the Creative Commons Attribution 4.0 License.
the Creative Commons Attribution 4.0 License.
A dynamical process-based model for quantifying global agricultural ammonia emissions – AMmonia–CLIMate v1.0 (AMCLIM v1.0) – Part 1: Land module for simulating emissions from synthetic fertilizer use
Jize Jiang
David S. Stevenson
Mark A. Sutton
Ammonia (NH3) emissions mainly originate from agricultural practices and can have multiple adverse impacts on the environment. With the substantial increase in synthetic fertilizer use over the past decades, volatilization of NH3 has become a major loss of N applied to land. Since NH3 can be strongly influenced by both environmental conditions and local management practices, a better estimate of NH3 emissions from fertilizer use requires improved understanding of the relevant processes. This study describes a new process-based model, AMmonia–CLIMate (AMCLIM), for quantifying agricultural NH3 emissions. More specifically, the present paper focuses on the development of a module (AMCLIM–Land) that is used for simulating NH3 emissions from synthetic fertilizer use. Other modules, together termed as AMCLIM-Livestock, simulate NH3 emissions from agricultural livestock and are described in Part 2). AMCLIM–Land dynamically models the evolution of N species in soils by incorporating the effects of both environmental factors and management practices to determine the NH3 emissions released from the land to the atmosphere. Based on simulations for 2010, NH3 emissions resulting from the synthetic fertilizer use are estimated at 15.0 Tg N yr−1, accounting for around 17 % of applied fertilizer N. Strong spatial and seasonal variations are found. Higher emissions typically occur in agriculturally intensive countries (such as China, India, Pakistan and the US) and mostly reach the maximum in the summer season. Volatilization rates indicate that hotter environments can result in more N lost due to NH3 emissions and show how other factors including soil moisture and pH can greatly affect volatilization of NH3. The AMCLIM model also allows for estimation of how application techniques and fertilizer type have impacts on the NH3 emissions, pointing to the importance of improving management practices to tackle nutrient loss and of appropriate data gathering to record management practices internationally.
- Article
(23085 KB) - Full-text XML
- Companion paper
-
Supplement
(1210 KB) - BibTeX
- EndNote
Ammonia (NH3) is the one of the most critical species in the nitrogen cycle. It is the primary reduced form of reactive nitrogen (Nr) and also the principle alkaline gas in the atmosphere, which can have significant impacts on the environment (Sutton et al., 2020). Ammonia released to the air can react with sulfuric and nitric acids to form particulate aerosols. These aerosols not only reduce air quality and visibility but also have implications on the Earth's radiation balance (Butterbach-Bahl et al., 2011b). Due to its high solubility, NH3 readily gets deposited on wet surfaces, such as waterbodies or plant surfaces. The deposition may cause eutrophication of aquatic systems and damage to vegetation, subsequently harming local biodiversity and ecosystems (Dise et al., 2011). These negative environmental consequences also pose great threats to human society.
The largest NH3-emitting sector is agriculture, via the volatilization of NH3 from fertilizer and animal excreta. Estimated agricultural NH3 emissions have increased rapidly from over 20 Tg N yr−1 in the 1970s to over 45 Tg N yr−1 in the 2010s (EDGAR, 2023) as a result of agricultural intensification. For agricultural NH3 emissions, application of synthetic fertilizer is a major source. Since the mid-20th century, the exponential increase in synthetic fertilizer use has led to a substantial rise in NH3 emissions (Lu and Tian, 2017; Xu et al., 2019). On the one hand, the famous Haber–Bosch process revolutionized agriculture by significantly increasing crop yields with additional N input through fertilizer application, estimated to support about half of the global population (Erisman et al., 2008). On the other hand, the use of synthetic fertilizers also causes significant environmental impacts because a large portion of applied N is leaked to the environment instead of being absorbed by the crops, contributing to the environmental problems noted above. Emission of NH3 is one of the major losses of N introduced to the agricultural systems, representing a crucial waste of reactive nitrogen resources (Sutton et al., 2021).
Improving our understanding of the NH3 emissions from synthetic fertilizers is important not only for evaluating their environmental impacts and resource distributions but also for developing effective mitigation measures, especially in the face of a changing climate and growing population, which can also bring economic benefits. Although studies have been conducted to quantify NH3 emissions from synthetic fertilizers, most of these estimates rely on emission factors (EFs). Emission factors are empirically derived or experimental values that summarize NH3 volatilization rates that vary by specific source sectors. Emission of NH3 is then calculated by combining statistical activity data with reference EFs. The simplicity in calculations is an advantage. However, these EFs may not provide an accurate representation of NH3 volatilization because NH3 emissions are highly sensitive to environmental conditions, such as temperature, that show large spatial and temporal variations. For example, it has been suggested that a 5 °C rise in temperature will lead NH3 volatilization potential to almost double, as predicted by solubility and thermodynamics (Sutton et al., 2013). As EFs only consider the climatic effects to a limited extent, using constant values to describe the fraction of N that volatilizes as NH3 from different sources may not provide realistic estimates under all environmental conditions (Jiang et al., 2021). Significant uncertainties may result from using EFs in large-scale assessment (e.g. global-scale calculations), and these also typically lack information in the temporal characteristics of NH3 emissions, although seasonal empirical corrections are sometimes used (Hellsten et al., 2008).
Compared with EFs, process-based models are a useful tool used to estimate NH3 emissions, which are developed based on the theoretical understanding of relevant processes (Sutton et al., 1995; Nemitz et al., 2001; Flechard et al., 2013; Móring et al., 2016). Process-based models attempt to include the effects of environmental factors on NH3 volatilization to address the limitation that EFs lack a systematic response to environmental drivers. In recent decades, more effort has been put into developing process-based models to provide better estimates for the NH3 emissions. Nemitz et al. (2001) developed a two-layer canopy compensation point model (2LCCPM) to investigate the bi-directional exchange of NH3 between the atmosphere, the vegetation and the ground layer below. The 2LCCPM model incorporates the “compensation point” theory (Farquhar et al., 1980; Sutton et al., 1995), which introduces a theoretical equilibrium reached by the atmospheric NH3 concentrations above a given source or sink of NH3. This bi-directional exchange scheme has been adapted and modified for different purposes in later studies and models, such as estimating NH3 emissions from fertilized agricultural land like CMAQ-EPIC (Bash et al., 2013; Fu et al., 2015; Chen et al., 2021) and DLEM (Xu et al., 2018, 2019) and for investigating NH3 volatilization from urine patches in the GAG model (Móring et al., 2016). Pinder et al. (2004) constructed a model for simulating NH3 emissions from dairy cattle with a range of activities included, such as housing, grazing, manure storage and application. The Flow of Agricultural Nitrogen (FAN) model, which simulates global agricultural NH3 emissions, includes response to climatic factors and has detailed soil processes (Riddick et al., 2016; Vira et al., 2020).
Although process-based models are more sophisticated compared to EFs, they also require more inputs and computational resources than studies and inventories that use the EFs. Due to the difficulties in covering all processes in a reasonable level of detail, each model has its own focus and advantage, with different levels of complexity, inputs, processes and factors emphasized. It is critical to justify which processes are important and should be included. In this study, the development, evaluation and application of a new and complete model for quantifying global agricultural NH3 emissions, AMmonia–CLIMate (AMCLIM), is described. This paper presents the module of the AMCLIM model that is used for simulating NH3 emissions from synthetic fertilizer use (“fertilizer simulations”), while the other components of the model for livestock farming (“livestock simulations”) are detailed in a forthcoming paper.
2.1 Overview of the AMCLIM model
The AMmonia–CLIMate model (AMCLIM) is a dynamical emission system that quantifies climate-dependent NH3 emissions from agriculture based on a process-level understanding. AMCLIM version 1.0, as described here, incorporates the effects of environmental conditions on the formation and transport of N compounds to simulate the temporal evolution of various N species, especially NH3. There are three modules in AMCLIM, as shown in Fig. 1: (a) housing, (b) manure management and (c) land. The model focuses on synthetic fertilizer application (present paper) and livestock farming, simulating relevant physical, chemical and biological processes that govern the N flows in agricultural systems, while also considering agricultural management practices.
The AMCLIM model can be operated at multiple scales. It is calibrated and validated at the site scale by comparing with measurements and experimental studies and is then applied on the global scale to provide estimates of global NH3 emissions. For site-scale simulations, the AMCLIM model explores various source sectors and can be run with different length time steps, depending on inputs given in the measurement datasets. For global simulations, the AMCLIM model covers all major agricultural sectors and aims to provide a comprehensive assessment of agricultural NH3 emissions. Livestock sectors include pigs, poultry, cattle, sheep and goats, which together dominate the livestock NH3 emissions. An earlier version of the model for poultry has been reported by Jiang et al. (2021). The AMCLIM model also simulates NH3 emission from global synthetic fertilizer use on crops. In this study, the development of the land module of AMCLIM (AMCLIM–Land) is described, which was used to simulate NH3 emissions from synthetic fertilizer use. The land module is also used elsewhere as part of AMCLIM–Manure Management, which considers emissions from the full chain of animal housing, manure storage and land application of manure.
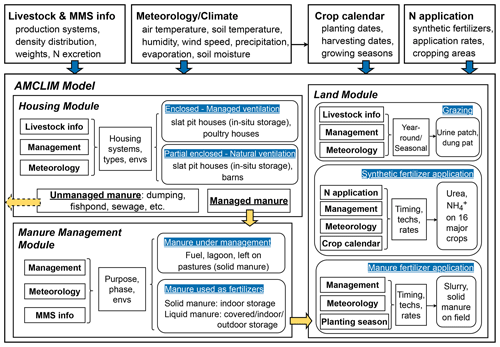
Figure 1Components and structure of the AMCLIM model and inputs (blue arrows) used for simulations. The dashed yellow arrows represent a fraction of unmanaged N from housing that is not simulated in the manure management module (AMCLIM–MMS). Solid yellow arrows represent the N flows between modules (MMS: manure management system; Envs: environments; Techs: techniques).
2.2 Land module of AMCLIM: AMCLIM–Land
2.2.1 Soil layering and simulated processes in AMCLIM–Land
AMCLIM–Land simulates NH3 volatilization at the land surface and the evolution of N species in soils. AMCLIM–Land models all the crucial processes associated with fertilizer application, including NH3 volatilization to the atmosphere, surface runoff, nitrogen diffusion and leaching into deep soil, nitrification, hydrolysis of urea, and plant N uptake, as illustrated in Fig. 2. While the main focus of the model is NH3 emissions, these other processes are incorporated as they are relevant in determining the fate of applied nitrogen, which interacts with NH3 emissions according to the mass balance.
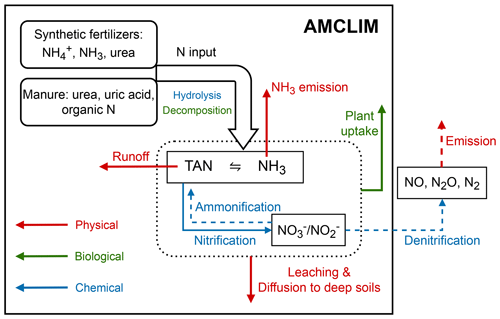
Figure 2Simulated N processes in AMCLIM–Land (shown with solid black boxes). Ammonification of nitrate (or dissimilatory nitrate reduction to ammonium) and denitrification and emission of NO, N2O and N2 are not included in this study but are shown (as dashed arrows or outside the black boxes) to illustrate the comprehensive concept. The dotted black box indicates soil N processes. Red arrows represent physical processes, including NH3 volatilization, surface runoff, leaching and diffusion of nitrogen to deep soils. Green arrows represent biological processes, such as plant uptake of N and decomposition of organic N. Blue arrows represent chemical transformations, including hydrolysis of urea and uric acid in animal excreta and nitrification.
Soil layers in AMCLIM–Land
To simulate these processes, AMCLIM–Land defines four soil layers with a total depth of 28 cm, each with a specific thickness of 2, 5, 7 and 14 cm, respectively (Fig. 3a). The upper two layers (0–2, 2–7 cm) correspond to the first soil layer defined by European Centre for Medium-Range Weather Forecasts Reanalysis v5 (ERA5) for which reanalysis data are used, while the lower two layers (7–14, 14–28 cm) correspond to the second soil layer in ERA5 (Hersbach et al., 2020). By integrating these soil layers into its model, AMCLIM–Land can simulate the soil processes related to fertilizer applications at various depths.
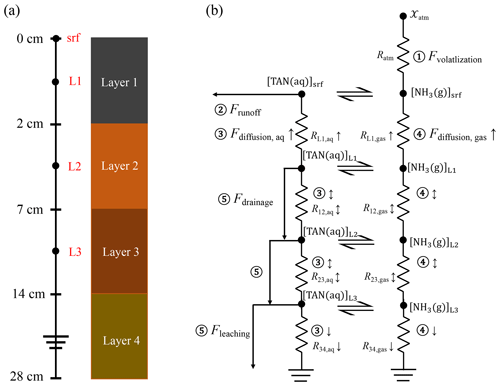
Figure 3Schematic view of the vertical soil layers and physical transport scheme for N species (showing TAN as an example) in AMCLIM–Land. (a) Four soil layers in the soil column from the surface (0 cm) to a depth of 28 cm (not to scale). (b) Physical transport of N species in soils and the atmosphere. Processes include (1) NH3 volatilization, (2) surface runoff, (3) aqueous diffusion, (4) gaseous diffusion, and (5) drainage and leaching. The concentrations of aqueous TAN and gaseous NH3 are the mean concentrations of each soil layer, represented by black dots. Soil resistances are shown between the two black dots, with the numbering representing the soil layers, i.e. R12 is the soil resistance for diffusion from soil layer 1 to layer 2. Arrows represent the direction of diffusion, which can be upwards, downwards or bi-directional. Transport distances for diffusion are the distance between the midpoints of two adjacent soil layers, e.g. 3.5 cm from soil layer 1 to layer 2 and 6 cm from soil layer 2 to layer 3. The concentrations of N species in the bottom soil layer are assumed to be 0, and downward fluxes take place from the above layer 3 to this layer.
Masses of N pools and concentrations
In the AMCLIM model, pools of N compounds are determined by the sources and losses. Flows between the pools (termed fluxes) are simulated, with the masses of pools calculated at every time step. The general expression for the time-dependent N pools can be simply written as follows:
where MN is the mass of a N species (g N m−2, given in per unit area; all masses have units of g m−2 if not specifically explained). and represent the sum of production (including inputs) and losses of the N compound, respectively (all N flows have units of g N m−2 s−1 if not specifically explained).
The same mass balance approach is used to calculate the water pool in AMCLIM and to solve the concentrations in the aqueous phase of each N species by dividing the mass by the volume of water as follows:
where [N] (g mL−1) is the concentration of the N species in water and (mL m−2) is the volume of water. It must be noted that the sources and losses terms of each N pool and the water pool in different modules are not the same, and Eq. (2) is a general representation for the concentration calculations, which is modified when considering multi-phase equilibria.
Calculation of soil TAN pool and partition
The most important aggregated N species simulated in AMCLIM is total ammoniacal nitrogen (TAN = NH3+ NH), which can be partitioned into gaseous NH3 (), aqueous TAN (MTAN,aq) and adsorbed NH, as shown in Eq. (3):
The physical and biochemical processes involved in these anthropogenic activities influence the transformations between various N forms and the transport of N species, in which the abundance of TAN is the key component that governs the NH3 emission potential (Γ) of a system (see Eq. 10).
In managed arable lands, the primary sources of the TAN pool are the application of N fertilizers, where ammonium is a direct source, while urea is a TAN input via hydrolysis. The TAN in soils can be depleted through multiple processes, such as NH3 volatilization, diffusion and nitrification. The time-dependent TAN pool (MTAN; mass per unit area; all masses have units of g m−2 if not specifically explained) is determined by the following equation, which includes the inputs and the depleting processes:
where ITAN (g N m−2 s−1) represents direct input of TAN species from fertilization, such as ammonium, and FTAN is the TAN production, i.e. through urea hydrolysis (see Sect. S1 in the Supplement). The remaining fluxes are removal processes, as shown in Fig. 2: is the flux of NH3 volatilization, FTAN runoff is the flux of surface TAN runoff, Fdiffusion is diffusive fluxes, Fleaching is the flux of leaching, Fnitrif is nitrification, and Fuptake is the flux of N uptake by plants and crops; all N fluxes and flows have units of g N m−2 s−1 if not specifically explained.
It should be noted that each soil layer may have different modelled processes. Equation (4) provides a general expression for the TAN budget of the entire soil column. Nitrogen losses through volatilization and runoff occur at the land surface in the top soil layer. These losses are not included in deeper soil layers, where volatilization and surface runoff are absent. Furthermore, it is assumed that there is no N uptake in the top soil layer (0–2 cm). In addition, diffusive and drainage fluxes considered to be losses in the soil layer above become sources of nitrogen for the layer underneath. Fluxes are modified accordingly in each simulated soil layer, and detailed equations are presented in Sect. S1.
The soil TAN pool is partitioned into three phases: gaseous NH3 that exists in the air-filled porous space of soil (with its concentration expressed by [NH3(g)]), aqueous TAN dissolved in the soil water (with its concentration expressed by [TAN(aq)]) and solid exchangeable NH adsorbed onto solid particles (with its concentration expressed by [NH](s), Riedo et al., 2002; Vira et al., 2020) as follows:
where θis the soil volumetric water content (m3 m−3 or m m−1) and ε is the porosity of soil (or the soil volumetric water content at saturation). The thickness of the soil layer is represented by z (m).
Gaseous NH3 is in equilibrium with aqueous TAN. The value of [NH3(g)] can be expressed as follows:
where is a combined coefficient of Henry and dissociation equilibria, as shown in Eqs. (9) and (10), respectively. Similarly, the concentration of solid exchangeable NH can be expressed by the following equation:
where Kd (m3 m−3) is the partition coefficient that represents soil adsorbed of TAN, which is dependent on soil properties (see Sect. S2).
By combining Eqs. (5)–(7), the concentration of aqueous TAN is given by
AMCLIM–Land also simulates other N species, including urea and nitrate, which have their own equations and processes that are detailed in Sect. S1.
Volatilization of NH3
Ammonia emission is a physiochemical process that typically takes place from wet or drying surfaces. Gas-phase NH3, held within the soil pore spaces (or excreta pores and at the surface in the slurry), is in dynamic equilibrium with aqueous ammonium depending on the substrate pH and temperature response of combined Henry and dissociation equilibria as follows (Nemitz et al., 2000):
where is the dissociation constant of ammonium (NH) and Γ is the NH3 emission potential defined as the ratio of (Sutton et al., 1998; Nemitz et al., 2001).
The volatilization of NH3 from the land surface to the atmosphere is driven by the concentration difference at two heights and is constrained by the atmospheric resistances, which is calculated as
where and χatm are NH3 concentrations at the surface and atmospheric NH3 concentration at a reference height consistent with atmospheric resistances (typically 2 m), respectively. Ra and Rb are aerodynamic and boundary layer resistance, respectively. AMCLIM–Land simulates NH3 volatilization as a uni-directional process, i.e. NH3 flux is an emission only, and deposition is not simulated. There is no interaction with surface vegetation so that there is no surface resistance in Eq. (11). Although a substantial body of research has considered such bi-directional interactions (Sutton et al., 1995; Nemitz et al., 2000; Flechard et al., 2013), the present approach treats these as a separate modelling step for subsequent integration with atmospheric transport and deposition modelling (Sutton et al., 2013). The NH3 concentration in Eq. (11), [NH3(g)]srf, is in equilibrium with the aqueous TAN concentration (as shown by Eq. 6) at the surface, which is determined by the loss fluxes (i.e. NH3 volatilization and surface runoff) from the surface and the upward diffusive fluxes from the soil underneath (details given in Sect. 2.2.1 “Physical transport of N in soils” and Sect. S6).
Chemical transformations and biological processes of N in soils
Nitrogen in soils occurs in several forms, which are controlled by a range of chemical and biological processes. Nitrification and plant N uptake are crucial processes in AMCLIM–Land for simulating N dynamics in soils. Nitrification is the process by which NH is converted to NO, which leads to depletion of the soil TAN pool. Nitrification is dependent on the abundance of NH, and its rate is influenced by various environmental factors, such as temperature, oxygen availability and substrate pH (Parton et al., 1996, 2001; Malhi and McGill, 1982; Bateman and Baggs, 2005; Gilmour, 1984; Norton and Stark, 2011). In AMCLIM–Land, the nitrification rate is calculated by scaling the optimum nitrification rate (Knitrif,opt) by normalizing factors that depend on temperature (knitrif,T), water-filled pore space (knitrif,WFPS) and pH (knitrif,pH) as follows:
The optimum nitrification rate and the representation of each dependence is presented in Sect. S3.
The uptake of N by crops is a key biological process in AMCLIM–Land and can be used as a critical indicator for evaluating the fertilizer N use efficiency. However, simulating plant N uptake is complex and can be challenging; AMCLIM–Land uses a root uptake scheme derived from several studies (Riedo et al., 1998; Thornley, 1991; Thornley and Cannell, 1992; Thornley and Verberne, 1989). The scheme uses an integrated root activity parameter for N uptake (αroot, g N m−2 s−1); the combined response factor for substrate C and N level (JC,N); the effective available N pool for the plant, including NH and NO (MNeff, g N m−2); and the correction constant for root activity (KNeff, g N m−2), which is expressed by the following equation:
The uptake of N by crops in AMCLIM–Land is mainly affected by temperature, and it is assumed to take place in soil layers beneath the top soil layer, as explained in connection with Eq. (4). The growth of crops is represented by a set of empirical parameters reflecting the maturing state of roots. The C and N dynamics of crop growth are not modelled. Constant values suggested by literature are used in this study, since the model focuses on the NH3 emission process. Details are presented in Sect. S4.
Immobilization or microbial N uptake is a competing process against plant N uptake and is considered to be primarily regulated by available C in soils and gross ammonification (Butterbach-Bahl et al., 2011a). It remains uncertain how microbial N uptake affects NH3 emissions. Since AMCLIM does not simulate soil C dynamics, an explicit incorporation of microbial activities is beyond the scope of this study.
Physical transport of N in soils
The physical transport scheme of TAN and other N compounds (e.g. nitrate) is shown in Fig. 3b. Diffusion processes in soils are similar to the volatilization and are also driven by concentration gradients. AMCLIM simulates diffusion in both the aqueous and gaseous phases. Each phase is limited by soil resistances, which are functions of transport distance, molecular diffusivities and soil tortuosity factors (Móring et al., 2016; Vira et al., 2020). Detailed calculations are given in Sect. S5. Diffusion is treated as a bi-directional process between soil layers 1 and 3, while diffusion is assumed to take place downward only from soil layer 3 to the bottom soil layer and upward only from soil layer 1 to the soil surface (Fig. 3b). It is worth noting that the surface concentrations used to calculate gaseous NH3 fluxes and runoff fluxes from the surface are variables solved by assuming an equilibrium state. Upward diffusion from the first soil layer to the surface (Fdiffusion to surface) is equal to the sum of NH3 emission and runoff from the land surface to satisfy mass conservation (details given in Sect. S6) as follows:
The transport of N by movement of water includes leaching and runoff. Both processes are evaluated by multiplying the corresponding concentrations by the movement fluxes. For leaching (Fleaching), a percolation flux of water (qp, m s−1) is used for the calculation, as follows:
where [N(soil)] is the concentration of the N species in the soil. The loss via surface runoff (FN runoff) is calculated similarly by the following equation:
where qr (m s−1) is the surface runoff flux of water and [N(sfc)] is the surface concentration of the N species. It is worth noting that the surface runoff of N is assumed to ultimately enter waterbodies and not to contribute to further NH3 emissions.
Leaching of NO occurs more frequently compared with NH because NO is highly mobile in soils, while NH is absorbed on the soil cation exchange complex and is thus less mobile (Butterbach-Bahl et al., 2011a). Annual NH leaching is usually less than 5 % of the total dissolved N in soil but may have larger contributions in soils with heavy NH loads (Dise et al., 2009; de Vries et al., 2007). Nitrogen flows out from the simulated soil column are termed “leaching”, while N fluxes that are transport between soil layers by water movement are termed “drainage”, as shown in Fig. 3b. The percolation flux of water (qp, in Eq. 15) is the minimum between soil hydraulic conductivity (Ks, m s−1) and water drainage potential of a soil layer (Dpot, m s−1), as expressed by the following equation:
The soil hydraulic conductivity is related to the soil textures and soil water content. The water drainage potential is defined as the excess amount of water beyond soil field capacity draining out from the soil layer. The calculation of qp is given in Sect. S7. In contrast, the surface runoff flux of water (qr, in Eq. 16) is not explicitly modelled in AMCLIM–Land but is taken from the reanalysis meteorological dataset (Hersbach et al., 2020).
Soil pH scheme in AMCLIM–Land
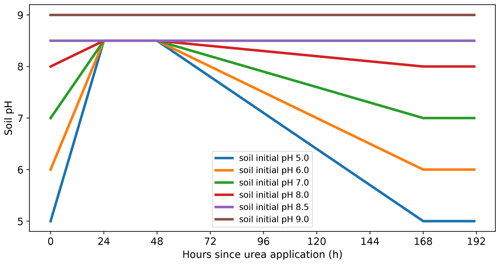
Soil pH can greatly affect NH3 emissions from fertilizer. Urea application is found to have strong impacts on soil pH as urea hydrolysis consumes hydrogen ions (H+) (CO(NH2)2+ 2H2O + H2NH + HCO). Experimental studies found that soil pH increased dramatically after urea application (including urine deposition), resulting in a peak in NH3 emissions (Chantigny et al., 2004; Curtin et al., 2020; Cabrera et al., 1991; Móring et al., 2016). Móring et al. (2016) developed a detailed chemistry scheme for soil pH dynamics in a urine patch and suggested that it is nevertheless suitable to use a fixed pH for larger-scale modelling as it is extremely difficult to explicitly simulate soil pH change on a larger scale, e.g. a global scale (Móring et al., 2017). AMCLIM–Land therefore uses an empirical relationship describing the soil pH after urea application, which is developed based on Chantigny et al. (2004) and Móring et al. (2016). As shown by Fig. 4 and Eq. (18), soil pH is assumed to reach a peak value of 8.5 within 24 to 48 h after application, and it then gradually recovers back to the original values over the next 120 h (Chantigny et al., 2004; Móring et al., 2016).
Due to limited experimental knowledge, for soils with higher pH than 8.5, pH values are assumed to remain unchanged at the original values in AMCLIM–Land. Meanwhile, soil pH also does not change significantly for fertilizer applications other than urea, e.g. NH, for which a database of soil pH is used in AMCLIM–Land (see Sect. 2.3.2). Although long-term responses in soil pH can result from addition of different forms of N (including NH and NO salts) in relation to their ultimate fate (plant uptake, storage, nitrification, leaching), such long-term effects are not considered in AMCLIM as having a significant effect on NH3 emission.
2.2.2 Representations of human management in AMCLIM–Land
Fertilizer application timing and techniques
Nitrogen fertilizers are applied on cropland within a specific time period of the year depending on the climatic conditions, crop types and other environmental factors. AMCLIM–Land incorporates a crop calendar dataset that specifies the planting and harvesting seasons for major crops in both rain-fed and irrigated croplands (Jägermeyr et al., 2021). AMCLIM assumes a simple scheme for synthetic fertilizer application, where half the fertilizer is applied at the beginning of the planting season and the other half in the middle of the growing period, i.e. midway between the dates of planting start and harvesting start.
AMCLIM–Land includes three techniques for fertilizer application: broadcasting, incorporation and deep placement. Different techniques refer to different locations where fertilizer N is applied, which can be reflected in AMCLIM–Land by distributing N input to the corresponding soil layer(s). “Broadcasting” is the easiest method and involves spreading fertilizers broadly at the land surface, with N input added only to the first soil layer. “Incorporation” requires additional work to mix fertilizer deeper into the soil, and AMCLIM–Land assumes that applied N is well mixed in the top two soil layers as a representation of immediate incorporation after fertilizer application. “Deep placement” is a less commonly used technique that involves burying fertilizer under the soil surface to mitigate nutrient loss to the air, and the model reflects this by adding N input to the third soil layer in simulations. By including this range of application techniques, the model can simulate NH3 emissions under different management that more closely reflect real-world situations and allows testing of potential mitigation measures. AMCLIM–Land does not simulate the impacts of fertilizer application on changing soil characteristics.
Irrigation events
Water availability is a crucial factor that influences crop performance and determines local agricultural practices. In areas with adequate rainfall, natural precipitation is sufficient for crop growth, while in arid or semi-arid regions, additional water inputs are necessary for crop production. Croplands are classified into two categories: rain-fed and irrigated areas. For rain-fed croplands, it is assumed that there are no irrigation events, meaning that soil moisture is represented using reanalysis soil moisture data, while the percolation flux (qp) is represented by reanalysis subsurface runoff data. For irrigated croplands, irrigation is assumed to occur after fertilizer application and when necessary. Consequently, the soil moisture of irrigated croplands needs to be re-estimated, as expressed by the following equation:
where θirr,t and θrea,t represent the soil water content of irrigated croplands and the reanalysis soil water content data at time t, respectively. The reanalysis soil moisture data provide a reference value for “unperturbed” conditions, i.e. no irrigation. The term Δθ represents an incremental change in soil moisture due to various to processes and activities, including irrigation (wirr, m), percolation flux of water (qp, m s−1) and water uptake by crops (Wuptake, m s−1):
where Δt is the model time step. The amount of water applied during a single irrigation event equals the soil water content when the top two soil layers reach field capacity (θfc). The water uptake by crops is described in Sect. S4. As mentioned, water is applied when the soil is too dry for crop growth. The threshold for initiating irrigation is when soil water content falls below the soil wilting point (θwp), as expressed by the following equation:
Irrigation is considered to have impacts on NH3 emissions by influencing the leaching and altering the soil moisture. There are other processes affecting soil moisture, such as evapotranspiration, which are considered to be implicitly included in the reanalysis data. It is worth noting that the method is a simplified approximation for the soil moisture of irrigated croplands, and water uptake by plants is only simulated under this condition. A systematic simulation of soil moisture based on the underlying physics is beyond the scope of this study and is not considered in AMCLIM–Land.
2.3 Modelling NH3 emissions from synthetic fertilizer use
2.3.1 Application of AMCLIM–Land at site scale
AMCLIM–Land was applied at site scale to simulate NH3 emissions from a fertilized grassland. To evaluate the model, modelled emissions were compared with measurements from the GRAMINAE (GRassland AMmonia INteractions Across Europe) experiment on NH3 biosphere–atmosphere exchange conducted over intensively managed grassland in Braunschweig (52°18′ N, 10°26′ E), Germany (Sutton et al., 2009a, b). The GRAMINAE project measured NH3 fluxes from managed grassland at three different stages: prior to cutting, post-cutting and after fertilization, using a combination of the aerodynamic gradient method (AGM) and relaxed eddy accumulation (REA). AMCLIM–Land was applied to simulate the NH3 emissions during the third stage, in which ammonium nitrate fertilizer was broadcast onto the grassland at a rate of 100 kg N per hectare on 5 June 2000. The N input to AMCLIM–Land was then set to be 5 g NH–N per square metre, which is equivalent to 50 kg NH–N per hectare for the simulation (because nitrate is assumed not to contribute to NH3 emissions in the model). AMCLIM–Land was driven by meteorological variables, including air temperature, relative humidity, wind speed, precipitation and ground temperature. Soil properties and characteristics, including soil moisture, soil pH and soil textures, were also used as model input, all measured at the site by the GRAMINAE project. Measured atmospheric NH3 concentrations interpolated to a reference height of 1 m were used as a reference when simulating emissions, with atmospheric resistances calculated from the measured meteorology. AMCLIM–Land was operated with a 15 min time step to match the frequency of meteorological inputs and the measured NH3 fluxes. The GRAMINAE project provided the necessary level of detail for running AMCLIM–Land to simulate NH3 emissions from fertilizer application, and additional information can be found in Sutton et al. (2009a, b). No irrigation event occurred after fertilizer application, so AMCLIM–Land used measured soil moisture data documented by the GRAMINAE dataset.
2.3.2 Global application of AMCLIM–Land: input and model setup
AMCLIM–Land was applied at the global scale to quantify NH3 emissions from global synthetic fertilizer use. There were three major types of inputs, as presented in Fig. 1: nitrogen application information, crop calendars and meteorological variables. Nitrogen application data were obtained from the Global Gridded Crop Model Intercomparison Phase 3 (GGCMI3) dataset for 16 major crops, including synthetic fertilizer N application rates and total synthetic fertilizer N applied to crops (Mueller et al., 2012; Hurtt et al., 2020). The GGCMI3 datasets reported data for years from 1850 to 2015. Data for years after 2015 were then extended by a linear interpolation using data for the most recent 10 years (2005 to 2015). Data for 2010 and 2018 were used in this study. A time series for global fertilizer use of the 21st century is given by Fig. A1 in Appendix A, with information on the simulated crops. The areas of croplands that use synthetic fertilizers were derived from GGCMI3, which have incorporated the harvested area from the Farming the Planet 2 (FTP2) dataset (Monfreda et al., 2008).
Nitrogen fertilizers include several types, such as urea, ammonium nitrate and ammonium phosphate. AMCLIM–Land considers three groups of applied N: ammonium N, urea N and nitrate N. Ammonium N directly enters the soil TAN pool and is treated as not affecting soil pH, while urea hydrolysis is treated as causing a temporary rise in soil pH after application. Nitrate is treated in AMCLIM as not contributing to NH3 emission (Sect. 2.2.1). AMCLIM–Land combines the GGCMI3 nitrogen application data with country-level synthetic fertilizer consumption statistical data provided by the International Fertilizer Association (IFA, 2021) to split the application rates into fractions of the three groups of applied N (see Sect. S8). The area of cropland that uses a specific type of fertilizer is proportional to the fraction of the fertilizer used.
The crop calendars used in AMCLIM–Land were also obtained from the GGCMI3 dataset, which distinguish the planting and harvesting seasons of crops in rain-fed and irrigated systems. These calendars were used to determine the timing of fertilizer application, and each crop has a specific calendar that varies geographically. It should be noted that these crop calendars are based on climatology and therefore do not vary with years.
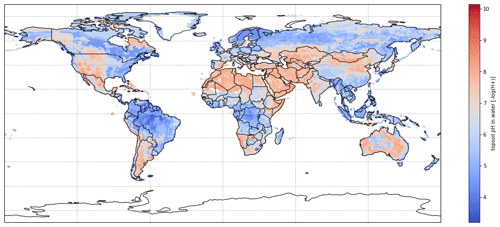
The hourly meteorological inputs for AMCLIM were from the ERA5 collection (Hersbach et al., 2020) and include air temperature, relative humidity (derived from dew point temperature), wind speed, rainfall, soil temperature and water content at two levels (0–7, 7–28 cm), and runoff fluxes. Soil data inputs such as soil pH, soil texture (sand, clay and silt fraction) and soil organic matter content were obtained from the Regridded Harmonized World Soil Database (HWSD) v1.2 (FAO/IIASA/ISRIC/ISS-CAS/JRC, 2012; Wieder et al., 2014). The GRIPC dataset was used to classify cropland into rain-fed and irrigated systems and to determine the irrigation events and corresponding crop calendars.
For global simulations, AMCLIM–Land was applied using a longitude–latitude grid at a resolution of 0.5° × 0.5°. All model inputs were regridded to the model resolution if necessary. The simulations were performed at an hourly time step, and the prognostic variables at each time step were solved by the Euler method in the model. AMCLIM–Land was set up to use a 1-year spin-up in order to keep an annual cycle of simulation period for each grid (as fertilization that takes place in November or December may result in NH3 emissions in the following year) and was run for three rounds in which three application techniques were simulated independently and were assumed not to interact with each other. Each round was comprised of 32 full-year simulations, with urea and ammonium N run separately for the 16 major crops (i.e. 1 year of simulation for two types of N fertilizer applied to 16 crops). The total NH3 emission from fertilizer application is calculated using the following equation:
where is the component NH3 emission from n crop with fertilizer type j by using application technique i, and ftech(i) and ffert(j) are the fraction of the application technique and fertilizer type used in a grid, respectively. The assumption in AMCLIM–Land is that the fraction of a specific fertilizer application technique used is related to the country income level, with higher-income countries assumed to use more incorporation and deep placement compared with lower-income countries. The income classification is provided by World Bank statistics (WB, 2022). The details are presented in Table A1 in Appendix A.
3.1 Site simulations for NH3 emissions from synthetic fertilizer application
Figure 5 shows the results of simulated NH3 emissions over 10 d from the fertilized post-cutting grassland (the GRAMINAE campaign site), along with comparisons with measurements. Meteorological conditions are also given in Fig. 5, which shows that the ground temperature at the study site varied between 10 and 25 °C, with 3 particularly hot days on 9, 10 and 13 June. It is notable that ground temperature, relative humidity (RH) and friction velocity (which is dependent on wind speed and atmospheric stability) showed large diurnal variations. During the daytime, ground temperature and friction velocity were high while RH was low, with the opposite occurring at night-time. Atmospheric resistances (including aerodynamic and boundary layer resistance) are inversely related to the friction velocity, of which values were small during the day and much larger at night. A few precipitation events occurred during the study period, with the largest rainfall occurring on 10 June (Fig. 5c). Soil water content was measured every 2 d at two depths of 0.15 and 0.30 m. The grassland was watered prior to the fertilization on 15 to 17 May, and there was no irrigation between 5 and 15 June. Therefore, subsurface runoff fluxes retrieved from the ERA5 reanalysis data were used as the percolation fluxes to determine drainage and leaching, ranging from 0.60 to 0.75 mm d−1 in the simulated days. The shallower layer had lower soil water content than deeper soils, and moisture levels at both depths decreased from 12 % to 10 % in the 10 d following fertilizer application. The extent to which rainfall-affected soil water content was uncertain based on the available measurements.
Ammonium nitrate fertilizer was applied on the grassland by broadcasting at 05:00–06:00 CET on 5 June 2000. Emissions of NH3 occurred immediately after the fertilization, with maximum values of over 3000 ng m−2 s−1 observed on the same day. The measured emissions then gradually decreased over the following days but showed strong diurnal variability, peaking around the midday, when temperature and friction velocity were high, and declining to a minimum at night when these variables were low. By 7 June, the third day after fertilization, the highest emission was 1500 ng m−2 s−1, which was only half of the peak value observed on the first day. The NH3 emissions increased substantially on 8 June relative to the previous day (7 June) and declined again. From 12 June, the measured emissions were generally less than 500 ng m−2 s−1, which was significantly lower compared with the first week.
Figure 5d demonstrates that the AMCLIM model is capable of capturing the predominant features of the measured NH3 emissions throughout the simulated period and producing estimates for daily NH3 emissions and sub-hourly fluctuations comparable with the measurements. However, there are some differences between modelled and measured NH3 fluxes, particularly on the first day and during night-time simulations. Simulated emissions are higher than measurements in the afternoon and evening of the first day and night-time on 6, 7, 9 and 10 June. Meanwhile, the highest measured emissions on 8 June are over 2500 ng m−2 s−1, but AMCLIM is unable to replicate these values and underestimates the peak emissions by about 40 %. It should be noted that particularly large standard errors (shown as a shaded grey area) also exist in measured NH3 fluxes during 8–10 June, which is likely due to instrument uncertainties (Sutton et al., 2009a). Overall, AMCLIM overestimates cumulative NH3 emissions by 50 % from 5 June to 15 June (when there are available measurements). The modelled cumulative NH3 flux is 0.49 g m−2 compared with 0.32±0.07 g m−2 from the measurements (Sutton et al., 2009a). Other diagnostic variables are shown in Sect. S9.
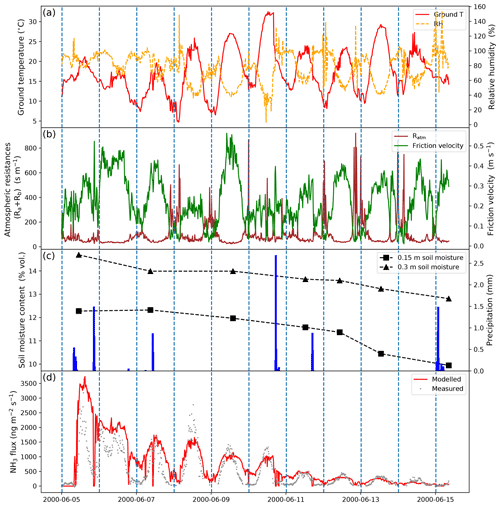
Figure 5Meteorological variables measured by GRAMINAE and site simulations for NH3 emissions from a post-cutting grassland after fertilization in Braunschweig, Germany, from 5 June 2000 to 15 June 2000 by AMCLIM–Land. (a) Surface temperature and relative humidity. (b) Atmospheric resistances and friction velocity. (c) Soil volumetric water content at 0.15 m and 0.30 m depth and precipitation. (d) Modelled and measured NH3 emissions.
To evaluate the performance of the model against the measurements, AMCLIM–Land operated 12 runs with varying model parameters, variables and processes with different levels of complexity. In general, there were four groups of simulations, with correlation coefficients (“r” value) of each run and measurements, standard deviations normalized to measurements and normalized root-mean-square error (NRMSE) shown in Fig. 6. The base run provides the “best” fitting as the closest point to the measurement. All runs show similar correlation coefficients, ranging between 0.7 and 0.85, which demonstrates the model's robustness as over 50 % of the variability in the measured NH3 flux can be explained by the model. Varying the thickness of the top soil layer leads to the largest changes in standard deviation and the NRMSE (circles in Fig. 6). Changing z1 to 1 cm results in much larger NRMSE than the base value of 2 cm and also overestimates the variability in the measurement. In contrast, simulations using different atmospheric NH3 concentrations at 1 m does not show significant changes in NRMSE (triangles in Fig. 6), and the standard deviations of these simulations are close to those of the measurement. A range of tortuosity correction was tested (stars in Fig. 6). Lowering tortuosity (no tortuosity and j=6) results in large increase in NRMSE compared with the base run using j of 8.5, with an overestimation of the variations in measured fluxes. By comparison, higher tortuosity (j=10) leads to comparable NRMSE but much smaller standard deviations. AMCLIM–Land was also run by switching off several N processes, including drainage flux to the soil layer underneath, surface runoff and nitrification (“P” in Fig. 6). Excluding the drainage of N in the model results in larger NRMSE than the base run, while excluding runoff or nitrification only leads to a small change.
Based on the comparison with the GRAMINAE measurements, AMCLIM–Land provided an overall reasonable estimate for the NH3 emission from a fertilized field and generally captured the variations in NH3 at a high temporal resolution. The Taylor plot (Fig. 6) shows that the base model set up produces the best fitting to the measurement compared with several model runs with varying parameters. Moreover, assuming a zero background NH3 concentration for global simulations is justified as only limited impacts were found on the overall model performance. The model performance at various temporal resolutions was tested, and an hourly time step was found to be acceptable for global simulations given the modelling results and computational costs. More details for testing the model temporal resolution are given in Sect. S10. AMCLIM–Land was then applied at the global scale, and the results are presented in the following sections.
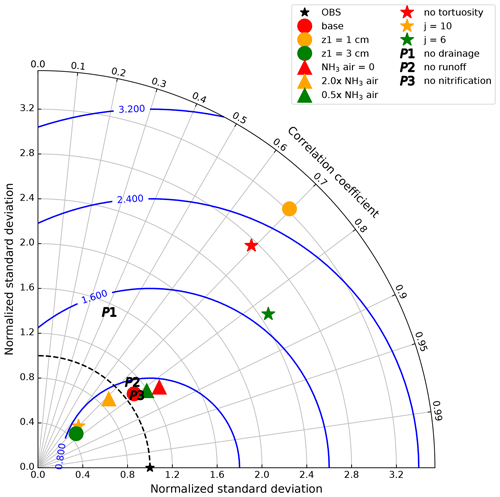
Figure 6A Taylor plot of correlation of simulated and measured NH3 emissions by GRAMINAE and normalized standard deviation of the model and measurements for four groups of model runs. Circles show the base run (red), with a top soil layer thickness of z1=1 cm (orange) and z1=3 cm (green). Triangles show atmospheric NH3 concentration set to 0 (red), 2.0× the measured NH3 concentration (orange) and 0.5× the measured NH3 concentration (green). Stars show no soil tortuosity correction for diffusion (red), with a tortuosity correction factor j=1.0 (orange) and j=0.65 (green). P1–P3 represent simulations without drainage, surface runoff and nitrification, respectively. The blue contours represent the root-mean-square error normalized by measurements (NRMSE).
3.2 Global NH3 emissions from synthetic fertilizer use
According to simulations using AMCLIM–Land, the global NH3 emissions from synthetic fertilizer use are 15.0 Tg N yr−1 in 2010 and 16.8 Tg N yr−1 in 2018. The use of synthetic fertilizer increases from 102.3 to 120.5 Tg N yr−1 during this period. The overall volatilization rates, which represent the percentage of applied N in ammonium and urea fertilizer that volatilizes as NH3, are 17.2 % in 2010 and 16.7 % in 2018, respectively. Additional details about the use of three types of fertilizer are summarized in Table 1.
Table 1Use of three types of synthetic fertilizers, corresponding NH3 emissions and percentage of volatilization (PV) simulated by AMCLIM–Land in 2010 and 2018. Data for synthetic fertilizer use are derived from GGCMI3 and IFA.

a Nitrate fertilizer is assumed to not contribute to NH3 emissions in AMCLIM–Land. b Percentage of volatilization when not including nitrate fertilizers. c Percentage of volatilization when including nitrate fertilizers. d Percentage of volatilization from ammonium input (rather than of total N applied).
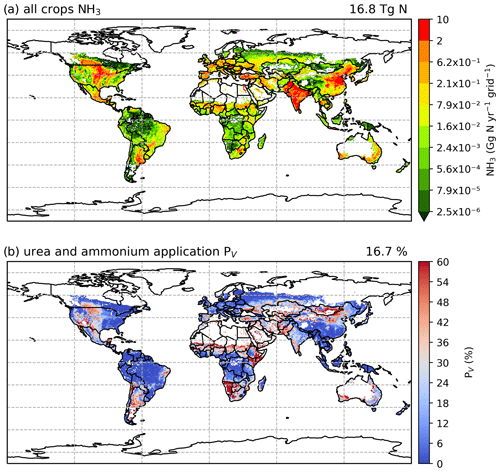
The geographical distributions of NH3 emissions and the volatilization rates for 2010 and 2018 are shown in Figs. 7 and A2 (see Appendix A). The spatial patterns are similar for both years, with the highest emissions occurring in some parts of South Asia (mainly India and Pakistan), the North China Plain (NCP) and northeastern China, and the central US and southern Canada. Regions including Europe, the Middle East and South America also had high emissions in some countries, such as France, Spain, Türkiye and Argentina.
For the volatilization rates (PV), the highest rates are found in eastern Africa (e.g. Kenya, Ethiopia and Somalia), southern Africa (e.g. Namibia) and part of East Asia (e.g. Mongolia and northern China) exceeding 50 %. High PV values are also found in several regions in the western US, the southern part of South America, the Sahel region, Ukraine, southwestern Russia and western Australia. It should be noted that regions with high volatilization rates do not always coincide with high emissions. Countries with high emissions often have moderate PV rates. In particular, the NCP and northeastern China show PV values of around 20 %, with high-volatilization hot spots. The estimated volatilization rates of India are approximately 24 %, while some regions in central and southern India show higher PV values. In most parts of Europe, estimated PV rates range from low to moderate (6 % to 18 %). However, both relatively high emissions and high volatilization rates are observed in Argentina and the central US.
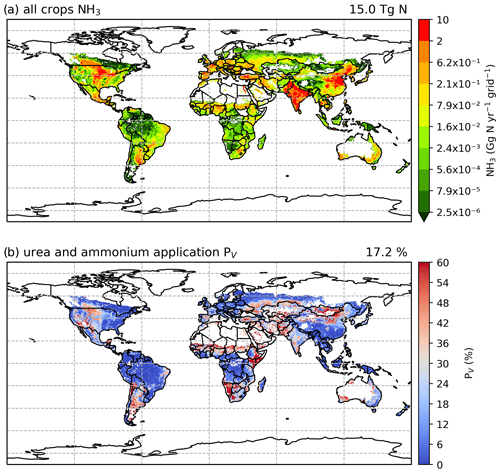
Figure 7Simulated (a) annual global NH3 emissions (Gg N yr−1 per grid) from synthetic fertilizer use in 2010. The colour bar represents the 5th, 15th, 25th, 35th, 50th, 65th, 75th, 85th, 95th and 99th percentiles of NH3 emissions from synthetic fertilizer application in 2010. (b) Percentage of applied N in synthetic fertilizers (urea and ammonium fertilizers) that volatilizes (PV) as NH3 in 2010. The resolution is 0.5° × 0.5°. Maps of global fertilizer use in 2010 are shown in Fig. S1 (see Sect. S8 in the Supplement).
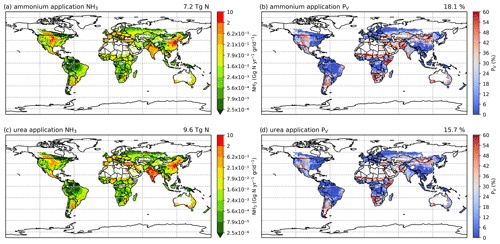
Figures 8 and A3 show the NH3 emission from ammonium and urea fertilizer and the corresponding volatilization rates. In both 2010 and 2018, urea application results in more emissions than ammonium application due to its widespread use, although the emissions from each type of fertilizer are comparable. In 2010, about 40 % of emissions are from the use of ammonium and 60 % are from urea, and the relative contribution of ammonium to NH3 emissions increases to 43 % in 2018. The volatilization rates of both fertilizers are similar, with ammonium application resulting in slightly higher volatilization rates. The overall volatilization rate from ammonium application decreases from 19.3 % in 2010 to 18.1 % in 2018, while the rate for urea also decreases from 16.1 % in 2010 to 15.7 % in 2018. These differences are directly linked to meteorological differences between these years.
As shown in Fig. 8, ammonium application in 2010 shows higher volatilization rates than urea application in most of the regions, especially in Argentina, the central US, the Middle East (Iran and Türkiye) and South Asia (Pakistan, although note that there was no urea application in Pakistan in 2010 according to IFA), while urea application shows higher volatilization than ammonium in northern China, Mongolia and Ukraine (Fig. 8b and d). In 2018, the spatial variations in the volatilization rates for both fertilizers are very similar (Fig. A3b and d).
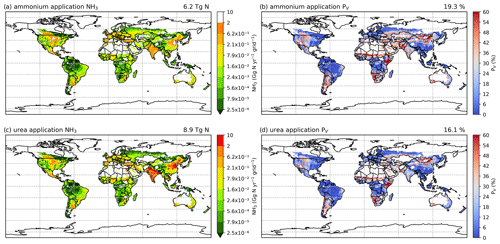
Figure 8Simulated NH3 emissions (Gg N yr−1) from two main types of fertilizers (global maps on the left) and the corresponding volatilization rates (PV) in 2010 (global maps on the right). Ammonia emissions from (a) ammonium application and (c) urea application. Percentage of applied N that volatilizes as NH3 from (b) ammonium application and (d) urea.
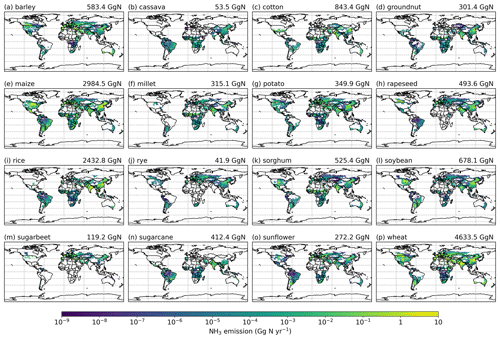
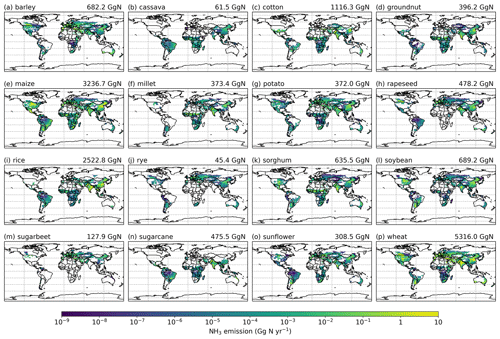
Simulated NH3 emissions from individual crops are shown in Figs. A7 and A8 (see Appendix A). Among the 16 major crops, wheat, maize and rice are the top three emitter crops. The NH3 emissions associated with wheat are the largest, with NH3 increasing from 4.6 Tg N yr−1 in 2010 to 5.3 Tg N yr−1 in 2018. Maize contributes 2.9 and 3.2 Tg N yr−1 in 2010 and 2018, respectively, and emissions from rice increase from 2.4 Tg N yr−1 in 2010 to 2.5 Tg N yr−1 in 2018. For the other crops, emissions range from 41.9 (rye) to 843.4 Gg N yr−1 (cotton) in 2010, and from 45.4 (rye) to 1116.3 Gg N yr−1 (cotton) in 2018.
The total global NH3 emissions from synthetic fertilizer use in 2018 are generally higher than 2010 as a result of increasing synthetic fertilizer, and most of crops have higher emissions in 2018 compared to 2010. Cotton and groundnut in particular have a 32 % increase in NH3 emissions, which is the topmost increase over time among these crops. By comparison, rapeseed is the only crop for which emissions decreased, with around 3 % less NH3 emitted in 2018 than in 2010.
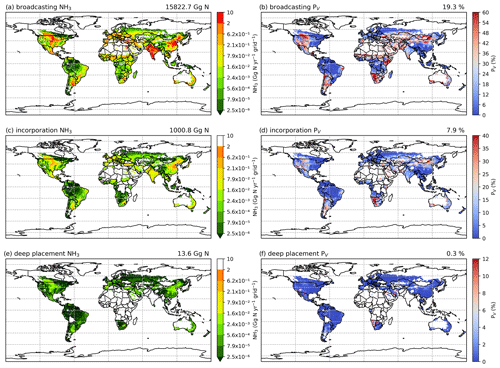
Figures A9 and A10 show the component NH3 emissions from fertilization by different techniques for the 2 years. Broadcasting is responsible for more than 90 % of the estimated NH3 emission, whereas incorporation and deep placement together contribute less than 10 % of the estimated global emissions (see Table A1 for assumptions). The geographical distributions of the volatilization rates for broadcasting are consistent with the global totals, given that broadcasting is the primary method used in fertilizer applications (Riddick et al., 2016). By comparison, incorporation and deep placement result in lower volatilization rates. Specifically, incorporation reduces simulated emissions by more than 50 % based on the PV rates, while deep placement could potentially reduce emissions by almost 98 % (Figs. A9 and A10), although this reduction needs to be further investigated as it may be an overestimation. Regions with high volatilization rates for broadcasting also have high rates even when fertilizers were assumed to be incorporated into the soils in the simulations, such as Argentina, northern China, Mongolia, Namibia and the central US (Figs. A9b and d, A10b and d).
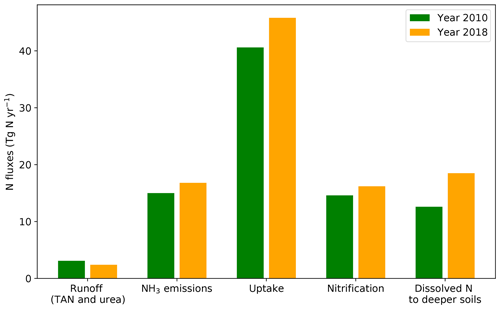
The fate of applied N in fertilizers for 2010 and 2018 is shown in Fig. 9. For both years, N uptake by crops is the largest among all processes, equivalent to 46.6 % (40.6 Tg N yr−1) and 45.1 % (45.6 Tg N yr−1) of fertilizer N applied in 2010 and 2018, respectively. Surface runoff is responsible for the smallest estimated N loss, which is only 3.6 % (3.1 Tg N yr−1) in 2010 and 2.4 % (2.4 Tg N yr−1) in 2018. The amounts of N losses (in the form of ammonium and urea) due to volatilization and nitrification and dissolved in soils through diffusion and leaching are comparable. In 2010, around 16.8 % (14.6 Tg N yr−1) of N is estimated to undergo nitrification, with 14.5 % (12.6 Tg N yr−1) transferred to deeper soils. Nitrification is estimated at 16.2 Tg N yr−1 in 2018, accounting for 16.2 % of the total pathways, which is similar to 2010. The diffusive fluxes and leaching in 2018 are approximately 50 % higher than the 2010 values (12.6 Tg N yr−1), which together account for 11.0 % (18.5 Tg N yr−1) of the N in applied synthetic fertilizers.
3.3 Seasonal and regional NH3 emissions from synthetic fertilizer use
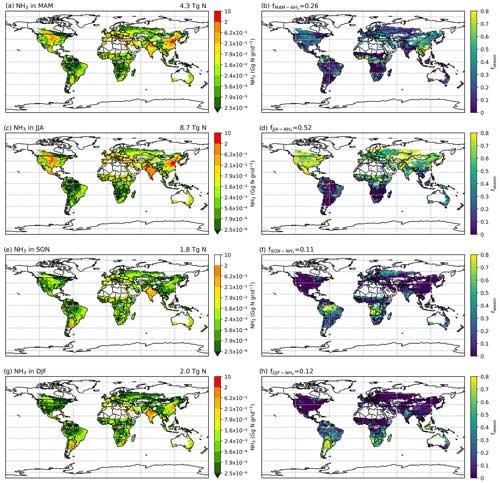
As NH3 emissions are greatly influenced by climatic conditions and local management, NH3 emissions exhibit strong seasonality that varies across the globe. Figures 10 and A4 (see Appendix A) show the seasonal NH3 emissions from fertilizer applications for 2010 and 2018, respectively. The seasonal emissions in both years are similar, with over 50 % of NH3 occurring in the Northern Hemisphere (NH) summer months and about 25 % in March–April–May (MAM). September–October–November (SON) and December–January–February (DJF) both contribute slightly over 10 % of the annual emissions. In the NH, more than 70 % of annual emissions are from June–July–August (JJA), while emissions in SON and DJF are significant in the Southern Hemisphere (SH). For example, Brazil and central African countries have predominantly SON emissions, while Argentina and southern Africa have emissions that largely occurred in JJA. Countries with high annual NH3 emissions such as China, India and the US generally show similar seasonal patterns, with the highest emissions occurring in JJA and lower emissions in other months.
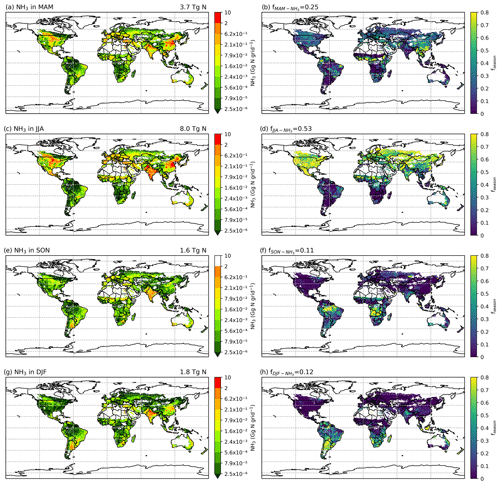
Figure 10Seasonal NH3 emissions (Gg N per grid) from ammonium and urea fertilizer application (global maps on the left) and the relative fraction of annual emissions that are from the corresponding season (fseason) in 2010 simulated by AMCLIM–Land (global maps on the right). Ammonia emissions in (a) March, April, and May (MAM); (c) June, July, and August (JJA); (e) September, October, and November (SON); and (g) December, January and February (DJF). Percentage of annual emissions in the season of (b) MAM, (d) JJA, (f) SON and (h) DJF.
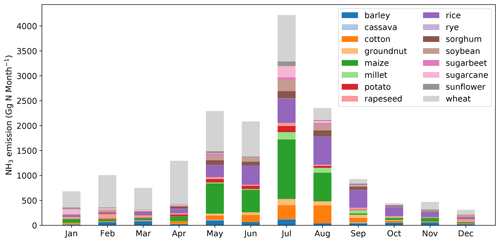
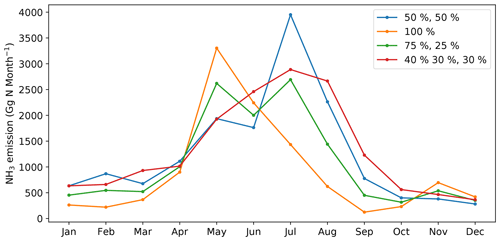
Global monthly emissions of NH3 from synthetic fertilizer use categorized between the 16 crops are shown in Figs. 11 and A5 (see Appendix A). The seasonal trends for both 2010 and 2018 are generally the same. The highest emission of around 4.0 Tg N per month occurs in July, with August showing the second highest emission of around 2.5 Tg N per month. Large emissions take place in between April and August. The first emission peak is in May, which is the first month of the year when NH3 emissions reach 2.0 Tg N per month in both years. Emissions slightly decrease in June but then reach the maximum in July. Wheat-related emissions are seen throughout the year and are the most significant emissions in most months, except for August, September and October, in which rice contributes to the largest estimated emissions. Maize is also one of the most important crops that result in NH3 emissions from May to August.
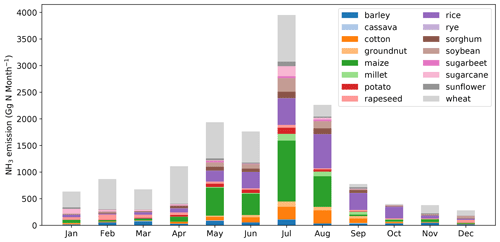
Figure 11Global monthly NH3 emissions (Gg N per month) from ammonium and urea fertilizer applications for 16 major crops in 2010 simulated by AMCLIM–Land.
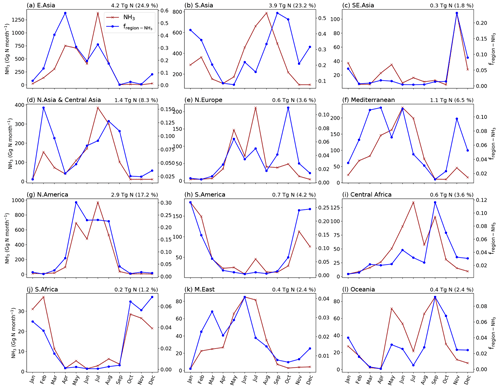
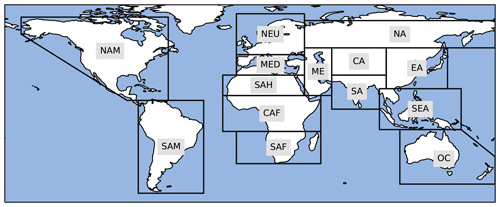
The seasonality of NH3 emissions differs between regions across the globe. Figures 12 and A6 present monthly NH3 emissions from 12 different geographical regions and the percentage of global monthly emissions that each region contributes. The map of the geographical regions defined in AMCLIM is given by Fig. A11. The highest emissions are from South Asia and East Asia, with both regions responsible for roughly a quarter of global emissions. North America has the third-highest emissions, accounting for over 17 % of global emissions. Southern Africa has the lowest emissions and only accounts for about 1 % of the global total. In terms of country-level statistics, China results in the largest emissions of 3.7 Tg N yr−1 in 2010 and 4.1 Tg N yr−1 in 2018, followed by India, which contributes to 3.4 Tg N yr−1 and 3.5 Tg N yr−1 in 2010 and 2018, respectively. The US creates third-largest amount of national emissions, with emissions of 1.9 Tg N yr−1 in 2010 and 2.0 Tg N yr−1 in 2018.
Regions in the NH, including East Asia, South Asia, north and central Asia, northern Europe and the Mediterranean, North America, and the Middle East, generally show high emissions in JJA and MAM, as shown in Figs. 12 and A6. In particular, East Asia, northern Europe and North America exhibit very similar monthly variations. Northern and central Asia and South Asia also show similar monthly trends. The NH3 emissions in the Mediterranean region are high for spring and summer emissions but much lower in autumn and winter. By contrast, South America and southern Africa show higher winter emissions and lower emissions in other seasons. Oceania has distinct seasonal emission patterns. The emissions in Oceania peak in May and are high in August and September. Figures 12 and A6 show that different regions dominate NH3 emissions in different seasons, with East Asia and South Asia being the largest contributors to spring and summer emissions, while South Asia and South America dominate autumn and winter emissions. North America also contributes significantly to summer emissions.
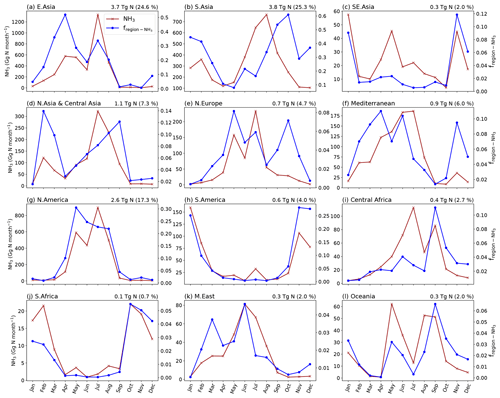
Figure 12Monthly NH3 emissions from ammonium and urea fertilizer application in different regions of the world and the relative fraction of the global monthly emissions that are from the corresponding regions (fregion). Annual total NH3 emissions of the region are given at the top-right corner of each plot with the percentage of emissions from each region. The figure is for 2010.
Table 2 provides a summary of the regional volatilization rates from the use of synthetic fertilizers in both 2010 and 2018. The data show that ammonium application generally results in higher estimated volatilization rates than urea application according to the AMCLIM model, noting that the values would be half those shown if ammonia volatilization is referenced to total N input where ammonium nitrate is used. Africa and Oceania have the highest volatilization rates for both 2010 and 2018, with over 23 % to 25 % of N in ammonium and urea application volatilized as NH3, while South America shows the lowest volatilization rates with less than 13 %. In the listed regions, the volatilization rates of both ammonium and urea application for 2018 are higher than 2010, except for Europe, North America and South Asia.
Table 2Volatilization rates of synthetic fertilizer use in different regions for the years 2010 and 2018 (percentage values). Values in the parentheses are volatilization rates when including nitrate application.

* Volatilization rates are half the specified figure if referenced against total N input when applying ammonium nitrate.
4.1 Comparison with other studies
The GRAMINAE dataset proved especially useful for testing the model in detail given that a robust set of ammonia flux data are available (based on comparison of several instruments) together with extensive supporting data that allow AMCLIM to be applied at a high time resolution (15 min resolution). However, many published ammonia flux datasets do not have comparable detail to the GRAMINAE dataset. This highlights the importance of providing sufficient information on micrometeorological conditions, soil data and management information to allow detailed model simulations.
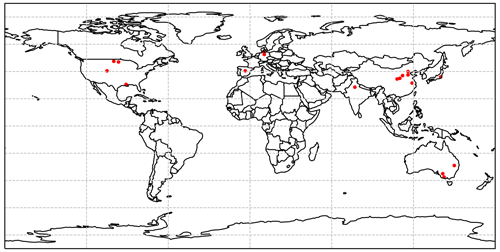
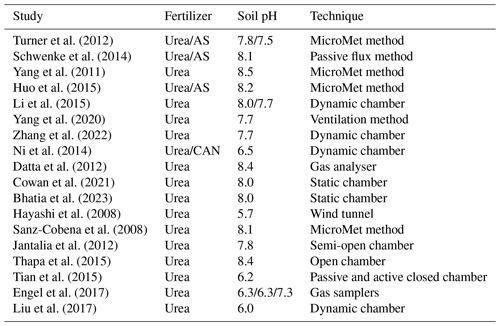
Nevertheless, it is possible to make a simpler overall comparison between the results of the global simulations of AMCLIM and the average volatilization rate of other published studies according to the latitude and longitude of each study. In a simple way, this takes into account the effects of environment and climate and soil and management conditions as they are estimated in AMCLIM. By doing this, the simulated volatilization rates from synthetic fertilizer use by AMCLIM were compared with measurements, focusing on experimental studies that measured cumulative NH3 emissions from urea and ammonium fertilizer application to agricultural land (Fig. 13; detailed information can be found in Table A2). Modelled volatilization rates were extracted from the global simulations and compared with the reported volatilization rates from these experimental studies that were conducted in different regions across the globe. These experimental studies used for comparisons were from 17 sites in seven countries (as shown in Fig. A13). The sites included show a reasonable spatial distribution from various climatic conditions (represented by average temperature from 8.5 to 31.7 °C during measurements) and soil conditions (represented by soil pH between a range from 5.7 to 8.5), with five major crops being examined.
As shown in Fig. 13a, AMCLIM can either overestimate the volatilization rates of urea application compared with measured estimates (e.g. studies “E”, “K”, “M”, “N”, “P”, “Q” and “R”) or underestimate them (e.g. study “A”). For ammonium fertilizer application (Fig. 13b), AMCLIM overestimated the volatilization rates, which has been also shown in the GRAMINAE simulations (Fig. 5d). The differences between the observed and modelled PV rates could be due to the diffusion and infiltration processes as irrigation was usually done in the experimental studies and the complex soil pH dynamics after urea application. It is also worth noting that the results from global simulations are largely dependent on the timing of fertilization (crop calendar), which might not be reflected in or not consistent with the experimental studies. The limitations of such comparisons emphasize the urgent need for well-documented and good-quality measurements to improve the development and performance of models.
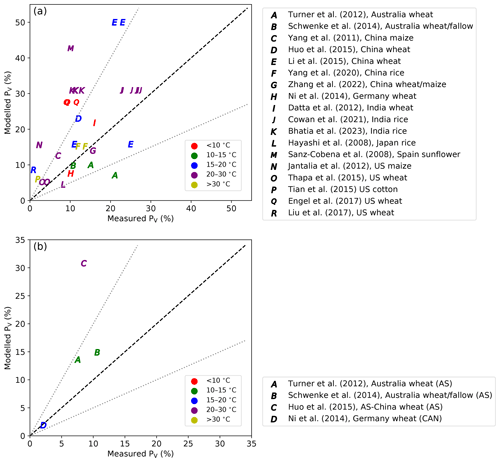
Figure 13Modelled percentage volatilization rates (PV, %) compared with experimental studies (Hayashi et al., 2008; Sanz-Cobena et al., 2008; Yang et al., 2011; Datta et al., 2012; Jantalia et al., 2012; Turner et al., 2012; Ni et al., 2014; Schwenke et al., 2014; Huo et al., 2015; Li et al., 2015; Tian et al., 2015; Thapa et al., 2015; Engel et al., 2017; Liu et al., 2017; Cowan et al., 2021; Zhang et al., 2022; Bhatia et al., 2023). Measurement data were from literature that studied NH3 volatilization from (a) urea application and (b) ammonium fertilizer application to fields. The dashed black line is the 1:1 line, and the dotted grey lines indicate the values within a factor of 2. AS stands for ammonium sulfate, and CAN stands for calcium ammonium nitrate.
As shown in Fig. 14a and b, both measured and modelled PV tend to be larger as soil pH increases, with modelled PV having a stronger response. Results of ammonium fertilizer application more obviously illustrate positive correlation between volatilization rates and soil pH compared with urea application, although this could be due to the studies having fewer data points. The general trend is consistent with the fact that more alkaline soils can result in higher NH3 volatilization. The soil pH used in AMCLIM for global simulations are sometimes lower than the measured values, and this indicates that the simulated volatilization rates would have been even larger if using higher pH. The difference in pH could be partly due to the model still not having high enough resolution to deal with the heterogeneity of soil characteristics. Overall, the comparisons reflect that AMCLIM is likely to overestimate NH3 emissions from fertilizer application as compared with the reported measurement results.
The comparatively high volatilization rates of ammonium fertilizers estimated by AMCLIM are possibly due to the following reasons.
-
AMCLIM does not simulate the dissolving process of ammonium fertilizers and instead assumes that ammonium “pellets” instantly dissolves in soil moisture according to the soil pH specified in the global soil database, which results in large initial emission potential and might cause an overestimation of NH3 emissions (Fig. 5d shows that the majority of overestimation by AMCLIM occurs in the first day).
-
The drainage and diffusion in AMCLIM might be underestimated, meaning that more N in the ammonium fertilizer is available for volatilization than may be the case in actuality.
-
The present version of AMCLIM does not include the potential for NH3 recapture by an overlying plant canopy. This may be particularly relevant for tall canopies and those with small soil ammonia emissions in wet environments.
-
Measurements also have uncertainties, especially when using enclosure methods to measure NH3 emissions (Kamp et al., 2024), which can significantly underestimate emissions. For example, companion studies at the GRAMINAE site suggested that NH3 fluxes measured by a cuvette system were only about a quarter of the net canopy fluxes estimated using micro-meteorological techniques, e.g. AGM and REA (David et al., 2009; Milford et al., 2009; Sutton et al., 2009a). Low levels of turbulent mixing and absorption to surfaces (especially if condensation occurs) are possible reasons for such underestimation of measured fluxes by chamber systems.
Each of these points indicates the need for further experimentation and comparison of published studies on the dependence of ammonia emission on dissolution processes, soil properties, canopy structure and alternative fates of the added nitrogen (see Fig. 9), with the prospect of improved simulation of these interactions. For example, future development of AMCLIM is planned to include assessment of interactions with the overlaying plant canopy.
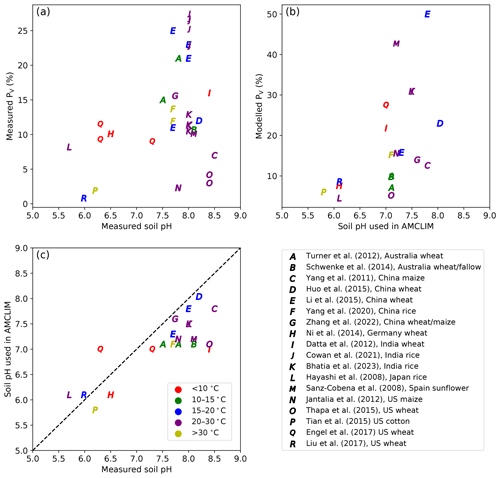
Figure 14Measured percentage volatilization rates (PV, %) vs. measured soil pH (a). Modelled PV vs. soil pH used in AMCLIM (b). Soil pH used in AMCLIM compared with measured soil pH (c), with the dashed black line representing the 1:1 line.
Table 3 compares the simulated NH3 emissions from synthetic fertilizer use by AMCLIM–Land with those estimated by other studies, including models and inventories, on global, continental and national scales. Table 3 also includes volatilization rates, where available. Among all studies for comparisons, DLEM and FAN are both processed-based models (see Table 3 for references for all model descriptions and studies), while the other studies are inventories that mainly use EF methods. DLEM incorporates a bi-directional exchange scheme for NH3, and FAN is interactively coupled to an Earth system model.
Table 3 shows AMCLIM–Land compared with DLEM and FAN at several spatial scales. Among models, estimated global NH3 emissions by AMCLIM are the second largest, which are in close agreement with DLEM. For the year 2010, AMCLIM and DLEM estimate 15.0 and 16.7 Tg N yr−1 of NH3 emissions, respectively. By comparison, the FAN model provides lower estimates of 12 Tg N yr−1 for 2000 by FANv1 and 11 Tg N yr−1 for 2010–2015 by FANv2. The lower NH3 emission value suggested by FAN is partially due to less total N application in FANv2, which is 79–87 Tg N yr−1 compared to 102 Tg N yr−1 in AMCLIM and DLEM. The volatilization rates estimated by the three models are comparable, ranging between 13 % and 16 %. For different types of fertilizers, it is estimated that about 16 % of N in urea fertilizers is lost as NH3 compared to 19 % by FANv2, and NH3 emissions from ammonium and nitrate fertilizer application account for 12 % to 13 %, which is higher than 7 % estimated by FANv2, while DLEM does not specifically report NH3 emissions from urea or ammonium fertilizers.
Global estimates of emissions from other studies vary significantly, ranging from 5.9 to 28.6 Tg N yr−1. MASSAGE_NH3 and NH3_stat both suggest that annual global NH3 emissions are less than 10 Tg N yr−1 for 2008 and 2012. The NH3_stat model estimates much lower emissions of 5.9 Tg N yr−1, which is only about 35 % of AMCLIM's result. In contrast, estimated emissions by Yang et al. (2023) are the highest (28.6 Tg N yr−1) for the 2010s. The large differences among the studies can be partly explained by the different agricultural activities included and different input data used in each study.
For NH3 emissions from major continents and emitters (China, India and the US), AMCLIM provides consistent estimates as compared with DLEM for regions including Africa, Asia, Europe and China but higher emissions than FANv2. However, the volatilization rates of AMCLIM and FANv2 agree with each other in Africa, Asia, Oceania, China and India, indicating that the different NH3 emissions can be partly explained by the different inputs of N fertilizer to the models. As shown in Table 3, AMCLIM has similar estimates for NH3 emissions to other studies for most of regions except for North America, US and India. For the US, emissions estimated by AMCLIM are higher than EPA by 60 % and NH3_stat and MASSAGE_NH3 by 2 to 4 times. Meanwhile, NH3 emissions from India are also higher in AMCLIM, approximately 10 % to 20 % higher than other models and inventories. Only Yang et al. (2023) suggested even higher NH3 emissions from India than AMCLIM. However, the volatilization rate for India estimated by AMCLIM is similar to FANv2. The slightly lower values of AMCLIM than FANv2 indicate that the difference mainly results from different input data used. For example, the total N application in India is 16 Tg N yr−1 in AMCLIM compared to 10 Tg N yr−1 in FANv2.
Table 3Comparisons of global, continental and national NH3 emissions from fertilizer (Tg N yr−1) and corresponding volatilization rates (%) between AMCLIM and other inventories, models and studies.
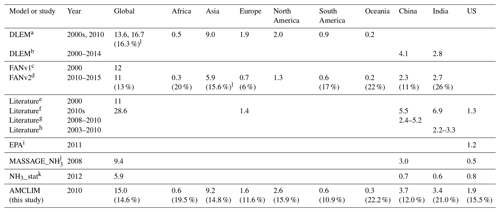
a Xu et al. (2019). b Xu et al. (2018). c Riddick et al. (2016). d Vira et al. (2020). e Beusen et al. (2008). f Yang et al. (2023). g Kurokawa et al. (2013); Kang et al. (2016); and Zhang et al. (2017, 2018). h Aneja et al. (2012) and Kurokawa et al. (2013). i EPA (2011). j Paulot et al. (2014). k Aneja et al. (2020). l Values are calculated based on the results in the literature.
Key features of several models are summarized and listed in Table 4. Compared with existing models, AMCLIM is a dynamical emission model with an emphasis on the NH3 volatilization. AMCLIM shows adequate levels of complexity in terms of soil layering construction, simulations for N processes in soils, NH3 volatilization simulation and soil pH dynamics. AMCLIM has relatively high temporal resolution, which provides implications for the temporal variations in NH3 fluxes. The highly resolved outputs can be used by atmospheric transport and chemistry models. It is worth noting that AMCLIM is considered a comprehensive emission model rather than a biogeochemical model.
Table 4Comparisons of model features between AMCLIM and other models for NH3 emission simulations.
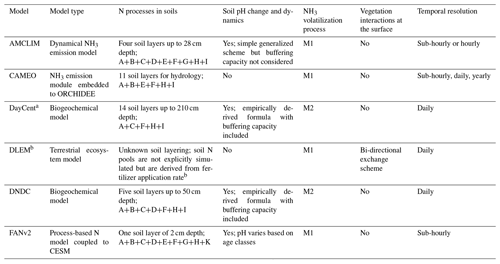
a Based on Gurung et al. (2021), who developed a new NH3 volatilization scheme for urea application in DayCent. b Based on a model version DLEM-Bi-NH3 (Xu et al., 2018).
Letters indicate the following processes: A is mass balance calculation of N pools; B is NH3/NHequilibrium; C is urea hydrolysis; D is TAN partition; E is surface runoff; F is leaching; G is diffusion in soils; H is nitrification; I is plant N uptake; J is microbial N uptake; K is mechanical N loss; M1 is fluxes that are concentration gradient driven and constrained by resistances derived from well-established micrometeorological theory; and M2 is empirically derived mass transfer coefficient.
For modelling global-scale NH3 emissions, calibrations were not explicitly done at site scale for models such as FANv2 (Vira et al., 2020), CAMEO (Beaudor et al., 2023), DNDC (Yang et al., 2022) and DLEM (Xu et al., 2019). This is possibly because global models tend to provide general representation and try to avoid over calibration. In contrast, DayCent is widely used for simulating N2O emissions rather than NH3 emissions and is intensively calibrated using N2O measurements from fields. The parameters can be quite different between simulations for different places, e.g. North America vs. Europe. However, there are limited studies that apply DayCent at a global scale, and little evidence was found that explicit model calibration was done in the global application of DayCent (e.g. Del Grosso et al., 2009).
In this study, the AMCLIM model was firstly applied to simulate the NH3 emission from fertilized grassland at the GRAMINAE site and was intensively evaluated by a detailed comparison of time series between measured and modelled fluxes. AMCLIM was then applied at the global scale to simulate NH3 emissions from 16 major crops. Admittedly, there is a gap resulting from using model settings for fertilized grassland to represent croplands. The development of AMCLIM was based on understanding at a process level. The management practices at the GRAMINAE site were not complicated, which provides a good test situation for the numerical representations of the physical and chemical processes. The model results show close agreement with the GRAMINAE measurements (Fig. 5). The multi-site comparison demonstrates that the model provides reasonable estimates for various crops under different climatic and soil conditions (Fig. 13), and the global estimates by AMCLIM are broadly consistent with existing models (as shown in Table 2). On the other hand, it has been found that the critical factor that affects NH3 emissions is the timing of fertilization and amount of fertilizer applied under current model settings (see Sect. 4.3 and Figs. A14 and A15). Therefore, considering the model structure and complexity, the processes included in AMCLIM are believed to be robust and representative of simulations for synthetic fertilizer use.
Table 5 summarizes the crop-specific NH3 emissions from synthetic fertilizer applications estimated by AMCLIM–Land and other studies. Although there are limited data available for NH3 emissions from individual crops, the results from each study are generally consistent in magnitude. Zhan et al. (2021) focuses on year 2000, and their values are the smallest. The results from Yang et al. (2023) are average values for the period from 2010 to 2018 and are generally higher. All studies agree that wheat, rice and maize are the top three crops that dominate the NH3 emissions. AMCLIM has similar estimates for maize but much higher wheat emissions and lower soybean emissions compared with DLEM. The emissions related to rice estimated by AMCLIM are nearly 50 % lower than estimates by DLEM, which might be partly due to the fact that AMCLIM does not include a flooded paddy scheme for rice simulations. Urea hydrolysis can be faster in a flooded rice paddy, which can result in higher NH3 emissions depending on floodwater pH. There are no data for fertilization of this type of rice systems in the GGCMI3 dataset that was used in AMCLIM. However, the simplification is considered reasonable for global application of the current model version as the comparisons (as shown in Fig. 13) indicate the simplification provides estimates that are accurate within an order of magnitude (mostly within a factor of 2). The differences in crop-specific NH3 emissions highlight the need for further research to improve the understanding of NH3 emissions from different crops and fertilizer management practices. Future work should include addressing of individual cropping systems in more detail.
4.2 Spatial and temporal variations in NH3 emissions
The NH3 emissions from synthetic fertilizer use are primarily determined by the amount of N applied and are strongly influenced by both environmental conditions and local management practices. Regions with high NH3 emissions are typically found in countries with intensive agricultural activities, such as China, India, Pakistan and the US, where a large amount of synthetic fertilizer N has been used. The PV rate is an important indicator that shows the percentage of applied N volatilizes as NH3. The regional pattern of the PV rate does not always match the distribution of NH3 emissions due to the combined effect of environmental factors and management practices. Since AMCLIM was applied in this study using the management practices that do not vary significantly for 2010 and 2018, this means that differences in PV between these years are mainly due to environmental differences between these years, as shown in Figs. 7 and A2.
When considering the environmental effects on NH3 emissions, there are several factors that can cause volatilization rates to vary, including soil pH, soil temperature and moisture, and wind speed. Alkaline soils tend to cause higher estimated NH3 emissions in AMCLIM, meaning that regions with high soil pH, such as the western US, Argentina, the Middle East, Namibia, Mongolia and part of northern China show high volatilization rates (soil map as shown in Fig. A12). Since the base soil pH distribution is fixed in AMCLIM–Land according to HWSD v1.2 (FAO/IIASA/ISRIC/ISS-CAS/JRC, 2012; Wieder et al., 2014) and does not vary over time, the similar geographical patterns of the volatilization rates in the 2 simulated years of 2010 and 2018 indicate clear climatic dependences (due to temperature, water and wind conditions) featured in NH3 volatilization.
High temperature leads to faster rates and quicker processes, which can result in larger emissions. Soil moisture influences the concentrations of N species in soils. When the soil is dry, soil TAN concentrations can be high, which may result in a greater emission potential at the soil surface, especially under alkaline soil conditions. This effect could be further amplified for ammonium fertilizer application as AMCLIM does not simulate the initial dissolving of fertilizer pellets. Dry regions, such as Mongolia, Namibia, the western US and the Middle East show high volatilization rates. It is worth noting that these regions also have alkaline soils with high pH values, suggesting that the high volatilization may be due to a combined effects of soil dryness and alkalinity. Moreover, when the soil is dry and the subsurface percolation flux is small, there may be a lack of infiltration or drainage, which prevents N from moving from the surface to deeper soil layers. Instead, more N will volatilize as NH3 from the surface. It is notable that the estimated N fluxes to run off are lower in 2018, but the NH3 volatilization rate is higher in 2018 than in 2010 (Fig. 9). Wind speed is also a critical factor that impacts NH3 volatilization since it influences the turbulence, which affects the atmospheric resistances. Emissions are higher under windy conditions because atmospheric resistances are smaller. Simulations for the GRAMINAE site indicate that the sub-hourly NH3 emissions vary with temperature and the friction velocity (which is related to wind speed and atmospheric resistances; Fig. 5) and show strong diurnal cycles. Rainfall can also affect the NH3 emission, mostly causing a reduction. Similarly, nitrogen species are washed off from the land surface during heavy rainfall event. Although the effects of rainfall are not explicitly included in AMCLIM, they are reflected implicitly by the runoff fluxes, and the magnitude of scavenged NH3 is small compared with the emission flux. The above meteorological factors can interactively affect the NH3 emission.
Management plays another key role in affecting the NH3 emissions in the agricultural activities, specifically through the timing of fertilizer application during planting seasons, the type of fertilizer used and the application techniques. The temporal variations in NH3 emissions are largely related to the timing of fertilizer application, since volatilization usually takes place soon after the fertilizers are applied. The regional monthly emissions are closely linked to the planting seasons, with large emissions being found in a few months throughout the year. On the global scale, NH3 emissions are the highest in MAM and JJA, with the first peak of emissions in May and the largest emissions in July, corresponding to the typical planting seasons for crops in the NH.
The second factor is the type of fertilizer used. According to simulations using AMCLIM–Land, application of ammonium and urea have similar volatilization rates on the global scale. The comparable volatilization rates of the two fertilizer types are possibly because of the following reasons. Ammonium is a direct input to soil TAN pool, which is readily volatilized as NH3, while urea must be hydrolysed before it is converted to TAN. The hydrolysis process is limited by water availability. If the soil is very dry, the amount of urea that hydrolyses is reduced (Rodríguez et al., 2005). Furthermore, hydrolysis of urea can cause soil pH to increase, leading to more NH3 emissions. As a result, NH3 volatilization from urea application is controlled by two processes with opposite effects. When including both ammonium and nitrate fertilizers (e.g. ammonium nitrate, where the N content doubles but the volatilization rate of NH3 halves because the nitrate part does not contribute to NH3 emissions), urea application is found to result in higher NH3 emission due to the elevated soil pH by hydrolysis.
The third critical factor is the application techniques. How fertilizers are applied on land can have huge impacts. Broadcasting is the most commonly used method and contributes to the largest fraction of NH3 emissions, while both immediate incorporation and deep placement of fertilizers are effective methods that can reduce NH3 emissions to a large extent. According to the assumptions specified in Table A1, only a small fraction of fertilizer was incorporated according to the development level of each region (WB, 2022). In practice the adoption of increased use of incorporation and deep placement could substantially reduce NH3 emissions as compared with the present estimates. The availability of national statistics on such practices is therefore a priority for improving estimates of the model and demonstrating the benefits of improved fertilizer placement practices.
Based on current estimates, less than 50 % of applied N is taken up by crops, which may be partly due to the very simple application techniques used. In addition to the three factors discussed above, irrigation can also influence NH3 emissions as it has been found in literature that less NH3 emissions occur after irrigation (Dawar et al., 2011; Yang et al., 2022; Zhang et al., 2022), although AMCLIM is not evaluated against observations for this effect because of insufficient input data. Irrigation leads to an increase in the soil moisture and reduction in emissions by diluting concentrations of N species and transporting them to deeper soil layers. Proper management practices, such as timely and precise application of fertilizers and adequate application techniques, can help reduce NH3 emissions and improve crop uptake of N.
4.3 Uncertainty and limitations
In general, uncertainty in NH3 emissions arises from two main aspects: input data and model parameters. Input data uncertainty includes the N application rates, the crop calendars that determine the application dates and the soil characteristics. The crop calendars used in AMCLIM are static. Emissions could be influenced if using different crop calendars as the environmental conditions may also change. AMCLIM assumes that fertilizers are applied twice during the growing season, which is a moderate value used as a representation for fertilization. This value mostly varies between one and three or four applications across the globe. For example, there can be two to four fertilizer applications in North America or zero to three applications in South America (Xu et al., 2019). Additional rounds of simulations were performed to test the following three possible scenarios: (1) 100 % of fertilizer N applied at the beginning of the planting season; (2) 75 % of N applied at the beginning of the planting season and 25 % midway through the growing season; and (3) 40 % of N applied at the beginning of the planting season, 30 % at one-third through the growing season, and 30 % at two-thirds through the growing season. The global NH3 emissions from synthetic fertilizer use based on the different scenarios were 10.8, 12.9 and 15.8 Tg N yr−1, respectively, as compared with the base assumption of 15.0 Tg N yr−1 (when applied at 50 % : 50 %). In general, this shows that in AMCLIM adding a larger share of fertilizer later in the growing season is associated with increased emission, which can be linked to warmer temperatures as the growing season progresses. However, it should be noted that further testing of this effect would be warranted given the possible effect of tall crop canopies in reducing emissions, which is not addressed in the present version of AMCLIM reported in this study. The differences in spatial distribution and seasonal variation between different fertilization scenarios are shown by Figs. A14 and A15.
In AMCLIM, only NH3 emissions from grazed grassland were simulated, which will be described by the second part of the model in a forthcoming paper (for the livestock sector). Fertilized grasslands (with synthetic fertilizers) were not included and simulated because there are no data specified for this type of vegetation in the GGCMI3 dataset used. This addresses the need for future work to use a more complete compilation of statistical data and model input data. It is worth noting that the majority of synthetic fertilizer used globally was for croplands rather than grasslands (although in Europe and some other locations grasslands can receive significant amounts of fertilizers). The total applied N from synthetic fertilizer was 102.3 Tg N yr−1 in AMCLIM, which is comparable to the 99.6 Tg N yr−1 of consumed fertilizer suggested by the International Fertilizer Association.
The heterogeneity of the land during fertilization can also contribute to uncertainty in the overall estimates. In intensive farming countries like China and India, where fertilization can take up to a week or more, the assumption of fertilization being completed within a day in AMCLIM introduces uncertainty. Soil characteristics including soil pH, bulk density, soil constituents and organic matter content are assumed to remain constant in AMCLIM–Land, which can affect the chemical equilibrium and variables dependent on these data.
Uncertainty is also introduced from various parameters used in the AMCLIM model. First, the representation of soil pH evolution after urea application relies on an empirical relationship due to the complexity of simulating soil pH dynamics. Soil pH is assumed in AMCLIM to reach a maximum of 8.5 after urea application and will eventually decline to the original value. The duration of such perturbed soil pH is assumed to be around 1 week. In addition, long-term trends of soil pH changes, i.e. soil acidification due to fertilization, are not included in AMCLIM. Instead, simulations for different years used the same base soil pH. Potentially the most important uncertainty is the extent of variations in soil pH between microsites, as this can substantially affect simulated ammonia emissions, for example if dissolving fertilizer particles are not well coupled to soil pH.
Second, AMCLIM assumes the atmospheric concentrations of NH3 to be zero rather than a positive value for the background NH3, which may cause some overestimation of emissions, although this is expected to be small (Fig. 6). Third, the model uses linear relationships to calculate the diffusive and drainage pathways, including irrigation-related drainage, which is difficult to simulate accurately. The overestimation of night-time NH3 at the GRAMINAE site by approximately a factor of 2 suggests that the diffusive fluxes were not well represented.
Fourth, the relative fraction of techniques used in fertilizer application worldwide are assumed to be dependent on country income level, as shown in Table A1. Wealthy countries are assumed to have better application techniques that result in less NH3 emissions compared to less developed countries that tend to use simpler application methods. Such an assumption is based on expert judgement due to the lack of statistical data and thus can introduce uncertainty. There are also sub-national-level variations in techniques used, which can affect the weighted sum and lead to different estimates. Application of a urease inhibitor was also not included in the current version of AMCLIM due to insufficient statistical data, which may result in an overestimation of NH3 emissions from urea application. However, this impact is limited because very few countries have regulations on the use of urease inhibitors. Future work on incorporating existing regulations will be possible once there are sufficient data.
A systematic calculation of uncertainty associated with a process-based model can be very complicated. Instead, considering all the factors discussed above, a simple analysis for estimating the uncertainty in AMCLIM was performed. For ammonium fertilizer, the estimated uncertainty is suggested to be 33 %, which was derived from the simulation of GRAMINAE. For urea application, the uncertainty was estimated to be 20 % based on the multi-site comparison (as shown in Fig. 13). As a result, the overall expected uncertainty in emissions from synthetic fertilizer use is 3.9 Tg N yr−1 in 2010 and 4.3 Tg N yr−1 in 2018, which accounts for 26 % of the emissions in each year. It is worth noting that readers should only interpret the estimates and the uncertainty within the context of modelling.
The AMCLIM model only simulates NH3 volatilization and does not include a bi-directional exchange scheme for NH3, which may overestimate the NH3 flux when there is enhanced deposition, especially for areas close to agricultural and semi-agricultural land. Another limitation of AMCLIM is the N uptake scheme. The current scheme for N uptake by crops has limited interactions with the carbon cycle, and the crop dynamics are represented by fixed empirical parameters that only account for temperature effects. There is no consideration of water stress constraining the uptake. Microbial N uptake is also not included in AMCLIM. However, these points are considered beyond the scope of this study due to the complexity involved in simulating the relevant processes.
It must be acknowledged that the detailed evaluation of AMCLIM focused on the GRAMINAE dataset, where all needed inputs and parameters were available, as well as clearly quantified uncertainties in the measured fluxes. Other possible evaluation datasets that were accessible to the authors had either key gaps in data following fertilizer application or major measurement uncertainties. For this reason, the wider evaluation took an approach of comparing with multiple studies where average flux estimates are available but the datasets are not sufficient for a detailed, hourly comparison with the model. This emphasizes the need to establish more high-quality and accessible ammonia flux datasets following fertilizer application that can be used for model development and evaluation. Considering the needs for detailed model testing, such measurements should meet the following requirements.
-
They should contain information about the field site (coordinates, basic climatic and soil conditions).
-
They should include meteorological variables that are measured at high frequency and reported with high temporal resolution (ideally sub-hourly, e.g. 15 min), including air temperature and wind speed at a reference height, atmospheric pressure, precipitation, and humidity. Radiation and heat flux measurements are also very useful, especially to establish canopy temperature, humidity and wetness.
-
They should include soil temperature and soil moisture measured at a specified depth (better to have measurements at multiple depths) with the same measured frequency as the meteorological variables.
-
They should include soil textures, bulk density and pH. If possible, the soil pH should be measured continuously or periodically following urea application.
-
They should include above-canopy fluxes of ammonia and atmospheric concentration of NH3 at a reference height above the canopy (e.g. 1 m), together with a report of the uncertainties involved (especially where uncertainties vary over time), with clear information provided about the NH3, measurement method and the flux method used, including any assumptions.
-
They should include a description of the field site, including estimates of surface displacement height, roughness height and single-sided leaf area index (LAI, if vegetation is present).
-
They should include a record of human management practices, such as fertilization information (date, time, amount and technique) and irrigation.
-
If possible, information about the temporal changes in atmospheric concentrations of other air pollutants, especially acidic compounds such as sulfur dioxide and nitric acid, should also be included.
-
Optionally, hydraulic conductivity and cation exchange capacity would be a useful addition.
-
It is critical that the measurements avoid large gaps in measurement data, especially at key periods (such as immediately after fertilization events), if measurement data are to be used for detailed comparison with a model application.
This study presents the development and operation of AMCLIM–Land, a module in AMCLIM designed to simulate NH3 emissions from synthetic fertilizer use at both the site scale and global scale. AMCLIM–Land simulates physical, chemical and biological processes in the soils and at the land surface that control NH3 volatilization. It incorporates the effects of environmental conditions and important management practices on these processes. AMCLIM–Land employs a four-layer soil structure, allowing for a detailed simulation of the soil processes and evaluation of various application techniques. Besides NH3 volatilization, AMCLIM–Land also models other important N pathways in the agricultural systems, including surface runoff, nitrification, crop uptake and dissolved N to deep soils via leaching and diffusion. Although they are not the prime focus of the present modelling approach, these losses are relevant as they affect the amount of ammoniacal nitrogen that is available at the soil surface for volatilization as ammonia.
AMCLIM–Land was tested at the site scale (one field campaign with detailed measurements) and then applied on the global scale. A review of the literature showed that many NH3 flux measurement datasets do not have the requisite information included to allow full application of the model. Nevertheless, a broader comparison of average volatilization rates was possible with a wide range of published literature (Fig. 13). The comparison demonstrates close agreement with measurements in the GRAMINAE experiment and broad agreement from the global comparison of mean volatilization rates. AMCLIM–Land accurately captures the major features of NH3 fluxes from a post-cutting grassland after fertilization in the GRAMINAE study. On the global scale, using AMCLIM–Land it is estimated that NH3 emissions from synthetic fertilizer use are 15.0±3.9 Tg N yr−1 in 2010 and 16.8±4.3 Tg N yr−1 in 2018, which accounts for 14.6±3.8 % and 13.9±3.6 % of the total N in synthetic fertilizers, respectively, in each year. The spatial and temporal variations in NH3 emissions are significant, with high emissions occurring in regions with intensive agricultural activities, such as China, India and the US. Global NH3 emissions are dominated by East Asia, South Asia and North America. AMCLIM highlights key factors that tend to cause larger NH3 emissions, including hot temperatures, low soil moisture, windy conditions and high soil pH. The highest NH3 emissions occur in July during both simulated years, and the seasonality of emissions was largely driven by planting seasons and temperature. Summer (JJA) contributed to over half of the annual NH3 emissions.
Based on simulations using AMCLIM–Land, less than 50 % of applied N is absorbed by crops (Fig. 9), and NH3 volatilization to the air is one of the major pathways for N losses. Broadcasting is the most commonly used method for fertilizer application, but it results in a large fraction of N being lost due to NH3 emissions. By comparison, incorporation and deep placement are effective methods that can be employed to mitigate NH3 emissions and treated within the modelling framework of AMCLIM.
AMCLIM–Land can be used as a valuable tool for exploring the impacts of different agricultural management practices on NH3 emissions and N pathways despite the necessary simplifications of complex processes. The main advantages of AMCLIM–Land include (1) the model being based on understanding at a process level and including the most important N pathways; (2) the inclusion of responses to environmental variables; (3) representations of local management being present; and (4) the model performing simulations at high temporal resolutions that provide more reliable estimates of NH3 emissions, which are strongly influenced by environmental conditions. Overall, AMCLIM–Land provides insights into how environmental conditions and changes in agricultural management can affect NH3 emissions and the N pathways.
Future research should focus on improving the soil pH dynamics and better representing diffusion and drainage in the AMCLIM model in order to provide more accurate estimates of NH3 emissions. Incorporating a bi-directional exchange scheme for NH3 could be a potential future task that would give the model the ability simulate interactions between the soil and the vegetation. More testing and comparisons against site-scale measurements will also be helpful to reduce uncertainty and improve the model performance.
A1 Global fertilizer use in the 21st century
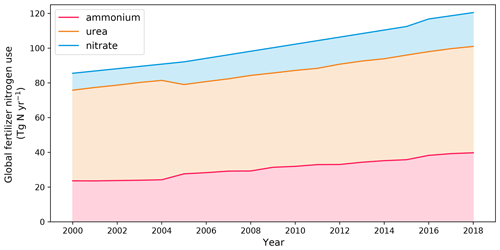
Figure A1Global total use of three types of fertilizers in the 21st century (IFA, 2021). The 16 major crops that are simulated by AMCLIM-Land are (1) barley, (2) cassava, (3) cotton, (4) groundnut, (5) maize, (6) millet, (7) potato, (8) rapeseed, (9) rice, (10) rye, (11) sorghum, (12) soybean, (13) sugar beet, (14) sunflower, (15) sugarcane and (16) wheat.
A2 Techniques used for chemical fertilizer application
A3 Global simulations for the year 2018
A4 Crop-specific NH3 emissions
A5 Effects of application techniques
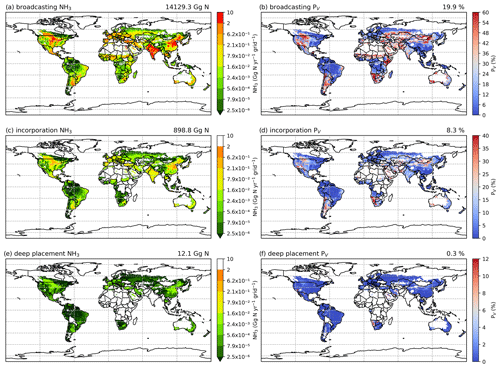
Figure A9Simulated NH3 emissions (Gg N yr−1) from synthetic fertilizer application by three techniques and the corresponding volatilization rates (PV) in 2010. NH3 emissions from (a) broadcasting, (c) incorporation and (e) deep placement. Percentage of applied N that volatilizes as NH3 by (b) broadcasting, (d) incorporation and (f) deep placement.
A6 Geographical regions defined in AMCLIM
A8 List of experimental studies used for model comparison
A9 Global simulations for different fertilization scenarios
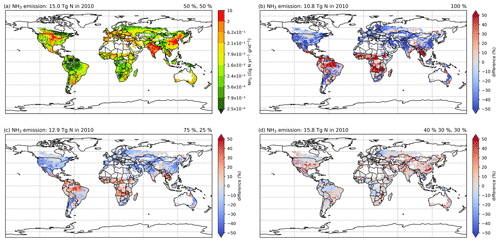
Figure A14Simulated (a) global NH3 emissions (Gg N yr−1 per grid) from synthetic fertilizer use in 2010 using the 50 %–50 % fertilization scenario and differences in NH3 emissions (%) from simulations using the (b) 100 % fertilization scenario, (c) 75 %–25 % fertilization scenario and (d) 40 %–30 %–30 % fertilization scenario.
Code of the model can be obtained from GitHub (https://github.com/jjzwilliam/AMCLIM, last access: 3 April 2024) and Zenodo (https://doi.org/10.5281/zenodo.10911886, Jiang, 2024). Model results presented in this study are in netCDF format and can be freely accessed from the Edinburgh DataShare (https://doi.org/10.7488/ds/7710, Jiang et al., 2024).
A table of model variables and parameters is presented in the Supplement. The supplement related to this article is available online at: https://doi.org/10.5194/gmd-17-8181-2024-supplement.
JJ, DSS and MAS designed the research. JJ developed the model, wrote the code, performed the simulations and wrote the paper. All authors contributed to analysis of the model outputs, interpretation of results and critical revision of the text.
The contact author has declared that none of the authors has any competing interests.
Publisher's note: Copernicus Publications remains neutral with regard to jurisdictional claims made in the text, published maps, institutional affiliations, or any other geographical representation in this paper. While Copernicus Publications makes every effort to include appropriate place names, the final responsibility lies with the authors.
Jize Jiang gratefully acknowledges support from University of Edinburgh, UK Centre for Ecology and Hydrology (UK CEH), ETH Zurich, and the UK national supercomputing ARCHER2. The authors are grateful for the support from the Global Environment Facility (GEF) through the UN Environment Programme (UNEP) for the project “Towards the International Nitrogen Management System (INMS)”; from the UKRI under its Global Challenges Research Fund for support of the GCRF South Asian Nitrogen Hub (grant no. NE/S009019/2); from NERC for National Capability support, including through the CEH SUNRISE project; and from the ReCLEAN Joint Initiative at ETH Zurich under the ETH Board Joint Initiatives scheme. The authors sincerely thank the two anonymous reviewers for their insightful and constructive comments and suggestions during the reviewing process. The authors thank Christoph Müller for being the topic editor.
This research has been supported by the UK Natural Environment Research Council (grant no. NE/S009019/2) and ReCLEAN Joint-Initiative co-financed by the ETH board.
This paper was edited by Christoph Müller and reviewed by two anonymous referees.
Aneja, V. P., Schlesinger, W. H., Erisman, J. W., Behera, S. N., Sharma, M., and Battye, W.: Reactive nitrogen emissions from crop and livestock farming in India, Atmos. Environ., 47, 92–103, https://doi.org/10.1016/j.atmosenv.2011.11.026, 2012.
Aneja, V. P., Schlesinger, W. H., Li, Q., Nahas, A., and Battye, W. H.: Characterization of the Global Sources of Atmospheric Ammonia from Agricultural Soils, J. Geophys. Res.-Atmos., 125, e2019JD03168, https://doi.org/10.1029/2019JD031684, 2020.
Bash, J. O., Cooter, E. J., Dennis, R. L., Walker, J. T., and Pleim, J. E.: Evaluation of a regional air-quality model with bidirectional NH3 exchange coupled to an agroecosystem model, Biogeosciences, 10, 1635–1645, https://doi.org/10.5194/bg-10-1635-2013, 2013.
Bateman, E. J. and Baggs, E. M.: Contributions of nitrification and denitrification to N2O emissions from soils at different water-filled pore space, Biol. Fertil. Soils, 41, 379–388, https://doi.org/10.1007/s00374-005-0858-3, 2005.
Beaudor, M., Vuichard, N., Lathière, J., Evangeliou, N., Van Damme, M., Clarisse, L., and Hauglustaine, D.: Global agricultural ammonia emissions simulated with the ORCHIDEE land surface model, Geosci. Model Dev., 16, 1053–1081, https://doi.org/10.5194/gmd-16-1053-2023, 2023.
Beusen, A. H. W., Bouwman, A. F., Heuberger, P. S. C., Van Drecht, G., and Van Der Hoek, K. W.: Bottom-up uncertainty estimates of global ammonia emissions from global agricultural production systems, Atmos. Environ., 42, 6067–6077, https://doi.org/10.1016/j.atmosenv.2008.03.044, 2008.
Bhatia, A., Cowan, N. J., Drewer, J., Tomer, R., Kumar, V., Sharma, S., Paul, A., Jain, N., Kumar, S., Jha, G., Singh, R., Prasanna, R., Ramakrishnan, B., Bandyopadhyay, S. K., Kumar, D., Sutton, M. A., and Pathak, H.: The impact of different fertiliser management options and cultivars on nitrogen use efficiency and yield for rice cropping in the Indo-Gangetic Plain: Two seasons of methane, nitrous oxide and ammonia emissions, Agr. Ecosyst. Environ., 355, 108593, https://doi.org/10.1016/j.agee.2023.108593, 2023.
Butterbach-Bahl, K., Gundersen, P., Ambus, P., Augustin, J., Beier, C., Boeckx, P., Dannenmann, M., Gimeno, B. S., Ibrom, A., Kiese, R., Kitzler, B., Rees, R. M., Smith, K. A., Stevens, C., Vesala, T., and Zechmeister-Boltenstern, S.: Nitrogen processes in terrestrial ecosystems, in: The European Nitrogen Assessment, Chap. 6, Cambridge University Press, 99–125, 2011a.
Butterbach-Bahl, K., Nemitz, E., Zaehle, S., Billen, G., Boeckx, P., Erisman, J. W., Garnier, J., Upstill-Goddard, R., Kreuzer, M., Oenema, O., Reis, S., Schaap, M., Simpson, D., De Vries, W., Winiwarter, W., and Sutton, M. A.: Nitrogen as a threat to the European greenhouse balance, in: The European Nitrogen Assessment, edited by: Sutton, M. A., Howard, C. M., Erisman, J. W., Billen, G., Bleeker, A., Grennfelt, P., Van Grinsven, H., and Grizzetti, B., Cambridge University Press, 434–462, https://doi.org/10.1017/CBO9780511976988.022, 2011b.
Cabrera, M. L., Kissel, D. E., and Bock, B. R.: Urea hydrolysis in soil: Effects of urea concentration and soil pH, Soil Biol. Biochem., 23, 1121–1124, https://doi.org/10.1016/0038-0717(91)90023-D, 1991.
Chantigny, M. H., Rochette, P., Angers, D. A., Massé, D., and Côté, D.: Ammonia Volatilization and Selected Soil Characteristics Following Application of Anaerobically Digested Pig Slurry, Soil Sci. Soc. Am. J., 68, 306–312, https://doi.org/10.2136/sssaj2004.3060, 2004.
Chen, Y., Shen, H., Kaiser, J., Hu, Y., Capps, S. L., Zhao, S., Hakami, A., Shih, J.-S., Pavur, G. K., Turner, M. D., Henze, D. K., Resler, J., Nenes, A., Napelenok, S. L., Bash, J. O., Fahey, K. M., Carmichael, G. R., Chai, T., Clarisse, L., Coheur, P.-F., Van Damme, M., and Russell, A. G.: High-resolution hybrid inversion of IASI ammonia columns to constrain US ammonia emissions using the CMAQ adjoint model, Atmos. Chem. Phys., 21, 2067–2082, https://doi.org/10.5194/acp-21-2067-2021, 2021.
Cowan, N., Bhatia, A., Drewer, J., Jain, N., Singh, R., Tomer, R., Kumar, V., Kumar, O., Prasanna, R., Ramakrishnan, B., Kumar, D., Bandyopadhyay, S. K., Sutton, M., and Pathak, H.: Experimental comparison of continuous and intermittent flooding of rice in relation to methane, nitrous oxide and ammonia emissions and the implications for nitrogen use efficiency and yield, Agr. Ecosyst. Environ., 319, 107571, https://doi.org/10.1016/j.agee.2021.107571, 2021.
Curtin, D., Peterson, M. E., Qiu, W., and Fraser, P. M.: Predicting soil pH changes in response to application of urea and sheep urine, J. Environ. Qual., 49, 1445–1452, https://doi.org/10.1002/jeq2.20130, 2020.
Datta, A., Sharma, S. K., Harit, R. C., Kumar, V., Mandal, T. K., and Pathak, H.: Ammonia emission from subtropical crop land area in India, Asia-Pacific J. Atmos. Sci., 48, 275–281, https://doi.org/10.1007/s13143-012-0027-1, 2012.
David, M., Loubet, B., Cellier, P., Mattsson, M., Schjoerring, J. K., Nemitz, E., Roche, R., Riedo, M., and Sutton, M. A.: Ammonia sources and sinks in an intensively managed grassland canopy, Biogeosciences, 6, 1903–1915, https://doi.org/10.5194/bg-6-1903-2009, 2009.
Dawar, K., Zaman, M., Rowarth, J. S., Blennerhassett, J., and Turnbull, M. H.: Urea hydrolysis and lateral and vertical movement in the soil: effects of urease inhibitor and irrigation, Biol. Fertil. Soils, 47, 139–146, https://doi.org/10.1007/s00374-010-0515-3, 2011.
Del Grosso, S. J., Ojima, D. S., Parton, W. J., Stehfest, E., Heistemann, M., DeAngelo, B., and Rose, S.: Global scale DAYCENT model analysis of greenhouse gas emissions and mitigation strategies for cropped soils, Global Planet. Change, 67, 44–50, https://doi.org/10.1016/j.gloplacha.2008.12.006, 2009.
de Vries, W., van der Salm, C., Reinds, G. J., and Erisman, J. W.: Element fluxes through European forest ecosystems and their relationships with stand and site characteristics, Environ. Pollut., 148, 501–513, https://doi.org/10.1016/j.envpol.2006.12.001, 2007.
Dise, N. B., Rothwell, J. J., Gauci, V., van der Salm, C., and de Vries, W.: Predicting dissolved inorganic nitrogen leaching in European forests using two independent databases, Sci. Total Environ., 407, 1798–1808, https://doi.org/10.1016/j.scitotenv.2008.11.003, 2009.
Dise, N. B., Ashmore, M., Belyazid, S., Bleeker, A., Bobbink, R., De Vries, W., Erisman, J. W., Spranger, T., Stevens, C. J., and Van Den Berg, L.: Nitrogen as a threat to European terrestrial biodiversity, in: The European Nitrogen Assessment, edited by: Sutton, M. A., Howard, C. M., Erisman, J. W., Billen, G., Bleeker, A., Grennfelt, P., Van Grinsven, H., and Grizzetti, B., Cambridge University Press, 463–494, https://doi.org/10.1017/CBO9780511976988.023, 2011.
EDGAR: Emissions Database for Global Atmospheric Research v6.1, http://edgar.jrc.ec.europa.eu/, last access: 21 May 2023.
Engel, R., Jones, C., Romero, C., and Wallander, R.: Late-Fall, Winter and Spring Broadcast Applications of Urea to No-Till Winter Wheat I. Ammonia Loss and Mitigation by NBPT, Soil Sci. Soc. Am. J., 81, 322–330, https://doi.org/10.2136/sssaj2016.10.0332, 2017.
EPA: Environmental Protection Agency, https://www.epa.gov/air-emissions-inventories/2011-national-emissions-inventory-nei-data (last access: 12 May 2022), 2011.
Erisman, J. W., Sutton, M. A., Galloway, J., Klimont, Z., and Winiwarter, W.: How a century of ammonia synthesis changed the world, Nat. Geosci., 1, 636–639, https://doi.org/10.1038/ngeo325, 2008.
FAO/IIASA/ISRIC/ISS-CAS/JRC: Harmonized World Soil Database (version 1.2), FAO, Rome, Italy and IIASA, Laxenburg, Austria, 2012.
Farquhar, G. D., Firth, P. M., Wetselaar, R., and Weir, B.: On the Gaseous Exchange of Ammonia between Leaves and the Environment: Determination of the Ammonia Compensation Point, Plant Physiol., 66, 710–714, https://doi.org/10.1104/pp.66.4.710, 1980.
Flechard, C. R., Massad, R.-S., Loubet, B., Personne, E., Simpson, D., Bash, J. O., Cooter, E. J., Nemitz, E., and Sutton, M. A.: Advances in understanding, models and parameterizations of biosphere-atmosphere ammonia exchange, Biogeosciences, 10, 5183–5225, https://doi.org/10.5194/bg-10-5183-2013, 2013.
Fu, X., Wang, S. X., Ran, L. M., Pleim, J. E., Cooter, E., Bash, J. O., Benson, V., and Hao, J. M.: Estimating NH3 emissions from agricultural fertilizer application in China using the bi-directional CMAQ model coupled to an agro-ecosystem model, Atmos. Chem. Phys., 15, 6637–6649, https://doi.org/10.5194/acp-15-6637-2015, 2015.
Gilmour, J. T.: The Effects of Soil Properties on Nitrification and Nitrification Inhibition, Soil Sci. Soc. Am. J., 48, 1262–1266, 1984.
Gurung, R. B., Ogle, S. M., Breidt, F. J., Williams, S., Zhang, Y., Del Grosso, S. J., Parton, W. J., and Paustian, K.: Modeling ammonia volatilization from urea application to agricultural soils in the DayCent model, Nutr. Cycl. Agroecosyst., 119, 259–273, https://doi.org/10.1007/s10705-021-10122-z, 2021.
Hayashi, K., Nishimura, S., and Yagi, K.: Ammonia volatilization from a paddy field following applications of urea: Rice plants are both an absorber and an emitter for atmospheric ammonia, Sci. Total Environ., 390, 485–494, https://doi.org/10.1016/j.scitotenv.2007.10.037, 2008.
Hellsten, S., Dragosits, U., Place, C. J., Vieno, M., Dore, A. J., Misselbrook, T. H., Tang, Y. S., and Sutton, M. A.: Modelling the spatial distribution of ammonia emissions in the UK, Environ. Pollut., 154, 370–379, https://doi.org/10.1016/j.envpol.2008.02.017, 2008.
Hersbach, H., Bell, B., Berrisford, P., Hirahara, S., Horányi, A., Muñoz-Sabater, J., Nicolas, J., Peubey, C., Radu, R., Schepers, D., Simmons, A., Soci, C., Abdalla, S., Abellan, X., Balsamo, G., Bechtold, P., Biavati, G., Bidlot, J., Bonavita, M., Chiara, G., Dahlgren, P., Dee, D., Diamantakis, M., Dragani, R., Flemming, J., Forbes, R., Fuentes, M., Geer, A., Haimberger, L., Healy, S., Hogan, R. J., Hólm, E., Janisková, M., Keeley, S., Laloyaux, P., Lopez, P., Lupu, C., Radnoti, G., Rosnay, P., Rozum, I., Vamborg, F., Villaume, S., and Thépaut, J.: The ERA5 global reanalysis, Q. J. Roy. Meteor. Soc., 146, 1999–2049, https://doi.org/10.1002/qj.3803, 2020.
Huo, Q., Cai, X., Kang, L., Zhang, H., Song, Y., and Zhu, T.: Estimating ammonia emissions from a winter wheat cropland in North China Plain with field experiments and inverse dispersion modeling, Atmos. Environ., 104, 1–10, https://doi.org/10.1016/j.atmosenv.2015.01.003, 2015.
Hurtt, G. C., Chini, L., Sahajpal, R., Frolking, S., Bodirsky, B. L., Calvin, K., Doelman, J. C., Fisk, J., Fujimori, S., Klein Goldewijk, K., Hasegawa, T., Havlik, P., Heinimann, A., Humpenöder, F., Jungclaus, J., Kaplan, J. O., Kennedy, J., Krisztin, T., Lawrence, D., Lawrence, P., Ma, L., Mertz, O., Pongratz, J., Popp, A., Poulter, B., Riahi, K., Shevliakova, E., Stehfest, E., Thornton, P., Tubiello, F. N., van Vuuren, D. P., and Zhang, X.: Harmonization of global land use change and management for the period 850–2100 (LUH2) for CMIP6, Geosci. Model Dev., 13, 5425–5464, https://doi.org/10.5194/gmd-13-5425-2020, 2020.
IFA: International Fertilizer Association, http://https://www.fertilizer.org/, last access: 6 November 2021.
Jägermeyr, J., Müller, C., Ruane, A. C., Elliott, J., Balkovic, J., Castillo, O., Faye, B., Foster, I., Folberth, C., Franke, J. A., Fuchs, K., Guarin, J. R., Heinke, J., Hoogenboom, G., Iizumi, T., Jain, A. K., Kelly, D., Khabarov, N., Lange, S., Lin, T.-S., Liu, W., Mialyk, O., Minoli, S., Moyer, E. J., Okada, M., Phillips, M., Porter, C., Rabin, S. S., Scheer, C., Schneider, J. M., Schyns, J. F., Skalsky, R., Smerald, A., Stella, T., Stephens, H., Webber, H., Zabel, F., and Rosenzweig, C.: Climate impacts on global agriculture emerge earlier in new generation of climate and crop models, Nat. Food, 2, 873–885, https://doi.org/10.1038/s43016-021-00400-y, 2021.
Jantalia, C. P., Halvorson, A. D., Follett, R. F., Rodrigues Alves, B. J., Polidoro, J. C., and Urquiaga, S.: Nitrogen Source Effects on Ammonia Volatilization as Measured with Semi-Static Chambers, Agronom. J., 104, 1595–1603, https://doi.org/10.2134/agronj2012.0210, 2012.
Jiang, J.: AMmonia-CLIMate (AMCLIM) v1.0, Zenodo [code], https://doi.org/10.5281/zenodo.10911886, 2024.
Jiang, J., Stevenson, D. S., Uwizeye, A., Tempio, G., and Sutton, M. A.: A climate-dependent global model of ammonia emissions from chicken farming, Biogeosciences, 18, 135–158, https://doi.org/10.5194/bg-18-135-2021, 2021.
Jiang, J., Stevenson, D., and Sutton, M.: Data supporting the manuscript “A dynamical process-based model AMmonia–CLIMate (AMCLIM) for quantifying global agricultural ammonia emissions – Part 1: Land module for simulating emissions from synthetic fertilizer use”, 2010, University of Edinburgh, School of GeoSciences [data set], https://doi.org/10.7488/ds/7710, 2024.
Kamp, J. N., Hafner, S. D., Huijsmans, J., Van Boheemen, K., Götze, H., Pacholski, A., and Pedersen, J.: Comparison of two micrometeorological and three enclosure methods for measuring ammonia emission after slurry application in two field experiments, Agric. Forest Meteorol., 354, 110077, https://doi.org/10.1016/j.agrformet.2024.110077, 2024.
Kang, Y., Liu, M., Song, Y., Huang, X., Yao, H., Cai, X., Zhang, H., Kang, L., Liu, X., Yan, X., He, H., Zhang, Q., Shao, M., and Zhu, T.: High-resolution ammonia emissions inventories in China from 1980 to 2012, Atmos. Chem. Phys., 16, 2043–2058, https://doi.org/10.5194/acp-16-2043-2016, 2016.
Kurokawa, J., Ohara, T., Morikawa, T., Hanayama, S., Janssens-Maenhout, G., Fukui, T., Kawashima, K., and Akimoto, H.: Emissions of air pollutants and greenhouse gases over Asian regions during 2000–2008: Regional Emission inventory in ASia (REAS) version 2, Atmos. Chem. Phys., 13, 11019–11058, https://doi.org/10.5194/acp-13-11019-2013, 2013.
Li, Q., Yang, A., Wang, Z., Roelcke, M., Chen, X., Zhang, F., Pasda, G., Zerulla, W., Wissemeier, A. H., and Liu, X.: Effect of a new urease inhibitor on ammonia volatilization and nitrogen utilization in wheat in north and northwest China, Field Crops Res., 175, 96–105, https://doi.org/10.1016/j.fcr.2015.02.005, 2015.
Liu, S., Wang, J. J., Tian, Z., Wang, X., and Harrison, S.: Ammonia and greenhouse gas emissions from a subtropical wheat field under different nitrogen fertilization strategies, J. Environ. Sci., 57, 196–210, https://doi.org/10.1016/j.jes.2017.02.014, 2017.
Lu, C. and Tian, H.: Global nitrogen and phosphorus fertilizer use for agriculture production in the past half century: shifted hot spots and nutrient imbalance, Earth Syst. Sci. Data, 9, 181–192, https://doi.org/10.5194/essd-9-181-2017, 2017.
Malhi, S. S. and McGill, W. B.: Nitrification in three Alberta soils: Effect of temperature, moisture and substrate concentration, Soil Biol. Biochem., 14, 393–399, https://doi.org/10.1016/0038-0717(82)90011-6, 1982.
Milford, C., Theobald, M. R., Nemitz, E., Hargreaves, K. J., Horvath, L., Raso, J., Dämmgen, U., Neftel, A., Jones, S. K., Hensen, A., Loubet, B., Cellier, P., and Sutton, M. A.: Ammonia fluxes in relation to cutting and fertilization of an intensively managed grassland derived from an inter-comparison of gradient measurements, Biogeosciences, 6, 819–834, https://doi.org/10.5194/bg-6-819-2009, 2009.
Monfreda, C., Ramankutty, N., and Foley, J. A.: Farming the planet: 2. Geographic distribution of crop areas, yields, physiological types, and net primary production in the year 2000: GLOBAL CROP AREAS AND YIELDS IN 2000, Global Biogeochem. Cycles, 22, GB1022, https://doi.org/10.1029/2007GB002947, 2008.
Móring, A., Vieno, M., Doherty, R. M., Laubach, J., Taghizadeh-Toosi, A., and Sutton, M. A.: A process-based model for ammonia emission from urine patches, GAG (Generation of Ammonia from Grazing): description and sensitivity analysis, Biogeosciences, 13, 1837–1861, https://doi.org/10.5194/bg-13-1837-2016, 2016.
Móring, A., Vieno, M., Doherty, R. M., Milford, C., Nemitz, E., Twigg, M. M., Horváth, L., and Sutton, M. A.: Process-based modelling of NH3 exchange with grazed grasslands, Biogeosciences, 14, 4161–4193, https://doi.org/10.5194/bg-14-4161-2017, 2017.
Mueller, N. D., Gerber, J. S., Johnston, M., Ray, D. K., Ramankutty, N., and Foley, J. A.: Closing yield gaps through nutrient and water management, Nature, 490, 254–257, https://doi.org/10.1038/nature11420, 2012.
Nemitz, E., Sutton, M. A., Schjoerring, J. K., Husted, S., and Paul Wyers, G.: Resistance modelling of ammonia exchange over oilseed rape, Agric. Forest Meteorol., 105, 405–425, https://doi.org/10.1016/S0168-1923(00)00206-9, 2000.
Nemitz, E., Milford, C., and Sutton, M. A.: A two-layer canopy compensation point model for describing bi-directional biosphere-atmosphere exchange of ammonia, Q. J. Roy. Meteor. Soc., 127, 815–833, https://doi.org/10.1002/qj.49712757306, 2001.
Ni, K., Pacholski, A., and Kage, H.: Ammonia volatilization after application of urea to winter wheat over 3 years affected by novel urease and nitrification inhibitors, Agr. Ecosyst. Environ., 197, 184–194, https://doi.org/10.1016/j.agee.2014.08.007, 2014.
Norton, J. M. and Stark, J. M.: Regulation and Measurement of Nitrification in Terrestrial Systems, in: Methods in Enzymology, vol. 486, Elsevier, 343–368, https://doi.org/10.1016/B978-0-12-381294-0.00015-8, 2011.
Parton, W. J., Mosier, A. R., Ojima, D. S., Valentine, D. W., Schimel, D. S., Weier, K., and Kulmala, A. E.: Generalized model for N2 and N2O production from nitrification and denitrification, Global Biogeochem. Cycles, 10, 401–412, https://doi.org/10.1029/96GB01455, 1996.
Parton, W. J., Holland, E. A., Del Grosso, S. J., Hartman, M. D., Martin, R. E., Mosier, A. R., Ojima, D. S., and Schimel, D. S.: Generalized model for NOx and N2O emissions from soils, J. Geophys. Res., 106, 17403–17419, https://doi.org/10.1029/2001JD900101, 2001.
Paulot, F., Jacob, D. J., Pinder, R. W., Bash, J. O., Travis, K., and Henze, D. K.: Ammonia emissions in the United States, European Union, and China derived by high-resolution inversion of ammonium wet deposition data: Interpretation with a new agricultural emissions inventory (MASAGE_NH3), J. Geophys. Res.-Atmos., 119, 4343–4364, https://doi.org/10.1002/2013JD021130, 2014.
Pinder, R. W., Pekney, N. J., Davidson, C. I., and Adams, P. J.: A process-based model of ammonia emissions from dairy cows: improved temporal and spatial resolution, Atmos. Environ., 38, 1357–1365, https://doi.org/10.1016/j.atmosenv.2003.11.024, 2004.
Riddick, S., Ward, D., Hess, P., Mahowald, N., Massad, R., and Holland, E.: Estimate of changes in agricultural terrestrial nitrogen pathways and ammonia emissions from 1850 to present in the Community Earth System Model, Biogeosciences, 13, 3397–3426, https://doi.org/10.5194/bg-13-3397-2016, 2016.
Riedo, M., Grub, A., Rosset, M., and Fuhrer, J.: A pasture simulation model for dry matter production, and fluxes of carbon, nitrogen, water and energy, Ecol. Model., 105, 141–183, https://doi.org/10.1016/S0304-3800(97)00110-5, 1998.
Riedo, M., Milford, C., Schmid, M., and Sutton, M. A.: Coupling soil-plant-atmosphere exchange of ammonia with ecosystem functioning in grasslands, Ecol. Model., 158, 83–110, 2002.
Rodríguez, S. B., Alonso-Gaite, A., and Álvarez-Benedí, J.: Characterization of Nitrogen Transformations, Sorption and Volatilization Processes In Urea Fertilized Soils, Vadose Zone J., 4, 329–336, https://doi.org/10.2136/vzj2004.0102, 2005.
Sanz-Cobena, A., Misselbrook, T. H., Arce, A., Mingot, J. I., Diez, J. A., and Vallejo, A.: An inhibitor of urease activity effectively reduces ammonia emissions from soil treated with urea under Mediterranean conditions, Agr. Ecosyst. Environ., 126, 243–249, https://doi.org/10.1016/j.agee.2008.02.001, 2008.
Schwenke, G. D., Manning, W., and Haigh, B. M.: Ammonia volatilisation from nitrogen fertilisers surface-applied to bare fallows, wheat crops and perennial-grass-based pastures on Vertosols, Soil Res., 52, 805, https://doi.org/10.1071/SR14107, 2014.
Seneviratne, S. I., Nicholls, N., Easterling, D., Goodess, C. M., Kanae, S., Kossin, J., Luo, Y., Marengo, J., McInnes, K., Rahimi, M., Reichstein, M., Sorteberg, A., Vera, C., Zhang, X., Rusticucci, M., Semenov, V., Alexander, L. V., Allen, S., Benito, G., Cavazos, T., Clague, J., Conway, D., Della-Marta, P. M., Gerber, M., Gong, S., Goswami, B. N., Hemer, M., Huggel, C., Van Den Hurk, B., Kharin, V. V., Kitoh, A., Tank, A. M. G. K., Li, G., Mason, S., McGuire, W., Van Oldenborgh, G. J., Orlowsky, B., Smith, S., Thiaw, W., Velegrakis, A., Yiou, P., Zhang, T., Zhou, T., and Zwiers, F. W.: Changes in Climate Extremes and their Impacts on the Natural Physical Environment, in: Managing the Risks of Extreme Events and Disasters to Advance Climate Change Adaptation, edited by: Field, C. B., Barros, V., Stocker, T. F., and Dahe, Q., Cambridge University Press, 109–230, https://doi.org/10.1017/CBO9781139177245.006, 2012.
Sutton, M. A., Schjørring, J. K., and Wyers, G. P.: Plant-atmosphere exchange of ammonia, Philos. T. Roy. Soc. Lond. A, 351, 261–278, https://doi.org/10.1098/rsta.1995.0033, 1995.
Sutton, M. A., Burkhardt, J. K., Guerin, D., Nemitz, E., and Fowler, D.: Development of resistance models to describe measurements of bi-directional ammonia surface-atmosphere exchange, Atmos. Environ., 32, 473–480, https://doi.org/10.1016/S1352-2310(97)00164-7, 1998.
Sutton, M. A., Nemitz, E., Milford, C., Campbell, C., Erisman, J. W., Hensen, A., Cellier, P., David, M., Loubet, B., Personne, E., Schjoerring, J. K., Mattsson, M., Dorsey, J. R., Gallagher, M. W., Horvath, L., Weidinger, T., Meszaros, R., Dämmgen, U., Neftel, A., Herrmann, B., Lehman, B. E., Flechard, C., and Burkhardt, J.: Dynamics of ammonia exchange with cut grassland: synthesis of results and conclusions of the GRAMINAE Integrated Experiment, Biogeosciences, 6, 2907–2934, https://doi.org/10.5194/bg-6-2907-2009, 2009a.
Sutton, M. A., Nemitz, E., Theobald, M. R., Milford, C., Dorsey, J. R., Gallagher, M. W., Hensen, A., Jongejan, P. A. C., Erisman, J. W., Mattsson, M., Schjoerring, J. K., Cellier, P., Loubet, B., Roche, R., Neftel, A., Hermann, B., Jones, S. K., Lehman, B. E., Horvath, L., Weidinger, T., Rajkai, K., Burkhardt, J., Löpmeier, F. J., and Daemmgen, U.: Dynamics of ammonia exchange with cut grassland: strategy and implementation of the GRAMINAE Integrated Experiment, Biogeosciences, 6, 309–331, https://doi.org/10.5194/bg-6-309-2009, 2009b.
Sutton, M. A., Reis, S., Riddick, S. N., Dragosits, U., Nemitz, E., Theobald, M. R., Tang, Y. S., Braban, C. F., Vieno, M., Dore, A. J., Mitchell, R. F., Wanless, S., Daunt, F., Fowler, D., Blackall, T. D., Milford, C., Flechard, C. R., Loubet, B., Massad, R., Cellier, P., Personne, E., Coheur, P. F., Clarisse, L., Van Damme, M., Ngadi, Y., Clerbaux, C., Skjøth, C. A., Geels, C., Hertel, O., Wichink Kruit, R. J., Pinder, R. W., Bash, J. O., Walker, J. T., Simpson, D., Horváth, L., Misselbrook, T. H., Bleeker, A., Dentener, F., and de Vries, W.: Towards a climate-dependent paradigm of ammonia emission and deposition, Philos. T. Roy. Soc. B, 368, 20130166, https://doi.org/10.1098/rstb.2013.0166, 2013.
Sutton, M. A., Van Dijk, N., Levy, P. E., Jones, M. R., Leith, I. D., Sheppard, L. J., Leeson, S., Sim Tang, Y., Stephens, A., Braban, C. F., Dragosits, U., Howard, C. M., Vieno, M., Fowler, D., Corbett, P., Naikoo, M. I., Munzi, S., Ellis, C. J., Chatterjee, S., Steadman, C. E., Móring, A., and Wolseley, P. A.: Alkaline air: changing perspectives on nitrogen and air pollution in an ammonia-rich world, Philos. T. Roy. Soc. A., 378, 20190315, https://doi.org/10.1098/rsta.2019.0315, 2020.
Sutton, M. A., Howard, C. M., Kanter, D. R., Lassaletta, L., Móring, A., Raghuram, N., and Read, N.: The nitrogen decade: mobilizing global action on nitrogen to 2030 and beyond, One Earth, 4, 10–14, https://doi.org/10.1016/j.oneear.2020.12.016, 2021.
Thapa, R., Chatterjee, A., Johnson, J. M. F., and Awale, R.: Stabilized Nitrogen Fertilizers and Application Rate Influence Nitrogen Losses under Rainfed Spring Wheat, Agronom. J., 107, 1885–1894, https://doi.org/10.2134/agronj15.0081, 2015.
Thornley, J. H. M.: A Transport-resistance Model of Forest Growth and Partitioning, Ann. Bot., 68, 211–226, https://doi.org/10.1093/oxfordjournals.aob.a088246, 1991.
Thornley, J. H. M. and Cannell, M. G. R.: Nitrogen Relations in a Forest Plantation – Soil Organic Matter Ecosystem Model, Ann. Bot., 70, 137–151, https://doi.org/10.1093/oxfordjournals.aob.a088450, 1992.
Thornley, J. H. M. and Verberne, E. L. J.: A model of nitrogen flows in grassland, Plant Cell Environ, 12, 863–886, https://doi.org/10.1111/j.1365-3040.1989.tb01967.x, 1989.
Tian, Z., Wang, J. J., Liu, S., Zhang, Z., Dodla, S. K., and Myers, G.: Application effects of coated urea and urease and nitrification inhibitors on ammonia and greenhouse gas emissions from a subtropical cotton field of the Mississippi delta region, Sci. Total Environ., 533, 329–338, https://doi.org/10.1016/j.scitotenv.2015.06.147, 2015.
Turner, D. A., Edis, R. E., Chen, D., Freney, J. R., and Denmead, O. T.: Ammonia volatilization from nitrogen fertilizers applied to cereals in two cropping areas of southern Australia, Nutr. Cycl. Agroecosyst., 93, 113–126, https://doi.org/10.1007/s10705-012-9504-2, 2012.
Vira, J., Hess, P., Melkonian, J., and Wieder, W. R.: An improved mechanistic model for ammonia volatilization in Earth system models: Flow of Agricultural Nitrogen version 2 (FANv2), Geosci. Model Dev., 13, 4459–4490, https://doi.org/10.5194/gmd-13-4459-2020, 2020.
WB: World Bank, https://www.worldbank.org/, last access: 23 March 2022.
Wieder, W. R., Boehnert, J., and Bonan, G. B.: Evaluating soil biogeochemistry parameterizations in Earth system models with observations: Soil Biogeochemistry in ESMs, Global Biogeochem. Cycles, 28, 211–222, https://doi.org/10.1002/2013GB004665, 2014.
Xu, R., Tian, H., Pan, S., Prior, S. A., Feng, Y., Batchelor, W. D., Chen, J., and Yang, J.: Global ammonia emissions from synthetic nitrogen fertilizer applications in agricultural systems: Empirical and process-based estimates and uncertainty, Glob. Change Biol., 25, 314–326, https://doi.org/10.1111/gcb.14499, 2019.
Xu, R. T., Pan, S. F., Chen, J., Chen, G. S., Yang, J., Dangal, S. R. S., Shepard, J. P., and Tian, H. Q.: Half-Century Ammonia Emissions From Agricultural Systems in Southern Asia: Magnitude, Spatiotemporal Patterns, and Implications for Human Health, GeoHealth, 2, 40–53, https://doi.org/10.1002/2017GH000098, 2018.
Yang, G., Ji, H., Sheng, J., Zhang, Y., Feng, Y., Guo, Z., and Chen, L.: Combining Azolla and urease inhibitor to reduce ammonia volatilization and increase nitrogen use efficiency and grain yield of rice, Sci. Total Environ., 743, 140799, https://doi.org/10.1016/j.scitotenv.2020.140799, 2020.
Yang, Y., Liu, L., Bai, Z., Xu, W., Zhang, F., Zhang, X., Liu, X., and Xie, Y.: Comprehensive quantification of global cropland ammonia emissions and potential abatement, Sci. Total Environ., 812, 151450, https://doi.org/10.1016/j.scitotenv.2021.151450, 2022.
Yang, Y., Liu, L., Liu, P., Ding, J., Xu, H., and Liu, S.: Improved global agricultural crop- and animal-specific ammonia emissions during 1961–2018, Agr. Ecosyst. Environ., 344, 108289, https://doi.org/10.1016/j.agee.2022.108289, 2023.
Yang, Z. P., Turner, D. A., Zhang, J. J., Wang, Y. L., Chen, M. C., Zhang, Q., Denmead, O. T., Chen, D., and Freney, J. R.: Loss of nitrogen by ammonia volatilisation and denitrification after application of urea to maize in Shanxi Province, China, Soil Res., 49, 462, https://doi.org/10.1071/SR11107, 2011.
Zhan, X., Adalibieke, W., Cui, X., Winiwarter, W., Reis, S., Zhang, L., Bai, Z., Wang, Q., Huang, W., and Zhou, F.: Improved Estimates of Ammonia Emissions from Global Croplands, Environ. Sci. Technol., 55, 1329–1338, https://doi.org/10.1021/acs.est.0c05149, 2021.
Zhang, C., Song, X., Zhang, Y., Wang, D., Rees, R. M., and Ju, X.: Using nitrification inhibitors and deep placement to tackle the trade-offs between NH3 and N2O emissions in global croplands, Global Change Biology, 28, 4409–4422, https://doi.org/10.1111/gcb.16198, 2022.
Zhang, L., Chen, Y., Zhao, Y., Henze, D. K., Zhu, L., Song, Y., Paulot, F., Liu, X., Pan, Y., Lin, Y., and Huang, B.: Agricultural ammonia emissions in China: reconciling bottom-up and top-down estimates, Atmos. Chem. Phys., 18, 339–355, https://doi.org/10.5194/acp-18-339-2018, 2018.
Zhang, X., Wu, Y., Liu, X., Reis, S., Jin, J., Dragosits, U., Van Damme, M., Clarisse, L., Whitburn, S., Coheur, P.-F., and Gu, B.: Ammonia Emissions May Be Substantially Underestimated in China, Environ. Sci. Technol., 51, 12089–12096, https://doi.org/10.1021/acs.est.7b02171, 2017.


