the Creative Commons Attribution 4.0 License.
the Creative Commons Attribution 4.0 License.
Development and performance of a high-resolution surface wave and storm surge forecast model: application to a large lake
Laura L. Swatridge
Ryan P. Mulligan
Leon Boegman
Shiliang Shan
A real-time forecast model of surface hydrodynamics in Lake Ontario (Coastlines-LO) was developed to automatically predict storm surges and surface waves. The system uses a dynamically coupled Delft3D–SWAN model with a structured grid to generate 48 h predictions for the lake that are updated every 6 h. The lake surface is forced with meteorological data from the High Resolution Deterministic Prediction System (HRDPS). The forecast model has been running since May 2021, capturing a wide variety of storm conditions. Good agreement between observations and modelled results is achieved, with root mean squared errors (RMSEs) for water levels and waves under 0.02 and 0.26 m, respectively. During storm events, the magnitude and timing of storm surges are accurately predicted at nine monitoring stations (RMSE <0.05 m), with model accuracy either improving or remaining consistent with decreasing forecast length. Forecast significant wave heights agree with observed data (1 %–12 % relative error for peak wave heights) at four wave buoys in the lake. Coastlines-LO forecasts for storm surge prediction for two consecutive storm events were compared to those from the Great Lakes Coastal Forecasting System (GLCFS) to further evaluate model performance. Both systems achieved comparable results with average RMSEs of 0.02 m. Coastlines-LO is an open-source wrapper code driven by open data and has relatively low computational requirements compared to GLCFS, making this approach suitable for forecasting marine conditions in other coastal regions.
- Article
(7818 KB) - Full-text XML
-
Supplement
(1514 KB) - BibTeX
- EndNote
-
A real-time forecast model of wind-driven hydrodynamics in Lake Ontario is developed.
-
Model performance compares well with observed data and other forecast models.
-
Forecast lead time impacts the accuracy of wave height and storm surge predictions.
Coastal regions of large lakes can face hazardous conditions with costly consequences due to strong storm events, where powerful winds generate large waves and a storm surge (Danard, 2003; FEMA, 2014; Gallagher et al., 2020). Waves during these events can cause erosion, overtopping, and run-up, with the hazards being greater when the water level is elevated due to a storm surge. The intensity and frequency of strong storm events are increasing in the Great Lakes region as a result of climate change, as tropical storms are predicted to reach higher latitudes more often (Bender et al., 2010; Studholme et al., 2022). In addition, the mean water levels in the Great Lakes are being impacted by climate change, with large seasonal fluctuations in lake levels and record-low and record-high water levels consistently occurring in recent years (Gronewold and Rood, 2019). The combined impacts of these projections present a greater risk for hazardous conditions in Great Lakes coastal regions, and developing better methods to understand and model the physical processes occurring during storms is important to help mitigate the risk (Chisholm et al., 2021; Gronewold et al., 2013).
Real-time forecasting of lakes and coastal oceans can be achieved by applying numerical models to run predictive simulations of future hydrodynamic conditions in real time. Water level, circulation, and temperature simulations, using forecast models of large lakes and reservoirs, aid in water quality management (Baracchini et al., 2020; Carey et al., 2022; Lin et al., 2022). Coastal hazard forecasting is also being applied in numerous ocean regions, including the northern Gulf of Mexico, where forecast systems of water levels and waves predict hurricane impacts on various scales (Bilskie et al., 2022; Dietrich et al., 2018; Paramygin et al., 2017). Similarly, Rey and Mulligan (2021) use a coupled Deflt3D–SWAN model to forecast storm conditions in coastal North Carolina, investigating the influence of various atmospheric forecast models on the results during hurricanes. Specific to lakes, the National Oceanic and Atmospheric Administration (NOAA) has implemented forecast models for North American coastal regions, including the Great Lakes, with the Great Lakes Coastal Forecasting System (GLCFS). The GLCFS uses a high-resolution (30 m–2 km) hydrodynamic model (FVCOM) to simulate physical processes including currents, temperatures, and water levels (Kelley et al., 2018; Peng et al., 2019). Waves in the Great Lakes are predicted by Environment and Climate Change Canada's (ECCC) Regional Ensemble Wave Prediction System (REWPS), which uses a probabilistic approach to forecast wave characteristic 3 d into the future.
Developing deterministic forecast models that run in real time requires dealing with the challenge of minimizing the computational runtime of the model while still achieving accurate results (model resolution and performance), as the forecasts must be available in advance of the actual event. This need to effectively balance efficiency and accuracy in real-time models is an active research area (Elko et al., 2019). In addition, clear and efficient dissemination of forecasts must be provided to users and stakeholders. Typical real-time coastal models require large computing resources to run high-resolution and accurate forecast simulations (Bilskie et al., 2022; Kelley et al., 2018), while fewer model applications focus on developing flexible systems that can achieve accurate results while running on local computers, often for smaller domains, using open data and with a smaller computational allowance (Lin et al., 2022; Rey and Mulligan, 2021).
The accuracy of numerical models for simulating the hydrodynamic response of coastal regions to storm events has increased with advances in computing power, data availability, and the development of models that can better represent more physical processes and their interactions; however, model performance is still limited by the quality of input and forcing data available for a simulation. Model ability also depends on the grid resolution, with higher-resolution models being more capable of resolving bathymetric features (Bilskie et al., 2022), and the inclusion of relevant processes, such as wave–current interactions and baroclinic effects (Asher et al., 2019; Swatridge et al., 2022). A main consideration is the accuracy of the atmospheric forcing, as winds are the primary driver of surface behaviour, and errors in the winds translate through as errors in the modelled results (Dietrich et al., 2018; Farhadzadeh and Gangai, 2017; Rey and Mulligan, 2021).
A probabilistic approach can be used to account for uncertainty in atmospheric forcing by running multiple variations of the same event; however, this requires large computational resources (Baracchini et al., 2020; Fleming et al., 2008). In deterministic forecasts of water levels in Lake Erie, the error in the atmospheric forcing was significantly larger for 240 h forecasts compared to the 120 h forecasts, which translated to increased error in predicted water levels (Lin et al., 2022). The longer forecast predicted excessive seiching and an underestimation in peak water level, which improved as forecast length decreased. Forecasts of hurricane storm surges and waves in the Gulf of Mexico by Forbes et al. (2010), Dietrich et al. (2018), and Bilskie et al. (2022) found trends of decreasing error in storm surge prediction with shorter forecast length. Longer forecasts (∼5 d) resulted in storm surge variations of up to 4 m from the best track predictions, attributed to variability in atmospheric forcing, and for forecasts shorter than 2.5 d, simulations converged on a solution, and the error was almost constant (Dietrich et al., 2018).
The hydrodynamics of Lake Ontario have been simulated on various scales in previous studies (e.g., Huang et al., 2010; Paturi et al., 2012; Prakash et al., 2007; Shore, 2009). Numerical models have also been used to simulate waves and circulation during extreme events in the Kingston Basin (Cooper and Mulligan, 2016; McCombs et al., 2014a, b). Sogut et al. (2019) used a combination of analyzing historical water level and wave data as well as numerical modelling of extreme storm events to gain insight into lake seiching, storm surges, and wave patterns. Historical data have also been studied to determine the risk of flooding due to a storm surge along the Lake Ontario shoreline with a statistical model (Steinschneider, 2021). Surface waves and storm surges were simulated over the entire lake by Swatridge et al. (2022) during recent storm events. Their study investigated the influence of different wind fields on the accuracy of storm surge simulation, finding that variations in meteorological forcing were the primary source of uncertainty in model results.
In the present study, an existing depth-averaged numerical model of Lake Ontario (Swatridge et al., 2022) was applied to the lake to forecast water levels and waves in real time, driven by spatially varied wind fields from a high-resolution wind forecast model. The workflow develops an open-source Python- and MATLAB-based wrapper code that has been successfully applied to other systems using different hydrodynamic models as part of the Canadian Coastal and Lake Forecasting Model System (Coastlines; https://coastlines.engineering.queensu.ca, last access: 18 July 2024; Lin et al., 2022; Rey and Mulligan, 2021). This flexible methodology uses open-access forcing and validation data and has relatively low computational requirements compared to other existing Great Lakes storm surge models, allowing for application to other locations. Model performance is evaluated by comparing results to near-real-time-observed data. Forecast results for storm surges and waves are statistically investigated over forecast lead times ranging from 6 to 48 h.
2.1 Modelling approach
A two-dimensional (depth-averaged) coupled hydrodynamic–wave model is applied to Lake Ontario to simulate wind-driven hydrodynamics and waves using Delft3D–SWAN. The Delft3D flow model calculates non-steady flow on a structured grid by solving the Reynolds-averaged Navier–Stokes equations (Lesser et al., 2004). Wave conditions are simulated with the phase-averaged wave model, Simulating WAves Nearshore (SWAN), which uses the spectral action balance equation to compute random wind-generated waves. SWAN accounts for non-linear wave interactions, wave propagation, refraction, dissipation due to whitecapping, bottom friction, and depth-induced breaking (Booij et al., 1999). The models are dynamically coupled to account for wave–current interactions. Radiation stress gradients from SWAN simulations are input into the horizontal momentum equations in Delft3D to account for the impacts of waves on circulation, such as wave-induced mass fluxes driving currents, and enhanced bed shear stress. Results from the hydrodynamic simulation are then used to update water levels and circulation in the wave model.
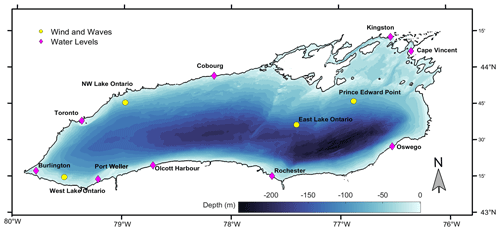
Figure 1Map of Lake Ontario showing NCEI bathymetry and the location of real-time water level, wind, and wave observation stations (Tables 1 and 2).
Model setup choices were made based on simulations by Swatridge et al. (2022), which were adapted for the present study to minimize computational requirements, allowing the system to run in real time. The Delft3D simulation uses a curvilinear grid with a horizontal resolution gradually ranging from 250–450 m. The wave grid has a coarser resolution, ranging from 350–600 m, thus reducing the computational time required to complete a wave simulation while still achieving higher resolution in nearshore areas (Table S2 in the Supplement). Flow simulations are depth-averaged and barotropic, and they are shown by Swatridge et al. (2022) to accurately represent surface storm surges in Lake Ontario, with root mean squared errors (RMSEs) between observations and model results ranging between 0.01–0.07 m during several major events. Bathymetry data were interpolated to the grid from the US National Centers for Environmental Information's (NCEI) 3 arcsec (∼90 m) resolution dataset, with supplementary data from the ETOPO1 global relief model with a resolution of approximately 1.3 km (Fig. 1). Detailed sensitivity testing for this model was completed in Swatridge et al. (2022) to calibrate model parameters. Hydrodynamic simulations use a time step of 120 s to satisfy the Courant–Friedrichs–Lewy stability criterion, and coupling with the stationary wave model occurs every 60 min.
Spatially varied atmospheric input from the Meteorological Service of Canada (MSC) High Resolution Deterministic Prediction System (HRDPS) is used to drive the model (Milbrandt et al., 2016). HRDPS is an hourly assimilated forecast system downscaled from the larger-scale regional deterministic prediction system (RDPS) that provides hourly predictions of surface pressure and wind velocity components with a horizontal resolution of 2.5 km for the pan-Canada domain. The system runs every 6 h, predicting atmospheric conditions 48 h into the future. This wind forcing was successfully used by Swatridge et al. (2022) to simulate the lake surface response to a range of storm conditions. Their modelled results for water levels and surface waves agreed with observations at up to 16 locations in Lake Ontario, resulting in a maximum difference between predicted and observed peak wave heights and water levels of 0.4 and 0.08 m, respectively. No lateral boundary conditions are applied to account for the influence of the riverine flows (Niagara and St. Lawrence rivers), as results from previous modelling studies have concluded that the hydrodynamic influence of river inflows and outflows is limited to within 10 km of the river mouth and therefore can be neglected for simulations of lake-wide water level over event-based timescales (Prakash et al., 2007; McCombs et al., 2014a). The closed-system approach leads to uncertainties in the simulated results in the river region; however, the impacts on the lake-wide hydraulics are expected to be minimal.
2.2 Development of an automated prediction system
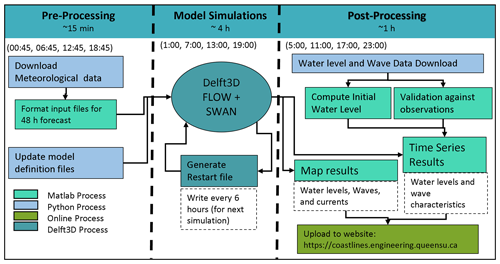
The forecast system uses a combination of code written in MATLAB and Python to automatically run every 6 h and has been operational since May 2021 (https://coastlines.engineering.queensu.ca/lake-ontario/, last access: 18 July 2024). The workflow (Fig. 2) consists of pre-processing, model simulation, and post-processing stages. For pre-processing, initiation of the modelling system is scheduled to occur when a new HRDPS forecast becomes available. Python is used to download the latest forecast, and MATLAB is used to automatically process the atmospheric forcing and write input files for Delft3D–SWAN. The Delft3D model definition files are then updated with the correct time information.
Model simulations cover a period of 48 h and are “hot-started” with a restart file from a previous model run if available. If a restart file is not available, simulations begin from rest with initial water levels of 0 m and current speeds (u) of 0 m s−1 throughout the lake. When the simulation finishes, all available real-time-observed data, outlined in Table S1, are downloaded using Python and are then processed in MATLAB. Observed water levels at each station are averaged over the previous 12 h and used to locally adjust the datum of the model outputs. We acknowledge that assimilating observed water levels into the initial conditions may be a preferred approach, but this is beyond the scope of the present study and may be incorporated into future versions of Coastlines-LO (a real-time forecast model of surface hydrodynamics in Lake Ontario). The model simulates high-frequency variability in water levels generated by winds. Seasonal changes in water levels due to inflows, outflows, and evaporation are not included but are accounted for in post-processing.
Time series plots of observed water levels and wave heights are automatically compared to the forecast model results from the previous 2.5 d at the observation locations, and additional plots are created to provide predictions at other locations of interest with no observed data (Fig. 1). Spatial snapshots of model results across the lake are generated at select times, as well as animations showing key output parameters during the forecast simulation. All outputs are exported to Google Sheets and displayed on the project web page, https://coastlines.engineering.queensu.ca/ (last access: 18 July 2024). The system runs in a Windows environment using 16 cores of a 32-core Xeon workstation, with each workflow cycle taking approximately 5 h to complete a 48 h forecast simulation.
2.3 Real-time comparison between model results and observations
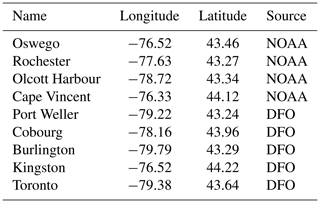
Near-real-time observations of water surface elevation (η) data are available at nine water level gauges around the perimeter of Lake Ontario from the National Oceanic and Atmospheric Administration (NOAA) and the Department of Fisheries and Oceans Canada (DFO), retrieved from https://tidesandcurrents.noaa.gov/water_level_info.html (last access: 27 October 2024) and https://www.tides.gc.ca/en/stations (last access: 27 October 2024), with temporal resolutions of 3 and 6 min, respectively (Fig. 1; Table 1). Hourly surface waves and winds are measured in Lake Ontario at one US National Data Buoy Center (NDBC) buoy and ECCC buoys from spring to early winter, retrieved from https://www.ndbc.noaa.gov/ (last access: 27 October 2024; Table 2). The buoys report the significant wave height (Hs), peak wave period (Tp), and surface wind speed and direction averaged over an 8 min period (U).
For long-term analysis of results, the residual component of the water level data, representing a storm surge, is isolated at the gauge locations by finding the difference between the total water level and the average water level, calculated using a Gaussian window of 7 d (Steinschneider et al., 2021). Model performance is quantified using statistical measures including the RMSE (Eq. 1), the normalized RMSE (NRMSE; Eq. 2), and the correlation coefficient (r; Eq. 3):
where xi and yi (i=1, 2, 3, … N) are time series of modelled and observed data, respectively, and N is the number of samples in the series. Storm surge events are identified from the water level data using the peaks-over-threshold method (Steinschneider et al., 2021). The forecast error during select events was evaluated by computing error metrics for consecutive forecasts leading up to the peak of the event. For each forecast, the relative error (RE; Eq. 4) between an observed and a simulated maximum storm surge relative to the mean water level calculated at water level gauge locations and between observed and modelled maximum wave heights at buoy locations was computed. The RMSE for each location was computed over a 6 h period that included the peak of the event.
Table 3Error statistics for residual water level results over 106 d (15 September–30 December 2022).

Table 4Error statistics for significant wave heights at the buoy locations over 600 d (21 April 2021–12 December 2022).

3.1 Long-term model performance
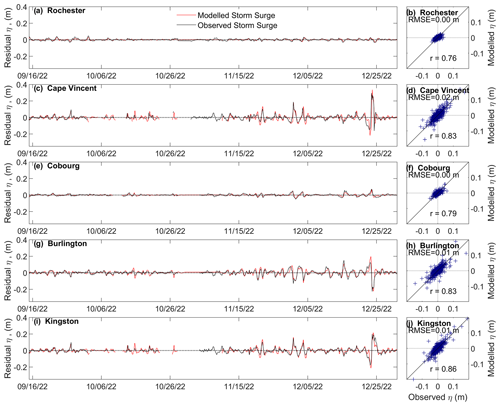
Simulation results for water levels and waves at the observation locations were compiled over the 20-month operational period. The first 6 h of each 48 h forecast was stitched into a single time series, and these results were compared to the observed data (Fig. S1 in the Supplement). During this time, seasonal changes in the observed mean lake level fluctuated by over 1 m, with the highest water levels occurring in May 2022. The ability of the model to reproduce a storm surge was investigated over a 4-month period when multiple storm events occurred (106 d from 15 September to 30 December 2022; Fig. 3). Stations with larger ranges of observed water levels (i.e., Burlington, Cape Vincent), located at the east and west ends of the lake (i.e., Fig. 3c, g), show a slight bias, where the model tended to slightly overpredict the maximum and minimum values, corresponding to larger RMSE values (Table 3). These stations also tended to show a stronger correlation (r=0.83–0.86), whereas observation points with typically smaller ranges in water levels (Fig. 3a, e) resulted in weaker correlations (r=0.76–0.79). Normalized results show comparable error statistics at all stations, with larger errors occurring at locations with smaller storm surges (i.e., Rochester, Oswego).
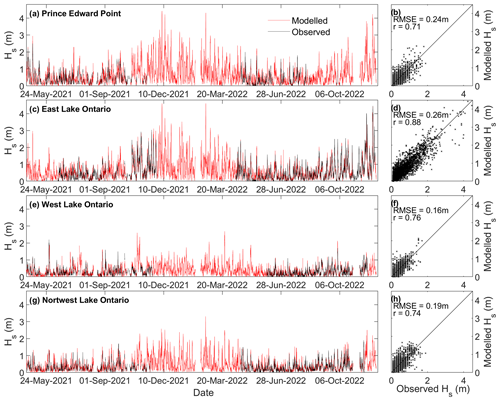
Figure 4Time series of observed (black) and modelled (red) significant wave height over the duration that the buoys were in the lake (September–December 2022), with corresponding error scatter plots at the location of the four buoys. Note that the model was offline and unavailable between 9–27 February 2022 due to a change of service for the meteorological inputs.
Results for simulated Hs at buoy locations show the largest waves occurred during winter, between December and March (Fig. 4). Results showing the forecasted wave period compared to observations are shown in Fig. S2. Over the 600 d operational period, no monitoring data were available for comparison, and Lake Ontario could potentially experience partial ice cover in nearshore areas, impacting the wave environment (Anderson et al., 2018). Stations in the eastern end of the lake (Prince Edward Point, East Lake Ontario) are expected to experience the largest waves due to the prominent northeasterly direction of storms over the lake, which results in winds blowing along the long axis of the lake creating a large fetch at these locations (Lacke et al., 2007; McCombs et al., 2014a). Error statistics show similar values for the RMSE at these points; however, Prince Edward Point had the lowest correlation coefficient (Fig. 4a, b; r=0.71), while East Lake Ontario showed the highest correlation (Fig. 4c, d; r=0.88). The lower RMSEs were at stations with smaller waves (Fig. 4e, g), and normalized results (Table 3) show comparable results at all buoys (NRMSE =0.42–0.53 m).
3.2 Storm event forecasts
The performance of the model was evaluated over an event on 11–12 November 2021, consisting of wind speeds that approached 15 m s−1, with the direction rotating clockwise from blowing towards the northeast to the winds dominantly blowing towards the east over a 24 h period. This event was selected due to the large storm surge generated (η=0.17 m), and it resulted in the largest significant wave height that occurred over the 20-month operational period, with wave measurements available at all buoy locations for comparison. Overlapping 48 h HRDPS forecasts (i.e., generated every 6 h) were validated against buoy observations, with good agreement found between modelled and predicted total wind speeds and directions and with peak wind speeds underrepresented by at most 4.21 m s−1 at Northwest Lake Ontario and overpredicted by up to 2.61 m s−1 at Prince Edward Point (Fig. S3).
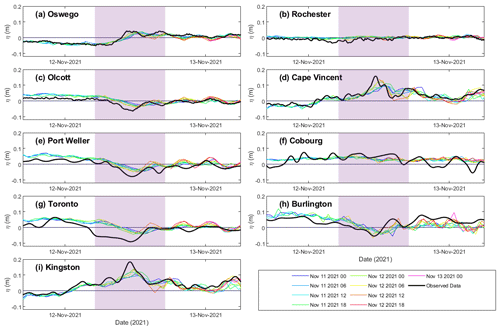
Figure 5Time series of measured water levels at various observation points compared to forecasted data from progressive model simulations. The highlighted area indicates the 12 h period over which error statistics are computed.
This event resulted in an observed storm surge of up to 0.16 m in the northeast region of the lake, at Cape Vincent and Kingston. The forecast simulations captured the timing and magnitude of the event peak, with predicted surge values ranging between 0.12–0.17 m (Fig. 5d, i). A setdown of about 0.10 m was recorded at the Burlington station, which was underpredicted by the model by up to 0.05 m for the initial forecast results, and improves as the forecast lead time decreases, to a prediction of 0.08 m. The simulated results at this location predicted water levels up to 0.05 m higher than the observations for the 24 h preceding the storm (Fig. 5h). A notable error can also be identified at Cobourg (Fig. 5f), with the model predicting negligible fluctuations in the water surface, but observations show some oscillations (0.05 m).
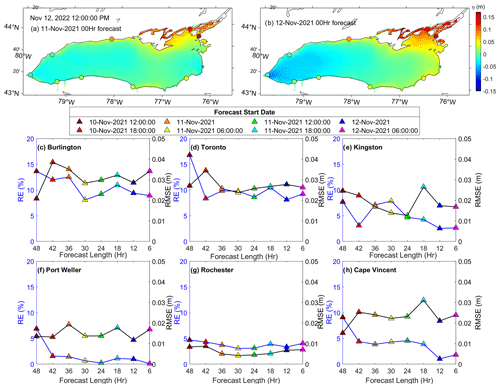
Figure 6Contour plots showing maps of modelled water levels at the peak of the storm event from two different forecasts, with a (a) 35 h lead time starting on 11 November, 00:00 UTC, and a (b) 11 h lead time starting on 12 November, 00:00 UTC, and with observed data plotted at the observation locations in black circles. Panels (c) to (h) show metrics including the RE and RMSE for peak storm surge magnitude at the locations of six selected water level gauges from the eight forecasts preceding the storm event.
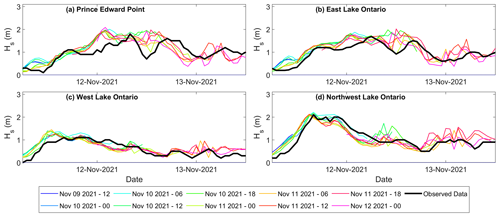
Figure 7Time series of measured Hs at the location of the four buoys compared to modelled data from progressive model forecasts for event 1 (12 November 2021).
Forecast performance was quantified by computing error statistics over the duration of the event for each forecast leading up to the time of peak water level. The largest errors occurred at the location of the setdown, Burlington and Toronto, with a nearly constant RMSE of 0.03 m and RE of 14 % and 10 %, respectively (Fig. 6c, d). The errors at all stations remained fairly constant with RMSE and RE under 0.03 m and 10 %, respectively, for each new forecast. However, map results showing the spatial variability in water level predictions from forecasts 12 and 36 h before the storm peak show large differences (Fig. 6a, b). The earlier results (Fig. 6a) simulated a far less extensive storm surge in the northeast region of the lake than what was subsequently predicted 24 h later (Fig. 6b), when the storm surge was simulated to impact most of the northeast shoreline. The later forecast also predicted a spatially larger setdown – about 0.10 m more than the earlier forecast in the western region of the lake.
Measured waves during this event reached up to 2.10 m, with the buoys in the western region of the lake (Fig. 7c, d) experiencing peak wave heights about 12 h earlier (11 November 2021, 18:00 UTC) than the buoys in the eastern region of the lake (Fig. 7a, b; 12 November 2021, 06:00 UTC). This is explained by the shift in wind direction over the storm duration, with winds originally from the southeast rotating clockwise and then blowing dominantly from the west along the axis of the lake (Fig. S3). Overall, forecast simulations captured the magnitude of the waves at all stations, with some error and an approximately 5 h delay in the timing of the peak Hs at Prince Edward Point (Fig. 7a). The error for waves during this event, at all stations, was constant for consecutive forecasts at all stations, with RMSE between 0.03–0.25 m and RE between 1 %–12 %. Despite the generally consistent results at the buoy locations, maps from different forecasts show distinct changes between the 36 h forecast (Fig. 8a) and the 6 h forecast (Fig. 8b). Simulated wave fields in the northeast region of the lake showed similar results between forecasts, but in the northwest, predicted wave magnitudes and directions were distinctly different. The earlier forecast predicted waves under 0.70 m coming from the southeast, whereas the later forecast showed larger waves (Hs=0.50–1.00 m) from the southwest, which can be attributed to changes in forecasted wind fields.
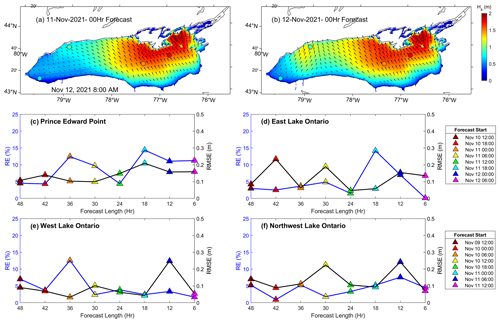
Figure 8Contour maps of modelled waves with vectors indicating wave direction at a select time during the storm event from two forecasts, with a (a) 32 h lead time starting on 11 November, 00:00 UTC, and a (b) 8 h lead time starting on 12 November, 00:00 UTC, and with observed data plotted at the observation locations in black circles. Every 10th vector is plotted for clarity. Panels (c) to (f) show metrics including the RE and RMSE for significant wave height at the locations of four buoys from the eight forecasts preceding the storm event on 12 November 2021, 12:00 UTC, and RMSE values are computed over a 12 h period centred at the time of the peak Hs for each station.
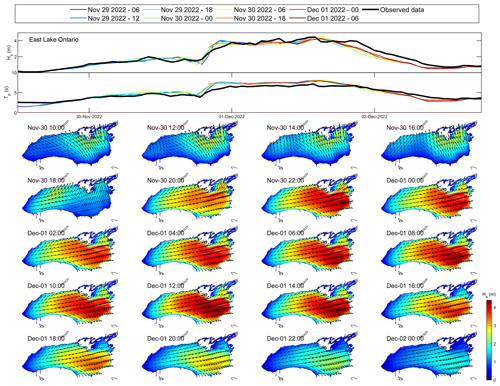
For further investigation into model performance during storm events, wave forecasts during the event that resulted in the largest observed wave heights (1 December 2022, Fig. 3c) were examined. During this storm, the lake experienced sustained easterly winds for almost 24 h, reaching speeds >20 m s−1 on 1 December, 14:00 UTC, and generating waves >4 m (Fig. 9). Data were only available from the one buoy at East Lake Ontario during this event, which recorded a maximum Hs=4.46 m. The forecasts initially underestimated this value, with a maximum predicted wave height of Hs=4.19 m from the forecast starting on 29 November at 18:00 UTC, and the next forecast then overestimated this value (Hs=4.54 m). Subsequent forecasts slightly underestimated the peak value, with the lowest predicted peak Hs=4.26 m and the maximum values occurring ∼1 h after the observed peak. All forecast results tended to overestimate the peak wave period, with predicted values ranging between 7.8–8.1 s, compared to an observed maximum value of 7.2 s.
4.1 Forecast lead times
Water level forecasts during a storm event on 8 December 2021 were examined in relation to forecast lead time. During this event, 21 m s−1 winds (Fig. S4) generated a storm surge of approximately 0.20 m along the northeast coast, as well as a resulting setdown of 0.10 m on the opposite end of the lake. Error statistics throughout the peak of the event, as a function of forecast lead time, were plotted at selected stations (Fig. 10). The timing and magnitude of the storm surge were well represented by the forecast model, with a RMSE <0.05 m for all forecasts and a maximum RE =14 %.
Trends in the error can be identified for this event at all stations, with notable patterns corresponding to locations with larger fluctuations in water level (i.e., Cape Vincent, Kingston, Burlington). At these sites, the forecast error tended to decrease as the forecast length shortened. At Cape Vincent, the initial 48 h forecast had a RMSE of 0.05 m, and by the 18 h forecast, the RMSE had decreased to 0.01 m. However, after the 18 h forecast there was a slight increase in RE from less than 1 % to about 5 % (Fig. 10b). Trends in decreasing error were also observed at Kingston, where a similar decrease in RMSE was observed, and the RE was maintained between 1 %–5 %, corresponding to a maximum underprediction of about 0.05 m (Fig. 10i, j). The locations with smaller ranges in surface fluctuations (Toronto, Port Weller) generally showed a constant error (0.02 m and ∼1 % at Port Weller; 0.01 m and 7 % at Toronto) for consecutive forecast results over the duration of this event (Fig. 10d, f).
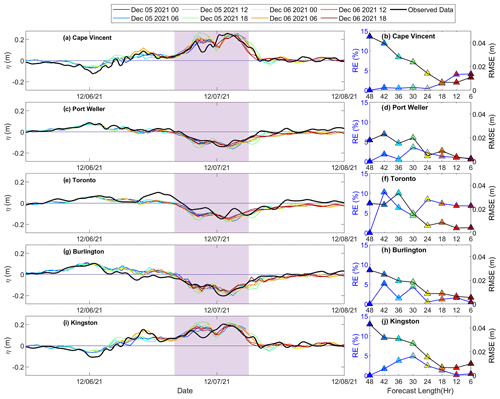
Figure 10Time series of measured water levels at select observation points compared to forecasted data from progressive model simulations for event 3: 8 December 2021, with corresponding plots showing the computed RMSE calculated over the shaded area and the percent error in the peak storm surge from the eight forecasts preceding the storm event.
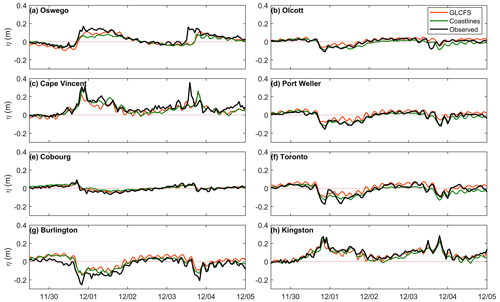
Figure 11Compiled Coastlines-LO forecast results compared to forecasts from the GLCFS and observed data at select water level gauge locations interpolated to a 30 min time resolution for two subsequent events between 30 November–5 December 2022.
Hydrodynamics in the model are only driven by atmospheric forcing, which is a primary source of uncertainty in simulations of surface dynamics in large lakes. The accuracy of meteorological forecasts typically decreases with increasing length due to assimilation schemes using observations and satellite imagery to yield more accurate results (Buehner et al., 2015). Therefore, it is expected that hydrodynamic forecast simulations will increase in accuracy as the lead time to a storm event decreases. For forecasts of storm surges in other Great Lakes (e.g., Lake Erie; Lin et al., 2022) and coastal seas (e.g., Gulf of Mexico; Dietrich et al., 2018), improvements in storm surge predictions are directly linked to increased accuracy in meteorological forcing leading up to an event. However, our Lake Ontario model results do not follow a consistent trend between different events, either improving accuracy (Fig. 10) or maintaining accuracy (Figs. 6, 8). Cases where the error increases (i.e., Fig. 10b) or remains constant (i.e., Fig. 8) can be explained due to sources of uncertainty in the model calibration and neglecting additional hydrodynamic processes in the model setup (i.e., three-dimensional circulation). Despite model accuracy being constant at the observation locations, changes in the spatial variability of predicted water levels and wave conditions for different forecasts are not clearly communicated through time series analysis but are qualitatively shown in maps of results (Figs. 6, 10).
4.2 Comparison with other models
The current work (Coastlines-LO) makes use of a relatively simple, low-computational-requirement modelling approach. The performance of this model can be compared to the GLCFS, which delivers a higher-resolution and more complex forecast system throughout the Great Lakes. Differences between predictions from these models can be explained according to the setup of each system, including different hydrodynamic models, grid resolutions, and atmospheric forcing inputs, which are summarized in Table S3. The GLCFS uses the 2 km horizontal resolution High Resolution Rapid Refresh (HRRR) meteorological forcing, which is comparable to HRDPS (2.5 km); however, previous studies have found that wind and direction predictions can vary between these models (Rey and Mulligan, 2021; Swatridge et al., 2022). The inclusion of waves in the two systems is also accounted for differently, with a separate model (WaveWatch III) used to simulate waves in the GLCFS, while Coastlines-LO uses a dynamically coupled wave and flow model that accounts for wave–current interactions. The inclusion of wave coupling in simulations of the Great Lakes can impact water level predictions (Mao and Xia, 2017). The GLCFS runs on NOAA's high-performance computing system, and the larger computational power allows it to include 3D baroclinic processes while still running in the required time frame, whereas the Coastlines-LO system in the present study uses a 2D, depth-averaged approach and therefore does not resolve vertical gradients in lake temperature or 3D circulation. The inclusion of river inflows and outflows in the GLCFS also allows the model to simulate seasonal changes in the mean lake water level instead of accounting for these changes based on observed data in post-processing.
Forecast results from both models were compared to observed data over a 6 d period in December 2022, during which two storm events occurred (Fig. 11; Table S4). Results from the first 6 h of subsequent forecasts are combined to construct a water level time series at observation points for both models for the entire duration. Both models represent trends in water levels over this, resulting in comparable metrics, with an average RMSE 0.02 m for both models and r=0.73 and 0.74 for Coastlines-LO and GLCFS, respectively. GLCFS achieved better predictions of peak water levels at Oswego for the event on 1 December (RE =30 % for GLCFS, RE =51 % for Coastlines-LO; Fig. 11a) and more accurately represented the surface fluctuations observed over the entire 6 d period at Toronto (Fig. 11f). While GLCFS was able to represent water levels at some locations, Coastlines-LO had higher-accuracy predictions at others (Fig. 11c, d). At Port Weller and Cape Vincent, Coastlines-LO better predicted the peak setdown and setup on December 1 by 0.01 and 0.03 m, respectively, while GLCFS underpredicted at these locations by 0.05 and 0.09 m. Both models had difficulty simulating the second storm surge (3 December) at Oswego and Cape Vincent (Fig. 11a, c), where the observed surge occurs approximately 3 h before the predicted peak. At the Kingston station (Fig. 11h), storm surges of 0.25 and 0.30 m are observed. Coastlines-LO yielded better predictions for the first event, simulating a peak value of 0.24 m, compared to 0.28 m predicted by GLCFS, while GLCFS performed better for the second event, with predicted storm surges of 0.28 and 0.22 m for GLCFS and Coastlines-LO, respectively. Therefore, while the GLCFS offers several advantages, Coastlines-LO provides comparable results for water level prediction with lower computational requirements. This demonstrates that a relatively simple modelling system can be applied to coastal environments to achieve accurate and efficient hydrodynamic predictions. The open-source and flexible wrapper code could therefore be theoretically adapted to include different hydrodynamic models and investigate different field sites as previous works have successfully applied similar approaches for forecast modelling (e.g., Lin et al., 2022; Rey and Mulligan, 2021).
4.3 Limitations and uncertainties
Sensitivity testing and calibration of the numerical model this system is based on come from the work of Swatridge et al. (2022), who found that 3D simulations of Lake Ontario improved predictions of surface behaviour compared to 2D depth-averaged simulations. The 3D simulation allowed the model to account for the transfer of surface momentum into baroclinic motions, giving a better representation of current velocities and surface seiching following a storm event, resulting in a reduced RMSE during storm events by up to 12 % and an improvement in modelled peak storm surge magnitude by up to 0.03 m. While 3D simulations improved accuracy, they also increased the computational runtime of a 24 h simulation from about 2.5 to 4 h. The 10 d forecasts of 3D hydrodynamic processes in Lake Erie have been achieved by Lin et al. (2022) using the AEM3D model with a coastline computational workflow similar to the current work. However, the Lake Erie model uses a coarser 2 km horizontal resolution grid and does not couple with SWAN to predict surface waves, which is computationally expensive compared to hydrodynamic simulations. Therefore, to apply this model in real time with a new simulation every 6 h, 2D simulations are used, potentially resulting in up to 12 % greater uncertainty in the forecast results. Additional investigation of real-time model performance during more storm events, including when the lake is stratified, is recommended for further model validation.
There is additional uncertainty in model results during the winter season, when ice forms in the Great Lakes. Lake Ontario typically experiences some ice cover between December and April (Anderson et al., 2018), which impacts lake processes, including water levels, circulation, and waves through limited air–water momentum transfer (Anderson et al., 2018; Farhadzadeh and Gangai, 2017). While ice cover has been simulated in Lake Ontario using other models (e.g., Oveisy et al., 2012), it is presently not available in Delft3D–SWAN. Therefore, simulations of surface behaviour during the ice-covered months would have limited accuracy in ice-covered areas. Future work could incorporate ice cover into the model by applying dynamic masking of ice-covered surfaces using satellite data to improve results during these months.
While this system requires low computational resources, making it flexible for adaptation to other coastal regions, its capability for forecasting in additional locations is an area that requires future investigation. The applicability of the model is limited by the availability of online data for model forcing and validation. In order to account for seasonal changes in mean lake levels, near-real-time measurements of water levels are needed in the simulation to adjust the datum in post-processing. However, if no data were available, the simulation could include the wind-generated short-term fluctuations in surface levels and real-time operations could continue. The workflow of the model is also limited by the availability of atmospheric forcing data, with any interruptions of service in the HRDPS forecasts causing the hydrodynamic simulations to fail for that run cycle. Improvements in the system could account for this by providing a secondary source of atmospheric forcing in that case. In future studies, we recommend applying this system to a region in the coastal ocean, therefore requiring the development of real-time forecast inputs of open boundary conditions.
A forecast model for wind-driven hydrodynamics was developed and applied to Lake Ontario using an approach with relatively low computational requirements. Wind waves and water levels were simulated using a dynamically coupled Delft3D–SWAN model driven by high-resolution atmospheric forcing. Simulations were able to forecast the wind-driven variability in the lake surface, with seasonal changes in the total water levels accounted for by adjusting the datum for each forecast cycle based on observations of the mean water level. The system provides rapid (∼5 h runtime) predictions that are publicly available through the project web page, with the automated system forecasting a 48 h period every 6 h. The model has been running continuously since April 2021, capturing a variety of storm events with storm surges up to 0.30 m and significant wave heights over 4.00 m. Reliable prediction for wave conditions during winter months is provided by the forecast model when no wave observations are available; however, accuracy is limited where ice is present as this process is not included in the modelling system.
Results show that the model is effective in simulating short-term fluctuations in the water levels and wave conditions during strong storm events, with relative errors between observed and forecasted storm surge magnitudes and significant wave heights of less than 15 %. Larger errors typically corresponded to locations in the lake with larger ranges in observed water levels. For storm events, as the forecast lead time decreases for progressing forecasts, the simulated results changed as a result of updates to the meteorological forcing. No constant trends in the forecast error due to decreasing forecast length were apparent, with forecast accuracy increasing with shorter forecasts in some cases and staying constant at others, but overall results agreed well with observed data for all forecasts leading up to an event, with the RMSE for the storm surge and waves below 0.05 and 0.30 m, respectively. The model compared well with other existing forecast models in the Great Lakes (GLCFS), yielding comparable results for water level predictions during multiple storm events. Due to the low computational requirements and pan-Canadian coverage from the High Resolution Deterministic Prediction System forecasts, this model could be adapted to other Canadian lakes and coastal seas with available bathymetry data for storm surge prediction and monitoring.
Real-time model results can be viewed at https://coastlines.engineering.queensu.ca/lake-ontario/ (Coastlines, 2024), and they are archived on the local server and can be made available by contacting the corresponding author. HRDPS input data are available from the Meteorological Service of Canada Datamart, and observed data are openly accessible online, as cited in the text. The source code and documentation of the open-source numerical model (Delft3D 4.01.01) can be accessed on their online repositories (https://svn.oss.deltares.nl/repos/delft3d/tags/delft3d4/142586/, Deltares, 2024). The Python and MATLAB scripts, supporting files used in the automated workflow, and data and scripts used to generate the plots presented in this paper are archived on Zenodo (https://doi.org/10.5281/zenodo.10407863, Swatridge, 2023).
The supplement related to this article is available online at: https://doi.org/10.5194/gmd-17-7751-2024-supplement.
The concept of the COASTLINES-LO workflow was designed by RPM, LB, SS, and LLS, and LLS implemented the idea. LLS developed and performed the model simulations. All authors contributed to the validation of the model and interpretation of the results. LLS wrote the paper with contributions from LB, SS, and RPM.
The contact author has declared that none of the authors has any competing interests.
Publisher’s note: Copernicus Publications remains neutral with regard to jurisdictional claims made in the text, published maps, institutional affiliations, or any other geographical representation in this paper. While Copernicus Publications makes every effort to include appropriate place names, the final responsibility lies with the authors.
Computational support for this work was provided by Alexander Rey, Shuqi Lin, and FEAS-ITS at Queen's University.
This research has been supported by the Natural Sciences and Engineering Research Council of Canada (grant no. RGPIN/04043-2018) and the Queen's University (Dean's Research Fund).
This paper was edited by Andy Wickert and reviewed by three anonymous referees.
Anderson, E. J., Fujisaki-Manome, A., Kessler, J., Land, G.A., Chu, P.Y., Kelley, J. G. W., Chen, Y., and Wang, J.: Ice Forecasting in the Next-Generation Great Lakes Operational Forecast System (GLOFS), J. Mar. Sci. Eng., 6, 123, https://doi.org/10.3390/jmse6040123, 2018.
Asher, T. G., Luettich, R. A., Fleming, J. G., and Blandton, B. O.: Low frequency water level correction in storm surge models using data assimilation, Ocean Model., 144, 101483, https://doi.org/10.1016/j.ocemod.2019.101483, 2019.
Baracchini, T., Wuest, A., and Bouffard, D.: Meteolakes: An operational online three-dimensional forecasting platform for lake hydrodynamics, Water Res., 172.1-12, 115529, https://doi.org/10.1016/j.watres.2020.115529, 2020.
Bender, M. A., Knutson, T. R., Tuleya, R. E., Sirutis, J. J., Vecchi, G. A., Garner, S. T., and Held, I. M.: Modeled impact of anthropogenic warming on the frequency of intense Atlantic hurricanes, Science, 327, 454–458, https://doi.org/10.1126/science.1180568, 2010.
Bilskie, M. V., Asher, T. G., Miller, P. W., Fleming, J. G., Hagen, S. C., and Luettich Jr., R. A.: Real-time simulated storm surge predictions during Hurricane Michael (2018), Weather Forecast., 37, 1085–1102, https://doi.org/10.1175/WAF-D-21-0132.1, 2022.
Buehner, M., McTaggart-Cowan, R., Beaulne, A., Charette, C., Garand, L., Heilliette, S., Daneshard, V., Hounshell, A. G., Howard, D. W., Lewis, A. S. L., McClure, R. P., Wander, H. L., Ward, N. K., and Thomas, R. Q.: Implementation of Deterministic Weather Forecasting Systems Based on Ensemble-Variational Data-Assimilation at Environment Canada. Part 1: The Global System, Mon. Weather Rev., 143, 2532–2559, https://doi.org/10.1175/MWR-D-14-00354.1, 2015.
Booij, N., Ris, R. C., and Holthuijsen, L. H.: A third-generation wave model for coastal regions: 1.Model Description and validation, J. Geophys. Res.-Oceans, 104, 7649–7666, https://doi.org/10.1029/98JC02622, 1999.
Carey, C. C., Woelmer, W. M., Lofton, M. E., Figueiredo, R. J., Bookout, B. J., Corrigan, R. S., Lapalme, E., Laroche, S., Macpherson, S. R., Morneau, J., and Zadra, A.: Advancing lake and reservoir water quality management with near-term iterative ecological forecasting, Inland Waters, 12, 107–120, https://doi.org/10.1080/20442041.2020.1816421, 2022.
Chisholm, L., Talbot, T., Appleby, W., Tam, B., and Rong, R.: Projected change to air temperature, sea-level rise, and storms for the Gulf of Main region in 2050, Elem Sci Anth. 9, 1–14, https://doi.org/10.1525/elementa.2021.00059, 2021.
Cooper, A. H. and Mulligan, R. P.: Application of a Spectral Wave Model to assess Breakwater Configurations at a small craft harbour on Lake Ontario, J. Mar. Sci. Eng., 2016, 4, 46, https://doi.org/10.3390/jmse4030046, 2016.
Coastlines: Lake Ontario Homepage, https://coastlines.engineering.queensu.ca/lake-ontario/, last access: 11 March 2024.
Danard, M., Munro, A., and Murty, T.: Storm surge hazard in Canada, Nat. Hazards, 28, 407–434, https://doi.org/10.1023/A:1022990310410, 2003.
Deltares: delf3d – Revision 142633, https://svn.oss.deltares.nl/repos/delft3d, last access: 11 March 2024.
Dietrich, J. C., Muhammad, M., Curcic, M., Fathi, A., Dawson, C. N., Chen, S. S., and Luettich Jr., A.: Sensitivity of Storm Surge Prediction to Atmospheric Forcing during Hurricane Isaac, J. Waterw. Port C. Div., 144, 04017035, https://doi.org/10.1061/(ASCE)WW.1943-5460.0000419, 2018.
Elko, N., Dietrich, C., Cialone, M. A., Stockdon, H., Bilksie, M. W., Boyd, B., Charbonneau, B., Cox., D., Desback, K., Elgar, S., Lewis, A., Limber, P., Long, J., Massey, C., Mayo, T., McIntosh, K., Nadal-Caraballo, N.C., Raubenheimer, B., Tomiczek, T., and Wargula, A. E.: Advancing the understanding of storm processes and impacts, Shore & Beach, 87, 37–51, 2019.
Farhadzadeh, A. and Gangai, J.: Numerical Modelling of Coastal Storms for Ice-Free and Ice-Covered Lake Erie, J. Coast. Res., 33, 1383–1396, https://doi.org/10.2112/JCOASTRES-D-16-00101.1, 2017.
FEMA: FEMA Great Lakes Coastal Guidelines, Appendix D.3 Update, FEMA, 2014.
Forbes, C., Luettich, R. A., Mattocks, C. A., and Westerink, J. J.: A retrospective evaluation of the storm surge produced by Hurricane Gustav (2008): Forecast and hindcast results, Weather Forecast., 25, 1577–1602, https://doi.org/10.1175/2010WAF2222416.1, 2010.
Fleming, J. G., Fulcher, C. W., Luettich Jr., R. A., Estade, B. D., Allen, G., and Winer, H. S.: A real time storm surge forecasting system using ADCIRC, Proceedings of the International Conference on Estuarine and Coastal Modeling, Newport, RI, USA, 893–912, https://doi.org/10.1061/40990(324)48, 2008.
Gallagher, G. W., Duncombe, R. K., and Steeves, T. M.: Establishing Climate Change Resilience in the Great Lakes in Response to Flooding, Journal of Science Policy & Governance, 17, https://doi.org/10.38126/JSPG170105, 2020.
Gronewold, A. D. and Rood, R. B.: Recent water level changes across Earth's largest lake system and implications for future variability, J. Great Lakes Res., 45, 1–3, https://doi.org/10.1016/j.jglr.2018.10.012, 2019.
Gronewold, A. D., Fortin, V., Lofgren, B., Clites, A., Stow, C. A., and Quinn, F.: Coasts, water levels, and climate change: A Great Lakes perspective, Clim. Change, 120, 697–711, https://doi.org/10.1007/s10584-013-0840-2, 2013.
Huang, A., Rao, Y. R., Lu, Y., and Zhao, J.: Hydrodynamic modelling of Lake Ontario: An intercomparison of three models, J. Geophys. Res.-Oceans, 115, 1–16, https://doi.org/10.1029/2010JC006269, 2010.
Kelley, J. G. W., Chen, Y., Anderson, E. J., Lang, G. A., and Xu, J.: Upgrade of NOS Lake Erie Operational Forecast System (LEOFS) to FVCOM: Model Development and Hindcast Skill Assessment, NOS CS 40, NOAA, NOAA Technical Memorandum, https://doi.org/10.7289/V5/TM-NOS-CS-40, 2018.
Lacke, M. C., Knox, J. A., Frye, J. D., Stewart, A. E., Durkee, J. D., Fuhrmann, C. M., and Dillingham, S. M.: A climatology of cold-season non convective wind events in the Great Lakes region, J. Climate, 20, 6012–6022, https://doi.org/10.1175/2007JCLI1750.1, 2017.
Lesser, G. R., Roelvink, J. A., and Stelling, G. S.: Development and validation of a three-dimensional morphological model, Coast. Eng., 51, 883–915, https://doi.org/10.1016/j.coastaleng.2004.07.014, 2004.
Lin, S., Boegman, L., Shan, S., and Mulligan, R.: An automatic lake-model application using near-real-time data forcing: development of an operational forecast workflow (COASTLINES) for Lake Erie, Geosci. Model Dev., 15, 1331–1353, https://doi.org/10.5194/gmd-15-1331-2022, 2022.
Mao, M. and Xia, M.: Dynamics of wave-current-surge interactions in Lake Michigan: A model comparison, Ocean Model. 110, 1–20, https://doi.org/10.1016/j.ocemod.2016.12.007, 2007.
McCombs, M. P., Mulligan, R. P., Boegman, L., and Rao, Y. R.: Modelling surface waves and wind-driven circulation in eastern Lake Ontario during winter storms, J. Great Lakes Res., 40, 130–142, https://doi.org/10.1016/j.jglr.2014.02.009, 2014a.
McCombs, M. P., Mulligan, R. P., and Boegman, L.: Offshore wind farm impacts on surface waves and circulation in Eastern Lake Ontario, Coast. Eng., 93, 32–39, https://doi.org/10.1016/j.coastaleng.2014.08.001, 2014b.
Milbrandt, J. A., Belair, S., Faucher, M., Vallee, M., Carrera, M. L., and Glazer, A.: The Pan-Canadian High Resolution (2.5 km) Deterministic Prediction System, Weather Forecast., 31, 1791–1816, https://doi.org/10.1175/WAF-D-16-0035.1, 2016.
Oveisy, A., Boegman, L., and Imberger, J.: Three-dimensional simulation of lake and ice dynamics during winter, Limnol. Oceanogr., 57, 43–57, https://https://doi.org/10.4319/lo.2012.57.1.0043, 2012.
Paramygin, V. A., Sheng, Y. P., and Davis, J. R.: Towards the development of an operational forecast system for the Florida coast, J. Mar. Sci. Eng., 5, 8, https://doi.org/10.3390/jmse5010008, 2017.
Paturi, S., Boegman, L., and Rao, Y.R.: Hydrodynamics of eastern Lake Ontario and the upper St. Lawrence River, J. Great Lakes Res., 38, 194–204, https://doi.org/10.1016/j.jglr.2011.09.008, 2012.
Peng, M., Zhang, A., Anderson, E. J., Lang, G. A., Kelley, J. G. W., and Chen, Y.: Implementation of the Lakes Michigan and Huron Operational Forecast System (LMHOFS) and the Nowcast/Forecast Skill Assessment, NOAA technical report NOS CO-OPS, https://doi.org/10.25923/cy7n-ja86, 2019.
Prakash, S., Atkinson, J. F., and Green, M. L.: A semi-Lagrangian study of circulation in Lake Ontario, J. Great Lakes Res., 33, 774–790, https://doi.org/10.3394/0380-1330(2007)33[774:ASSOCA]2.0.CO;2, 2007.
Rey, A. J. M. and Mulligan, R. P.: Influence of hurricane wind field variability on real-time forecast simulations of the coastal environment, J. Geophys. Res.-Oceans, 126, 1–20, https://doi.org/10.1029/2020JC016489, 2021.
Shore, J. A.: Modelling the circulation and exchange of the Kingston Basin and Lake Ontario with FVCOM, Ocean Model., 30, 106–114, https://doi.org/10.1016/j.ocemod.2009.06.007, 2009.
Sogut, D. V., Jensen, R. E., and Farhadzadeh, A.: Characterizing Lake Ontario Marine Renewable Energy Resources, Mar. Technol. Soc. J., 53, 21–38, https://doi.org/10.4031/MTSJ.53.2.3, 2019.
Steinschneider, S.: A hierarchical Bayesian model of storm surge and total water levels across the Great Lakes shoreline – Lake Ontario, J. Great Lakes Res. 47, 829–843, https://doi.org/10.1016/j.jglr.2021.03.007, 2021.
Studholme, J., Fedorov, A. V., Gulev, S. K., Emanuel, K., and Hodges, K.: Poleward expansion of tropical cyclone latitudes in warming climates, Nat. Geosci., 15, 14–18, https://doi.org/10.1038/s41561-021-00859-1, 2022.
Swatridge, L.: Coastlines-LO, Zenodo [data set], https://doi.org/10.5281/zenodo.10407863, 2023.
Swatridge, L. L., Mulligan, R. P., Boegman, L., Shan, S., and Valipour, R.: Coupled modelling of storm surge, circulation, and surface waves in a large, stratified lake, J. Great Lakes Res., 48, 1520–1535, https://doi.org/10.1016/j.jglr.2022.08.023, 2022.


