the Creative Commons Attribution 4.0 License.
the Creative Commons Attribution 4.0 License.
 | 22 Aug 2024
Quantifying the role of ozone-caused damage to vegetation in the Earth system: a new parameterization scheme for photosynthetic and stomatal responses
Zhimin Zhou
Samuel Levis
Stephen Sitch
Felicity Hayes
Zhaozhong Feng
Peter B. Reich
Zhiyi Zhao
Yanqing Zhou
Surface ozone (O3) is the primary air pollutant threatening global vegetation. It typically reduces the photosynthetic rate and stomatal conductance, leading to changes in carbon, water, and energy cycles; vegetation structure and composition; and climate. Several parameterization schemes have been developed to integrate the photosynthetic and stomatal responses to O3 exposure in regional and global process-based models to simulate time- and space-varying O3 plant damage and its cascading dynamic influence. However, these schemes are calibrated based on limited observations and often fail to reproduce the response relationships in observations, impeding accurate assessments of the role of O3 plant damage in the Earth system. This study proposes a new parameterization scheme to utilize the extensive observations from O3 fumigation experiments to inform large-scale modeling. It is built on 4210 paired data points of photosynthetic and stomatal responses compiled from the peer-reviewed literature, more than 6 times larger than those employed in earlier schemes. Functions of phytotoxic O3 dose (POD) are found to accurately reproduce the statistically significant linear or nonlinear relationships observed between POD and either relative leaf photosynthetic rate or relative stomatal conductance for needleleaf trees, broadleaf trees, shrubs, grasses, and crops. These eliminate the practice in earlier schemes of setting response functions as constants and applying the response function from one vegetation type to another. It outperforms the old scheme in the Community Land Model (CLM), which skillfully reproduces the observed response for crop photosynthetic rate only. The nonlinear response functions we developed depict decreasing plant sensitivity with increases in POD, enabling models to implicitly capture the variability in plant ozone tolerance and the shift among plant species for both intra- and inter-PFTs (plant functional types) within a vegetation type observed in the real world. Then, the new scheme is incorporated into the Community Earth System Model version 2.2 (CESM2.2), specifically its land component CLM5, to quantify the global impacts of present-day O3 plant damage by comparing the simulations with and without O3 plant damage. Results show that O3 exposure reduces the global leaf photosynthetic rate by 8.5 % and stomatal conductance by 7.4 %, around half the estimates using the old scheme. Furthermore, the new scheme improves global gross primary productivity (GPP) simulations, decreasing RMSE by 11.1 % relative to simulations without O3 plant damage and by 11.7 % compared to the old scheme. These results underscore the importance of including O3 plant damage in large-scale process-based models and the effectiveness of the new scheme in assessing and projecting globally the role of O3 plant damage in the Earth system.
- Article
(7861 KB) - Full-text XML
-
Supplement
(1031 KB) - BibTeX
- EndNote


Surface ozone (O3) is a major air pollutant damaging natural and managed ecosystems worldwide (Reich, 1987; Ainsworth et al., 2012; Gribacheva and Gecheva, 2019; Feng et al., 2021). It is mainly formed through complex photochemical reactions among nitrogen oxides (NOx), volatile organic compounds (VOCs), methane (CH4), and carbon monoxide (CO) (Chameides et al., 1988; Ainsworth et al., 2012). The rapid pace of industrialization and urbanization has led to increased emissions of these precursors and climate warming, both contributing to a dramatic surge in global O3 levels, with an increase of 32 %–71 % since 1850 (Griffiths et al., 2021; Szopa et al., 2021; Tarasick et al., 2019). If climate mitigation and pollutant control efforts remain weak, this alarming upward trend is projected to persist (Turnock et al., 2020; Griffiths et al., 2021).
Over the past decades, extensive O3 fumigation experiments have been conducted across various plant species to quantify the harmful effects of ozone on plant physiological processes and to understand the underlying mechanisms (CLRTAP, 2017). They found that O3 generally reduces leaf photosynthetic rate, which occurs mainly by decreasing the RuBisCO enzyme content and activity and chlorophyll content in the chloroplast, altering chloroplast structure, impairing the electron transport chain, and decreasing both mesophyll conductance and stomatal conductance (Lombardozzi et al., 2013; CLRTAP, 2017; Zhou et al., 2017; Xu et al., 2023). The O3-induced decrease in stomatal conductance is primarily due to abscisic acid-triggered Ca2+ entry into the guard cells (Pei et al., 2000; Wilkinson and Davies, 2010); inhibition of K+ channels (Tran et al., 2013); disruption of signal transduction pathways (Wilkinson and Davies, 2010; Astier et al., 2017; Hasan et al., 2021); an increase in internal leaf CO2 (Herbinger et al., 2007); and, over the long term, damage to the stomatal apparatus (Kangasjärvi et al., 2005; Reich, 1987). The changes in leaf photosynthetic rate and stomatal conductance have cascading biological, physical, and chemical effects on the carbon, water, and energy fluxes of terrestrial ecosystems (Sitch et al., 2007; Lombardozzi et al., 2015; Unger et al., 2020; Ma et al., 2023). These effects can further slow plant growth, alter vegetation structure and composition, and reduce crop yield and timber production (Mills et al., 2013; Fuhrer et al., 2016; Tai et al., 2014, 2021; CLRTAP, 2017; Agathokleous et al., 2020; Sharps et al., 2021; Feng et al., 2022), as well as modifying surface climate and atmospheric composition (Ainsworth et al., 2012; Sadiq et al., 2017; Arnold et al., 2018; Zhu et al., 2022).
Three major parameterization schemes (Felzer et al., 2004; Sitch et al., 2007; Lombardozzi et al., 2015) have been proposed and used in process-based models for regional and global simulations of time- and space-varying O3 plant damage. These process-based models can be land surface models, dynamic global vegetation models (DGVMs), global gridded crop models (GGCMs), and Earth system models (ESMs) (Tian et al., 2010; Clark et al., 2011; Lombardozzi et al., 2013; Val Martin et al., 2014; Emberson et al., 2018; Lawrence et al., 2019). To ensure inter-process harmonization and dynamic modeling of the downstream impacts resulting from the damage, these schemes consider O3 effects on photosynthetic rate and stomatal conductance. This is different from integrated assessment models (IAMs) (CLRTAP, 2017) that jump to estimate the influence of O3 on crop yield and timber production directly and bypass O3 impacts on all processes before harvest. In these schemes, the global photosynthetic and stomatal responses are categorized by several vegetation types (needleleaf trees, broadleaf trees, grasses, shrubs, and crops) operating within a unified framework yet differentiated by parameters. The parameters are obtained from synthetic analysis of observations to ensure robustness and representativeness, aligning with utilizing big data to inform big ecology concepts in microsystems research (Reichman et al., 2011; Soranno and Schimel, 2014) and the construction principles of large-scale process-based modeling (Bonan, 2019).
Felzer et al. (2004) developed a parameterization scheme based on the O3 response relationships established by Reich (1987) for needleleaf trees and crops and Ollinger et al. (1997, 2002) for broadleaf trees and applied it to the Terrestrial Ecosystem Model (TEM). In this scheme, the photosynthetic response for the current month was a function of the product of stomatal conductance and AOT40 (accumulated ozone exposure in ppb h over an hourly concentration threshold of 40 ppb in daylight hours). To address the persistent damage resulting from past ozone exposure during the lifespan of a leaf, Felzer et al. (2004) compounded the current month's ozone effect with that of the previous month. This scheme was later incorporated into the Dynamic Land Ecosystem Model (DLEM), with adjustments made to the time step shifting from a monthly to a daily resolution (Ren et al., 2007; Tian et al., 2010). However, it should be noted that the product of stomatal conductance and AOT40 lacks quantitative physical interpretation and fails to account for the impact of chronic ozone exposure at O3 concentrations below 40 ppb.
PODY (phytotoxic O3 dose over a flux threshold of Y nmol O3 m−2 s−1) has become increasingly used in observational studies due to its clear biophysical interpretation (the cumulative stomatal uptake of ozone), comprehensive consideration of stomatal conductance, ozone concentration, and ozone exposure duration, as well as generally stronger correlation with ozone effects than AOT40 (Karlsson et al., 2004; Pleijel et al., 2004, 2022). Correspondingly, Sitch et al. (2007, hereafter S07) proposed a scheme in which upper and lower thresholds of photosynthetic response to O3 were a function of instantaneous ozone flux, and the photosynthetic response parameters were derived using an inverse method to fit the observed relationship of PODY with crop yield (Pleijel et al., 2004) and needleleaf and broadleaf tree biomass (Karlsson et al., 2004). The scheme was developed in the land surface model MOSES-TRIFFID (Met Office Surface Exchange Scheme Top-down Representation of Interactive Foliage and Flora Including Dynamics) (Sitch et al., 2007) and subsequently used in JULES (Joint UK Land Environment Simulator, successor of MOSES-TRIFFID) (Clark et al., 2011; Oliver et al., 2018) and the DGVM YIBs (Yale Interactive terrestrial Biosphere model) (Yue and Unger, 2015; developed based on TRIFFID and CASA). However, S07 has several limitations. First, due to a lack of observational data collection and analyses, S07 applied crop and broadleaf tree response functions to grasses and shrubs, respectively. Second, the photosynthetic response parameters derived through the inverse method based on an observed relationship of PODY with yield or biomass rather than with photosynthesis directly are likely biased, influenced by uncertainties in simulating the processes (e.g., respiration, allocation, and phenology) and environmental variables such as soil moisture between photosynthesis and harvest. Third, because the estimated parameters are model-dependent, applying them directly to non-TRIFFID models may reduce the accuracy of O3 damage simulations. Fourth, unlike other processes that are optimally represented, S07 focuses on the threshold modeling (i.e., the upper and lower response thresholds to O3). Lastly, S07 assumed the response function to be the same for photosynthetic rate and stomatal conductance, contradicting the increasing observations that chronic ozone exposure decouples stomatal conductance and photosynthetic rate (Tjoekler et al., 1995; Wittig et al., 2007; Lombardozzi et al., 2012; Kinose et al., 2020).
To address these limitations, Lombardozzi et al. (2013, 2015) developed a scheme (hereafter L15) that adopted different functions of PODY for photosynthetic and stomatal response, based on 652 paired data points of PODY and relative photosynthetic rate and stomatal conductance compiled from the peer-reviewed literature. The scheme was implemented in the land surface model CLM5 (Community Land Model version 5), the land component of the Community Earth system model version 2.2 (CESM2.2) (Lawrence et al., 2019). However, since the response function was assumed to be linear, L15 found a skillful (regression statistically significant at the 0.05 level) response function for only crop photosynthetic rate and temperate evergreen tree stomatal conductance. For other vegetation types, a constant (intercept of the linear regression) was employed (see Appendix), resulting in a fixed simulated ozone effect regardless of PODY change. Furthermore, similar to S07, L15 applied the response functions of trees and crops to shrubs and grasses due to no observations collected and no significant linear fitting found, respectively.
In this study, we propose a novel parameterization scheme, in which the photosynthetic and stomatal response functions are built upon 4210 paired data points collected from experimental measurements reported in the peer-reviewed literature. The sample size is more than 6 times that of L15 and 23 times that of S07. Furthermore, we remove the linear assumption employed in prior schemes and identify two-parameter linear or nonlinear functions of PODY to capture the statistically significant response relationship in observations for broadleaf trees, needleleaf trees, shrubs, grasses, and crops. We then apply this scheme to CESM2.2's land component CLM5 to quantify the global impact of present-day ozone exposure on the total, spatial distribution, and seasonality of leaf photosynthetic rate and stomatal conductance. In addition, given the close relationship of gross primary productivity (GPP) of terrestrial ecosystems with leaf photosynthesis and stomatal conductance and the availability of global GPP benchmark data, we evaluate global GPP simulations with and without ozone stress and with different parameterization schemes.
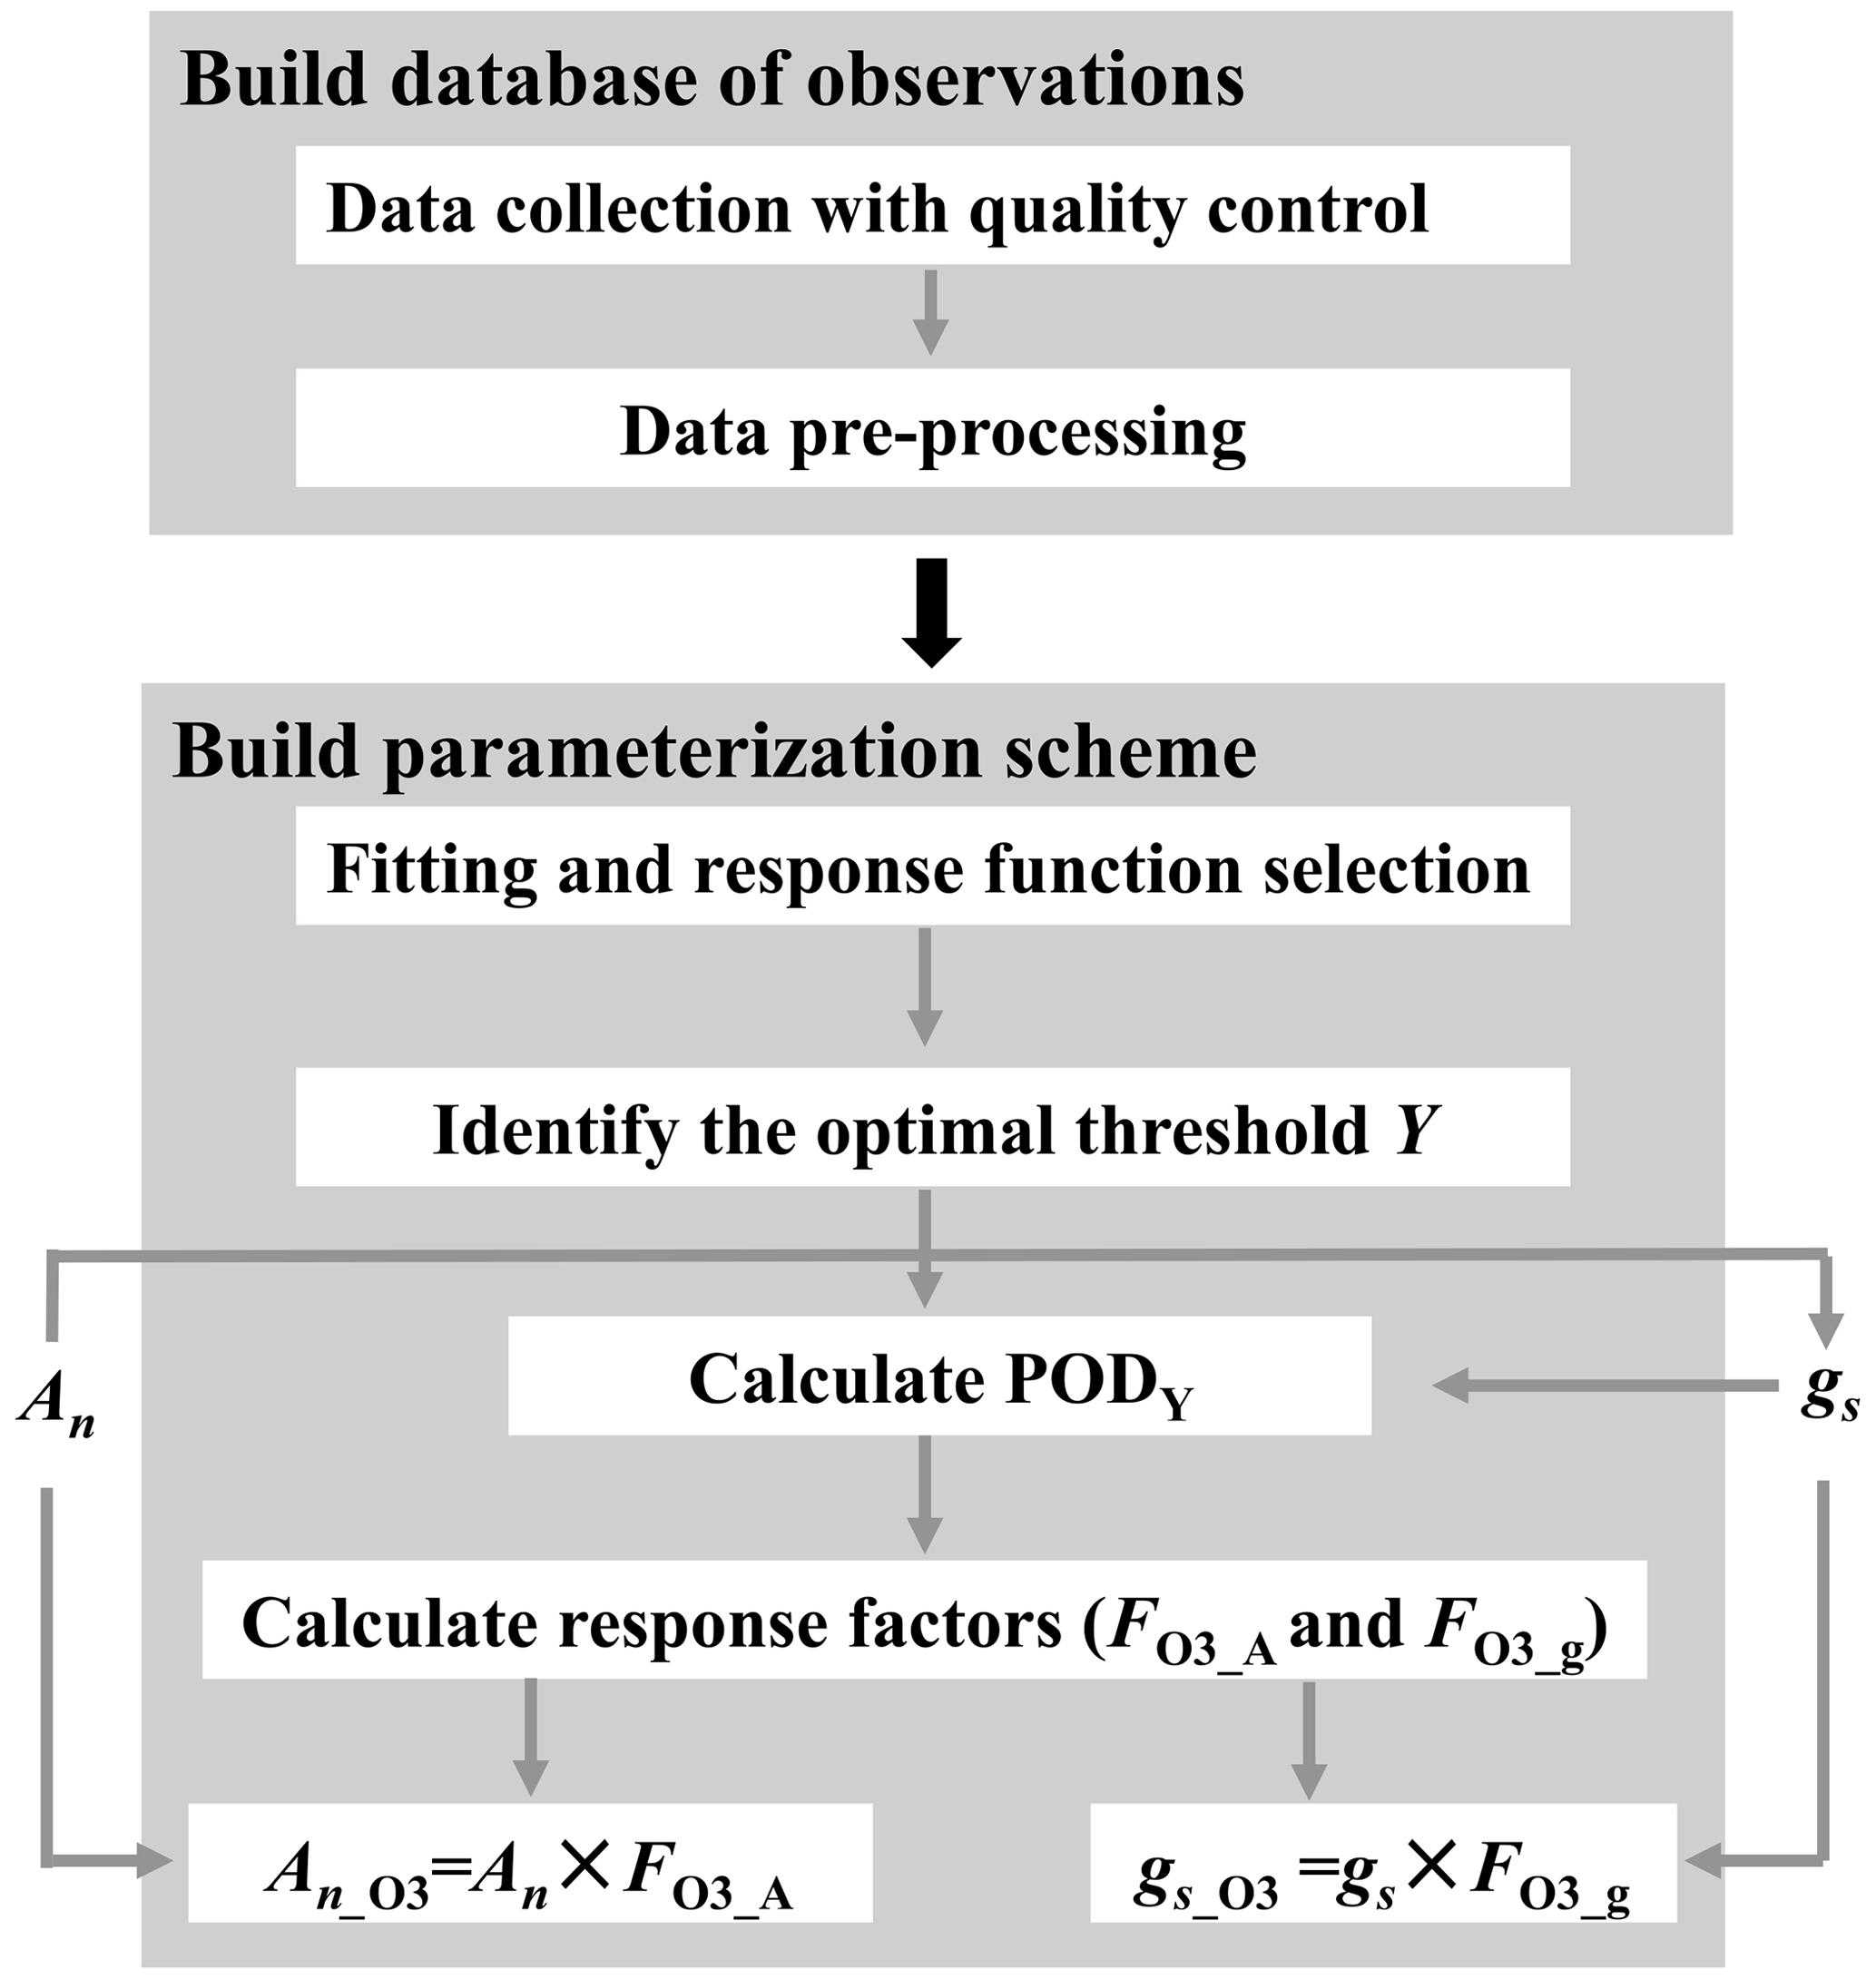
Figure 1Flowchart illustrating the construction of O3 plant damage parameterization scheme. PODY (phytotoxic ozone dose over an ozone flux threshold of Y) represents the cumulative leaf stomatal uptake of O3; An and gs are net photosynthetic rate and stomatal conductance without ozone plant damage, respectively, while An_O3 and gs_O3 are those modified by O3 plant damage; and FO3_A and FO3_g are photosynthetic and stomatal response factors, respectively.
The parameterization scheme construction involves two steps (Fig. 1). First, we establish a database via data collection with quality control and preprocessing. Second, using the preprocessed data, we construct the parameterization scheme through regression analysis, response function selection, identification of the optimal threshold Y, and incorporation of photosynthetic and stomatal response functions into regional and global process-based models. After the scheme construction, we apply it to the CESM2.2's land component CLM5 for quantifying the global impact of O3 plant damage.
2.1 Construction of observational database
2.1.1 Data collection with quality control
A database of O3 effects on leaf photosynthetic rate and stomatal conductance is compiled by conducting a survey of the peer-reviewed literature using keyword searches in the Web of Science, Springer Nature, and China National Knowledge Infrastructure. A total of 298 articles published from January 1970 to December 2022 have been identified to report experimental measurements on the O3 effect. Measurements within an article are considered independent data points if they were made for different species, for distinct genotypes within a species, for different ozone treatments, or on different dates, consistent with the approach taken by Wittig et al. (2007) and Lombardozzi et al. (2013). Otherwise, they are treated as a sample of one data point, and the sample mean is used as a data point for analysis.
Table 1Overview of experimental data collected from the peer-reviewed literature about O3 effects on photosynthetic rate and stomatal conductance. The numbers in parentheses are the number of articles, species, and data points within each category. BT and NT represent broadleaf trees and needleleaf trees, respectively.
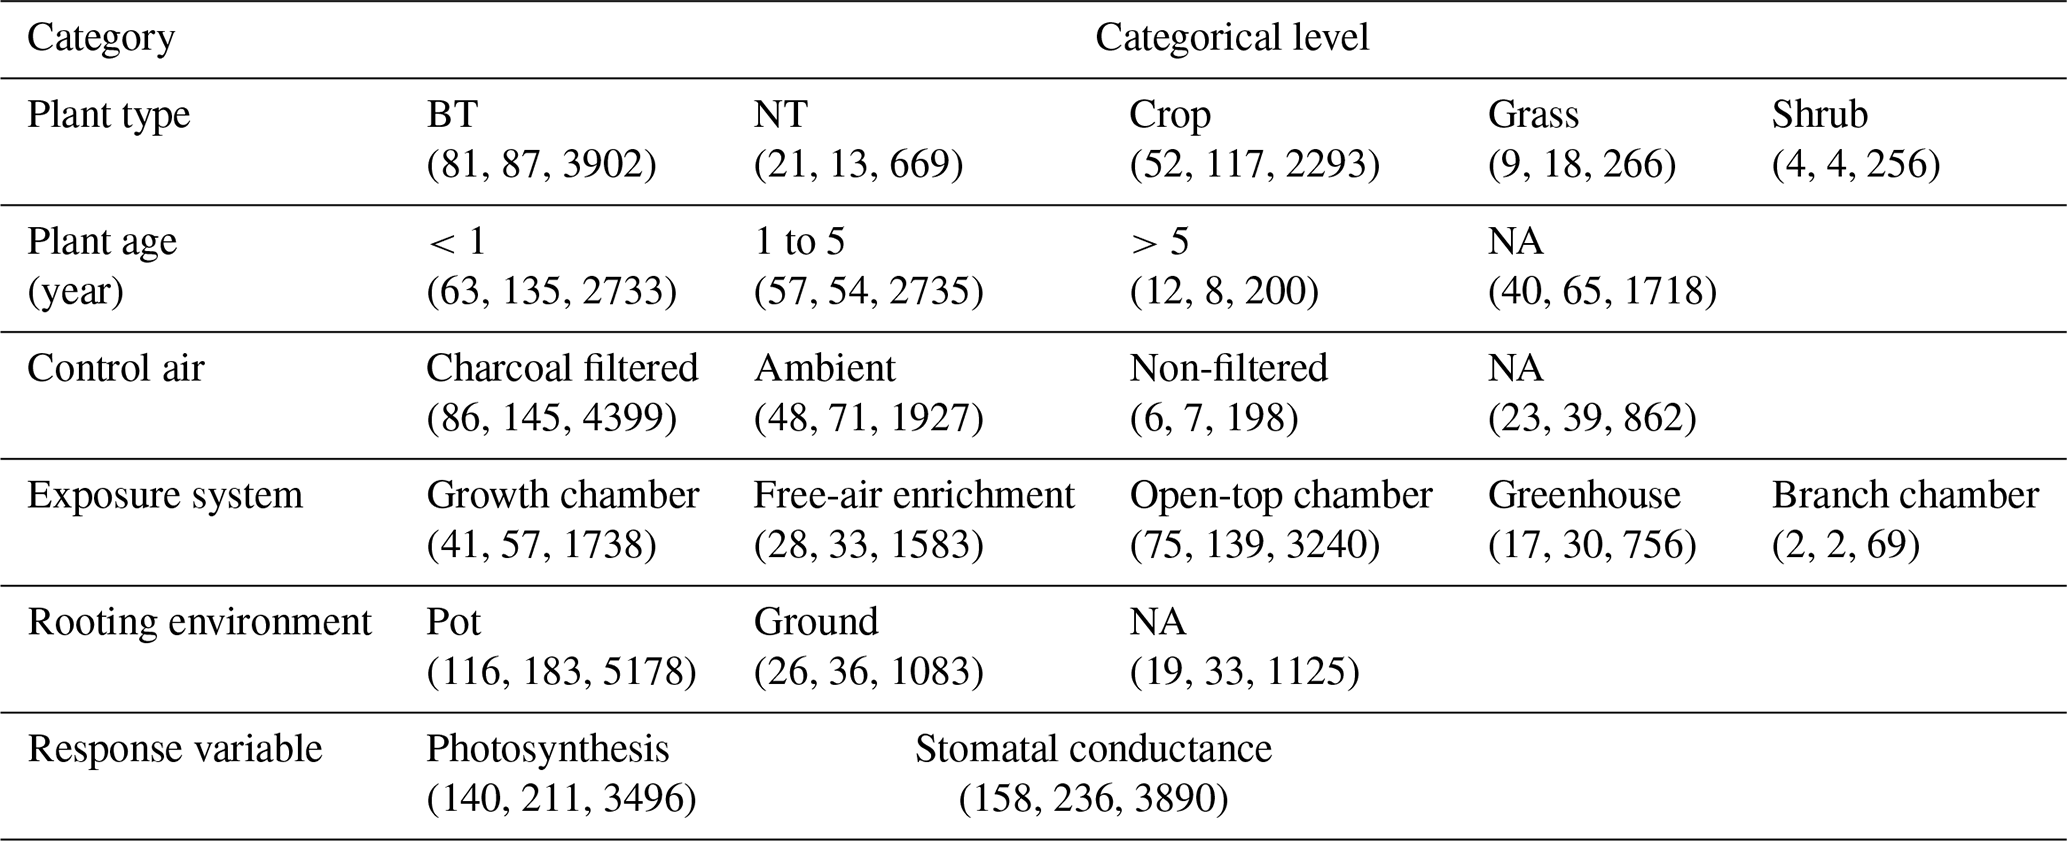
NA: not available
Data quality control is then carried out. Data points are excluded (1) if PODY or variables for calculating PODY (see Eq. 1) cannot be extracted; i.e., only data categorized as high and medium confidence defined by Lombardozzi et al. (2013) are considered in our study. In Lombardozzi et al. (2013), data were assigned high confidence if POD was presented, medium confidence if the publication contained multiple stomatal conductance measurements throughout the course of the experiment and enough other information to calculate POD, and low confidence otherwise. They are also excluded (2) if either photosynthetic rate or stomatal conductance, including their units, cannot be extracted or are unreasonable (incorrect units or numerical deviation exceeds an order of magnitude); (3) if the data are previously or more completely reported in another article; (4) if the photosynthetic rate is not reported in conjunction with stomatal conductance; (5) if other environmental interactions are included so that the effect of only O3 is unclear; or (6) if experiments are conducted for less than 7 d and thus not representative of chronic exposure. Following these criteria, data are collected from a total of 159 articles (see Supplement), representing 238 species and providing 3496 data points for photosynthetic rate and 3890 data points for stomatal conductance (Table 1).
Stomatal conductance and photosynthetic rate or their relative values to those without ozone stress, as well as PODY or variables to calculate it in the control and elevated O3 treatments, are collected from tables, figures, and text in the articles and compiled into a database. In cases where data are presented graphically, PlotDigitizer v3 is employed for data extraction. When PODY needs to be calculated but the light exposure of field experiments is not reported, sunlight duration is obtained from the website https://richurimo.bmcx.com/9.61__jw__45.69__time__2013_09__richurimo/ (last access: 30 May 2023) by entering the longitude, latitude, and date of the experiments. Additional information such as location, vegetation type, plant species, plant age, type of control air, O3 exposure system conditions, rooting environment, sample size, sample standard deviation (SD) or standard error (SE), and reference is also recorded for each data point and summarized in Table 1.
2.1.2 Data preprocessing
For the literature that does not provide PODY (mmol O3 m−2), we calculate it for various candidates of O3 flux threshold Y (nmol O3 m−2 s−1) using data from the literature on O3 concentration at the leaf surface ([O3]ls, ppb), leaf stomatal conductance (gs, mol H2O m−2 s−1), and the number of hours of plant exposure to O3 and light (h, hour), as
where kO3=1.51 () (mol H2O (mol O3)−1) is the ratio of leaf resistance for O3 to that for water vapor. Equation (1) combines Eqs. (1) and (2) used in Lombardozzi et al. (2013) for preprocessing observations but with three modifications: Y is not arbitrarily set to zero, a typo is corrected in that kO3 was incorrectly multiplied in Eq. (2) when it should have been divided, kO3 value is updated based on Massman et al. (1998) and CLRTAP (2017) instead of 1.67 used in Lombardozzi et al. (2013). The Y candidates considered in this study cover all the values used in earlier studies, including 0.5, 0.8, 1, 1.6, 2, 3, 4, 5, and 6. Specifically, L15 used 0.8 for all plant types; S07 assigned 1.6 to needleleaf and broadleaf trees and shrubs and 5 to crops and grasses; and CLRTAP et al. (2017) applied 1 for natural plants and 6 for crops, followed by Oliver et al. (2018) and Ma et al. (2023).
To achieve comparability of the O3 effect across different experiments, species, control air types, and dates within a given vegetation type, we need to calculate the relative photosynthetic rate and relative stomatal conductance to the values without ozone stress if the literature does not report them. Similar to Karlsson et al. (2004), Pleijel et al. (2004), and Hayes et al. (2021), for pairs of control and O3-elevated experimental measurements that differ solely in ozone concentration, we begin by performing a simple linear regression using photosynthetic rate or stomatal conductance as the dependent variable and PODY as the independent variable. The regression enables us to obtain the intercept representing the photosynthetic rate or stomatal conductance at PODY=0. Next, we derive the relative values through dividing the photosynthetic rate or stomatal conductance by the intercept. Then, we conduct linear regression using the relative values and corresponding PODY for individual plant species in a study, and data with intercepts falling outside the range of 0.9 to 1.1 are removed based on Hayes et al. (2021) and the CLRTAP convention to ensure a usable response relationship. Finally, we exclude the paired data points at PODY=0. For the literature that reports the relative photosynthetic rate or relative stomatal conductance in units of percentage, we convert it to a unitless fraction via dividing it by 100.
Through the above data preprocessing, we obtain the paired data points of PODY and relative photosynthetic rate (or relative stomatal conductance), including 567–943 (or 486–1281) for broadleaf trees, 2–217 (or 3–232) for needleleaf trees, 0–153 (or 0–149) for shrubs, 20–40 (or 42–78) for grasses, and 380–605 (or 418–691) for crops (Tables S1–S2). For a specific vegetation category, the values represent the ranges of the number of paired data points across different ozone flux thresholds Y. A higher threshold Y often results in more PODY values equaling zero (Eq. 1), so more paired data points at PODY=0 are excluded during preprocessing to ensure a usable response relationship (refer to the last preprocessing step). The number of paired data points clearly varies with the threshold Y for a specific vegetation type.
2.2 Construction of the parameterization scheme
2.2.1 Regression analysis and selection of response function
We use two-parameter linear () and nonlinear (y=f(x)) regression functions to fit the preprocessed data, where y is the relative photosynthetic rate or relative stomatal conductance, x is PODY, and f denotes a nonlinear function. For nonlinear regression, we consider five commonly used linearizable function forms: (i) logarithm function , (ii) power function y=bxa, (iii) exponential function y=beax, (iv) hyperbolic tangent function , and (v) reciprocal function . When parameter a<0, the first four nonlinear functions and the linear function all imply a decrease in y as x increases. We use the least-squares principle to estimate the regression coefficients and F test to test the statistical significance of regression (Huang, 2016).
For each vegetation type and each ozone flux threshold Y, the sample is the same, so we compare the residual sum of squares (RSS), which is the sum of the squared distances between observed versus predicted values, across different function forms. The function with the lowest RSS is identified as the optimal function.
As shown in Fig. 2, the linear function is typically optimal for needleleaf tree and grass photosynthetic response as well as crop stomatal response. The exponential function is often optimal for broadleaf tree and crop photosynthetic response, while the logarithm function is often optimal for broadleaf tree stomatal response and for grass when Y is small.
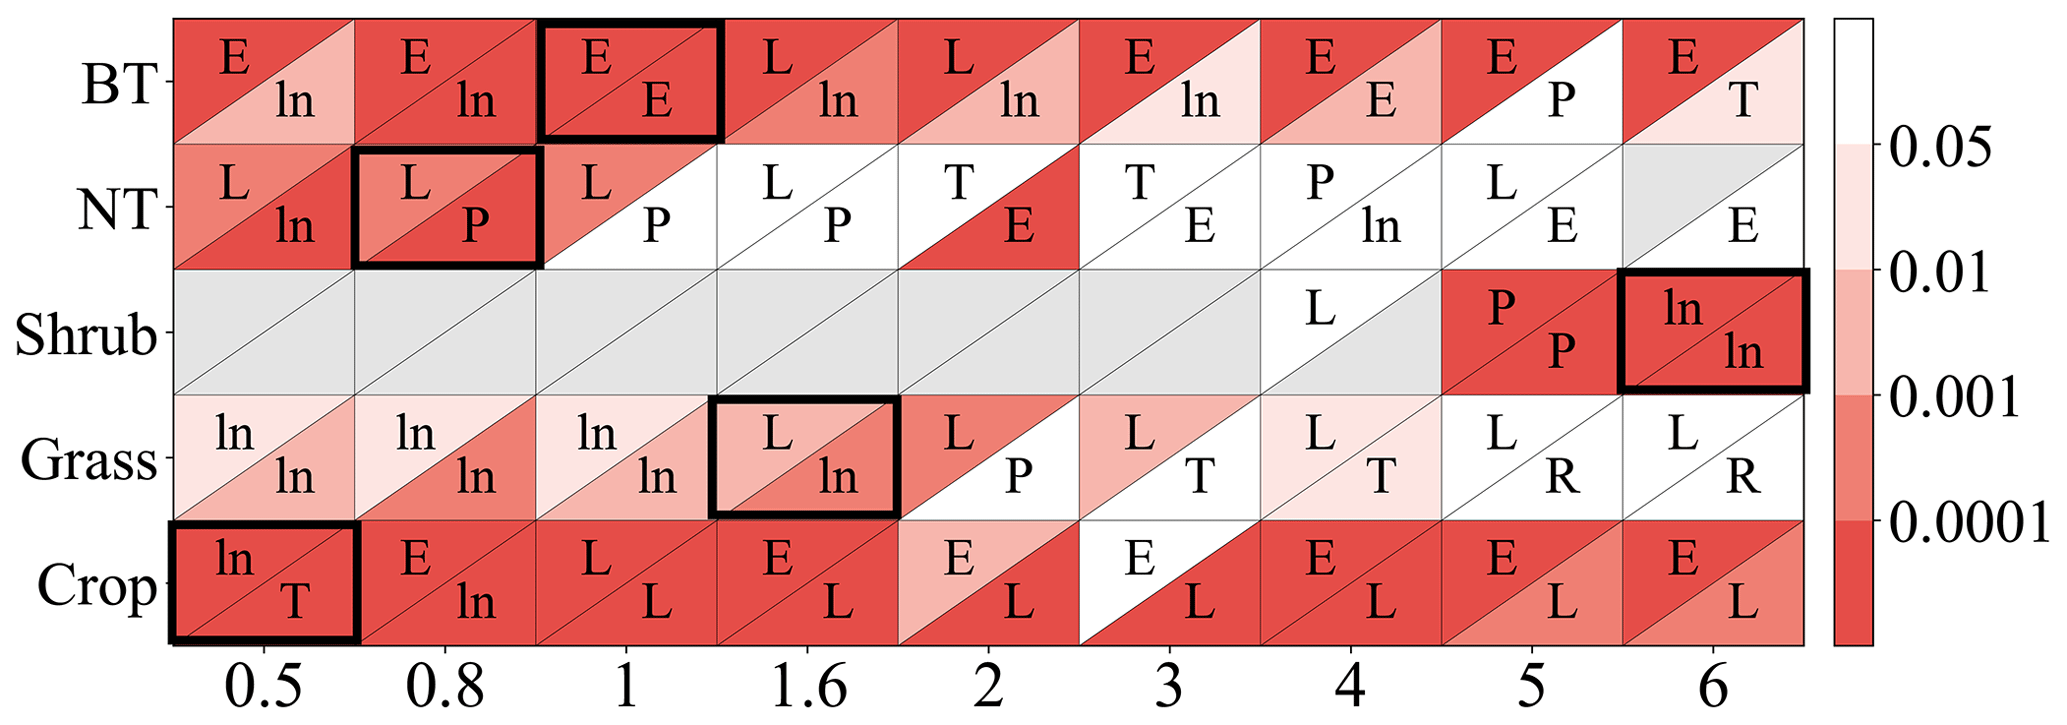
Figure 2P value from regression analysis using a linear or nonlinear function corresponding to different ozone flux thresholds Y (0.5, 0.8, 1, 1.6, 2, 3, 4, 5, 6) in PODY for photosynthetic (upper triangle) and stomatal (lower triangle) responses across different vegetation types: broadleaf trees (BT), needleleaf trees (NT), crops, grasses, and shrubs. A lower P value (deeper red) indicates a regression with greater statistical significance and higher accuracy, and a regression with P<0.05 is considered statistically significant. The letters within the triangles denote the optimal function forms for a given Y and vegetation type determined by the smallest residual sum of squares (RSS): linear function (L), logarithm function (ln), exponential function (E), hyperbolic tangent function (T), power function (P), and reciprocal function (R). Boxes with the optimal Y (required to be statistically significant for both photosynthetic and stomatal responses and have the highest significance) are outlined using a black frame. Triangles in gray indicate the number of observations is fewer than three.
2.2.2 Selection of ozone flux threshold Y
The optimal threshold Y for each vegetation type is selected based on two criteria: (i) the P values of the optimal regression functions for both the photosynthetic rate and stomatal conductance are less than 0.05 (i.e., regression is statistically significant) and (ii) the sum of the P values for the Y is smallest (i.e., highest statistical significance).
Because a smaller sample size leads to fewer degrees of freedom, a higher coefficient of determination (R2) is associated with a statistically significant regression model that is superior to a random prediction model. In our study, sample size obviously varies with threshold Y (Tables S1–S2 and Sect. 2.1.2), and comparison R2 among different Y fails to account for the effect of sample size. Therefore, we use the P value as the criterion rather than R2.
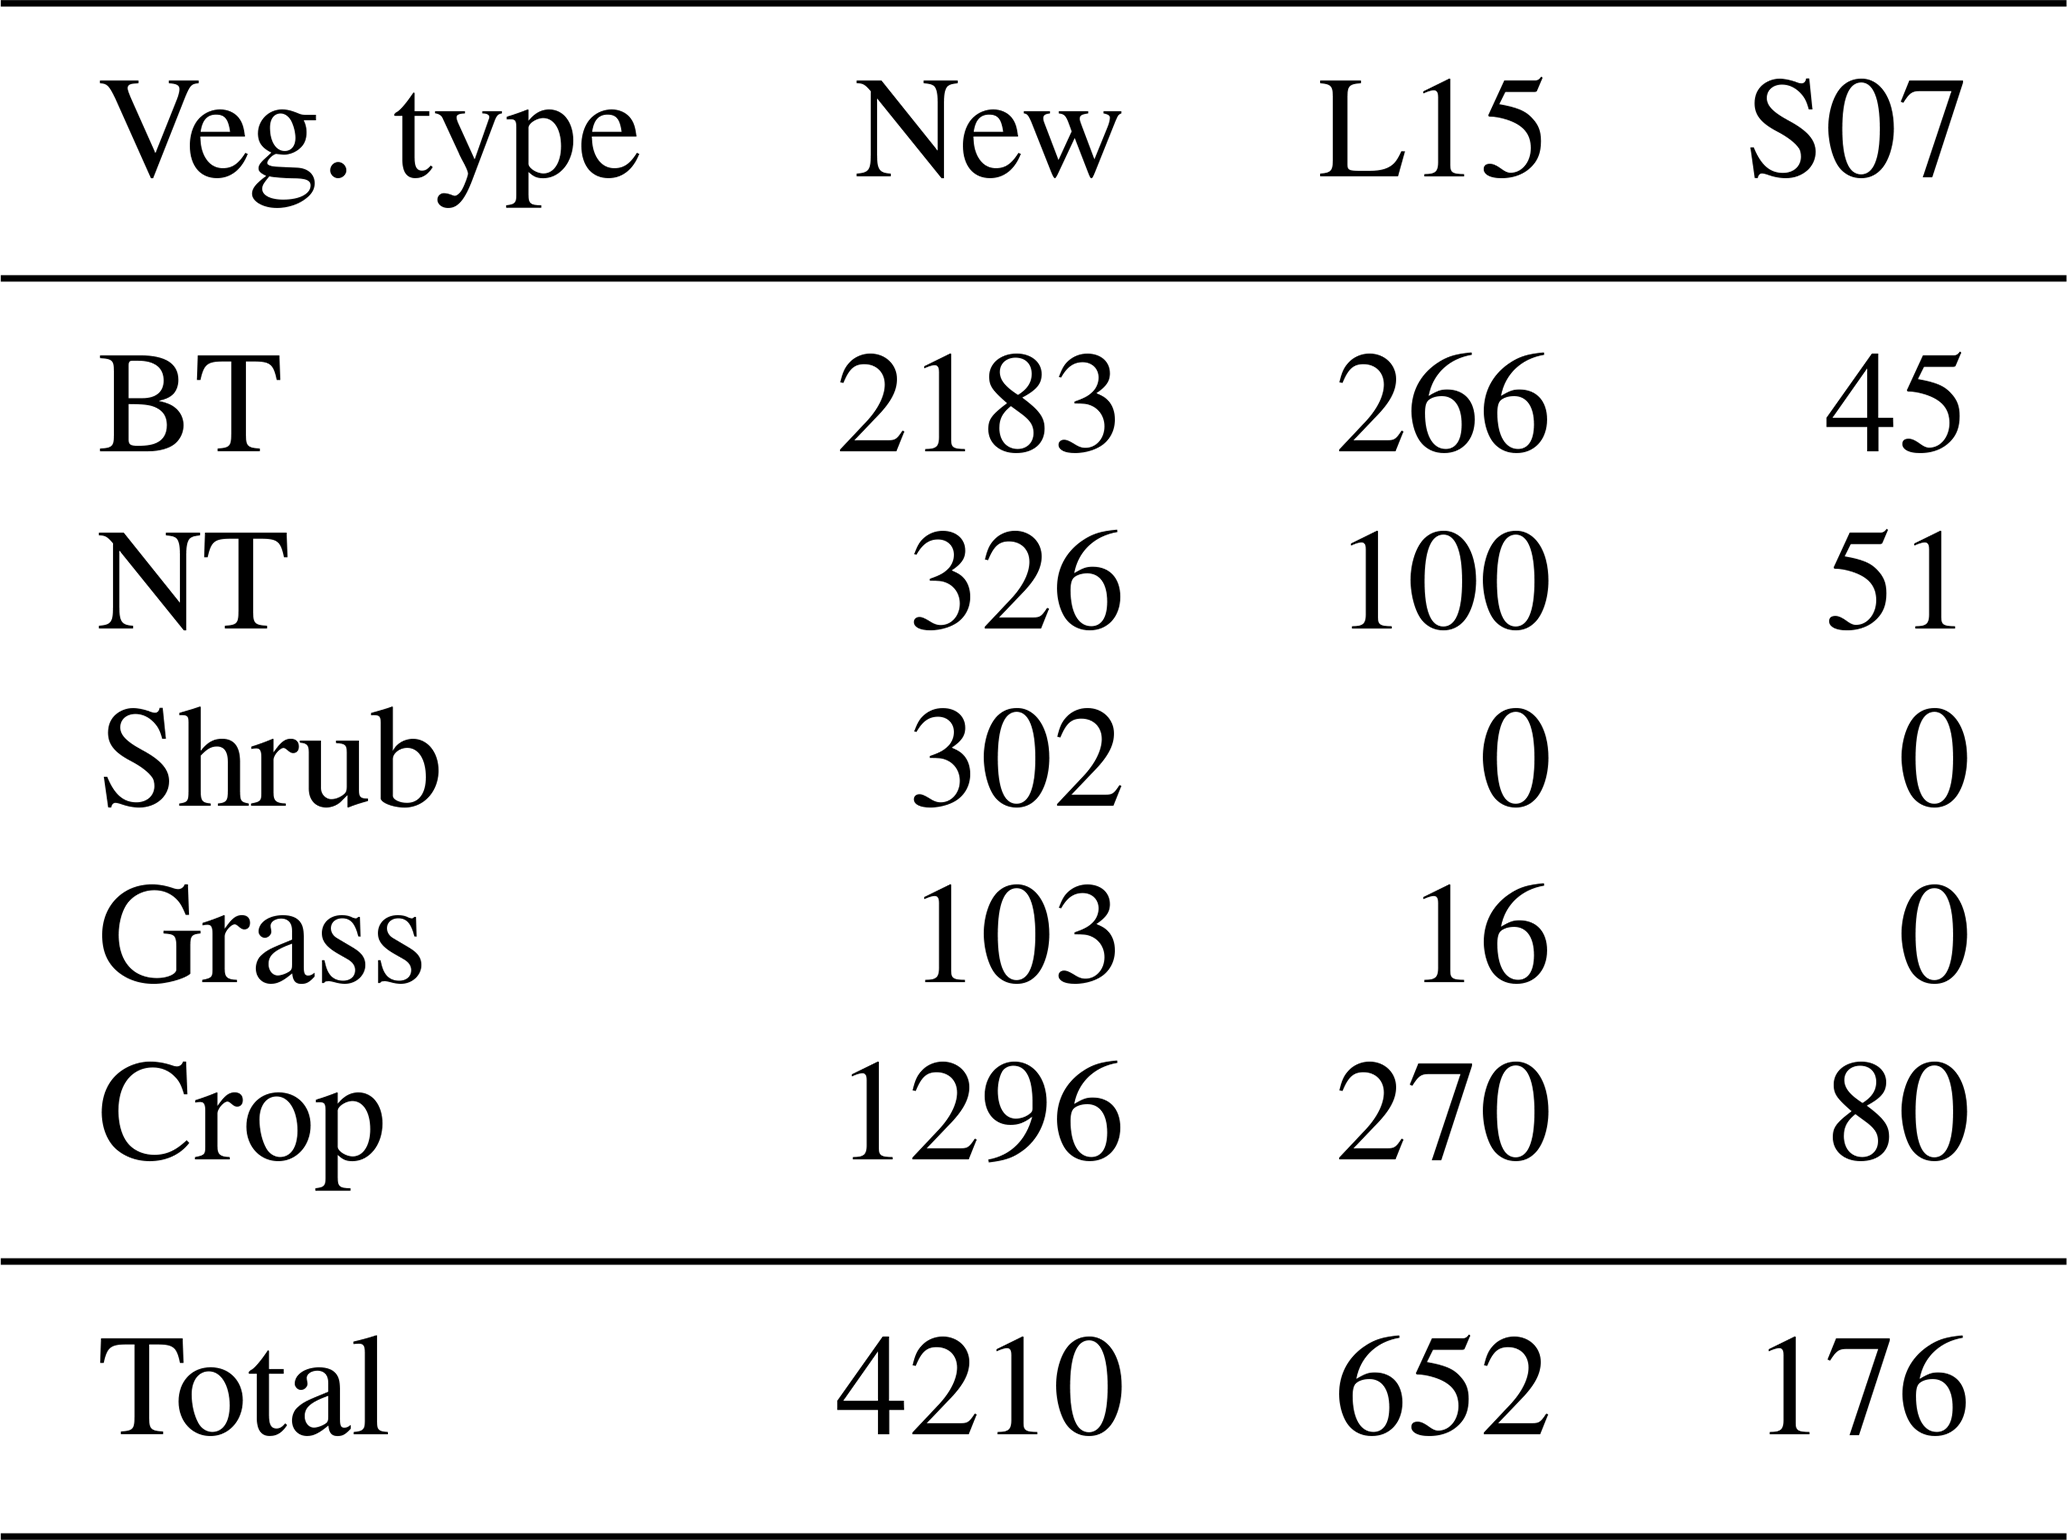
Consequently, the optimal threshold Y is identified as 1 for broadleaf trees, 0.8 for needleleaf trees, 6 for shrubs, 1.6 for grasses, and 0.5 for crops (Fig. 2). The number of paired data points corresponding to the selected Y is 2183 (=902 for photosynthetic response plus 1281 for stomatal response) for broadleaf trees, 326 () for needleleaf trees, 302 () for shrubs, 103 () for grasses, and 1296 () for crops, totaling 4210 (Table 2).
Table 2The number of paired data points used to generate response functions of photosynthetic rate and stomatal conductance for the new parameterization scheme, L15 (Lombardozzi et al., 2015), and S07 (Sitch et al., 2007).
2.3 Application for global simulations
2.3.1 Model platform
We test the new parameterization scheme using the CESM. CESM is a widely utilized Earth system model that enables the simulation of the global atmosphere, ocean, land, and sea ice, along with their interactions (Danabasoglu et al., 2020). It is developed by the CESM community and hosted at the National Center for Atmospheric Research (NCAR). For our study, we adopt the latest version, CESM2.2, which incorporates CLM5 as its land component (Lawrence et al., 2019).
CLM5 uses the Farquhar–Collatz model for photosynthesis and the Medlyn model for stomatal conductance. When calculating photosynthesis and stomatal conductance, it distinguishes between sunlit and shaded leaves, in which sunlit leaves absorb both direct and diffuse solar radiation, while shaded leaves only receive diffuse radiation. The L15 scheme (see Appendix A) is included in CLM5 as an option to account for ozone damage to vegetation, but it is inactive in default simulations. Like L15, we calculate the O3 uptake and its influence on the photosynthetic rate and stomatal conductance for sunlit and shaded leaves separately.
2.3.2 Experimental design
We use the component set I2000Clm50Sp (present-day offline simulations of land model CLM5.0 with prescribed vegetation) of CESM2.2, similar to I2000Clm45Sp (present-day offline simulations of land model CLM4.5 with prescribed vegetation) used in Lombardozzi et al. (2015). In this component set, CLM5 includes 1 bare soil PFT (plant functional type) and 16 vegetated PFTs (3 needleleaf tree PFTs, 5 broadleaf tree PFTs, 3 shrub PFTs, 3 grass PFTs, and 2 crop PFTs). The component set uses prescribed present-day vegetation distribution and structure and keeps the biogeochemical module inactive, so the impacts of O3 plant damage on them and their feedback are not considered. It is acceptable because this study aims to quantify the direct photosynthetic and stomatal responses to O3 exposure.
Three experiments are performed: O3_New, O3_OFF, and O3_L15. The three simulations are identical except for applying the new scheme proposed in this study, no ozone plant damage, and the L15 scheme, respectively. We quantify the global impacts of O3 on leaf photosynthetic rate and stomatal conductance by calculating the difference between O3_New and O3_OFF and assess the impact of the different schemes by calculating the difference between O3_New and O3_L15.
All simulations are conducted for 30 years with 2005–2014 atmospheric forcing and surface ozone concentration cycling three times. They are initialized from an equilibrium (spun-up) state of CLM5 default present-day simulations provided by CESM2.2, similar to O3_OFF but employing a different length of atmospheric forcing. The last 20 years of the simulations are analyzed, and the first 10 years are discarded as spin-up. The simulations run at a spatial resolution of 1.895° latitude by 2.5° longitude, with a model time step of 30 min.
2.3.3 Input data
The Global Soil Wetness Project (GSWP3.1) provides a 3-hourly 0.5° global atmospheric reanalysis dataset for 2005–2014, which serves as the default atmospheric forcing for CLM5. It includes variables such as surface air temperature, wind speed, specific humidity, air pressure, incident longwave radiation, insolation, and precipitation. The input data of the prescribed present-day vegetation distribution and structure (leaf area index, LAI, and canopy height) have no interannual variability, which is based on MODIS satellite observations. The above-mentioned forcing and initial data, as well as atmospheric CO2 concentration and nitrogen and aerosol deposition for the year 2000, are provided with CESM2.2.
In our study, 2005–2014 time-varying surface air ozone concentration in parts per billion (i.e., volume mixing ratio, VMR) is derived based on the 3-hourly 0.75° surface ozone mass mixing ratio (MMR, kg kg−1) from CAMS global reanalysis EAC4 (ECMWF Atmospheric Composition Reanalysis 4; Inness et al., 2019) through multiplying MMR by (Giusti, 2019). It is better than a global constant ozone concentration set in CLM5 and time step data from linear interpolation of monthly ozone concentration used in the ongoing CLM development version. The ozone concentration (in ppb) could convert to that (in units of nmol m−3) used in Eq. (7) through multiplying by , where Patm, Oatm, and R are atmospheric pressure (Pa), atmospheric potential temperature (K), and the universal gas constant (J K−1 kmol−1), respectively. In CESM coupled land–atmosphere simulations (not performed here), ozone concentration can be simulated by the atmospheric model and transferred to the land model.
2.3.4 Benchmark data
The FLUXCOM product is used as benchmark data to assess 2005–2014 averaged global GPP simulations. The 0.5° daily FLUXCOM RS+METEO GPP product is derived by using machine learning to integrate FLUXNET site-level observations, satellite remote sensing, and meteorological data (Jung et al., 2020). It is commonly used to evaluate GPP simulations of regional and global process-based models.
2.3.5 Parameterization scheme
Following the processes detailed in Sect. 2.1 and 2.2, photosynthetic and stomatal response functions are generated (Figs. 3–4). The response factors of photosynthetic rate to O3 (FO3_A, unitless) for broadleaf trees (BT), needleleaf trees (NT), shrubs, grasses, and crops are given as
and the response factors of stomatal conductance to O3 (FO3_g, unitless) are
As shown in Figs. 3–4, the regression is statistically significant for all vegetation types, so each vegetation type has its own function based on observations. This differs from earlier parameterization schemes that employed substitution when regressions were not statistically significant or observations were unavailable or collected for a specific vegetation type. When we evaluate the L15 scheme using our expanded collected dataset, we find that the regression functions of L15 with POD0.8 as the independent variable are statistically significant for crop photosynthetic rate only. Even for the crop photosynthetic rate, our scheme improves the fitting skill (quantified by R2) by 8.1 % (Table 3). As in L15, the response factors are required to range from 0 to 1 to avoid unwanted outcomes in any scenario when used in models.
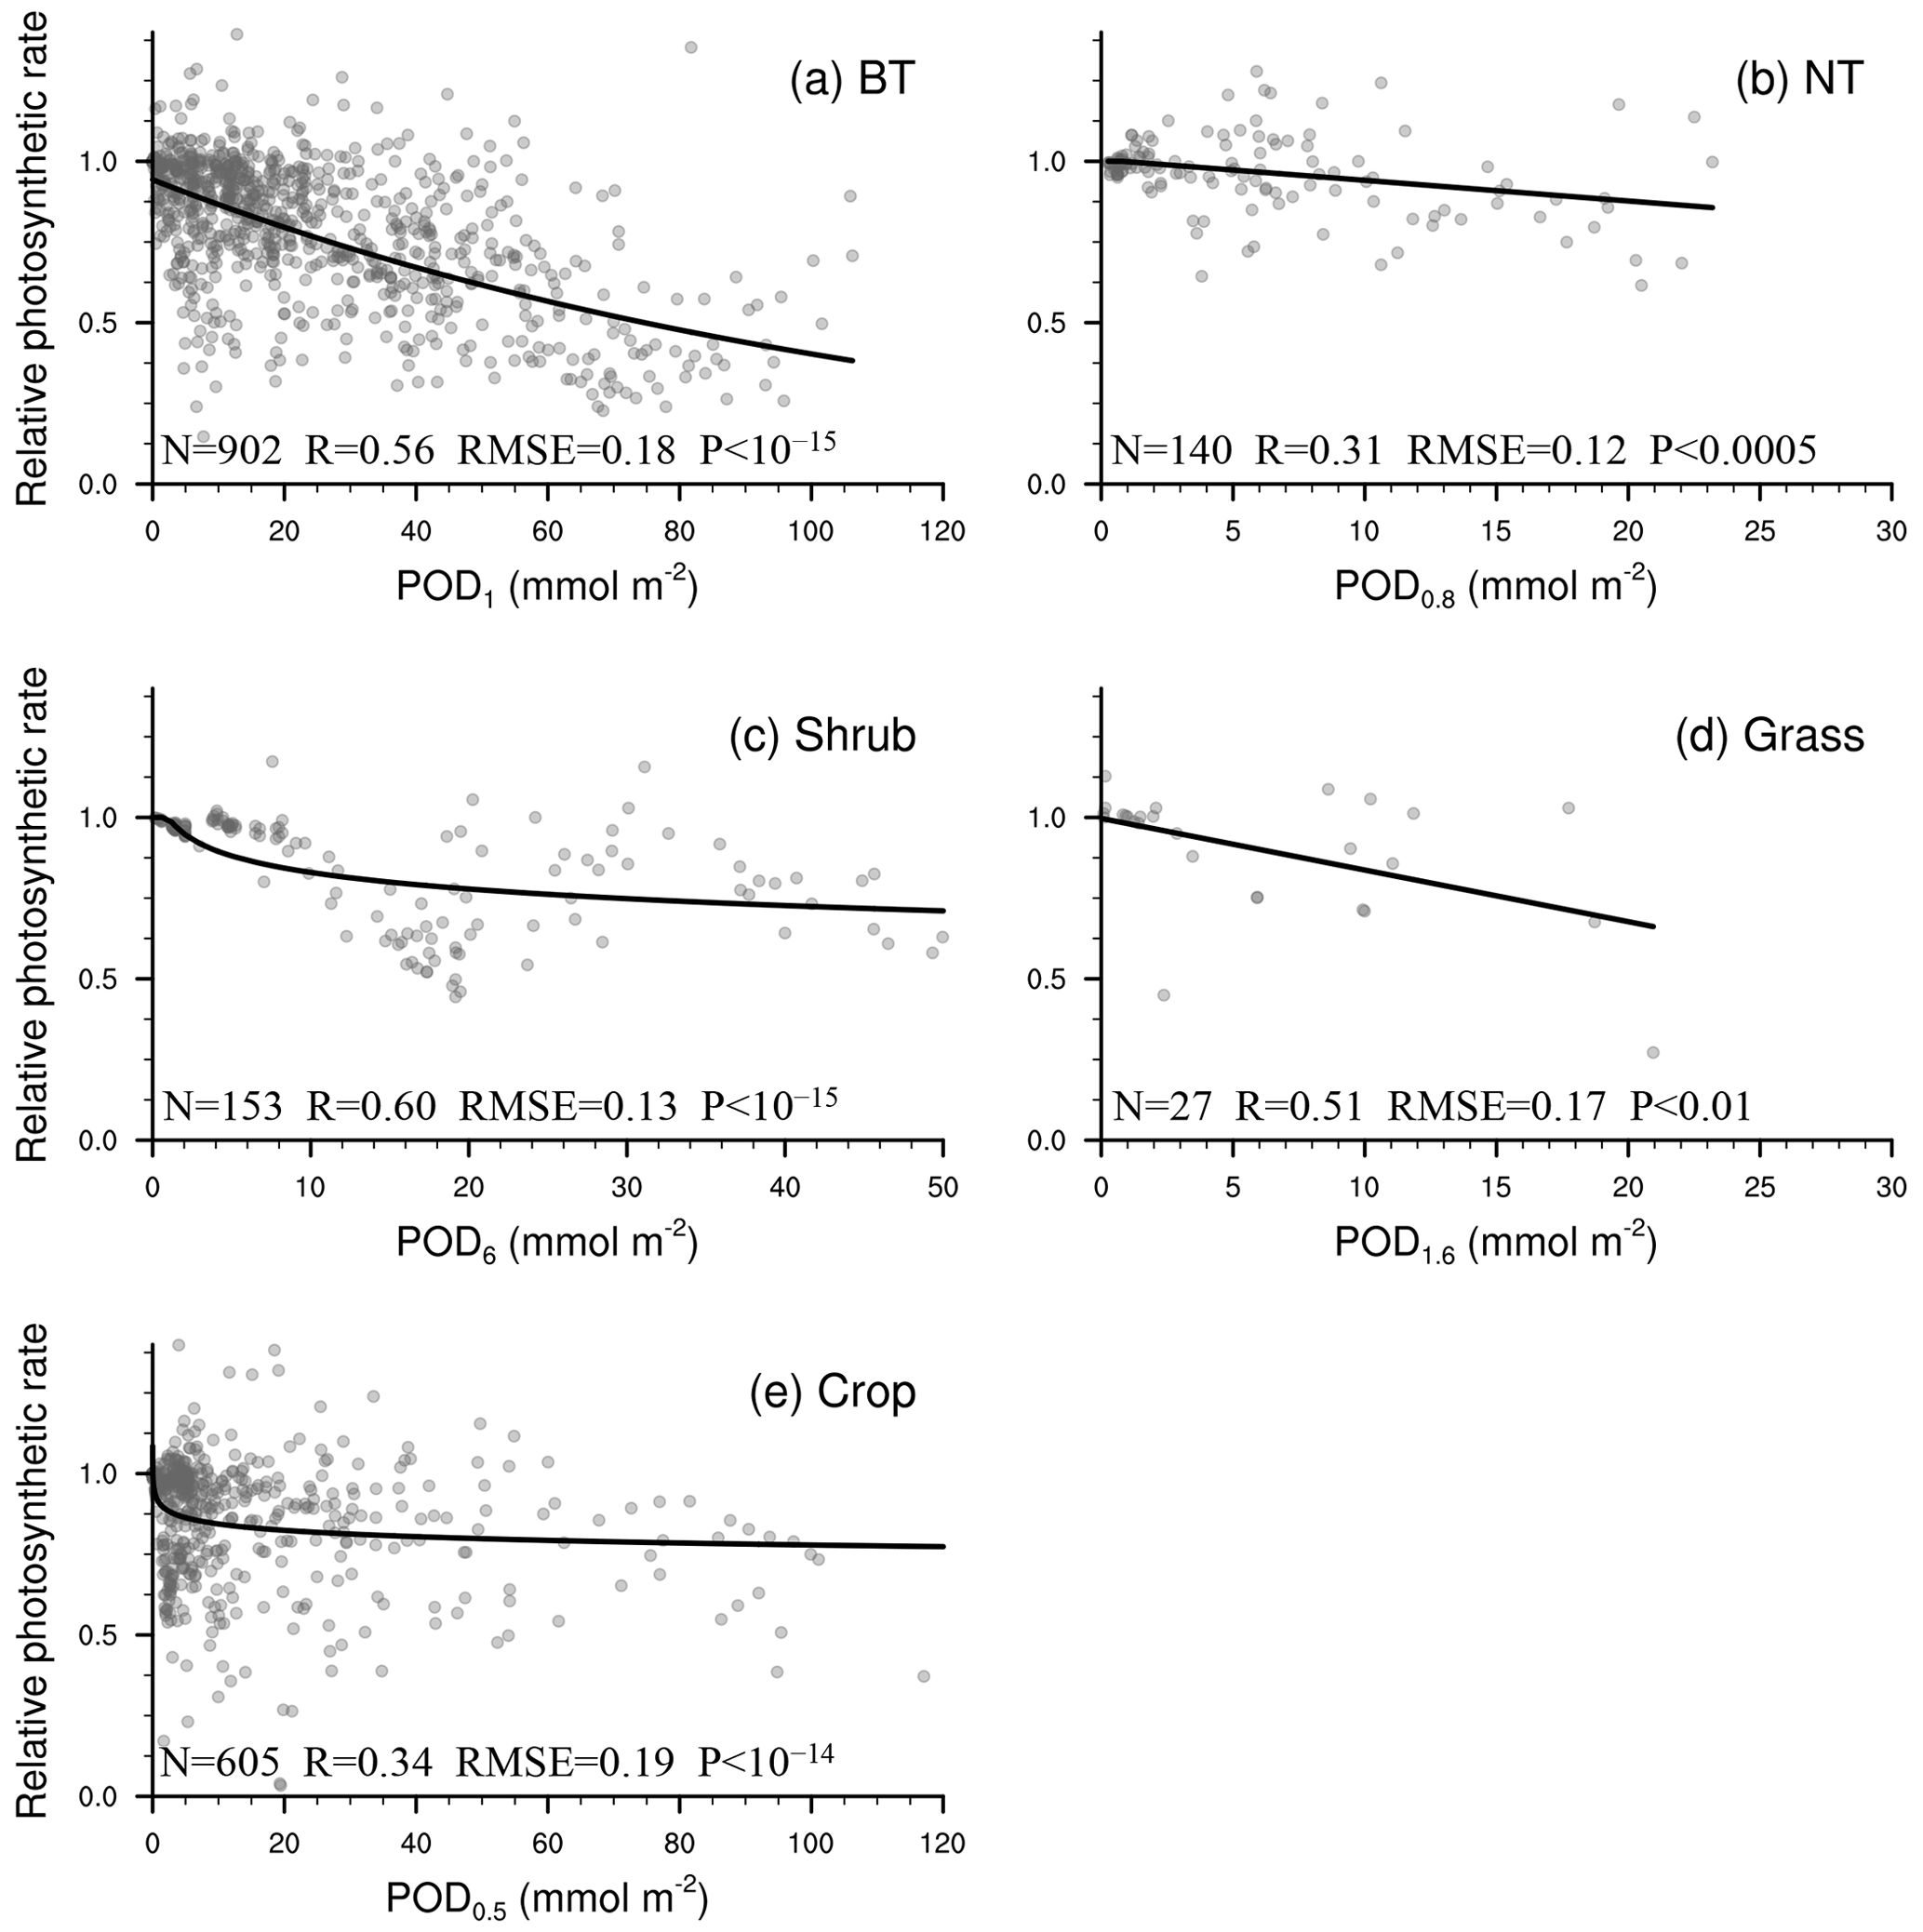
Figure 3Relationship between PODY and relative photosynthetic rate from experimental measurements (dots). The line of best fit (line) represents the photosynthetic response function (FO3_A) used in our parameterization scheme. Sample size of measurements (N), correlation coefficient (R), root mean square error (RMSE) between measurements and predicted values, and P value of regression (P) are also shown. When P<0.05, the regression analysis is considered statistically significant. A smaller P value indicates that the regression analysis has a stronger statistical significance and higher skill than random prediction.
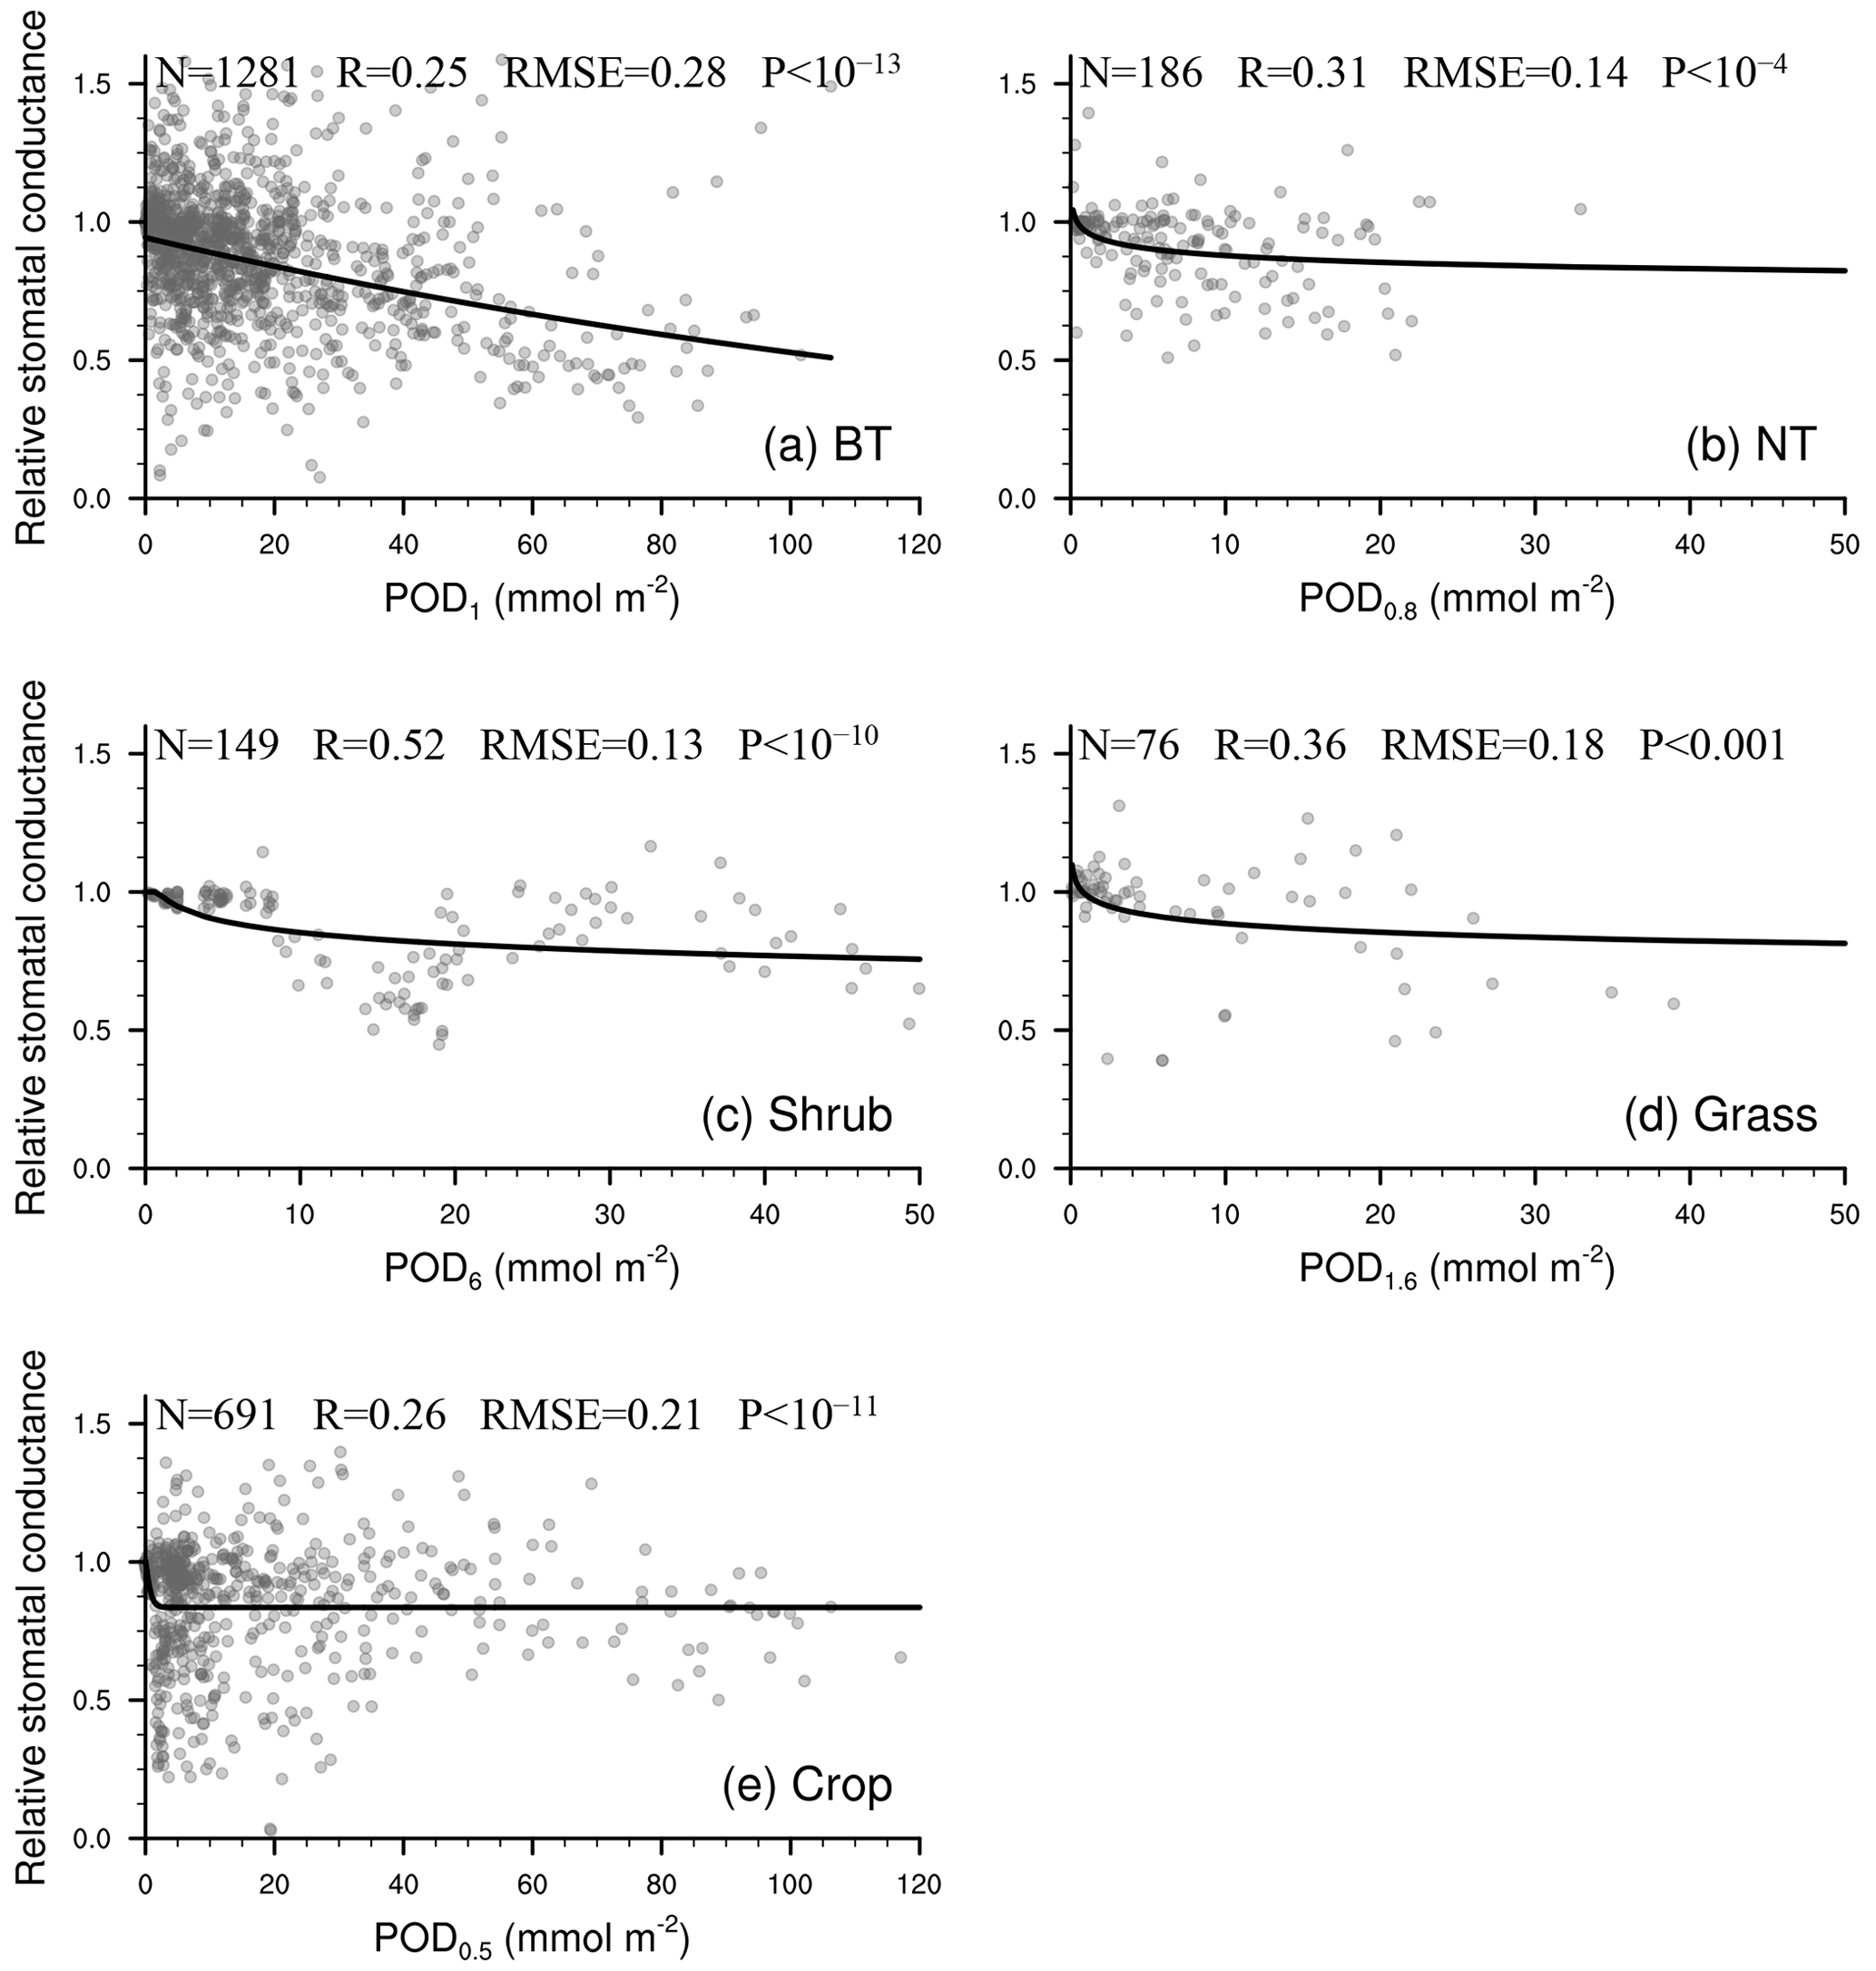
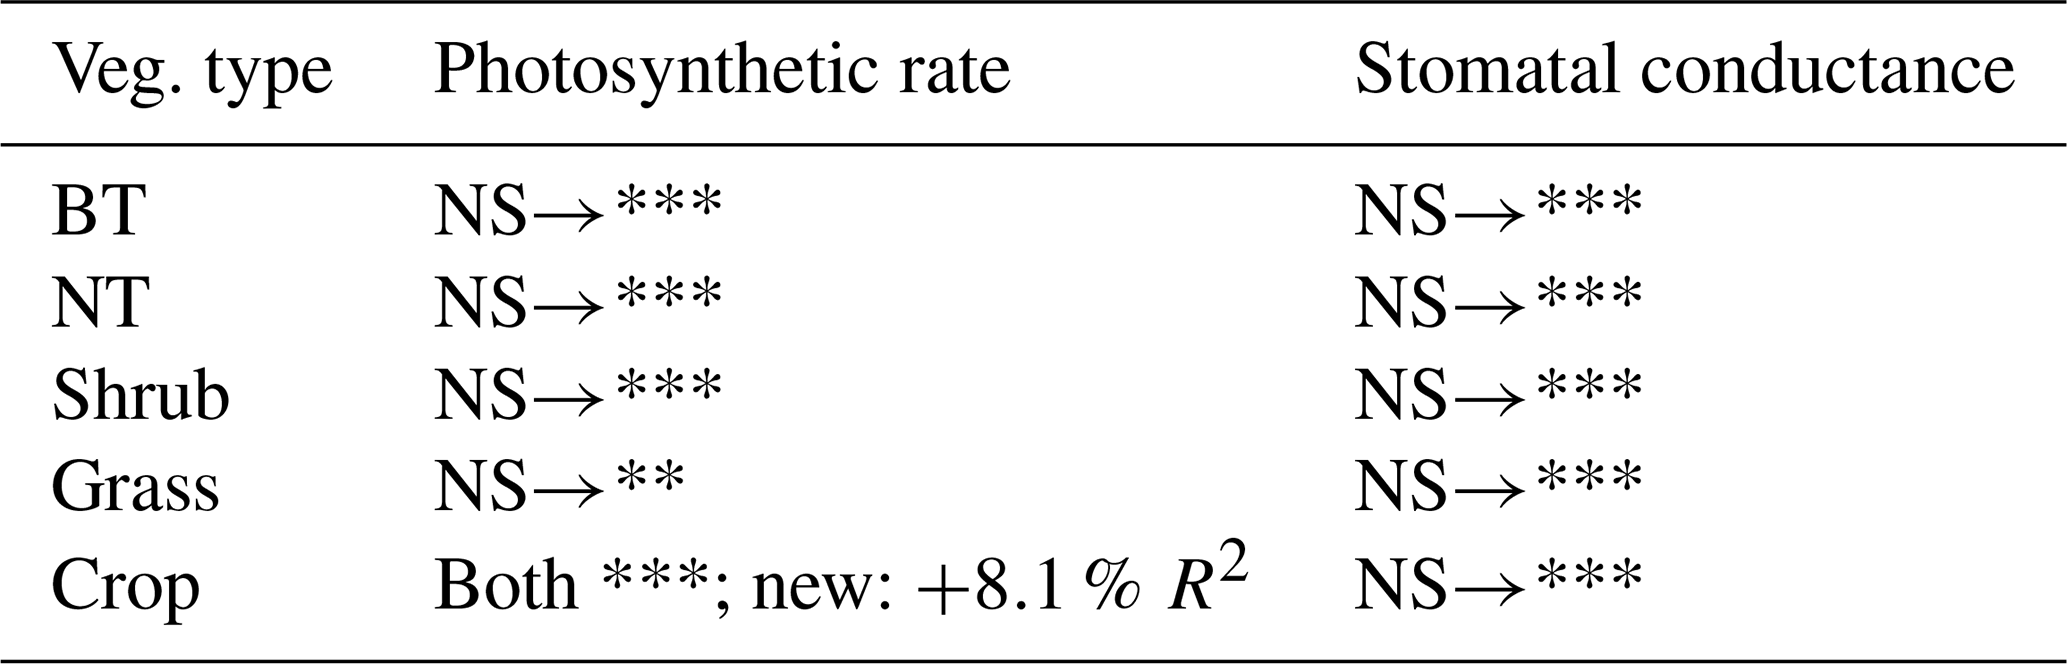
Table 3Overview of improved ability from the L15 scheme to the new scheme in reproducing the observed relationship between PODY and either relative photosynthetic rate or relative stomatal conductance for various vegetation types, based on the database collected in our study. NS: non-significant; *: P<0.05; **: P<0.01; ***: P<0.001. When both schemes are significant, we also list the relative changes in R2 of the new scheme to L15.
PODY (mmol m−2) in Eqs. (2) and (3) represents the cumulative O3 uptake during the vegetation growing season. Its value in time step t is calculated as
where PODY,t and POD are the PODY at time steps t and t−1; Dt (0 to 1, unitless) is the decay fraction at time step t given that leaves fall and emerge, and PODY in process-based models represents the PFT average in a grid cell; UY,t (nmol O3 m−2 time step−1) is the daytime O3 uptake at time step t; and 10−6 is the unit converter from nanomoles to millimoles. The growing season is defined as leaf area index (LAI, m2 m−2) >0.3 for temperate deciduous shrubs and LAI >0.5 for other deciduous PFTs and all year for evergreen PFTs. The LAI threshold of 0.5 is used by Lombardozzi et al. (2015). For the temperate deciduous shrubs, a threshold of 0.5 is too high and close to the observed peak-month LAI according to CLM5 present-day surface data (generated from the MCD15A LAI product; Lawrence et al., 2019), so we use a lower value of 0.3 as the threshold.
The decay fraction is set as
where Δt is time step length (s); lleaf is leaf longevity (years); and LAIt−1 and LAIt are leaf area index at time steps t−1 and t, respectively. lleaf is set to 1.7, 3.2, 1.3, and 6.5 years for tropical broadleaf evergreen trees, temperate needleleaf evergreen trees, temperate broadleaf evergreen trees, and boreal needleleaf evergreen trees, respectively, according to Zhang et al. (2016), who assessed the leaf longevity based on 418 field measurements around the world. The leaf longevity value (1.3 years) of temperate broadleaf evergreen trees is used for temperate broadleaf evergreen shrubs. For evergreen PFTs, the function of Dt is typically used to calculate the leaf turnover rate in DGVMs. For deciduous PFTs, we consider the decay of cumulative O3 uptake during the green-up period. We prefer the function of LAI over leaf carbon pool for broader applications because (i) land surface models and ESMs often run with prescribed vegetation and an inactive carbon cycle module (Dai et al., 2003; Lawrence et al., 2019; Song et al., 2021) and (ii) many DGVMs update carbon pools at the end of a year while updating LAI daily, so they do not model the changes in leaf carbon during the growing season, e.g., LPJ-DGVM, CLM-DGVM, IAP-DGVM, and CoLM-DGVM (Sitch et al., 2003; Levis et al., 2004; Zeng et al., 2014; Ji et al., 2014). For models with carbon pools updated at a sub-hourly to daily time step, an alternative function of Dt for deciduous PFTs is to use leaf carbon to replace LAI.
The O3 uptake at time step t is calculated using
where ozone flux threshold Y (nmol O3 m−2 s−1) is 3 for BT, 1 for NT, 5 for shrub, 2 for grass, and 0.5 for crop based on Sect. 2.2.2; the instantaneous O3 flux to stomata at time step t, FO3,t (nmol O3 m−2 s−1), is estimated in analogy with Ohm's law by
where [O3] is the O3 concentration at reference level (nmol m−3), and ram (s m−1), rb (s m−1), and rs (s m−1) are aerodynamical resistance, boundary layer resistance, and leaf stomatal resistance, respectively. Equation (7) is similar to S07 and L15 but with the updated value of kO3.
After response factors are calculated based on Eqs. (2) and (3), the leaf net photosynthetic rate (An,t, ) and stomatal conductance (gs,t, ) at time step t are modified for ozone stress as
and
In process-based models, net photosynthetic rate An is the photosynthetic rate minus dark respiration, where the photosynthetic rate is usually calculated using the Farquhar–Collatz model (Farquhar et al., 1980; Collatz et al., 1992). Stomatal conductance gs is generally estimated according to the Medlyn (Medlyn et al., 2011) or Ball–Berry (Ball et al., 1987; Collatz et al., 1991) models. CO2 partial pressure at the leaf surface and in the leaf, vapor pressure at the leaf surface, stomatal resistance (the reciprocal of stomatal conductance), and net photosynthetic rate are solved iteratively. The impact of O3 plant damage is not considered during the iterations.
3.1 O3 effect on global leaf photosynthetic rate and stomatal conductance
We integrate the new scheme into the CESM2.2's land component CLM5 to quantify the impact of ozone exposure on global leaf photosynthetic rate and stomatal conductance for 2005–2014. The growing season average of daytime O3 concentration is high mainly in the midlatitudes (20–50° N) of the Northern Hemisphere (NH) (Fig. 5a). The areas with the highest O3 concentrations are in the western United States, western and central Asia, and northern Africa, largely coinciding with the NH arid and semi-arid regions. O3 concentrations over boreal grasslands and shrublands as well as tropical savannas are higher than those in the tropical rainforests in South America (i.e., Amazon rainforest), Africa (i.e., Congo rainforest), and New Guinea but lower than those in NH forests and croplands. The peak-month O3 concentrations during the growing season are much higher than the growing season average, overall exceeding 40 ppb across most vegetated regions (Fig. 5b).
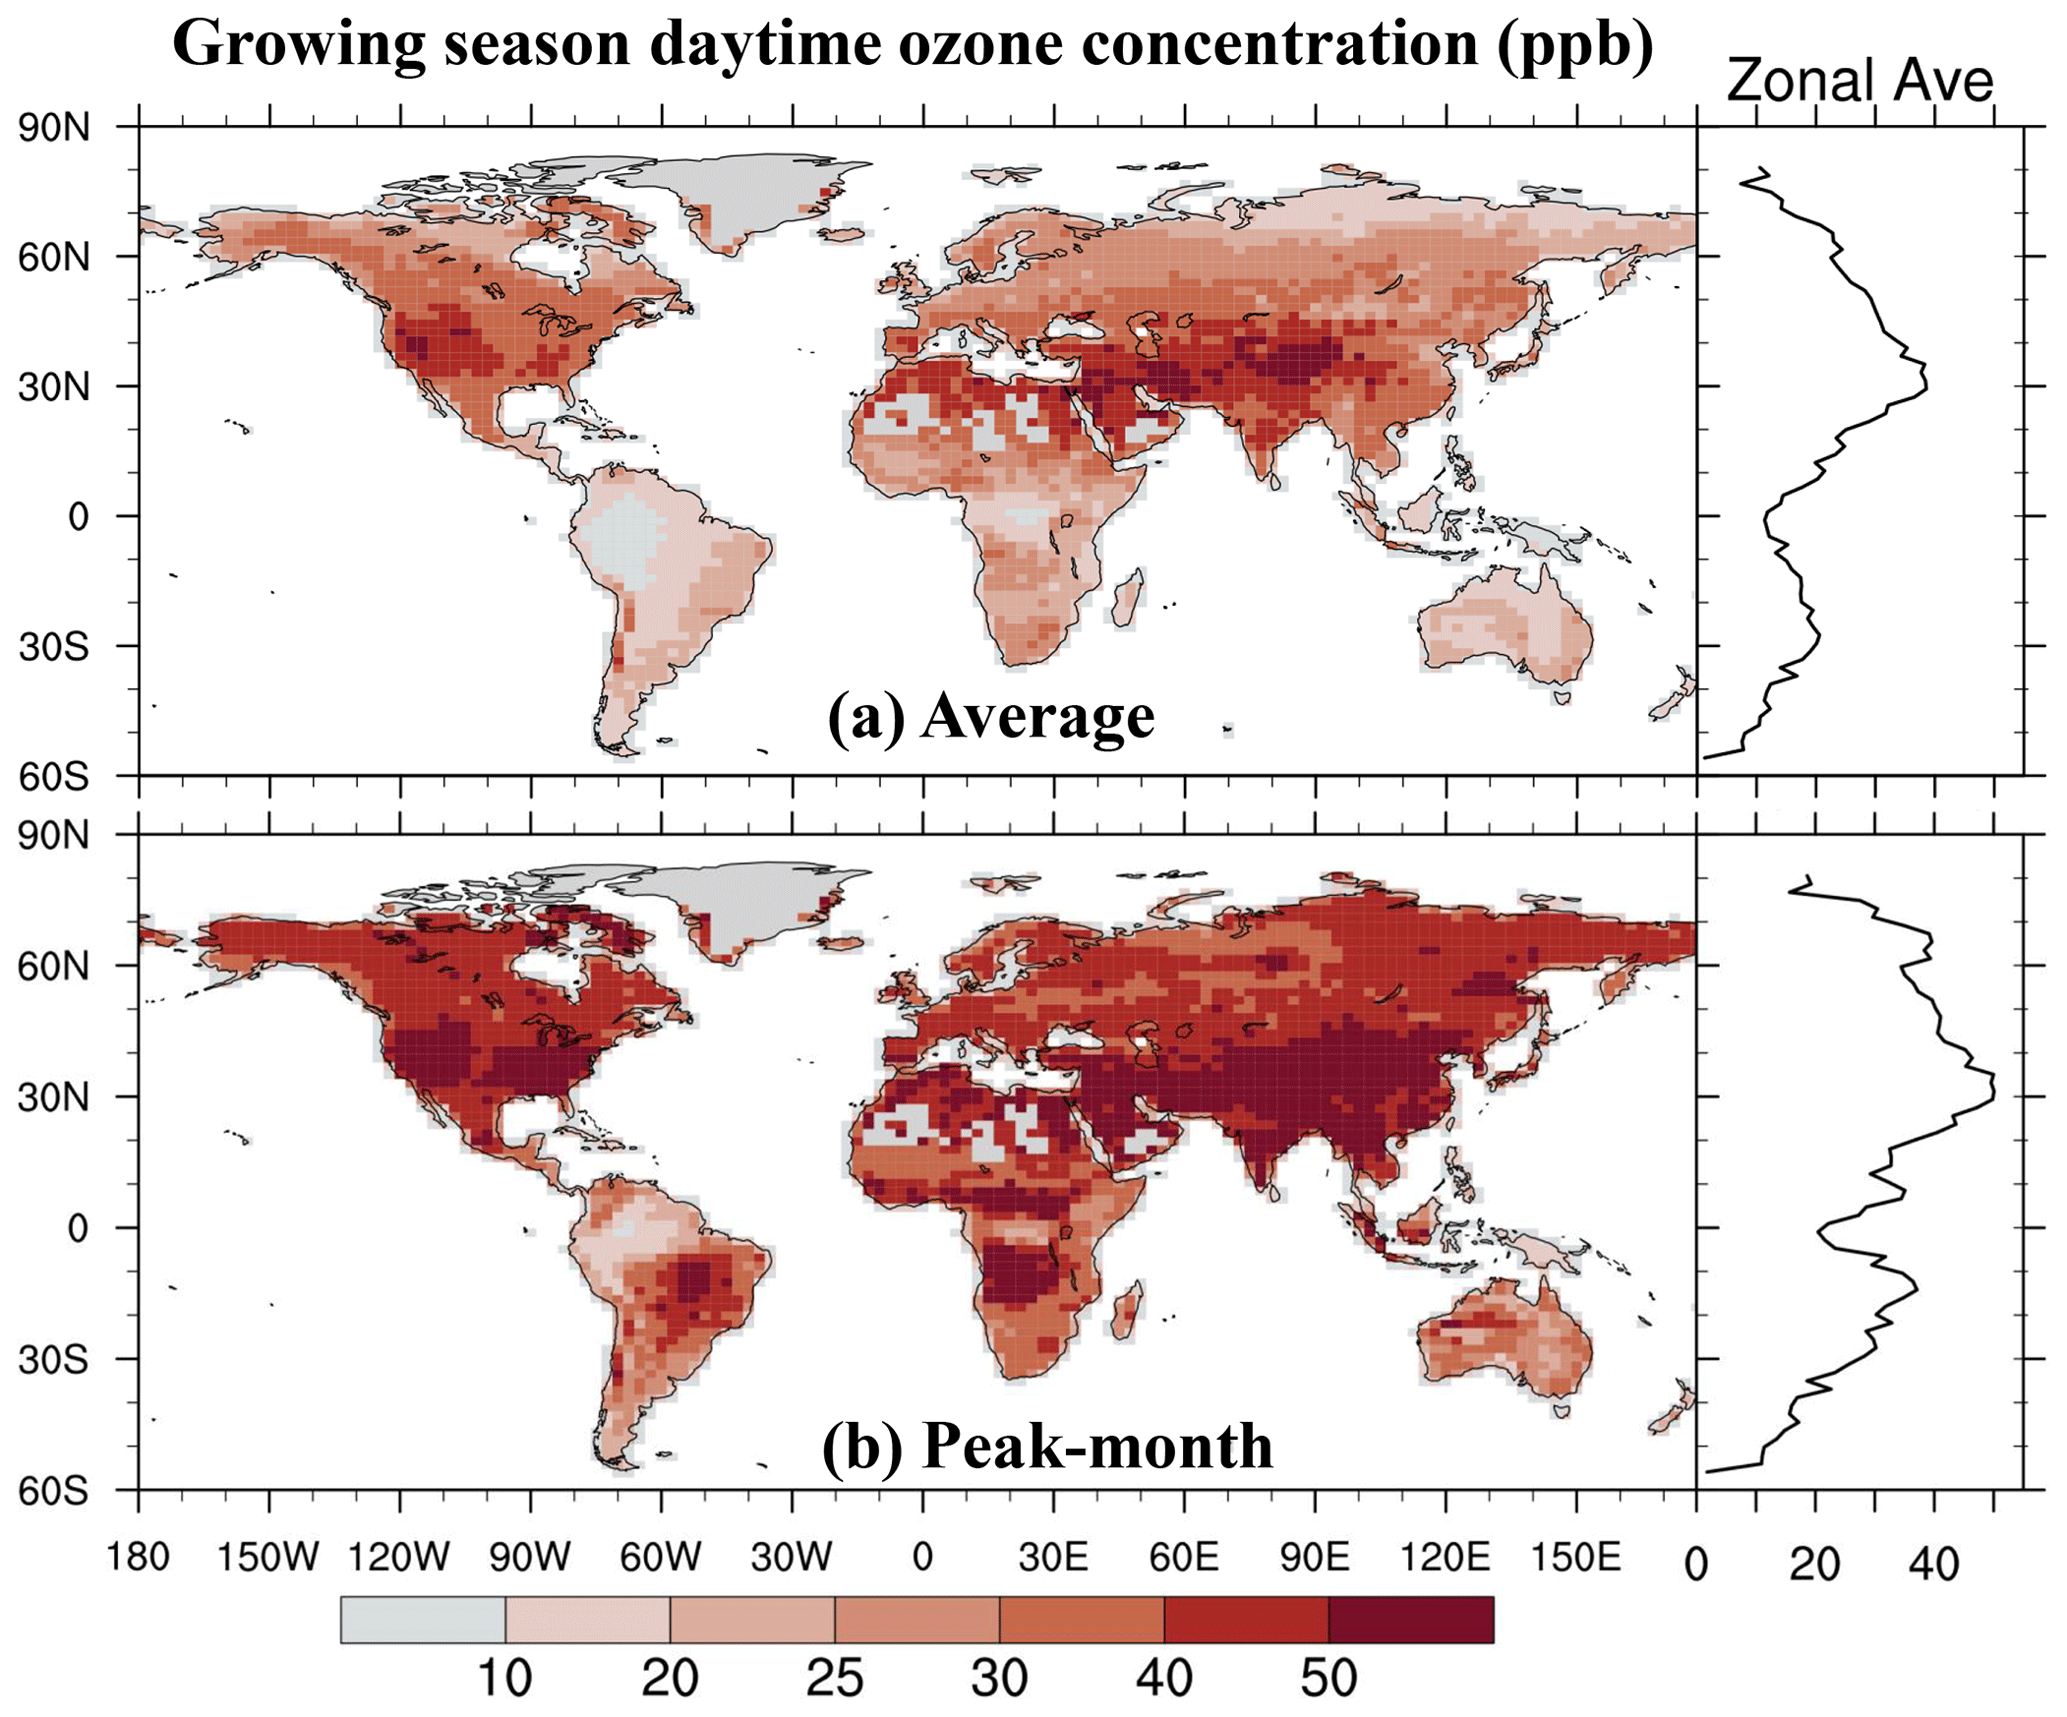
Figure 5The 2005–2014 average of (a) the growing season average of daytime O3 concentration and (b) the highest monthly concentration during the growing season. The O3 concentration data used as input for CLM5 are sourced from the ECMWF Atmospheric Composition Reanalysis 4 (EAC4).
Annual cumulative O3 uptake for sunlit leaves is high over the temperate forests and croplands in East Asia, Southeast Asia, South Asia, the United States, and Europe, as well as the boreal evergreen forest zone around 55° N (Fig. 6a). Most of these regions are those with moderate to high O3 concentrations (Fig. 5a) or long growing season. Low-value regions are characterized by either low O3 concentrations, such as in the heart of the Amazon and Congo rainforests, or low stomatal conductance, such as in NH temperate arid regions due to dry conditions and in boreal grasslands and shrublands due to the cold climate. The spatial pattern for shaded leaves is similar but with much lower values due to lower stomatal conductance (Fig. 6b).
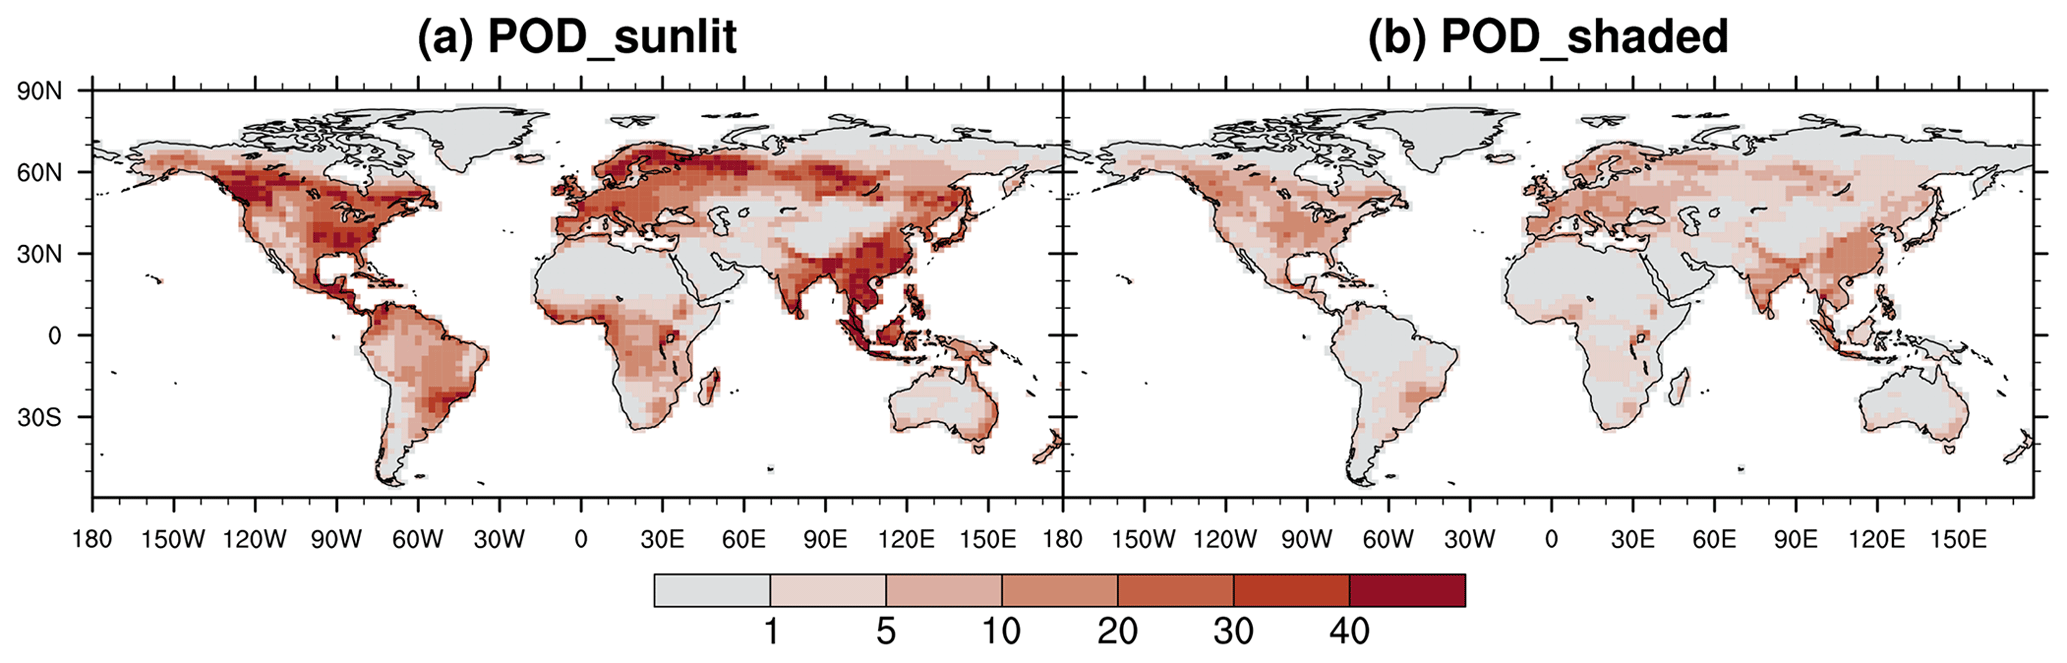
Figure 6Annual average PODY (mmol m−2) for (a) sunlit and (b) shaded leaves in O3_New simulations.
As shown in Fig. 7, O3 significantly reduces annual leaf photosynthetic rate and stomatal conductance over most vegetated areas, with a global average reduction of 8.5 % for the former and 7.4 % for the latter, both significant at the 0.05 level according to Student's t test. The spatial pattern of O3-induced significant reduction in leaf photosynthetic rate (Fig. 7a) is similar to that of sunlit-leaf cumulative O3 uptake (Fig. 6a). O3-induced reduction in stomatal conductance is typically weaker, with the largest reductions located in East Asia, Southeast Asia, and South Asia (Fig. 7b).
Compared to the new scheme, the L15 scheme generally simulates a stronger reduction in both photosynthetic rate and stomatal conductance (Fig. 7c–d), particularly in the tropical savannas across South America, Africa, and Australia and in the grasslands and shrublands over boreal Asia for photosynthesis (Fig. 7e) and the tropical savannas across Africa, South America, and Australia for stomatal conductance (Fig. 7f). The estimated global reduction is 20.4 % for leaf photosynthesis and 13.4 % for stomatal conductance. Both reductions are statistically significant at the 0.05 level and are 2.4 and 1.8 times greater, respectively, than those estimated with the new scheme.
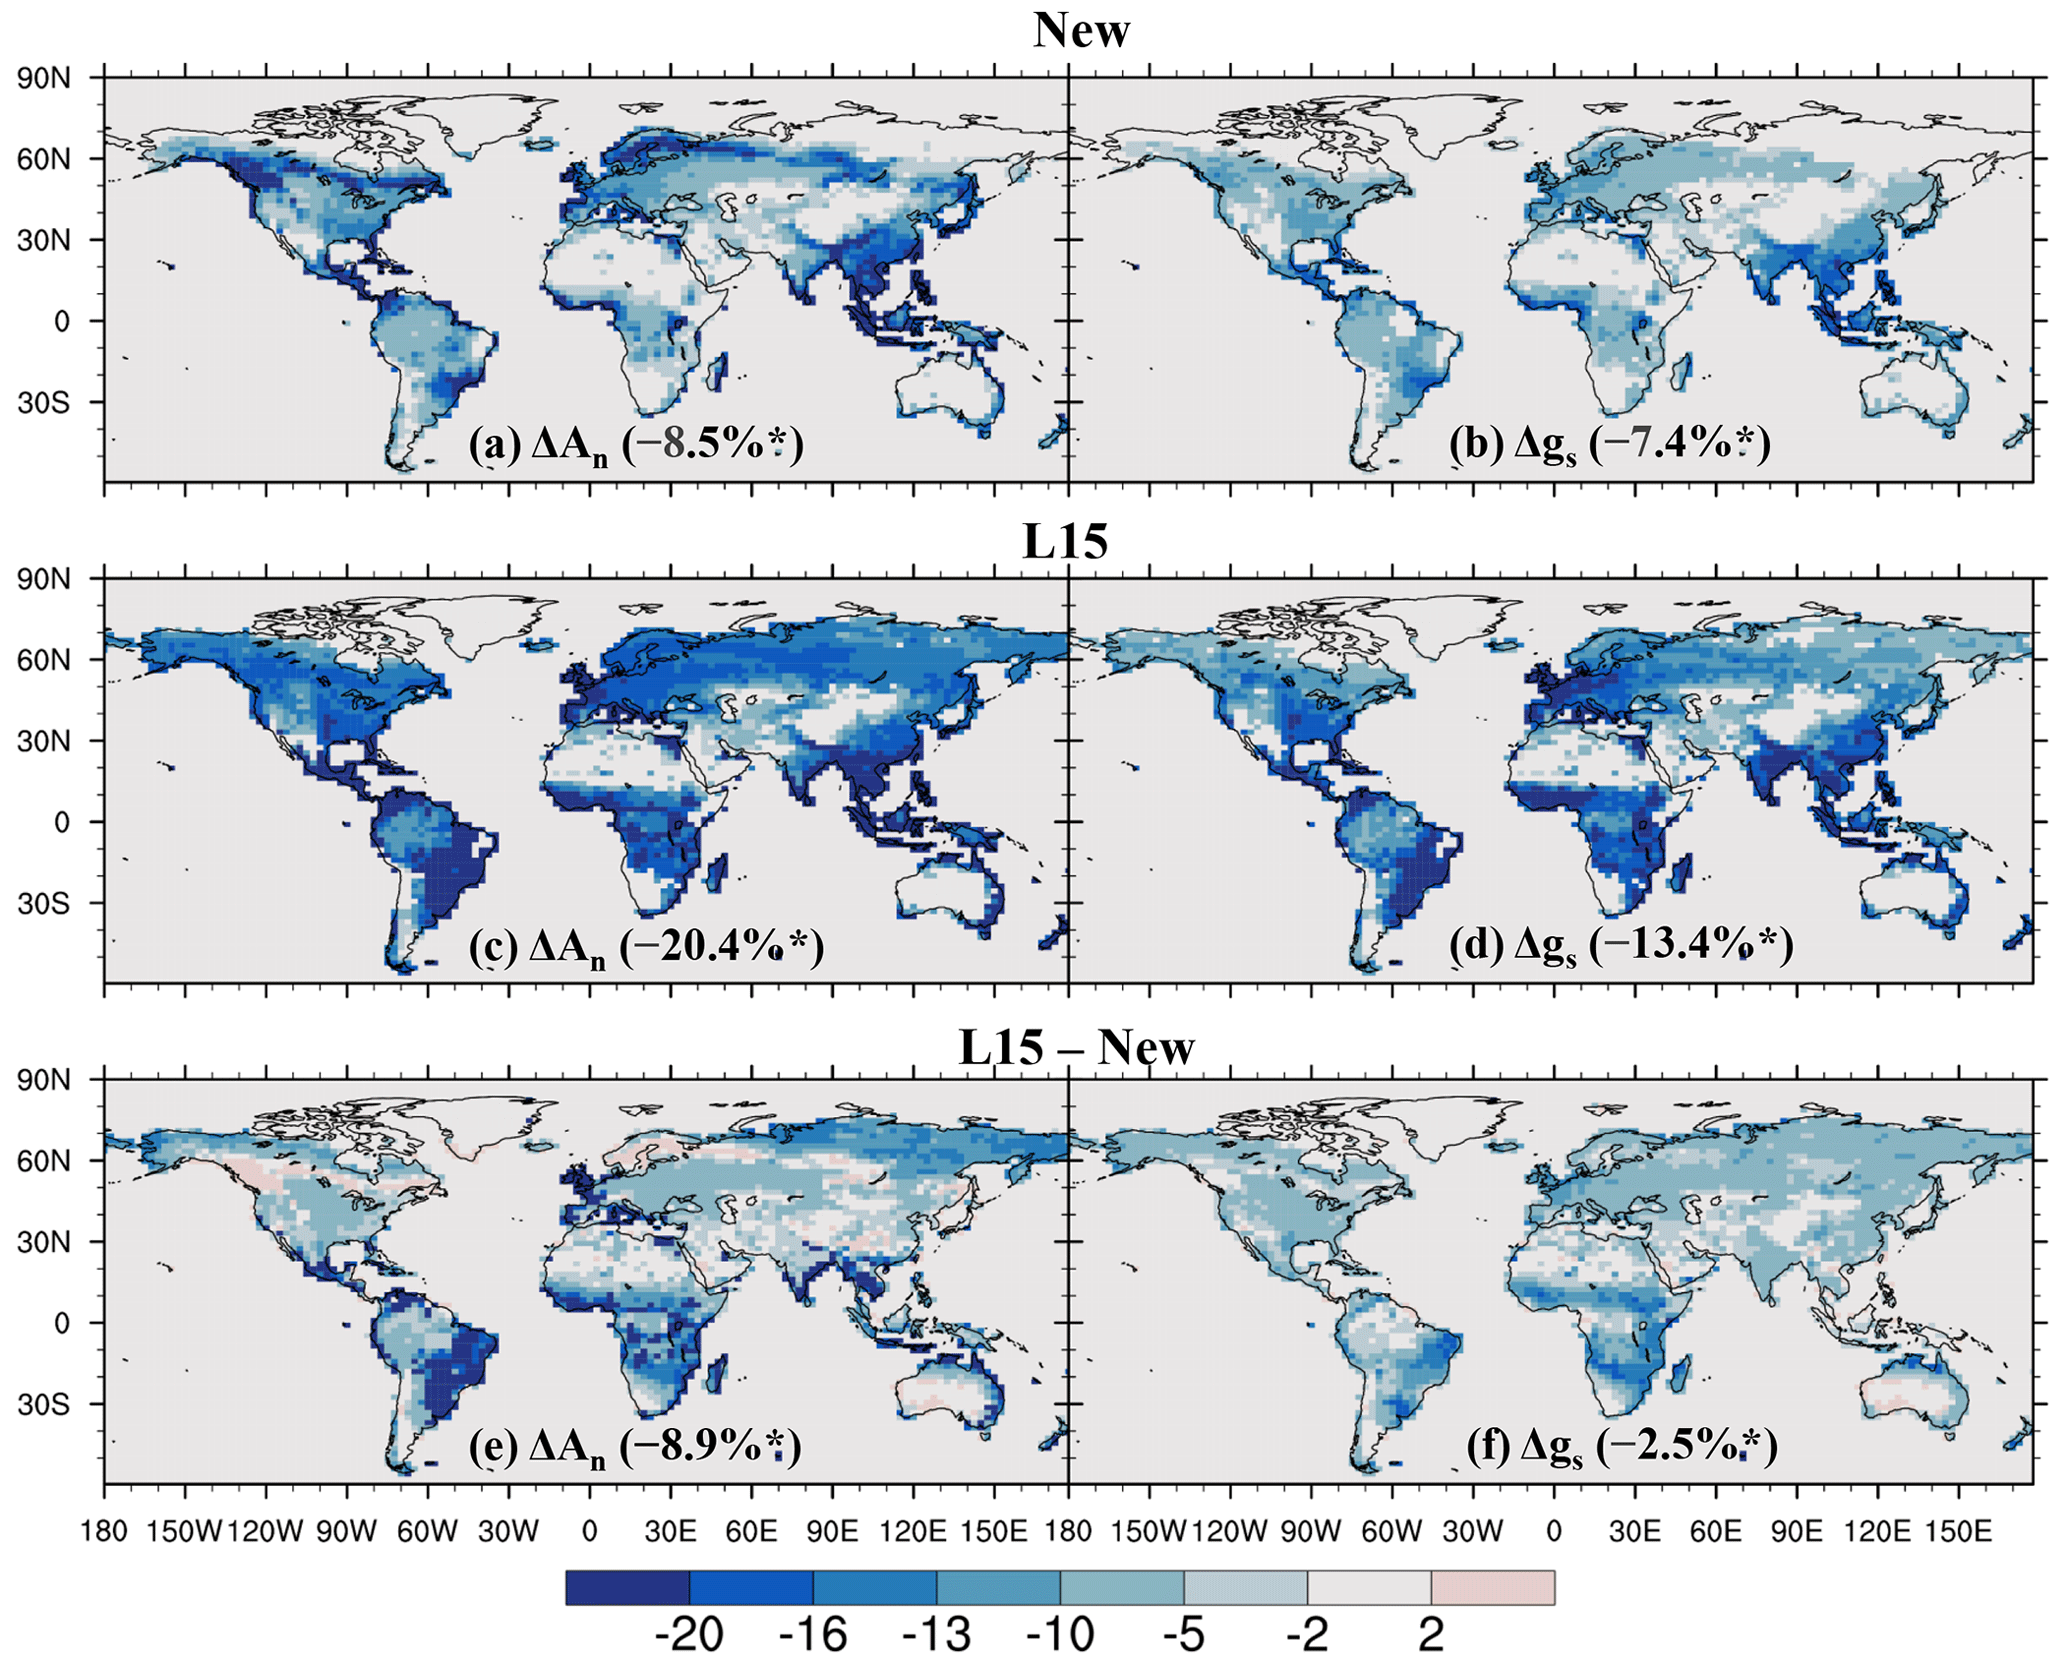
Figure 7Relative impact (%) of O3 on net leaf photosynthetic rate (An) and stomatal conductance (gs) quantified using (a, b) the new and (c, d) L15 schemes, as well as (e, f) the difference between them. In (a)–(d), the relative impacts are calculated using O3_New or O3_L15 compared to O3_OFF; only areas where the O3 impact is statistically significant at the 0.05 level are shown; numbers in parentheses are the global average influence. * Indicates that the (a–d) global influence and (e–f) the difference between schemes are significant at the 0.05 level.
The influence of O3 differs widely among PFTs, ranging from 0 %–17.1 % for photosynthetic rate and 0 %–15.7 % for stomatal conductance. Crops and trees are the most affected, followed by grasses, and shrubs are the least affected (Fig. 8). Grasses and shrubs are less affected mainly due to their lower cumulative O3 uptakes. Among trees, evergreen PFTs are more responsive to O3 than their deciduous counterparts within needleleaf or broadleaf types, attributable to their longer growing season and thus longer O3 exposure and higher cumulative O3 uptake. The photosynthetic rate of temperate broadleaf trees and boreal broadleaf deciduous trees is more affected than that of temperate needleleaf trees and boreal needleleaf deciduous trees (Fig. 8a) due to the higher sensitivity of broadleaf versus needleleaf photosynthesis (Eq. 2 and Fig. 3). Broadleaf trees and grasses exhibit a greater photosynthetic response than stomatal response (Fig. 8), highlighting the importance of nonstomatal O3 response mechanisms for photosynthesis; e.g., O3 decreases photosynthesis by reducing the mesophyll conductance in observations (Xu et al., 2023).
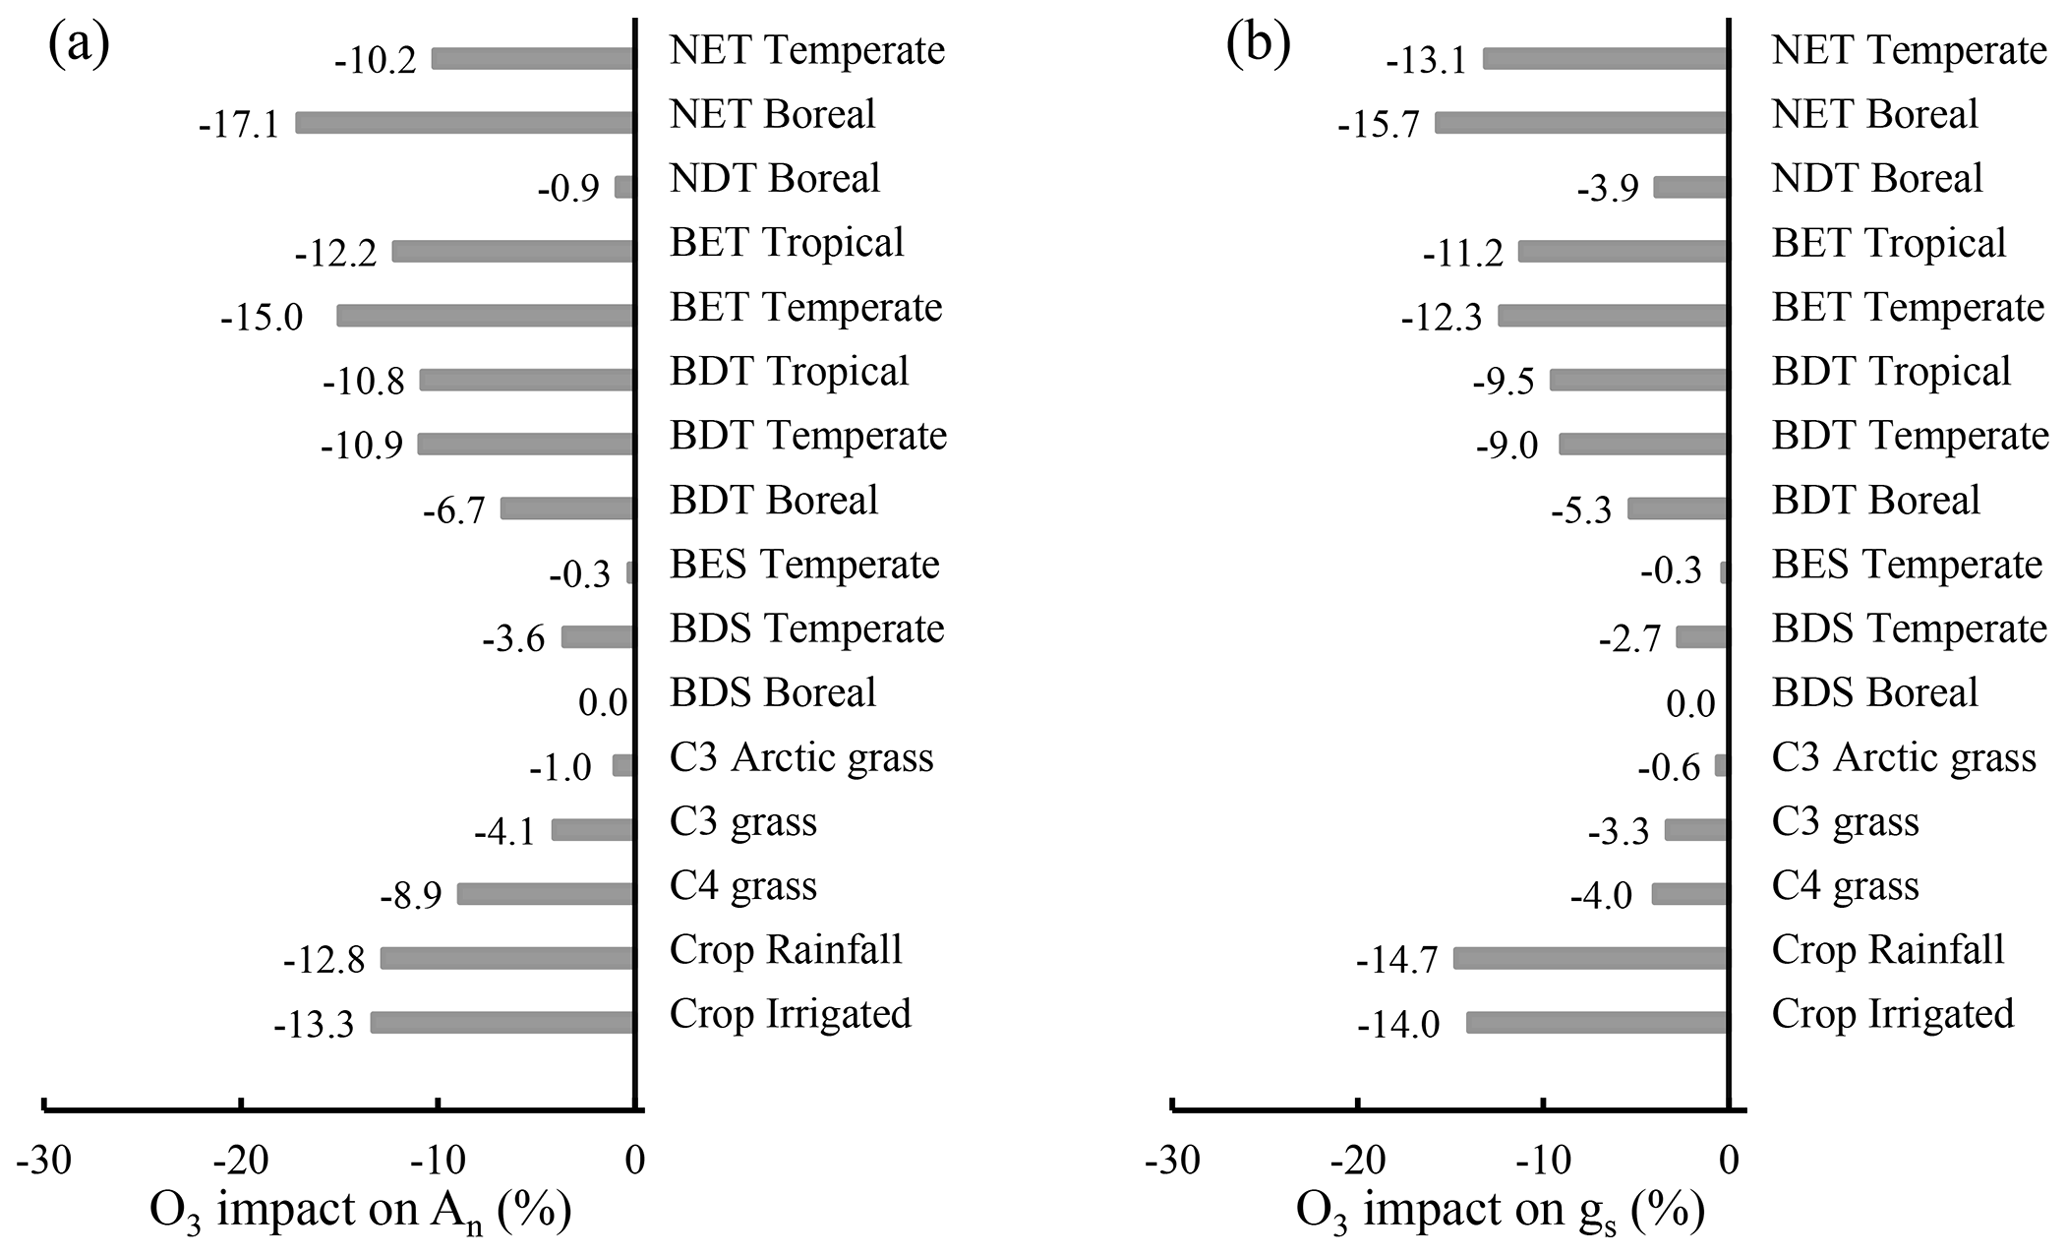
Figure 8Global PFT-level relative impact (%) of 2005–2014 O3 exposure for (a) An and (b) gs, quantified by [(O3-New − O3_OFF) O3_OFF] × 100 %. Abbreviations: T – tree; S – shrub; N – needleleaf; B – broadleaf; E – evergreen; D – deciduous. CLM5 PFTs are used, and their global distribution is shown in Fig. S1.
On the seasonal cycle, the impact of O3 on the seasonal phase of both leaf photosynthetic rate and stomatal conductance is small, shifting the peak month by less than 1 month in most regions (Fig. 9a, b). However, O3 exerts a strong influence on the magnitude of the seasonal cycle (Fig. 9c, d). It decreases the seasonal amplitude of photosynthetic rate in mid- and low-latitude vegetated areas except in evergreen forests (Fig. 9c). For stomatal conductance, the reduction is even greater and more widespread (Fig. 9d). Areas with up to a 50 % reduction in stomatal conductance include eastern North America, Europe, East Asia, South Asia, and tropical savannas in north Africa. This dampening of seasonal variation is mainly due to the partial overlap between the peak periods of photosynthesis and stomatal conductance and the peak period of cumulative O3 uptake, as the latter is influenced by stomatal conductance.
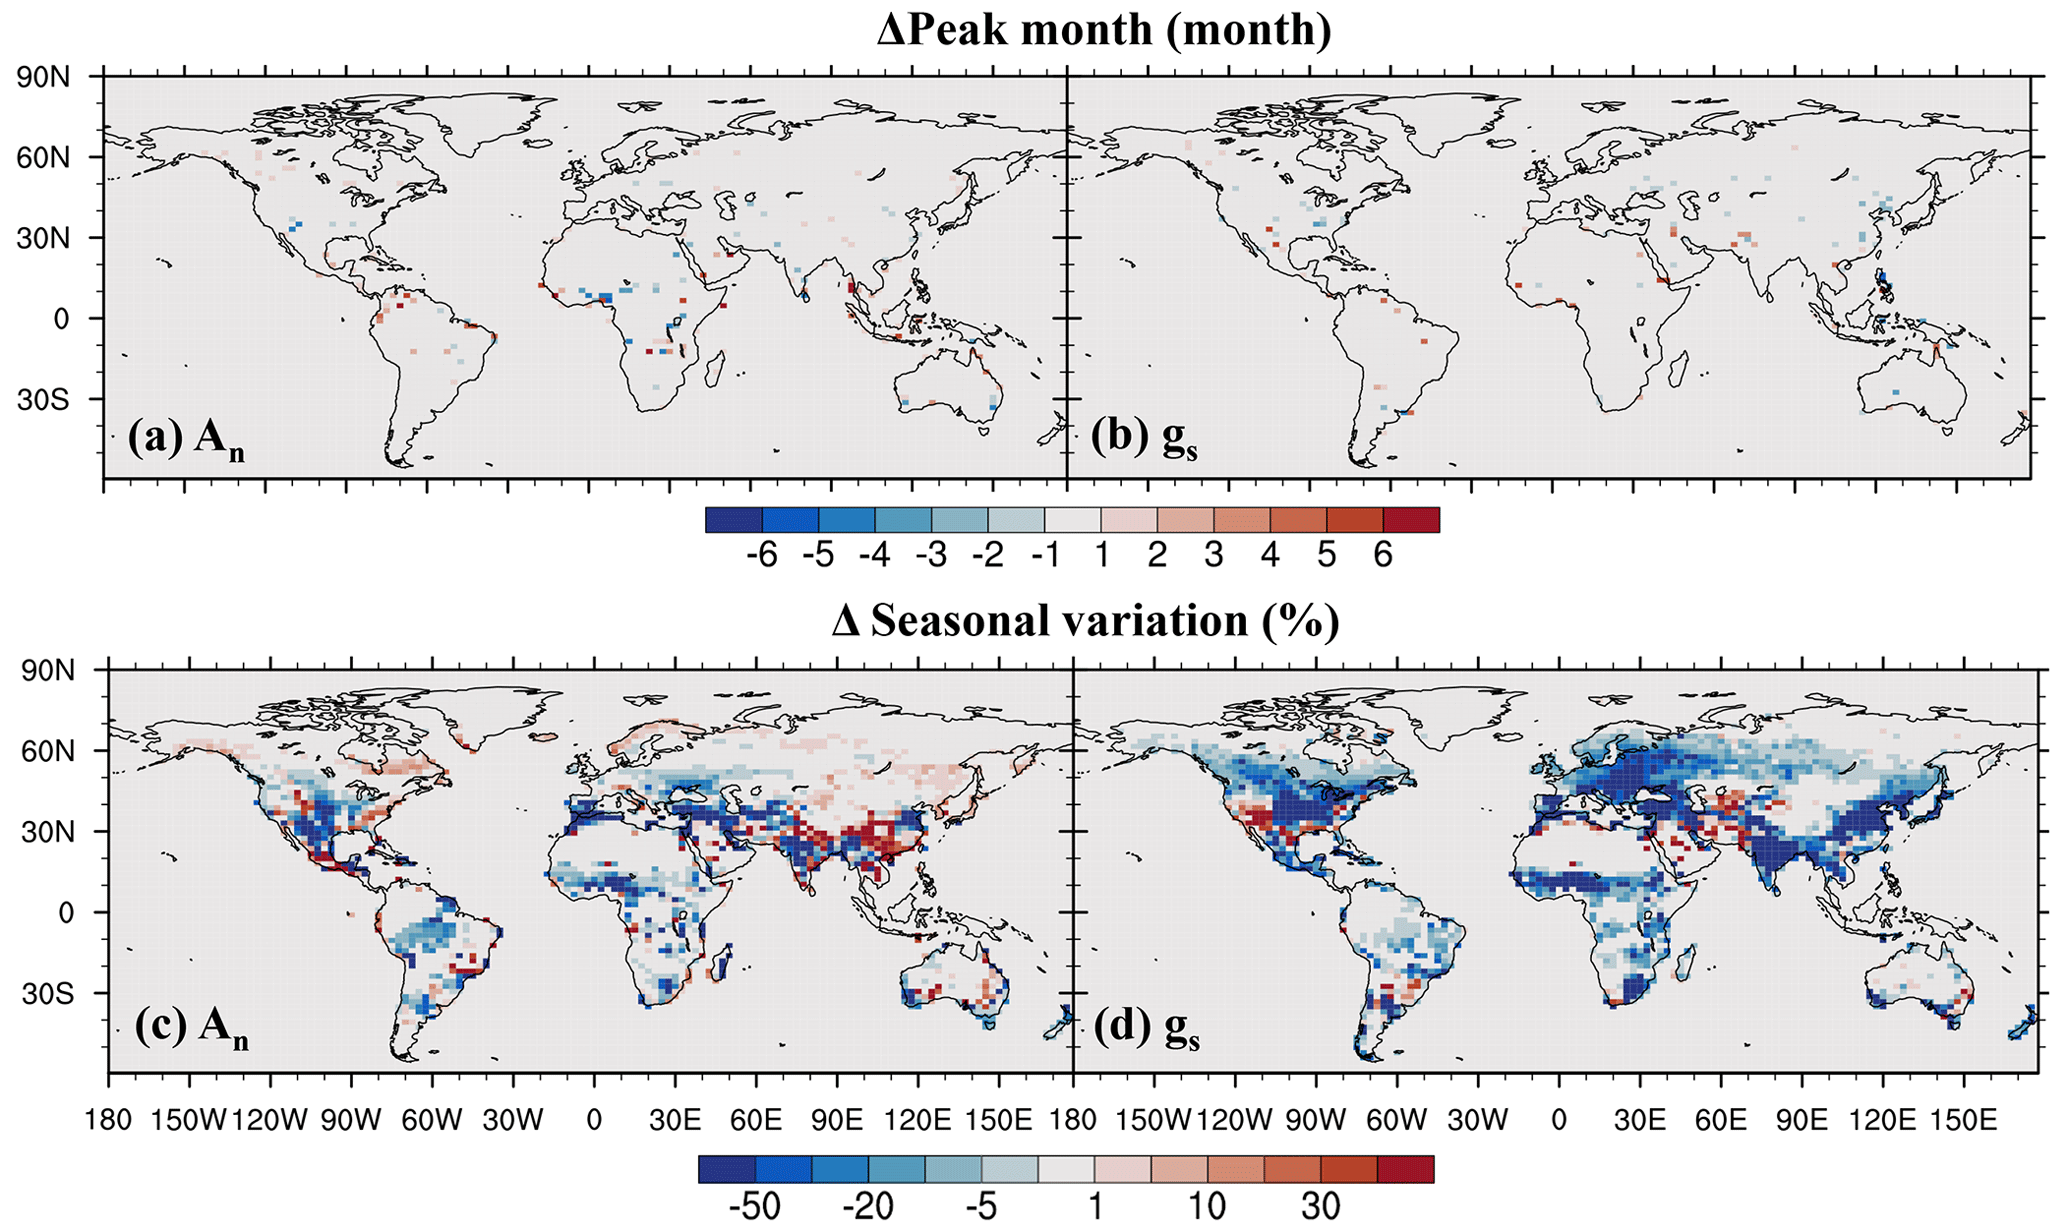
Figure 9O3 impact on (a, b) peak month and (c, d) seasonal amplitude quantified by the coefficient of variation.
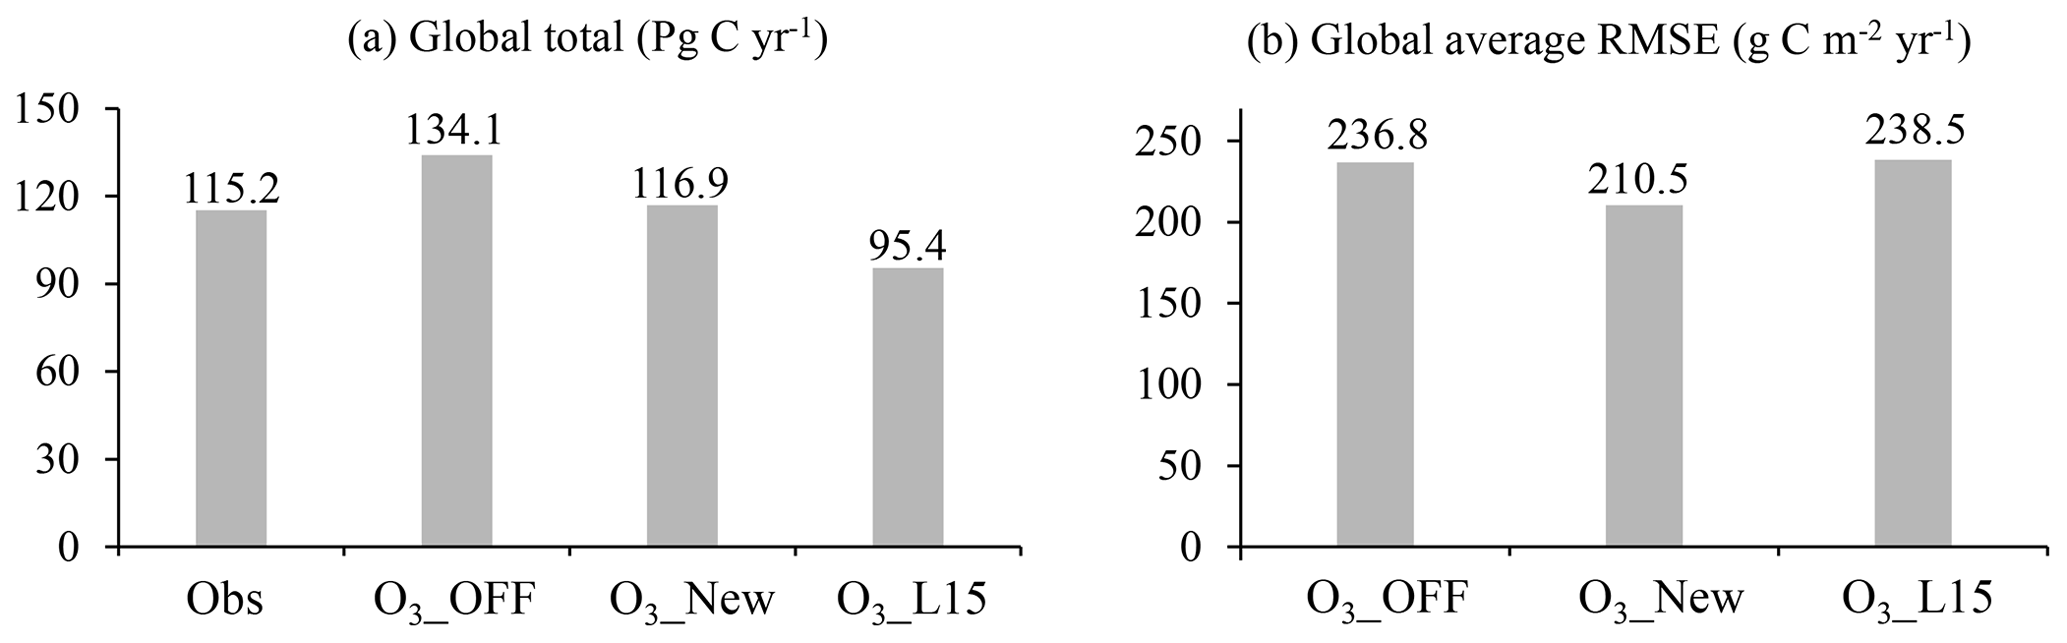
Figure 10The 2005–2014 averaged (a) global total gross primary production (GPP) of FLUXCOM (Obs) and simulations and (b) global land average of root mean square error (RMSE) of GPP between FLUXCOM and simulations.
3.2 Effects on global GPP simulations
O3 plant damage, as quantified using the new scheme, decreases the global GPP from 134.1 to 116.9 Pg C yr−1 (a 12.8 % reduction) for the period 2005 to 2014 (Fig. 10a). The global total GPP simulated with the new scheme aligns closely with the FLUXCOM benchmark (115.2 Pg C yr−1). The global average RMSE between simulations and FLUXCOM is reduced by 11.1 % (Fig. 10b) compared to the simulations without O3 plant damage, justifying the significance of incorporating O3 plant damage into large-scale process-based models.
In comparison, the L15 scheme estimates a very strong O3-induced decrease in GPP, up to 28.9 %, yielding a global GPP estimate (95.4 Pg C yr−1) much lower than the FLUXCOM one (Fig. 10a). Furthermore, the RMSE is 238.5 g C m−2 yr−1, which is close to the value of the simulation without O3 plant damage. The RMSE of the new scheme is 11.7 % lower than that of the L15 scheme, demonstrating the superiority of the new scheme over the L15 scheme (Fig. 10b).
Spatially, incorporating the new scheme improves simulations by reducing the overestimation of GPP over the boreal forest zone around 55° N, tropical savannas, and American croplands (Figs. S2a and S3a–b). It also lessens the underestimation of GPP over Europe, east and west America, South America, African rainforests, East Asia, Southeast Asia, and South Asia in L15 simulations (Figs. S2b and S3b–c).
4.1 The new parameterization scheme
4.1.1 Summary
This study proposes a new parameterization scheme designed to integrate the response of leaf photosynthetic rate and stomatal conductance to O3 exposure into process-based models (e.g., land surface models, DGVMs, GGCMs, or ESMs), enabling regional and global simulations of O3 plant damage and its subsequent influence. The scheme is built using the most comprehensive compilation of observations gathered from the peer-reviewed literature. Functions of flux-based ozone index PODY are found to accurately reproduce the statistically significant linear and nonlinear relationships between PODY and either relative leaf photosynthetic rate or stomatal conductance in observations for needleleaf trees, broadleaf trees, shrubs, grasses, and crops.
4.1.2 Advantages
The new parameterization scheme exhibits obvious advantages over previous parameterization schemes. First, it is built on 4210 paired data points from O3 fumigation experiments, more than 6 times those employed in earlier schemes. We extend data collection from the peer-reviewed literature to December 2022, compared to June 2011 in L15 and before 2004 in Felzer et al. (2004) and S07. The comprehensive dataset enhances the representation of the new scheme and supports the response functions established for shrubs (and grasses), which previously used the observed responses for trees (and crops) in L15 (and S07) due to a lack of observations. Also, the data we compiled are observed photosynthetic and stomatal responses rather than biomass or yield responses which were the foundation of S07. In this way we need not estimate the parameters of photosynthetic and stomatal responses through the inverse method used in S07 to fit the observed yield or biomass response; thereby the response functions and parameters in the new scheme are model- and bias-independent, which enhances the accuracy and applicability.
Second, it accurately reproduces statistically significant linear or nonlinear photosynthetic and stomatal responses to O3 in observations for all the vegetation types, eliminating the need to apply the response function of one vegetation type to another or to use constants. The L15 scheme, which assumes a linear response, could reproduce the observed relationship with PODY for only the crop photosynthetic rate and temperate evergreen tree stomatal conductance. When evaluated with our expanded observations, applying the response function of temperate evergreen tree stomatal conductance to needleleaf trees by L15 is found to be unsupported (Table 3).
The nonlinear functions built for most vegetation types in the new scheme depict a decreasing plant sensitivity with increasing PODY, different from the constant sensitivity implied by linear functions. Our observation dataset aggregates data from diverse plant species into broader vegetation types and demonstrates the decreased sensitivity. This decrease in sensitivity reflects the plant adaptability or a transition from sensitivity to tolerance among plant species naturally (e.g., competition) or anthropogenically (e.g., genetic variation, breeding) in the real world (Fuhrer, 2003; Frei, 2013; Agathokleous et al., 2020). Current global process-based models do not simulate such adaptability and are limited to representing PFTs without differentiation among plant species (Bonan, 2019). The nonlinear response functions we have developed will enable these models to capture the variability in plant ozone tolerance and the shift among plant species for both intra- and inter-PFTs within a vegetation type despite not directly modeling species-level responses.
In addition, the new scheme sets the photosynthetic and stomatal responses as a function of PODY. In contrast to the product of stomatal conductance and AOT40 used in Felzer et al. (2004), PODY has a clear physical interpretation, considering not only high O3 concentrations but also chronic ozone exposure at moderate or low O3 levels. Compared to S07, this scheme provides an optimal representation of O3 plant damage rather than upper and lower response thresholds, aligning with other processes represented in process-based models. Moreover, like L15, our scheme considers the decoupling of stomatal conductance and photosynthetic rate under ozone exposure, an observational fact not accounted for in Felzer et al. (2004) and S07.
4.1.3 Implementation
The new scheme has important potential for both academic research and practical implementation. First, it is important for the development of large-scale process-based models. Although S07 and L15 have been integrated into JULES and CLM (the land components of UKESM and CESM, respectively), they are not active in default runs (Lawrence et al., 2019) partly due to limited representation of observations. Our scheme offers considerable improvements, detailed in Sect. 5.1.2, enabling process-based models to reasonably simulate the observed O3 plant damage. Our results also show that, when using CESM2.2's CLM5, the new scheme reduces global GPP simulation bias by 11.1 % compared to simulations without O3 plant damage and by 11.7 % compared to the old scheme (i.e., L15), underscoring the necessity of incorporating O3 plant damage into large-scale process-based models and the utility of our new scheme.
Second, it can improve our understanding and projection accuracy of the role of O3 plant damage in the Earth system on regional and global scales. Rising O3 is currently a critical environmental issue in the world. Even though many studies quantified its impacts using various models, they mainly focused on GPP, net primary productivity, or a specific region, and their results are highly uncertain. We have already developed a new parameterization scheme in this study. Moving forward, we will comprehensively quantify the influence of O3 plant damage on ecosystems and climate using ESMs equipped with the new scheme, as we did for wildfires, another important form of terrestrial ecosystem disturbance (Li et al., 2014, 2017, 2019, 2022; Jiang et al., 2016; Li and Lawrence, 2017; Lasslop et al., 2020).
In addition, the new scheme aids in establishing an effective model platform to calculate the impact of proposed industrial developments, emissions standards, and land use changes on ecosystems, climate, and socioeconomics, guiding the formulation of effective policies for air quality control, climate mitigation, and biodiversity conservation.
4.1.4 Future development
Even though the new scheme has advantages over earlier schemes, as listed in the previous section, there are still big variations in observations that cannot be explained by our response functions (fitting shown in Figs. 3 and 4). This limitation may introduce uncertainty in modeling carbon and water cycles, yield, biomass, and ecosystem structure and composition in large-scale process-based models, as well as in quantifying the role of ozone plant damage in the Earth system using these models to conduct numerical experiments.
To address the limitation of the new scheme, we propose four potential directions for further development. First, besides the average of a sample (e.g., multiple measurements, measurements on different leaves or different individuals), the observation dataset we compiled contains sample size and standard deviation (SD) or standard error (SE) for most data points. Incorporating the additional information allows us to assign greater weight to data points that are more reliable, such as those with larger sample sizes and/or smaller SD or SE, thereby enhancing the representativeness of the response functions.
Second, this study only tests the commonly used linearizable nonlinear functions. Other two-parameter nonlinear functions may better capture the photosynthetic and stomatal responses.
Third, introducing other explanatory variables may reduce the number of parameters that require estimation. Karlsson et al. (2007) and Bussotti (2008) found that plant sensitivity to O3 was linked to leaf morphological traits like leaf area, thickness, and leaf mass per area (LMA). Feng et al. (2018) further suggested using LMA to unify the response of woody species to O3 and proposed a function of trait-based ozone plant sensitivity. Ma et al. (2023) combined the function with S07, and testing results in a DGVM verified that using a unified sensitivity parameter for all PFTs, along with the observed global LMA map, could yield results similar to those of S07, which uses multiple vegetation-type-dependent parameters. Yet, it is important to consider the inherent simulation uncertainty in the new explanatory variables and their influence, as well as whether the approach works for all vegetation types and species. Furthermore, earlier studies found that environmental factors (e.g., CO2 concentration, nitrogen availability, drought, and temperature) can influence the O3 photosynthetic response through changing POD (e.g., Wittig et al., 2007; Hansen et al., 2019; Xu et al., 2020). These factors may also affect the relationship between POD and O3 photosynthetic response, although there have been no analyses to verify this and identify the underlying mechanisms. Based on our dataset and by collecting data on environmental factors in corresponding experiments, we may be able to investigate this in the future. If the influence exists, introducing environmental factors will improve the fitting.
In addition, conducting PFT, biome, or regional fitting rather than the current broader vegetation type fitting may reduce the unexplained variation in observations. Some researchers strive to further subdivide vegetation or crop types for more accurate fitting (Singh et al., 2023; Guarin et al., 2024). However, the current experimental data for C4 crops and tropical plants are limited and may not adequately support the detailed categorization from the perspective of big data for big ecology. Especially as the variety of vegetation and crop types continues to grow in process-based models, the demand for observations will likely grow.
Our database offers the most comprehensive compilation of observations to date, supporting the above development directions and enabling their evaluation, selection, and integration.
4.2 Global impact assessment using the new scheme
As an application example, we integrate the new scheme into CESM2.2's land component CLM5 to assess the global physiological impact of O3 exposure from 2005 to 2014. This is done by quantifying the difference between simulations with and without O3 plant damage. Our results indicate that present-day O3 exposure leads to an 8.5 % reduction in global leaf photosynthetic rate and a 7.4 % reduction in stomatal conductance, with spatially the largest reduction in eastern and southern Asia, Europe, the eastern United States, and the boreal evergreen forest zone for photosynthesis and in eastern and southern Asia for stomatal conductance. Our results that the O3 influence on photosynthetic rate and stomatal conductance differs at a global scale support the findings of observational analyses that chronic O3 exposure decouples the photosynthetic rate and stomatal conductance partly due to O3 nonstomatal limitation to photosynthesis (Tjoekler et al., 1995; Wittig et al., 2007; Lombardozzi et al., 2012; Kinose et al., 2020).
Our estimates of the O3-induced reduction in global average photosynthetic rate and stomatal conductance are around half of those calculated using the L15 scheme (20.4 % and 13.9 %; Fig. 7). They are also lower than those estimated by Lombardozzi et al. (2013) (21 % and 11 %), which were derived from the average differences between control and O3 fumigation experiments. Lombardozzi et al. (2013) used a smaller dataset than ours, did not differentiate between vegetation or control experiment types, and did not filter out low-confidence data. Furthermore, we estimate an 11.3 % and 10.5 % reduction in photosynthetic rate and stomatal conductance for trees, similar to the 11 % and 13 % estimated by Wittig et al. (2007) based on a meta-analysis of a smaller observational dataset. When examining the effects at the PFT level, we found that crops are most affected, followed by trees, with grasses moderately affected and shrubs the least affected. Ma et al. (2023) also reported that the crops were most affected under the present-day O3 concentration quantified using YIBs with the S07 LMA scheme. The crops that are most sensitive to O3 are also supported by observational analyses of Reich (1987). Interestingly, as far as we know, this study is the first to discover that O3 exposure generally leads to a decrease in seasonal amplitude over most vegetated areas, especially for stomatal conductance, while only causing limited changes in their seasonal pattern.
In addition, using the new scheme, we estimate a global GPP reduction of 12.8 % due to O3, which is less than half of the 28.9 % reduction estimated using L15 in CLM5. The discrepancy arises in L15 using lower flux thresholds Y for broadleaf trees, shrubs, and grasses, as well as functions representing an overall higher sensitivity to O3 for crops, needleleaf trees, and grasses, considering the nighttime O3 uptake, and limiting the impact of leaf fall and emergence to the ozone uptake at a single time step (i.e., UY, t) (see Appendix A). Our estimate is higher than the quantification result of S07 (2 %–5 %; Yue and Unger, 2015) and S07 LMA (4.8 %; Ma et al., 2023) in YIBs but lower than L15 in CLM4.5 (10.8 %) (Lombardozzi et al., 2015) and in CLM5 (28.7 %); the influence of O3 estimates by the new scheme likely lies between S07 and L15 if using the same model platform. The big disparity in the estimated influence of L15 between CLM5 and CLM4.5 suggests the potential benefit of employing multiple process-based models to quantify the uncertainty of O3 influence due to the different stomatal conductance across models which will affect the estimated PODY. For example, including plant hydraulic stress in CLM5 increases stomatal conductance, leading to higher PODY and, thus, higher O3 influence.
4.3 Suggestions to the observational community
Currently, an increasing number of O3 fumigation experiments are exploring the relationship between PODY and the crop yield or biomass of trees and grasses, which is beneficial for IAMs (CLRTAP, 2017). Nevertheless, modeling the dynamic responses of carbon, water, energy, and even climate is crucial for large-scale process-based models and for accurate projections of global change. Therefore, O3 fumigation experiments that quantify the sensitivity of photosynthetic rates and stomatal conductance are still necessary, particularly for C4 crops and tropical plants, which remain underrepresented in observations. Furthermore, this study objectively establishes the optimal flux threshold of Y based on extensive observations rather than arbitrary assignment as in L15 or those based on a small number of observations as in CLRTAP (2017). The flux threshold of Y can serve as a reference for future observational analyses of leaf photosynthetic and stomatal responses. In addition, parameterization schemes (including ours) often assume that the response relationship of a specific plant is the same for shaded and sunlit leaves. The assumptions must be validated or adjusted to a more reasonable ratio based on additional observations.
In the scheme proposed by Lombardozzi et al. (2015, L15) and used in CLM5, the response factor to O3 for photosynthetic rate is
and that for stomatal conductance is
where POD0.8 is the phytotoxic O3 dose over a threshold of 0.8 nmol O3 m−2 s−1 during the growing season (defined as LAI >0.5 m2 m−2). When used in CLM5, the response factors in Eqs. (A1)–(A2) are required to range from 0 to 1 to avoid unwanted outcomes in any scenario. Shrubs used the response functions of trees due to the unavailability of observations, while, for grasses, broadleaf trees, and needleleaf trees, L15 employs the functions of crops, temperate deciduous trees, and temperate evergreen trees, respectively, because significant linear regression functions were not found.
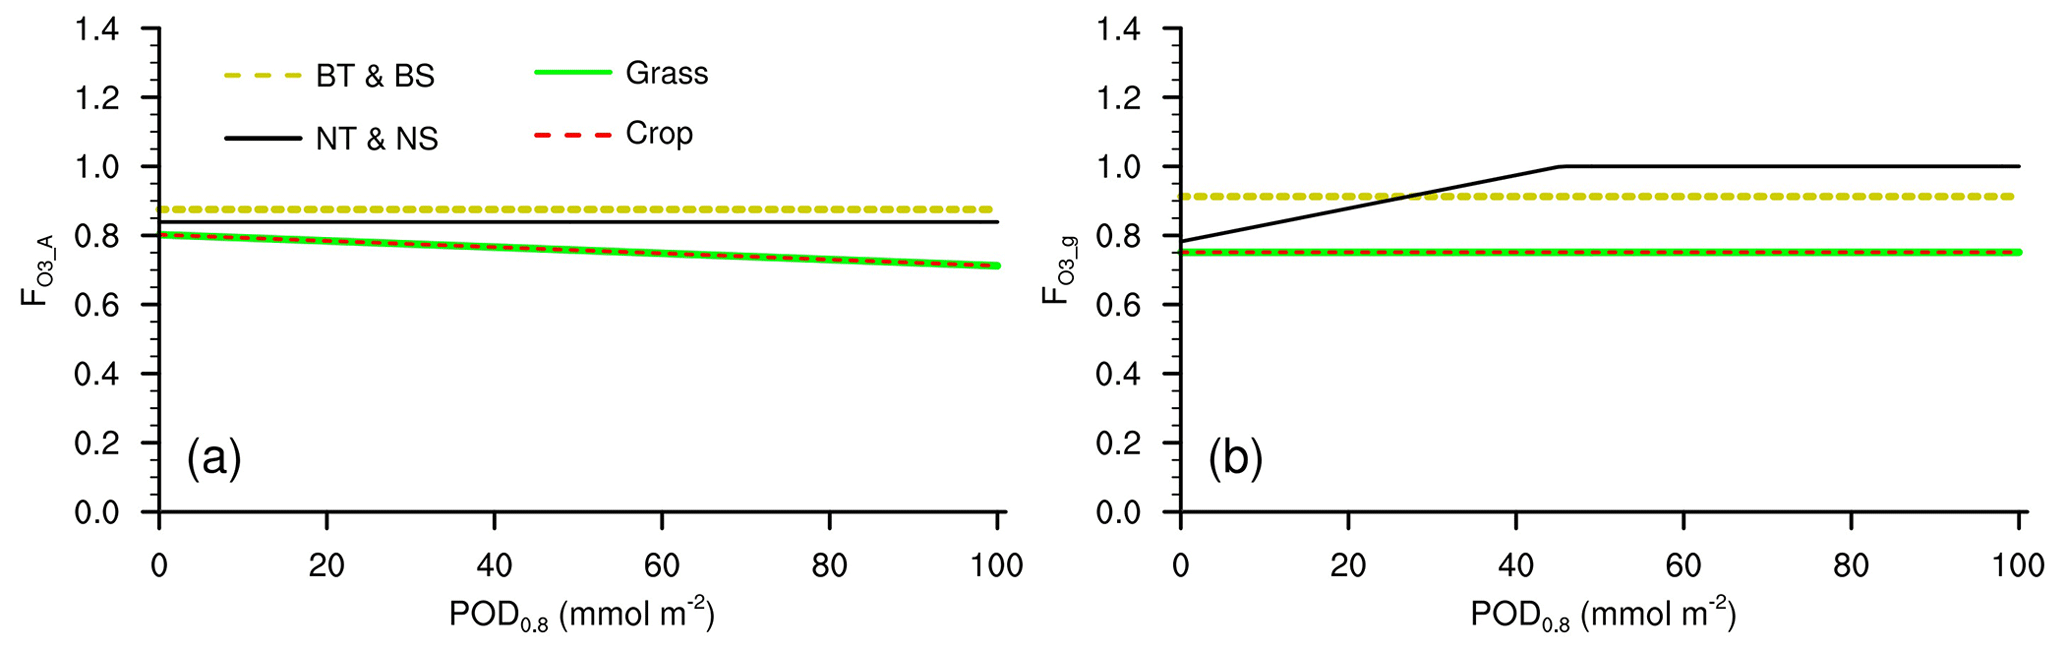
Figure A1Response factors of (a) photosynthetic rate and (b) stomatal conductance to O3 in L15 when used in CLM5. BT: broadleaf tree; BS: broadleaf shrub; NT: needleleaf tree; NS: needleleaf shrub.
The value of POD0.8 at time step t is
In Eq. (A3), the decay factor (0 to 1, unitless) is
where Δt is the time step length and lleaf (year) is the leaf longevity.
The O3 uptake at time step t is calculated using
Here, the instantaneous O3 flux to stomata at time step t, FO3,t (nmol O3 m−2 s−1), is calculated as Eq. (4), and the healing factor H (0 to 1, unitless) is set as
where LAIt−1 and LAIt are leaf area index at time steps t−1 and t, respectively.
The code (including its license) for the new parameterization scheme for modeling ozone-caused damage to vegetation in process-based models is accessible at https://doi.org/10.5281/zenodo.11183913 (Li, 2024a). The input data for ozone concentration, along with the observations and simulations utilized in this study, are available at https://doi.org/10.5281/zenodo.11185196 (Li, 2024b). The code of the Earth system model CESM2.2.0 is archived at https://doi.org/10.5281/zenodo.11229776 (CESM Team, 2024).
The supplement related to this article is available online at: https://doi.org/10.5194/gmd-17-6173-2024-supplement.
FL conceived the research ideas, constructed the new parameterization scheme, developed the model code, and performed the simulations and data analysis. ZZho and FL collected data from the peer-reviewed literature. Data preprocessing was carried out by ZZha, YZ, and FL. FL wrote the manuscript draft. SL, SS, FH, ZF, and PBR reviewed and edited the manuscript.
The contact author has declared that none of the authors has any competing interests.
Publisher's note: Copernicus Publications remains neutral with regard to jurisdictional claims made in the text, published maps, institutional affiliations, or any other geographical representation in this paper. While Copernicus Publications makes every effort to include appropriate place names, the final responsibility lies with the authors.
We are grateful to Danica Lombardozzi, Zhongda Lin, Xu Yue, Dezhen Yin, and Peter Lawrence for their helpful discussions; Huanhuan Sun and Yue Hu for their assistance with data collection and preprocessing; editor Hisashi Sato for helpful suggestions and the time dedicated to handling the paper review process; and the two reviewers for their constructive comments and suggestions. We would also like to acknowledge the National Center for Atmospheric Research (NCAR), principally funded by the US National Science Foundation (NSF) under cooperative agreement no. 1852977, for providing Earth system model CESM2.2 code and input data.
This study is co-supported by the National Natural Science Foundation of China (grant no. 41875137), Guangdong Major Project of Basic and Applied Basic Research (grant no. 2021B0301030007), the National Key Research and Development Program of China (grant no. 2022YFE010650), and the National Key Scientific and Technological Infrastructure project “Earth System Science Numerical Simulator Facility” (EarthLab). Stephen Sitch and Felicity Hayes are supported by the UKRI National Environmental Research Council (grant no. NE/R001812/1). Peter B. Reich is supported by the National Science Foundation: Biology Integration Institutes (grant no. NSF-DBI-2021898).
This paper was edited by Hisashi Sato and reviewed by Ye Liu and one anonymous referee.
Agathokleous, E., Kitao, M., Komatsu, M., Tamai, Y., Saito, H., Harayama, H., Uemura, A., Tobita, H., and Koike, T.: Effects of soil nutrient availability and ozone on container-grown Japanese larch seedlings and role of soil microbes, J. For. Res., 31, 2295–2311, https://doi.org/10.1007/s11676-019-01056-y, 2020.
Ainsworth, E. A., Yendrek, C. R., Sitch, S., Collins, W. J., and Emberson, L. D.: The effects of tropospheric ozone on net primary productivity and implications for climate change, Annu. Rev. Plant Biol., 63, 637–661, https://doi.org/10.1146/Annurev-Arplant-042110-103829, 2012.
Arnold, S. R., Lombardozzi, D., Lamarque, J. F., Richardson, T., Emmons, L. K., Tilmes, S., Sitch, S. A., Folberth, G., Hollaway, M. J., and Martin, M. V.: Simulated global climate response to tropospheric ozone-induced changes in plant transpiration, Geophys. Res. Lett., 45, 13070–13079, https://doi.org/10.1029/2018GL079938, 2018.
Astier, J., Gross, I., and Durner, J.: Nitric oxide production in plants: An update, J. Exp. Bot, 69, 3401–3411, 2017.
Ball, J. T., Woodrow, I. E., and Berry, J. A.: A model predicting stomatal conductance and its contribution to the control of photosynthesis under different environmental conditions, Progress in Photosynthesis Research: volume 4 proceedings of the VIIth international congress on photosynthesis providence, Rhode Island, USA, 10–15 August 1986, 221–224, https://doi.org/10.1007/978-94-017-0519-6_48, 1987.
Bonan, G.: Climate change and terrestrial ecosystem modeling, Cambridge University Press, Cambridge, UK, New York, NY, https://doi.org/10.1017/9781107339217, 2019.
Bussotti, F.: Functional leaf traits, plant communities and acclimation processes in relation to oxidative stress in trees: a critical overview, Glob Change Biol, 14, 2727–2739, https://doi.org/10.1111/j.1365-2486.2008.01677.x, 2008.
CESM Team: CESM-release-cesm2.2.0, Zenodo [code], https://doi.org/10.5281/zenodo.11229776, 2024.
Chameides, W. L., Lindsay, R. W., Richardson, J., and Kiang, C. S.: The role of biogenic hydrocarbons in urban photochemical smog: Atlanta as a case study, Science, 241, 1473–1475, https://doi.org/10.1126/science.3420404, 1988.
Clark, D. B., Mercado, L. M., Sitch, S., Jones, C. D., Gedney, N., Best, M. J., Pryor, M., Rooney, G. G., Essery, R. L. H., Blyth, E., Boucher, O., Harding, R. J., Huntingford, C., and Cox, P. M.: The Joint UK Land Environment Simulator (JULES), model description – Part 2: Carbon fluxes and vegetation dynamics, Geosci. Model Dev., 4, 701–722, https://doi.org/10.5194/gmd-4-701-2011, 2011.
CLRTAP: The UNECE Convention on Long-range Trans-boundary Air Pollution, Manual on Methodologies and Criteria for Modelling and Mapping Critical Loads and Levels and Air Pollution Effects, Risks and Trends: Chapter III Mapping Critical Levels for Vegetation, UNECE, https://icpvegetation.ceh.ac.uk/sites/default/files/Chapter 3 - Mapping critical levels for vegetation.pdf (last access: 30 May 2023), 2017.
Collatz, G. J., Ball, J. T., Grivet, C., and Berry, J. A.: Physiological and environmental regulation of stomatal conductance, photosynthesis, and transpiration: A model that includes a laminar boundary layer, Agric. For. Meteor, 54, 107–136, https://doi.org/10.1016/0168-1923(91)90002-8, 1991.
Collatz, G. J., Ribas-Carbo, M., and Berry, J. A.: Coupled photosynthesis-stomatal conductance model for leaves of C4 plants, Aust. J. Plant Physiol, 19, 519–538, https://doi.org/10.1071/PP9920519, 1992.
Dai, Y., Zeng, X., Dickinson, R. E., Baker, I., Bonan, G. B., Bosilovich, M. G., Denning, A. S., Dirmeyer, P. A., Houser, P. R., Niu, G., Oleson, K. W., Schlosser, C. A., and Yang, Z.: The Common Land Model, B. Am. Meteorol. Soc., 84, 1013–1024, https://doi.org/10.1175/BAMS-84-8-1013, 2003.
Danabasoglu, G., Lamarque, J. F., Bacmeister, J., Bailey, D. A., DuVivier, A. K., Edwards, J., Emmons, L. K., Fasullo, J., Garcia, R., Gettelman, A., Hannay, C., Holland, M. M., Large, W. G., Lauritzen, P. H., Lawrence, D. M., Lenaerts, J. T. M., Lindsay, K., Lipscomb, W. H., Mills, M. J., Neale, R., Oleson, K. W., Otto-Bliesner, B., Phillips, A. S., Sacks, W., Tilmes, S., Van Kampenhout, L., Vertenstein, M., Bertini, A., Dennis, J., Deser, C., Fischer, C., Fox-Kemper, B., Kay, J. E., Kinnison, D., Kushner, P. J., Larson, V. E., Long, M., Mickelson, S., Moore, J. K., Nienhouse, E., Polvani, L., Rasch, P. J., and Strand, W. G.: The Community Earth System Model Version 2 (CESM2), J. Adv. Model. Earth Sy., 12, e2019MS001916, https://doi.org/10.1029/2019MS001916, 2020.
Emberson, L. D., Pleijel, H., Ainsworth, E. A., van den Berg, M., Ren, W., Osborne, S., Mills, G., Pandey, D., Dentener, F., Büker, P., Ewert, F., Koeble, R., and Van Dingenen, R.: Ozone effects on crops and consideration in crop models, Eur. J. Agron., 100, 19–34, https://doi.org/10.1016/j.eja.2018.06.002, 2018.
Farquhar, G. D., Caemmerer, S. V., and Berry, J. A.: A biochemical-model of photosynthetic CO2 assimilation in leaves of C3 Species, Planta, 149, 78–90, https://doi.org/10.1007/Bf00386231, 1980.
Felzer, B., Kicklighter, D., Melillo, J., Wang, C., Zhuang, Q., and Prinn, R.: Effects of ozone on net primary production and carbon sequestration in the conterminous United States using a biogeochemistry model, Tellus B, 56, 230–248, https://doi.org/10.1111/j.1600-0889.2004.00097.x, 2004.
Feng, Z., Agathokleous, E., Yue, X., Oksanen, E., Paoletti, E., Sase, H., Gandin, A., Koike, T., Calatayud, V., Yuan, X., Liu, X., De Marco, A., Jolivet, Y., Kontunen-Soppela, S., Hoshika, Y., Saji, H., Li, P., Li, Z. Z., Watanabe, M., and Kobayashi, K.: Emerging challenges of ozone impacts on asian plants: actions are needed to protect ecosystem health, Ecosyst. Health Sust., 7, 1911602, https://doi.org/10.1080/20964129.2021.1911602, 2021.
Feng, Z. Z., Buker, P., Pleijel, H., Emberson, L., Karlsson, P. E., and Uddling, J.: A unifying explanation for variation in ozone sensitivity among woody plants, Glob. Change Biol., 24, 78–84, https://doi.org/10.1111/gcb.13824, 2018.
Feng, Z. Z., Xu, Y. S., Kobayashi, K., Dai, L. L., Zhang, T. Y., Agathokleous, E., Calatayud, V., Paoletti, E., Mukherjee, A., Agrawal, M., Park, R. J., Oak, Y. J., and Yue, X.: Ozone pollution threatens the pro-duction of major staple crops in East Asia, Nat. Food, 3, 47–56, https://doi.org/10.1038/s43016-021-00422-6, 2022.
Frei, M.: Lignin: Characterization of a multifaceted crop component, Sci. World J., 2013, 436517, https://doi.org/10.1155/2013/436517, 2013.
Fuhrer, J.: Agroecosystem responses to combinations of elevated CO2, ozone, and global climate change, Agric. Ecosyst. Environ. 97, 1–20, https://doi.org/10.1016/S0167-8809(03)00125-7, 2003.
Fuhrer, J., Martin, M. V., Mills, G., Heald, C. L., Harmens, H., Hayes, F., Sharps, K., Bender, J., and Ashmore, M. R.: Current and future ozone risks to global terrestrial biodiversity and ecosystem processes, Ecol. Evol., 6, 8785–8799, https://doi.org/10.1002/ece3.2568, 2016.
Giusti, M.: Convert mass mixing ratio (MMR) to mass concentration or to volume mixing ratio (VMR), CAMS Scientific User Forum, https://confluence.ecmwf.int/pages/viewpage.action?pageId=153391710 (last access: 30 May 2023), 2019.
Gribacheva, N. P. and Gecheva, G. M.: Monitoring ozone effects on vegetation: a review, Ecol. Balk., 2, 217–227, 2019.
Griffiths, P. T., Murray, L. T., Zeng, G., Shin, Y. M., Abraham, N. L., Archibald, A. T., Deushi, M., Emmons, L. K., Galbally, I. E., Hassler, B., Horowitz, L. W., Keeble, J., Liu, J., Moeini, O., Naik, V., O'Connor, F. M., Oshima, N., Tarasick, D., Tilmes, S., Turnock, S. T., Wild, O., Young, P. J., and Zanis, P.: Tropospheric ozone in CMIP6 simulations, Atmos. Chem. Phys., 21, 4187–4218, https://doi.org/10.5194/acp-21-4187-2021, 2021.
Guarin, J. R., Jägermeyr, J., Ainsworth, E. A., Oliveira, F. A. A., Asseng, S., Boote, K., Elliott, J., Emberson, L., Foster, I., Hoogenboom, G., Kelly, D., Ruane, A. C., and Sharps, K.: Modeling the effects of tropospheric ozone on the growth and yield of global staple crops with DSSAT v4.8.0, Geosci. Model Dev., 17, 2547–2567, https://doi.org/10.5194/gmd-17-2547-2024, 2024.
Hansen, E. M. Ø., Hauggaard-Nielsen, H., Launay, M., Rose, P., and Mikkelsen, T. N.: The impact of ozone exposure, temperature and CO2 on the growth and yield of three spring wheat varieties, Environ. Exp. Bot., 168, 103868, https://doi.org/10.1016/j.envexpbot.2019.103868, 2019.
Hasan, M. M., Rahman, M. A., Skalicky, M., Alabdallah, N. M., Waseem, M., Jahan, M. S., Ahammed, G. J., El-Mogy, M. M., Abou El-Yazied, A., Ibrahim, M. F. M., and Fang, X. W.: Ozone induced stomatal regulations, MAPK and phytohormone signaling in plants, Int. J. Mol. Sci., 22, 6304, https://doi.org/10.3390/ijms22126304, 2021.
Hayes, F., Harmens, H., Mills, G., Bender, J., and Grünhage, L.: Ozone critical levels for (semi-)natural vegetation dominated by perennial grassland species, Environ. Sci. Pollut. Res., 28, 15090–15098, https://doi.org/10.1007/s11356-020-11724-w, 2021.
Herbinger, K., Then, C., Haberer, K., Alexou, M., Low, M., Remele, K., Rennenberg, H., Matyssek, R., Grill, D., Wieser, G., and Tausz, M.: Gas exchange and antioxidative compounds in young beech trees under free-air ozone exposure and comparisons to adult trees, Plant Biol., 9, 288–297, https://doi.org/10.1055/s-2006-924660, 2007.
Huang, J.: Meteorological Statistical Analysis and Forecast Methods, 4th Edn., China Meteorological Press, 2016.
Inness, A., Ades, M., Agustí-Panareda, A., Barré, J., Benedictow, A., Blechschmidt, A.-M., Dominguez, J. J., Engelen, R., Eskes, H., Flemming, J., Huijnen, V., Jones, L., Kipling, Z., Massart, S., Parrington, M., Peuch, V.-H., Razinger, M., Remy, S., Schulz, M., and Suttie, M.: The CAMS reanalysis of atmospheric composition, Atmos. Chem. Phys., 19, 3515–3556, https://doi.org/10.5194/acp-19-3515-2019, 2019.
Ji, D., Wang, L., Feng, J., Wu, Q., Cheng, H., Zhang, Q., Yang, J., Dong, W., Dai, Y., Gong, D., Zhang, R.-H., Wang, X., Liu, J., Moore, J. C., Chen, D., and Zhou, M.: Description and basic evaluation of Beijing Normal University Earth System Model (BNU-ESM) version 1, Geosci. Model Dev., 7, 2039–2064, https://doi.org/10.5194/gmd-7-2039-2014, 2014.
Jiang, Y., Lu, Z., Liu, X., Qian, Y., Zhang, K., Wang, Y., and Yang, X.-Q.: Impacts of global open-fire aerosols on direct radiative, cloud and surface-albedo effects simulated with CAM5, Atmos. Chem. Phys., 16, 14805–14824, https://doi.org/10.5194/acp-16-14805-2016, 2016.
Jung, M., Schwalm, C., Migliavacca, M., Walther, S., Camps-Valls, G., Koirala, S., Anthoni, P., Besnard, S., Bodesheim, P., Carvalhais, N., Chevallier, F., Gans, F., Goll, D. S., Haverd, V., Köhler, P., Ichii, K., Jain, A. K., Liu, J., Lombardozzi, D., Nabel, J. E. M. S., Nelson, J. A., O'Sullivan, M., Pallandt, M., Papale, D., Peters, W., Pongratz, J., Rödenbeck, C., Sitch, S., Tramontana, G., Walker, A., Weber, U., and Reichstein, M.: Scaling carbon fluxes from eddy covariance sites to globe: synthesis and evaluation of the FLUXCOM approach, Biogeosciences, 17, 1343–1365, https://doi.org/10.5194/bg-17-1343-2020, 2020.
Kangasjärvi, J, Jaspers, P., and Kollist, H.: Signalling and cell death in ozone-exposed plants, Plant Cell Environ., 28, 1021–1036, https://doi.org/10.1111/j.1365-3040.2005.01325.x, 2005.
Karlsson, P. E., Uddling, J., Braun, S., Broadmeadow, M., Elvira, S., Gimeno, B. S., Le Thiec, D., Oksanen, E., Vandermeiren, K., Wilkinson, M., and Emberson, L.: New critical levels for ozone effects on young trees based on AOT40 and simulated cumulative leaf uptake of ozone, Atmos. Environ., 38, 2283–2294, https://doi.org/10.1016/j.atmosenv.2004.01.027, 2004.
Karlsson, P. E., Braun, S., Broadmeadow, M., Elvira, S., Emberson, L., Gimeno, B. S., Le Thiec, D., Novak, K., Oksanen, E., Schaub, M., Uddling, J., and Wilkinson, M.: Risk assessments for forest trees: The performance of the ozone ?ux versus the AOT concepts, Environ. Pollut., 146, 608–616, https://doi.org/10.1016/j.envpol.2006.06.012, 2007.
Kinose, Y., Fukamachi, Y., Watanabe, M., and Izuta, T.: Ozone-induced change in the relationship between stomatal conductance and net photosynthetic rate is a factor determining cumulative stomatal ozone uptake by Fagus crenata seedlings, Trees, 34, 445–454, https://doi.org/10.1007/s00468-019-01927-1, 2020.
Lasslop, G., Hantson, S., Harrison, S. P., Bachelet, D., Burton, C., Forkel, M., Forrest, M., Li F., Melton, J. R., Yue, C., Archibald, S., Scheiter, S., Arneth, A., Hickler, T., and Sitch, S.: Global ecosystems and fire: Multi-model assessment of fire-induced tree-cover and carbon storage reduction, Glob. Change Biol., 26, 5027–5041, https://doi.org/10.1111/gcb.15160, 2020.
Lawrence, D. M., Fisher, R. A., Koven, C. D., Oleson, K. W., Swenson, S. C., Bonan, G., Collier, N., Ghimire, B., van Kampenhout, L., Kennedy, D., Kluzek, E., Lawrence, P. J., Li, F., Li, H., Lombardozzi, D., Riley, W. J., Sacks, W. J., Shi, M., Vertenstein, M., Wieder, W. R., Xu, C, Ali, A. A., Badger, A. M., Bisht, G., van den Broeke, M., Brunke, M. A., Burns, S. P., Buzan, J., Clark, M., Craig, A., Dahlin, K., Drewniak, B., Fisher, J. B., Flanner, M., Fox, A. M., Gentine, P., Hoffman, F., Keppel-Aleks, G., Knox, R., Kumar, S., Lenaerts, J., Leung, R., Lipscomb, W. H., Lu, Y., Pandey, A., Pelletier, J. D., Perket, J., Randerson, J. T., Ricciuto, D. M., Sanderson, B. M., Slater, A., Subin, Z. M., Tang, J., Thomas, R. Q., Martin, M. V., and Zeng, X.: The Community Land Model version 5: Description of new features, benchmarking, and impact of forcing uncertainty, J. Adv. Model. Earth Sy., 11, 4245–4287, https://doi.org/10.1029/2018MS001583, 2019.
Levis, S., Bonan, G. B., Vertenstein, M., and Oleson, K. W.: The Community Land Model's Dynamic Global Vegetation Model (CLM-DGVM): Technical description and user's guide, NCAR Tech. Note TN-459 IA, Terrestrial Sciences Section, Boulder, Colorado, 2004.
Li, F.: New parameterization scheme for modeling ozone-caused damage to vegetation in process-based models: code, Zenodo [code], https://doi.org/10.5281/zenodo.11183913, 2024a.
Li, F.: New parameterization scheme for modeling ozone-caused damage to vegetation in process-based models; data, Zenodo [data set], https://doi.org/10.5281/zenodo.11185196, 2024b.
Li, F. and Lawrence, D. M.: Role of fire in the global land water budget during the twentieth century due to changing ecosystems, J. Climate, 30, 1893–1908, https://doi.org/10.1175/JCLI-D-16-0460.1, 2017.
Li, F., Bond-Lamberty, B., and Levis, S.: Quantifying the role of fire in the Earth system – Part 2: Impact on the net carbon balance of global terrestrial ecosystems for the 20th century, Biogeosciences, 11, 1345–1360, https://doi.org/10.5194/bg-11-1345-2014, 2014.
Li, F., Lawrence, D. M., and Bond-Lamberty B.: Impact of fire on global land surface air temperature and energy budget for the 20th century due to changes within ecosystems, Environ. Res. Lett., 12, 044014, https://doi.org/10.1088/1748-9326/aa6685, 2017.
Li, F., Val Martin, M., Andreae, M. O., Arneth, A., Hantson, S., Kaiser, J. W., Lasslop, G., Yue, C., Bachelet, D., Forrest, M., Kluzek, E., Liu, X., Mangeon, S., Melton, J. R., Ward, D. S., Darmenov, A., Hickler, T., Ichoku, C., Magi, B. I., Sitch, S., van der Werf, G. R., Wiedinmyer, C., and Rabin, S. S.: Historical (1700–2012) global multi-model estimates of the fire emissions from the Fire Modeling Intercomparison Project (FireMIP), Atmos. Chem. Phys., 19, 12545–12567, https://doi.org/10.5194/acp-19-12545-2019, 2019.
Li, F., Lawrence, D. M., Jiang, Y., Liu, X., and Lin, Z.: Fire aerosols slow down the global water cycle, J. Climate, 35, 3619–3633, https://doi.org/10.1175/JCLI-D-21-0817.1, 2022.
Lombardozzi, D., Sparks, J. P., Bonan, G., and Levis, S.: Ozone exposure causes a decoupling of conductance and photosynthesis: Implications for the ball-berry stomatal conductance model, Oecologia, 169, 651–659, https://doi.org/10.1007/s00442-011-2242-3, 2012.
Lombardozzi, D., Sparks, J. P., and Bonan, G.: Integrating O3 influences on terrestrial processes: photosynthetic and stomatal response data available for regional and global modeling, Biogeosciences, 10, 6815–6831, https://doi.org/10.5194/bg-10-6815-2013, 2013.
Lombardozzi, D., Levis, S., Bonan, G., Hess, P. G., and Sparks, J. P.: The Influence of chronic ozone exposure on global carbon and water cycles, J. Climate, 28, 292–305, https://doi.org/10.1175/Jcli-D-14-00223.1, 2015.
Ma, Y., Yue, X., Sitch, S., Unger, N., Uddling, J., Mercado, L. M., Gong, C., Feng, Z., Yang, H., Zhou, H., Tian, C., Cao, Y., Lei, Y., Cheesman, A. W., Xu, Y., and Duran Rojas, M. C.: Implementation of trait-based ozone plant sensitivity in the Yale Interactive terrestrial Biosphere model v1.0 to assess global vegetation damage, Geosci. Model Dev., 16, 2261–2276, https://doi.org/10.5194/gmd-16-2261-2023, 2023.
Val Martin, M., Heald, C. L., and Arnold, S. R.: Coupling dry deposition to vegetation phenology in the Community Earth System Model: Implications for the simulation of surface O3, Geophys. Res. Lett., 41, 2988–2996, https://doi.org/10.1002/2014GL059651, 2014.
Massman, W. J.: A review of the molecular diffusivities of H2O, CO2, CH4, CO, O3, SO2, NH3, N2O, NO, and NO2 in air, O2 and N2 near STP, Atmos. Environ., 32, 1111–1127, https://doi.org/10.1016/S1352-2310(97)00391-9, 1998.
Medlyn, B. E., Duursma, R. A., Eamus, D., Ellsworth, D. S., Prentice, I. C., Barton, C. V. M., Crous, K. Y., De Angelis, P., Freeman, M., and Wingate, L.: Reconciling the optimal and empirical approaches to modelling stomatal conductance, Glob. Change Biol., 17, 2134–2144, https://doi.org/10.1111/j.1365-2486.2010.02375.x, 2011.
Mills, G., Wagg, S., and Harmens, H.: Ozone pollution: Impacts on ecosystem services and biodiversity, ICP Vegetation Programme Coordination Centre, Centre for Ecology and Hydrology, Bangor, UK, 2013.
Oliver, R. J., Mercado, L. M., Sitch, S., Simpson, D., Medlyn, B. E., Lin, Y.-S., and Folberth, G. A.: Large but decreasing effect of ozone on the European carbon sink, Biogeosciences, 15, 4245–4269, https://doi.org/10.5194/bg-15-4245-2018, 2018.
Ollinger, S. V., Aber, J. D., and Reich, P. B.: Simulating Ozone Effects on Forest Productivity: Interactions among Leaf-, Canopy-, and Stand-Level Processes, Ecol. Appl., 7, 1237–1251, https://doi.org/10.2307/2641211, 1997.
Ollinger, S. V., Aber, J. D., Reich, P. B., and Freuder, R. J.: Interactive effects of nitrogen deposition, tropospheric ozone, elevated CO2 and land use history on the carbon dynamics of northern hard-wood forests, Glob. Change Biol., 8, 545–562, https://doi.org/10.1046/j.1365-2486.2002.00482.x, 2002.
Pei, Z. M., Murata, Y., Benning, G., Thomine, S., Klüsener, B., Allen, G. J., Grill, E., and Schroeder, J. I.: Calcium channels activated by hydrogen peroxide mediate abscisic acid signalling in guard cells, Nature, 406, 731–734, https://doi.org/10.1038/35021067, 2000.
Pleijel, H., Danielsson, H., Ojanperä, K., De Temmerman, L., Högy, P., Badiani, M., and Karlsson, P. E.: Relationships between ozone exposure and yield loss in European wheat and potato – a comparison of concentration- and flux-based exposure indices, Atmos. Environ., 38, 2259–2269, https://doi.org/10.1016/j.atmosenv.2003.09.076, 2004.
Pleijel, H., Danielsson, H., and Broberg, M. C.: Benefits of the Phytotoxic Ozone Dose (POD) index in dose-response functions for wheat yield loss, Atmos. Environ., 268, 118797, https://doi.org/10.1016/j.atmosenv.2021.118797, 2022.
Reich, P. B.: Quantifying plant response to ozone: a unifying theory, Tree Physiol., 3, 63–91, https://doi.org/10.1093/treephys/3.1.63, 1987.
Reichman, O. J., Jones, M. B., and Schildhauer, M. P.: Challenges and opportunities of open data in ecology, Science, 331, 703–705, https://doi.org/10.1126/science.1197962, 2011.
Ren, W., Tian, H. Q., Liu, M. L., Zhang, C., Chen, G. S., Pan, S. F., Felzer, B., and Xu, X. F.: Effects of tropospheric ozone pollution on net primary productivity and carbon storage in terrestrial ecosystems of China, J. Geophys. Res.-Atmos., 112, D22S09, https://doi.org/10.1029/2007JD008521, 2007.
Sadiq, M., Tai, A. P. K., Lombardozzi, D., and Val Martin, M.: Effects of ozone–vegetation coupling on surface ozone air quality via biogeochemical and meteorological feedbacks, Atmos. Chem. Phys., 17, 3055–3066, https://doi.org/10.5194/acp-17-3055-2017, 2017.
Sharps, K., Vieno, M., Beck, R., Hayes, F., Harmens, H.: Quantifying the impact of ozone on crops in Sub-Saharan Africa demonstrates regional and local hotspots of production loss. Environ, Sci. Pollut. Res., 28, 62338–62352, https://doi.org/10.1007/s11356-021-14967-3, 2021.
Singh, J., Lombardozzi, D., Xia, L., and Robock, A., and Lerdau, M.: Evaluating impact of tropospheric ozone on plants with improved ozone damage parameterization in CLM5, CESM workshop 2023, Boulder, CO, USA, 13–14, June, https://files.cesm.ucar.edu/events/workshops/2023/3/2023-cesm-bgcwg-jyoti-singh.pdf (last access: 30 July 2023), 2023.
Sitch, S., Smith, B., Prentice, I. C., Arneth, A., Bondeau, A., Cramer, W., Kaplan, J. O., Levis, S., Lucht, W., and Sykes, M. T.: Evaluation of ecosystem dynamics, plant geography and terrestrial carbon cycling in the LPJ dynamic global vegetation model, Glob. Change Biol., 9, 161–185, 2003.
Sitch, S., Cox, P. M., Collins, W. J., and Huntingford, C.: Indirect radiative forcing of climate change through ozone effects on the land-carbon sink, Nature, 448, 791–794, https://doi.org/10.1038/Nature06059, 2007.
Song, X., Wang, D. Y., Li, F., and Zeng, X. D.: Evaluating the performance of CMIP6 Earth system models in simulating global vegetation structure and distribution, Adv. Clim. Chang. Res., 12, 584–595, https://doi.org/10.1016/j.accre.2021.11.003, 2021.
Soranno, P. A. and Schimel, D. S.: Macrosystems ecology: big data, big ecology, Front. Ecol. Environ., 12, 3, https://doi.org/10.1890/1540-9295-12.1.3, 2014.
Szopa, S., Naik, V., Adhikary, B., Artaxo, P., Berntsen, T., Collins, W. D., Fuzzi, S., Gallardo, L., Kiendler Scharr, A. Z., Klimont, H., Liao, N., and Unger, P. Z.: Short-Lived Climate Forcers, in Climate Change 2021: The Physical Science Basis. Contribution of Working Group I to the Sixth Assessment Report of the Intergovernmental Panel on Climate Change, Cambridge University Press, 2021.
Tai, A. P. K., Martin, M. V., and Heald, C. L.: Threat to future global food security from climate change and ozone air pollution, Nat. Clim. Change, 4, 817–821, https://doi.org/10.1038/nclimate2317, 2014.
Tai, A. P. K., Sadiq, M., Pang, J. Y. S., Yung, D. H. Y., and Feng, Z.: Impacts of Surface Ozone Pollution on Global Crop Yields: Comparing Different Ozone Exposure Metrics and Incorporating Co-effects of CO2, Front. Sustain. Food Syst., 5, 534616, https://doi.org/10.3389/fsufs.2021.534616, 2021.
Tarasick, D., Galbally, I. E., Cooper, O. R., Schultz, M. G., Ancellet, G., Leblanc, T., Wallington, T. J., Ziemke, J. R., Liu, X., Steinbacher, M., Staehelin, J., Vigouroux, C., Hannigan, J. W., García, O., Foret, G., Zanis, P., Weatherhead, E., Petropavlovskikh, I., Worden, H. M., Osman, M., Liu, J. J., Chang, K.-L., Gaudel, A., Lin, M., Granados-Muñoz, M., Thompson, A. M., Oltmans, S. J., Cuesta, J., Dufour, G., Thouret, V., Hassler, B., Trickl, T., and Neu, J. L.: Tropospheric Ozone Assessment Report: Tropospheric ozone from 1877 to 2016, observed levels, trends and uncertainties, Elementa, 7, 39, https://doi.org/10.1525/elementa.376, 2019.
Tian, H. Q., Liu, M. L., Zhang, C., Ren, W., Xu, X. F., Chen, G. S., Lu, C. Q., and Tao, B.: The Dynamic Land Ecosystem Model (DLEM) for simulating terrestrial processes and interactions in the context of multifactor global change, Acta Geographica Sinica, 65, 1027–1047, 2010.
Tjoelker, M. G., Volin, J. C., Oleksyn, J., and Reich, P. B.: Interaction of ozone pollution and light effects on photosynthesis in a forest canopy experiment, Plant Cell Environ., 18, 895–905, https://doi.org/10.1111/j.1365-3040.1995.tb00598.x, 1995.
Tran, D., El-Maarouf-Bouteau, H., Rossi, M., Biligui, B., Briand, J., Kawano, T., Mancuso, S., and Bouteau, F.: Post-transcriptional regulation of GORK channels by superoxide anion contributes to increases in outward-rectifying K+ currents, New Phytol., 198, 1039–1048, https://doi.org/10.1111/nph.12226, 2013.
Turnock, S. T., Allen, R. J., Andrews, M., Bauer, S. E., Deushi, M., Emmons, L., Good, P., Horowitz, L., John, J. G., Michou, M., Nabat, P., Naik, V., Neubauer, D., O'Connor, F. M., Olivié, D., Oshima, N., Schulz, M., Sellar, A., Shim, S., Takemura, T., Tilmes, S., Tsigaridis, K., Wu, T., and Zhang, J.: Historical and future changes in air pollutants from CMIP6 models, Atmos. Chem. Phys., 20, 14547–14579, https://doi.org/10.5194/acp-20-14547-2020, 2020.
Unger, N., Zheng, Y. Q., Yue, X., and Harper, K. L.: Mitigation of ozone damage to the world's land ecosystems by source sector, Nat. Clim. Change, 10, 134–137, https://doi.org/10.1038/s41558-019-0678-3, 2020.
Wilkinson, S. and Davies, J. W.: Drought, ozone, ABA and ethylene: new insights from cell to plant to community, Plant Cell Environ., 33, 510–525, https://doi.org/10.1111/j.1365-3040.2009.02052.x, 2010.
Wittig, V. E., Ainsworth, E. A., and Long, S. P.: To what extent do current and projected increases in surface ozone affect photosynthesis and stomatal conductance of trees? A meta-analytic review of the last 3 decades of experiments, Plant Cell Environ., 30, 1150–1162, https://doi.org/10.1111/j.1365-3040.2007.01717.x, 2007.
Xu, Y., Shang, B., Feng, Z., and Tarvainen, L.: Effect of elevated ozone, nitrogen availability and mesophyll conductance on the temperature responses of leaf photosynthetic parameters in poplar, Tree Physiol., 40, 484–497, https://doi.org/10.1093/treephys/tpaa007, 2020.
Xu, Y., Feng, Z., and Peng, J.: Variations in leaf anatomical characteristics drive the decrease of mesophyll conductance in poplar under elevated ozone, Glob. Change Biol., 29, 2804–2823, https://doi.org/10.1111/gcb.16621, 2023.
Yue, X. and Unger, N.: The Yale Interactive terrestrial Biosphere model version 1.0: description, evaluation and implementation into NASA GISS ModelE2, Geosci. Model Dev., 8, 2399–2417, https://doi.org/10.5194/gmd-8-2399-2015, 2015.
Zeng, X., Li, F., and Song, X.: Development of the IAP Dynamic Global Vegetation Model, Adv. Atmos. Sci., 31, 505–514, https://doi.org/10.1007/s00376-013-3155-3, 2014.
Zhang, H., Liu, D., Dong, W., Cai, W., and Yuan, W.: Accurate representation of leaf longevity is important for simulating ecosystem carbon cycle, Basic Appl. Ecol., 17, 396–407, 2016.
Zhou, Z., Li, F., Zeng, X., and Ni, C.: The research progress in impacts of tropospheric ozone on vegetation: Observations, parameterization, and application, Clim. Environ. Res., 22, 613–622, https://doi.org/10.3878/j.issn.1006-9585.2017.16215, 2017.
Zhu, J., Tai, A. P. K., and Hung Lam Yim, S.: Effects of ozone–vegetation interactions on meteorology and air quality in China using a two-way coupled land–atmosphere model, Atmos. Chem. Phys., 22, 765–782, https://doi.org/10.5194/acp-22-765-2022, 2022.