the Creative Commons Attribution 4.0 License.
the Creative Commons Attribution 4.0 License.
 | 25 Jan 2024
A simple and realistic aerosol emission approach for use in the Thompson–Eidhammer microphysics scheme in the NOAA UFS Weather Model (version GSL global-24Feb2022)
Georg A. Grell
Ravan Ahmadov
Shan Sun
Jordan Schnell
Ning Wang
A physics suite under development at NOAA's Global Systems Laboratory (GSL) includes the aerosol-aware double-moment Thompson–Eidhammer microphysics (TH-E MP) scheme. This microphysics scheme uses two aerosol variables (concentrations of water-friendly aerosol (WFA) and ice-friendly aerosol (IFA) numbers) to include interactions with some of the physical processes. In the original implementation, WFA and IFA depended on emissions derived from climatologies. In our approach, using the Common Community Physics Package (CCPP), we embedded modules of sea-salt emissions, dust emissions, and biomass-burning emissions, as well as of anthropogenic aerosol emissions, into the Unified Forecast System (UFS) to provide realistic aerosol emissions for these two variables. This represents a very simple approach with no additional tracer variables and therefore very limited additional computing cost. We then evaluated a comparison of simulations using the original TH-E MP approach, which derives the two aerosol variables using empirical emission formulas from climatologies (CTL) and simulations that use the online emissions (EXP). Aerosol optical depth (AOD) was derived from the two variables and appears quite realistic in the runs with online emissions when compared to analyzed fields. We found less resolved precipitation over Europe and North America from the EXP run, which represents an improvement compared to observations. Also interesting are moderately increased aerosol concentrations over the Southern Ocean from the EXP run, which invigorate the development of cloud water and enhance the resolved precipitation in those areas. This study shows that a more realistic representation of aerosol emissions may be useful when using double-moment microphysics schemes.
- Article
(15340 KB) - Full-text XML
- BibTeX
- EndNote


The abundant aerosols in the atmosphere are able to influence both weather and climate through cloud formation and precipitation. Changes in cloud drop size and cloud drop number have impacts on cloud albedo, energy budget (Twomey, 1977), hydrometeor content, cloud cover, and cloud lifetime (Albrecht, 1989), and they can further suppress or enhance precipitation (Baklanov et al., 2014). Aerosol interaction with clouds – because of its impact on radiation, termed the indirect effect – still represents a large uncertainty for global climate forcing. Although there have been literally hundreds of papers looking into the effect of aerosols on clouds and precipitation, the science is still not settled for sure, and it still needs to be investigated (Tao et al., 2012).
In recent decades, numerous studies have been conducted to research this effect with numerical models. Hoffmann and Feingold (2021) coupled a Lagrangian cloud model to a parcel model and a large-eddy simulation model to study the marine stratocumulus. They found that the selection of seeded particle-size distribution is essential to the successful simulation of marine cloud brightening and that its efficacy is significantly affected by microphysical processes. Conrick et al. (2021) evaluated the influences of wildfire smoke and cloud microphysics during a Pacific Northwest wildfire case. They found that thermodynamic change due to smoke is the primary driver of enhanced cloud lifetime during wildfire events, even more so than the microphysical impact on clouds, which is the secondary contributing factor, and also pointed out that both the thermodynamic and microphysical effects are necessary. Kang et al. (2019) coupled a simplified chemistry package into the Global/Regional Integrated Model system (GRIMs; Hong et al., 2013) and converted the soluble chemical species to the cloud condensation nuclei (CCN) for the cloud precipitation physics. When coupling with the simplified chemistry package, the cloud water increases and results in a decrease in surface downward shortwave radiation, but the precipitation response to aerosol is not monotonic. Zhao et al. (2021) introduced the marine organic aerosol (MOA) as a new aerosol into the Community Atmosphere Model version 6 (CAM6), and they also implemented the MOA for droplet activation and ice nucleation. In their study the marine ice-nucleating particles are dominant below 400 hPa over the Southern Ocean and Arctic boundary layer. Over the Southern Ocean, the shortwave cloud forcing is reduced in the austral summer, and the longwave cloud forcing is enhanced in the austral winter when MOA acts as CCN and ice-nucleating particles, respectively. Mulcahy et al. (2014) evaluated a hierarchy of aerosol representations of aerosol climatology, fully prognostic aerosols, and initialized aerosols with data assimilation within the UK Met Office Unified Model (MetUM). They found that aerosol impacts on global precipitation and large-scale circulation appear small in the short-range forecasts, yet indirect aerosol effects can have significant impacts in local regions. They highlight the importance of including a realistic treatment for aerosol–cloud interactions in global short-range forecast models and the possibility of improving predictions by incorporating aerosol schemes. Grell et al. (2011) used a double-moment microphysics scheme with significantly more complex chemistry and aerosols in WRF-Chem (Grell et al., 2005). For stable precipitation areas, coverage and intensity of precipitation were depressed, but the cloud water mixing ratio and number concentrations were enhanced by the wildfire smoke in their study. Grell et al. (2011) showed that for deep convection, the behavior of the response was very different, sometimes even opposite. This study focuses mostly on non-convective precipitation in the higher latitudes.
At the NOAA Global Systems Laboratory (GSL), in collaboration with the NOAA Chemical Sciences Laboratory (CSL) and Air Resources Laboratory (ARL), an atmospheric composition suite (based on WRF-Chem) was developed and coupled with the Unified Forecast System (UFS) Weather Model through the National Unified Operational Prediction Capability (NUOPC)-based NOAA Environmental Modeling System (NEMS) software. This modeling system has been operational as an ensemble member of the Global Ensemble Forecast System (named as GEFS-Aerosols; Zhang et al., 2022) for global aerosol predictions. When using the NUOPC coupler, there are two independent components for atmosphere and chemistry that communicate via the coupler every time step. Because of the interactive and strongly coupled nature of chemistry and physics, it is natural to allow for some of the atmospheric composition modules to be called directly from inside the physics suite. This can be accomplished through the use of the Common Community Physics Package (CCPP; Heinzeller et al., 2023), which is designed to facilitate a host model-agnostic implementation of physics parameterizations and has been used by many different organizations. All the physics parameterizations in the UFS Weather Model are CCPP compliant. In this study the low-level chemical routines were embedded directly into the UFS Weather Model using CCPP (Li et al., 2021). A physics suite is under development at GSL, which includes the aerosol-aware double-moment Thompson–Eidhammer microphysics scheme (TH-E MP; Thompson and Eidhammer, 2014) and the scale- and aerosol-aware Grell–Freitas convection scheme (GF; Grell and Freitas, 2014; Freitas et al., 2021). This study represents an examination of the applicability of a very simple approach to represent the aerosol indirect effect in a global modeling system as originally developed by TH-E. However, instead of using the aerosol climatologies that TH-E embedded in their MP scheme, to derive the two necessary aerosol variables in their scheme, we evaluate the differences when implementing realistic aerosol emissions to fill the two variables.
This paper is organized as follows. The model, method, and experiment design are described in Sect. 2. The results are presented in Sect. 3, followed by a discussion section. Finally, the summary and future plans are given in Sect. 5.
2.1 The UFS Weather Model
The Unified Forecast System (UFS; Jacobs, 2021) Weather Model is a short- and medium-range research and operational forecast model that may be used across global and regional scales. It employs the Finite-Volume Cubed-Sphere Dynamical Core (FV3; Lin, 2004). The software infrastructure Flexible Modeling System (FMS) is used for functions such as parallelization. CCPP is used for physical parameterizations and to connect them to the host model. The main program is created by the NOAA Environmental Modeling System (NEMS) model driver. The UFS Weather Model (https://github.com/NOAA-GSL/ufs-weather-model/releases/tag/global-24Feb2022, last access: 21 January 2024) used in this study is a fork from the authoritative repository (https://github.com/ufs-community/ufs-weather-model, last access: 21 January 2024). Thus, the version and release of GSL global-24Feb2022 does not come from the authoritative repository but from a fork at the NOAA GSL.
2.2 Physics and aerosol emissions
The microphysics used in this study is the aerosol-aware Thompson–Eidhammer microphysics (TH-E MP; Thompson and Eidhammer, 2014) scheme. It includes prognostic fields of mixing ratios of the hydrometeors of cloud water (Qc), cloud ice (Qi), rainwater (Qr), snow water (Qs), and graupel (Qg) and the number concentrations of prognostic cloud water, cloud ice, and rainwater. In TH-E MP, the hygroscopic aerosol is referred to as a “water-friendly” aerosol (WFA), and the non-hygroscopic ice-nucleating aerosol is referred to as an “ice-friendly” aerosol (IFA). A semi-Lagrangian sedimentation is implemented into TH-E MP to replace the Eulerian sedimentation to allow for larger time steps in global modeling (Hong et al., 2022).
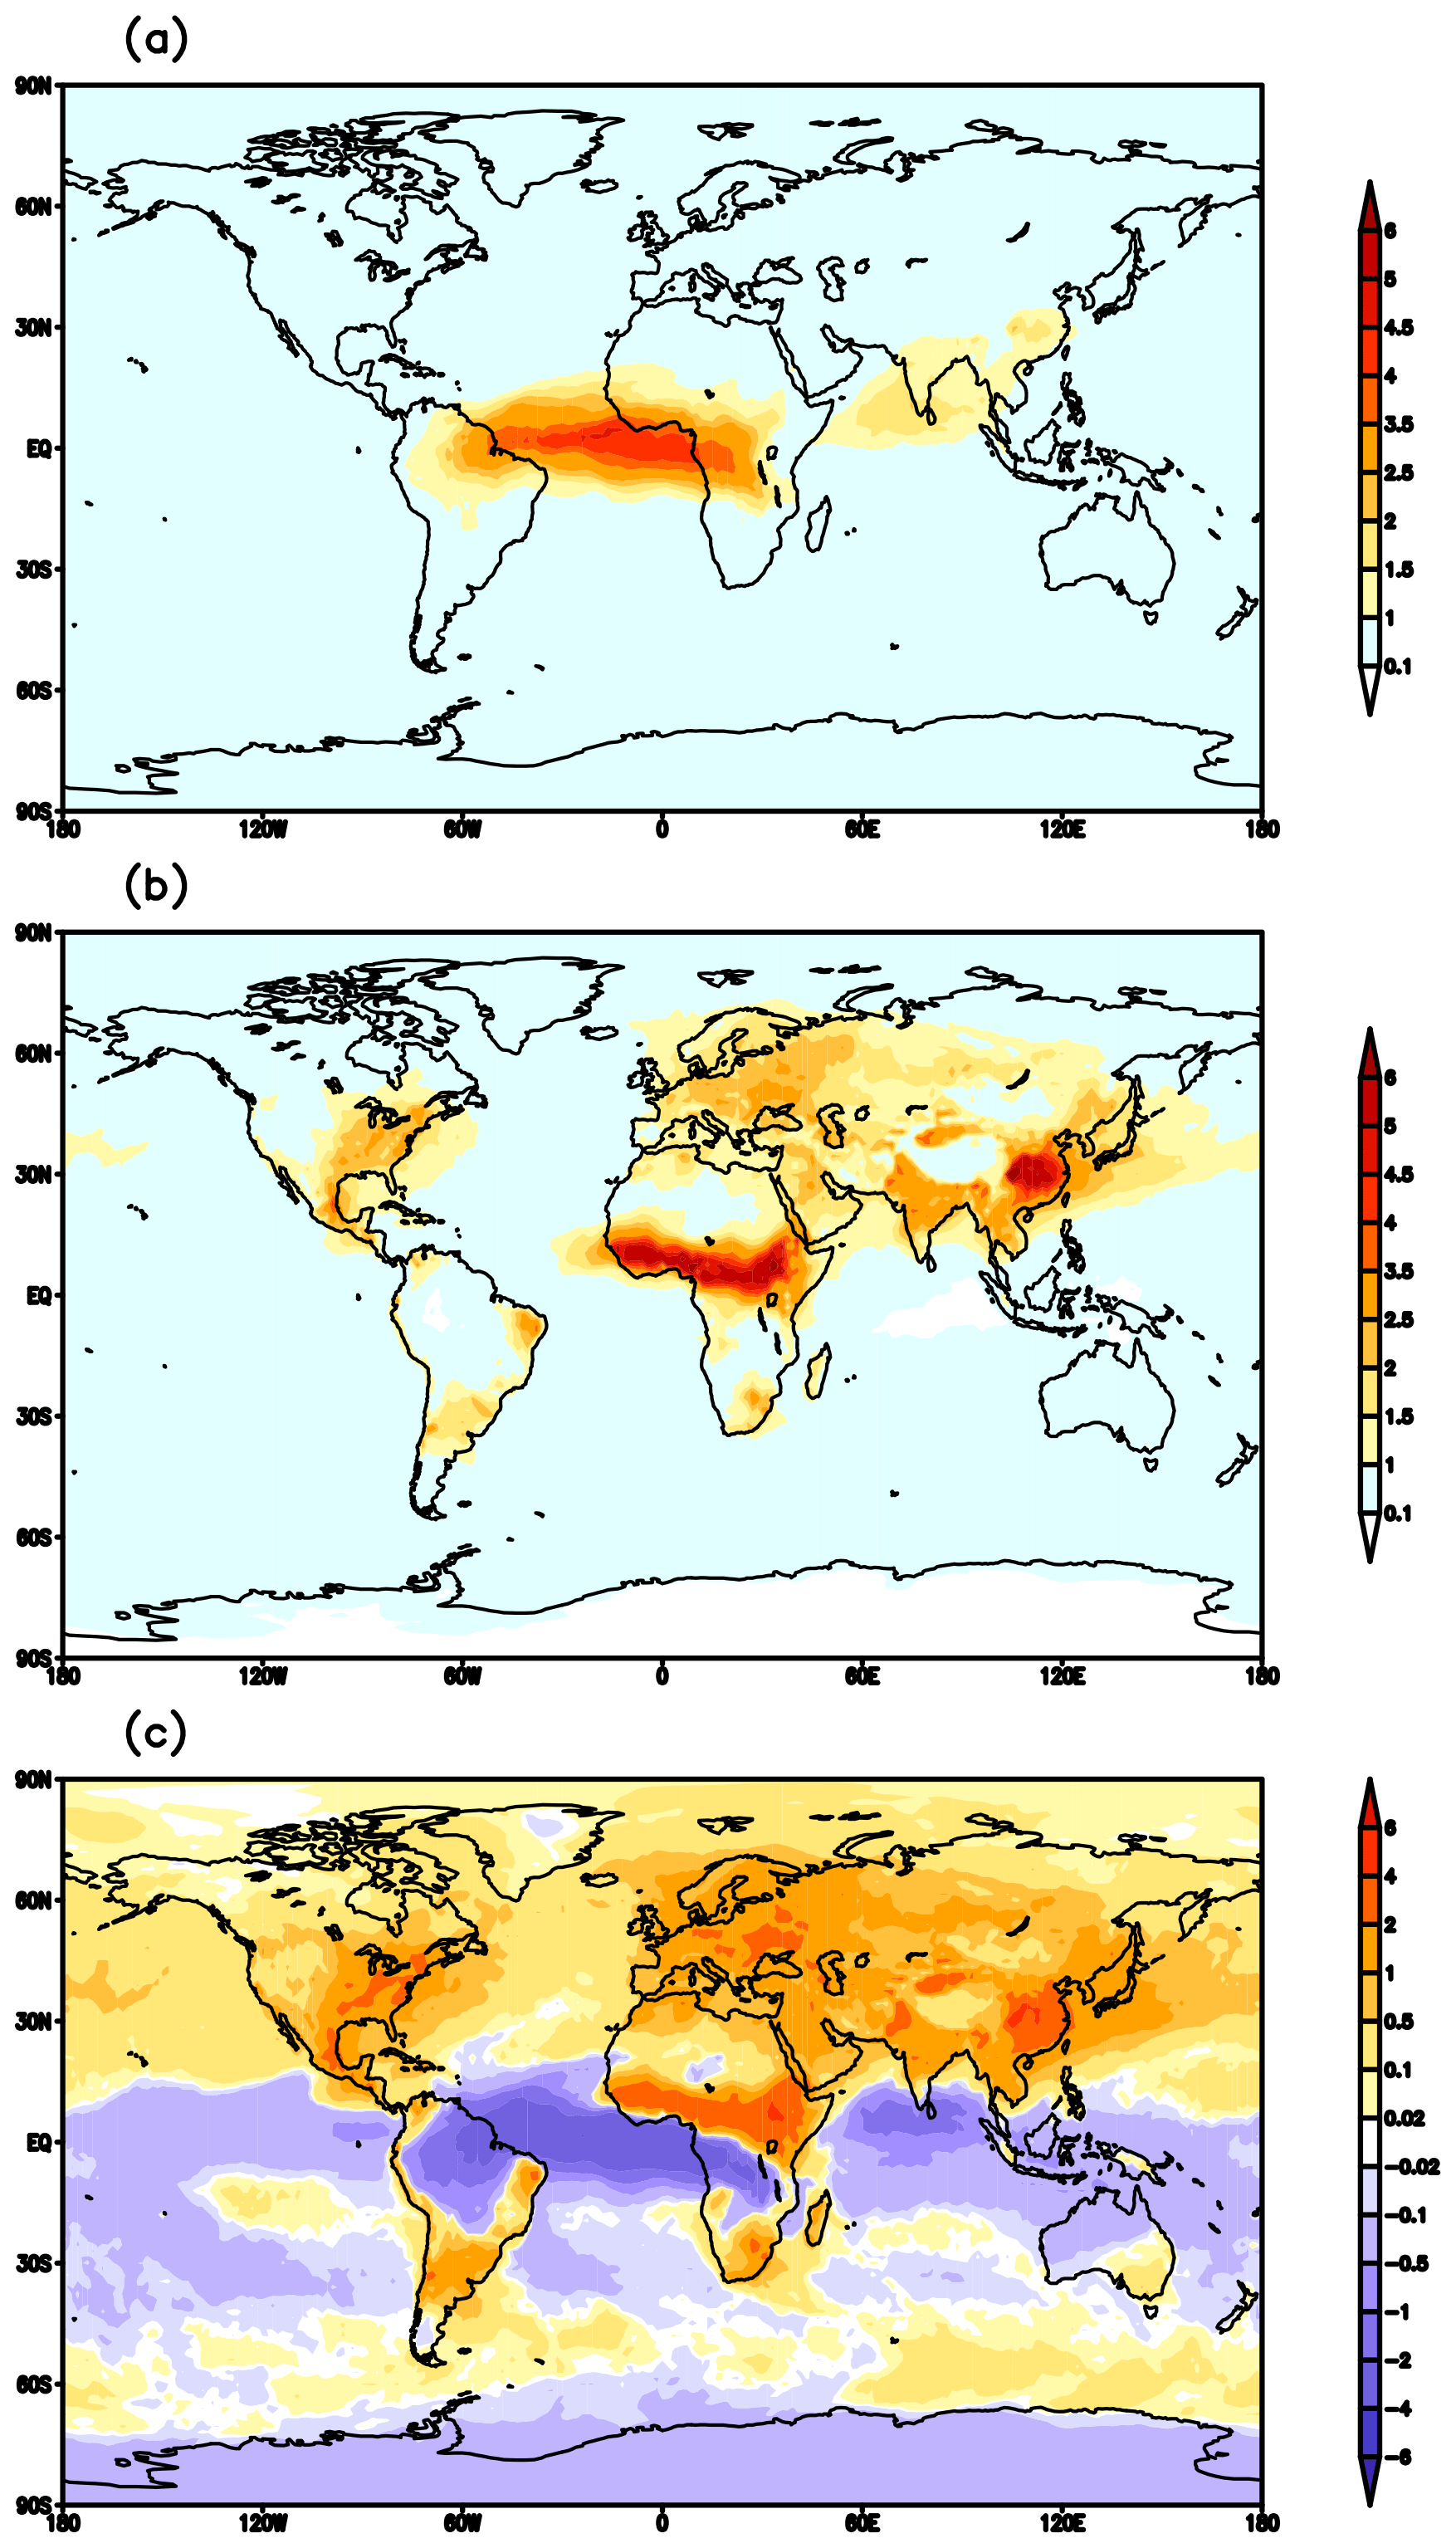
Figure 1The 120 h forecast vertically integrated WFA number concentration (10+13 m−2) from (a) CTL, (b) EXP, and (c) EXP minus CTL.
In our study, modules of sea-salt emissions, dust emissions, and biomass-burning emissions, as well as those of anthropogenic aerosol emissions, are embedded into the UFS Weather Model as physics subroutines. The dust emissions are from the FENGSHA dust scheme (Tong et al., 2017), and the sea-salt emissions are from the NASA GOCART model. The anthropogenic organic carbon emissions are from the emission inventories of the Community Emissions Data System (CEDS; Hoesly et al., 2018). Fire radiative power (FRP) from the blended Global Biomass Burning Emissions Product (GBBEPx; Zhang et al., 2014) is used to provide biomass-burning emissions. All modules are CCPP compliant and are called directly within the physics block before application of the boundary layer and convection parameterizations. The tendencies of WFAs (kg−1) and IFAs (kg−1) are calculated following Ackermann et al. (1998) and Powers et al. (2017), as in Eq. (1a) and (1b), respectively, from the sea-salt, organic carbon, and dust emissions.
where emis_ss is the sea-salt emissions, and emis_oc is the combined organic carbon from anthropogenic emissions and wildfire. The dust emissions are represented by emis_dust. ρsfc is the model surface layer air density, and dzsfc is the model surface layer depth. ρss, ρoc, and ρdust are the densities of sea salt, organic carbon, and dust, respectively. factwfa_ss, factwfa_oc, and factifa are the tuning factors with the diameters of sea salt (wfa_diameter_ss), organic carbon (factwfa_oc), and dust (factifa), respectively.
Table 1The domain-averaged aerosol optical depth (AOD) from 120 h forecast and reanalysis.
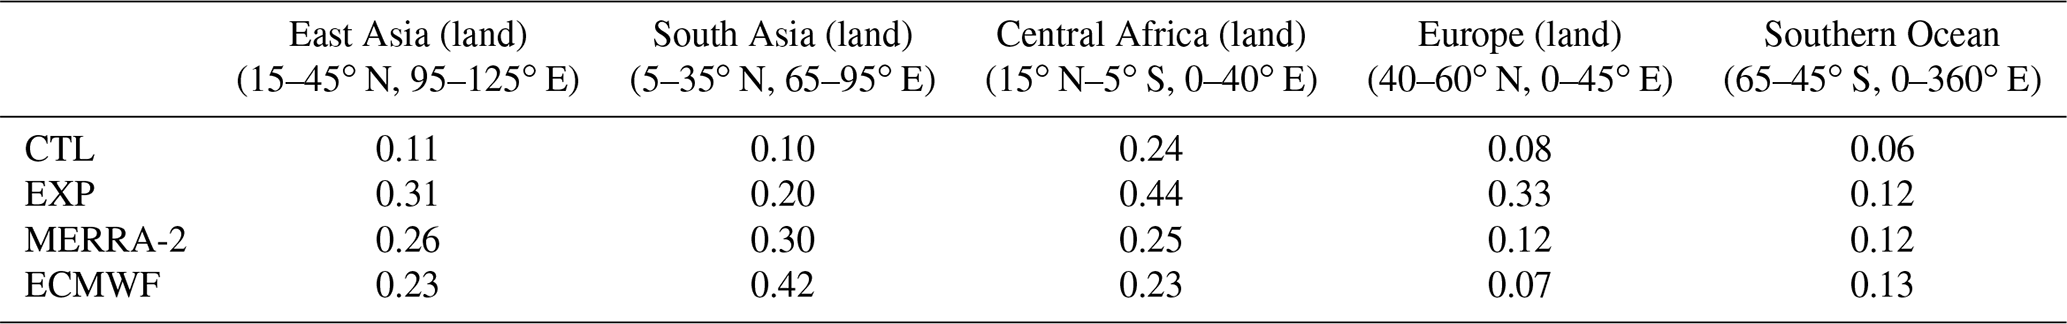
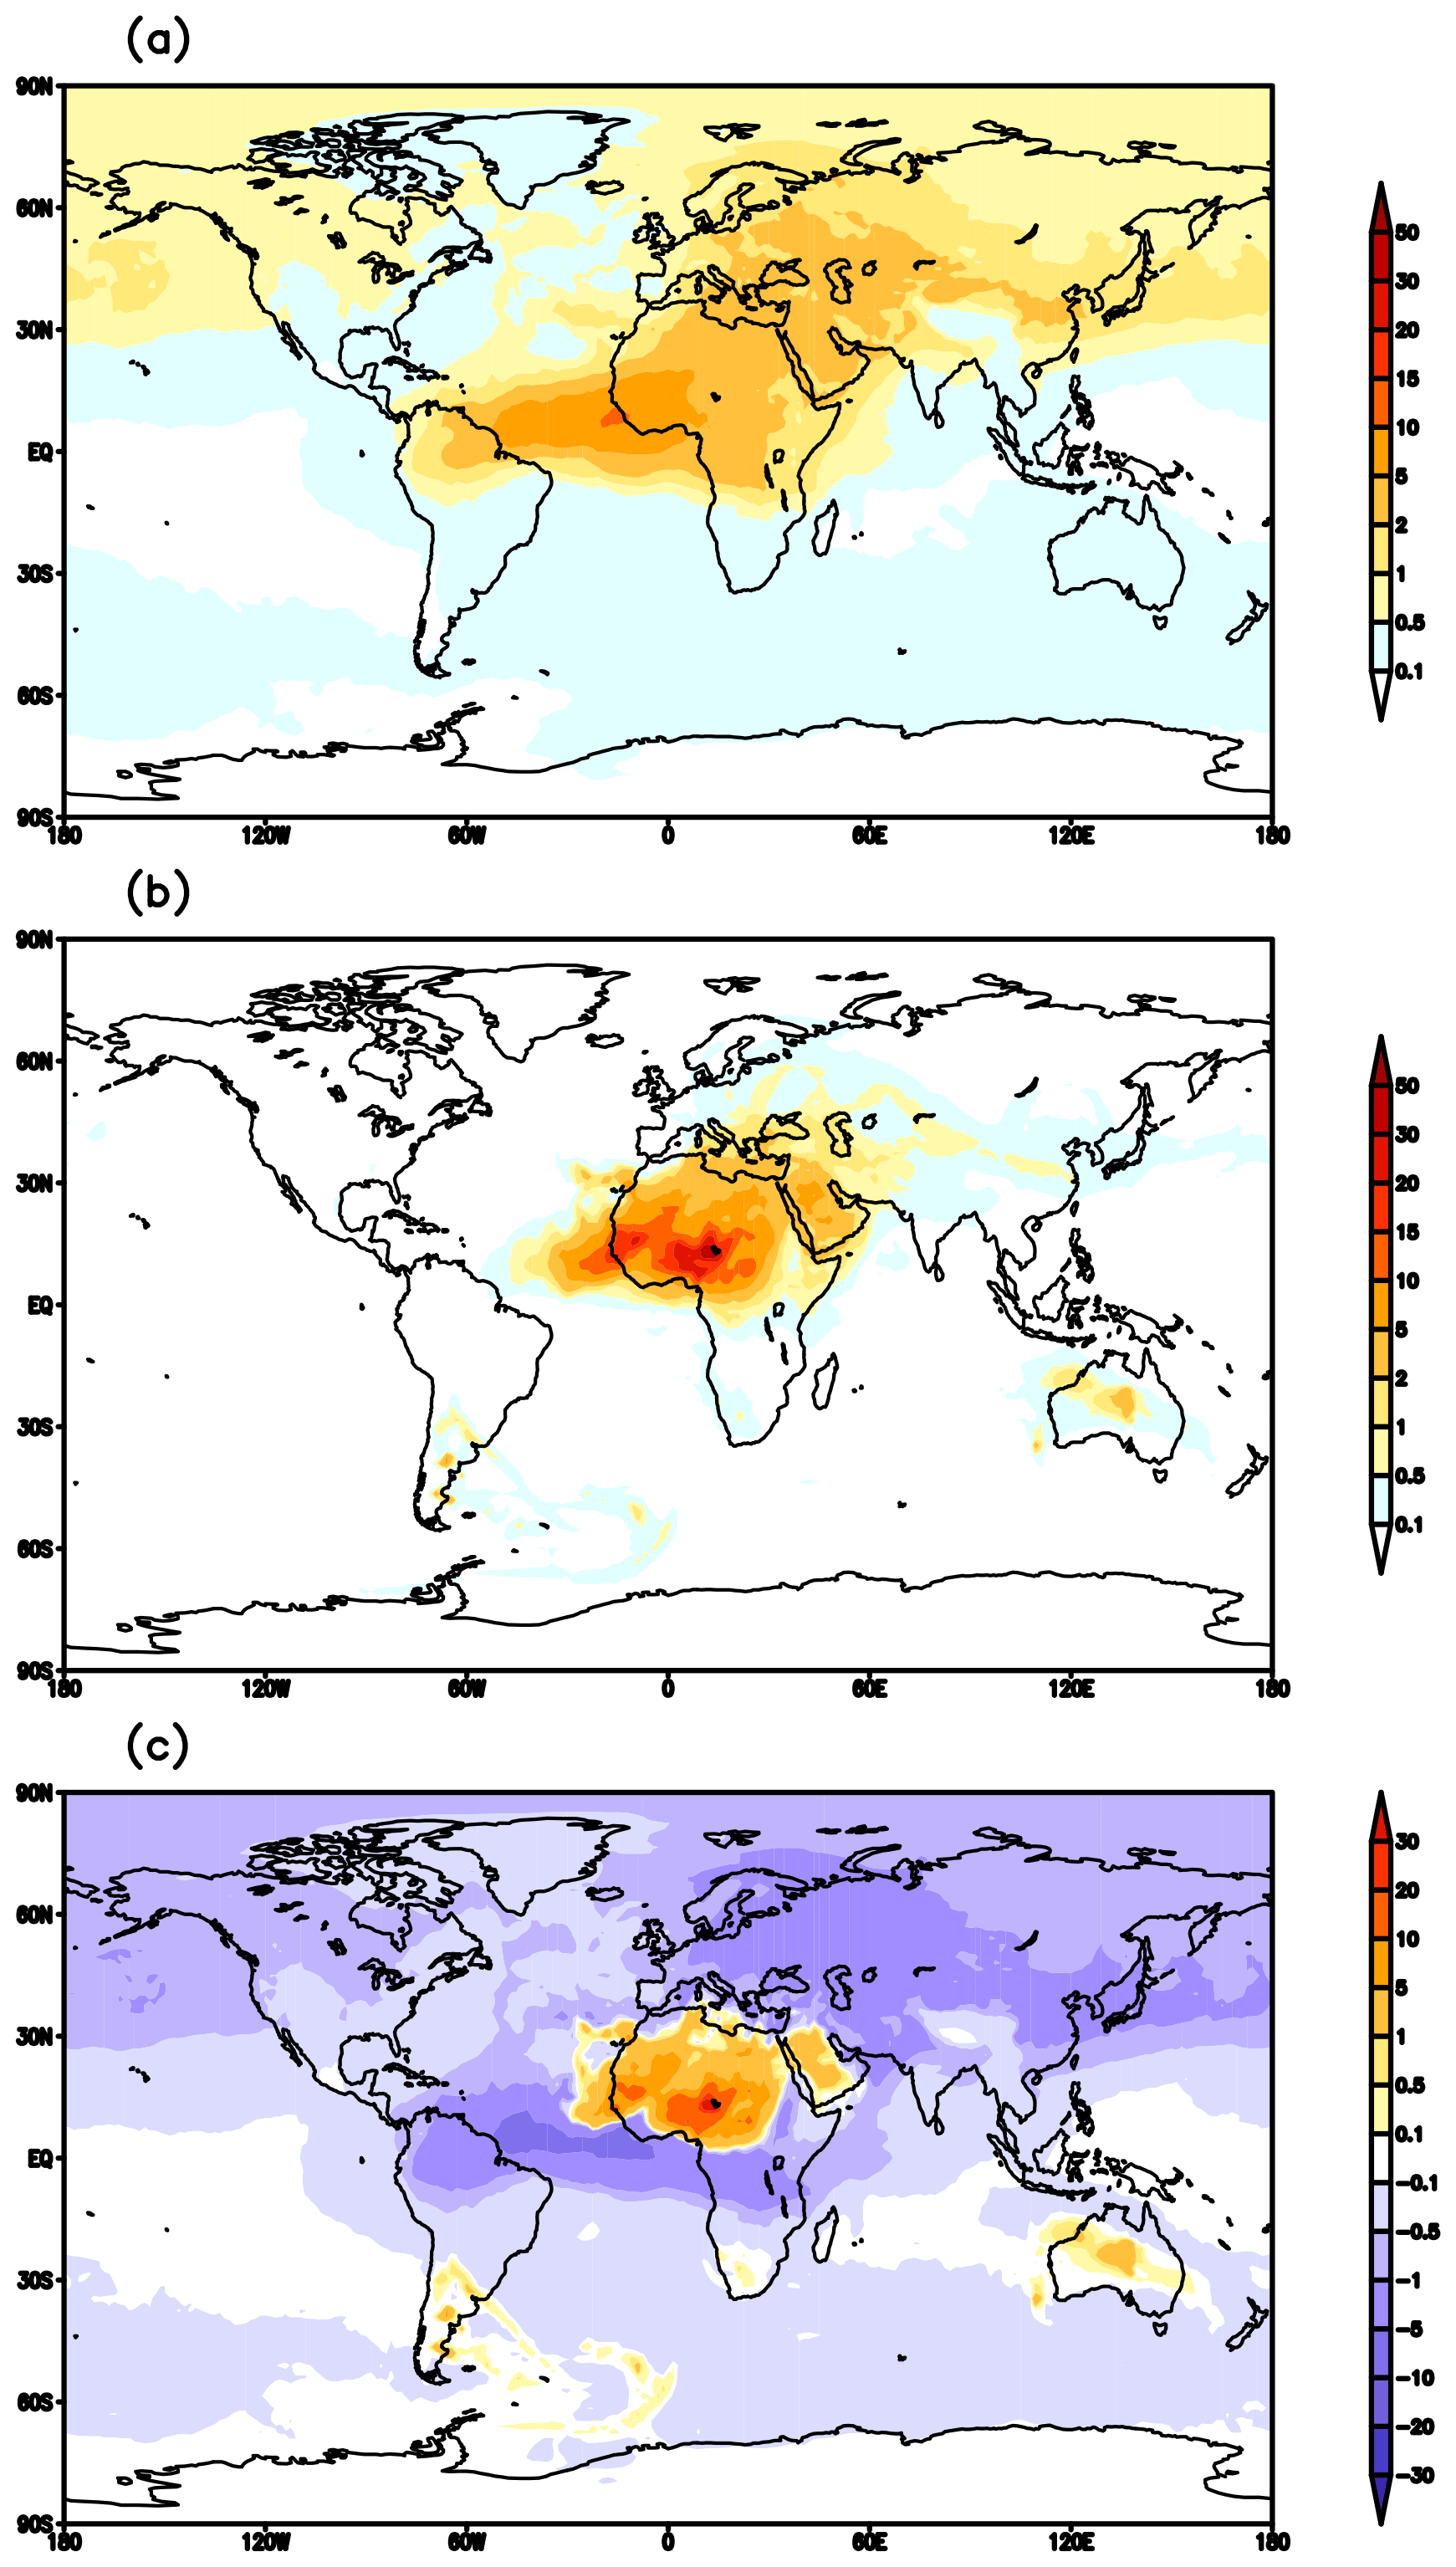
Figure 2The 120 h forecast vertically integrated IFA number concentration (10+10 m−2) from (a) CTL, (b) EXP, and (c) EXP minus CTL.
The GF cumulus convection scheme (Grell and Freitas, 2014; Freitas et al., 2021) is used to treat non-resolved convection in this study. The GF is scale aware; can be used as an aerosol-aware convective scheme; and allows for shallow, congestus, and deep convective modes. The convective wet scavenging and convective transport of WFAs and IFAs are included in the GF scheme. In order to isolate the microphysics response to aerosols, the aerosol-aware feature of GF is turned off in this study. The Mellor–Yamada–Nakanishi–Niino (Nakanishi and Niino, 2009) eddy-diffusivity/mass-flux (MYNN-EDMF; Olson et al., 2019) planetary boundary layer scheme is used to represent PBL mixing (including WFAs and IFAs).
2.3 Numerical experiment design
There are two sets of modeling experiments in this study. One is the control run (CTL hereafter), which uses the default aerosol emission and GOCART WFA/IFA initial conditions for TH-E MP. An empirical WFA-emission power formula, which depends on the surface climatological number concentration (Thompson and Eidhammer, 2014), is used to calculate the WFA tendency, and there is no IFA emission in the CTL run. A second experiment (EXP hereafter) uses WFA and IFA initial conditions converted from the operational GEFS-Aerosols. This provides a better set of real-time initial conditions, since, in addition to sea salt, dust, and carbon, sulfate is also available for the EXP experiment in the initial conditions. The WFA tendency and IFA tendency are calculated online as described in Sect. 2.2. Then the prognostic WFA and IFA tendencies are added to the surface-layer WFAs and IFAs every time step.
Both runs use atmospheric initial conditions from the GFS analysis. There are 10 boreal winter runs initialized every 120 h from 00:00 UTC of 1 December 2020 to 00:00 UTC of 15 January 2021, and the forecast is integrated for 120 h. We selected the boreal winter period to minimize the impact of convective precipitation over the Northern Hemisphere and to focus on the sensitivity of the resolved precipitation to aerosols. The horizontal resolution is C768 (∼13 km), and there are 127 vertical layers. The GFS near-sea-surface temperature (NSST) scheme is used to provide a sea-surface temperature (SST) forecast during the model integration.
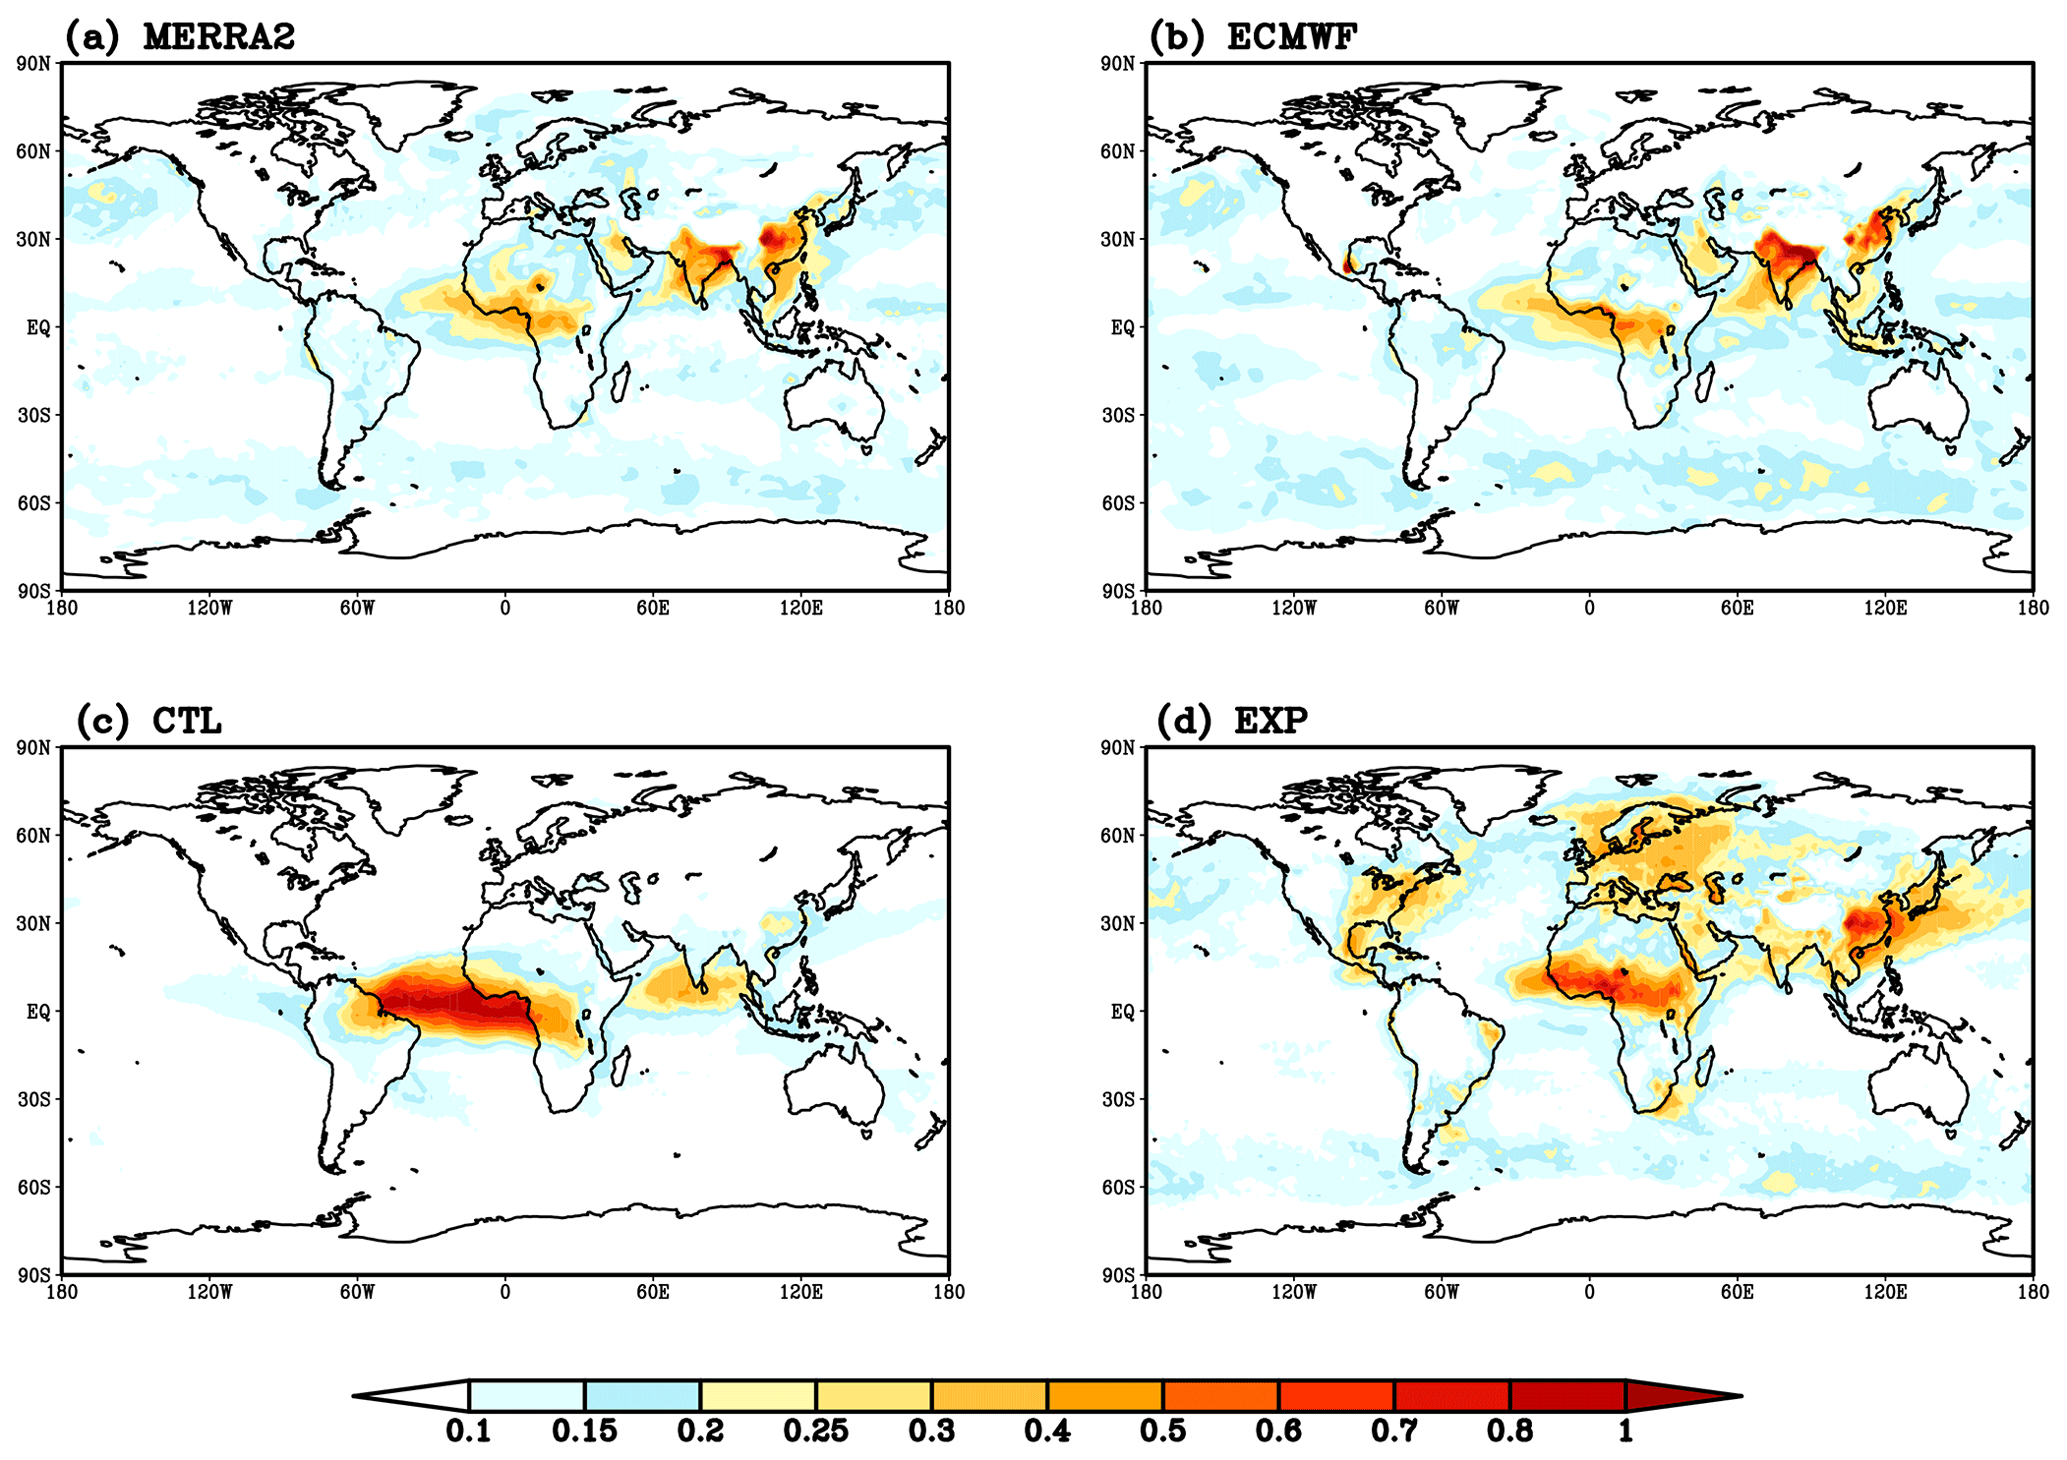
Figure 3The AOD from (a) MERRA-2 reanalysis and (b) ECMWF's CAMS reanalysis and the 120 h forecast from (c) CTL and (d) EXP run.
2.4 Datasets for forecast verification
Two aerosol reanalysis products from the European Centre for Medium-Range Weather Forecasts' (ECMWF's) Copernicus Atmosphere Monitoring Service (CAMS; Inness et al., 2019) and the Modern-Era Retrospective analysis for Research and Applications, version 2 (MERRA-2; Ronald et al., 2017), are used to validate the aerosol optical depth (AOD). The radiation flux is validated by the Clouds and the Earth's Radiant Energy System (CERES; Rutan et al., 2015) observation dataset. The NOAA Climate Prediction Center's (CPC's) global unified gauge-based analysis of daily precipitation (Chen and Xie, 2008) is used to verify the precipitation forecast. The GFS analysis is also used to calculate the anomaly correlation coefficient (ACC) for 500 hPa geopotential height.
We present retrospective run results from, on average, over 10 cases. The WFAs, IFAs, AOD, temperature, and hydrometeors are from the instantaneous values at the 120 h forecast. The cloud cover, radiation, and precipitation are from the cumulative values over the 120 h forecast period.
3.1 Water-friendly aerosols and ice-friendly aerosols
The average of the 120 h forecast of WFAs from the CTL runs (Fig. 1a) shows the largest concentrations mainly over the oceanic areas of the equatorial Atlantic and the northern Indian Ocean and over the land areas of the Amazon, Central Africa, and South and East Asia. The concentration of WFAs from the EXP runs (Fig. 1b) appears larger over land than over the ocean. For example, we can observe high WFA concentrations over eastern North America, Central America, Eurasia, and the savannas and rainforests of Africa, with the difference between EXP and CTL (Fig. 1c) indicating that the EXP runs have fewer WFAs, especially over the tropical oceans, and in general more WFAs over the Northern Hemisphere and slightly more over the high-latitude Southern Ocean. The maximum of IFAs from the CTL runs (Fig. 2a) is located over the tropical Atlantic, but significant concentrations cover most areas of the Northern Hemisphere. However, high IFA concentrations from the EXP runs (Fig. 2b) concentrate mostly over the desert areas of the Sahara, with some dust emissions leading to elevated IFA concentrations over Australia, southern South America, and East Asia.
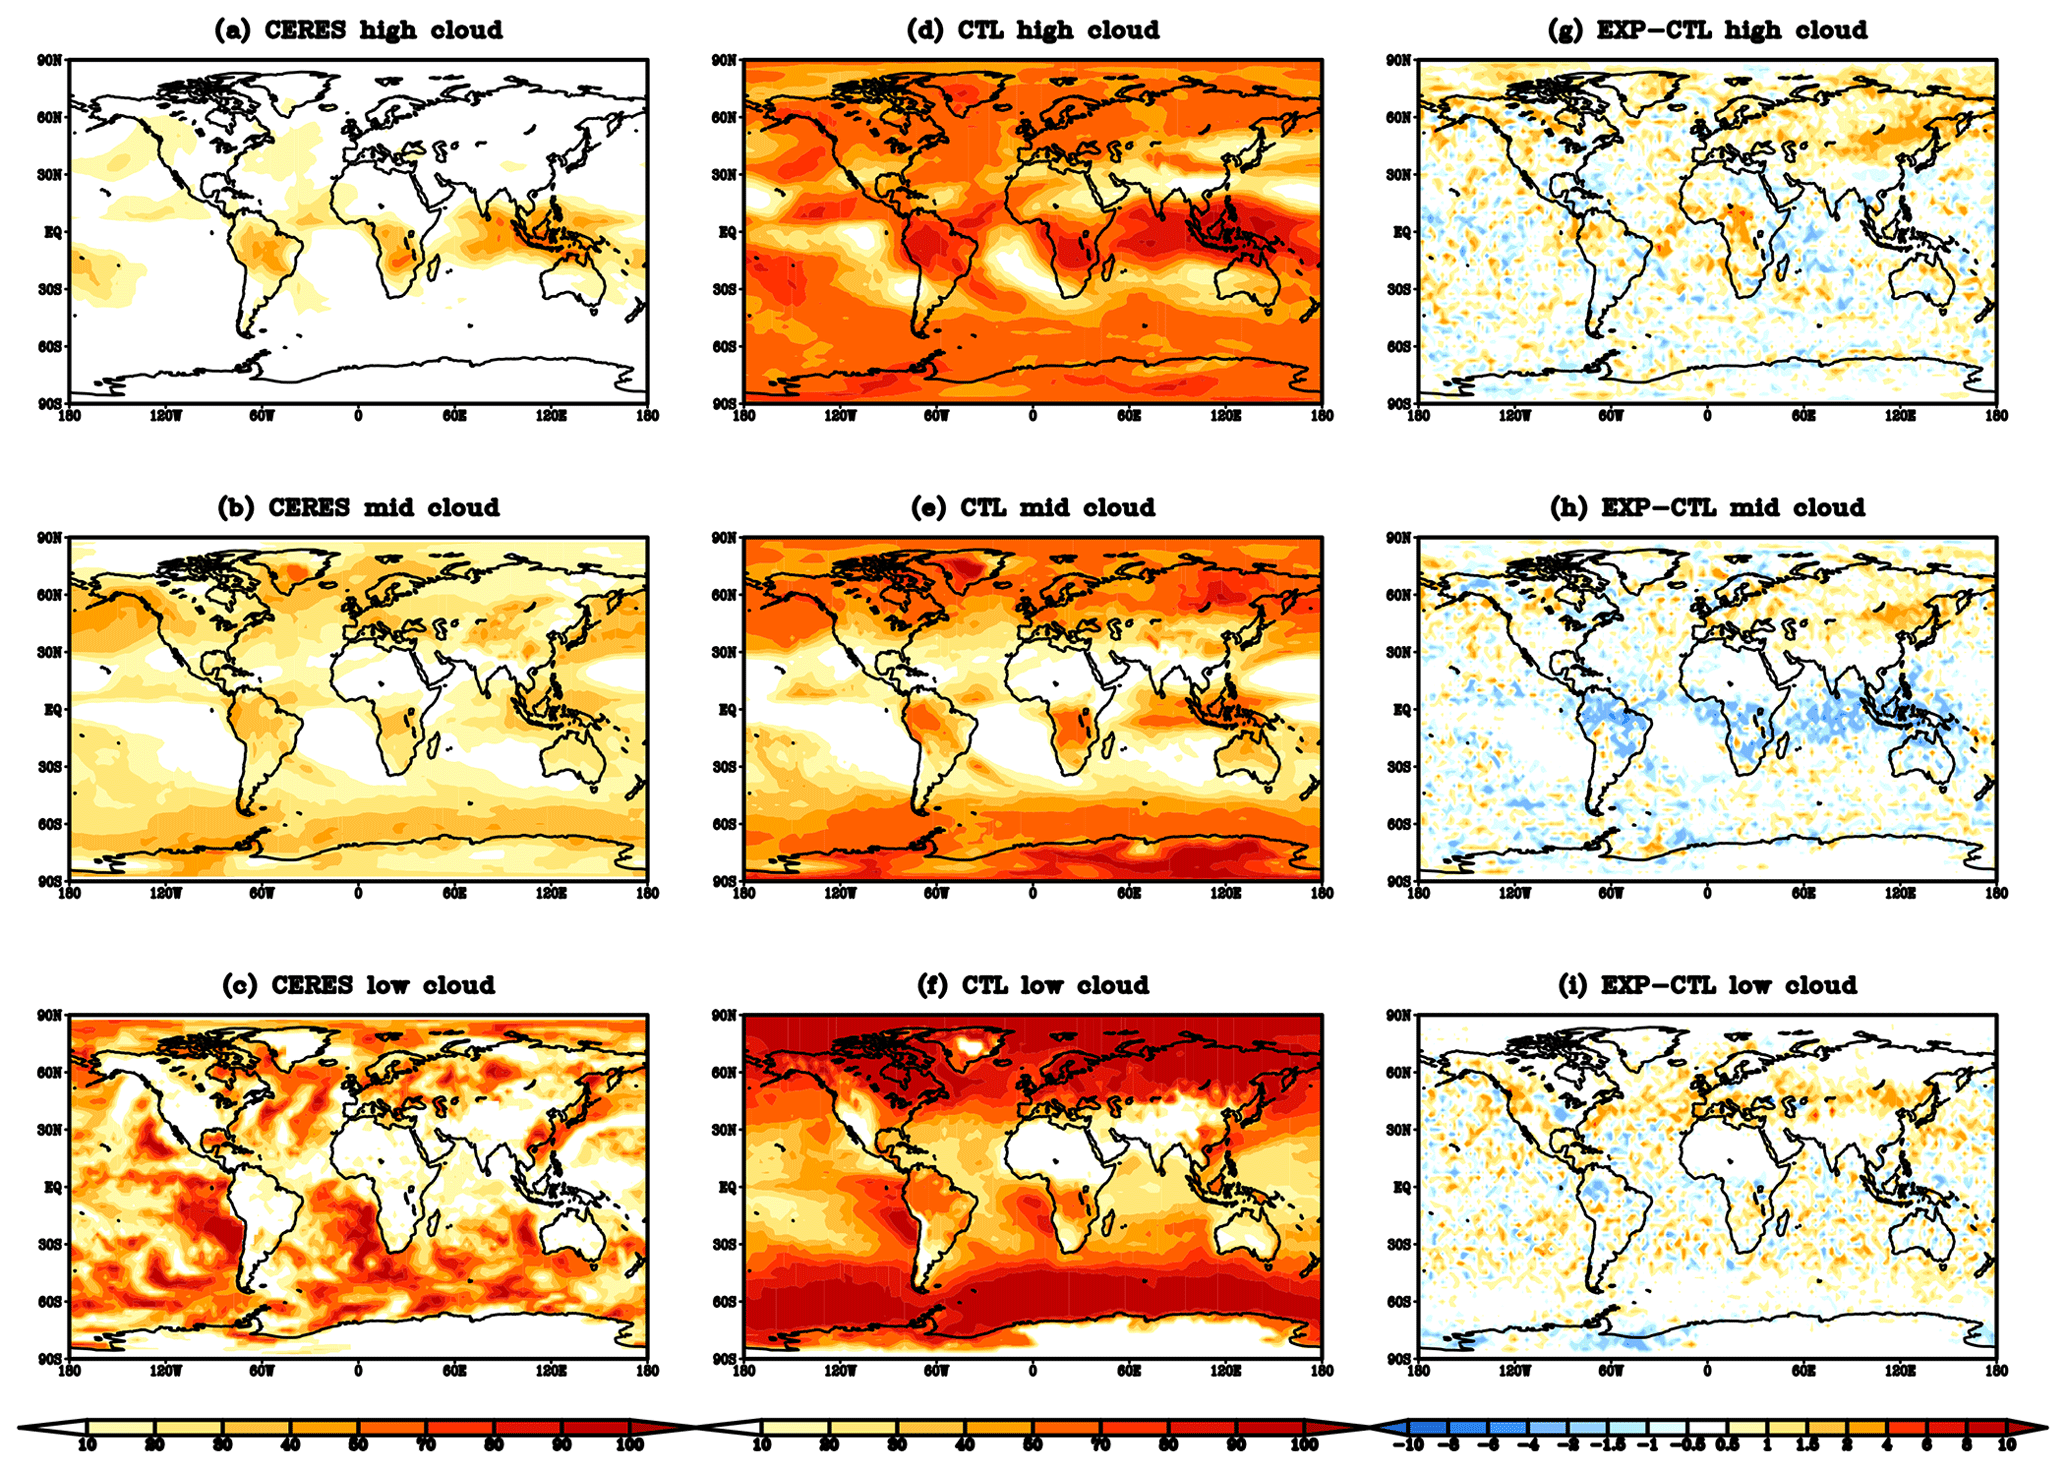
Figure 4The (a) high, (b) medium, and (c) low cloud-cover fraction (%) from CERES satellite observations; the 120 h averaged (d) high, (e) medium, and (f) low cloud-cover fraction (%) from the CTL run; and the differences in (g) high, (h) medium, and (i) low cloud-cover fraction (%) between the EXP and CTL runs (EXP minus CTL).
3.2 Aerosol optical depth
Aerosol optical depth (AOD) is a key variable in measuring the absorbing and scattering radiation by aerosol particles. In this study, analyzed 550nm AOD fields are compared with simulated 550 nm AOD fields derived from WFAs and IFAs by using a look-up table (Colarco et al., 2010) with observation constraint. Two kinds of reanalysis data, MERRA-2 (Ronald et al., 2017; Fig. 3a) and ECMWF's CAMS (Inness et al., 2019; Fig. 3b), are used in this study to evaluate the average of 120 h forecast AOD from the CTL runs (Fig. 3c) and the EXP runs (Fig. 3d). The AOD from the CTL runs is high over the tropical Atlantic and the northern Indian Ocean. This overestimation is consistent with the distribution of WFAs and IFAs, and the CTL runs also underestimate the AOD over South Asia, East Asia, and mid-latitude ocean areas (Table 1). The absence of IFA emissions in the CTL runs may result in weaker IFAs and AOD over the Sahara area. The EXP runs (Fig. 3d) capture the AOD over continental areas of Central Africa, South Asia, and East Asia, as well as the observed AOD distribution over the northern Pacific, the northern Atlantic, and the Southern Ocean. However, the AOD from the EXP run is overestimated over Europe, the eastern part of the US, and Central Africa, and it is also underestimated over South Asia (Table 1). Large uncertainties exist in the two analysis fields, with MERRA-2 analysis probably in closest agreement, indicating higher AOD compared to the CAMS analysis over Europe (Table 1). Overall, the AOD derived from WFAs and IFAs is in reasonable agreement with analysis, suggesting it may be worth also investigating the direct radiation impact in comparison to using climatologies in future studies.
3.3 Cloud, radiation, and liquid water path
Most areas of the Earth are covered by clouds, and aerosol plays a key role in the formation of clouds. The 120 h averaged high, medium, and low cloud-cover fractions from CERES satellite observations are shown in Fig. 4a, b, and c, respectively. The 120 h averaged high, medium, and low cloud-cover fractions (Yoo and Li, 2012) from the CTL runs are shown in Fig. 4d, e, and f, respectively. The CTL run captures most of the distribution of high, medium, and low cloud-cover fractions of satellite observations but with smaller magnitudes. Compared with the CTL runs, the EXP runs have more high cloud cover over most continental areas of North America and Eurasia (Fig. 4g), more medium cloud cover over the Northern Hemisphere and less over tropical areas (Fig. 4h), and more low cloud cover over the mid-latitude areas of the Northern Hemisphere (Fig. 4i). This appears physically consistent with the WFA differences in Fig. 1c. However, there are no significant low cloud-cover differences over high-latitude areas, and this is probably because the model forecasts both have low cloud cover close to 100 % over high-latitude areas (Fig. 4f).
The 120 h averaged outgoing longwave radiation (OLR) bias from CTL and EXP against CERES observations is shown in Fig. 5a and b. In general, CTL has positive OLR bias over land and negative OLR bias over tropical ocean areas. The EXP runs slightly improve the tropics bias (Fig. 5c), e.g., less OLR over tropical land and more OLR over tropical ocean. The average global mean OLR from CERES observations, the CTL, and the EXP experiments is 234.5, 237.0, and 237.1 W m−2, respectively. The 120 h averaged surface downward shortwave radiation (SFCDSW) biases from the CTL and EXP runs relative to CERES observations are shown in Fig. 6a and b. Figure 6c shows the SFCDSW differences between the EXP and CTL runs. While it may be more difficult to see clear improvements in the EXP runs, there are interesting and notable differences. The EXP runs have less SFCDSW over the Northern Hemisphere and more SFCDSW over tropical areas, which is consistent with the cloud-cover fraction differences. There is less SFCDSW from the EXP runs over the Southern Ocean, although there are no significant cloud-cover fraction differences between the EXP and CTL runs. The global mean SFCDSW from the averaged CERES observations, the CTL runs, and the EXP runs is 192.5, 194.7, and 193.7 W m−2, respectively.
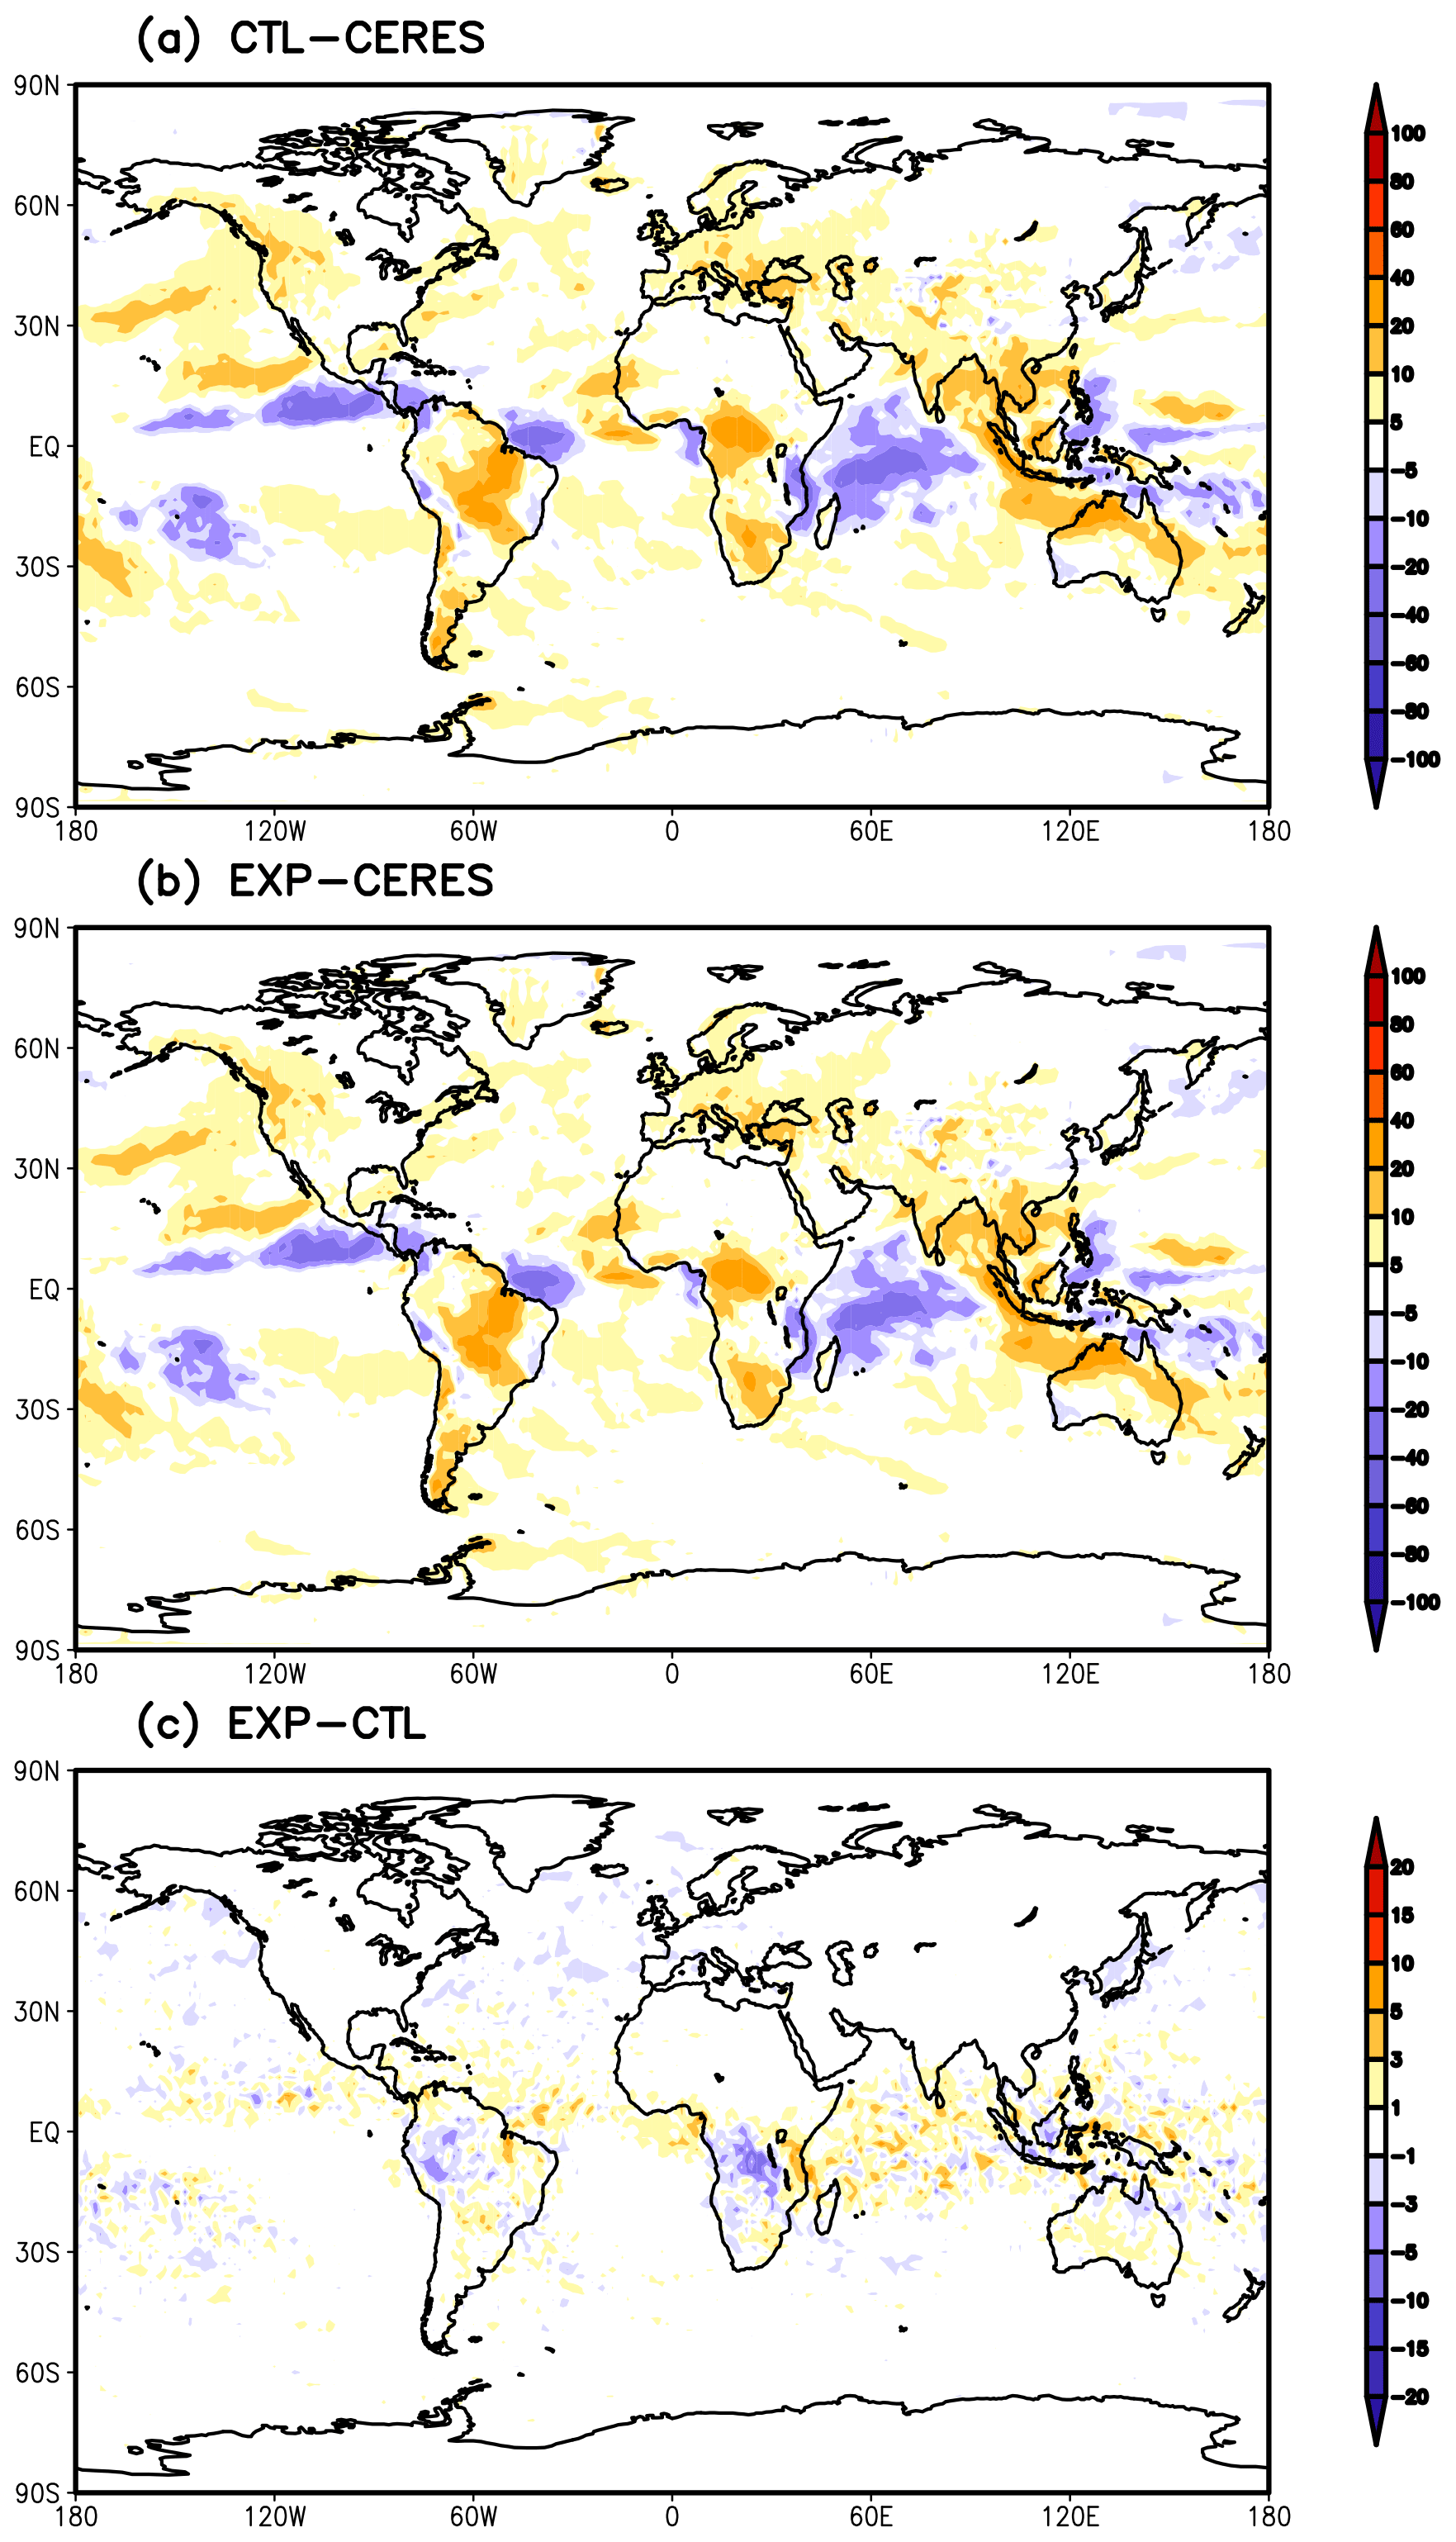
Figure 5The 120 h averaged OLR (W m−2) bias from (a) the CTL run against CERES observations, (b) the EXP run against CERES observations, and (c) the difference between the EXP and CTL run (EXP minus CTL).
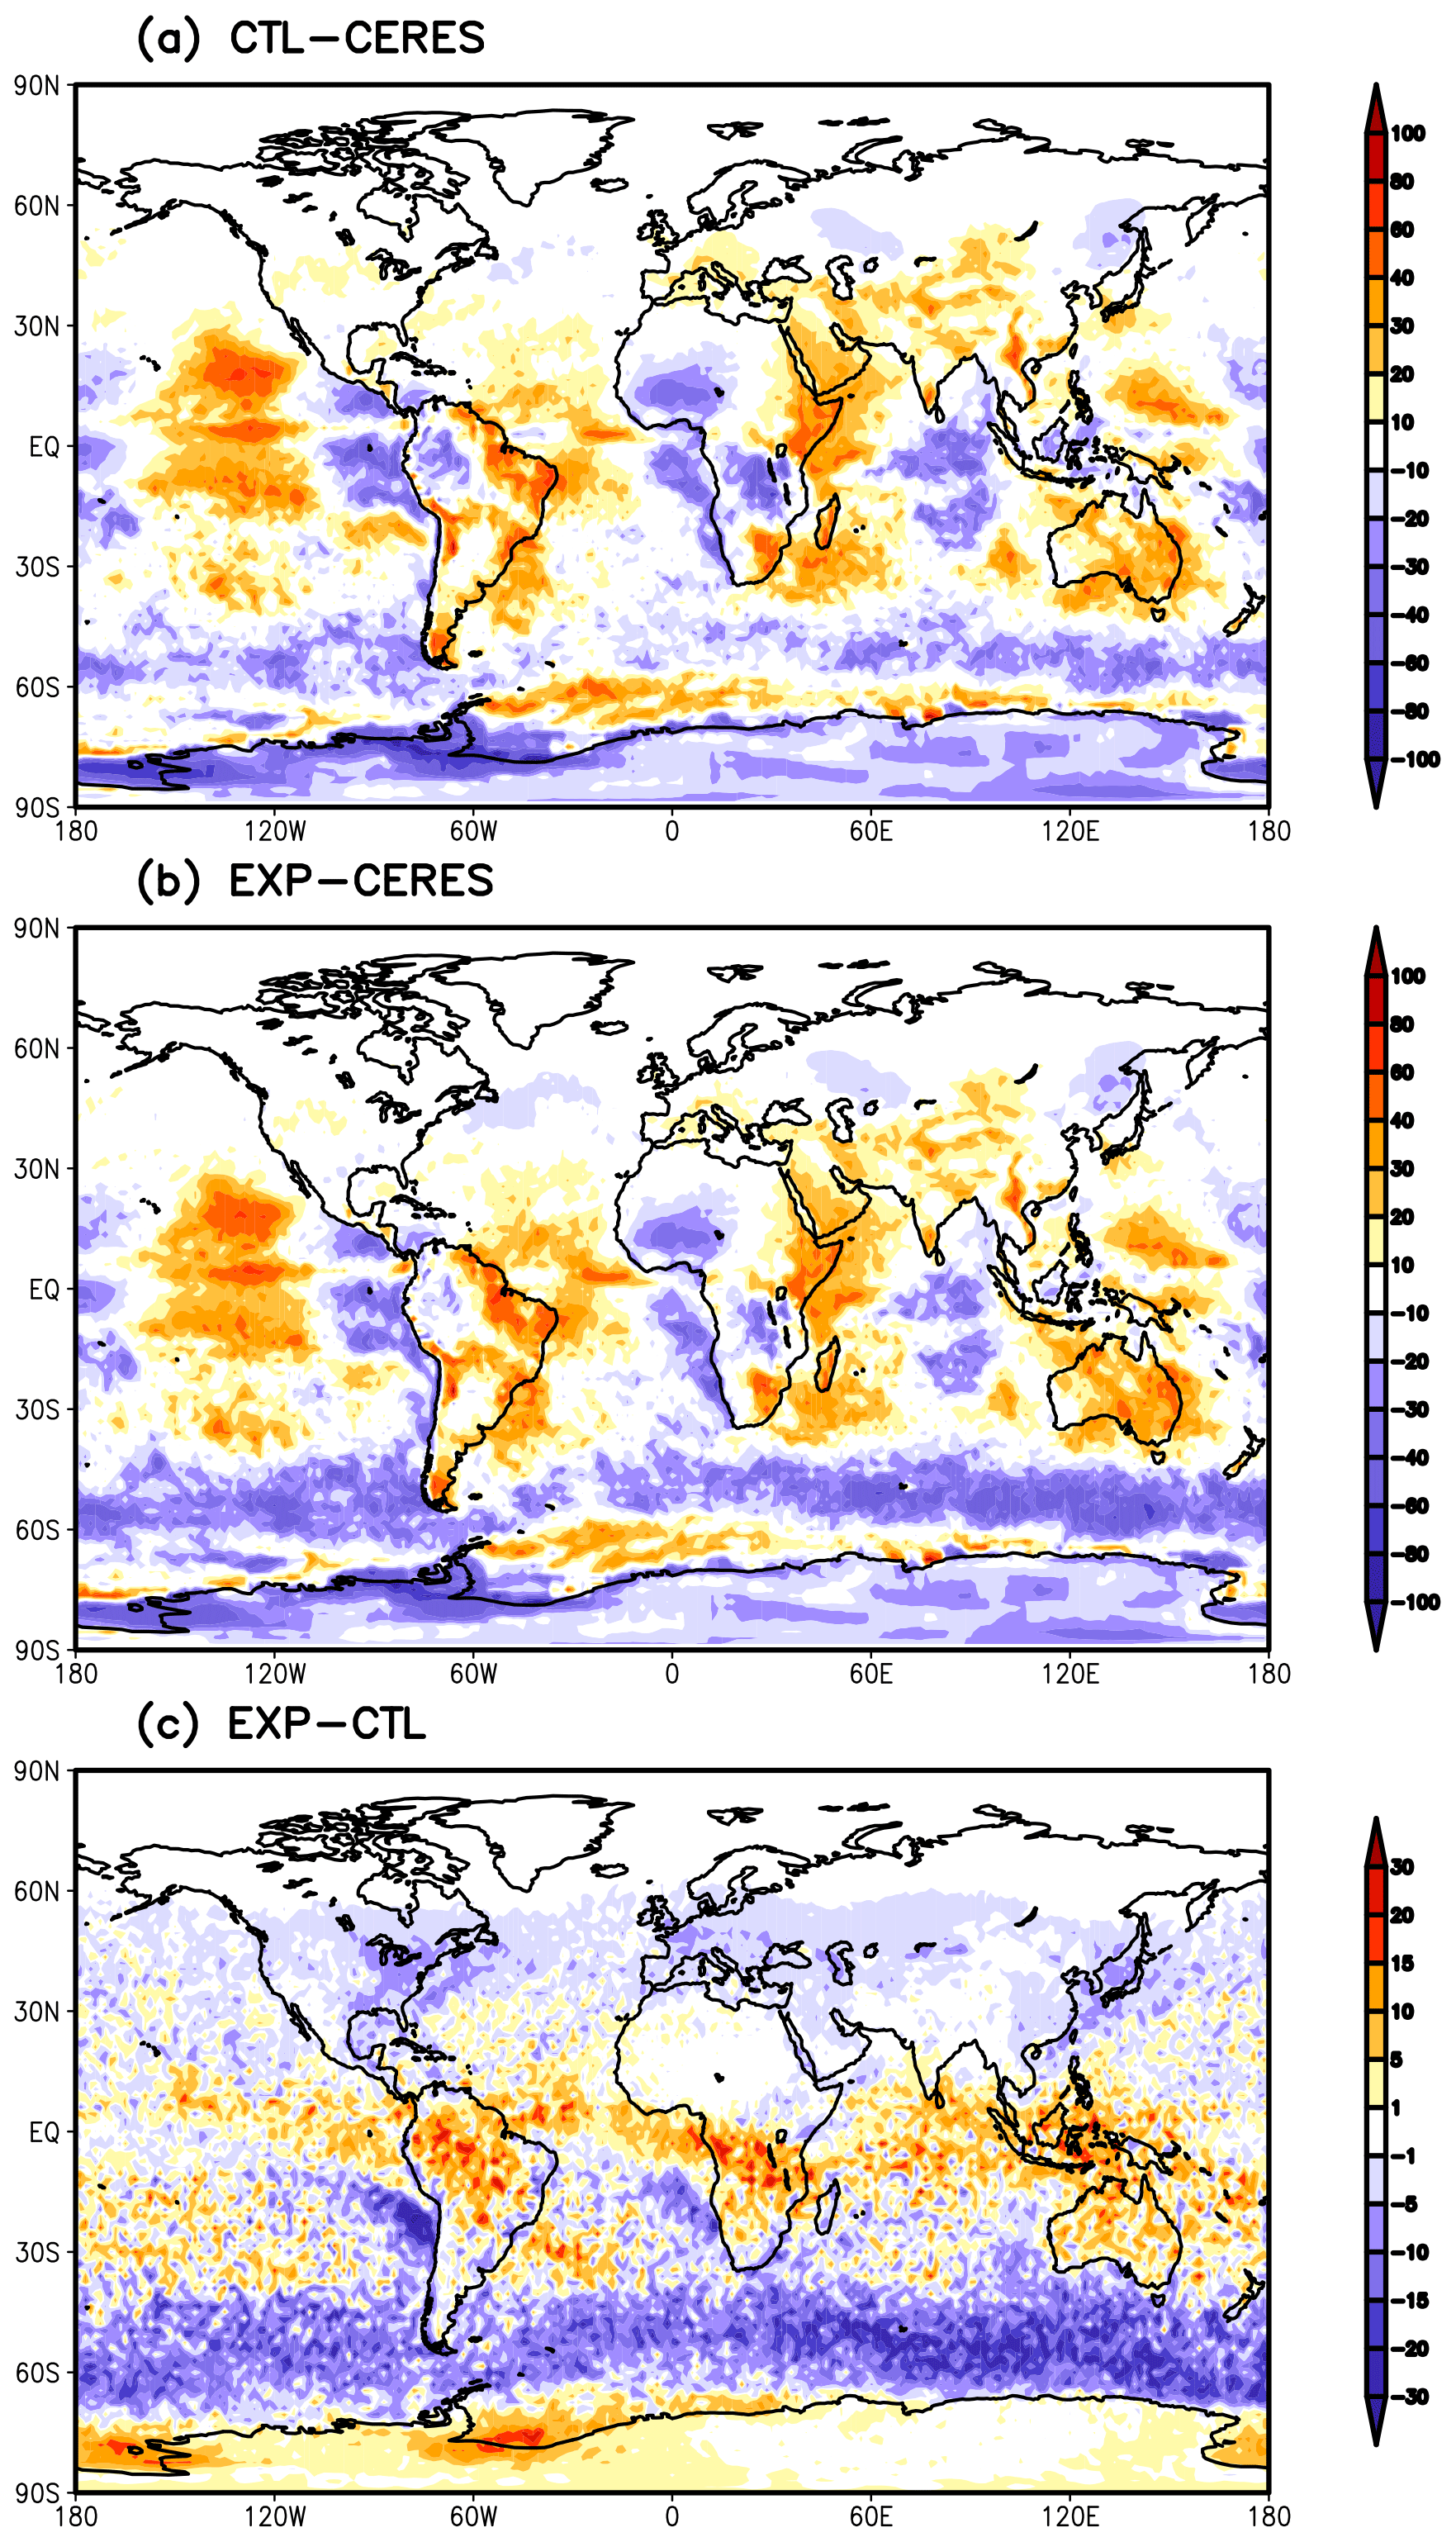
Figure 6The 120 h averaged surface downward shortwave radiation (W m−2) bias from (a) the CTL run against CERES observations, (b) the EXP run against CERES observations, and (c) the difference between the EXP and CTL run (EXP minus CTL).
Liquid water path (LWP) is important for cloud radiation and precipitating processes (Gryspeerdt et al., 2019). The LWP from ERA5, GFS analysis, and the CTL run is shown in Fig. 7a, b, and c, respectively. The CTL run (Fig. 7c) has the largest LWP over the northern and western Pacific, the northern Atlantic, Europe, and the Southern Ocean. The EXP run generates more LWP than the CTL run over the northern Pacific, the northern Atlantic, and the Southern Ocean and less LWP over Europe and the Great Lakes area of North America (Fig. 7d). The increased LWP over the Southern Ocean in the EXP run results in the negative SFCDSW differences (Fig. 6c).
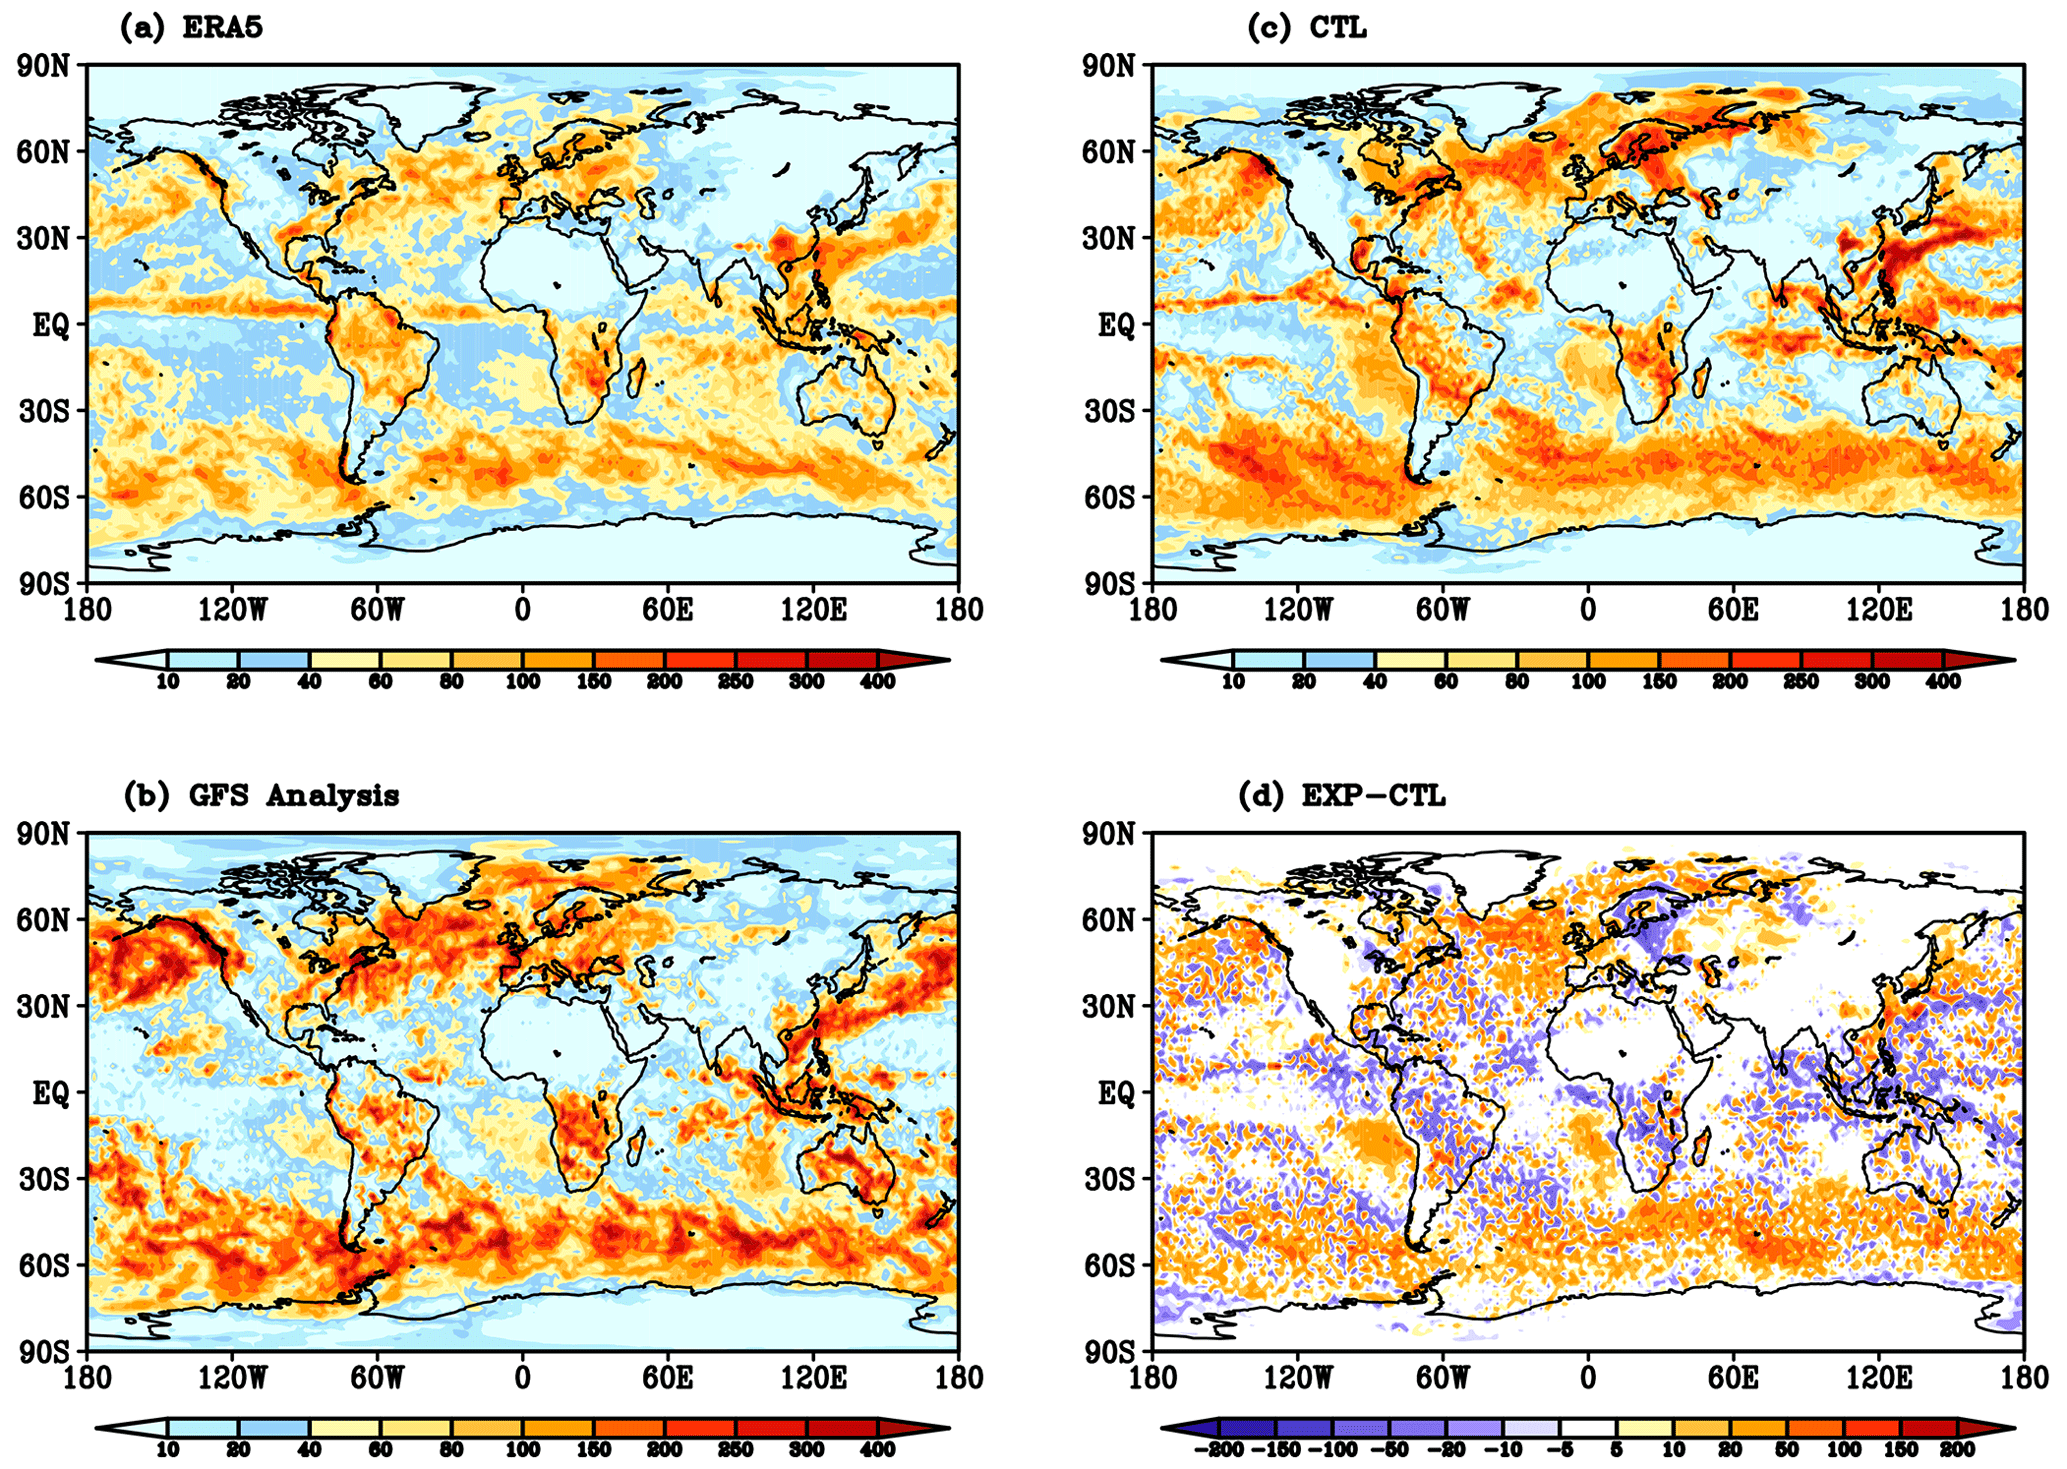
Figure 7The 120 h forecast liquid water path (LWP, g m−2) from (a) ERA5, (b) GFS analysis, (c) the CTL run, and (d) the difference between EXP and CTL (EXP minus CTL).
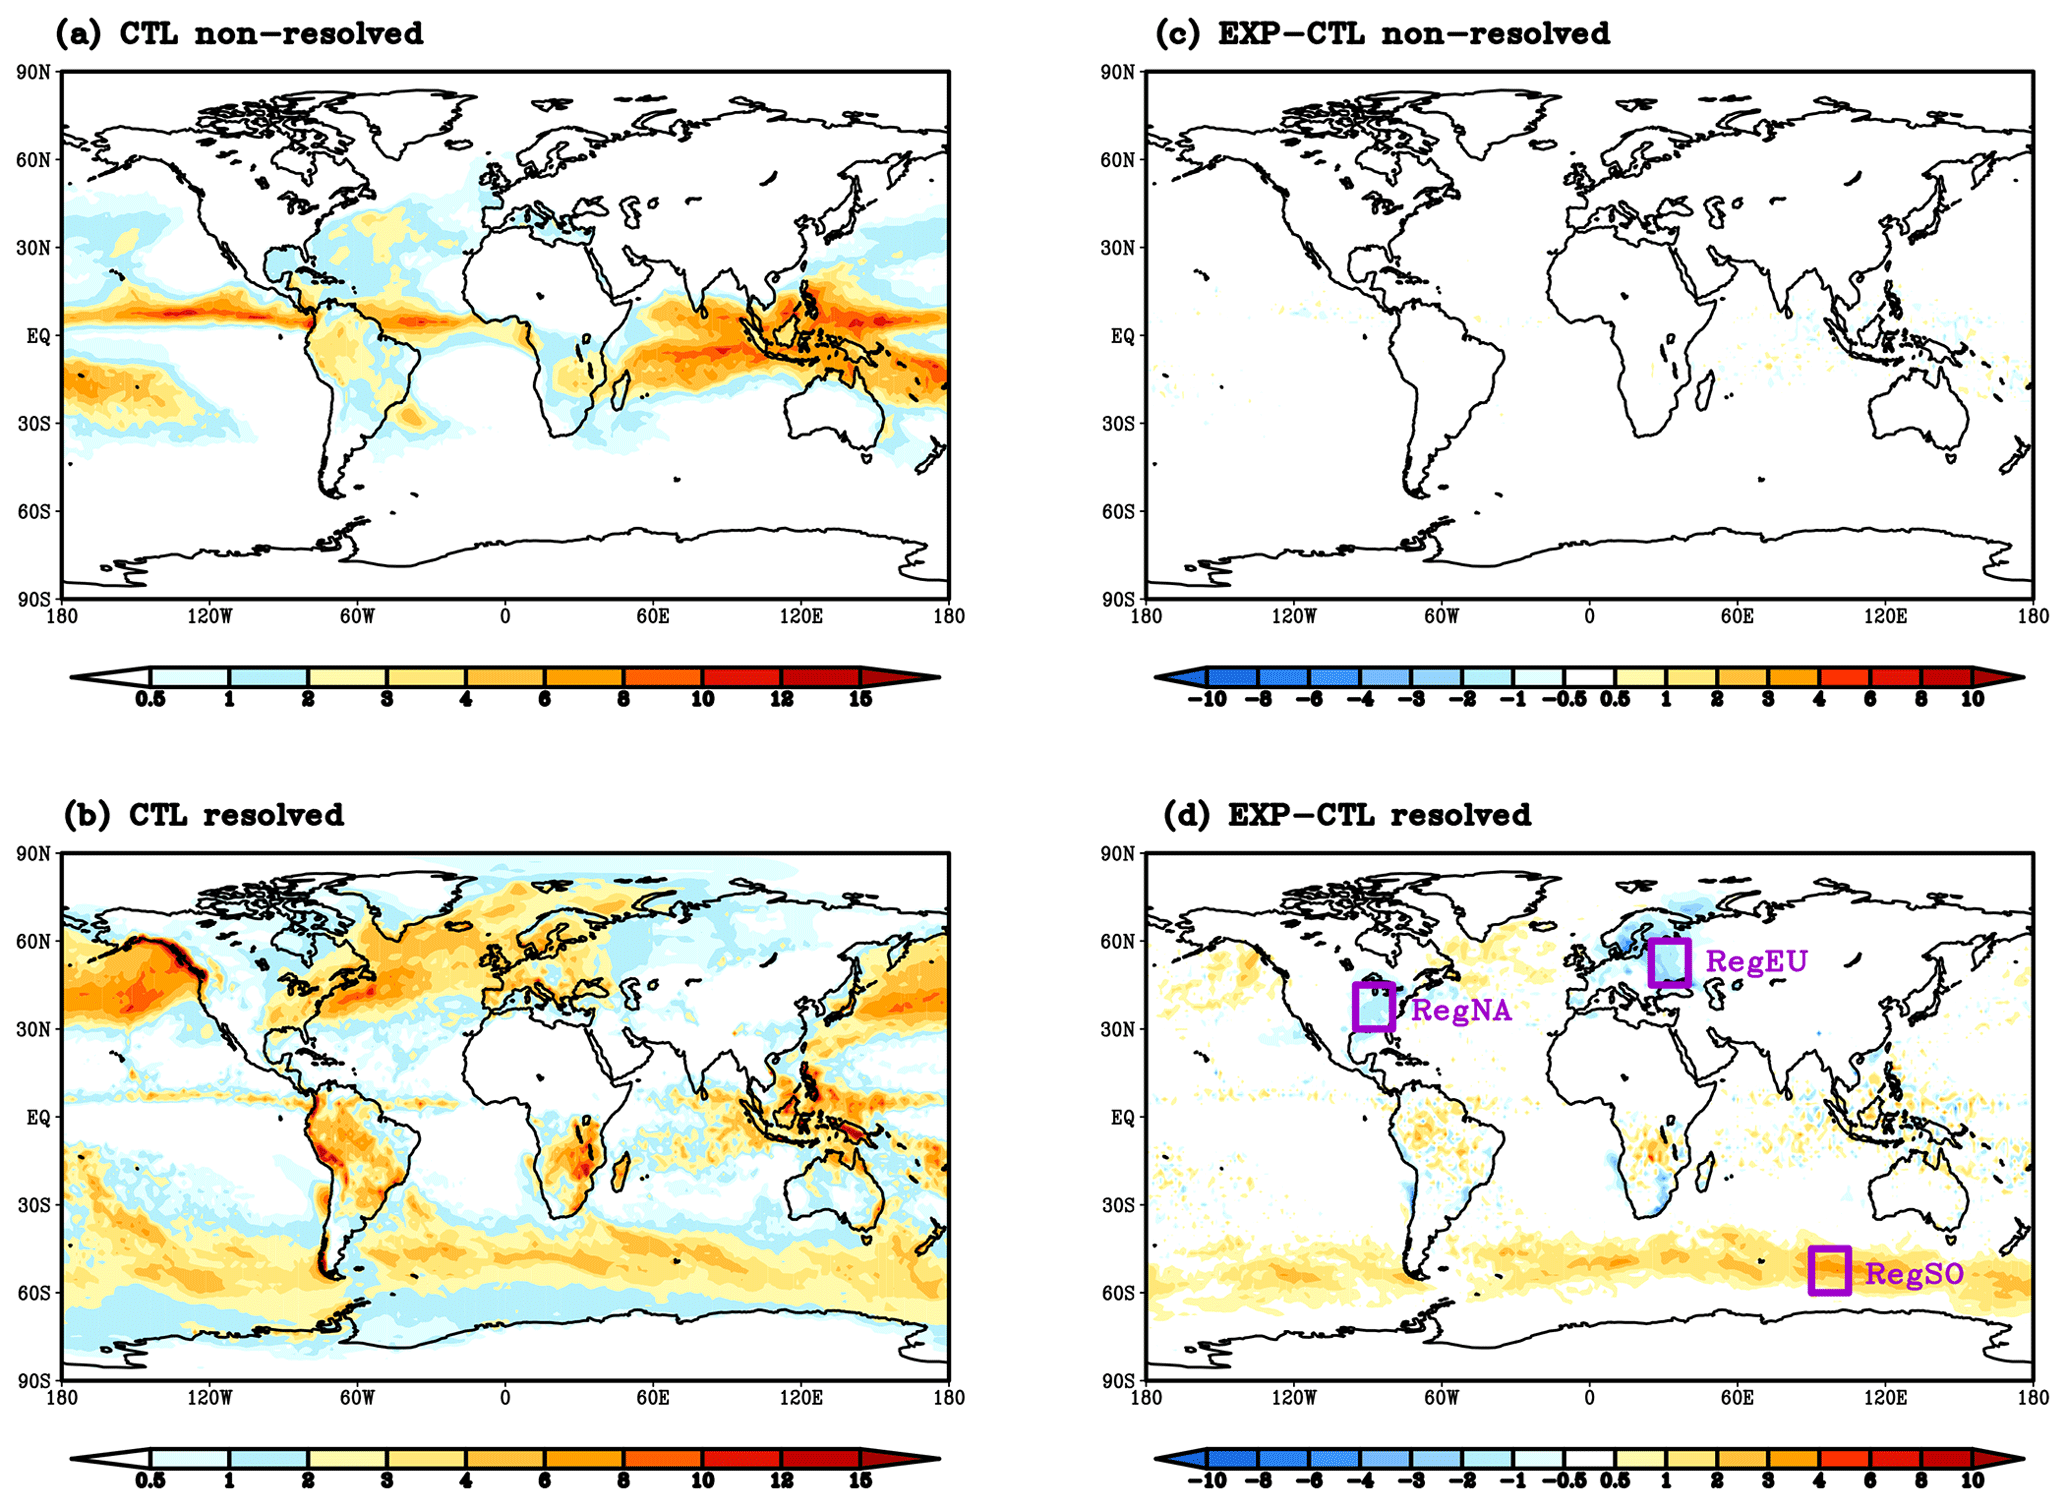
Figure 8The 120 h averaged (a) non-resolved precipitation (mm d−1) and (b) resolved precipitation (mm d−1) from the CTL run and the differences of (c) non-resolved precipitation (mm d−1) and (d) resolved precipitation (mm d−1) between the EXP and CTL runs (EXP minus CTL).
3.4 Precipitation
The 120 h averaged non-resolved precipitation and resolved precipitation are shown in Fig. 8a and b, respectively. The non-resolved precipitation is distributed mainly over the tropics (Fig. 8a), while the resolved precipitation is distributed mainly over the mid-latitude and high-latitude areas (Fig. 8b). This is, of course, expected, since most of the non-resolved precipitation is of a convective nature and handled by the GF scheme, which in our tests is not dependent on aerosols. Therefore, the difference in non-resolved precipitation between the EXP and CTL runs is very small and noisy (Fig. 8c). On the other hand, there are significant and interesting differences in the resolved precipitation fields (Fig. 8d). First, the EXP runs have less resolved precipitation over eastern North America and Europe and slightly more over the northern oceans. Second, and maybe most interesting, there appears to be significantly more precipitation over the southern high latitudes. The global mean non-resolved precipitation and resolved precipitation from the CTL runs are 1.20 and 1.90 mm d−1, respectively. The global mean non-resolved precipitation and resolved precipitation from the EXP runs are very similar with 1.19 and 1.99 mm d−1, respectively.
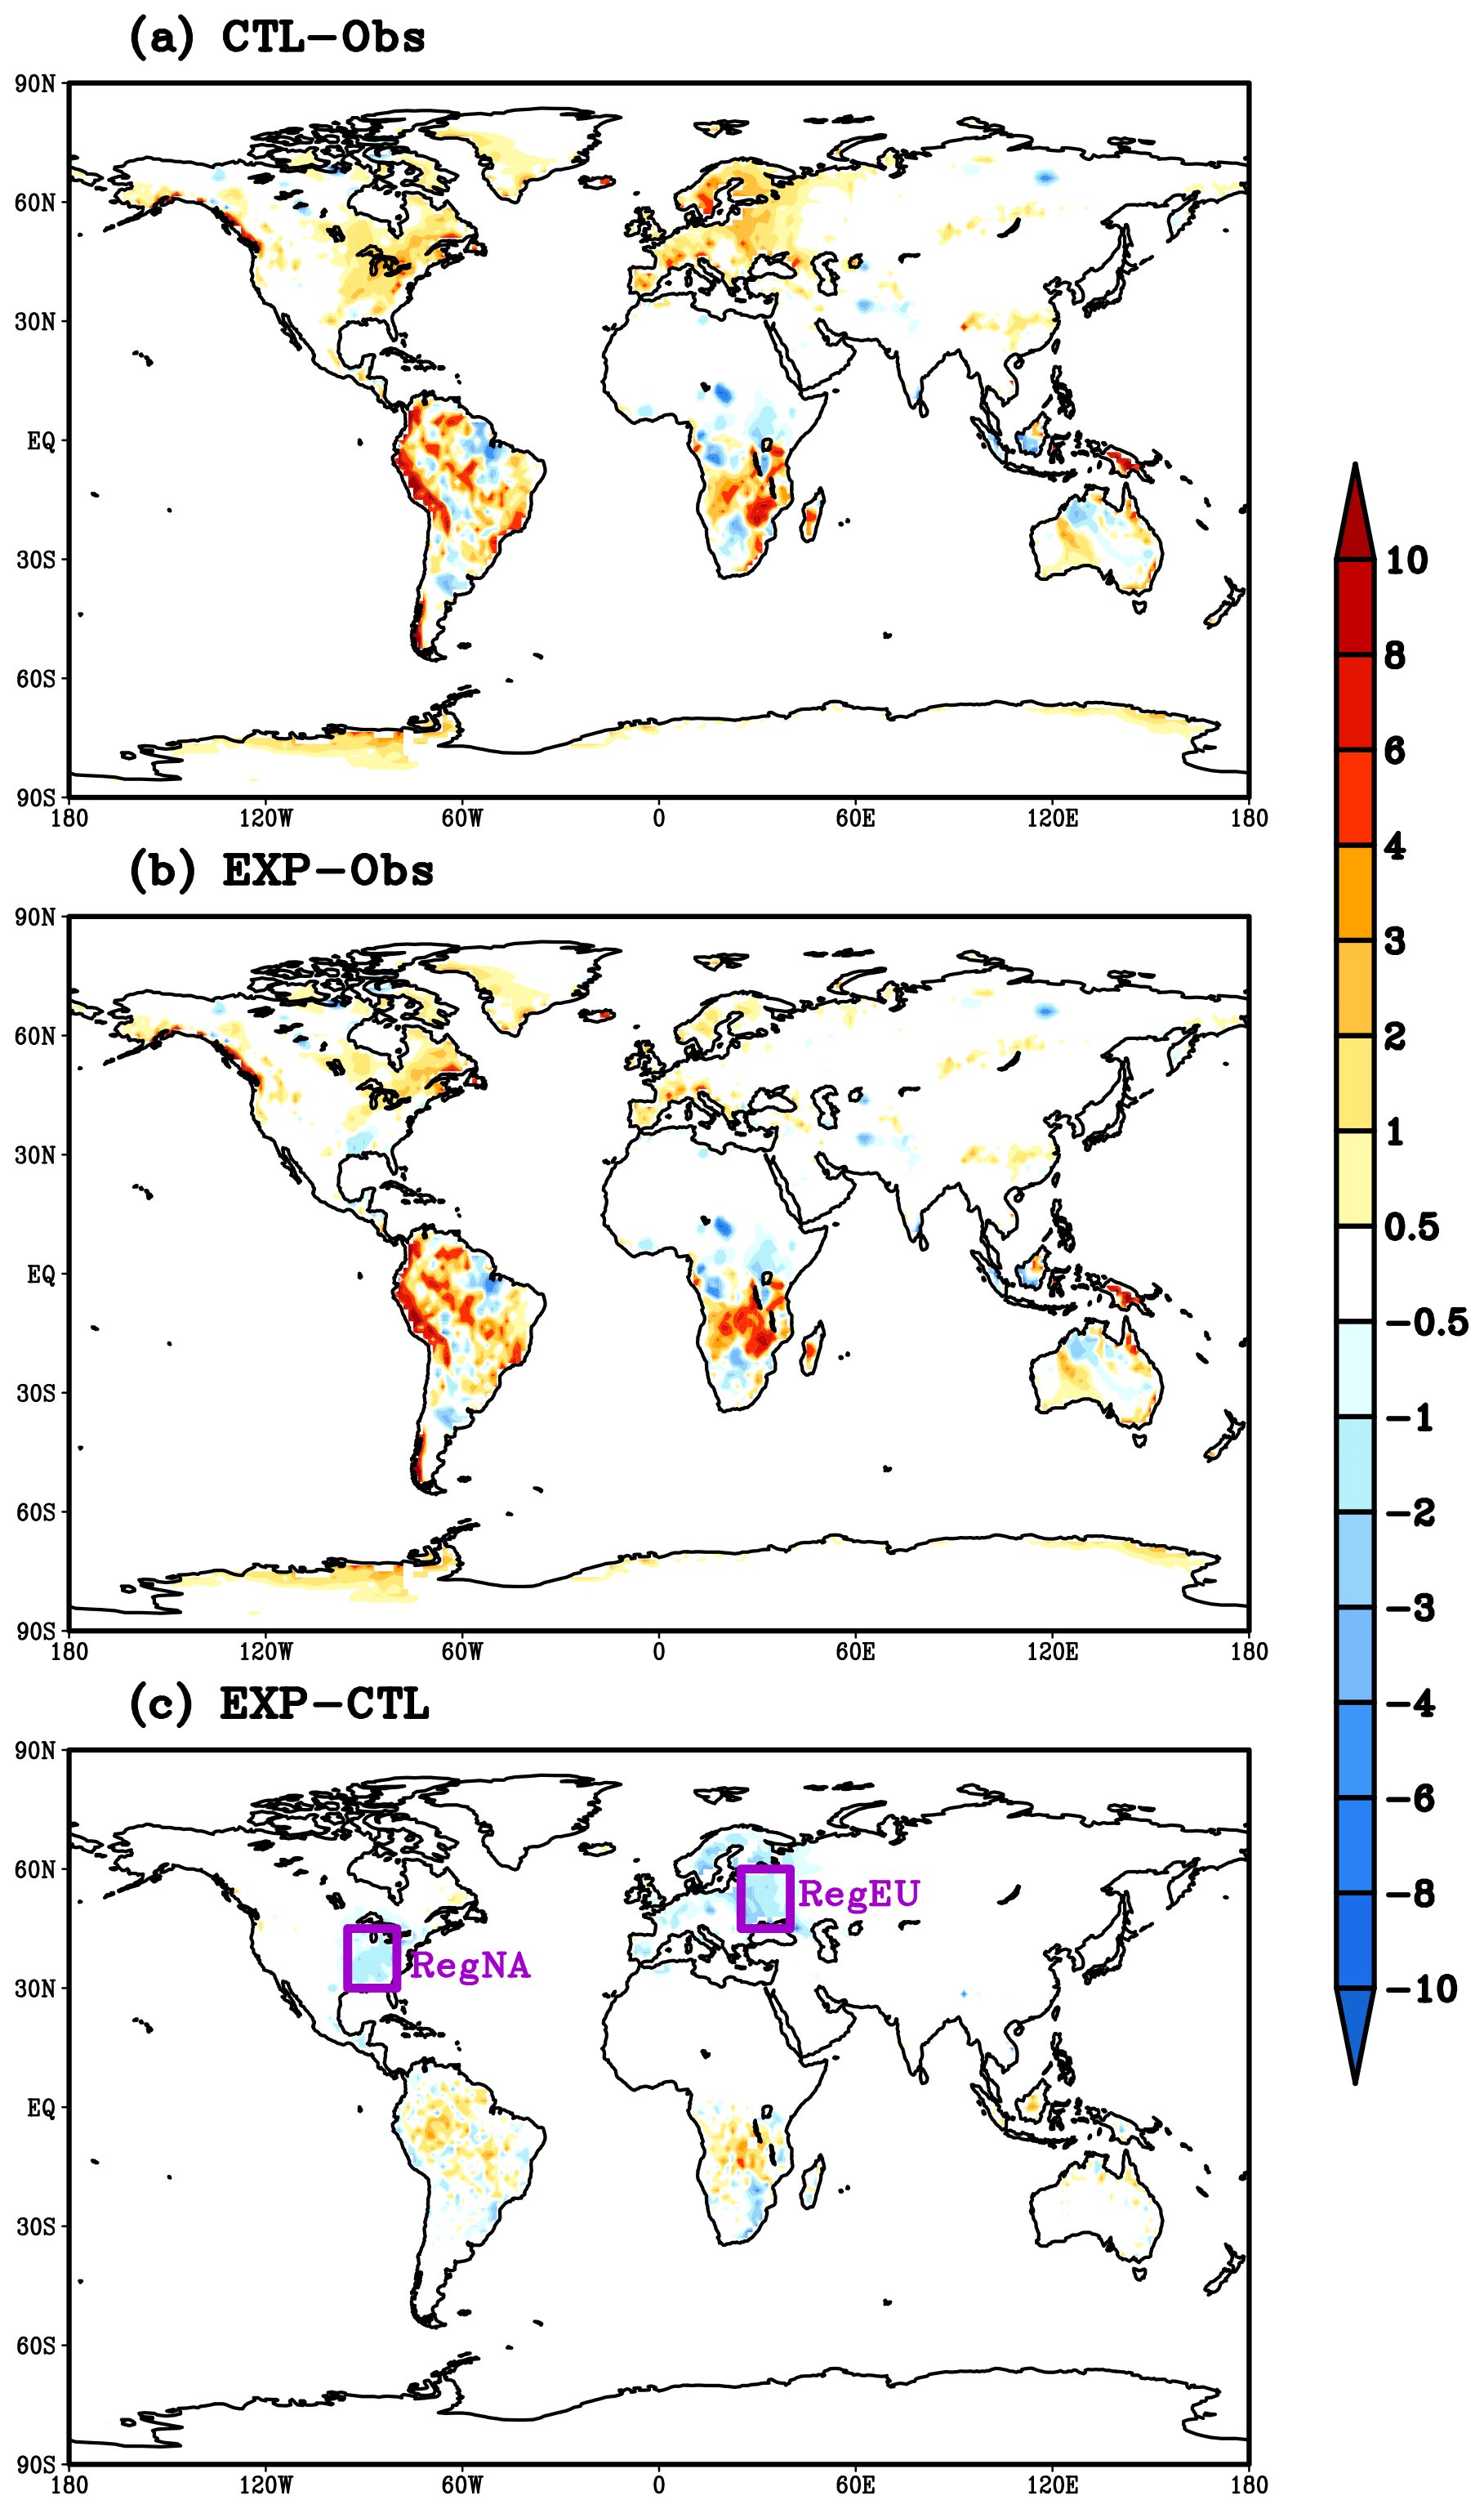
Figure 9The 120 h averaged total precipitation bias (mm d−1) from (a) the CTL run against CPC rain gauge observations, (b) the EXP run against CPC rain gauge observations, and (c) the difference (mm d−1) between the EXP and CTL runs (EXP minus CTL).
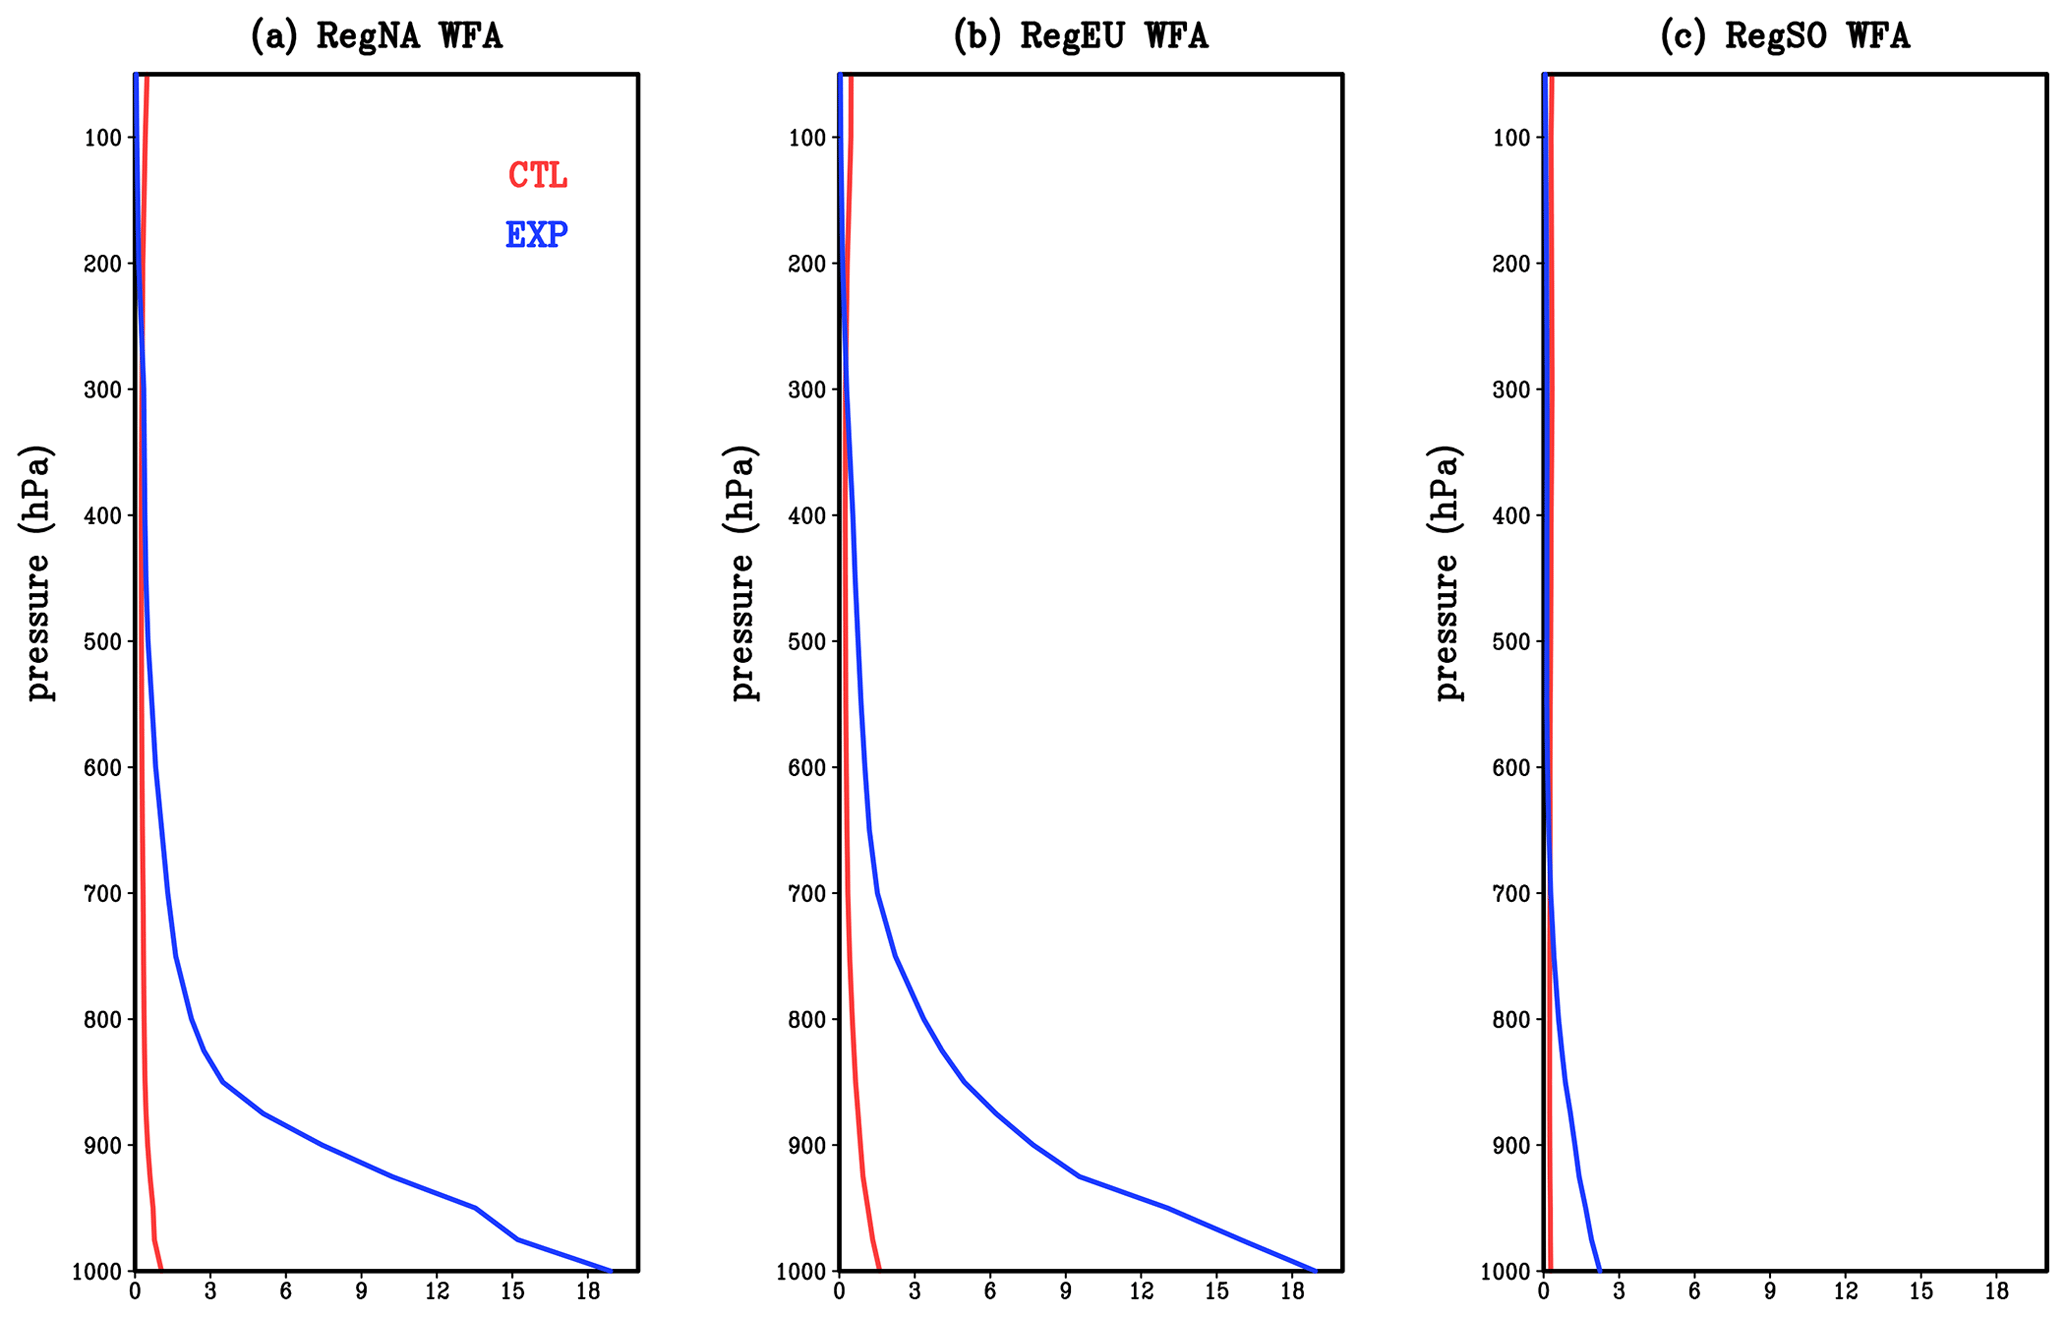
Figure 10The 120 h forecast WFA number concentration (10+9 kg−1) vertical profile over (a) RegNA, (b) RegEU, and (c) RegSO.
When validating against the NOAA CPC rain gauge observations over land, there is a widespread positive precipitation bias over the eastern North America and Europe (Fig. 9a) from the CTL runs, and this positive bias appears improved in the EXP runs (Fig. 9b, c). The global mean CPC rain gauge observation over land is 1.40 mm d−1, and the global mean precipitation from the averaged CTL runs over land is 1.78 mm d−1 with a 27.1 % overestimation, while the global mean precipitation from the averaged EXP runs over land is 1.69 mm d−1, reducing the overestimation to 20.7 %.
The EXP runs have significantly higher aerosol loading than the CTL runs over Europe and North America and slightly higher aerosol loading over the high-latitude Southern Ocean. Interestingly there are opposite resolved precipitation responses to aerosols with less resolved precipitation over North America and Europe and more resolved precipitation over the Southern Ocean. We selected three regions over North America (30–45∘ N, 95–80∘ W; RegNA), Europe (45–60∘ N, 25–40∘ E; RegEU), and the Southern Ocean (60–45∘ S, 90–105∘ E; RegSO) to further analyze the mechanism of aerosol impacts. The total precipitation is almost completely determined by resolved precipitation over these three domains.
Figure 10a, b, and c show some interesting differences and help explain the difference in behavior. There is a significant increase in surface WFA number concentration to about 19×109 kg−1 over RegNA (Fig. 10a) and RegEU (Fig. 10b), while the surface WFA number concentration is only slightly increased to 2.5×10⁹ kg−1 over RegSO (Fig. 10c). The high aerosol concentration from the EXP run results in more cloud droplets with reduced diameter, and it further reduced the autoconversion and collision coalescence in raindrops and less resolved precipitation over RegNA and RegEU. The CPC rain gauge observation is 1.31 mm d−1 over RegEU. When calculating the domain-averaged total precipitation from the CTL runs we get 3.06 mm d−1, while the average for the EXP runs is 1.34 mm d−1, significantly less. The CPC rain gauge observations averaged over RegNA show 2.23 mm d−1. The domain-averaged total precipitation from the CTL runs is 3.38 mm d−1 over the same area and is reduced to 2.12 mm d−1 when averaged for the EXP runs. It indicates the resolved precipitation response to aerosols over RegNA and RegEU is from the indirect effect. It looks like the moderate increase in aerosols over RegSO from the EXP runs enhances cloud water generation and results in more resolved precipitation. Since there are few CCN over the Southern Ocean, which is away from continental influence, an increase in the number of CCN may significantly impact the microphysics of precipitating clouds (Albrecht, 1989). Fan et al. (2016) also pointed out that recent studies consistently found that adding CCN to warm clouds with very low cloud drop concentrations (Nd) can invigorate them to enhance their vertical development, leading to higher cloud tops, more cloud water content, and enhanced precipitation rates. Increased cloud water may also lead to increased freezing and latent heating above the freezing level, further invigorating the clouds.
In this study, a simple and realistic method is used to provide online aerosol emissions for the aerosol-aware TH-E double-moment microphysics in the UFS Weather Model. In TH-E MP, the hygroscopic aerosol is referred to as WFA, and the non-hygroscopic ice-nucleating aerosol is referred to as IFA. We conducted two sets of retrospective runs to examine the indirect aerosol effect through microphysics when using this MP scheme. The CTL experiment applied the GOCART climatology as an initial condition for WFA and IFA, and it also uses a default empirical formula to compute WFA tendencies. In the runs from the EXP experiment, modules of sea-salt emissions, dust emissions, biomass-burning emissions, and anthropogenic aerosol emissions are calculated in-line without chemical interactions and are embedded into the UFS Weather Forecast Model as CCPP-compliant schemes. In this study, the EXP uses initial conditions from the operational GEFS-Aerosols model. In operational applications WFAs and IFAs could be cycled to be independent of GEFS-Aerosols. Although there are no additional tracer variables introduced in this simple and very cost-efficient approach presented here, if a cycled application (no initial conditions from GEFS-Aerosols) is preferred, sulfate may be required as one additional tracer variable with some sulfate chemical interactions.
As one possible validation method, we compared AOD forecasts that would result from EXP runs, CTL runs, and AOD analysis from MERRA-2 and ECMWF. The 550 nm AOD forecast from the EXP runs is significantly better compared to the CTL run, but further improvements may be necessary to match the MERRA-2 and/or ECMWF AOD reanalysis even more closely. This may be achieved through improved representation of the emissions and wet and dry scavenging. It may also be possible to introduce one or two additional variables to treat wet scavenging differently, depending on the substance. The closer resemblance of the EXP predictions of AOD to the available analysis products suggests further testing our approach with prognostic aerosol emissions for the aerosol direct effects. The indirect cloud-radiation differences between the EXP and CTL experiments respond in a physically consistent way to the aerosol differences. There are more high, medium, low, and total cloud-cover fractions from the EXP run over the Northern Hemisphere and fewer medium cloud-cover fractions over the tropics. In the EXP run, the SFCDSW is stronger over the tropics, which corresponds to fewer aerosols and lower medium cloud-cover fraction. Lower SFCDSW over the Northern Hemisphere corresponds to areas with more aerosols and higher cloud-cover fractions in the EXP runs, while lower SFCDSW over the Southern Ocean from the EXP runs appears to be mainly caused by increased cloud water. However, there are distinct differences in resolved precipitation with different aerosol response mechanisms. For the EXP experiment, the very high and significantly increased aerosol number concentrations over Europe and North America result in less resolved precipitation in those areas. On the other hand, there are very low aerosol number concentrations over the Southern Ocean, with the slightly increased aerosols from the EXP runs enhancing cloud water generation to result in more resolved precipitation. Compared to rain gauge observations we were able to significantly improve precipitation biases over eastern North America and Europe. We also looked at anomaly correlation coefficients (ACCs) for 500 hPa geopotential height but found only insignificant differences between the two experiments (not shown). This indicates the aerosol difference impact on large-scale circulation is neutral in this study. This is consistent with the study of implementing a new aerosol climatology dataset into the ECMWF Integrated Forecasting System (IFS) by Bozzo et al. (2020). They reported that the use of a new aerosol climatology has a small impact on the forecast skill of large-scale weather patterns but has a large local impact on the regional distribution of aerosol radiative forcings.
Computing cost is an important factor preventing coupling of complex chemistry modules with NWP models. Compared with the CTL runs, the additional computing time from the EXP runs is very limited, making this simple and realistic aerosol emission approach very affordable for operational NWP. This study shows that the aerosols in double-moment microphysics can have significant indirect feedback and impacts on the short-range weather forecasts, and a realistic representation of aerosol emissions should be considered in operational NWP. In order to focus on the microphysics response to aerosols, the aerosol-aware feature of GF convection was off in this study, and we will present the convection response to aerosols in a following study. Additionally, we will test the direct radiative impact when using the aerosol optical properties derived from the two double-moment microphysics aerosol variables.
The exact version of the UFS Weather Model used to produce the results used in this paper and data for model assessment are available at https://doi.org/10.5281/zenodo.7951581 (Li et al., 2023). The aerosol reanalysis of ECMWF's CAMS is from https://www.ecmwf.int/en/research/climate-reanalysis/cams-reanalysis (Inness et al., 2019), and the aerosol reanalysis of MERRA-2 is from https://gmao.gsfc.nasa.gov/reanalysis/MERRA-2/ (Ronald et al., 2017). The CERES radiation flux observations are available at https://ceres.larc.nasa.gov/ (Rutan et al., 2015). The NOAA CPC daily precipitation is available at https://psl.noaa.gov/data/gridded/data.cpc.globalprecip.html (Chen and Xie, 2008). The GFS analysis is available at https://doi.org/10.5065/D65D8PWK (NCEP, 2015).
HL, GAG, and RA contributed to the conceptualization and methodology; HL and GAG conducted the formal analysis and investigation; GAG was responsible for funding acquisition and supervision; and HL was responsible for validation and visualization. The original draft was written by HL, GAG, and RA, while LZ, SS, JS, and NW reviewed and edited the paper.
The contact author has declared that none of the authors has any competing interests.
Publisher’s note: Copernicus Publications remains neutral with regard to jurisdictional claims made in the text, published maps, institutional affiliations, or any other geographical representation in this paper. While Copernicus Publications makes every effort to include appropriate place names, the final responsibility lies with the authors.
This research has been supported by the NOAA Global Systems Laboratory (GSL) base funds (NOAA cooperative agreements NA22OAR4320151) and the Disaster Relief Supplemental Appropriations (DRSA) Act FIRE10 through Public Law 117–43 signed 30 September 2021, with the spending plan approved by Congress 30 March 2022.
This paper was edited by David Topping and reviewed by two anonymous referees.
Ackermann, I. J., Hass, H., Memmesheimer, M., Ebel, A., Binkowski, F. S., and Shankar, U.: Modal aerosol dynamics model for Europe: Development and first applications, Atmos. Environ., 32, 2981–2999, https://doi.org/10.1016/s1352-2310(98)00006-5, 1998.
Albrecht, A. B.: Aerosols, Cloud Microphysics, and Fractional Cloudiness, Science, 245, 1227–120, https://doi.org/10.1126/science.245.4923.1227, 1989.
Baklanov, A., Schlünzen, K., Suppan, P., Baldasano, J., Brunner, D., Aksoyoglu, S., Carmichael, G., Douros, J., Flemming, J., Forkel, R., Galmarini, S., Gauss, M., Grell, G., Hirtl, M., Joffre, S., Jorba, O., Kaas, E., Kaasik, M., Kallos, G., Kong, X., Korsholm, U., Kurganskiy, A., Kushta, J., Lohmann, U., Mahura, A., Manders-Groot, A., Maurizi, A., Moussiopoulos, N., Rao, S. T., Savage, N., Seigneur, C., Sokhi, R. S., Solazzo, E., Solomos, S., Sørensen, B., Tsegas, G., Vignati, E., Vogel, B., and Zhang, Y.: Online coupled regional meteorology chemistry models in Europe: current status and prospects, Atmos. Chem. Phys., 14, 317–398, https://doi.org/10.5194/acp-14-317-2014, 2014.
Bozzo, A., Benedetti, A., Flemming, J., Kipling, Z., and Rémy, S.: An aerosol climatology for global models based on the tropospheric aerosol scheme in the Integrated Forecasting System of ECMWF, Geosci. Model Dev., 13, 1007–1034, https://doi.org/10.5194/gmd-13-1007-2020, 2020.
Chen, M. and Xie, P.: CPC Unified Gauge-based Analysis of Global Daily Precipitation, 2008 Western Pacific Geophysics Meeting, Cairns, Australia, 29 July–1 August 2008, ftp://ftp.cpc.ncep.noaa.gov/precip/CPC_UNI_PRCP/GAUGE_GLB/DOCU/Chen_et_al_2008_Daily_Gauge_Anal.pdf (last access: 27 May 2023), 2008.
Colarco, P., da Silva, A., Chin, and Diehl, T.: Online simulations of global aerosol distributions in the NASA GEOS-4 model and comparisons to satellite and ground-based aerosol optical depth, J. Geophys. Res., 115, D14207, https://doi.org/10.1029/2009JD012820, 2010.
Conrick, R., Mass, C., Boomgard-Zagrodnik, J., and Ovens, D.: The influence of Wildfire Smoke on Cloud Microphysics during the September 2020 Pacific Northwest Wildfires, Weather Forecast., 36, 1519–1536, https://doi.org/10.1175/WAF-D-21-0044.1, 2021.
Fan, J., Wang, Y., Rosenfeld, D., and Liu, X.: Review of Aerosol-Cloud Interactions: Mechanisms, Significance, and Challenge, J. Atmos. Sci., 73, 4221–4252, https://doi.org/10.1175/JAS-D-16-0037.1, 2016.
Freitas, S. R., Grell, G. A., and Li, H.: The Grell–Freitas (GF) convection parameterization: recent developments, extensions, and applications, Geosci. Model Dev., 14, 5393–5411, https://doi.org/10.5194/gmd-14-5393-2021, 2021.
Grell, G. A. and Freitas, S. R.: A scale and aerosol aware stochastic convective parameterization for weather and air quality modeling, Atmos. Chem. Phys., 14, 5233–5250, https://doi.org/10.5194/acp-14-5233-2014, 2014.
Grell, G. A., Peckham, S. E., McKeen, S., Schmitz, R., Frost, G., Skamarock, W. C., and Eder, B.: Fully coupled “online” chemistry within the WRF model, Atmos. Environ., 39, 6957–6975, https://doi.org/10.1016/j.atmosenv.2005.04.027, 2005.
Grell, G., Freitas, S. R., Stuefer, M., and Fast, J.: Inclusion of biomass burning in WRF-Chem: impact of wildfires on weather forecasts, Atmos. Chem. Phys., 11, 5289–5303, https://doi.org/10.5194/acp-11-5289-2011, 2011.
Gryspeerdt, E., Goren, T., Sourdeval, O., Quaas, J., Mülmenstädt, J., Dipu, S., Unglaub, C., Gettelman, A., and Christensen, M.: Constraining the aerosol influence on cloud liquid water path, Atmos. Chem. Phys., 19, 5331–5347, https://doi.org/10.5194/acp-19-5331-2019, 2019.
Heinzeller, D., Bernardet, L., Firl, G., Zhang, M., Sun, X., and Ek, M.: The Common Community Physics Package (CCPP) Framework v6, Geosci. Model Dev., 16, 2235–2259, https://doi.org/10.5194/gmd-16-2235-2023, 2023.
Hoffmann, F. and Feingold, G.: Cloud Microphysical Implications for Marine Cloud Brightening: The Importance of the Seeded Particle Size Distribution, J. Atmos. Sci., 78, 3247–3262, https://doi.org/10.1175/JAS-D-21-0077.1, 2021.
Hong, S., Park, H., Cheong, H., Kim, J., Koo, M., Jang, J., Jam, S., Hwang, S., Park, B., Chang, E., and Li, H.: The Global/Regional Integrated Model System (GRIMs), Asia Pac. J. Atmos. Sci., 49, 219–243, https://doi.org/10.1007/s13143-013-0023-0, 2013.
Hong, S., Li, H., Bao, J.-W., Grell, G., and Sun, R.: A Semi-Lagrangian Advection Algorithm for Falling Raindrops in aTwo-Moment Microphysics Schemes, EGU General Assembly 2022, Vienna, Austria, 23–27 May 2022, EGU22-8984, https://doi.org/10.5194/egusphere-egu22-8984, 2022.
Hoesly, R. M., Smith, S. J., Feng, L., Klimont, Z., Janssens-Maenhout, G., Pitkanen, T., Seibert, J. J., Vu, L., Andres, R. J., Bolt, R. M., Bond, T. C., Dawidowski, L., Kholod, N., Kurokawa, J.-I., Li, M., Liu, L., Lu, Z., Moura, M. C. P., O'Rourke, P. R., and Zhang, Q.: Historical (1750–2014) anthropogenic emissions of reactive gases and aerosols from the Community Emissions Data System (CEDS), Geosci. Model Dev., 11, 369–408, https://doi.org/10.5194/gmd-11-369-2018, 2018.
Inness, A., Ades, M., Agustí-Panareda, A., Barré, J., Benedictow, A., Blechschmidt, A.-M., Dominguez, J. J., Engelen, R., Eskes, H., Flemming, J., Huijnen, V., Jones, L., Kipling, Z., Massart, S., Parrington, M., Peuch, V.-H., Razinger, M., Remy, S., Schulz, M., and Suttie, M.: The CAMS reanalysis of atmospheric composition, Atmos. Chem. Phys., 19, 3515–3556, https://doi.org/10.5194/acp-19-3515-2019, 2019 (data available at: https://www.ecmwf.int/en/research/climate-reanalysis/cams-reanalysis, last access: 21 January 2024).
Jacobs, N. A.: Open Innovation and the Case for Community Model Development, B. Am. Meteor. Soc., 102, E2002–E2011, https://doi.org/10.1175/BAMS-D-21-0030.1, 2021.
Kang, J., Bae, S., Park, R., and Han, J.: Aerosol Indirect Effects on the Predicted Precipitation in a Global Weather Forecasting Model, Atmosphere, 10, 392, https://doi.org/10.3390/atmos10070392, 2019.
Li, H., Grell, G., Zhang, L., Ahmadov, R., Mckeen, S., Henderson, J., Trahan, S., Barnes, H., Sun, S., Schnell, J., and Heinzeller, D.: The Inclusion of chemistry modules into the NOAA UFS Weather Model with the Common Community Physics Package (CCPP), EGU General Assembly 2021, online, 19–30 Apr 2021, EGU21-13401, https://doi.org/10.5194/egusphere-egu21-13401, 2021.
Li, H., Grell, G., Ahmadov, R., Zhang, L., Sun, S., Schnell, J., and Wang, N.: Source code and data for aerosol emission and indirect feedback paper (Version v1), Zenodo [data set], https://doi.org/10.5281/zendo.7951581, 2023.
Lin, S.: A “Vertically Lagrangian” Finite-Volume Dynamical Core for Global Models, Mon. Weather Rev., 132, 2293–2307, https://doi.org/10.1175/1520-0493(2004)132<2293:AVLFDC>2.0.CO;2, 2004.
Mulcahy, J. P., Walters, D. N., Bellouin, N., and Milton, S. F.: Impacts of increasing the aerosol complexity in the Met Office global numerical weather prediction model, Atmos. Chem. Phys., 14, 4749–4778, https://doi.org/10.5194/acp-14-4749-2014, 2014.
National Centers for Environmental Prediction/National Weather Service/NOAA/U.S. Department of Commerce (NCEP): NCEP GFS 0.25 Degree Global Forecast Grids Historical Archive, updated daily, Research Data Archive at the National Center for Atmospheric Research, Computational and Information Systems Laboratory [data set], https://doi.org/10.5065/D65D8PWK, 2015.
Nakanishi, M. and Niino, H.: Development of an improved turbulence closure model for the atmospheric boundary layer, J. Meteor. Soc. Jpn., 87, 895–912, https://doi.org/10.2151/jmsj.87.895, 2009.
Olson, J. B., Kenyon, J. S., Angevine, W. M., Brown, J. M., Pagowski, M., and Sušelj, K.: A description of the MYNN-EDMF scheme and coupling to other components in WRF-ARW, NOAA Tech. Memo. OAR GSD, 61, 37 pp., https://doi.org/10.25923/n9wm-be49, 2019.
Powers, J. G., Klemp. J. B., Skamarock, W. C., Davis, C. A., Dudhia, J., Gill, D. O., Coen, J. L., Gochis, D. J., Ahmadov, R., Peckham, S. E., Grell, G. A., Michalakes, J., Trahan, S., Benjamin, S. G., Alexander, C. R., Dimego, G. J., Wang, W., Schwartz, G. S., Romine, G. S., Liu, Z., Snyder, C., Chen, F., Barlage, M. J., Yu, W., and Duda, M. G.: The Weather Research and Forecast Model Overview, System Efforts, and Future Directions, B. Am. Meteor. Soc., 98, 1717–1737, https://doi.org/10.1175/bams-d-15-00308.1, 2017.
Rutan, D. A., Kato, S., Doelling. D. R., Rose, F. G., Nguyen, L. T., Galdwell, T. E., and Norman, G. L.: CERES Synoptic Product: Methodology and Validation of Surface Radiant Flux, J. Atmos. Ocean. Tech., 6, 1121–1143, https://doi.org/10.1175/JTECH-D-14-00165.1, 2015 (data available at: https://ceres.larc.nasa.gov/, last access: 21 January 2024).
Ronald, G., McCarty, W., Suarez, M. J., Todling, R., Molod, A., Takacs, L., Randles, C. A., Darmenov, A., Bosilovich, M. G., Reichle, R., Wargan, K., Coy, L., Gullather, R., Draper, C., Akella, S., Buchard, V., Conaty, A., da Silva, A. M., Gu, W., Kim, G., Koster, R., Lucchesi, R., Merkova, D., Nielsen, J. E., Partyka, G., Pawson, S., Putman, W., Rienecker, M., Schubert, S. D., Sienkiewicz, M., and Zhao, B.: The Modern-Era Retrospective Analysis for Research and Applications, Version 2 (MERRA-2), J. Climate, 30, 5419–5454, https://doi.org/10.1175/JCLI-D-16-0758.1, 2017 (data available at: https://gmao.gsfc.nasa.gov/reanalysis/MERRA-2/, last access: 21 January 2024).
Tao, W.-K., Chen, J.-P., Li, Z., Wang, C., and Zhang, C.: Impact of aerosols on convective clouds and precipitation, Rev. Geophys., 50, RG2001, https://doi.org/10.1029/2011RG000369, 2012.
Tong, D. Q., Wang, J. X. L., Gill, T. E., Lei, H., and Wang, B.: Intensified dust storm activity and Valley fever infection in the southwestern United States, Geophys. Res. Lett., 44, 4304–4312, https://doi.org/10.1002/2017GL073524, 2017.
Thompson, G. and Eidhammer, T.: A study of aerosol impacts on clouds and precipitation development in a large winter cyclone, J. Atmos. Sci., 71, 3636–3658, https://doi.org/10.1175/JAS-D-13-0305.1, 2014.
Twomey, S.: The influence of Pollution on the Shortwave Albedo of Clouds, J. Atmos. Sci., 34, 1149–1152, https://doi.org/10.1175/1520-0469(1977)034<1149:TIOPOT>2.0.CO;2, 1977.
Yoo, H. and Li, Z.: Evaluation of cloud properties in the NOAA/NCEP global forecast system using multiple satellite products, Clim. Dynam., 39, 2769–2787, https://doi.org/10.1007/s00382-012-1430-0, 2012.
Zhang, L., Montuoro, R., McKeen, S. A., Baker, B., Bhattacharjee, P. S., Grell, G. A., Henderson, J., Pan, L., Frost, G. J., McQueen, J., Saylor, R., Li, H., Ahmadov, R., Wang, J., Stajner, I., Kondragunta, S., Zhang, X., and Li, F.: Development and evaluation of the Aerosol Forecast Member in the National Center for Environment Prediction (NCEP)'s Global Ensemble Forecast System (GEFS-Aerosols v1), Geosci. Model Dev., 15, 5337–5369, https://doi.org/10.5194/gmd-15-5337-2022, 2022.
Zhang, X., Kondragunta, S., da Silva, A., Lu, S., Ding, H., Li, F., and Zhu, Y.: The blended global biomass burning emissions product from MODIS and geostationary satellites (GBBEPx), http://www.ospo.noaa.gov/Products/land/gbbepx/docs/GBBEPx_ATBD.pdf (last access: 27 May 2023), 2014.
Zhao, X., Liu, X., Burrows, S. M., and Shi, Y.: Effects of marine organic aerosols as sources of immersion-mode ice-nucleating particles on high-latitude mixed-phase clouds, Atmos. Chem. Phys., 21, 2305–2327, https://doi.org/10.5194/acp-21-2305-2021, 2021.