the Creative Commons Attribution 4.0 License.
the Creative Commons Attribution 4.0 License.
 | 02 Aug 2024
An urban module coupled with the Variable Infiltration Capacity model to improve hydrothermal simulations in urban systems
Yibing Wang
Xianhong Xie
Bowen Zhu
Arken Tursun
Fuxiao Jiang
Dawei Peng
Buyun Zheng
Global urban expansion has altered surface aerodynamics and hydrothermal dynamics, aggravating environmental challenges such as urban heat and urban dry islands. To identify such environmental responses, various physical models, including urban canyon models (UCMs) and land surface models (LSMs), have been developed to represent surface hydrothermal processes. However, UCMs often treat a city as a unified entity and overlook subcity heterogeneity. LSMs are generally designed for natural land cover types and lack the capability to capture urban characteristics. To address these limitations, the aim of this study is to couple an urban module with a sophisticated LSM, i.e. the Variable Infiltration Capacity (VIC) model. This coupled model, i.e. the VIC-urban model, is characterized by its ability to coordinate certain critical urban features, including urban geometry, radiative interactions, and human impacts. Adopting Beijing as an evaluation site, the VIC-urban model shows higher performance than the original version, with excellent accuracy in simulating sensible heat, latent heat, runoff, and land surface temperature (LST). The absolute error is smaller than 25 % for the sensible heat and latent heat and smaller than 12 % and 30 % for the LST and runoff, respectively, which indicates that VIC-urban can effectively simulate hydrological and thermal fluxes in urban systems. Sensitivity analysis reveals that the roof emissivity and interception capacity exert the greatest impact on the roof temperature and evaporation and the height-to-width ratio has the greatest influence on the canyon. Our work introduces a reliable option for large-scale land surface simulations that accounts for urban environments and is among the first attempts to establish a systematic urban modelling framework of the VIC model. The VIC-urban model enables the analysis of urbanization-induced environmental changes and quantification of environmental variations among different urban configurations. The proposed model can thus offer invaluable insights for urban planners and landscape designers.
- Article
(14191 KB) - Full-text XML
-
Supplement
(1299 KB) - BibTeX
- EndNote


Urban areas have been expanding globally and are characterized by increasing impervious surfaces and decreasing natural land coverage. This land cover change has led to alterations in surface aerodynamics and hydrothermal dynamics, resulting in decreased local evaporation and an exacerbation of temperature and extreme precipitation events (Yang et al., 2021). It has caused numerous environmental issues, such as urban heat islands (Morabito et al., 2021; Yao et al., 2021), urban dry islands (Meili et al., 2022; Li et al., 2021), and inundation problems (Mu et al., 2020; Huang et al., 2022). Moreover, cities encompass unique land surface processes, which differ from those of natural land surfaces. The difference results from diverse urban configurations, varied building materials, and human interventions (Oh and Sushama, 2021). Therefore, it is necessary to accurately quantify the impacts of urbanization and develop proper mitigation strategies (Yao et al., 2021).
As efficient tools, various land surface models (LSMs) have been rapidly developed in recent decades, providing unprecedented opportunities to obtain detailed information on the storage and movement of surface energy and water cycles (Bierkens et al., 2015). LSMs have been used for various applications, such as to study land–climate interactions (Zhong et al., 2020; Wang et al., 2020), in hydrothermal environment quantifications (Zhao et al., 2019; Huang et al., 2022), and to produce datasets (Hersbach et al., 2020; Rodell et al., 2004). However, LSMs are generally formulated for natural land surfaces (Best and Grimmond, 2015) and often overlook the unique characteristics (e.g. urban configurations and buildings) of urban systems. Specific models should be developed or improved by considering the complexity and uniqueness within cities.
The existing urban parameterization schemes in LSMs mainly involve the bulk approach and coupling with urban canopy models (UCMs) (Ji et al., 2021; Meng, 2015). The bulk approach treats urban surfaces as a regular land cover category with modified thermal and hydrological parameters (e.g. albedo and infiltration) (Wang et al., 2020; Yang et al., 2010) but still lacks consideration of urban-specific characteristics, such as building blocking, radiative interactions (Salvadore et al., 2015), artificial heating, and irrigation (Chen et al., 2022). Coupling LSMs with UCMs (hereafter referred to as LSM-UCMs) is also a popular strategy for capturing land surface processes in urban systems. Various LSM-UCMs have been favourably applied in studies (Meng, 2015; McNorton et al., 2021; Yang et al., 2010), including the Met Office–Reading Urban Surface Exchange Scheme (MORUSES) (Simón-Moral et al., 2019), Community Land Model Urban (CLMU) (Oleson and Feddema, 2020), and Geophysical Fluid Dynamics Laboratory land model LM3 (LM3-UCM) (Li et al., 2016a). However, there remains a shortage of LSM-UCM models and the dynamics of land cover and climate change are typically oversimplified by using constant parameters in simulations (Kusaka et al., 2001).
To better represent urban environments, more suitable methodologies are needed (Yao et al., 2021). Among the various LSM models, the Variable Infiltration Capacity (VIC) model is widely used for identifying thermal and hydrological processes on land surfaces (Meng et al., 2019, 2020; Zhu et al., 2020). VIC is characterized by grid-independent calculation and favourable consideration of multiple layers along both horizontal (i.e. land cover types) and vertical (i.e. soil layers) directions (Liang and Xie, 2001; Liang et al., 1996). The model can be coupled with multiple forms of remote sensing data (e.g. shortwave and longwave radiation, albedo, and leaf area index (LAI)) (Jiang et al., 2022; Meng et al., 2020; Wang et al., 2022) to consider the realistic dynamics in land surface properties and atmospheric conditions. The VIC model has been implemented in several urban-related studies based on the bulk approach and has demonstrated acceptable performance in simulating energy and hydrological fluxes (Yang et al., 2010; Mishra et al., 2010; Wang et al., 2020). Yet a systematic urban calculation method that considers unique urban characteristics within VIC is still lacking.
In this study, we developed an urban module within the VIC model based on the Urban Tethys-Chloris model (UT&C) (Meili et al., 2020), namely, the VIC-urban model. The coupled model can efficiently identify urban hydrothermal processes when solving the water and energy balance and considers unique urban characteristics, including urban geometry, radiative interactions among urban surfaces (i.e. roof, canyon, walls, and ground), and human interference (e.g. irrigation and indoor temperature). VIC-urban can facilitate multiple urban-related research endeavours, such as identifying long-term hydrothermal processes in urban systems, quantifying environmental changes resulting from urban expansion, and comparing environmental variations among different urban configurations. In this article, we first provide a technical description of the model coupling and process and evaluate the model in Beijing regarding the land surface temperature (LST), turbulent heat fluxes, and runoff. Further, we examine the sensitivity of the urban model input parameters to the urban environment (i.e. roof evaporation and temperature, canyon evaporation and temperature).
2.1 Urban module coupled with VIC
The VIC model divides a study area into latitude–longitude grids, with each grid representing multiple land cover types and soil layers. It estimates hydrological and thermal processes for each subgrid land cover type in the solution of the water and energy balance (Liang et al., 1994, 1996). However, the existing parameterization scheme ignores the unique characteristics of urban areas, such as building blockage and human influence (e.g. indoor temperature, anthropogenic heat, and water inputs). Fortunately, VIC assigns a unique ID number to each grid and labels each vegetation type within the target grid. This enables VIC to identify and compute the subgrid land cover with individual parameters, offering advantages for establishing the urban module channel.
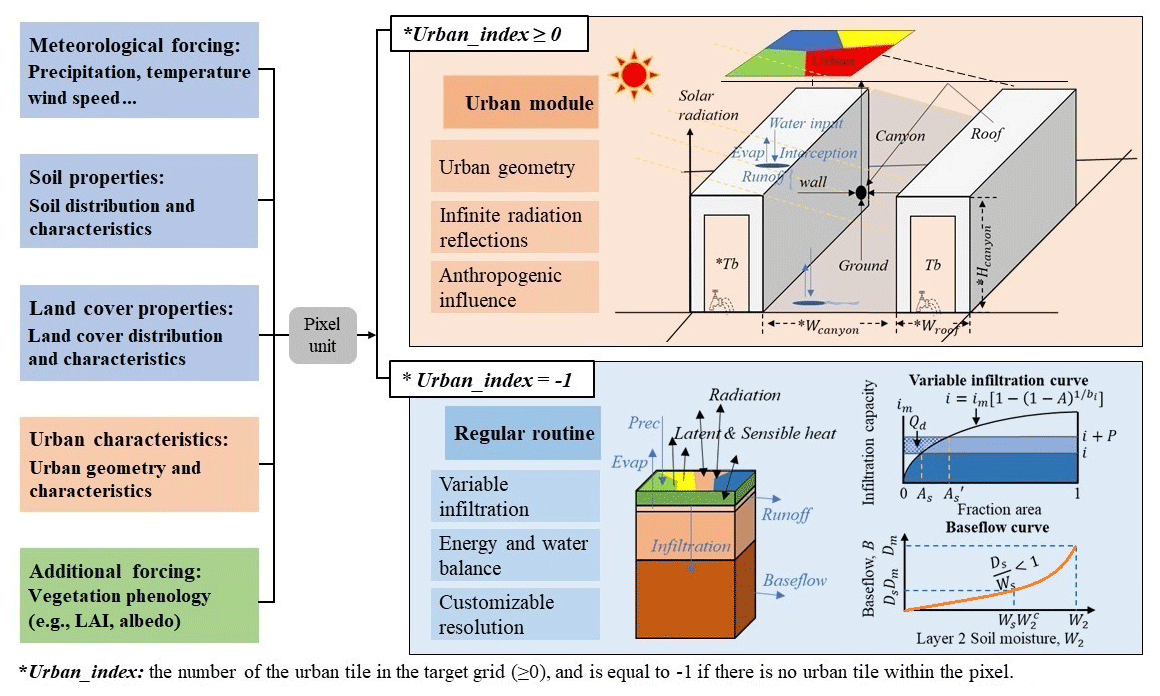
Figure 1Diagram of the urban module coupled with the VIC model. ∗Wcanyon, ∗Wroof, and ∗Hcanyon are parameters that describe the urban geometry (canyon width, roof width, and canyon height). ∗Tb is the indoor temperature. The parameters including As and Ds are defined by the original VIC model, and detailed information can be found on the VIC website (https://vic.readthedocs.io/en/master/Overview/ModelOverview/, last access: 27 July 2024.).
We integrate an urban module into the VIC model (VIC-urban). It executes the urban module for urban tiles and follows the same calculation routine as the original VIC model for the other land cover tiles. Specifically, the model uses two parameters (i.e. Gridcell and Urban_index) to identify urban tiles, as shown in Fig. 1. Gridcell is the ID number of the target grid. Urban_index serves as an index to ascertain the presence of an urban tile and to identify the urban tile label in the target grid. Urban_index is equal to n−1 if the urban tile is the nth land cover type of the target grid and equal to −1 if there is no urban tile in the grid. The VIC-urban model can thus identify the target grid and urban tile and obtain the parameters of the urban tile (i.e. the parameters of the [Urban_index+1]th land cover type in the target grid).
The urban module implemented in our study is based on the methods described in Meili et al. (2020). The urban tile is parameterized by three urban geometry parameters (canyon height, canyon width, and roof width) and four urban surfaces (roof, impervious ground, sunlit walls, and shaded walls). The hydrothermal fluxes and states (e.g. turbulent heat fluxes and land surface temperature) are individually calculated for each urban surface, considering the urban geometry, radiative interaction, and water and energy budgets. In addition, the urban module accounts for human impacts, including indoor temperature and artificial heating and irrigation. We present core formulations of the urban processes and related parameters in Sect. 2.2–2.5. A more detailed explanation is included in the Supplement and Meili et al. (2020).
2.2 Energy balance in the urban module
The newly developed urban module in VIC-urban treats the energy balance differently between the upper (i.e. roof) and lower canyon surfaces (i.e. ground and walls). For the roof surface, both short- and longwave radiation values are calculated similarly to those on bare soil, as the model assumes there is no obstruction or radiative interaction on roofs (Sect. S1.1 in the Supplement). For the ground and walls, the model first computes the incoming direct shortwave radiation as a function of the urban geometry, solar position, and grid location (Sect. S1.2 in the Supplement). Then it estimates the temperature, net absorbed radiation, and turbulent fluxes of each surface according to the sky-view factor (Sect. S1.5 in the Supplement) and infinite radiation reflections among the various surfaces (i.e. ground, sunlit and shaded walls, and sky) based on energy and water budgets. The detailed calculation method for the radiation can be found in Sect. S1 in the Supplement, and that for the turbulent fluxes can be found in Sect. S2 in the Supplement.
The energy balance of the roof, ground, and wall can be calculated as
where EBi is the energy balance of surface i and Sabs,i and Labs,i [W m−2] are the net absorbed short- and longwave radiation values, respectively, of surface i (roof, ground, and wall). Gi, Hi, and LEi are the conductive heat, sensible heat and latent heat fluxes, respectively, of surface i, and they can be calculated as
where ρa [kg m−3] is the air density, cp [] is the specific heat capacity of air at a constant pressure, Ti [K] is the temperature of surface i, r [s m−1] is the sum of the resistance values, λ [J kg−1] is the latent heat of vaporization, and [–] is the saturation specific humidity at temperature Ti [K]. Notably, for the surface above the canyon (i.e. canyon roof), Ta [K] and qa [–] are the air temperature and specific humidity, respectively, and for the ground and walls, Ta [K] and qa [–] are the canyon temperature and specific humidity at the canyon reference height, respectively (Sect. S2.5 in the Supplement). Moreover, λg [] is the heat conductivity and z is the thickness of the layer. Tint is the interior building temperature, which can be calculated from the outdoor and indoor temperatures based on the thermal conductivity parameters (Sect. S2.2 in the Supplement).
The energy balance of an urban canyon can be expressed as
where EBcan is the energy balance of the canyon and Qcan is anthropogenic heat, which can be prescribed according to associated observations or estimated from other formulations. H and LE are the sensible heat and latent heat fluxes, respectively, and the subscripts g, can, wsun, and wshd denote the ground, canyon, sunlit wall, and shaded wall, respectively; hcan [–] is the canyon height normalized by the canyon width ().
The turbulent heat fluxes of the canyon can be calculated as the area-weighted average of the walls and ground and directly include the anthropogenic heat input (Eq. 6), and the total turbulent fluxes of an urban tile can be calculated as the area-weighted average of the roof and urban canyon (Eq. 7):
where X [W m−2] denotes the turbulent heat fluxes (i.e. latent or sensible heat fluxes); froof and fcan [–] are the roof and canyon fractions, respectively; and Qcan [W m−2] is the anthropogenic heat input. The subscripts g, can, wsun, and wshd denote the ground, canyon, sunlit wall, and shaded wall, respectively.
2.3 Water balance in the urban module
The urban module computes the water mass balance for the roof and ground individually. For the roof, the incoming water is initially consumed by evaporation. Subsequently, runoff occurs when the remaining water exceeds the maximum water interception capacity. Runoff can be further divided into outflow runoff and run-on according to a certain ratio defined by experience. Outflow runoff flows off the roof and turns into incoming water for the ground, while run-on remains on the roof as the incoming water for the roof at the next time step. Therefore, the incoming water is equal to the precipitation and run-on of the previous time step.
where Int [mm h−1] is the interception water, P [mm h−1] is the precipitation, and E [mm h−1] is the evaporation.
For the ground, the incoming water flux includes precipitation, roof runoff, anthropogenic water input, and runoff of the previous time step. The incoming water is first consumed by evaporation and leakage and then by runoff and run-on. Outflow runoff leaves the current cell, while run-on remains in the cell as incoming water of the next time step. Notably, the model does not consider subsurface hydrological fluxes within urban tiles, such as soil moisture and baseflow, since impermeable surfaces impede vertical hydrological interactions. Therefore, the grid-scale subsurface water fluxes are assumed to be equal to the area-weighted mean value of the fluxes of the other land cover types in the grid.
where Q [mm h−1] is the anthropogenic water input and currently can be prescribed by user-defined 12-month-cycle values, but this prescription can be improved with dynamic values according to observations.
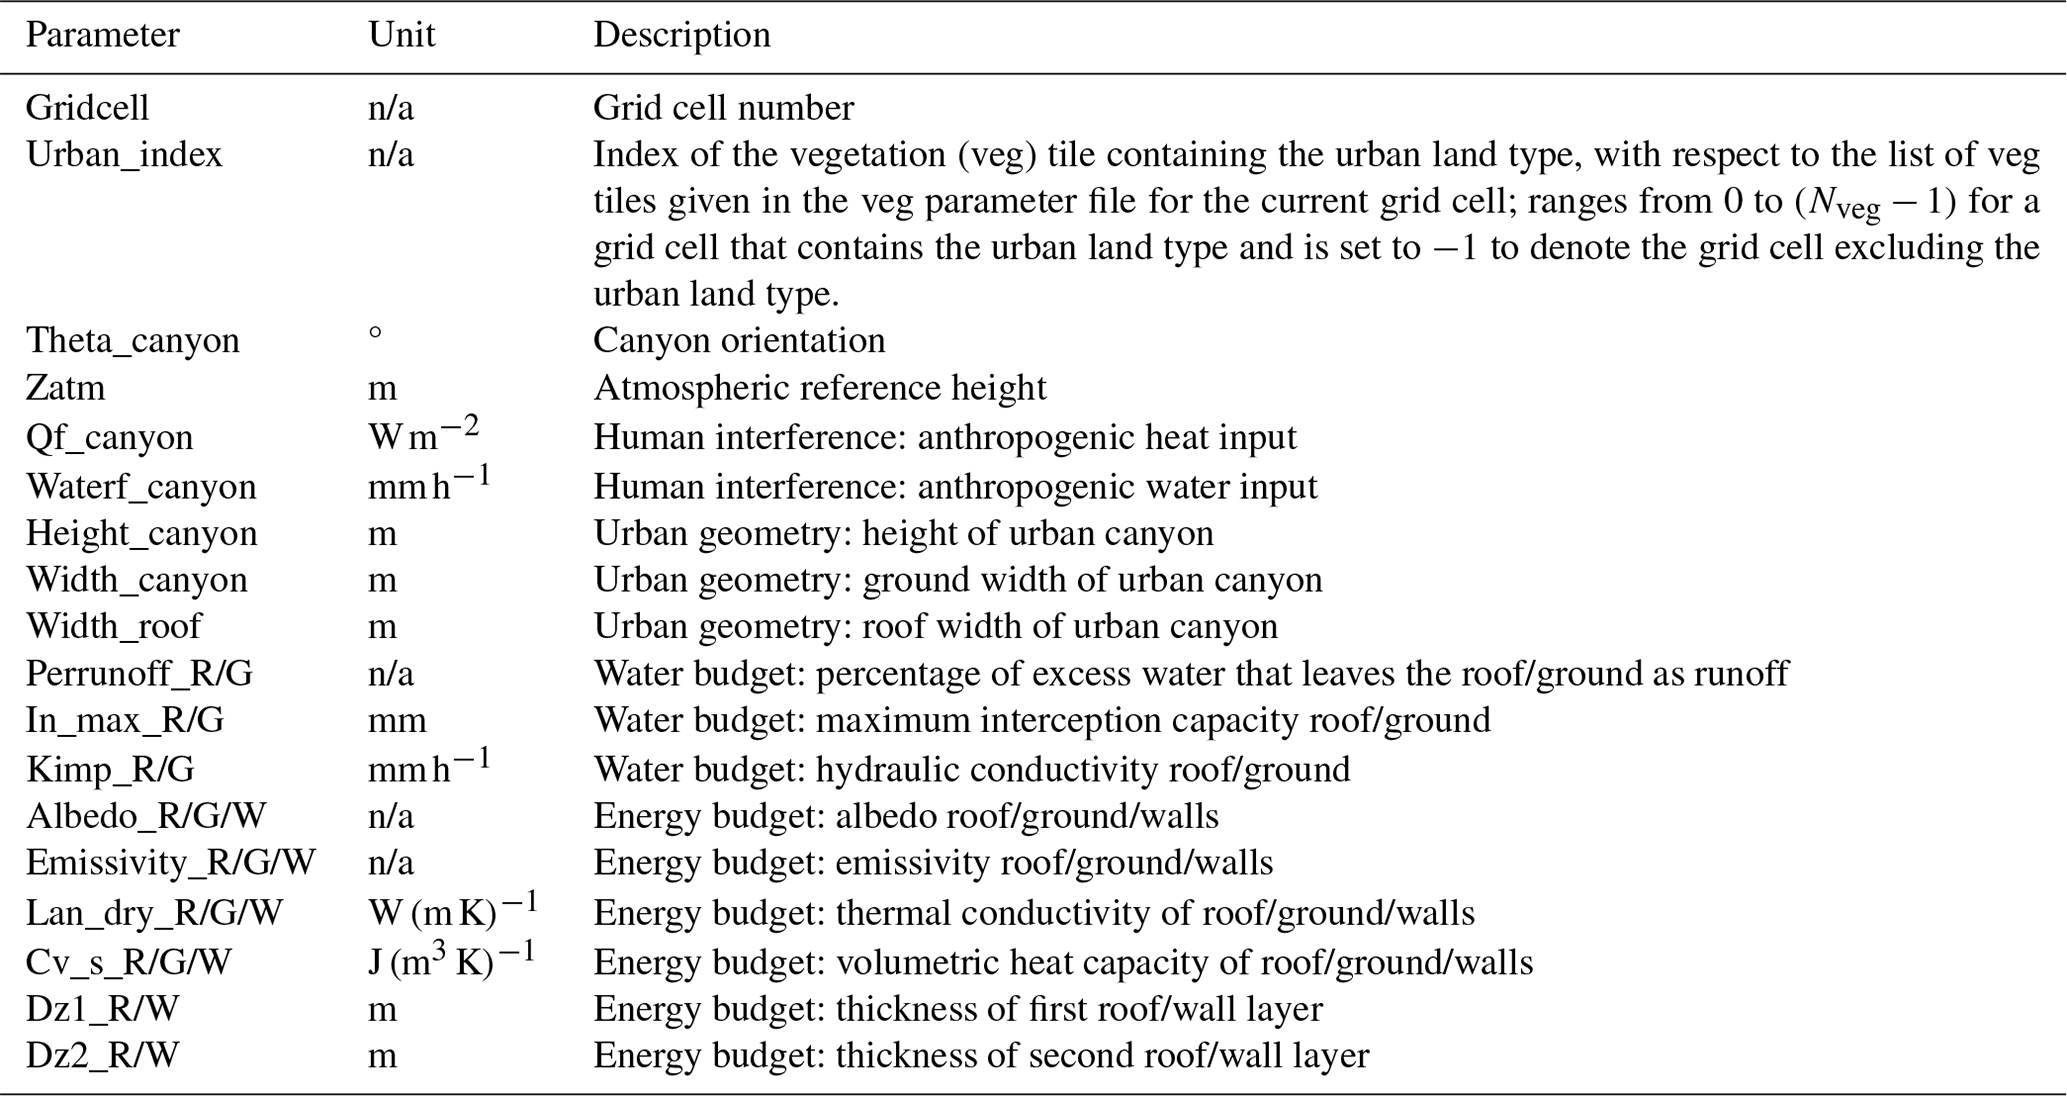
Table 1Overview of parameters for the urban module in the VIC model.
n/a: not applicable.
2.4 Parameters for the urban module
For the urban module, the input data include land cover maps and urban-related parameters. The land cover maps represent the locations of urban areas. The urban-related parameters are summarized in Table 1. Specifically, the Gridcell and Urban_index parameters are used to identify urban tiles; Qf_canyon and Waterf_canyon denote anthropogenic forcings; and the Theta_canyon, Zatm, Height_canyon, Width_canyon, and Width_roof parameters define the urban geometry. Parameters such as the hydraulic conductivity (Kimp) and maximum interception capacity albedo (In_max) are used for water budget calculation, while the other parameters (e.g. albedo, emissivity, Lan_dry, Cv_s, and Dz) are used for energy budget calculation.
2.5 Input data for VIC-urban
In addition to the urban-related parameters listed in Table 1, the other required input data of the VIC-urban model are similar to those of the original VIC model, referring to Liang et al. (1994, 1996) and Liang and Xie (2001). In general, the input data include topographical, meteorological forcing, and soil and land cover (i.e. vegetation) properties. The topographical dataset is used to delineate river networks and interpolate meteorological data. Meteorological forcings provide information on precipitation, maximum and minimum air temperatures, wind speed, and humidity. Soil data define the initial soil moisture conditions, including the variable infiltration curve and saturated hydrologic conductivity, and land cover data provide vegetation conditions such as the root zone thickness and the root fraction of each vegetation type.
In addition to the required forcing files, the VIC model can incorporate vegetation and radiation time series data (e.g. LAI, albedo, and shortwave and longwave radiation), which are particularly useful because they provide dynamic information on vegetation and radiation variables. By incorporating these data, the VIC model can better capture realistic land surface dynamics and energy budgets.
3.1 Study area and data input
The performance of the VIC-urban model was evaluated in simulating sensible and latent heat fluxes, runoff, and land surface temperature (LST) observations in Beijing from 2005 to 2020. Beijing is the capital of China, located between 39.43–41.05° N and 115.42–117.50° E. The city has experienced rapid urbanization since 1980, with extensive urban coverage since 2000 (Wang et al., 2020). Beijing can be divided into four functional zones with varying degrees of urbanization: the core functional zone (Core-Zone, with an urban fraction of ∼ 90 %), the urban functional extended zone (Extended-Zone, ∼ 70 %), the new urban development zone (NewDev-Zone, ∼ 30 %), and the ecological conservation zone (Eco-Zone, ∼ 5 %) (Fig. 2). This evaluation primarily focused on the three highly urbanized zones (Core-Zone, Extended-Zone, and NewDev-Zone) to demonstrate the performance of VIC-urban.
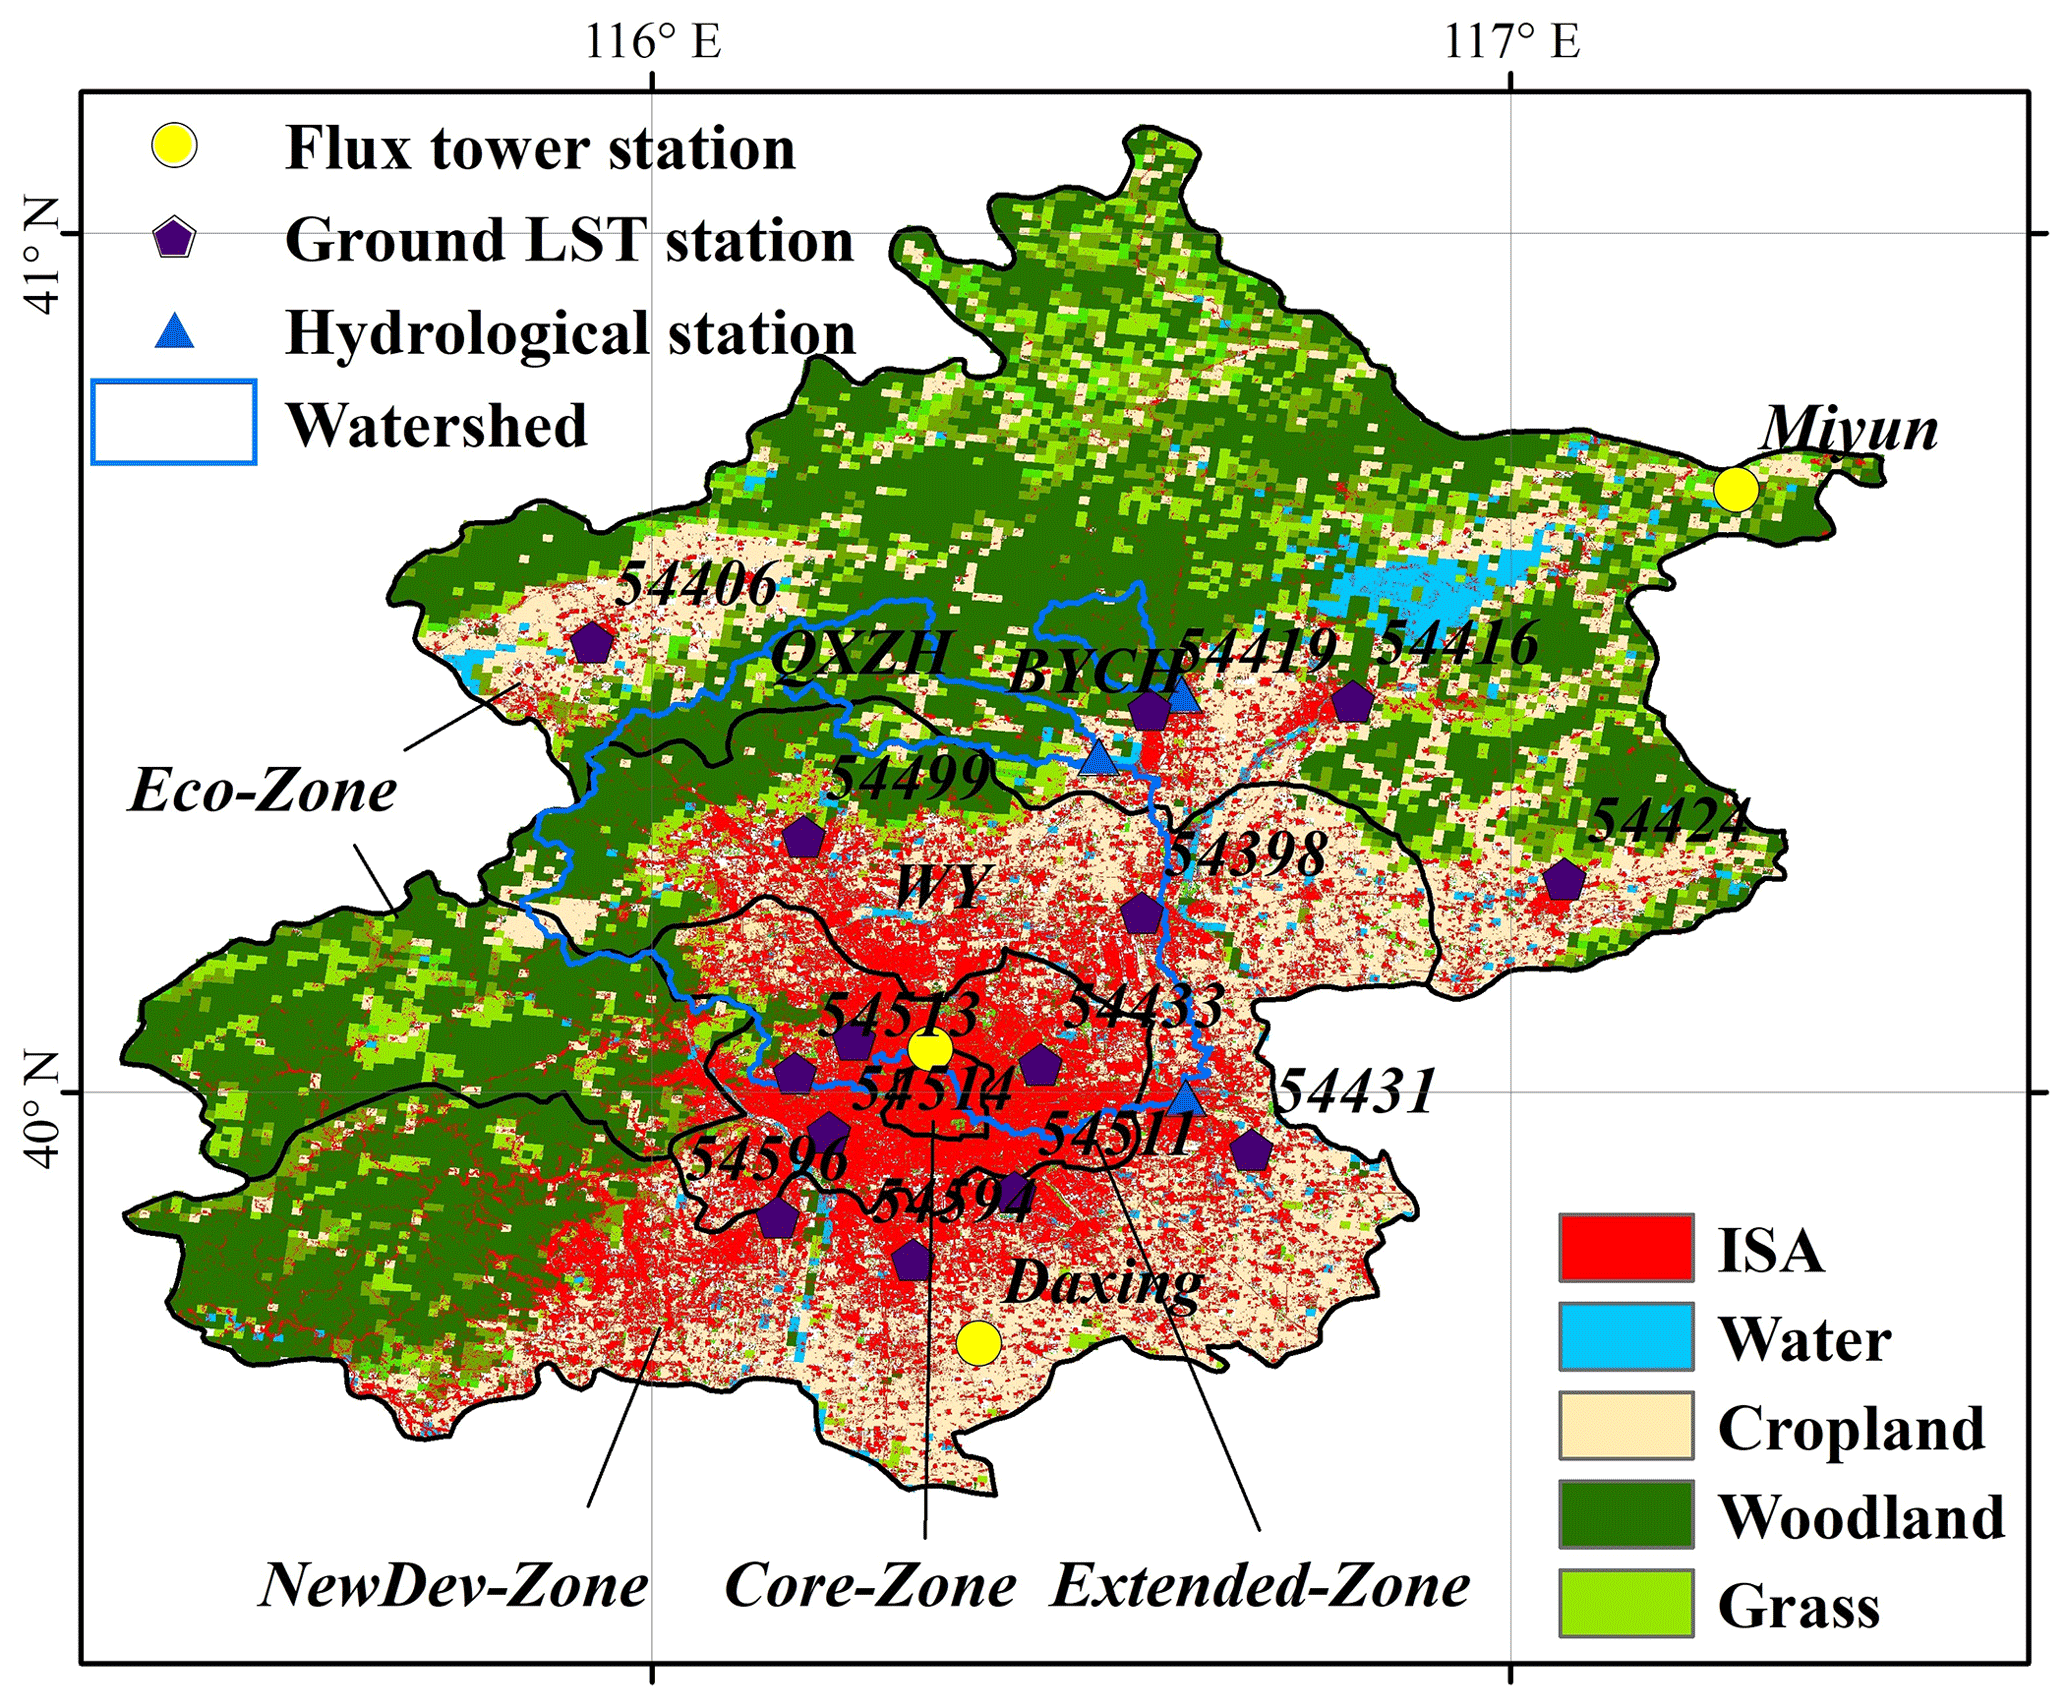
Figure 2Location of Beijing and the flux tower stations, hydrological stations and watersheds, and ground LST stations, with the 2015 land cover map as the background.
The parameters used in the urban module were based on those reported by Jackson et al. (2010), with manual calibration of the height-to-width ratio and the wall layer thickness based on Moderate Resolution Imaging Spectroradiometer (MODIS) LST and runoff observation data. The height-to-width ratio is a highly sensitive parameter in LST modelling and ranges from 0.5 to 1.1 according to the MODIS LST product. The prescribed wall layer thickness ranged from 0.2 to 0.6. The values of these parameters are generally consistent with those of previous research (McNorton et al., 2021; Li et al., 2016b), where the height-to-width ratio ranges from 0.75 to 1.5 and the wall layer thickness ranges from 0.3 to 0.5. Figure S2 in the Supplement illustrates the spatial distribution maps of the urban parameters.
Regarding the model input data of Beijing, topographical data (i.e. the digital elevation model) were obtained from the USGS with a 90 m resolution. Meteorological forcing data were produced by interpolating the data obtained from observation stations of the China Meteorological Administration (CMA) (Xie et al., 2015; Zhu et al., 2021). A soil map was obtained based on a 30 arcsec resolution dataset of soil characteristics. The soil parameters were derived based on a Chinese soil dataset (Shangguan et al., 2013; Zhu et al., 2020) and the Food and Agriculture Organization (FAO) (Nijssen et al., 2001). The land cover maps included base maps and urban maps. The base maps were obtained from Liu et al. (2010), which were created by merging Landsat Thematic Mapper (TM) digital images with a spatial resolution of 1 km and 12 land cover types. The urban maps were obtained from Wang et al. (2020) and were created by the classification and regression tree (CART) method using Landsat images with a spatial resolution of 30 m. The land cover parameters were obtained from Zhu et al. (2020). To better reasonably reflect the land cover changes in modelling, our study updated land cover maps and related parameters (e.g. the thermal conductivity, volumetric heat capacity) every 5 years. Moreover, four satellite datasets, namely, downward shortwave radiation (DSR), albedo, LAI, and fractional vegetation cover (FVC), were incorporated into the modelling process (Zhang et al., 2019; Liang et al., 2021) to better identify land conditions and calculate turbulent heat fluxes. The four datasets used in this study are at 0.05° spatial resolution. The DSR dataset is at daily temporal resolution, while the other three datasets are at 8 d temporal resolution. The four datasets were obtained from Global LAnd Surface Satellite (GLASS) products (http://www.geodata.cn/thematicView/GLASS.html, last access: 27 July 2024) (Liang et al., 2021). The spatial/temporal resolution of the VIC modelling is defined as 0.0625°/3 h in this study. To ensure consistency, all model input data were adjusted to match the same spatial resolution through a linear interpolation.
3.2 Evaluation data and method
The VIC-urban model underwent calibration using streamflow data from two watersheds and MODIS-based LST data. Then it was validated against observations retrieved from gauge stations and MODIS data regarding sensible and latent heat, runoff, and LST. The locations of the gauge stations are shown in Fig. 2, and detailed information is listed in Table 2. Four measures, namely, the Nash–Sutcliffe efficiency (NSE), root mean squared error (RMSE), relative bias (Er), and correlation coefficient (R), were used to evaluate the performance of VIC-urban.
Table 2Validation data used in this work.
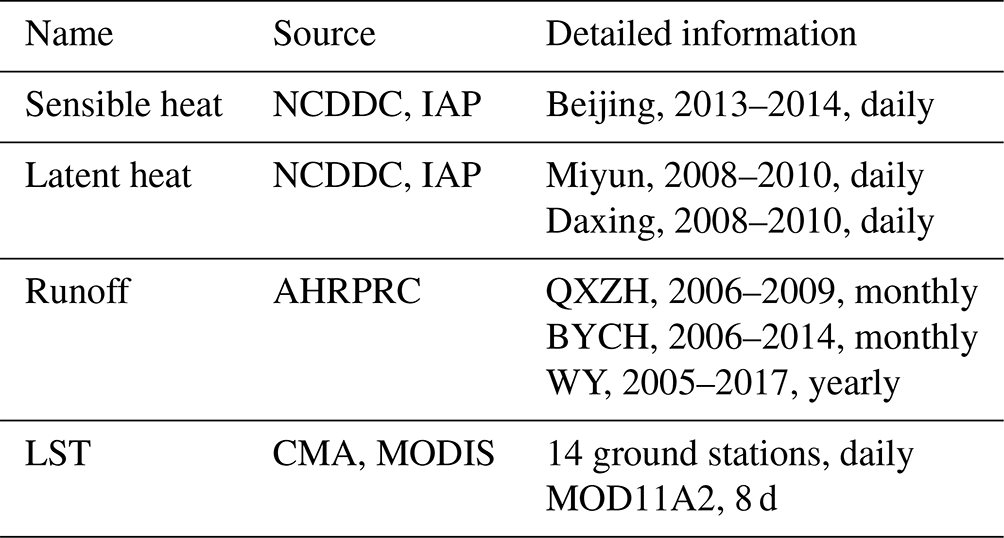
NCDDC, National Cryosphere Desert Data Center; IAP, Institute of Atmospheric Physics; AHRPRC, Annual Hydrological Report of the People's Republic of China; CMA, China Meteorological Administration; MODIS, Moderate Resolution Imaging Spectroradiometer; QXZH, Qianxinzhuang; BYCH, Boyachang; WY, Wenyu.
In regard to sensible and latent heat evaluation, three flux towers were used, namely, the Beijing, Daxing, and Miyun stations. Particularly of note is the Beijing station, located in the central part of Beijing and widely used to investigate urban turbulence characteristics (X. Liu et al., 2020; Ji et al., 2021). To calibrate and validate the simulated runoff, streamflow data from three stations were used, namely, Boyachang (BYCH), Qianxinzhuang (QXZH), and Wenyu (WY). Their corresponding watersheds are located in the northern part of Beijing and contain various land cover types, including urban, forest, crop, and grass (Fig. 2). The observed discharge data of the QXZH and BYCH stations were separated into two periods for model calibration and validation, whereas the observed discharge of the WY station was compared to the simulated runoff for the entire period due to the availability of only yearly data.
Regarding LST evaluation, we obtained data from 14 ground-based stations and 1 satellite-based product. At the ground-based stations of the CMA, platinum resistance sensors are used that are semi-buried in soil to measure the daily temperature at the skin surface. Among the stations, three stations provide long-term coverage data for the 2005–2020 period, while the remaining stations provide data covering the 2016–2020 period. The satellite-based LST product of Terra MODIS was adopted, i.e. MOD11A2 v006 (https://modis.gsfc.nasa.gov/, last access: 27 July 2024). MODIS LST data constitute one of the most widely used data sources for LST studies (Bounoua et al., 2015; Zhou et al., 2010; Q. Liu et al., 2020; Morabito et al., 2021; Zhou et al., 2018). MODIS has provided two instantaneous LST estimates (10:30 and 22:30 local solar time; this time zone is used for all times given in this paper) every 8 d since 2000, with a spatial resolution of 1 km. In our work, the simulated LST was averaged every 8 d for comparison with the MODIS data. The simulated LSTs from 09:00–12:00 and 21:00–24:00 were compared with the MODIS data for 10:30 and 22:30, assumed to represent the morning and evening times, respectively. Notably, the gauge-based measurements were obtained at the point scale, which is smaller than the model output resolution. To resolve the mismatch in the spatial scale, the evaluation was conducted at the subgrid scale with the same land cover type in the corresponding grid.
3.3 Sensitivity analysis
To examine the sensitivity of the model parameters to changes in the urban environment, four fluxes, namely, roof temperature, roof evaporation, canyon temperature, and canyon evaporation, were used as indicators of the urban environment. A single grid cell with high urban coverage was selected, and its input values were used as default values. The urban input parameters range from 70 % to 130 % of the default values in 6 % change steps. The specific parameters and their values are listed in Table S1 in the Supplement.
The sensitivity analysis covered 6 years (2015–2020) and was conducted at the annual scale, as well as for the winter (December to February of the next year) and summer (June to August) seasons. The sensitivity coefficient Sc can be calculated as (Beven, 1979)
where X is the input parameter that affects the urban environment (Y). A positive (or negative) Sc value suggests that Y is enhanced (or reduced) with increasing X.
4.1 Land surface temperature
The simulated LST was calibrated against the MODIS LST and evaluated using two ground observations and the MODIS LST dataset. As shown in Fig. 3, the simulated LST exhibited similar spatial patterns to those of the MODIS estimates for both the morning and the evening times in the city centre. At the morning time, both the VIC-urban model and MODIS data exhibited high LST values in Core-Zone and the southern part of Extended-Zone. At the evening time, the VIC-urban model simulations failed to capture the scattered LST patterns in Eco-Zone and the southwestern part of NewDev-Zone. This disagreement may be attributed to the relatively low urban fraction in these areas, given that our work mainly focused on the calculation of urban-related processes. Other than in these areas, the model could accurately produce a similar LST distribution to the MODIS LST data in Core-Zone and Extended-Zone.
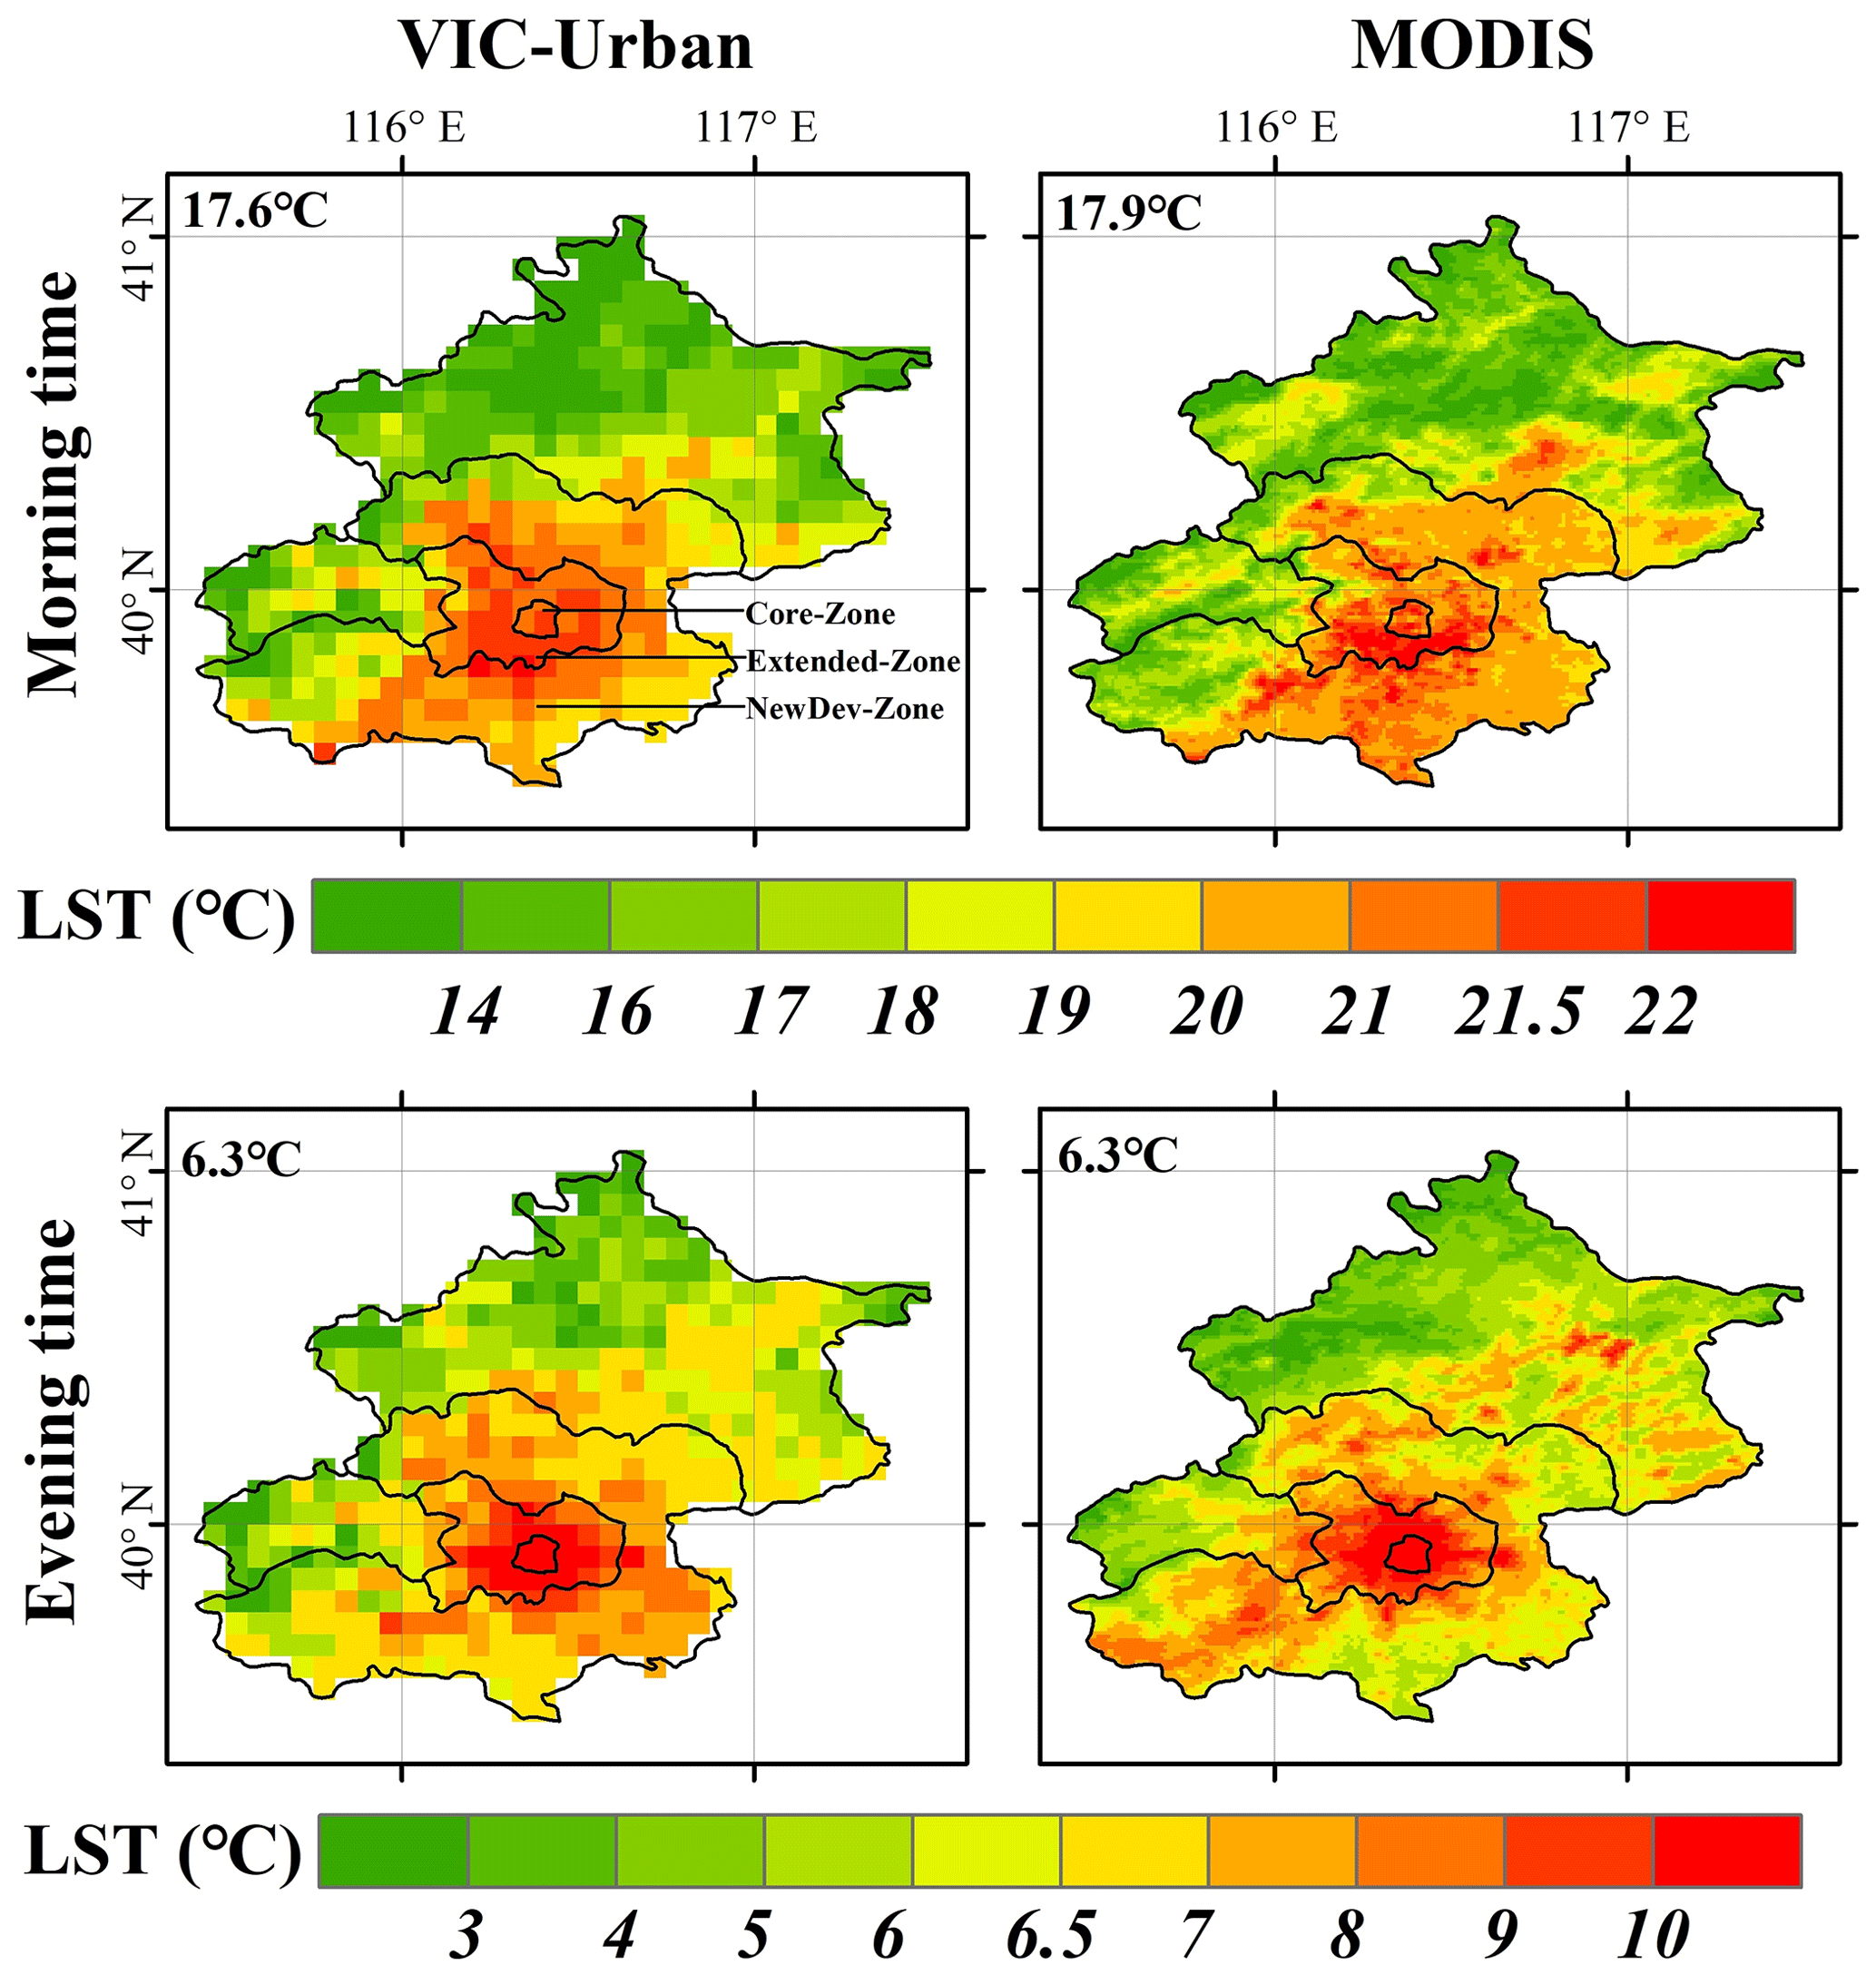
Figure 3Spatial distribution of the simulated LST compared to the MOD11A2 product, with the average LST shown in the upper left of each panel.
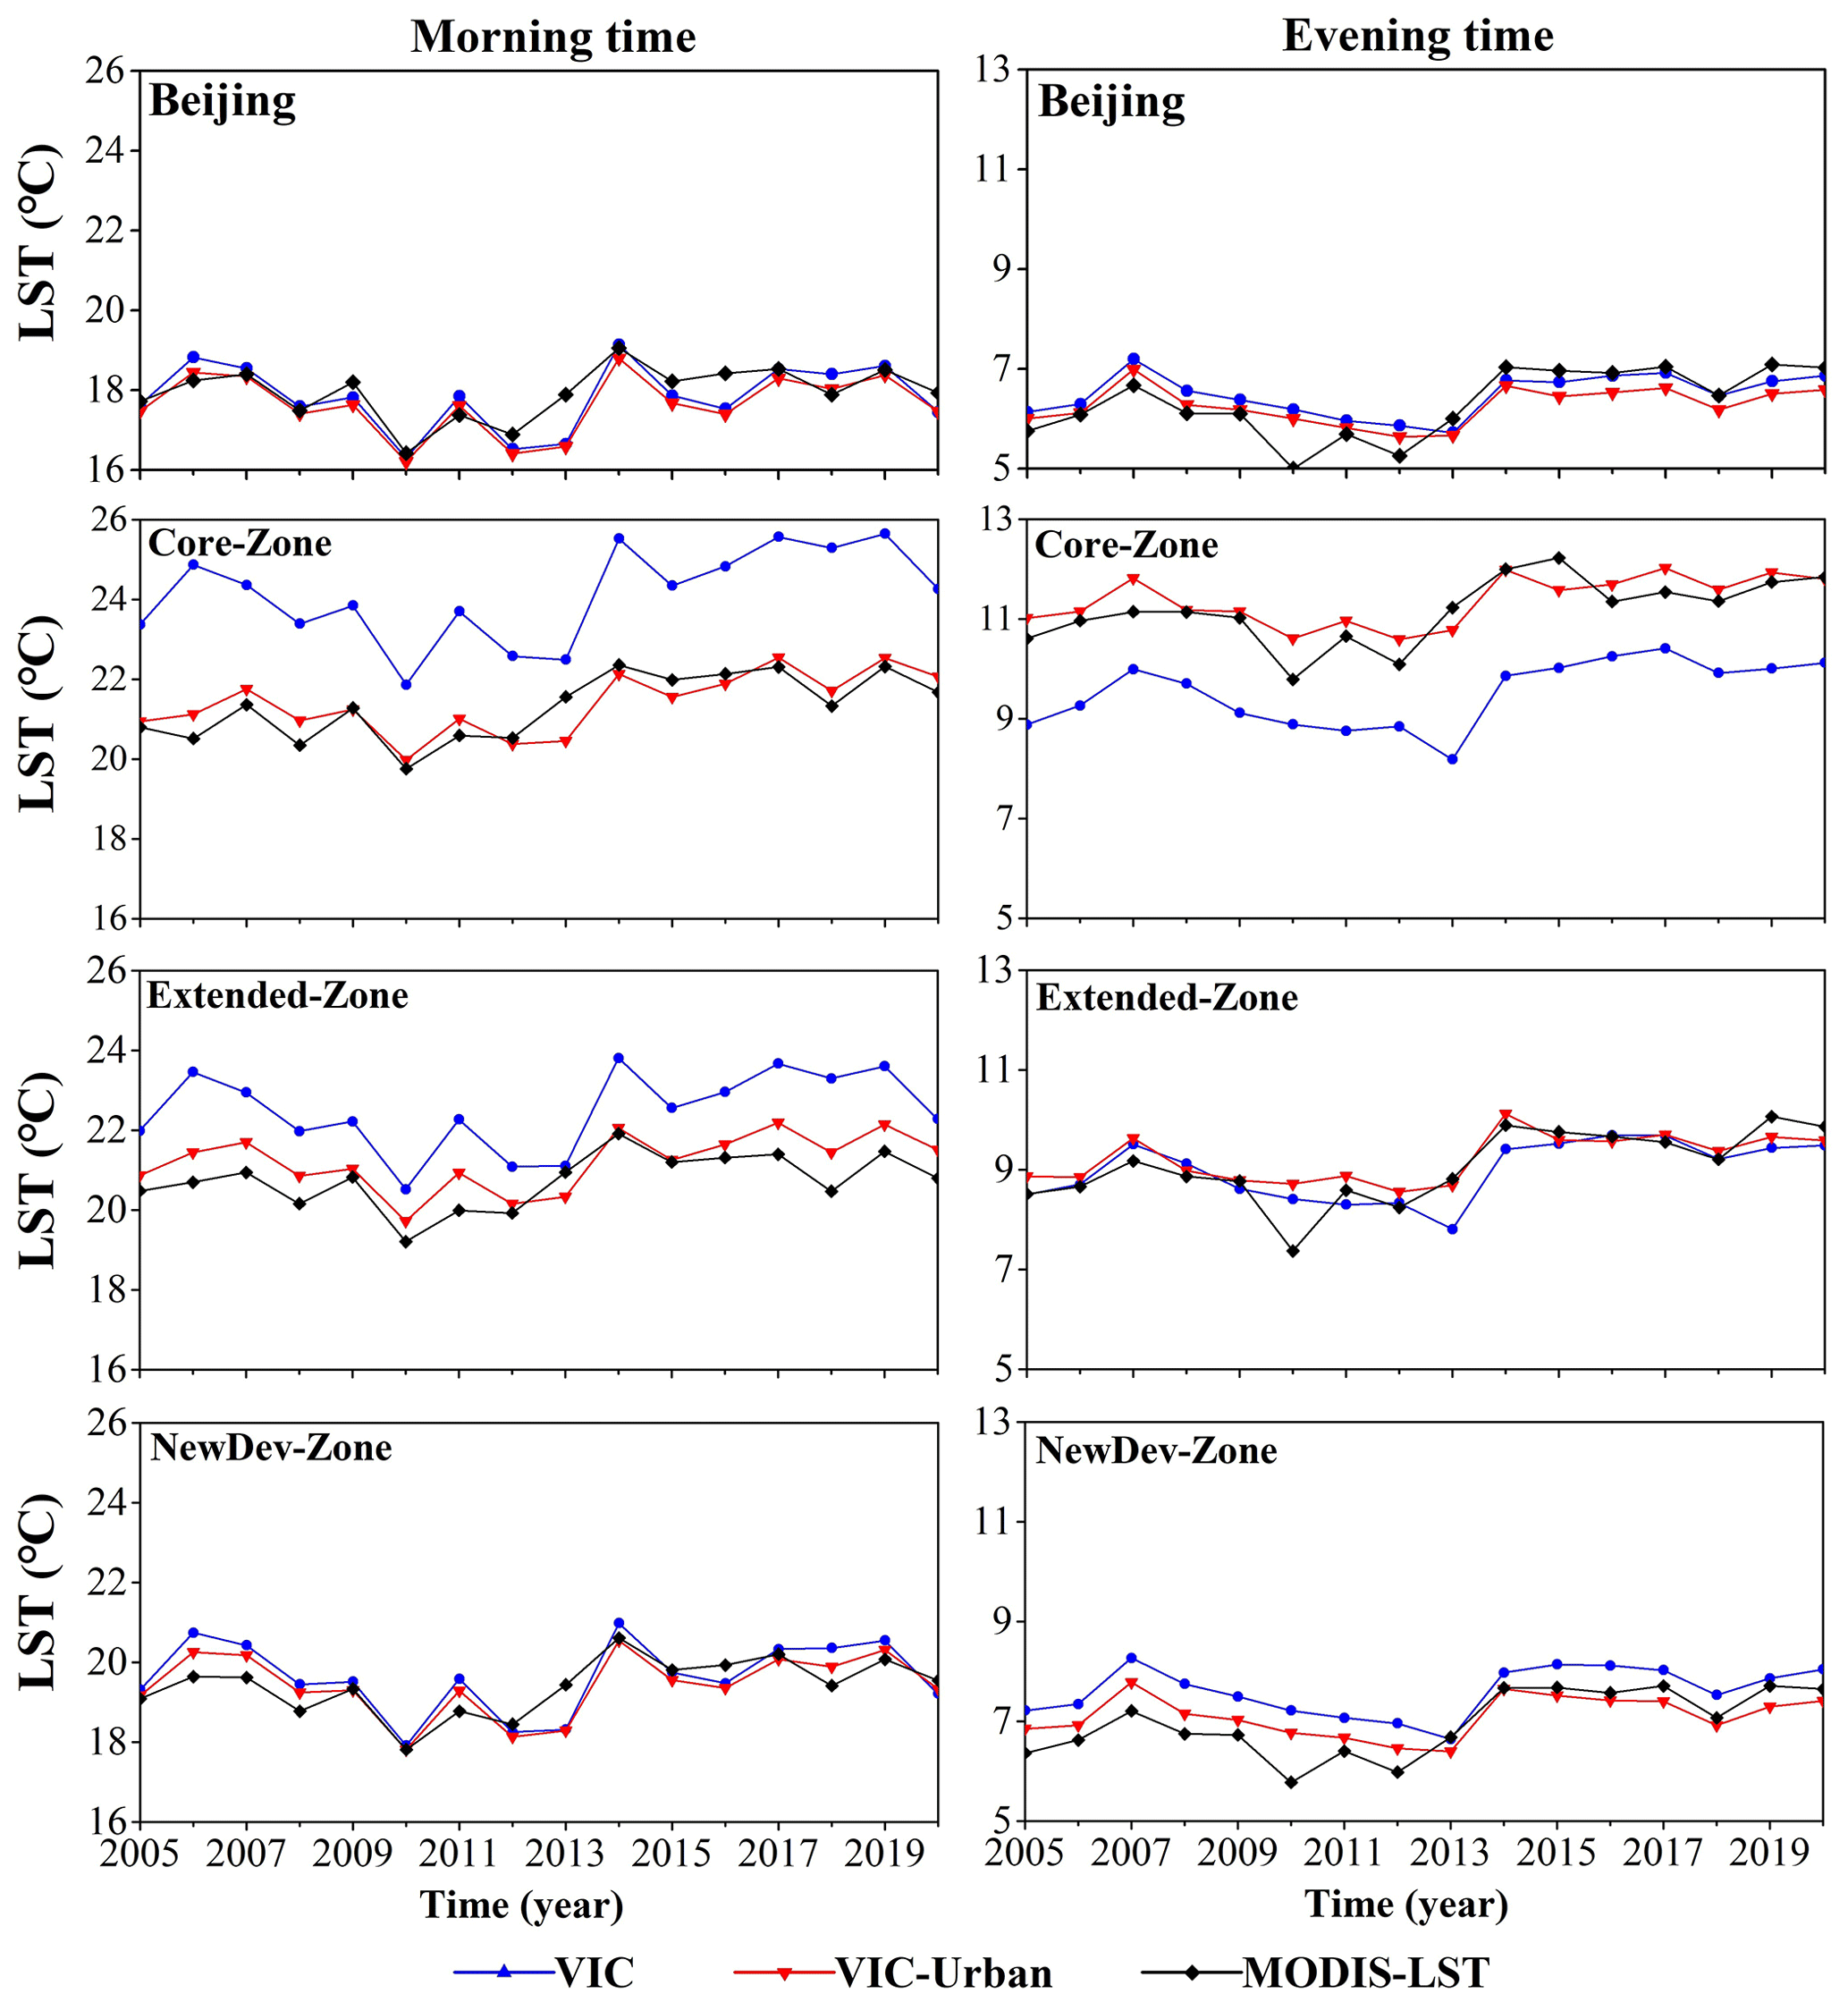
Figure 4Yearly dynamics of the simulated LST compared to the MOD11A2 product for Beijing and the three functional zones (i.e. Core-Zone, Extended-Zone, and NewDev-Zone).
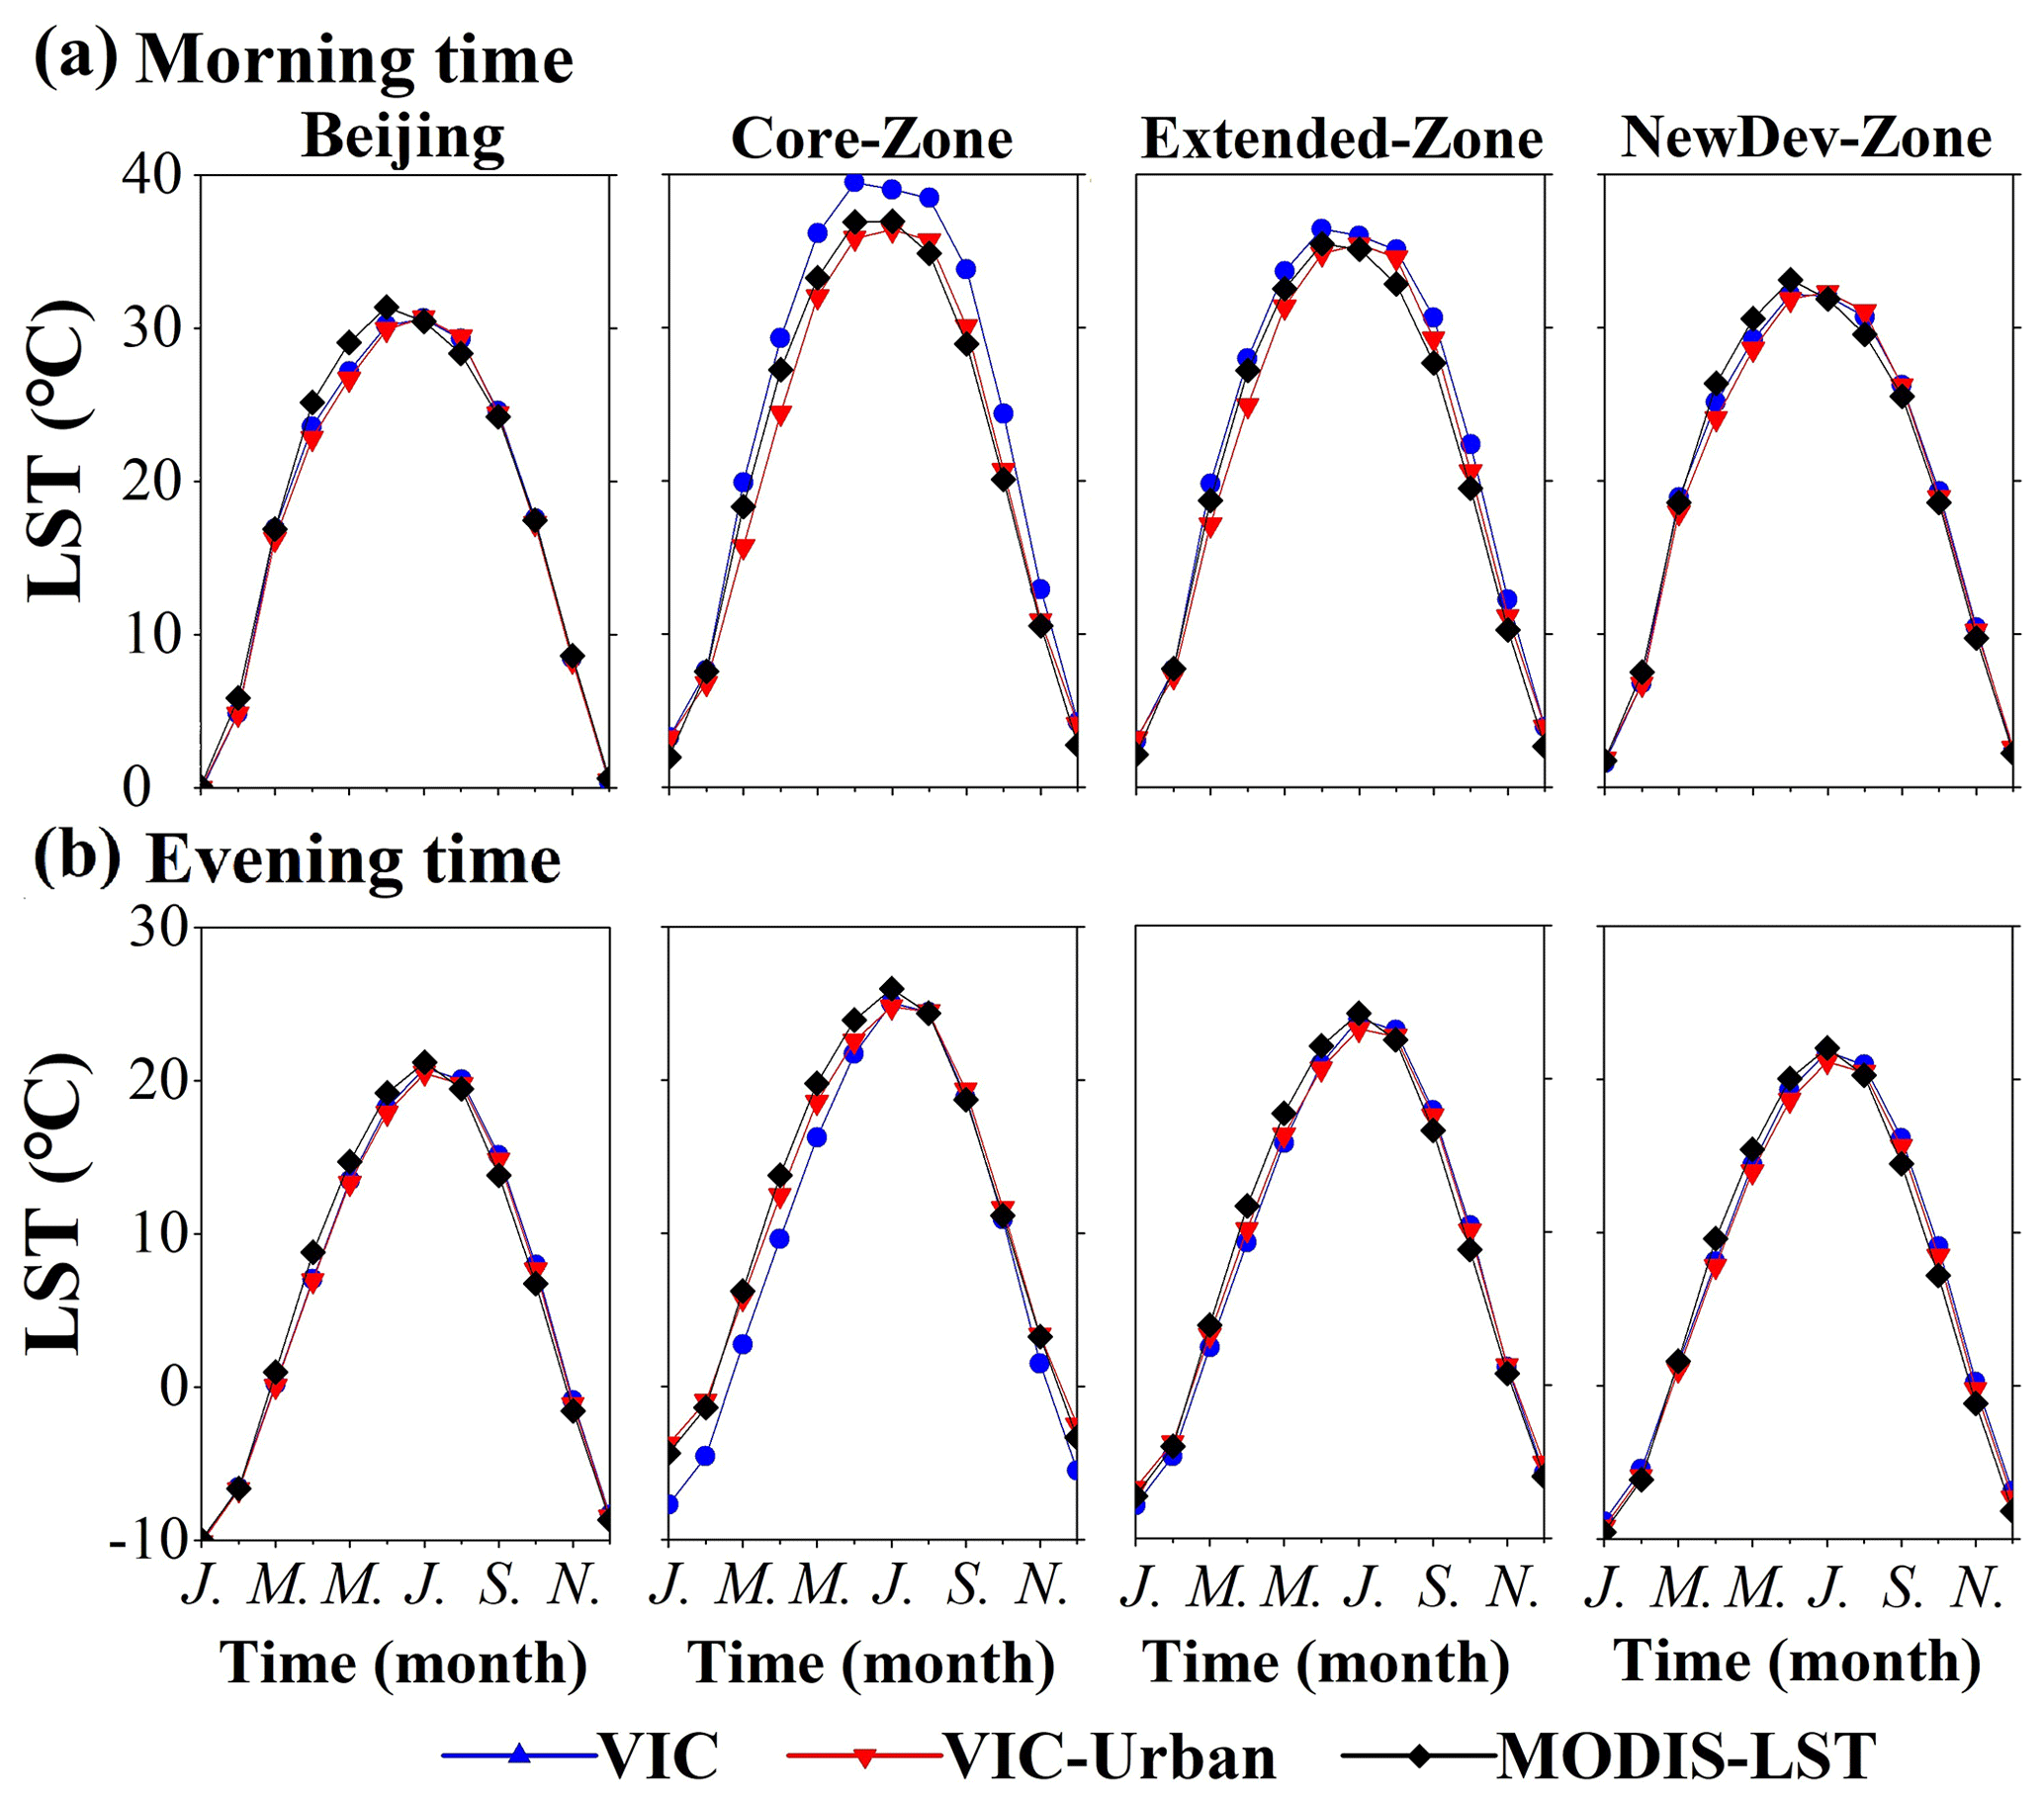
Figure 5Mean monthly cycle of the simulated LST compared to the MOD11A2 product for Beijing and the three functional zones (Core-Zone, Extended-Zone, and NewDev-Zone). The first initial of every second month is given on the x axis, starting with “J” for January.
In terms of temporal comparison, the simulated LST exhibited a high performance in all of Beijing and the three subzones (Core-Zone, Extended-Zone, and NewDev-Zone). As shown in Figs. 4 and 5, the simulated LST indicated similar yearly dynamics and mean monthly cycles relative to the MODIS LST data. The R values were over 0.8, and the RMSE and Er values were lower than 0.5 °C and 2.3 % for the morning and evening times, respectively. These results indicated that the simulated LST values closely captured the temporal variations in and spatial patterns of the MODIS LST data.
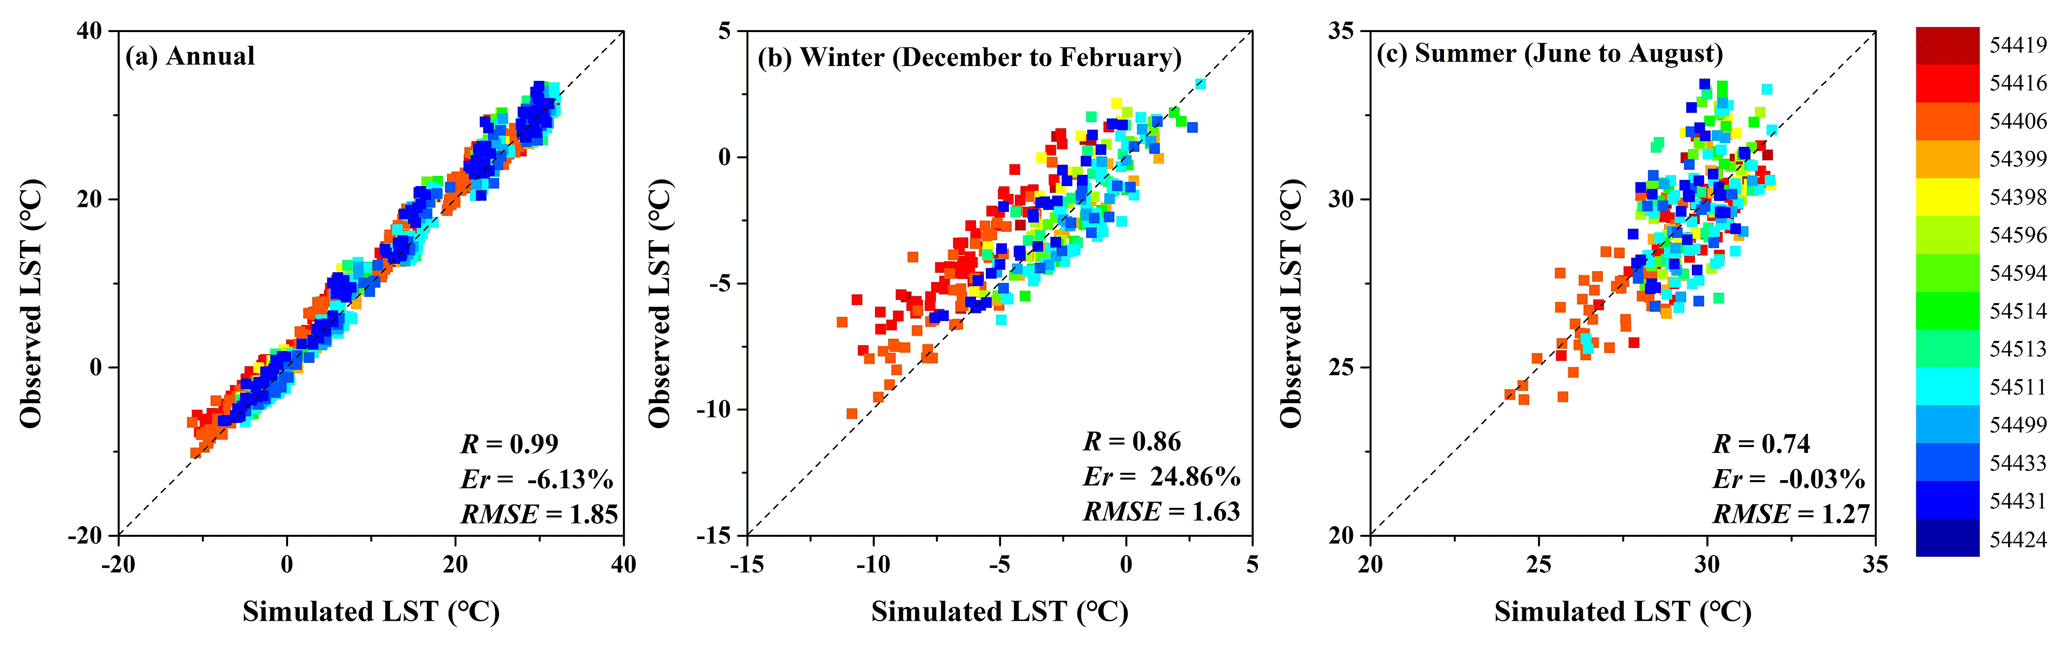
Figure 6Monthly simulated LST validated against 14 ground-based observation stations, which are marked in different colours.
Table 3The simulated LSTs from VIC-urban and VIC models are validated by 14 ground-based observations at an annual scale. The results of three indexes (Er, R, and RMSE) are shown in the table, with better results from the VIC-urban simulations in italics.
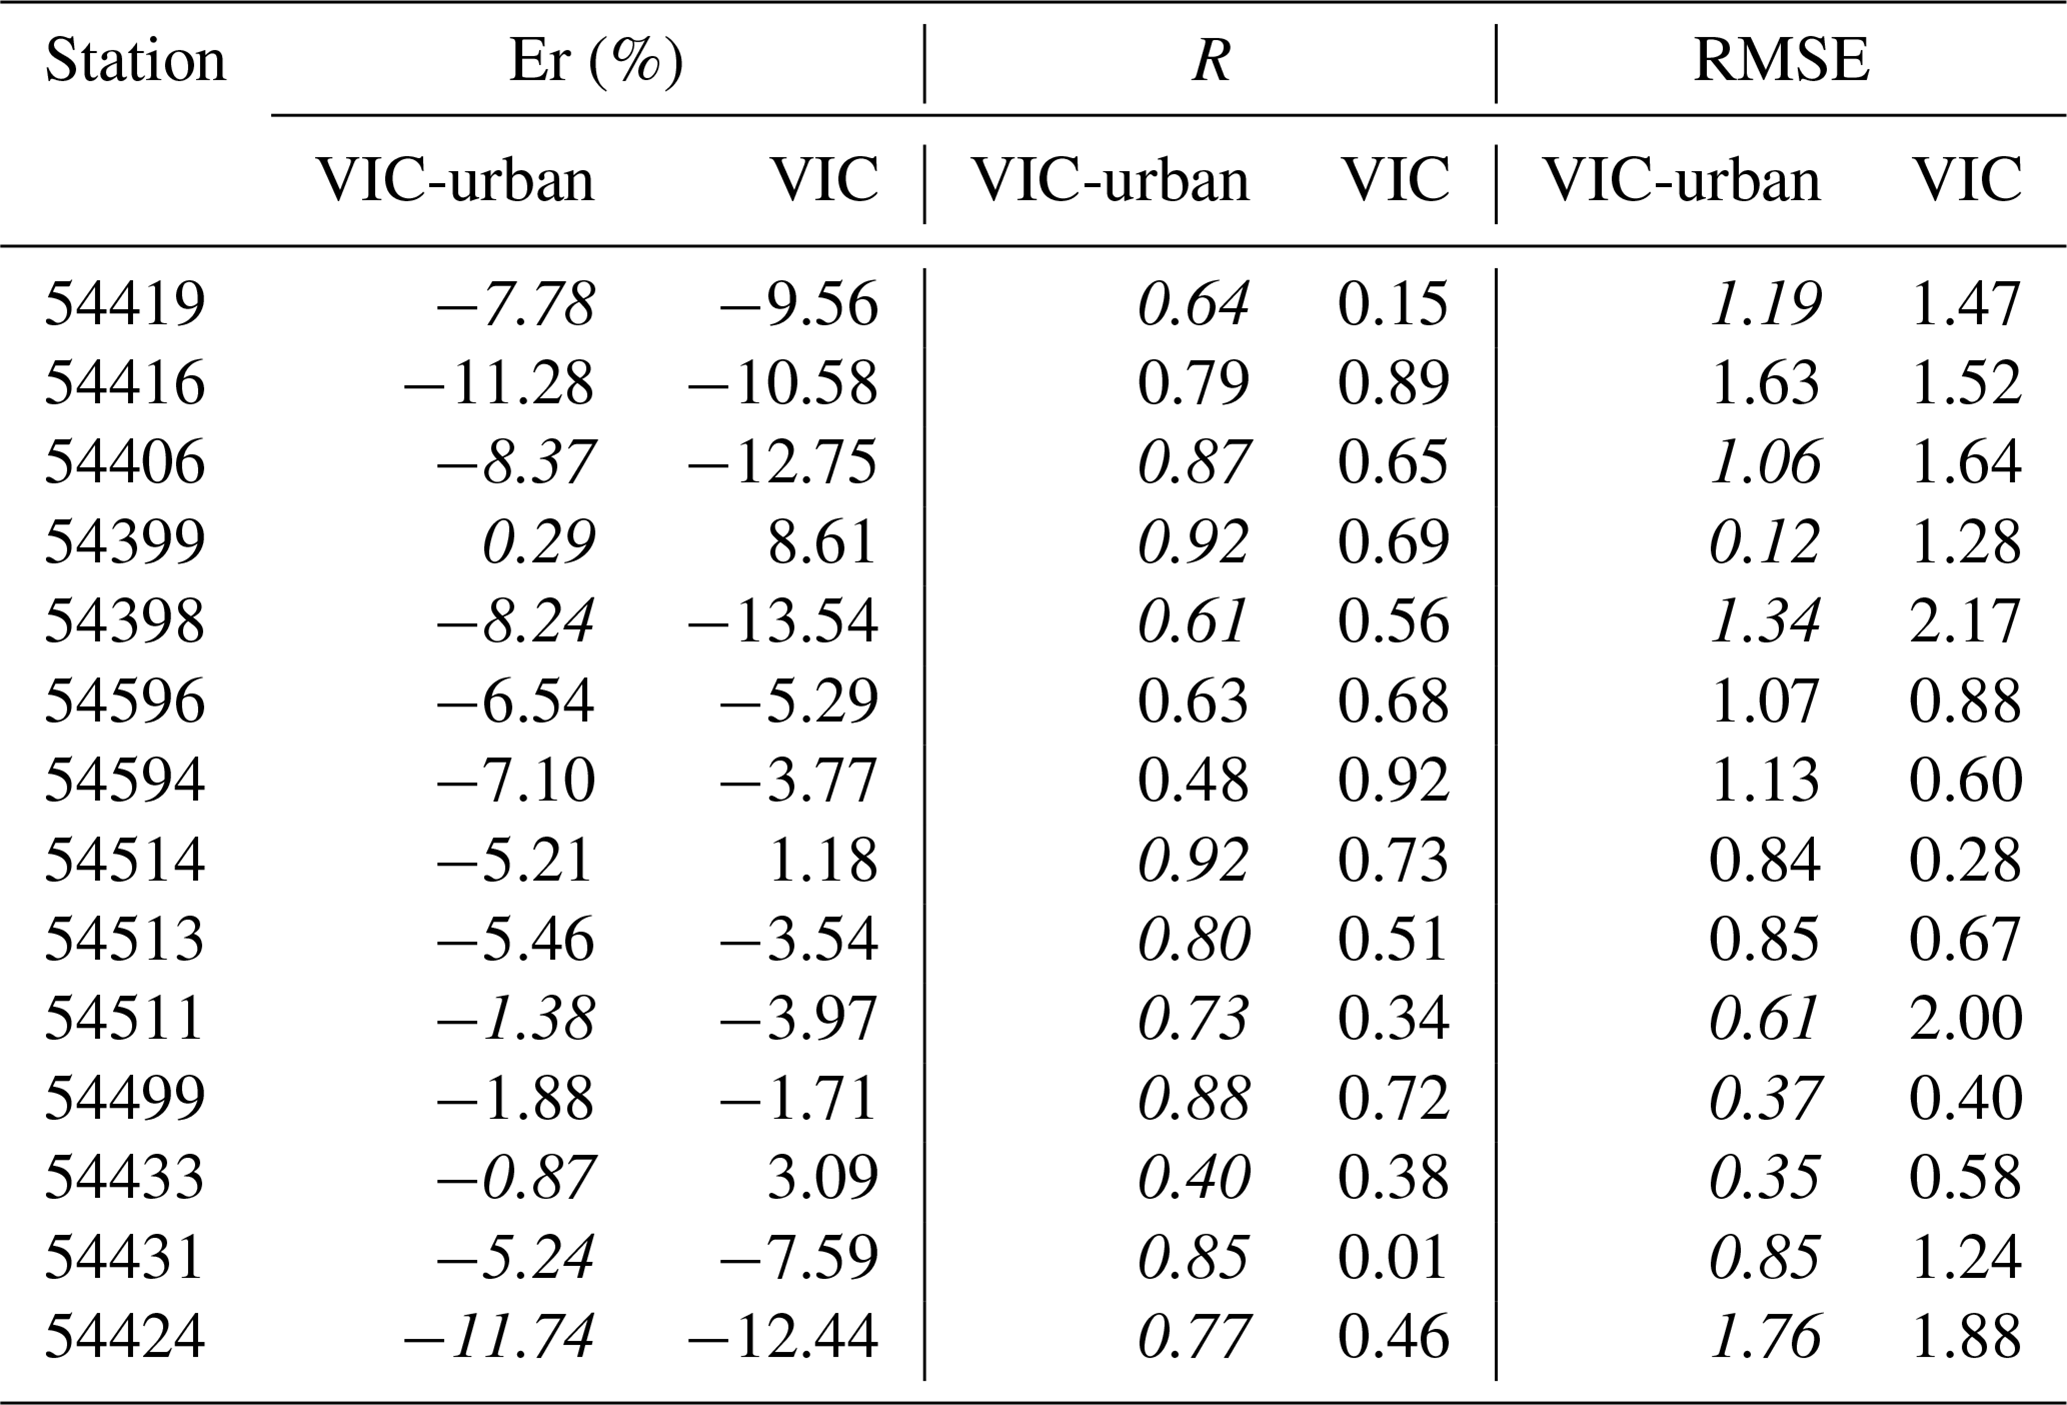
In regard to station-scale comparison, the model produced satisfactory LST estimates for the annual dynamics and during the winter and summer seasons (Fig. 6). Specifically, the overall RMSE was lower than 1.9 °C, R was higher than 0.9, and Er was lower than 7 % at the annual scale. During the winter and summer seasons, the RMSE values were lower than 1.7 °C, the R values were higher than 0.7, and Er was approximately 24.9 % in winter and −0.2 % in summer. The high Er value during the winter season could be attributed to the low average winter LST. The comparison at each site also indicated promising results (Table 3), with all Er values lower than 12 % and all RMSE values below 1.8 °C. It is important to note that the stations generally provided only five available values, i.e. annual data for the 2016–2020 period. Nevertheless, the R values for all the stations consistently exceeded 0.4, indicating the satisfactory performance of the VIC-urban model.
4.2 Runoff
The model was further calibrated using the streamflow data for the QXZH and BYCH watersheds and validated against the streamflow data for the WY, QXZH, and BYCH watersheds (Fig. 7). During the calibration period, the NSE and R values for the QXZH and BYCH watersheds were approximately 0.5 and 0.8, respectively, and the Er and RMSE values were below 10 % and 4 mm per month, respectively, for both watersheds. During the validation period, the simulated runoff showed a high correlation with the observed data of the three watersheds, with R ranging from 0.8 to 0.9 and NSE ranging from 0.6 to 0.8. The RMSE reached approximately 4 mm per month at QXZH, 5 mm per month at BYCH, and 42 mm yr−1 at WY. The Er values were approximately 12 % (QXZH), 29 % (BYCH), and −9.5 % (WY).
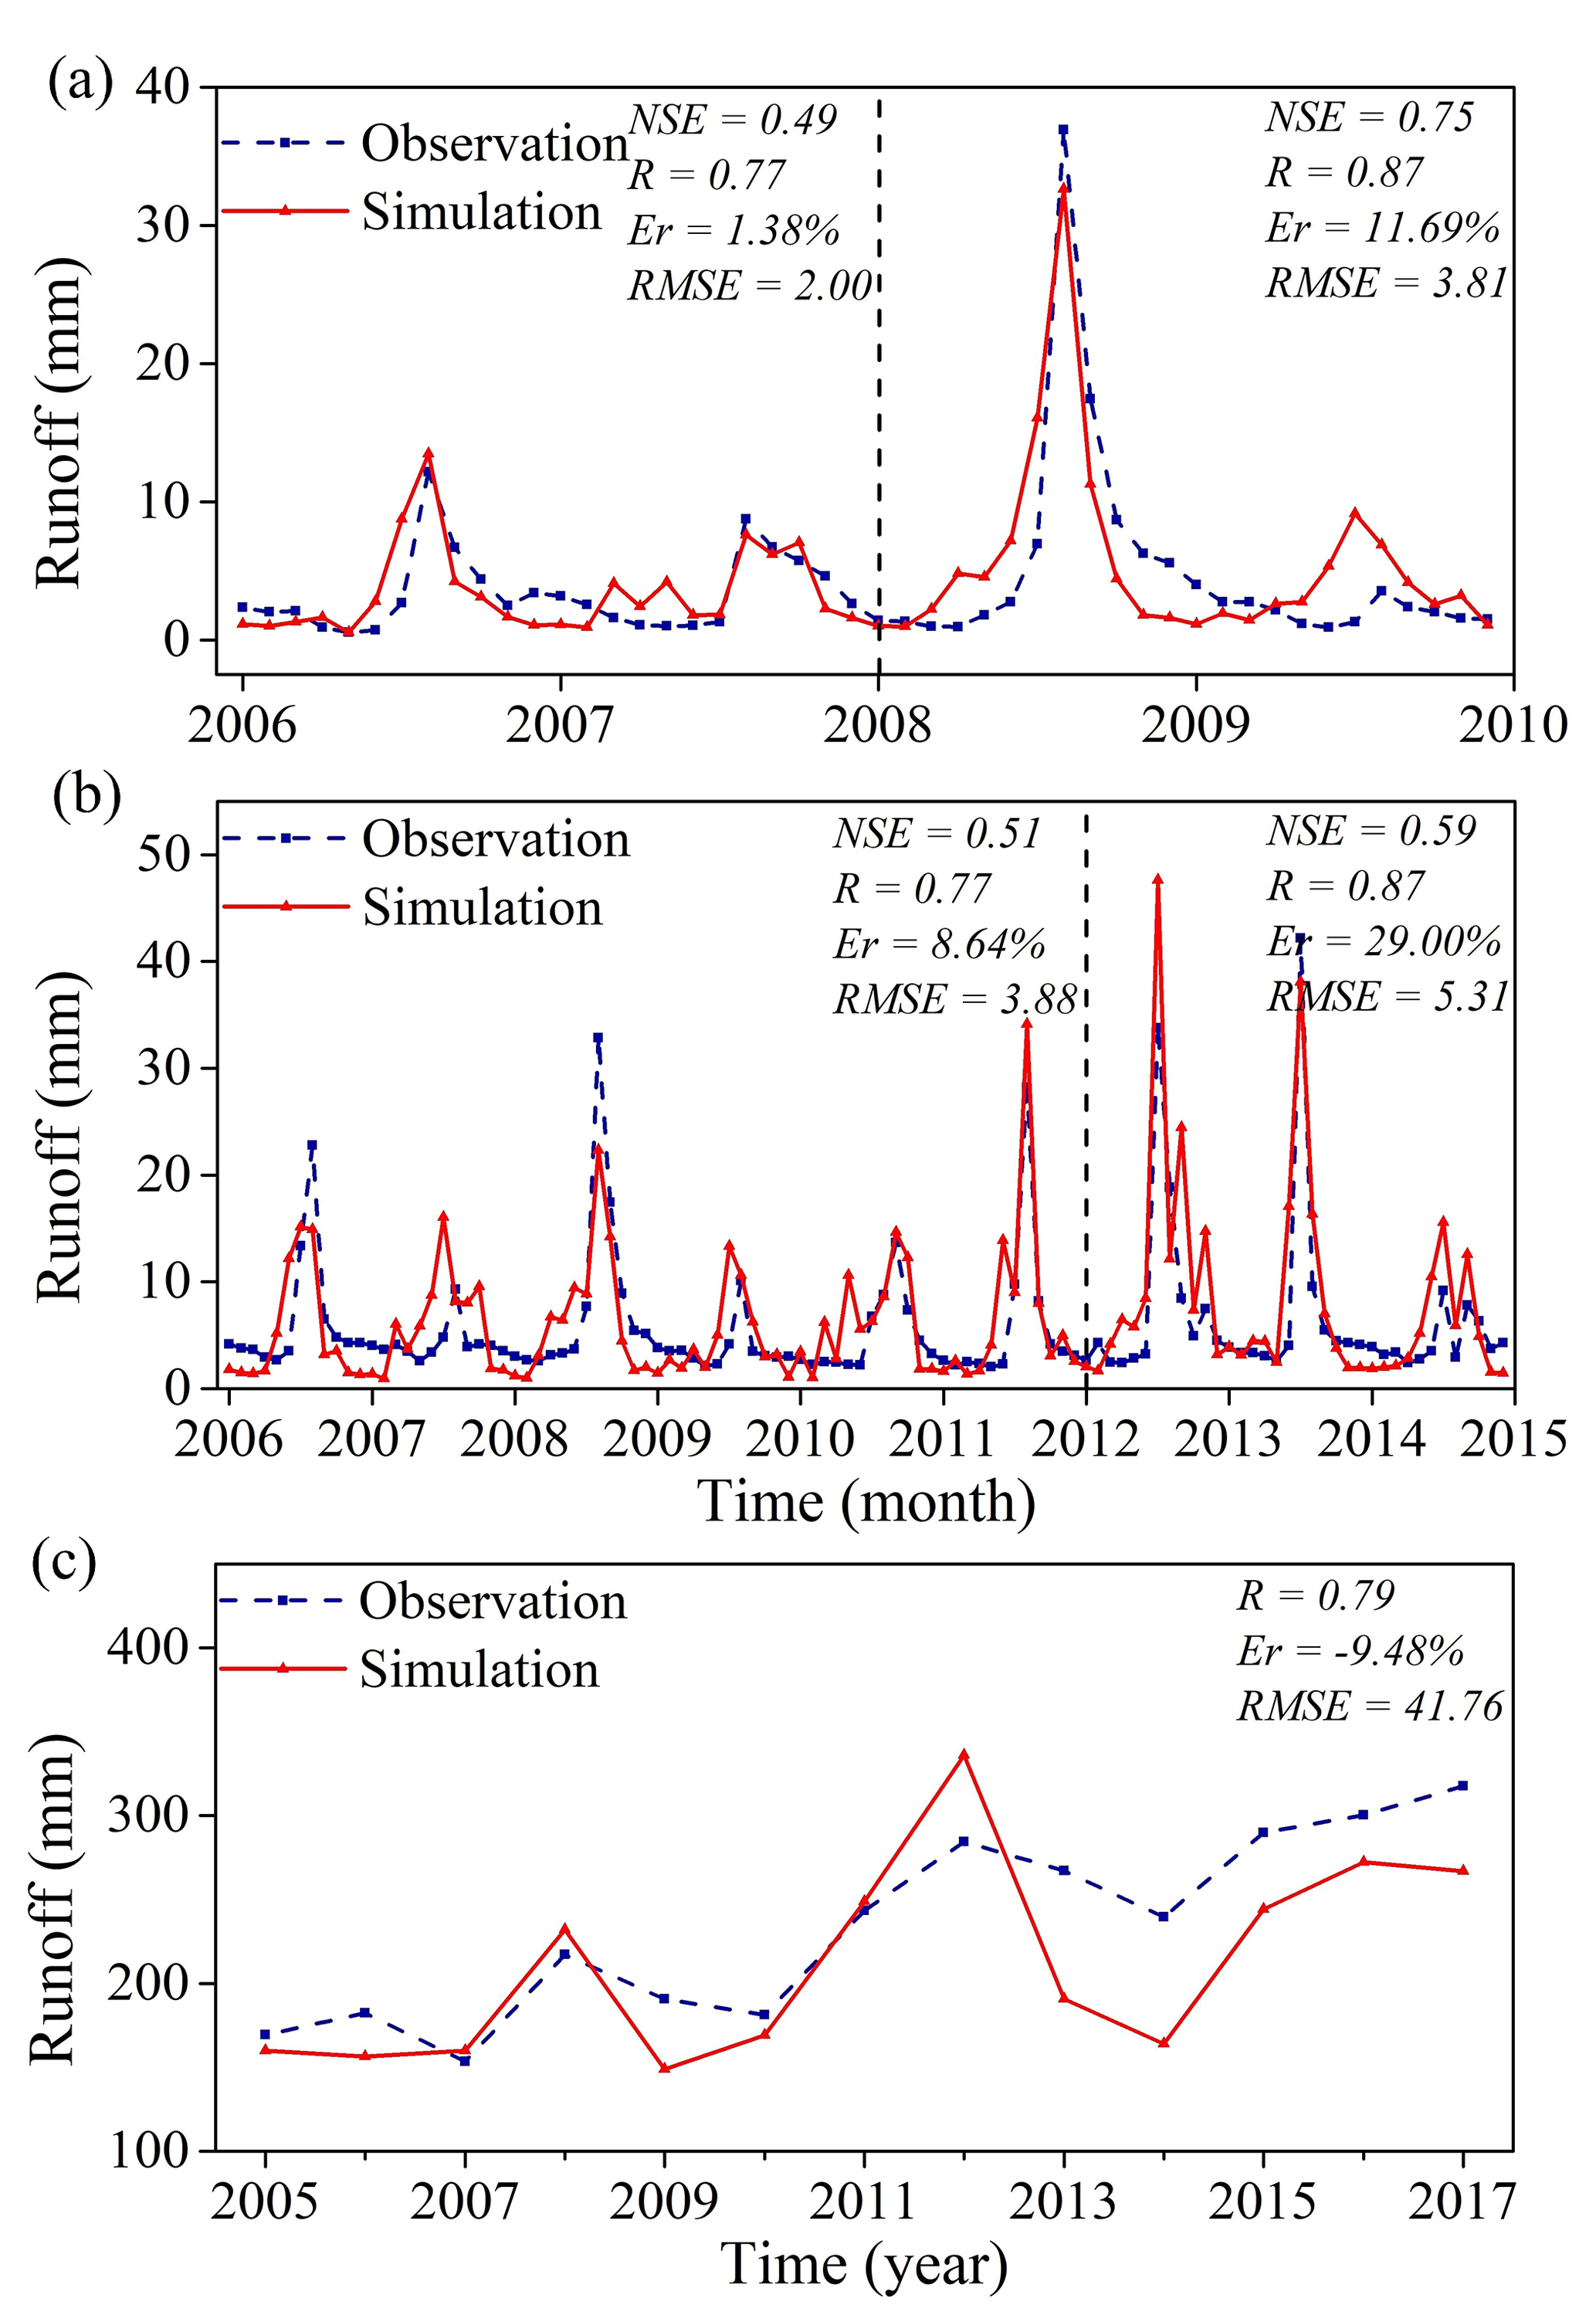
Figure 7Evaluation of the runoff simulation: (a) QXZH, (b) BYCH, and (c) WY. The dark dashed vertical line divides the data into the calibration period (before the line) and validation period (after the line).
The overestimations at QXZH and BYCH and the underestimation at WY could likely be attributed to the limitations of the VIC-urban model in considering human activities. Specifically, the model did not consider water allocation for industrial use in the upstream region of the city (QXZH and BYCH) or the impact of industrial and domestic wastewater in the city centre (WY). The Er of the WY watershed showed an increasing trend, particularly after 2013, which could be attributed to the increasing wastewater discharge. Despite these limitations, the VIC-urban model demonstrated an acceptable performance in simulating runoff.
4.3 Turbulent heat fluxes
The VIC-urban model was evaluated regarding the sensible and latent heat using the observed data of three stations: Beijing, Miyun, and Daxing. As shown in Fig. 8a, the simulated sensible heat flux agrees well with the observed value at the Beijing station. R is approximately 0.65, and the RMSE and Er are below 22 W m−2 and 25 %, respectively. Regarding the latent heat (Fig. 8c and d), the simulated values exhibit high correlations (R values) with the observed data at the Miyun stations (∼ 0.86), and R at the Daxing station is approximately 0.65. Additionally, the RMSE values are below 30 W m−2 for all stations, and the Er values vary between −21 % and −17 %.
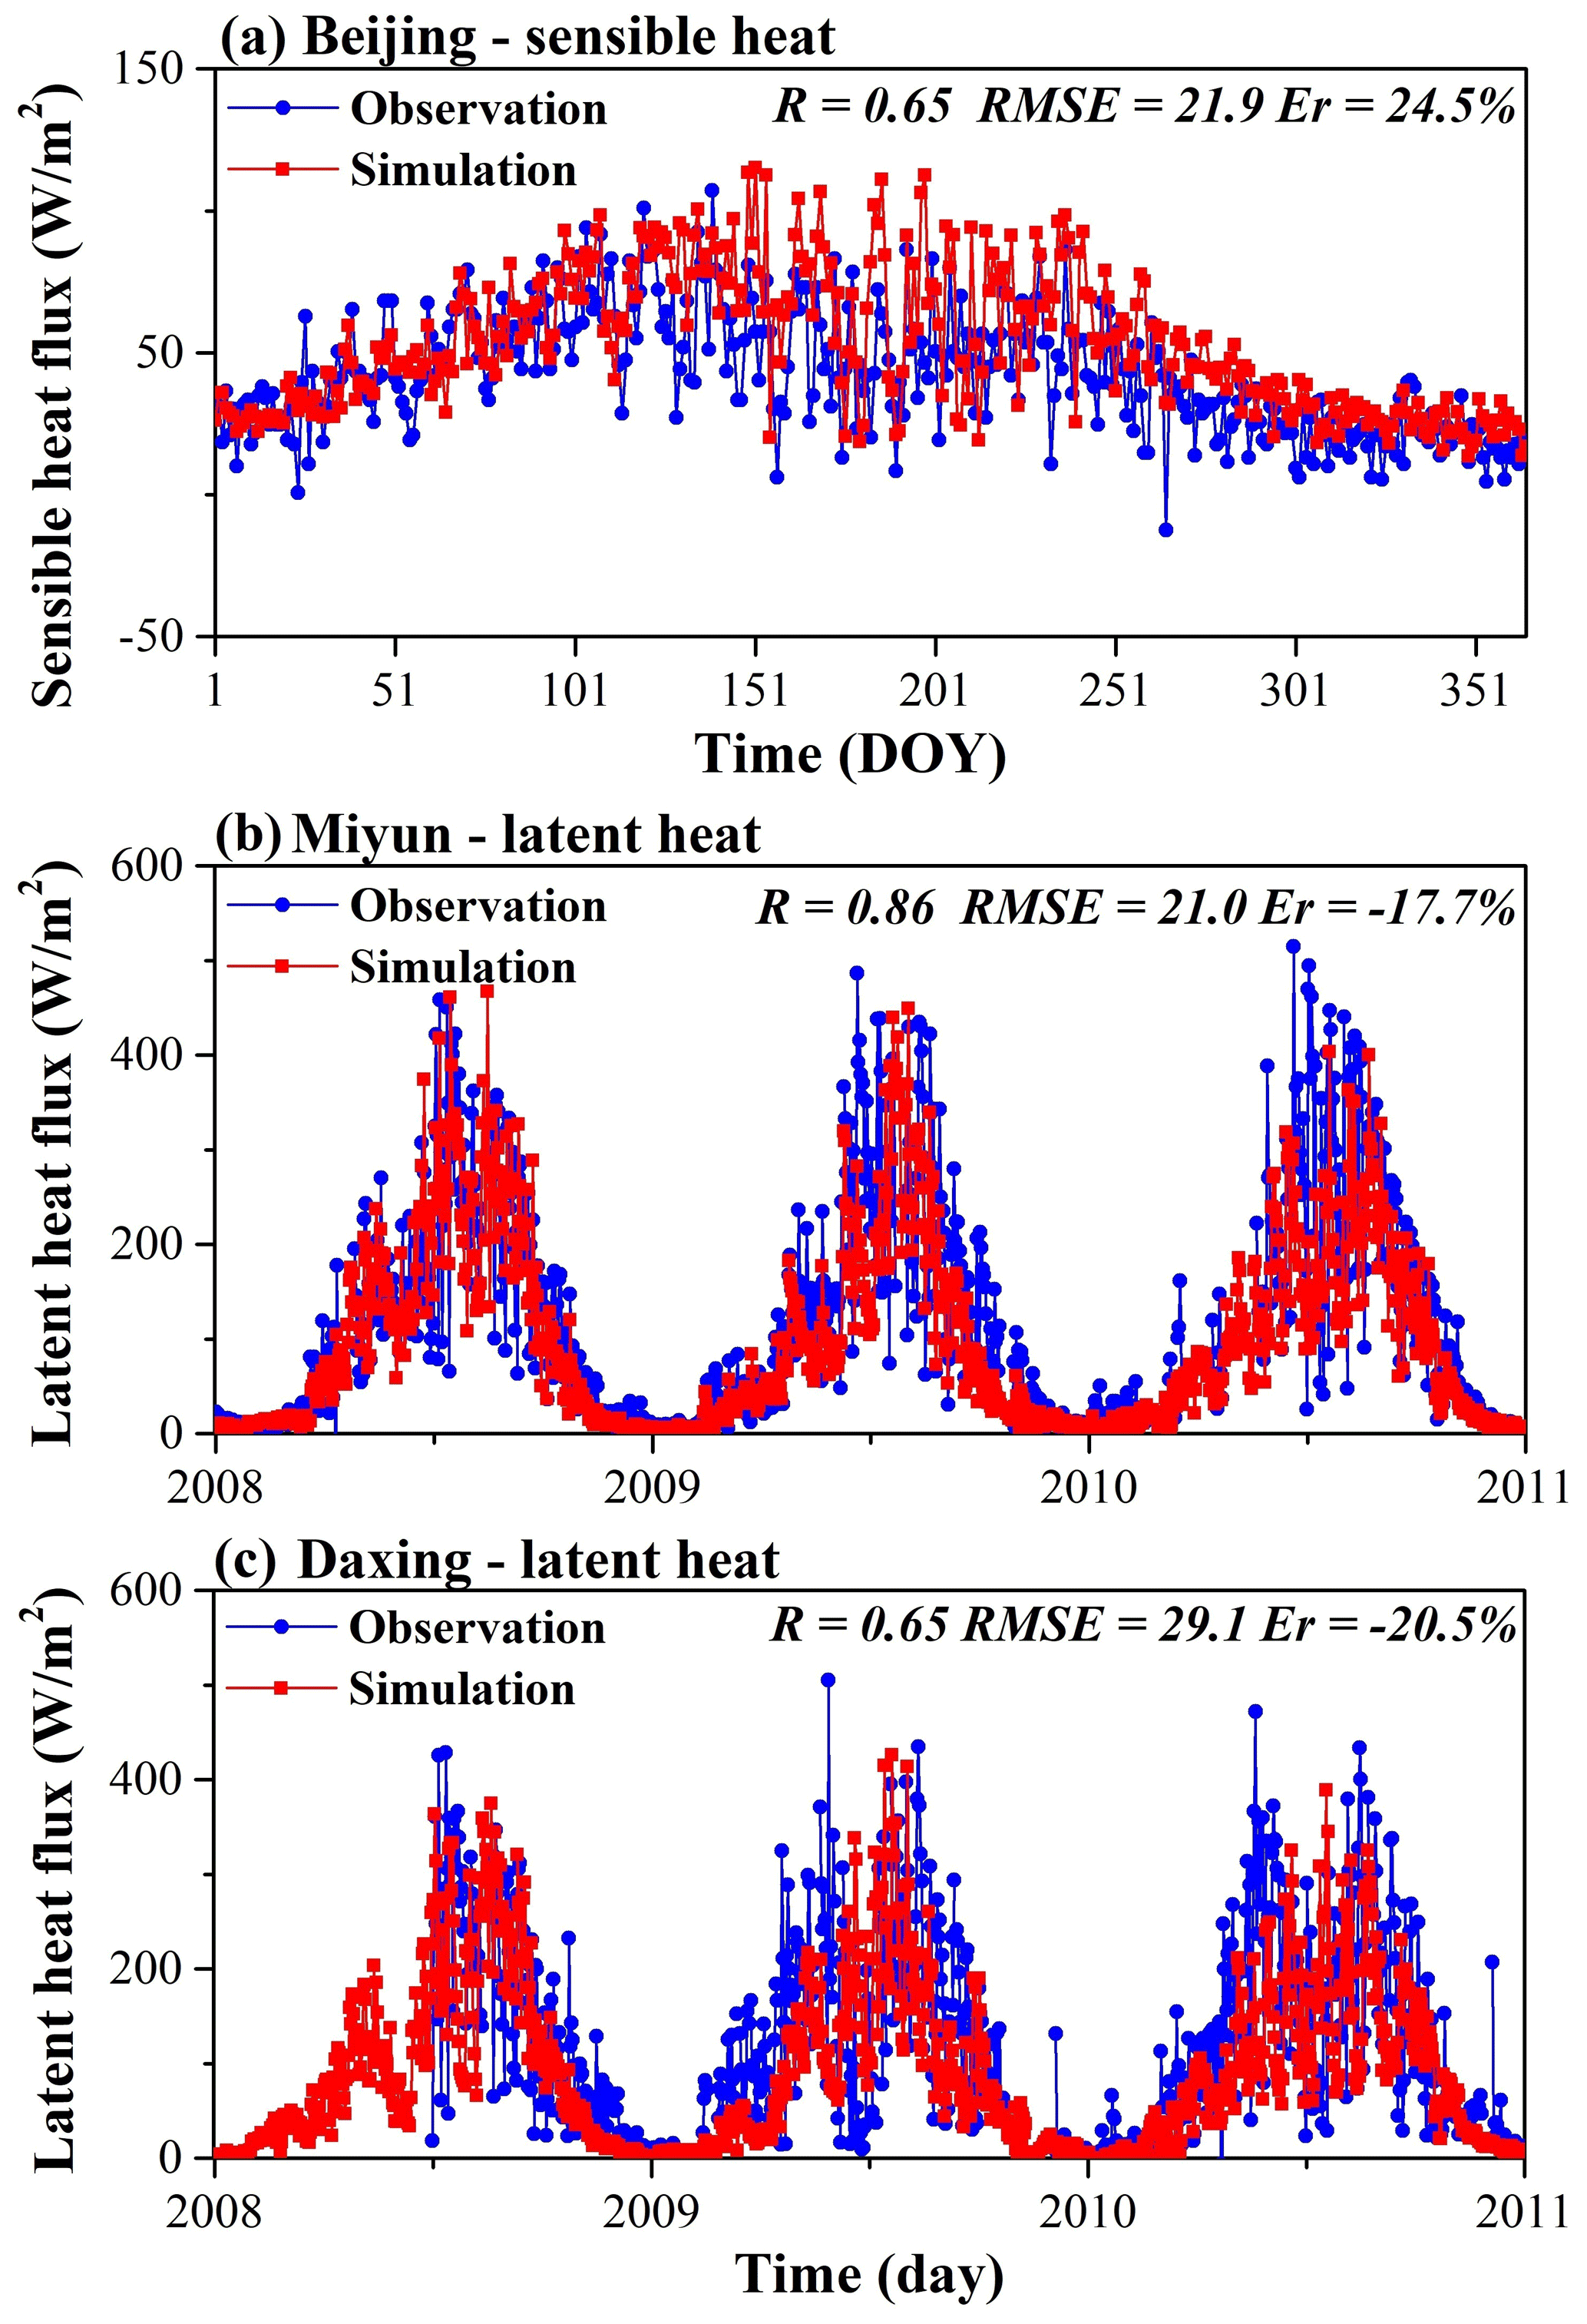
Figure 8Evaluation of the sensible and latent heat flux simulations: (a) averaged daily sensible heat flux at the Beijing flux tower during 2013–2014, (b) daily latent heat flux at the Miyun flux tower during 2008–2010, and (c) daily latent heat flux at the Daxing flux tower during 2008–2010.
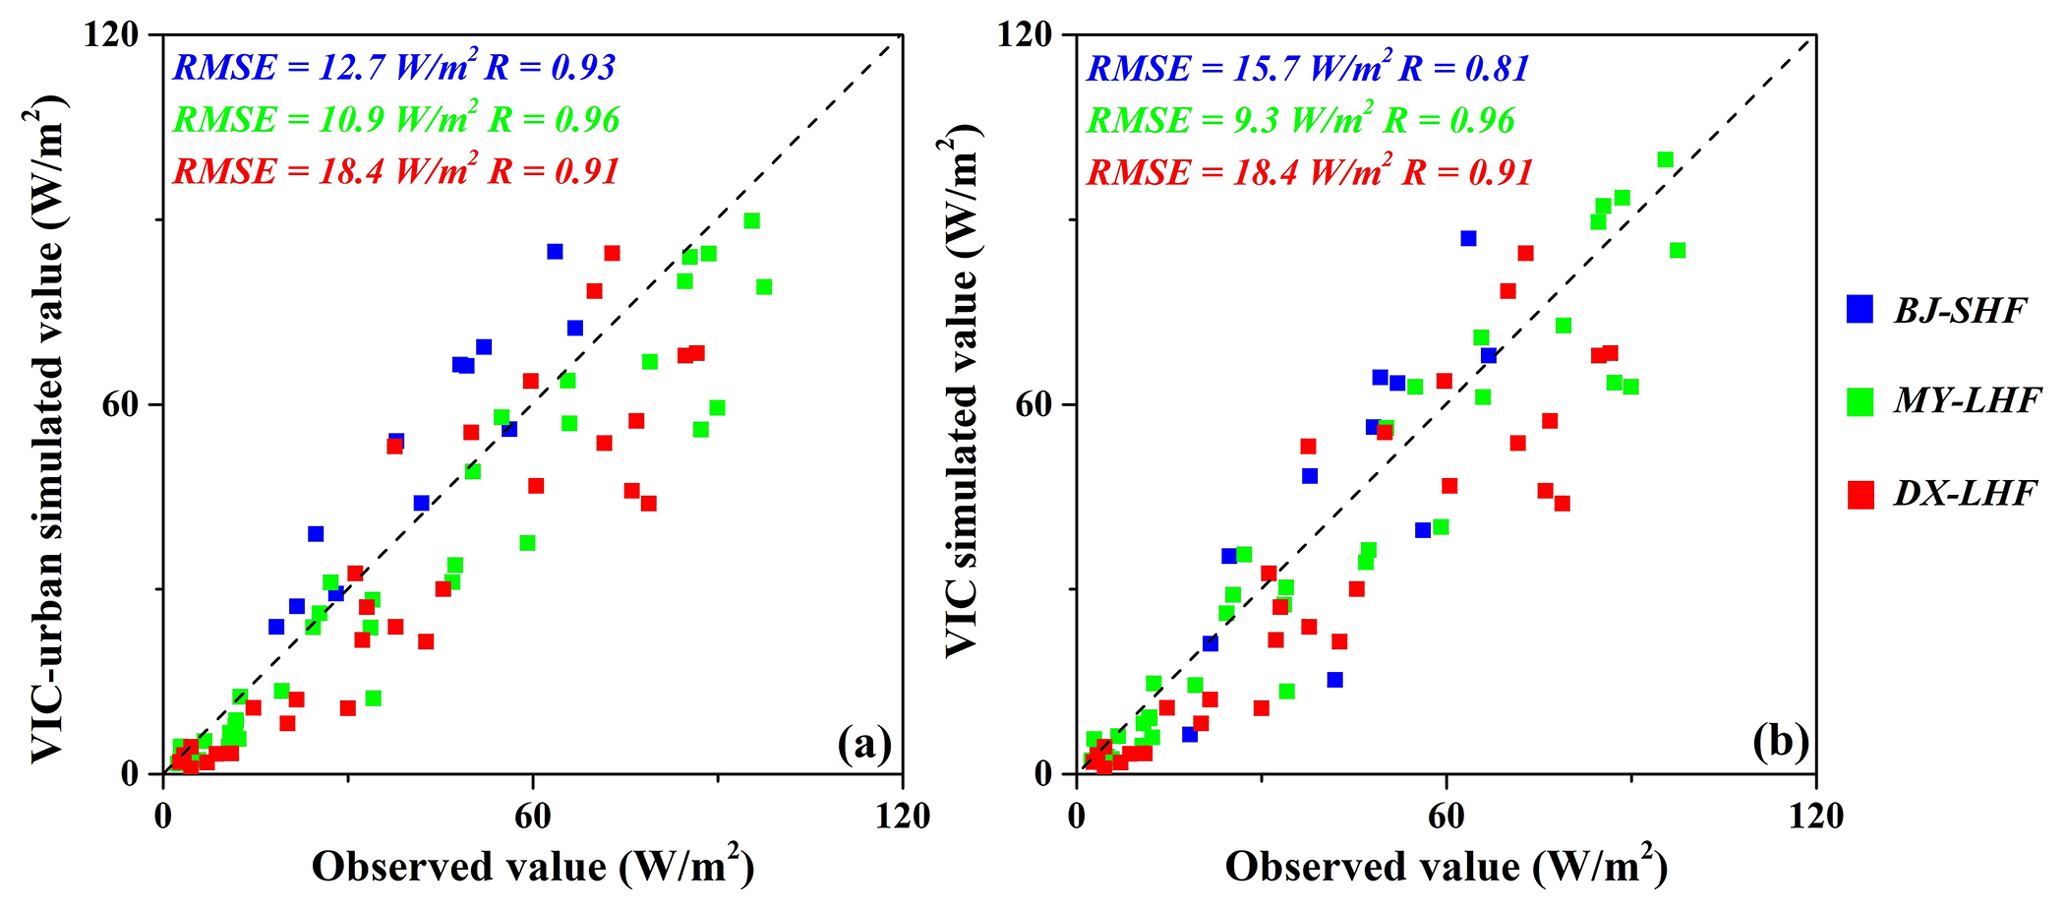
Figure 9Simulated yearly turbulent heat fluxes of the VIC-urban and VIC models compared to the observed data. The blue points denote the comparison of the sensible heat flux at the Beijing station, and the green and red points denote the comparisons of the latent heat flux at the Miyun and Daxing stations, respectively.
4.4 Comparison with the original VIC
The performance of the VIC-urban model and that of the original VIC model were compared in terms of the simulated turbulent heat fluxes, LST, and runoff. As shown in Fig. 9, the simulation results of the VIC-urban and the VIC models showed similar patterns at the Miyun and Daxing stations, as the two stations are located in suburban areas. The VIC-urban model mainly focuses on improving the model performance in urban areas rather than suburban areas. For the Beijing station, which is the site with a high degree of urbanization, VIC-urban provided a better performance. Specifically, the VIC-urban model yielded a smaller RMSE (∼ 12.7 W m−2) for the sensible heat flux than the VIC model (∼ 15.7 W m−2) and attained a higher correlation (∼ 0.93) than the VIC model (∼ 0.81).
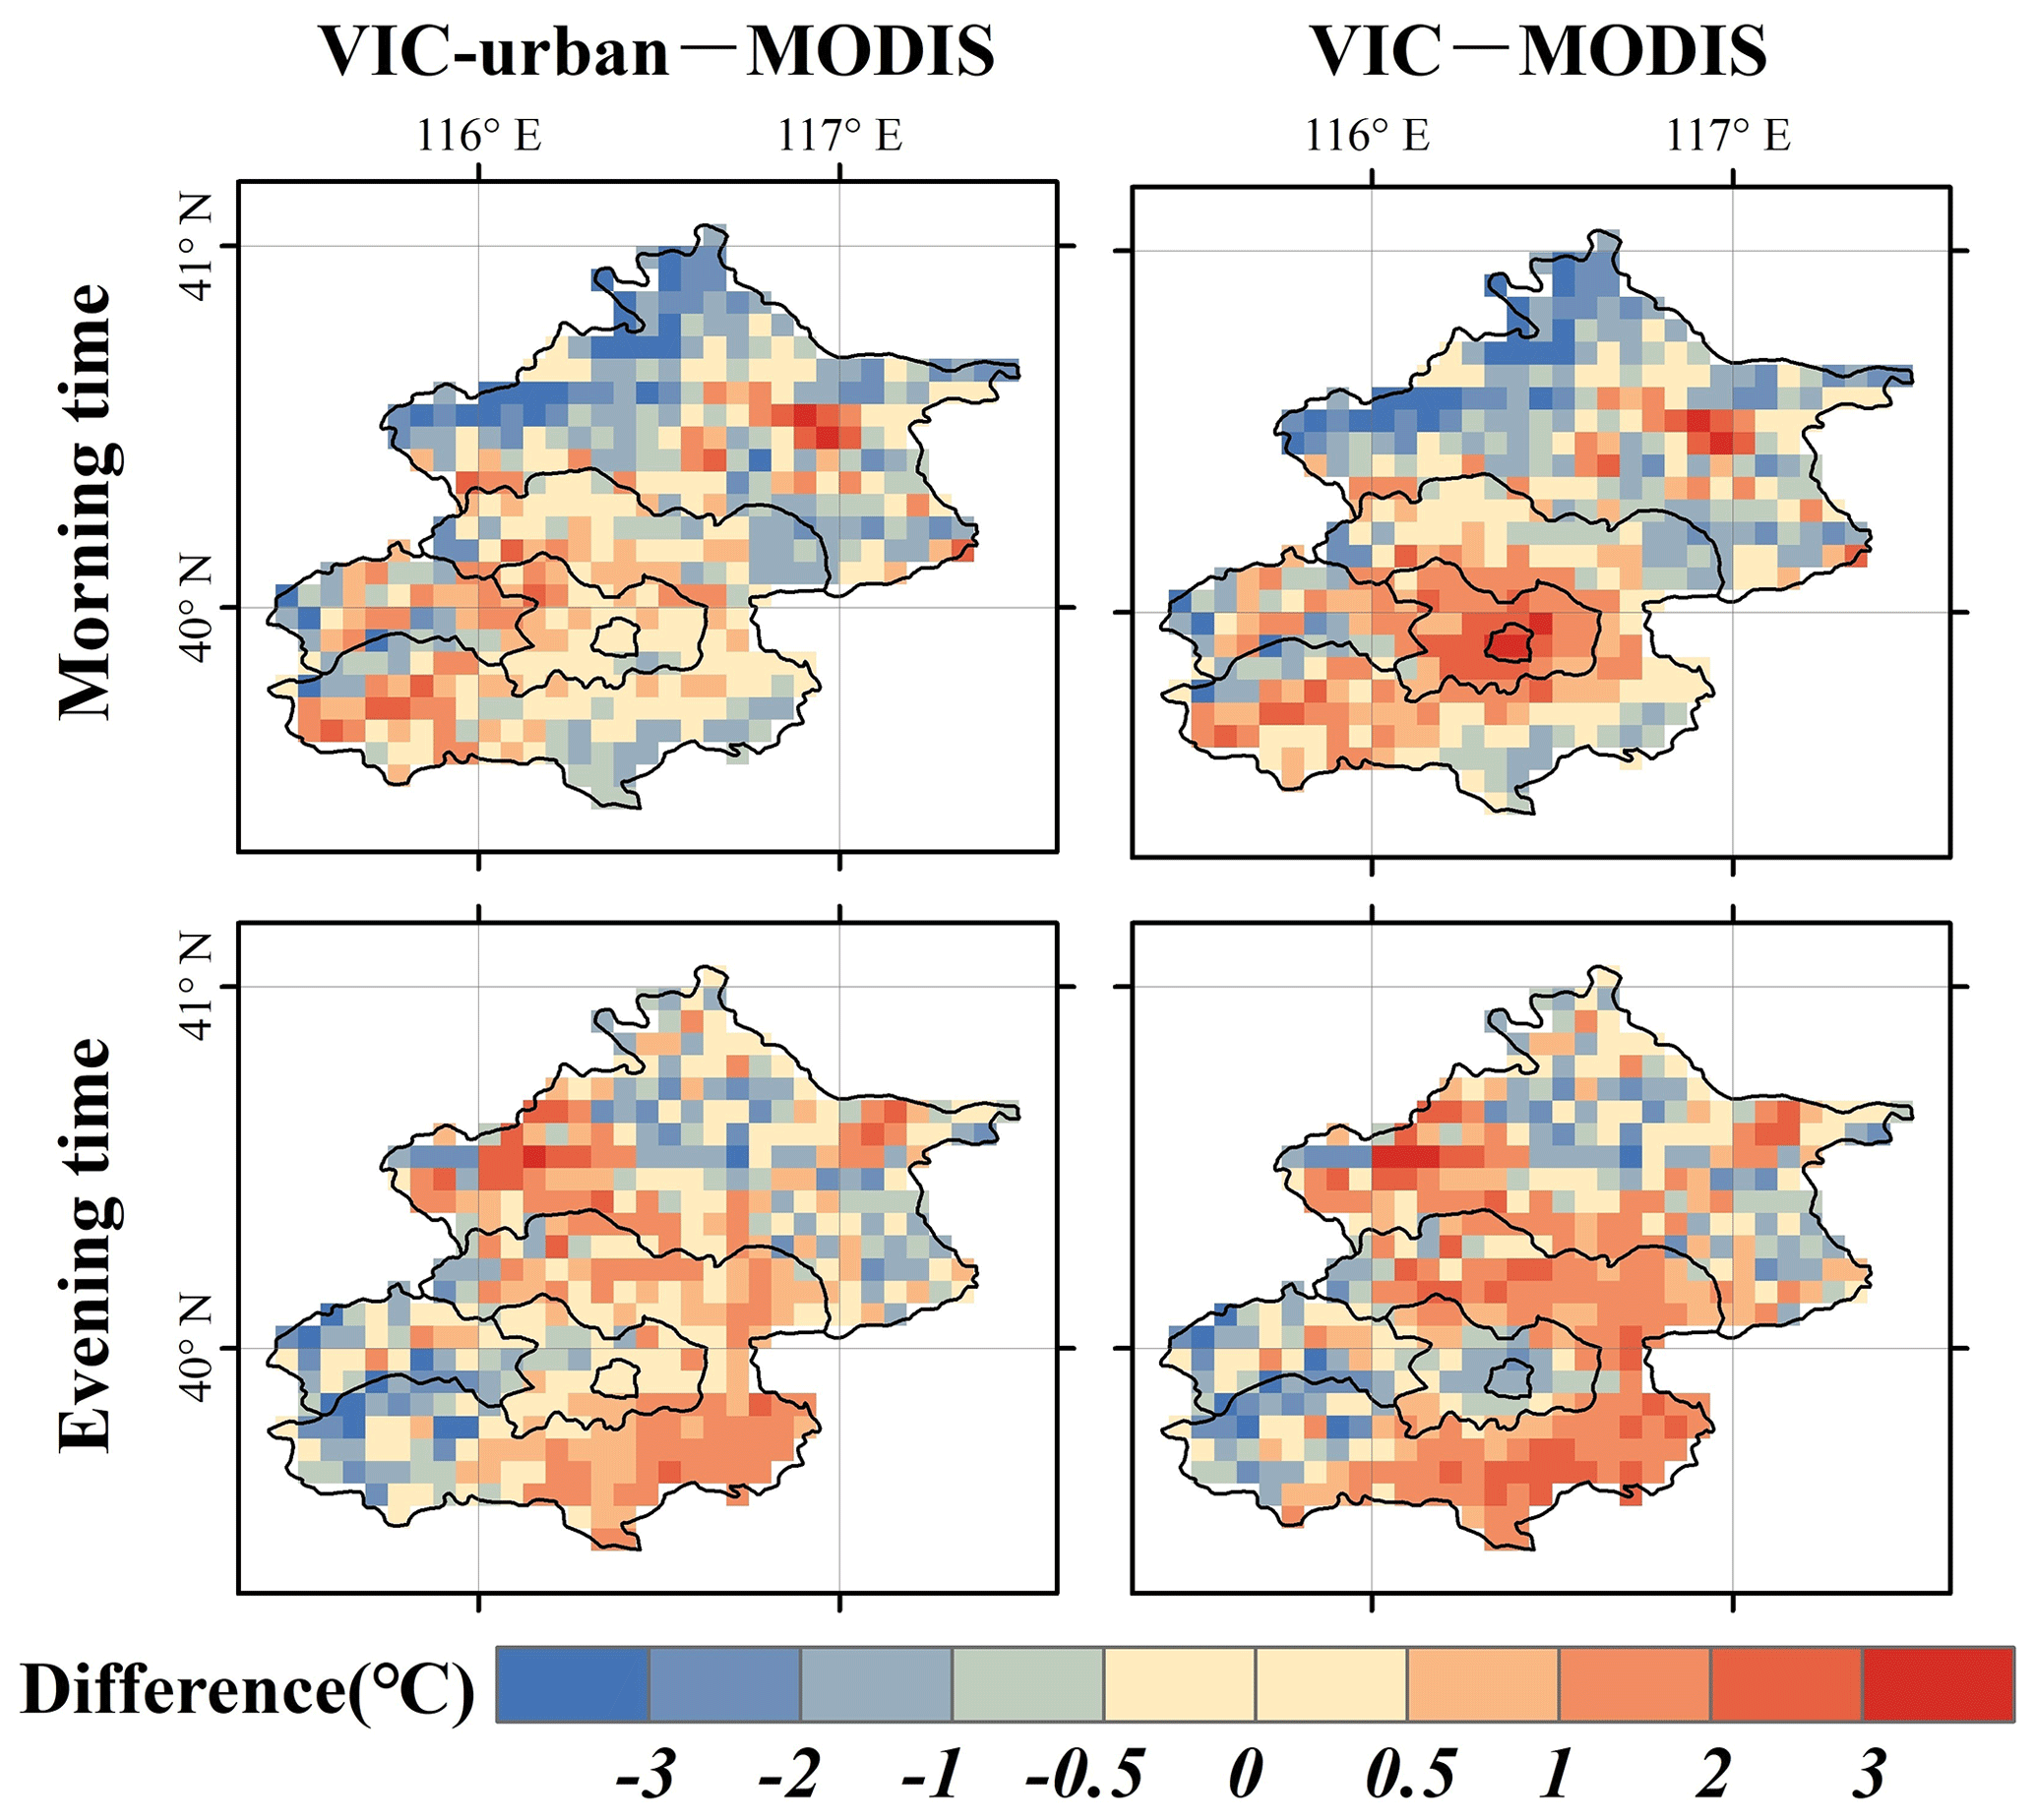
Figure 10Spatial distribution of the LST differences between the MODIS LST and the simulated LST of the VIC-urban model (left) and between the MODIS LST and the simulated LST of the VIC model (right).
In terms of the LST, the VIC-urban model simulations show a lower discrepancy with the MODIS product, especially in the city centre, and the average LST difference is less than 0.5 °C for both the morning and evening times (Fig. 10). However, the average LST difference is larger than 1.8 °C when using the VIC model. Regarding temporal comparison (Figs. 3 and 4), the VIC-urban model simulations show similar patterns to those in the MODIS data, while the VIC model simulations tend to overestimate the LST at the morning time and underestimate the LST at the evening time in Extended-Zone. The VIC-urban model also outperforms the VIC model at the station scale, as indicated by the higher R and lower Er and RMSE values (Table 3).
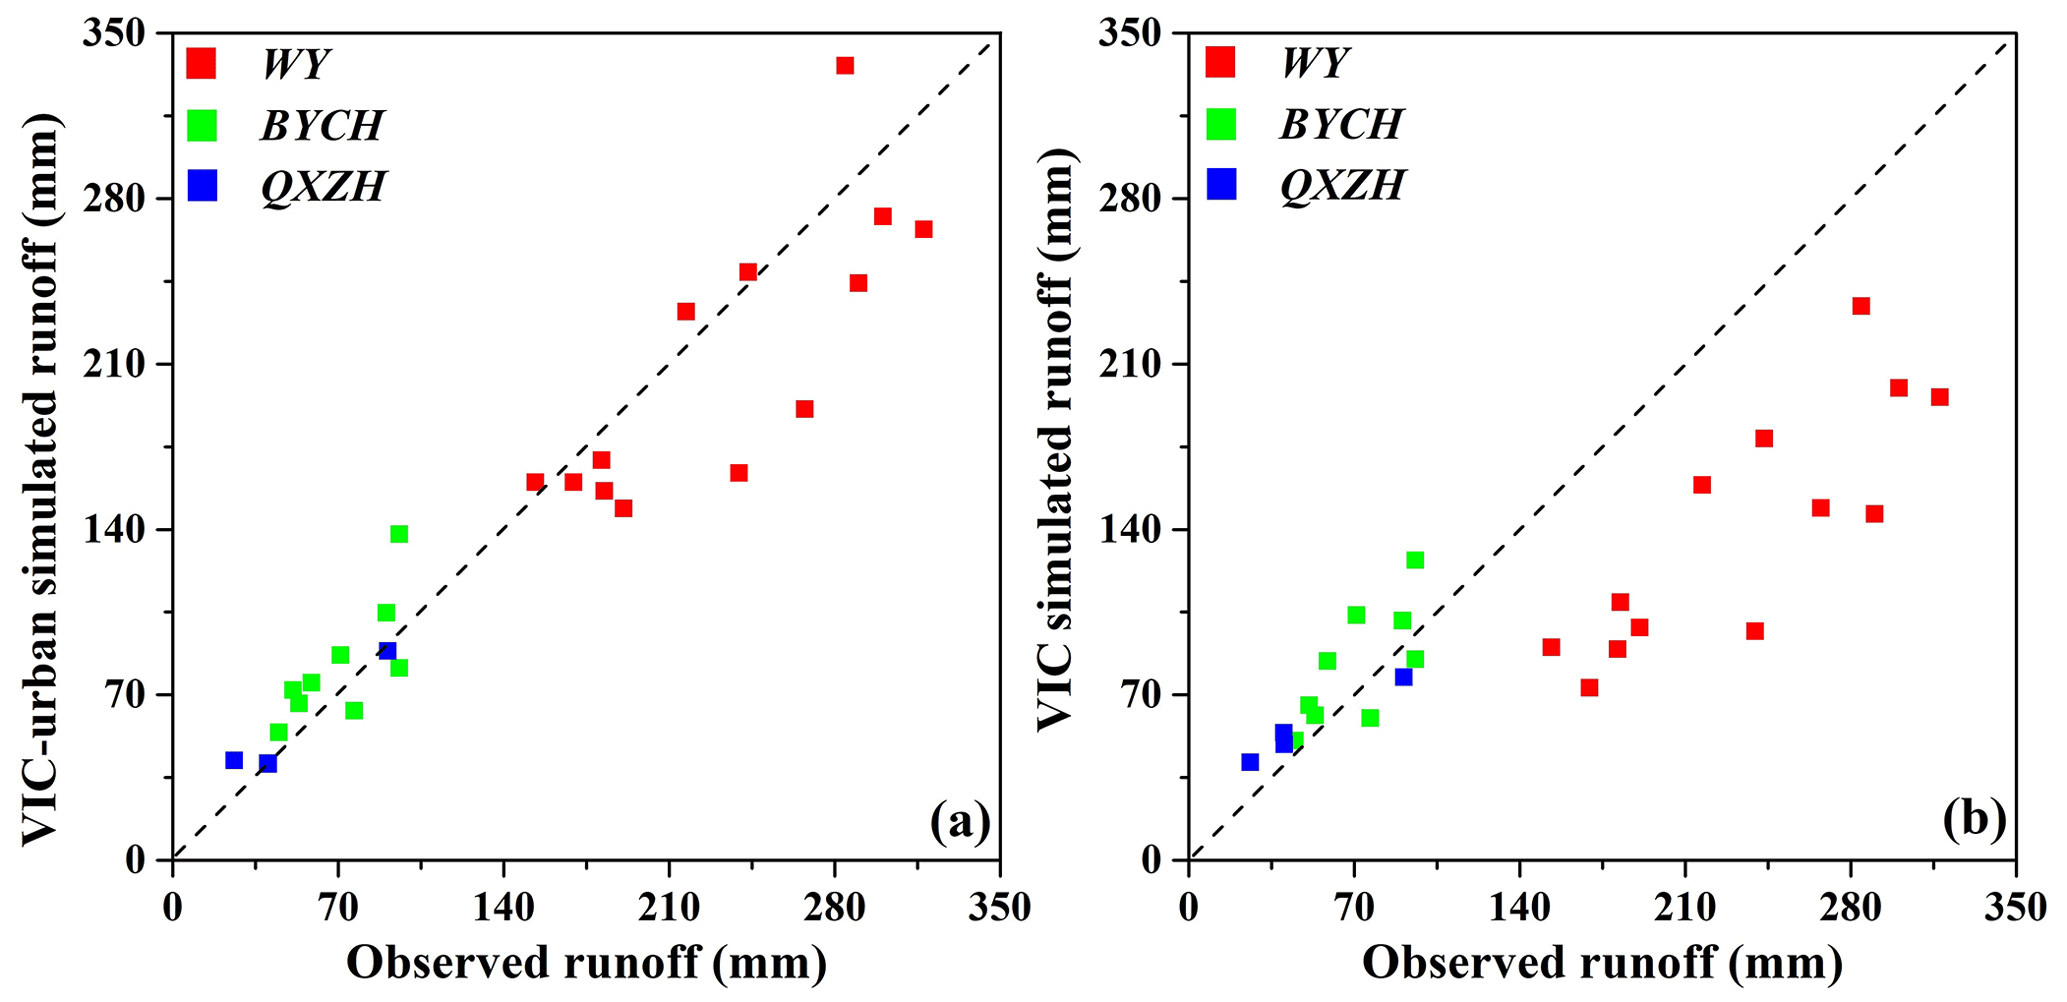
Figure 11Simulated yearly runoff of the VIC-urban and VIC models compared to the observed data. The red, green, and blue points denote the comparisons in the WY, BYCH, and QXZH watersheds, respectively.
Regarding runoff (Fig. 11), the VIC-urban and VIC models exhibit similar performance levels for both the BYCH and the QXZH watersheds. However, the VIC model obviously underestimates runoff in the WY watershed, which has a high urban coverage. The RMSE values of the VIC and VIC-urban model simulations for WY are 98.3 and 41.8 mm yr−1, respectively. Based on the comparisons above, it is evident that the VIC-urban model outperforms the original VIC model in analysing urban-related processes and can capture more realistic hydrological and thermal processes in cities.
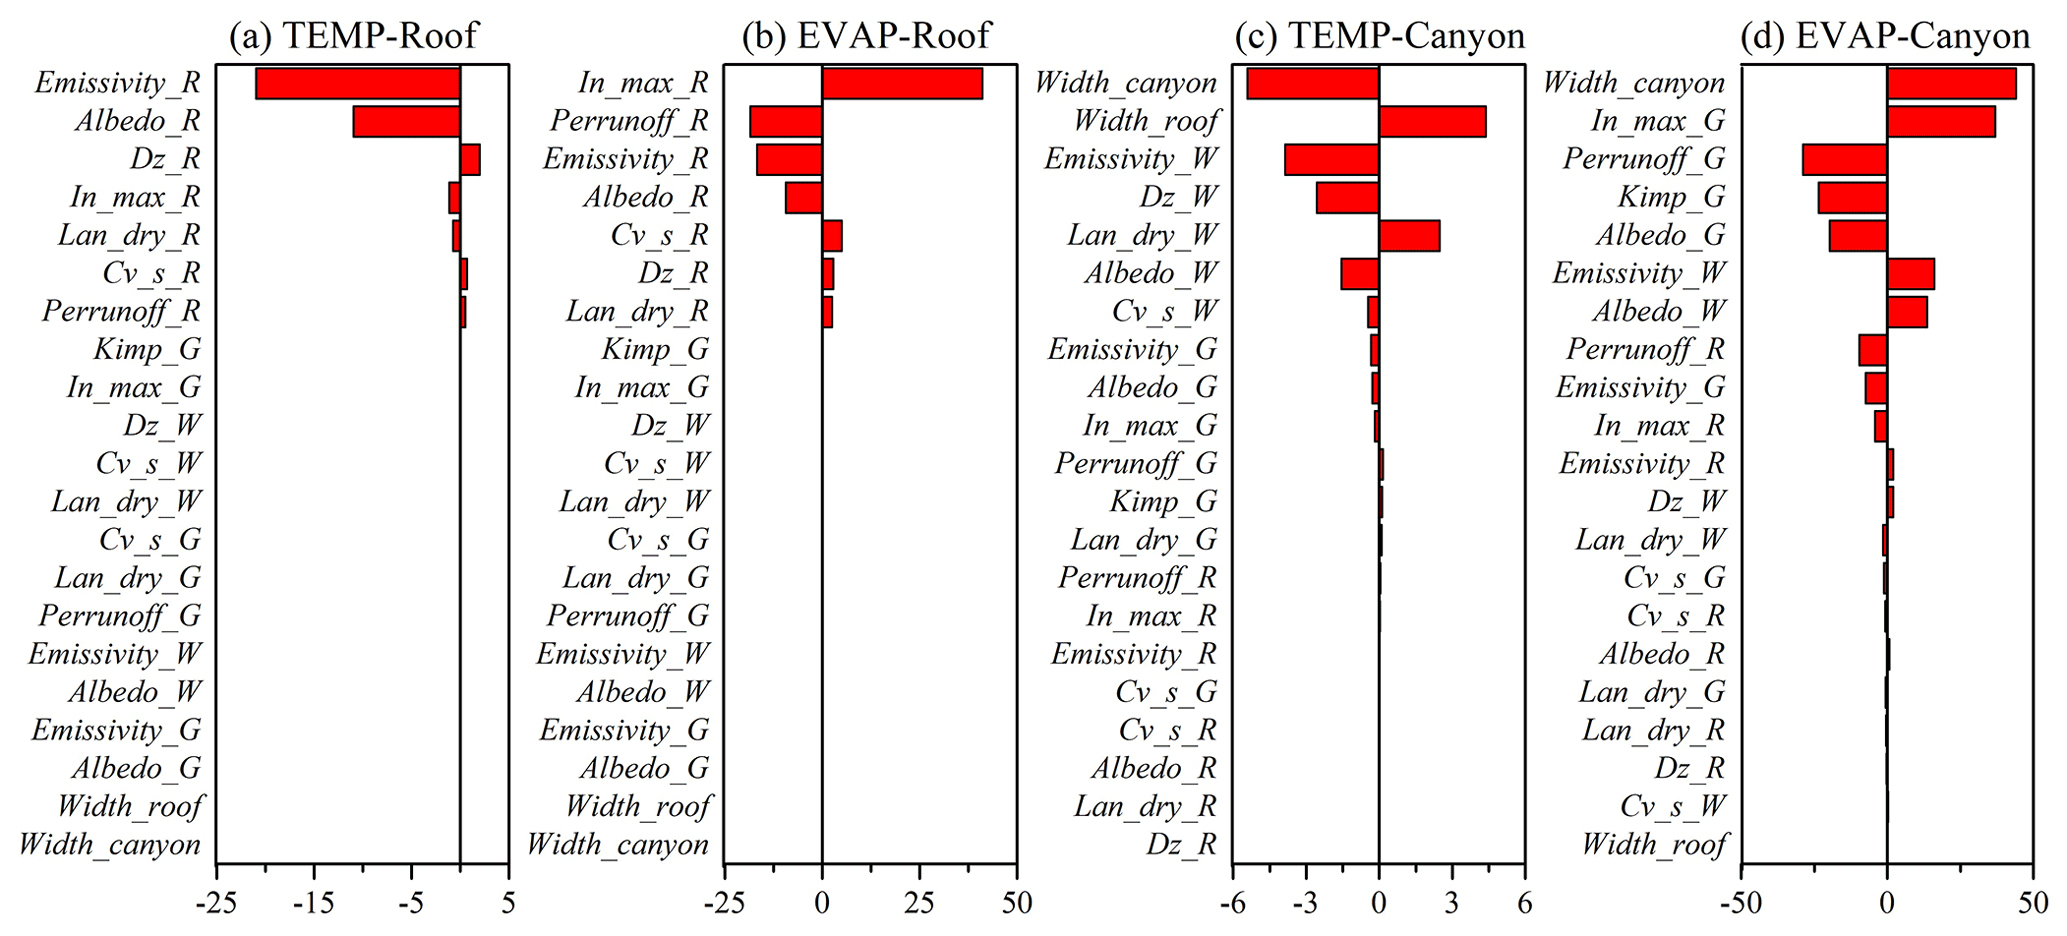
Figure 12Sensitivity coefficients of the parameters to the urban environment: (a) roof temperature, (b) roof evaporation, (c) canyon temperature, and (d) canyon evaporation.
4.5 Sensitivity analysis
We further calculated the sensitivity of the hydrothermal-process-related urban input parameters; that is, we calculated the impact on four indicators (i.e. roof temperature and evaporation and canyon temperature and evaporation). Regarding the roof (Fig. 12a and b), Emissivity_R and Albedo_R generally exhibited high sensitivity to the roof temperature, with sensitivity coefficients of −21 % and −11 %, respectively. The changes in In_max_R, Perrunoff_R, Emissivity_R, and Albedo_R exerted obvious impacts on roof evaporation, with values of 41 %, −19 %, −10 %, and −8 %, respectively.
Regarding the sensitivity of the canyon environment (Fig. 12c and d), Width_canyon (−5 %) and Width_roof (4 %) imposed the greatest impact on the canyon temperature, followed by Emissivity_W (−4 %), Dz_W (−3 %), Lan_dry_W (3 %), and Albedo_W (−2 %). In terms of canyon evaporation, Width_canyon (44 %) and In_max_G (37 %) yielded the highest impact, followed by Perrunoff_G (−29 %), Kimp_G (−23 %), Albedo_G (−20 %), Emissivity_W (16 %), and Albedo_W (14 %). An interesting finding is that the wall parameters (e.g. Emissivity_W, Albedo_W) generally imposed a greater influence on the canyon temperature, while the ground parameters exerted a higher influence on canyon evaporation. The sensitivity coefficients of all parameters are listed in Table S2 in the Supplement.
Figures S3 and S4 in the Supplement show the urban environment (roof and canyon temperature and evaporation) changes with increasing parameter values during the summer and winter seasons. The urban environment exhibited diverse patterns under parameter increase, rather than simply following linear trajectories. An interesting discovery is that the Dz_R and Lan_dry_R parameters showed opposite impacts on the roof temperature during the summer and winter seasons. This inconsistency could be attributed to their role in regulating heat transfer between indoor and outdoor environments. Specifically, indoor temperatures are higher than outdoor temperatures in winter and lower in summer. A higher thermal conductivity (i.e. higher Lan_dry_R and lower Dz_R values) will increase the outdoor surface temperature in winter and decrease it in summer. Similarly, the parameters related to heat conduction (e.g. Dz_W and Lan_dry_G) in the canyon exerted contrasting impacts on the canyon environment during the summer and winter seasons. Moreover, parameters such as albedo and emissivity directly exerted negative impacts on both the roof and canyon temperatures and the evaporation levels. Their effects on roofs are generally similar between winter and summer, and their impact on canyons is more pronounced in summer than in winter.
5.1 Enhanced performance of VIC-urban in urban systems
The urban module described above is among the first attempts to establish a systematic urban environment in the solution of the energy and water budget in the VIC model. The VIC-urban model incorporates detailed representations of urban canyons, urban geometry, and human influences. The model therefore provides favourable estimates of various components of the energy and water balance (e.g. surface runoff, evaporation, and LST) of each urban surface (i.e. roof, canyon, ground, and sunlit and shaded walls).
In each urban tile, the VIC-urban model calculates the incoming radiation of each surface based on geographic information, solar time, and geometric parameters. It then estimates energy budgets using an iterative approach that considers radiative interactions and energy balance principles (Meili et al., 2020). In water balance calculation, the model simulates the hydrological processes of the ground and roof individually and assumes that roof runoff contributes to the groundwater input. Additionally, given the distinct characteristics of urban areas, where excess water on a given surface tends to remain in place rather than immediately exiting the system (e.g. flat roofs and ground), the model includes a run-on component to more comprehensively represent water movement in urban environments.
The VIC-urban model was assessed based on the data of multiple gauge stations and MODIS LST data and compared to the original VIC model in Beijing urban areas. The results indicated that the VIC-urban model achieves excellent performance, with RMSE values below 0.5 and 1.8 °C relative to the MODIS LST and gauge station data, respectively, and lower than 30 W m−2 and 6 mm per month in turbulent heat and runoff evaluation, respectively. Importantly, the VIC-urban model outperforms the original VIC model in urban areas. It largely reduces the discrepancy between the simulated and observed values, successfully capturing higher LST and runoff values at the urban centre. These findings suggest that the VIC-urban model is a valuable tool for reliable analysis of urban areas.
5.2 Advantages of the VIC-urban model
The development of the VIC-urban model provides a new urban modelling option. It employs the canyon concept, which has been widely used in UCMs and coupled models (Oleson and Feddema, 2020; Li et al., 2016b; Sun and Grimmond, 2019). Most UCMs, such as the Surface Urban Energy and Water Balance Scheme (SUEWS) (Järvi et al., 2011), primarily focus on water and energy balances on urban impervious surfaces and have generally been applied at small spatial scales, such as a single city. Moreover, UCMs often neglect heterogeneity within urban areas (Kusaka et al., 2001; Meili et al., 2020). In contrast, the VIC-urban model is able to simulate hydrothermal processes for multiple land cover types and can be used for large-scale applications beyond urban areas (e.g. at regional and global scales). VIC-urban offers high customizability with urban configurations and simulates hydrothermal processes at the grid cell scale. It can merge hydrothermal inputs at the subcity scale to enhance its potential for predicting water and energy balances in complex urban systems.
Large-scale urban models provide advantages in detecting hydrothermal dynamics in urban environments due to their consideration of surface heterogeneity within a city. For instance, the CLMU model incorporates a building energy model that considers convection and longwave radiation exchange with interior building surfaces (Oleson and Feddema, 2020). The LM3-UCM model can simulate carbon exchange and considers dynamic transitions between urban, agricultural, and unmanaged tiles (Li et al., 2016b). However, these models often use constant land cover and radiation parameters over time. The VIC-urban model can continuously capture land cover and radiation dynamics by integrating remote sensing products. Furthermore, it incorporates a comprehensive thermally conductive framework that considers three distinct layers (i.e. outdoor environment, interior building, and indoor environment) and two vertical wall layers. These features are crucial for identifying long-term urban-induced environmental changes and providing a comprehensive understanding of the urban environment.
5.3 Limitations
The current version of the VIC-urban model has certain limitations. First, the model lacks the water and energy balance related to snow melt, as well as certain anthropogenic disturbances (e.g. drainage systems, air conditioning, and car exhaust) (Liu et al., 2021). The model also simplifies anthropogenic heat and water impacts, which are user-defined and represented by a constant setting and 12-month-cycle values, respectively. However, these anthropogenic influences fluctuate over time, such as anthropogenic heat input in office areas varying between weekdays and weekends. These factors may have a significant impact on the urban environment and need to be further studied given the availability and accuracy of data and the feasibility of methods (Yousefi Sohi et al., 2024). Second, the model does not consider horizontal interactions between land cover types and water and energy transfer in the subsoil beneath impervious surfaces due to impermeable characteristics. Third, the module does not explicitly formulate the type of urban vegetation (i.e. vegetation or trees in cities), which may play an important role in the hydrology and energy cycle of cities (Meili et al., 2020; Wang et al., 2018). Nevertheless, the VIC-urban model divides the study area of interest into grids and categorizes urban vegetation as forests and/or grasslands, thus estimating the water and energy balance.
The validation of the turbulent heat fluxes was not sufficient to reflect the model performance due to the scarcity of station data. However, the model was further validated using runoff and LST data obtained from gauge stations and the MODIS product. These hydrothermal fluxes and states can be cross-verified based on the principles of water and energy balance, proving the reliability of VIC-urban in representing the complexity of urban environments. In addition, the VIC-urban model introduces new parameters (Table 1) that should be estimated or calibrated before the simulation, and these parameters may cause substantial uncertainties. Notably, parameters such as In_max_R (maximum infiltration rate) and the height-to-width ratio are influential in estimating urban temperature and evaporation patterns, as illustrated in Sect. 4.5. Cities worldwide exhibit diverse configurations and various human influences, leading to differing empirical parameters of influence. The VIC-urban model therefore requires more evaluations in cities with diverse urban environments.
In this study, we developed a new urban module in the VIC model, demonstrated its reliability, and estimated the sensitivity of the model parameters. Adopting Beijing as an evaluation site, the VIC-urban model showed promising performance regarding the simulation of sensible heat, latent heat, runoff, and LST. Moreover, the VIC-urban model could capture the LST and runoff patterns in the city centre better than the original VIC model. The sensitivity analysis revealed that the parameters of emissivity (i.e. Emissivity_R) and maximum interception capacity of the roof (i.e. In_max_R) generally exert the greatest impacts on the roof temperature and evaporation, respectively, and the height-to-width ratio imposed the highest impact on the canyon temperature and evaporation.
The current version of the VIC-urban model still holds substantial uncertainties due to its parameters and related processes and the lack of consideration of human disturbances (anthropogenic heat and water inputs), horizontal interactions, and snow dynamics. However, our work is among the first attempts to establish systematic urban estimation within the VIC model, and the model is suitably formulated with detailed subcity configurations, human influences, and radiative balance and interactions. By considering the unique characteristics of urban areas and land cover and radiation dynamics, the VIC-urban model provides a more realistic representation of urban hydrology and thermal dynamics. Therefore, the model can be a valuable tool for detecting and understanding water and energy processes in urban areas and for improving the prediction of hydrothermal fluxes and states of the urban environment.
The codes of VIC-urban and an example file for urban parameters are available at https://doi.org/10.5281/zenodo.10258321 (Wang and Xie, 2023). The original VIC model is available at https://vic.readthedocs.io/en/master/Overview/ModelOverview/ (Liang et al., 1994), and the urban module refers to Meili et al. (2020). The Moderate Resolution Imaging Spectroradiometer (MODIS) datasets used in this study are from Wan et al. (2015), with the identifier https://doi.org/10.5067/MODIS/MOD11A2.006. The downward shortwave radiation (DSR) is obtained from Zhang et al. (2019), the albedo from Qu et al. (2014), the leaf area index (LAI) from Xiao et al. (2016), and the fractional vegetation cover (FVC) from Jia et al. (2019).
The supplement related to this article is available online at: https://doi.org/10.5194/gmd-17-5803-2024-supplement.
YW designed and implemented the model, performed the analysis, and wrote the manuscript. XX proposed and supervised the study and wrote and revised the manuscript. BZ, AT, and FJ created the figures and wrote Sect. S1 in the Supplement. YL, DP, and BZ wrote Sect. S2 in the Supplement. All authors contributed comments and discussions about the study.
The contact author has declared that none of the authors has any competing interests.
Publisher's note: Copernicus Publications remains neutral with regard to jurisdictional claims made in the text, published maps, institutional affiliations, or any other geographical representation in this paper. While Copernicus Publications makes every effort to include appropriate place names, the final responsibility lies with the authors.
We thank Nathaniel Chaney, Subimal Ghosh, and the two anonymous referees for their constructive comments. We are grateful to Naika Meili for guidance on urban modelling and coding.
This research has been supported by the National Natural Science Foundation of China (grant no. 42271021).
This paper was edited by Nathaniel Chaney and reviewed by Subimal Ghosh and two anonymous referees.
Best, M. J. and Grimmond, C. S. B.: Key conclusions of the first international urban land surface model comparison project, B. Am. Meteorol. Soc., 96, 805–819, https://doi.org/10.1175/BAMS-D-14-00122.1, 2015.
Beven, K.: A sensitivity analysis of the Penman–Monteith actual evapotranspiration estimates, J. Hydrol., 44, 169–190, 1979.
Bierkens, M. F. P., Bell, V. A., Burek, P., Chaney, N., Condon, L. E., David, C. H., de Roo, A., Döll, P., Drost, N., Famiglietti, J. S., Flörke, M., Gochis, D. J., Houser, P., Hut, R., Keune, J., Kollet, S., Maxwell, R. M., Reager, J. T., Samaniego, L., Sudicky, E., Sutanudjaja, E. H., van de Giesen, N., Winsemius, H., and Wood, E. F.: Hyper-resolution global hydrological modelling: what is next?, Hydrol. Process., 29, 310–320, https://doi.org/10.1002/hyp.10391, 2015.
Bounoua, L., Zhang, P., Mostovoy, G., Thome, K., Masek, J., Imhoff, M., Shepherd, M., Quattrochi, D., Santanello, J., Silva, J., Wolfe, R., and Toure, A. M.: Impact of urbanization on US surface climate, Environ. Res. Lett., 10, 084010, https://doi.org/10.1088/1748-9326/10/8/084010, 2015.
Chen, J., Bu, J., Su, Y., Yuan, M., Cao, K., and Gao, Y.: Urban evapotranspiration estimation based on anthropogenic activities and modified Penman-Monteith model, J. Hydrol., 610, 127879, https://doi.org/10.1016/j.jhydrol.2022.127879, 2022.
Hersbach, H., Bell, B., Berrisford, P., Hirahara, S., Horányi, A., Muñoz-Sabater, J., Nicolas, J., Peubey, C., Radu, R., Schepers, D., Simmons, A., Soci, C., Abdalla, S., Abellan, X., Balsamo, G., Bechtold, P., Biavati, G., Bidlot, J., Bonavita, M., Chiara, G., Dahlgren, P., Dee, D., Diamantakis, M., Dragani, R., Flemming, J., Forbes, R., Fuentes, M., Geer, A., Haimberger, L., Healy, S., Hogan, R. J., Hólm, E., Janisková, M., Keeley, S., Laloyaux, P., Lopez, P., Lupu, C., Radnoti, G., Rosnay, P., Rozum, I., Vamborg, F., Villaume, S., and Thépaut, J. N.: The ERA5 global reanalysis, Q. J. Roy. Meteor. Soc., 146, 1999–2049, https://doi.org/10.1002/qj.3803, 2020.
Huang, S., Zhang, X., Yang, L., Chen, N., Nam, W.-H., and Niyogi, D.: Urbanization-induced drought modification: Example over the Yangtze River Basin, China, Urban Climate, 44, 101231, https://doi.org/10.1016/j.uclim.2022.101231, 2022.
Jackson, T. L., Feddema, J. J., Oleson, K. W., Bonan, G. B., and Bauer, J. T.: Parameterization of Urban Characteristics for Global Climate Modeling, Ann. Assoc. Am. Geogr., 100, 848–865, https://doi.org/10.1080/00045608.2010.497328, 2010.
Järvi, L., Grimmond, C. S. B., and Christen, A.: The Surface Urban Energy and Water Balance Scheme (SUEWS): Evaluation in Los Angeles and Vancouver, J. Hydrol., 411, 219–237, https://doi.org/10.1016/j.jhydrol.2011.10.001, 2011.
Ji, P., Yuan, X., Liang, X. Z., Jiao, Y., Zhou, Y., and Liu, Z.: High-Resolution Land Surface Modeling of the Effect of Long–Term Urbanization on Hydrothermal Changes Over Beijing Metropolitan Area, J. Geophys. Res.-Atmos., 126, e2021JD034787, https://doi.org/10.1029/2021jd034787, 2021.
Jia, K., Yang, L., Liang, S., Xiao, Z., Zhao, X., Yao, Y., Zhang, X., Jiang, B., and Liu, D.: Long-Term Global Land Surface Satellite (GLASS) Fractional Vegetation Cover Product Derived From MODIS and AVHRR Data, IEEE J. Sel. Top. Appl. Earth Obs., 12, 508–518, 2019.
Jiang, F., Xie, X., Wang, Y., Liang, S., Zhu, B., Meng, S., Zhang, X., Chen, Y., and Liu, Y.: Vegetation greening intensified transpiration but constrained soil evaporation on the Loess Plateau, J. Hydrol., 614, 128514, https://doi.org/10.1016/j.jhydrol.2022.128514, 2022.
Kusaka, H., Kondo, H., and Kikegawa, Y.: A simple single-layer urban canopy model for amtospheric models: Comparison with multi-layer and slab models, Bound.-Lay. Meteorol., 2001, 101., 101, 329–358, 2001.
Li, D., Malyshev, S., and Shevliakova, E.: Exploring historical and future urban climate in the Earth System Modeling framework: 1. Model development and evaluation, J. Adv. Model. Earth Sy., 8, 917–935, https://doi.org/10.1002/2015ms000578, 2016a.
Li, D., Malyshev, S., and Shevliakova, E.: Exploring historical and future urban climate in the Earth System Modeling framework: 2. Impact of urban land use over the Continental United States, J. Adv. Model. Earth Sy., 8, 936–953, https://doi.org/10.1002/2015ms000579, 2016b.
Li, X., Fan, W., Wang, L., Luo, M., Yao, R., Wang, S., and Wang, L.: Effect of urban expansion on atmospheric humidity in Beijing–Tianjin–Hebei urban agglomeration, Sci. Total Environ., 759, 144305, https://doi.org/10.1016/j.scitotenv.2020.144305, 2021.
Liang, S., Cheng, C., Jia, K., Jiang, B., Liu, Q., Xiao, Z., Yao, Y., Yuan, W., Zhang, X., Zhao, X., and Zhou, J.: The Global LAnd Surface Satellite (GLASS) products suite, B. Am. Meteorol. Soc., 102, E323–E337, https://doi.org/10.1175/BAMS-D-18-0341.1, 2021.
Liang, X. and Xie, Z.: A new surface runoff parameterization with subgrid-scale soil heterogeneity for land surface models, Adv. Water Resour., 24, 1173–1193, https://doi.org/10.1016/S0309-1708(01)00032-X, 2001.
Liang, X., Lettenmaier, D. P., Wood, E. F., and Burges, S. J.: A simple hydrologically based model of land surface water and energy fluxes for general circulation models, J. Geophys. Res., 99, 14415–14428, https://doi.org/10.1029/94JD00483, 1994 (code available at: https://vic.readthedocs.io/en/master/Overview/ModelOverview/, last access: 27 July 2024).
Liang, X., Wood, E. F., and Lettenmaier, D. P.: Surface soil moisture parameterization of the VIC-2L model: evaluation and modification, Global Planet. Change, 13, 195–206, https://doi.org/10.1016/0921-8181(95)00046-1, 1996.
Liu, B., Xie, Z., Liu, S., Zeng, Y., Li, R., Wang, L., Wang, Y., Jia, B., Qin, P., Chen, S., Xie, J., and Shi, C.: Optimal water use strategies for mitigating high urban temperatures, Hydrol. Earth Syst. Sci., 25, 387–400, https://doi.org/10.5194/hess-25-387-2021, 2021.
Liu, J., Zhang, Z., Xu, X., Kuang, W., Zhou, W., Zhang, S., Li, R., Yan, C., Yu, D., and Wu, S.: Spatial patterns and driving forces of land use change in China during the early 21st century, J. Geogr. Sci., 20, 483–494, https://doi.org/10.1007/s11442-010-0483-4, 2010.
Liu, Q., Zhang, S., Zhang, H., Bai, Y., and Zhang, J.: Monitoring drought using composite drought indices based on remote sensing, Sci. Total Environ., 711, 134585, https://doi.org/10.1016/j.scitotenv.2019.134585, 2020.
Liu, X., Zhou, Y., Yue, W., Li, X., Liu, Y., and Lu, D.: Spatiotemporal patterns of summer urban heat island in Beijing, China using an improved land surface temperature, J. Clean. Prod., 257, 120529, https://doi.org/10.1016/j.jclepro.2020.120529, 2020.
McNorton, J. R., Arduini, G., Bousserez, N., Agustí-Panareda, A., Balsamo, G., Boussetta, S., Choulga, M., Hadade, I., and Hogan, R. J.: An Urban Scheme for the ECMWF Integrated Forecasting System: Single-Column and Global Offline Application, J. Adv. Model. Earth Sy., 13, e2020MS002375, https://doi.org/10.1029/2020ms002375, 2021.
Meili, N., Manoli, G., Burlando, P., Bou-Zeid, E., Chow, W. T. L., Coutts, A. M., Daly, E., Nice, K. A., Roth, M., Tapper, N. J., Velasco, E., Vivoni, E. R., and Fatichi, S.: An urban ecohydrological model to quantify the effect of vegetation on urban climate and hydrology (UT&C v1.0), Geosci. Model Dev., 13, 335–362, https://doi.org/10.5194/gmd-13-335-2020, 2020.
Meili, N., Paschalis, A., Manoli, G., and Fatichi, S.: Diurnal and seasonal patterns of global urban dry islands, Environ. Res. Lett., 17, 054044, https://doi.org/10.1088/1748-9326/ac68f8, 2022.
Meng, C.: The integrated urban land model, J. Adv. Model. Earth Sy., 7, 759–773, https://doi.org/10.1002/2015ms000450, 2015.
Meng, F., Su, F., Li, Y., and Tong, K.: Changes in Terrestrial Water Storage During 2003–2014 and Possible Causes in Tibetan Plateau, J. Geophys. Res.-Atmos., 124, 2909–2931, https://doi.org/10.1029/2018jd029552, 2019.
Meng, S., Xie, X., Zhu, B., and Wang, Y.: The relative contribution of vegetation greening to the hydrological cycle in the Three-North region of China: A modelling analysis, J. Hydrol., 591, 125689, https://doi.org/10.1016/j.jhydrol.2020.125689, 2020.
Mishra, V., Cherkauer, K. A., Niyogi, D., Lei, M., Pijanowski, B. C., Ray, D. K., Bowling, L. C., and Yang, G.: A regional scale assessment of land use/land cover and climatic changes on water and energy cycle in the upper Midwest United States, Int. J. Climatol., 30, 2025–2044, 2010.
Morabito, M., Crisci, A., Guerri, G., Messeri, A., Congedo, L., and Munafo, M.: Surface urban heat islands in Italian metropolitan cities: Tree cover and impervious surface influences, Sci. Total Environ., 751, 142334, https://doi.org/10.1016/j.scitotenv.2020.142334, 2021.
Mu, X., Wang, H., Zhao, Y., Liu, H., He, G., and Li, J.: Streamflow into Beijing and Its Response to Climate Change and Human Activities over the Period 1956–2016, Water, 12, 622, https://doi.org/10.3390/w12030622, 2020.
Nijssen, B., Schnur, R., and Lettenmaier, P. D.: Global retrospective estimation of soil moisture using the variable infiltration capacity land surface model, 1980–93, J. Climate, 14, 1790–1808, https://doi.org/10.1175/1520-0442(2001)014<1790:GREOSM>2.0.CO;2, 2001.
Oh, S.-G. and Sushama, L.: Urban-climate interactions during summer over eastern North America, Clim. Dynam., 57, 3015–3028, https://doi.org/10.1007/s00382-021-05852-3, 2021.
Oleson, K. W. and Feddema, J.: Parameterization and Surface Data Improvements and New Capabilities for the Community Land Model Urban (CLMU), J. Adv. Model. Earth Sy., 12, e2018MS001586, https://doi.org/10.1029/2018MS001586, 2020.
Qu, Y., Liu, Q., Liang, S., Wang, L., Liu, N., and Liu, S.: Direct-Estimation Algorithm for Mapping Daily Land-Surface Broadband Albedo From MODIS Data, IEEE T. Geosci. Remote, 52, 907–919, 2014.
Rodell, M., Houser, P. R., Jambor, U., Gottschalck, J., Mitchell, K., Meng, C.-J., Arsenault, K., Cosgrove, B., Radakovich, J., Bosilovich, M., Entin, J. K., Walker, J. P., Lohmann, D., and Toll, D.: The Global Land Data Assimilation System, B. Am. Meteorol. Soc., 85, 381–394, https://doi.org/10.1175/BAMS-85-3-381, 2004.
Salvadore, E., Bronders, J., and Batelaan, O.: Hydrological modelling of urbanized catchments: A review and future directions, J. Hydrol., 529, 62–81, https://doi.org/10.1016/j.jhydrol.2015.06.028, 2015.
Shangguan, W., Dai, Y., Liu, B., Zhu, A., Duan, Q., Wu, L., Ji, D., Ye, A., Yuan, H., Zhang, Q., Chen, D., Chen, M., Chu, J., Dou, Y., Guo, J., Li, H., Li, J., Liang, L., Liang, X., Liu, H., Liu, S., Miao, C., and Zhang, Y.: A China data set of soil properties for land surface modeling, J. Adv. Model. Earth Sy., 5, 212–224, https://doi.org/10.1002/jame.20026, 2013.
Simón-Moral, A., Dipankar, A., Roth, M., Sánchez, C., Velasco, E., and Huang, X. Y.: Application of MORUSES single-layer urban canopy model in a tropical city: Results from Singapore, Q. J. Roy. Meteor. Soc., 146, 576–597, https://doi.org/10.1002/qj.3694, 2019.
Sun, T. and Grimmond, S.: A Python-enhanced urban land surface model SuPy (SUEWS in Python, v2019.2): development, deployment and demonstration, Geosci. Model Dev., 12, 2781–2795, https://doi.org/10.5194/gmd-12-2781-2019, 2019.
Wan, Z., Hook, S., and Hulley, G.: MOD11A2 MODIS/Terra Land Surface Temperature/Emissivity 8-Day L3 Global 1km SIN Grid V006, NASA EOSDIS Land Processes Distributed Active Archive Center [data set], https://doi.org/10.5067/MODIS/MOD11A2.006 (last access: 27 July 2024), 2015.
Wang, C., Wang, Z. H., and Yang, J.: Cooling Effect of Urban Trees on the Built Environment of Contiguous United States, Earths Future, 6, 1066–1081, https://doi.org/10.1029/2018ef000891, 2018.
Wang, Y. and Xie, X.: An urban module coupled in VIC for water and energy balance simulations (Version v1), Zenodo [code], https://doi.org/10.5281/zenodo.10258321, 2023.
Wang, Y., Xie, X., Liang, S., Zhu, B., Yao, Y., Meng, S., and Lu, C.: Quantifying the response of potential flooding risk to urban growth in Beijing, Sci. Total Environ., 705, 135868, https://doi.org/10.1016/j.scitotenv.2019.135868, 2020.
Wang, Y., Xie, X., Shi, J., Zhu, B., Jiang, F., Chen, Y., and Liu, Y.: Accelerated hydrological cycle on the Tibetan Plateau evidenced by ensemble modeling of Long-term water budgets, J. Hydrol., 615, 128710, https://doi.org/10.1016/j.jhydrol.2022.128710, 2022.
Xiao, Z., Liang, S., Wang, J., Xiang, Y., Zhao, X., and Song, J.: Long-Time-Series Global Land Surface Satellite Leaf Area Index Product Derived From MODIS and AVHRR Surface Reflectance, IEEE T. Geosci. Remote, 54, 5301–5318, 2016.
Xie, X., Liang, S., Yao, Y., Jia, K., Meng, S., and Li, J.: Detection and attribution of changes in hydrological cycle over the Three-North region of China: Climate change versus afforestation effect, Agr. Forest Meteorol., 203, 74–87, https://doi.org/10.1016/j.agrformet.2015.01.003, 2015.
Yang, G., Bowling, L. C., Cherkauer, K. A., Pijanowski, B. C., and Niyogi, D.: Hydroclimatic Response of Watersheds to Urban Intensity: An Observational and Modeling-Based Analysis for the White River Basin, Indiana, J. Hydrometeorol., 11, 122–138, https://doi.org/10.1175/2009jhm1143.1, 2010.
Yang, L., Ni, G., Tian, F., and Niyogi, D.: Urbanization Exacerbated Rainfall Over European Suburbs Under a Warming Climate, Geophys. Res. Lett., 48, e2021GL095987, https://doi.org/10.1029/2021gl095987, 2021.
Yao, R., Wang, L., Huang, X., Liu, Y., Niu, Z., Wang, S., and Wang, L.: Long-term trends of surface and canopy layer urban heat island intensity in 272 cities in the mainland of China, Sci. Total Environ., 772, 145607, https://doi.org/10.1016/j.scitotenv.2021.145607, 2021.
Yousefi Sohi, H., Zahraie, B., Dolatabadi, N., and Zebarjadian, F.: Application of VIC-WUR model for assessing the spatiotemporal distribution of water availability in anthropogenically-impacted basins, J. Hydrol., 637, 131365, https://doi.org/10.1016/j.jhydrol.2024.131365, 2024.
Zhang, X., Zhao, X., Li, W., Liang, S., Wang, D., Liu, Q., Yao, Y., Jia, K., He, T., Jiang, B., Wei, Y., and Ma, H.: An Operational Approach for Generating the Global Land Surface Downward Shortwave Radiation Product From MODIS Data, IEEE T. Geosci. Remote, 57, 4636–4650, https://doi.org/10.1109/tgrs.2019.2891945, 2019.
Zhao, Q., Ding, Y., Wang, J., Gao, H., Zhang, S., Zhao, C., Xu, J., Han, H., and Shangguan, D.: Projecting climate change impacts on hydrological processes on the Tibetan Plateau with model calibration against the glacier inventory data and observed streamflow, J. Hydrol., 573, 60–81, https://doi.org/10.1016/j.jhydrol.2019.03.043, 2019.
Zhong, X., Wang, L., Zhou, J., Li, X., Qi, J., Song, L., and Wang, Y.: Precipitation Dominates Long-Term Water Storage Changes in Nam Co Lake (Tibetan Plateau) Accompanied by Intensified Cryosphere Melts Revealed by a Basin-Wide Hydrological Modelling, Remote Sens.-Basel, 12, 1926, https://doi.org/10.3390/rs12121926, 2020.
Zhou, D., Xiao, J., Bonafoni, S., Berger, C., Deilami, K., Zhou, Y., Frolking, S., Yao, R., Qiao, Z., and Sobrino, J.: Satellite Remote Sensing of Surface Urban Heat Islands: Progress, Challenges, and Perspectives, Remote Sens.-Basel, 11, 48, https://doi.org/10.3390/rs11010048, 2018.
Zhou, J., Li, J., and Yue, J.: Analysis of urban heat island (UHI) in the Beijing metropolitan area by time-series MODIS data, 2010 IEEE IGARSS, 25–30 July 2010, Honolulu, HI, USA, 3327–3330, 2010.
Zhu, B., Xie, X., Meng, S., Lu, C., and Yao, Y.: Sensitivity of soil moisture to precipitation and temperature over China: Present state and future projection, Sci. Total Environ., 705, 135774, https://doi.org/10.1016/j.scitotenv.2019.135774, 2020.
Zhu, B., Xie, X., Lu, C., Lei, T., Wang, Y., Jia, K., and Yao, Y.: Extensive Evaluation of a Continental-Scale High-Resolution Hydrological Model Using Remote Sensing and Ground-Based Observations, Remote Sens.-Basel, 13, 1247, https://doi.org/10.3390/rs13071247, 2021.