the Creative Commons Attribution 4.0 License.
the Creative Commons Attribution 4.0 License.
 | 06 May 2024
Diagnosing drivers of PM2.5 simulation biases in China from meteorology, chemical composition, and emission sources using an efficient machine learning method
Shuai Wang
Mengyuan Zhang
Yueqi Gao
Peng Wang
Qingyan Fu
Chemical transport models (CTMs) are widely used for air pollution modeling, which suffer from significant biases due to uncertainties in simplified parameterization, meteorological fields, and emission inventories. Accurate diagnosis of simulation biases is critical for the improvement of models, interpretation of results, and management of air quality, especially for the simulation of fine particulate matter (PM2.5). In this study, an efficient method with high speed and a low computational resource requirement based on the tree-based machine learning (ML) method, the light gradient boosting machine (LightGBM), was designed to diagnose CTM simulation biases. The drivers of the Community Multiscale Air Quality (CMAQ) model biases are compared to observations obtained by simulating PM2.5 concentrations from the perspectives of meteorology, chemical composition, and emission sources. The source-oriented CMAQ was used to diagnose the influences of different emission sources on PM2.5 biases. The model can capture the complex relationship between input variables and simulation bias well; meteorology, PM2.5 components, and source sectors can partially explain the simulation bias. The CMAQ model underestimates PM2.5 by −19.25 to −2.66 µg m−3 in 2019, especially in winter and spring and during high-PM2.5 events. Secondary organic components showed the largest contribution to the PM2.5 simulation bias for different regions and seasons (13.8 %–22.6 %) of all components. Relative humidity, cloud cover, and soil surface moisture were the main meteorological factors contributing to PM2.5 bias in the North China Plain, Pearl River Delta, and northwestern China, respectively. Primary and secondary inorganic components from residential sources showed the two largest contributions to this bias (12.05 % and 12.78 %), implying large uncertainties in this sector. The ML-based methods provide valuable complements to traditional-mechanism-based methods for model improvement, with high efficiency and low reliance on prior information.
- Article
(4897 KB) - Full-text XML
-
Supplement
(1187 KB) - BibTeX
- EndNote


Fine particulate matter (PM2.5) is a complex mixture of primary particulate matter (PPM) and secondary inorganic and organic components (SIAs/SOAs), with adverse effects on public health and ecosystems. Ambient levels of PM2.5 are influenced by meteorological conditions, emissions from different sources, and atmospheric chemical processes (World Health Organization, 2021; Xiao et al., 2022; Yang et al., 2016; J. Liu et al., 2021b; Zhai et al., 2019). China has experienced severe PM2.5 pollution over the past 2 decades (Bai et al., 2022; F. Liang et al., 2020). For effective air quality management, accurate PM2.5 modeling is essential. Chemical transport models (CTMs), like the Community Multiscale Air Quality (CMAQ) model, have been widely developed and applied to PM2.5 simulations through the atmospheric processes of dispersion and deposition, as well as chemical reactions (Qiao et al., 2018; Wang et al., 2021; Hu et al., 2017a). Application of CTM simulations is often limited by the biases due to uncertainties in simplified parameterization, meteorological prediction, emission inventories, and initial and boundary conditions (Binkowski and Roselle, 2003; Hu et al., 2014, 2016; Wang et al., 2023a, 2021). Thus, it is essential to diagnose the specific sources of simulation biases according to specific model applications, including grid resolution, parameterization, mechanisms, meteorological inputs, and emission inventories.
Traditional bias diagnosis approaches for CTMs usually rely on empirical and prior assumptions with extensive sensitivity testing and high demands on computational resources such as Monte Carlo methods or Latin hypercube sampling (Beekmann and Derognat, 2003; Hanna et al., 2005; Aleksankina et al., 2019). Recently, machine learning (ML) methods, such as random forest and eXtreme Gradient Boosting (XGBoost), have been widely used in environmental science research due to their simple structure, high speed, and ability to deal with non-linear relationships (Liu et al., 2022). Many studies used ML to predict air pollutant concentrations like those of PM2.5 and ozone (Wei et al., 2021a; Sun et al., 2021; Zhu et al., 2022; Bai et al., 2022), improve the accuracy of CTM simulations (Wang et al., 2023a; Wei et al., 2020), and explain the prediction results using interpretable ML techniques (Hou et al., 2022; Li et al., 2023; Stirnberg et al., 2021). To date, few studies have used ML to diagnose the simulation bias of CTMs. One study showed the potential of machine learning in explaining the simulation bias of ozone (Ye et al., 2022). However, as it is a complex multi-phase mixture, it is still challenging to diagnose biases in PM2.5 simulations using ML methods (Liu and Xing, 2022). Moreover, given the significant impact of emissions, it is instructive to diagnose CTM biases of PM2.5 based on a source apportionment perspective.
In this study, we use the light gradient boosting machine (LightGBM) model, an efficient ensemble ML approach, to diagnose the drivers of CMAQ biases in simulating PM2.5 concentrations. A source-oriented version of CMAQ is used to track sectoral source contributions to PM2.5. Model biases are diagnosed by observations from multiple perspectives, including meteorology, chemical components, and emission sources.
2.1 Surface PM2.5 observations
This study specifically targets the year of 2019 due to the extensive availability of observational data, the reliability of emission inventories, and the absence of COVID-19-related disruptions. Hourly PM2.5 observations for 2019 are taken from the China National Environmental Monitoring Centre (CNEMC; http://www.cnemc.cn/, last access: 23 April 2024). The daily observation data < 0.1 % quantile and > 99.9 % quantile, data showing PM2.5 exceeding PM10, and days with fewer than 20 valid hourly records are excluded. For observation sites located on the same CMAQ simulation grid (36 km×36 km), their average PM2.5 concentrations were calculated to be compared with CMAQ simulation. Approximately 350 000 observations, which met the quality control criteria, were selected from the entire time series data points collected from various monitoring stations. The distribution of (about 1200) observation sites is shown in Fig. S1 in the Supplement. The stations are unevenly distributed, with dense stations in eastern populated areas and sparse stations in western regions of Xinjiang and Tibet. Analysis has been carried out in several haze-polluted regions and the whole country (Fig. S1), including the Beijing–Tianjin–Hebei region (BTH), the Yangtze River Delta (YRD), the Pearl River Delta (PRD), the Sichuan Basin (SCB), and the region of northwestern China (NWCHN).
2.2 CMAQ simulation
The CMAQ simulation (36 km×36 km) was carried out to simulate PM2.5 components in mainland China and surrounding regions in 2019. The list of PM2.5 components simulated by CMAQ is shown in Table S1 in the Supplement. The Weather Research and Forecasting Model (WRF v4.2) was used to generate meteorological fields, driven by the National Centers for Environmental Prediction (NCEP) Final (FNL) Operational Model Global Tropospheric Analysis dataset (http://rda.ucar.edu/datasets/ds083.2/, last access: 23 April 2024) (NCEP, 2000). Several meteorological factors (Table S1) that are highly relevant to aerosol concentrations are selected for ML model building (Xiao et al., 2021; Z. Y. Chen et al., 2020; Meng et al., 2019). CMAQ v5.0.2 with a modified SAPRC-11 photochemical mechanism and an AERO6 aerosol module was applied to aerosol simulations (Carter and Heo, 2013; Ying et al., 2015; Binkowski and Roselle, 2003). The Multi-resolution Emission Inventory for China (MEIC) was used as a source of anthropogenic emissions (http://meicmodel.org/, last access: 23 April 2024), and the Model of Emissions of Gases and Aerosols from Nature (MEGAN) v2.1 was used to generate biogenic emissions (Guenther et al., 2012, 2006). The Fire INventory from the National Center for Atmospheric Research (FINN) based on satellite data was used to generate open burning emissions (Wiedinmyer et al., 2011).
The source apportionment method was used to quantify the contributions of the industry, energy, residential, transportation, agriculture, open burning, and biogenic sources to PPM and SIA concentrations using a modified version of CMAQ (Zhang et al., 2012; Ma et al., 2021; Qiao et al., 2018). PPM from different source sectors is tracked by non-reactive tracers (which account for 10−5 of the PPM emission rates), and source-specific PPM concentrations are then calculated by multiplying the tracer by 105. The contributions of source sectors to SIAs are quantified using specific reactive tagged tracers. Specifically, NOx, SO2, and NH3 from different sources were tracked separately through a series of chemical and physical processes involved in SIA formation. The source of SOAs was not traced due to the complex and currently imperfect mechanism of SOA formation and the high uncertainties in the precursor VOC emissions (J. Liu et al., 2021b; Hu et al., 2017b). Details on source apportionment can be found in previous studies (Zhang et al., 2012; Ma et al., 2021; Qiao et al., 2018; Ying et al., 2014). The contributions of source sectors to SOAs were not tracked due to insufficient knowledge of its precursors and incomplete formation mechanisms (Yang et al., 2019; Carlton et al., 2007; Zhang et al., 2011).
2.3 Machine learning method
Tree-based ML models typically outperform deep learning approaches in tabular data (e.g., air pollutant observation datasets) and thus have been widely developed (Grinsztajn et al., 2022). Wei et al. (2021a) compared several models when reconstructing PM2.5 data records in China and found that the tree model showed superior performance. The LightGBM model is an optimized gradient boosting decision tree (GBDT) algorithm (Ke et al., 2017) and has shown accurate performance in many fields (Wei et al., 2021b; Yan et al., 2021; Sun et al., 2020; W. Liang et al., 2020). Compared to XGBoost, a widely used GBDT, LightGBM uses the histogram decision tree algorithm along with gradient-based one-side sampling (GOSS), which saves memory and computation time (Ke et al., 2017). Three tree-based models, random forest, XGBoost, and LightGBM, were compared in our previous study (Wang et al., 2023b). Using the same input data and hyperparameters, LightGBM is as accurate as XGBoost but faster and less susceptible to overfitting (the difference in accuracy between training and testing). Nevertheless, multicollinearity between features such as pollutant concentrations and meteorological factors can greatly affect the performance of traditional linear models. When two independent variables are correlated, changes in one variable are associated with changes in the other, making it difficult for the model to independently estimate the relationship between each independent and dependent variable. However, these collinearities do not affect the performance of tree-based models like random forest and LightGBM because they do not require the assumption of feature independence (Belgiu and Drăguţ, 2016; Chen and Guestrin, 2016; Ke et al., 2017). Therefore, the LightGBM model was used to diagnose PM2.5 simulation biases in this study. Two metrics were calculated to evaluate model performance, including the coefficient of determination (R2) and the root mean square error (RMSE) (Wei et al., 2020).
Cross-validation (five-fold) combined with the RMSE was used to select hyperparameters. The dataset was randomly divided into five parts; one was taken in turn as the test set, and the rest were used for training, which was repeated five times, and the average test RMSE was calculated by looping to increase model complexity, ending the loop, and returning to the hyperparameters when the model test RMSE does not decrease significantly (< 0.01) or the gap between the training and test RMSE increases significantly (< 0.05). The separate test sets (not involved in the training and CV hyperparameter selection process) were chosen by randomly sampling 20 % of the data from all stations in the region of interest.
The target variable was defined as the difference between observed and simulated daily PM2.5 concentrations, and the key contributors to the simulation bias were identified through the relative importance (calculated by gain) of the input features (Ye et al., 2022; Loyola-González et al., 2023). Three categories of input variables were designed to separately fit the simulation biases: meteorological factors, chemical components, and emission sources. Meteorological factors, including wind speed, wind direction, temperature, humidity, surface pressure, cloud fraction, and boundary layer height, are used to investigate the impact of meteorology on the CMAQ simulation biases. The components of PM2.5 are divided into SIAs (sulfate, nitrate, and ammonium), primary and secondary organic aerosols (POAs/SOAs), elemental carbon (EC), and other components. The contributions to the simulation bias were quantified using seven sectoral sources: industry, energy, residential sources, transportation, agriculture, open burning, and biogenic emissions.
3.1 Observation and simulation of PM2.5
Figure 1a shows the time series of observed and simulated daily surface PM2.5 concentrations in China as a whole and in five specific regions (BTH, YRD, PRD, SCB, and NWCHN) during 2019. Observed PM2.5 concentrations were the highest in the BTH region (51.172 µg m−3) and lowest in the PRD region (28.273 µg m−3). The CMAQ model underestimates PM2.5 concentrations of −8.59, −2.66, −6.21, and −19.25 µg m−3 in the BTH, YRD, PRD, and NWCHN regions, respectively (Fig. 1b). Moreover, the underestimation occurred mainly in winter and spring (Fig. 1c) and during high-PM2.5 events (Fig. 1d) (Hu et al., 2016; Huang et al., 2017).

Figure 1(a) The time series of observed (black) and CMAQ-simulated (red) daily surface PM2.5 concentrations in China and five regions. Mean concentrations of the observed and simulated PM2.5 and MNB are also shown in the inset. (b) Box plots of CMAQ-simulated biases (simulated minus observed) for different regions. Crosses indicate average values and outliers are determined to be > 1.5 times the upper quartile and < 1.5 times the lower quartile. (c) Same as in panel (b) but for four seasons. Spring, summer, autumn, and winter are defined as March to May; June to August; September to November; and December, January, and February, respectively. (d) Same as in panel (b) but for different PM2.5 concentration levels (L1: [0,35], L2: [35,75], L3: [75,115], L4: [115,150], and L5: [150,1000]).
Table S2 in the Supplement shows the validation of CMAQ simulations against observations in different regions. Four indicators (mean normalized bias, MNB; mean normalized error, MNE; mean fractional bias, MFB; mean fractional error, MFE) were used to systematically evaluate the performance of the CMAQ simulations. The PM2.5 simulations in the BTH, YRD, and PRD regions were in better agreement with observations, with average MNB of −0.08, −0.07, and −0.08, respectively (within the standard of 0.66). The PM2.5 simulations in SCB and NWCHN regions show large biases with MNB of 0.46 and −0.42, respectively. The differences in CMAQ performance between regions can be attributed to multiple factors, including emission inventories, dominant mechanisms of PM2.5 generation, and topographic and meteorological conditions (Ma et al., 2021; Xue et al., 2019; Hu et al., 2014).
Annual and monthly mean PM2.5 components (SIAs, POAs, SOAs, EC, and other components) were calculated for China as a whole and for five key regions (Fig. 2). PM2.5 and its components show a similar spatial distribution, with high concentrations occurring in the eastern regions (SCB, BTH, and central YRD). SOAs showed high concentrations in summer over China (6.80 µg m−3), which could be related to enhanced solar radiation and atmospheric oxidation capacity in summer (precursors of SOAs such as isoprene are highly dependent on temperature and light) (Yang et al., 2019; S. Chen et al., 2020; J. Liu et al., 2021b). Nitrate and POAs were the dominant components in winter (10.14 and 9.11 µg m−3, respectively). In the BTH and SCB regions, POAs account for a higher proportion of total particles than nitrate in winter, whereas nitrate has a higher proportion in the YRD region. Nitrate showed higher concentrations than sulfate in most regions and seasons due to the implementation of coal combustion control policies (Shang et al., 2021; J. Liu et al., 2021b; Xu et al., 2019).

Figure 2Annual mean concentration map (a–g) and monthly mean concentrations (h–m) of PM2.5 and its components (SIAs, POAs, SOAs, EC, and other components) for China as a whole and five key regions in 2019. Dotted lines in (h–m) indicate PM2.5 observations.
The results of the PM2.5 sectoral source apportionment (Figs. 3 and S2 in the Supplement) show that industries and residential sources were the main contributors to daily PM2.5 concentrations for all regions and seasons, with seasonal fractional contributions of 25.31 %–31.92 % and 11.13 %–30.64 %, respectively. The seasonal average fractional contributions from energy, transportation, and agricultural NH3 in China as a whole were 3.26 %–5.67 %, 6.82 %–11.26 %, and 7.50 %–8.67 %, respectively. The contributions from biogenic sources were negligible in all regions and seasons (< 1 %). In contrast to the contributions from energy, transportation, industrial, and agricultural sources, significant seasonal variations occurred in emissions from residential sources in all five regions, with high contributions in winter (17.60 %–30.90 %) and low contributions in summer (5.53 %–16.46 %).
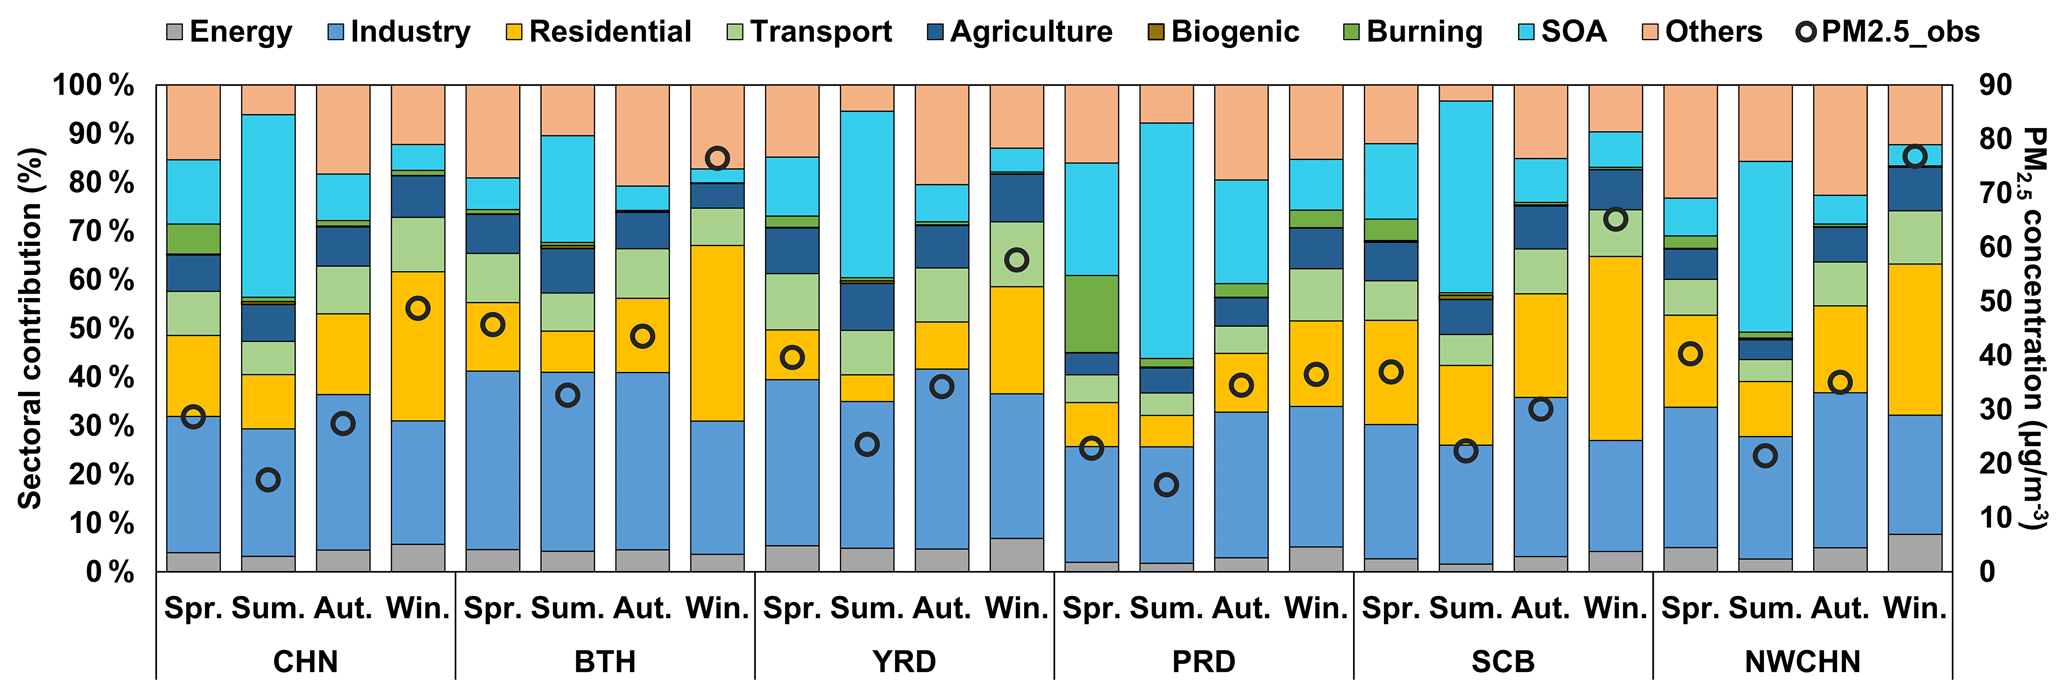
Figure 3Seasonal average fractional contributions of different sources to PM2.5 concentrations (black circle in relation to the right-hand axis) in China as a whole and five key regions.
As the secondary component makes up a large proportion of the total PM2.5, the source sectors of SIAs were analyzed for five regions (Fig. S2). High concentrations of SIAs were found in winter (12.36–34.08 µg m−3), with large contributions from industrial and agricultural sources and transportation (31.49 %–36.41 %, 20.40 %–22.40 %, and 19.77 %–22.46 %). The low contribution of the residential sector to secondary PM2.5 but the high contribution to total PM2.5 indicates that most residential emission sources emit PPM directly, with a small fraction of PPM coming from secondary generation. The contributions from biogenic and open burning sectors to SIAs were relatively low in all regions and seasons (< 10 %).
3.2 Drivers of PM2.5 simulation bias
The ML models were trained separately using information on meteorology, PM2.5 components, and source sectors for different regions and seasons, and separate test sets were used to evaluate the model performance (Fig. 4). All three feature combinations can partially explain the simulation bias. The mean test R2 values for meteorology, PM2.5 components, and source sectors were 0.64, 0.52, and 0.50, respectively, and the RMSEs were 17.41, 19.82, and 19.56 µg m−3, respectively. The model performed better in summer than in winter. This may be attributed to the high simulation biases in winter due to severe PM2.5 pollution and complex causes, while PM2.5 pollution in summer is lighter with a lower CMAQ simulation bias.

Figure 4Test results of CMAQ bias model training according to meteorology (a), PM2.5 components (b), and source sectors (c). RMSE unit: µg m−3.
Using PM2.5 components as input features to fit the total simulation bias enables the identification of components with a large simulation bias. Among the PM2.5 components (Fig. S4 in the Supplement), SOAs showed the largest contribution to the PM2.5 simulation bias for different regions and seasons (13.8 %–22.6 %), which is consistent with previous studies (J. Liu et al., 2021b; Yang et al., 2019; Fry et al., 2014). The inorganic aerosols (e.g., sulfates) are produced mainly by chemical pathways, while the SOAs are produced by the condensation of numerous partially oxidized gases and are therefore influenced by complex precursor concentrations and multi-stage oxidation processes. The incomplete description of SOA formation pathways in CTMs (simplified SOA parameterization) leads to significant differences between simulations and observations (Carlton et al., 2007; Zhang et al., 2018; Yang et al., 2019). In addition, biogenic emissions play an important role in SOA formation, with biogenic SOAs accounting for more than 70 % of the total SOAs in China during summer (Hu et al., 2017b; Wu et al., 2020), so the uncertainties in biogenic emissions can further contribute to the uncertainties in SOA emissions. Nitrate showed a large contribution to the PM2.5 simulation bias in winter in the BTH region, which is consistent with a previous study (Liu and Xing, 2022). Nitrate contribution to the simulation bias further implies the inaccuracy of nitrate simulations, which can be related to the imperfect pathways of nitrate production (e.g., non-homogeneous oxidation) in SAPRC-11 (that we used) and the uncertainties in nitrate precursor emission inventories in winter (Xu et al., 2019; Zhang et al., 2018; Carter and Heo, 2013).
The contribution of meteorological factors to the simulation bias varies across regions and seasons (Fig. 5). In the BTH region, surface pressure and relative humidity contribute the most to the simulation bias. In the PRD region, relative humidity, cloud cover, and wind direction were the main contributors during all four seasons.

Figure 5Contribution (%) of each meteorological factor to CMAQ simulation biases by region and season.
Humidity positively or negatively influences PM2.5 concentrations through several mechanisms. By enhancing the PM2.5 hygroscopic increase, promoting the secondary formation, and facilitating the gas-to-particle partitioning, high humidity positively influences PM2.5 concentrations and contributes significantly to haze pollution (Z. Y. Chen et al., 2020; Cheng et al., 2015; Zhang et al., 2011). The contribution of humidity to CMAQ simulation biases can be partly attributed to the uncertainties in the WRF simulation. The mean RMSE of relative humidity from WRF simulations compared to observations was 20.38 % in this study (Table S3 in the Supplement). In addition, imperfections in the mechanism of humidity-promoted secondary particle formation (e.g., non-homogeneous catalysis of SOA) can also lead to simulation biases (Zhang et al., 2011; J. Liu et al., 2021b). Atmospheric pressure indirectly influences PM2.5 concentrations through other meteorological factors (e.g., humidity and wind). High-pressure systems are connected to stationary weather, which is unfavorable for PM2.5 dispersion. On the other hand, low pressure is usually accompanied by high humidity, influencing PM2.5 nucleation, condensation, and coagulation and leading to increased PM2.5 concentrations (Z. Y. Chen et al., 2020). Therefore, the influence of atmospheric pressure on the CMAQ simulation biases in the BTH region may be attributed to the uncertainties in the meteorological field (Bei et al., 2017; Zhang et al., 2015). The contribution of wind direction in the YRD region may also be related to the uncertainties in the WRF simulation (mean RMSE of 90.39°). Aerosols have feedback on meteorology (Qu et al., 2021). In addition to directly changing the radiation received by the Earth through scattering and absorbing (direct radiation effect), PM2.5 can also influence radiation through aerosol–cloud interactions (indirect radiation effect) (Zhao et al., 2017; Yang et al., 2016). Moreover, PM2.5 can act as cloud condensation and nucleation sites, contributing to clouds' microphysical development and precipitation formation process (Wang et al., 2020). However, the aerosol-to-meteorology feedback mechanism is missing in the CMAQ used in this study. A previous study showed the dominant role of cloud chemistry in aerosol–cloud interactions in southern China (Zhao et al., 2017). Therefore, the influence of cloud cover on simulation biases in YRD can be attributed to the lack of an aerosol feedback mechanism.
In the NWCHN region, soil surface moisture and stomatal conductance contributed significantly to the simulation bias. These factors can be associated with ground-level sand rise and dust emission (S. Liu et al., 2021). Underestimation of dust aerosol in NWCHN can be attributed to emission (both natural and anthropogenic sources), and an accurate emission inventory (empirical- or physical-based numerical models) should be established in northwest China by detailed activity data and emission factors (Hu et al., 2016; J. Liu et al., 2021a). In addition, the parameterization and mechanism for dust aerosol simulation in CMAQ should be further examined and improved.
Dry and wet days were separated to analyze the influence of humidity on the simulation biases (Table S4 in the Supplement). In most areas of China, CMAQ underestimates PM2.5 more severely on dry days than on wet days, with larger absolute biases (−14.56, −7.09, −7.11, and −27.87 µg m−3 in spring, summer, autumn, and winter, respectively). On dry days, the BTH region showed severe underestimation in winter (−22.86 µg m−3), while the PRD region showed large simulation bias in spring (−21.55 µg m−3). Severe underestimation of PM2.5 was observed on both wet and dry days in NWCHN. These underestimates of PM2.5 on dry days can be related to the dry deposition process. Dry deposition is a critical but highly uncertain sink for aerosols which depends on the chemical and physical properties of aerosols and is influenced by land surface properties and meteorological conditions (Shu et al., 2022). Different land-use types (e.g., vegetation, deserts, and snow) possess markedly different capacities to capture particulate matter. The CMAQ model in this study used the dry deposition scheme PR11 from Pleim and Ran (2011). This study shows that the PR11 scheme underestimates PM2.5 concentrations in China. Recent studies in the United States also showed an underestimation of PM10 concentrations (Shu et al., 2022). Therefore, it is necessary to further develop and optimize the dry deposition scheme, especially for PM2.5. PM2.5 underestimation on wet days may be attributed to the biases in wet deposition and secondary organic aerosol formation under high humidity conditions (Wu et al., 2018; Ryu and Min, 2022; J. Liu et al., 2021b; Zhang et al., 2011).
Source sector contributions of PPM and SIAs (obtained from the source-oriented CMAQ) were used to build the model and diagnose the influences of different emission sources on PM2.5 simulation biases (Fig. 6). The PPM and SIAs in residential emissions showed the largest contribution (12.05 % and 12.78 %) to the PM2.5 simulation bias. The same conclusion was obtained when building a model with total PM2.5 concentrations from different source sectors (Table S5 in the Supplement). PM2.5 from residential emissions is the main contributor to the CMAQ simulation bias, accounting for 20.2 % of the total bias.
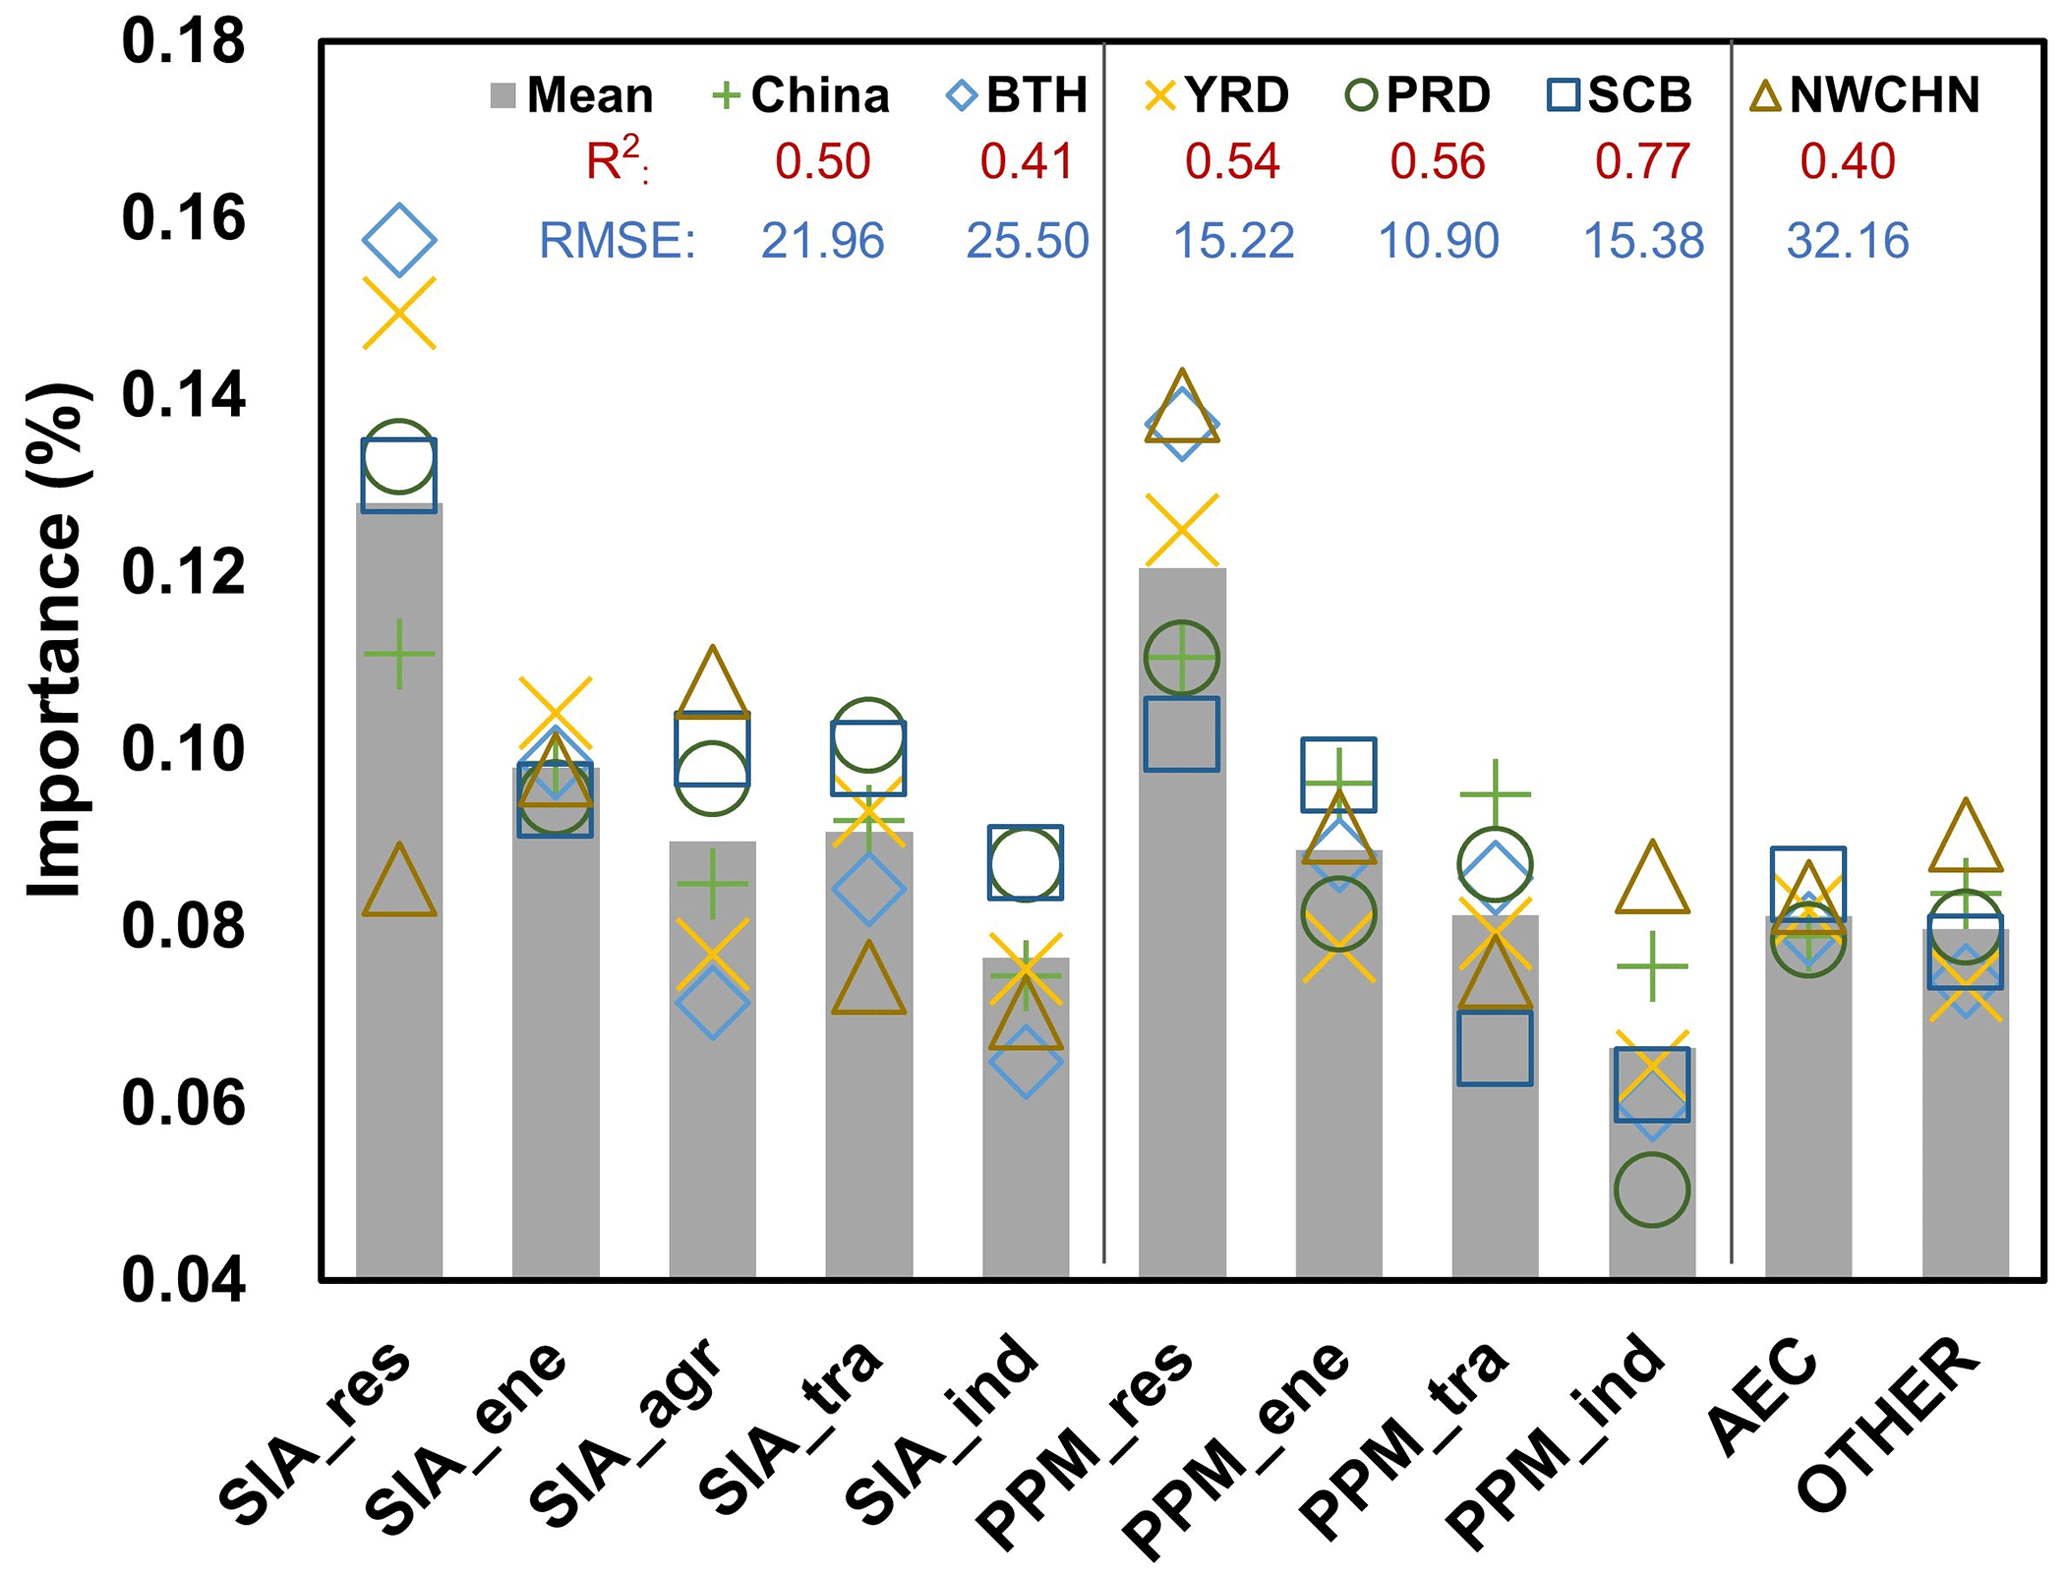
Figure 6Contribution (%) of each source sector to CMAQ biases by region and season (res: residential, ene: energy, tra: transportation, agr: agriculture, ind: industry, AEC: elemental carbon, OTHER: other components).
In China, the residential sector consumed fossil fuels (coal, oil, and natural gas) and biofuels (wood and crop straw) with low combustion efficiency for cooking and heating and emitted large amounts of air pollutants (Li et al., 2017). However, due to the lack of reliable data (a locally accurate emission factor and fuel consumption data), the residential sector has been recognized as a major uncertainty source in anthropogenic emission inventories (X. Liu et al., 2021; Shen et al., 2021), which is consistent with the results identified by a machine learning model in this study. Therefore, developing an accurate residential sector emission inventory is essential for accurate PM2.5 modeling, which requires reliable data regarding fuel consumption and emission factors based on fuel type, fuel characteristics, and combustion conditions (X. Liu et al., 2021).
3.3 Comparisons and uncertainties
Huang et al. (2019) used a new reduced-form model coupled with a higher-order decoupled direct method and a stochastic response surface model to identify the sources of uncertainty in CMAQ simulations. An analysis of the PRD region in China in the spring of 2013 revealed a systematic underestimation of SOA and identified wind speed and primary PM2.5 emissions as the key sources of uncertainties in PM2.5 simulations, which is consistent with the results identified using LightGBM in this study. Aleksankina et al. (2019) identified the PM2.5 simulation bias in Europe using optimized Latin hypercube sampling and also demonstrated the important impact of primary emissions on PM2.5 simulation uncertainties. Liu and Xing (2022) used a fully connected neural network to identify PM2.5 simulation biases and found that NO2 is the main contributor in BTH during heavy-pollution events in the winter, which is consistent with the main contribution of nitrate that we found in the BTH region (Fig. S4).
Although we filtered the features according to their relative importance and prior knowledge, collinearity still exists among the input features. Multicollinearity among features does not affect the performance of tree-based models like random forest and LightGBM (Belgiu and Drăguţ, 2016; Chen and Guestrin, 2016; Ke et al., 2017), but the contribution of a single feature might be slightly influenced by the other features. Previous studies (Hou et al., 2022; Ye et al., 2022) used ML to explain the causes of air pollution and model bias, and although there was multicollinearity between the input features they used, they got reliable conclusions, showing the minimal impact of multicollinearity and the reliability of tree-based machine learning methods.
The main objective of this study is to diagnose the contributors to CMAQ simulation biases using machine learning rather than for prediction. Since meteorology or emissions can only partially explain the simulation bias, a low R2 is justified when fitting the model with only meteorology or emission variables (Fig. 4). We designed a complementary experiment to measure the impact of the model itself by comparing popular regression models (including multiple linear regression, polynomial regression (second-degree), random forest, XGBoost, and LightGBM) with the same features (PM2.5 components). All models show similar performance (Table S6 in the Supplement); for example, all models show lower R2 in winter in the BTH region (0.16–0.4) and higher R2 in the SCB region (0.7–0.8). This is also evidence that the low R2 is more affected by the features than the model itself, as the commonly used regression models can hardly obtain high R2 with insufficient explanatory features (e.g., chemical component features in winter in BTH). Nevertheless, LightGBM shows comparable accuracy to XGBoost but is faster and shows smaller accuracy gaps between training and testing data with less overfitting.
Previous pollution prediction studies based on tree models usually added time-related features to describe the temporal pattern of pollutant changes to further improve the prediction ability; for example, Wei et al. (2021a) improved the model performance by adding temporal features of the day of year and Unix timestamps. However, the inclusion of temporal features cannot provide any useful information about contributors to simulation biases; instead, it is difficult to attribute them to meteorological or emissions contributions. Therefore, temporal features were not included in our model. Nevertheless, the ML bias diagnosis model constructed in this study is based entirely on local data. Some temporal and regional processes influencing PM2.5 concentrations are not considered in this study, such as vertical transport and long-distance transport, which should be better diagnosed in future work, and the main bias contributors identified by variable importance are in good agreement with the current findings.
Based on artificial intelligence technology, this study systematically diagnoses the possible drivers of biases in PM2.5 simulations from the perspectives of meteorology, chemical components, and emission sources. The relative importance of multiple factors helps to understand the sources of simulation bias and the deficiencies of the CMAQ mechanisms. SOA is the main contributor to simulation biases among chemical components. PM2.5 is more underestimated in dry weather. Among source sectors, residential sectors contributed the most simulation bias for both PPM and SIAs. These results provide valuable information for CMAQ model improvement in terms of SOA and dust aerosol underestimation, meteorological field uncertainties, imperfection of the dry deposition scheme, and inaccurate residential emission inventories. As efficient bias diagnosis methods, machine-learning-based methods provide valuable complements to traditional-mechanism-based methods. This approach also greatly reduces the amount of prior information needed for diagnosing simulation bias and efficiently identifies the important contributors, so it can be easily extended to other CTMs and other pollutants.
The data and code are publicly accessible at https://doi.org/10.5281/zenodo.10283739 (Wang et al., 2023c). This includes the machine learning code for diagnosing CMAQ simulation bias and the corresponding training dataset. CMAQ is an open-source chemical transport model developed by the US Environmental Protection Agency, which can be downloaded at https://doi.org/10.5281/zenodo.1079898 (US EPA Office of Research and Development, 2014).
The Supplement contains additional descriptions of the study domain, WRF-CMAQ simulation performance, concentrations, and bias contribution of PM2.5 components and sectoral sources. The supplement related to this article is available online at: https://doi.org/10.5194/gmd-17-3617-2024-supplement.
SW: methodology, software, and writing (original draft). MZ: software and validation. YG: data curation and visualization. PW: methodology and writing (reviewing and editing). QF: writing (reviewing and editing). HZ: conceptualization, supervision, and writing (reviewing and editing).
The contact author has declared that none of the authors has any competing interests.
Publisher's note: Copernicus Publications remains neutral with regard to jurisdictional claims made in the text, published maps, institutional affiliations, or any other geographical representation in this paper. While Copernicus Publications makes every effort to include appropriate place names, the final responsibility lies with the authors.
This research has been supported by the National Natural Science Foundation of China (grant nos. 42077194 and 42061134008).
This paper was edited by Lele Shu and reviewed by four anonymous referees.
Aleksankina, K., Reis, S., Vieno, M., and Heal, M. R.: Advanced methods for uncertainty assessment and global sensitivity analysis of an Eulerian atmospheric chemistry transport model, Atmos. Chem. Phys., 19, 2881–2898, https://doi.org/10.5194/acp-19-2881-2019, 2019.
Bai, K., Li, K., Ma, M., Li, K., Li, Z., Guo, J., Chang, N.-B., Tan, Z., and Han, D.: LGHAP: the Long-term Gap-free High-resolution Air Pollutant concentration dataset, derived via tensor-flow-based multimodal data fusion, Earth Syst. Sci. Data, 14, 907–927, https://doi.org/10.5194/essd-14-907-2022, 2022.
Beekmann, M. and Derognat, C.: Monte Carlo uncertainty analysis of a regional-scale transport chemistry model constrained by measurements from the atmospheric pollution over the Paris area (ESQUIF) campaign, J. Geophys. Res.-Atmos., 108, 8859, 10.1029/2003JD003391, 2003.
Bei, N., Wu, J., Elser, M., Feng, T., Cao, J., El-Haddad, I., Li, X., Huang, R., Li, Z., Long, X., Xing, L., Zhao, S., Tie, X., Prévôt, A. S. H., and Li, G.: Impacts of meteorological uncertainties on the haze formation in Beijing–Tianjin–Hebei (BTH) during wintertime: a case study, Atmos. Chem. Phys., 17, 14579–14591, https://doi.org/10.5194/acp-17-14579-2017, 2017.
Belgiu, M. and Drăguţ, L.: Random forest in remote sensing: A review of applications and future directions, ISPRS J. Photogramm., 114, 24–31, 2016.
Binkowski, F. S. and Roselle, S. J.: Models-3 Community Multiscale Air Quality (CMAQ) model aerosol component 1. Model description, J. Geophys. Res.-Atmos., 108, 4183, https://doi.org/10.1029/2001JD001409, 2003.
Carlton, A. G., Turpin, B. J., Altieri, K. E., Seitzinger, S., Reff, A., Lim, H.-J., and Ervens, B.: Atmospheric oxalic acid and SOA production from glyoxal: Results of aqueous photooxidation experiments, Atmos. Environ., 41, 7588–7602, https://doi.org/10.1016/j.atmosenv.2007.05.035, 2007.
Carter, W. P. and Heo, G.: Development of revised SAPRC aromatics mechanisms, Atmos. Environ., 77, 404–414, 2013.
Chen, S., Wang, H., Lu, K., Zeng, L., Hu, M., and Zhang, Y.: The trend of surface ozone in Beijing from 2013 to 2019: Indications of the persisting strong atmospheric oxidation capacity, Atmos. Environ., 242, 117801, https://doi.org/10.1016/j.atmosenv.2020.117801, 2020.
Chen, T. and Guestrin, C.: XGBoost: A Scalable Tree Boosting System, 22nd ACM SIGKDD International Conference on Knowledge Discovery and Data Mining (KDD), San Francisco, CA, 13–17 August 2016, WOS:000485529800092, 785–794, https://doi.org/10.1145/2939672.2939785, 2016.
Chen, Z. Y., Chen, D. L., Zhao, C. F., Kwan, M. P., Cai, J., Zhuang, Y., Zhao, B., Wang, X. Y., Chen, B., Yang, J., Li, R. Y., He, B., Gao, B. B., Wang, K. C., and Xu, B.: Influence of meteorological conditions on PM2.5 concentrations across China: A review of methodology and mechanism, Environ. Int., 139, 105558, https://doi.org/10.1016/j.envint.2020.105558, 2020.
Cheng, Y., He, K. B., Du, Z. Y., Zheng, M., Duan, F. K., and Ma, Y. L.: Humidity plays an important role in the PM2.5 pollution in Beijing, Environ. Pollut., 197, 68–75, https://doi.org/10.1016/j.envpol.2014.11.028, 2015.
Fry, J. L., Draper, D. C., Barsanti, K. C., Smith, J. N., Ortega, J., Winkler, P. M., Lawler, M. J., Brown, S. S., Edwards, P. M., Cohen, R. C., and Lee, L.: Secondary Organic Aerosol Formation and Organic Nitrate Yield from NO3 Oxidation of Biogenic Hydrocarbons, Environ. Sci. Technol., 48, 11944–11953, https://doi.org/10.1021/es502204x, 2014.
Grinsztajn, L., Oyallon, E., and Varoquaux, G.: Why do tree-based models still outperform deep learning on typical tabular data?, Adv. Neur. In., 35, 507–520, 2022.
Guenther, A., Karl, T., Harley, P., Wiedinmyer, C., Palmer, P. I., and Geron, C.: Estimates of global terrestrial isoprene emissions using MEGAN (Model of Emissions of Gases and Aerosols from Nature), Atmos. Chem. Phys., 6, 3181–3210, https://doi.org/10.5194/acp-6-3181-2006, 2006.
Guenther, A. B., Jiang, X., Heald, C. L., Sakulyanontvittaya, T., Duhl, T., Emmons, L. K., and Wang, X.: The Model of Emissions of Gases and Aerosols from Nature version 2.1 (MEGAN2.1): an extended and updated framework for modeling biogenic emissions, Geosci. Model Dev., 5, 1471–1492, https://doi.org/10.5194/gmd-5-1471-2012, 2012.
Hanna, S., Russell, A., Wilkinson, J., Vukovich, J., and Hansen, D.: Monte Carlo estimation of uncertainties in BEIS3 emission outputs and their effects on uncertainties in chemical transport model predictions, J. Geophys. Res.-Atmos., 110, D01302, https://doi.org/10.1029/2004JD004986, 2005.
Hou, L. L., Dai, Q. L., Song, C. B., Liu, B. W., Guo, F. Z., Dai, T. J., Li, L. X., Liu, B. S., Bi, X. H., Zhang, Y. F., and Feng, Y. C.: Revealing Drivers of Haze Pollution by Explainable Machine Learning, Environ. Sci. Tech. Let., 9, 112–119, https://doi.org/10.1021/acs.estlett.1c00865, 2022.
Hu, J., Wang, Y., Ying, Q., and Zhang, H.: Spatial and temporal variability of PM2.5 and PM10 over the North China Plain and the Yangtze River Delta, China, Atmos. Environ., 95, 598–609, 2014.
Hu, J., Chen, J., Ying, Q., and Zhang, H.: One-year simulation of ozone and particulate matter in China using WRF/CMAQ modeling system, Atmos. Chem. Phys., 16, 10333–10350, https://doi.org/10.5194/acp-16-10333-2016, 2016.
Hu, J., Huang, L., Chen, M., Liao, H., Zhang, H., Wang, S., Zhang, Q., and Ying, Q.: Premature mortality attributable to particulate matter in China: source contributions and responses to reductions, Environ. Sci. Technol., 51, 9950–9959, 2017a.
Hu, J., Wang, P., Ying, Q., Zhang, H., Chen, J., Ge, X., Li, X., Jiang, J., Wang, S., Zhang, J., Zhao, Y., and Zhang, Y.: Modeling biogenic and anthropogenic secondary organic aerosol in China, Atmos. Chem. Phys., 17, 77–92, https://doi.org/10.5194/acp-17-77-2017, 2017b.
Huang, Z., Hu, Y., Zheng, J., Yuan, Z., Russell, A. G., Ou, J., and Zhong, Z.: A New Combined Stepwise-Based High-Order Decoupled Direct and Reduced-Form Method To Improve Uncertainty Analysis in PM(2.5) Simulations, Environ. Sci. Technol., 51, 3852–3859, https://doi.org/10.1021/acs.est.6b05479, 2017.
Huang, Z., Zheng, J., Ou, J., Zhong, Z., Wu, Y., and Shao, M.: A Feasible Methodological Framework for Uncertainty Analysis and Diagnosis of Atmospheric Chemical Transport Models, Environ. Sci. Technol., 53, 3110–3118, https://doi.org/10.1021/acs.est.8b06326, 2019.
Ke, G. L., Meng, Q., Finley, T., Wang, T. F., Chen, W., Ma, W. D., Ye, Q. W., and Liu, T. Y.: LightGBM: A Highly Efficient Gradient Boosting Decision Tree, 31st Annual Conference on Neural Information Processing Systems (NIPS), Long Beach, CA, 4–9 December, WOS:000452649403021, 2017.
Li, M., Liu, H., Geng, G., Hong, C., Liu, F., Song, Y., Tong, D., Zheng, B., Cui, H., Man, H., Zhang, Q., and He, K.: Anthropogenic emission inventories in China: a review, Natl. Sci. Rev., 4, 834–866, https://doi.org/10.1093/nsr/nwx150, 2017.
Li, T., Zhang, Q., Peng, Y., Guan, X., Li, L., Mu, J., Wang, X., Yin, X., and Wang, Q.: Contributions of Various Driving Factors to Air Pollution Events: Interpretability Analysis from Machine Learning Perspective, Environ. Int., 107861, https://doi.org/10.1016/j.envint.2023.107861, 2023.
Liang, F., Xiao, Q., Huang, K., Yang, X., Liu, F., Li, J., Lu, X., Liu, Y., and Gu, D.: The 17-y spatiotemporal trend of PM2.5 and its mortality burden in China, P. Natl. Acad. Sci. USA, 117, 25601–25608, 2020.
Liang, W., Luo, S., Zhao, G., and Wu, H.: Predicting hard rock pillar stability using GBDT, XGBoost, and LightGBM algorithms, Mathematics, 8, 765, https://doi.org/10.3390/math8050765, 2020.
Liu, J. and Xing, J.: Identifying Contributors to PM2.5 Simulation Biases of Chemical Transport Model Using Fully Connected Neural Networks, J. Adv. Model. Earth Sy., 15, e2021MS002898, https://doi.org/10.1029/2021MS002898, 2022.
Liu, J., Ding, J., Rexiding, M., Li, X., Zhang, J., Ran, S., Bao, Q., and Ge, X.: Characteristics of dust aerosols and identification of dust sources in Xinjiang, China, Atmos. Environ., 262, 118651, https://doi.org/10.1016/j.atmosenv.2021.118651, 2021a.
Liu, J., Chu, B., Chen, T., Zhong, C., Liu, C., Ma, Q., Ma, J., Zhang, P., and He, H.: Secondary organic aerosol formation potential from ambient air in Beijing: effects of atmospheric oxidation capacity at different pollution levels, Environ. Sci. Technol., 55, 4565–4572, 2021b.
Liu, S., Xing, J., Sahu, S. K., Liu, X., Liu, S., Jiang, Y., Zhang, H., Li, S., Ding, D., Chang, X., and Wang, S.: Wind-blown dust and its impacts on particulate matter pollution in Northern China: current and future scenarios, Environ. Res. Lett., 16, 114041, https://doi.org/10.1088/1748-9326/ac31ec, 2021.
Liu, X., Shen, G., Chen, L., Qian, Z., Zhang, N., Chen, Y., Chen, Y., Cao, J., Cheng, H., Du, W., Li, B., Li, G., Li, Y., Liang, X., Liu, M., Lu, H., Luo, Z., Ren, Y., Zhang, Y., Zhu, D., and Tao, S.: Spatially Resolved Emission Factors to Reduce Uncertainties in Air Pollutant Emission Estimates from the Residential Sector, Environ. Sci. Technol., 55, 4483–4493, https://doi.org/10.1021/acs.est.0c08568, 2021.
Liu, X., Lu, D., Zhang, A., Liu, Q., and Jiang, G.: Data-driven machine learning in environmental pollution: Gains and problems, Environ. Sci. Technol., 56, 2124–2133, 2022.
Loyola-González, O., Ramírez-Sáyago, E., and Medina-Pérez, M. A.: Towards improving decision tree induction by combining split evaluation measures, Knowl.-Based Syst., 277, 110832, https://doi.org/10.1016/j.knosys.2023.110832, 2023.
Ma, J., Shen, J., Wang, P., Zhu, S., Wang, Y., Wang, P., Wang, G., Chen, J., and Zhang, H.: Modeled changes in source contributions of particulate matter during the COVID-19 pandemic in the Yangtze River Delta, China, Atmos. Chem. Phys., 21, 7343–7355, https://doi.org/10.5194/acp-21-7343-2021, 2021.
Meng, C., Cheng, T. H., Gu, X. F., Shi, S. Y., Wang, W. N., Wu, Y., and Bao, F. W.: Contribution of meteorological factors to particulate pollution during winters in Beijing, Sci. Total Environ., 656, 977–985, https://doi.org/10.1016/j.scitotenv.2018.11.365, 2019.
NCEP, F.: National Centers for Environmental Prediction/National Weather Service/NOAA/US Department of Commerce, NCEP FNL Operational Model Global Tropospheric Analyses, continuing from July 1999, Research Data Archive at the National Center for Atmospheric Research, Computational and Information Systems Laboratory, 2000, updated daily.
Pleim, J. and Ran, L.: Surface flux modeling for air quality applications, Atmosphere, 2, 271–302, 2011.
Qiao, X., Ying, Q., Li, X., Zhang, H., Hu, J., Tang, Y., and Chen, X.: Source apportionment of PM2.5 for 25 Chinese provincial capitals and municipalities using a source-oriented Community Multiscale Air Quality model, Sci. Total Environ., 612, 462–471, https://doi.org/10.1016/j.scitotenv.2017.08.272, 2018.
Qu, Y., Voulgarakis, A., Wang, T., Kasoar, M., Wells, C., Yuan, C., Varma, S., and Mansfield, L.: A study of the effect of aerosols on surface ozone through meteorology feedbacks over China, Atmos. Chem. Phys., 21, 5705–5718, https://doi.org/10.5194/acp-21-5705-2021, 2021.
Ryu, Y.-H. and Min, S.-K.: Improving Wet and Dry Deposition of Aerosols in WRF-Chem: Updates to Below-Cloud Scavenging and Coarse-Particle Dry Deposition, J. Adv. Model. Earth Sy., 14, e2021MS002792, https://doi.org/10.1029/2021MS002792, 2022.
Shang, D., Peng, J., Guo, S., Wu, Z., and Hu, M.: Secondary aerosol formation in winter haze over the Beijing-Tianjin-Hebei Region, China, Front. Env. Sci. Eng., 15, 1–13, 2021.
Shen, H., Luo, Z., Xiong, R., Liu, X., Zhang, L., Li, Y., Du, W., Chen, Y., Cheng, H., Shen, G., and Tao, S.: A critical review of pollutant emission factors from fuel combustion in home stoves, Environ. Int., 157, 106841, https://doi.org/10.1016/j.envint.2021.106841, 2021.
Shu, Q., Murphy, B., Schwede, D., Henderson, B. H., Pye, H. O. T., Appel, K. W., Khan, T. R., and Perlinger, J. A.: Improving the particle dry deposition scheme in the CMAQ photochemical modeling system, Atmos. Environ., 289, 119343, https://doi.org/10.1016/j.atmosenv.2022.119343, 2022.
Stirnberg, R., Cermak, J., Kotthaus, S., Haeffelin, M., Andersen, H., Fuchs, J., Kim, M., Petit, J.-E., and Favez, O.: Meteorology-driven variability of air pollution (PM1) revealed with explainable machine learning, Atmos. Chem. Phys., 21, 3919–3948, https://doi.org/10.5194/acp-21-3919-2021, 2021.
Sun, H., Shin, Y. M., Xia, M., Ke, S., Wan, M., Yuan, L., Guo, Y., and Archibald, A. T.: Spatial Resolved Surface Ozone with Urban and Rural Differentiation during 1990–2019: A Space–Time Bayesian Neural Network Downscaler, Environ. Sci. Technol., 56, 7337–7349, 2021.
Sun, X., Liu, M., and Sima, Z.: A novel cryptocurrency price trend forecasting model based on LightGBM, Financ. Res. Lett., 32, 101084, https://doi.org/10.1016/j.frl.2018.12.032, 2020.
US EPA Office of Research and Development: CMAQv5.0.2 (5.0.2), Zenodo [code], https://doi.org/10.5281/zenodo.1079898, 2014.
Wang, P., Qiao, X., and Zhang, H.: Modeling PM2.5 and O3 with aerosol feedbacks using WRF/Chem over the Sichuan Basin, southwestern China, Chemosphere, 254, 126735, https://doi.org/10.1016/j.chemosphere.2020.126735, 2020.
Wang, S., Wang, P., Qi, Q., Wang, S., Meng, X., Kan, H., Zhu, S., and Zhang, H.: Improved estimation of particulate matter in China based on multisource data fusion, Sci. Total Environ., 161552, https://doi.org/10.1016/j.scitotenv.2023.161552, 2023a.
Wang, S., Wang, P., Zhang, R., Meng, X., Kan, H., and Zhang, H.: Estimating particulate matter concentrations and meteorological contributions in China during 2000–2020, Chemosphere, 330, 138742, https://doi.org/10.1016/j.chemosphere.2023.138742, 2023b.
Wang, S., Zhang, M., Gao, Y., Wang, P., and Zhang, H.: Diagnosing drivers of PM2.5 simulation biases from meteorology, chemical composition, and emission sources using an efficient machine learning method, Zenodo [code and data set], https://doi.org/10.5281/zenodo.10283739, 2023c.
Wang, S. Y., Zhang, Y. L., Ma, J. L., Zhu, S. Q., Shen, J. Y., Wang, P., and Zhang, H. L.: Responses of decline in air pollution and recovery associated with COVID-19 lockdown in the Pearl River Delta, Sci. Total Environ., 756, 143868, https://doi.org/10.1016/j.scitotenv.2020.143868, 2021.
Wei, J., Li, Z., Cribb, M., Huang, W., Xue, W., Sun, L., Guo, J., Peng, Y., Li, J., Lyapustin, A., Liu, L., Wu, H., and Song, Y.: Improved 1 km resolution PM2.5 estimates across China using enhanced space–time extremely randomized trees, Atmos. Chem. Phys., 20, 3273–3289, https://doi.org/10.5194/acp-20-3273-2020, 2020.
Wei, J., Li, Z., Lyapustin, A., Sun, L., Peng, Y., Xue, W., Su, T., and Cribb, M.: Reconstructing 1-km-resolution high-quality PM2.5 data records from 2000 to 2018 in China: spatiotemporal variations and policy implications, Remote Sens. Environ., 252, 112136, https://doi.org/10.1016/j.rse.2020.112136, 2021a.
Wei, J., Li, Z., Pinker, R. T., Wang, J., Sun, L., Xue, W., Li, R., and Cribb, M.: Himawari-8-derived diurnal variations in ground-level PM2.5 pollution across China using the fast space-time Light Gradient Boosting Machine (LightGBM), Atmos. Chem. Phys., 21, 7863–7880, https://doi.org/10.5194/acp-21-7863-2021, 2021b.
Wiedinmyer, C., Akagi, S. K., Yokelson, R. J., Emmons, L. K., Al-Saadi, J. A., Orlando, J. J., and Soja, A. J.: The Fire INventory from NCAR (FINN): a high resolution global model to estimate the emissions from open burning, Geosci. Model Dev., 4, 625–641, https://doi.org/10.5194/gmd-4-625-2011, 2011.
World Health Organization: WHO global air quality guidelines: particulate matter (PM2.5 and PM10), ozone, nitrogen dioxide, sulfur dioxide and carbon monoxide: executive summary, World Health Organization, Geneva, PMID: 3466200, 2021.
Wu, K., Yang, X. Y., Chen, D., Gu, S., Lu, Y. Q., Jiang, Q., Wang, K., Ou, Y. H., Qian, Y., Shao, P., and Lu, S. H.: Estimation of biogenic VOC emissions and their corresponding impact on ozone and secondary organic aerosol formation in China, Atmos. Res., 231, 104656, https://doi.org/10.1016/j.atmosres.2019.104656, 2020.
Wu, Y., Liu, J., Zhai, J., Cong, L., Wang, Y., Ma, W., Zhang, Z., and Li, C.: Comparison of dry and wet deposition of particulate matter in near-surface waters during summer, PloS one, 13, e0199241, https://doi.org/10.1371/journal.pone.0199241, 2018.
Xiao, Q., Zheng, Y., Geng, G., Chen, C., Huang, X., Che, H., Zhang, X., He, K., and Zhang, Q.: Separating emission and meteorological contributions to long-term PM2.5 trends over eastern China during 2000–2018, Atmos. Chem. Phys., 21, 9475–9496, https://doi.org/10.5194/acp-21-9475-2021, 2021.
Xiao, Q., Geng, G., Xue, T., Liu, S., Cai, C., He, K., and Zhang, Q.: Tracking PM2.5 and O3 Pollution and the Related Health Burden in China 20132020, Environ. Sci. Technol., 56, 6922–6932, https://doi.org/10.1021/acs.est.1c04548, 2022.
Xu, Q., Wang, S., Jiang, J., Bhattarai, N., Li, X., Chang, X., Qiu, X., Zheng, M., Hua, Y., and Hao, J.: Nitrate dominates the chemical composition of PM2.5 during haze event in Beijing, China, Sci. Total Environ., 689, 1293–1303, 2019.
Xue, T., Zheng, Y., Tong, D., Zheng, B., Li, X., Zhu, T., and Zhang, Q.: Spatiotemporal continuous estimates of PM2.5 concentrations in China, 2000–2016: A machine learning method with inputs from satellites, chemical transport model, and ground observations, Environ. Int., 123, 345–357, 2019.
Yan, J., Xu, Y., Cheng, Q., Jiang, S., Wang, Q., Xiao, Y., Ma, C., Yan, J., and Wang, X.: LightGBM: accelerated genomically designed crop breeding through ensemble learning, Genome Biol., 22, 1–24, 2021.
Yang, W., Li, J., Wang, W., Li, J., Ge, M., Sun, Y., Chen, X., Ge, B., Tong, S., Wang, Q., and Wang, Z.: Investigating secondary organic aerosol formation pathways in China during 2014, Atmos. Environ., 213, 133–147, https://doi.org/10.1016/j.atmosenv.2019.05.057, 2019.
Yang, X., Zhao, C. F., Guo, J. P., and Wang, Y.: Intensification of aerosol pollution associated with its feedback with surface solar radiation and winds in Beijing, J. Geophys. Res.-Atmos., 121, 4093–4099, https://doi.org/10.1002/2015jd024645, 2016.
Ye, X., Wang, X., and Zhang, L.: Diagnosing the Model Bias in Simulating Daily Surface Ozone Variability Using a Machine Learning Method: The Effects of Dry Deposition and Cloud Optical Depth, Environ. Sci. Technol., 56, 16665–16675, https://doi.org/10.1021/acs.est.2c05712, 2022.
Ying, Q., Wu, L., and Zhang, H.: Local and inter-regional contributions to PM2.5 nitrate and sulfate in China, Atmos. Environ., 94, 582–592, 2014.
Ying, Q., Li, J., and Kota, S. H.: Significant contributions of isoprene to summertime secondary organic aerosol in eastern United States, Environ. Sci. Technol., 49, 7834–7842, 2015.
Zhai, S., Jacob, D. J., Wang, X., Shen, L., Li, K., Zhang, Y., Gui, K., Zhao, T., and Liao, H.: Fine particulate matter (PM2.5) trends in China, 2013–2018: separating contributions from anthropogenic emissions and meteorology, Atmos. Chem. Phys., 19, 11031–11041, https://doi.org/10.5194/acp-19-11031-2019, 2019.
Zhang, H., Surratt, J. D., Lin, Y. H., Bapat, J., and Kamens, R. M.: Effect of relative humidity on SOA formation from isoprene/NO photooxidation: enhancement of 2-methylglyceric acid and its corresponding oligoesters under dry conditions, Atmos. Chem. Phys., 11, 6411–6424, https://doi.org/10.5194/acp-11-6411-2011, 2011.
Zhang, H., Li, J., Ying, Q., Yu, J. Z., Wu, D., Cheng, Y., He, K., and Jiang, J.: Source apportionment of PM2.5 nitrate and sulfate in China using a source-oriented chemical transport model, Atmos. Environ., 62, 228–242, 2012.
Zhang, Q., Quan, J., Tie, X., Li, X., Liu, Q., Gao, Y., and Zhao, D.: Effects of meteorology and secondary particle formation on visibility during heavy haze events in Beijing, China, Sci. Total Environ., 502, 578–584, 2015.
Zhang, R., Sun, X. S., Shi, A. J., Huang, Y. H., Yan, J., Nie, T., Yan, X., and Li, X.: Secondary inorganic aerosols formation during haze episodes at an urban site in Beijing, China, Atmos. Environ., 177, 275–282, https://doi.org/10.1016/j.atmosenv.2017.12.031, 2018.
Zhao, B., Liou, K.-N., Gu, Y., Li, Q., Jiang, J. H., Su, H., He, C., Tseng, H.-L. R., Wang, S., Liu, R., Qi, L., Lee, W.-L., and Hao, J.: Enhanced PM2.5 pollution in China due to aerosol-cloud interactions, Sci. Rep.-UK, 7, 4453, https://doi.org/10.1038/s41598-017-04096-8, 2017.
Zhu, Q., Bi, J., Liu, X., Li, S., Wang, W., Zhao, Y., and Liu, Y.: Satellite-based long-term spatiotemporal patterns of surface ozone concentrations in China: 2005–2019, Environ. Health Persp., 130, 027004, https://doi.org/10.1289/EHP9406, 2022.