the Creative Commons Attribution 4.0 License.
the Creative Commons Attribution 4.0 License.
 | 26 Apr 2024
The regional climate–chemistry–ecology coupling model RegCM-Chem (v4.6)–YIBs (v1.0): development and application
Nanhong Xie
Tijian Wang
Xiaodong Xie
Filippo Giorgi
Qian Zhang
Danyang Ma
Rong Song
Beiyao Xu
Shu Li
Bingliang Zhuang
Mengmeng Li
Natalya Andreeva Kilifarska
Georgi Gadzhev
Reneta Dimitrova
The interactions between the terrestrial biosphere, atmospheric chemistry, and climate involve complex feedbacks that have traditionally been modeled separately. We present a new framework that couples the Yale Interactive terrestrial Biosphere (YIBs) model, a dynamic plant-chemistry model, with the RegCM-Chem model. RegCM-Chem–YIBs integrates meteorological variables and atmospheric chemical composition from RegCM-Chem with land surface parameters from YIBs. The terrestrial carbon flux calculated by YIBs is fed back into RegCM-Chem interactively, thereby representing the interactions between fine particulate matter (PM2.5), ozone (O3), and carbon dioxide (CO2). For testing purposes, we carry out a 1-year simulation (2016) at a 30 km horizontal resolution over East Asia with RegCM-Chem–YIBs. The model accurately captures the spatio-temporal distribution of climate, chemical composition, and ecological parameters. In particular, the estimated O3 and PM2.5 are consistent with ground observations, with correlation coefficients (R) of 0.74 and 0.65, respectively. The simulated CO2 concentration is consistent with observations from six sites (R ranged from 0.89 to 0.97) and exhibits a similar spatial pattern when compared with carbon assimilation products. RegCM-Chem–YIBs produces reasonably good gross primary productivity (GPP) and net primary productivity (NPP), showing seasonal and spatial distributions consistent with satellite observations, and mean biases (MBs) of 0.13 and 0.05 kg C m−2 yr−1. This study illustrates that RegCM-Chem–YIBs is a valuable tool to investigate coupled interactions between the terrestrial carbon cycle, atmospheric chemistry, and climate change at a higher resolution on a regional scale.
- Article
(9134 KB) - Full-text XML
-
Supplement
(4166 KB) - BibTeX
- EndNote


Air pollution and climate change are major focal points in atmospheric and environmental science (Hong et al., 2019; Kan et al., 2012). In this respect, China exhibits both high air pollution levels and large greenhouse gas emissions (Zheng et al., 2018; B. Li et al., 2016). The consequences of China's air pollution on global, regional, and urban climate are significant (Liu et al., 2022; Lu et al., 2020). Conversely, global warming impacts the dynamics, physics, and chemical mechanisms underlying atmospheric pollutant formation, underscoring a robust link between atmospheric chemistry and climate change (Baklanov et al., 2016; Fiore et al., 2012, 2015).
PM2.5, O3, and CO2 are important for regional air pollution and climate. O3, a potent pollutant, is harmful for human health and can also harm chloroplasts in plant cells, consequently influencing the carbon assimilation efficiency of land ecosystems (Xie et al., 2019; Ainsworth et al., 2012). Similarly, PM2.5 not only is one of the most dangerous pollutants for human health (Kim et al., 2015), but also affects atmospheric radiation mechanics, modulates radiation fluxes reaching vegetation canopies, and hence impacts plant physiological processes and terrestrial carbon fluxes (Lu et al., 2017; Strada and Unger, 2016). Terrestrial ecosystems, absorbing nearly 30 % of anthropogenic CO2 emissions, play an essential role in the global carbon cycle, for which even minor alterations can trigger significant oscillations in atmospheric CO2 concentrations, potentially destabilizing the global climate (Forkel et al., 2016; Ahlstrom et al., 2015). As a result, PM2.5, O3, and CO2 exhibit intricate interactions.
Models that couple climate and chemistry are vital tools for investigating the interplay between environmental pollution and climate warming (Dunne et al., 2020; Yahya et al., 2017) and in particular the direct and indirect influences of aerosols, O3, and greenhouse gases on climates at different scales (Chutia et al., 2019; Pu et al., 2017; Li et al., 2017a). For example, the Atmospheric Chemistry and Climate Model Intercomparison Project (ACCMIP) addresses this issue through the use of a range of global coupled climate–chemistry models (Young et al., 2013; Shindell et al., 2013; Lamarque et al., 2013). In fact, China has achieved significant advancements in atmospheric chemistry and coupled climate models during recent years, at both the global and the regional scale. Representative models encompass BCC_AGCM2.0_CAM, BCC-AGCM_CUACE2.0, RIEMS-Chem, and RegCCMS.
BCC_AGCM2.0_CAM was coupled by the China Meteorological Administration through direct integration of the Beijing Climate Center's atmospheric circulation model (BCC-AGCM) with the Canadian Aerosol Model (CAM) (Zhang et al., 2012). Atmospheric model BCC-AGCM2.0 was developed by the National Climate Center. For example, at the regional scale, the Institute of Atmospheric Physics of the Chinese Academy of Sciences has constructed the Regional Integrated Environmental Modeling System (RIEMS), which is widely used in studies on East Asian regional climate change and severe weather systems (Scheuch et al., 2015; Xiong et al., 2009). It incorporates atmospheric chemistry and aerosol dynamics into the Regional Integrated Environment Modeling System and produces online simulations of meteorological parameters, aerosol chemical composition, optical characteristics, radiation forcing, and aerosol-induced climate feedback (Li et al., 2014; J. W. Li et al., 2013; Han et al., 2012).
Nanjing University developed RegCCMS, a regional climate–chemistry modeling system and synthesis of the regional climate model RegCM2 and the tropospheric atmospheric chemistry model TACM, primarily oriented toward investigating the spatio-temporal distribution, radiation forcing, and climatic effects of tropospheric O3 and sulfate aerosols (Wang et al., 2004). Subsequently, RegCM3 was coupled with TACM, integrating modules for aerosols into RegCCMS (Wang et al., 2010; Zhang et al., 2014; Li et al., 2009). The system incorporates parameterization schemes facilitating the simulation of aerosols' direct, indirect, and semidirect climatic effects. Extensive evaluations have been carried out regarding major aerosol impacts on the meteorology and regional climate within East Asia (Zhuang et al., 2011, 2013; Wang et al., 2015). Subsequently, Shalaby et al. (2012) developed the regional climate–chemistry model RegCM-Chem by coupling the CBM-Z (Carbon Bond Mechanism-Z) gas-phase chemistry module to version 4 of the RegCM system, RegCM4 (Giorgi et al., 2012). RegCM-Chem also includes a simplified aerosol scheme including radiatively interactive sulfates, carbonaceous aerosols, sea salt, and desert dust (Zakey et al., 2006; Solmon et al., 2006), and it has been used for a variety of applications in different domains.
We developed the regional climate–chemistry–ecology model RegCM-Chem–YIBs, in which the interactive biosphere model YIBs (Yale Interactive terrestrial Biosphere) is coupled to RegCM-Chem. The model can produce multi-process simulations of regional climate, atmospheric chemistry, and ecology, especially PM2.5, O3, and CO2, and their interactions with atmospheric variables (Xu et al., 2023; Ma et al., 2023a, b; Xu et al., 2022; Gao et al., 2022; Xie et al., 2020). Here we expand on these previous studies. We carry out a 1-year simulation (2016) at a 30 km horizontal resolution over East Asia with RegCM-Chem–YIBs and conduct a comprehensive assessment. We validate the simulation not only in terms of atmospheric variables but also in terms of atmospheric composition and ecological parameters by comparison with a range of observations available for this period.
The paper is organized as follows. In Sect. 2 we first describe the RegCM-Chem–YIBs system, focusing in particular on the newly implemented coupling with the ecological component. We also describe the observation datasets used in the model assessment. The simulations are then analyzed in Sect. 3, while Sect. 4 presents our conclusions and a general discussion of our results and future developments.
2.1 Overall framework
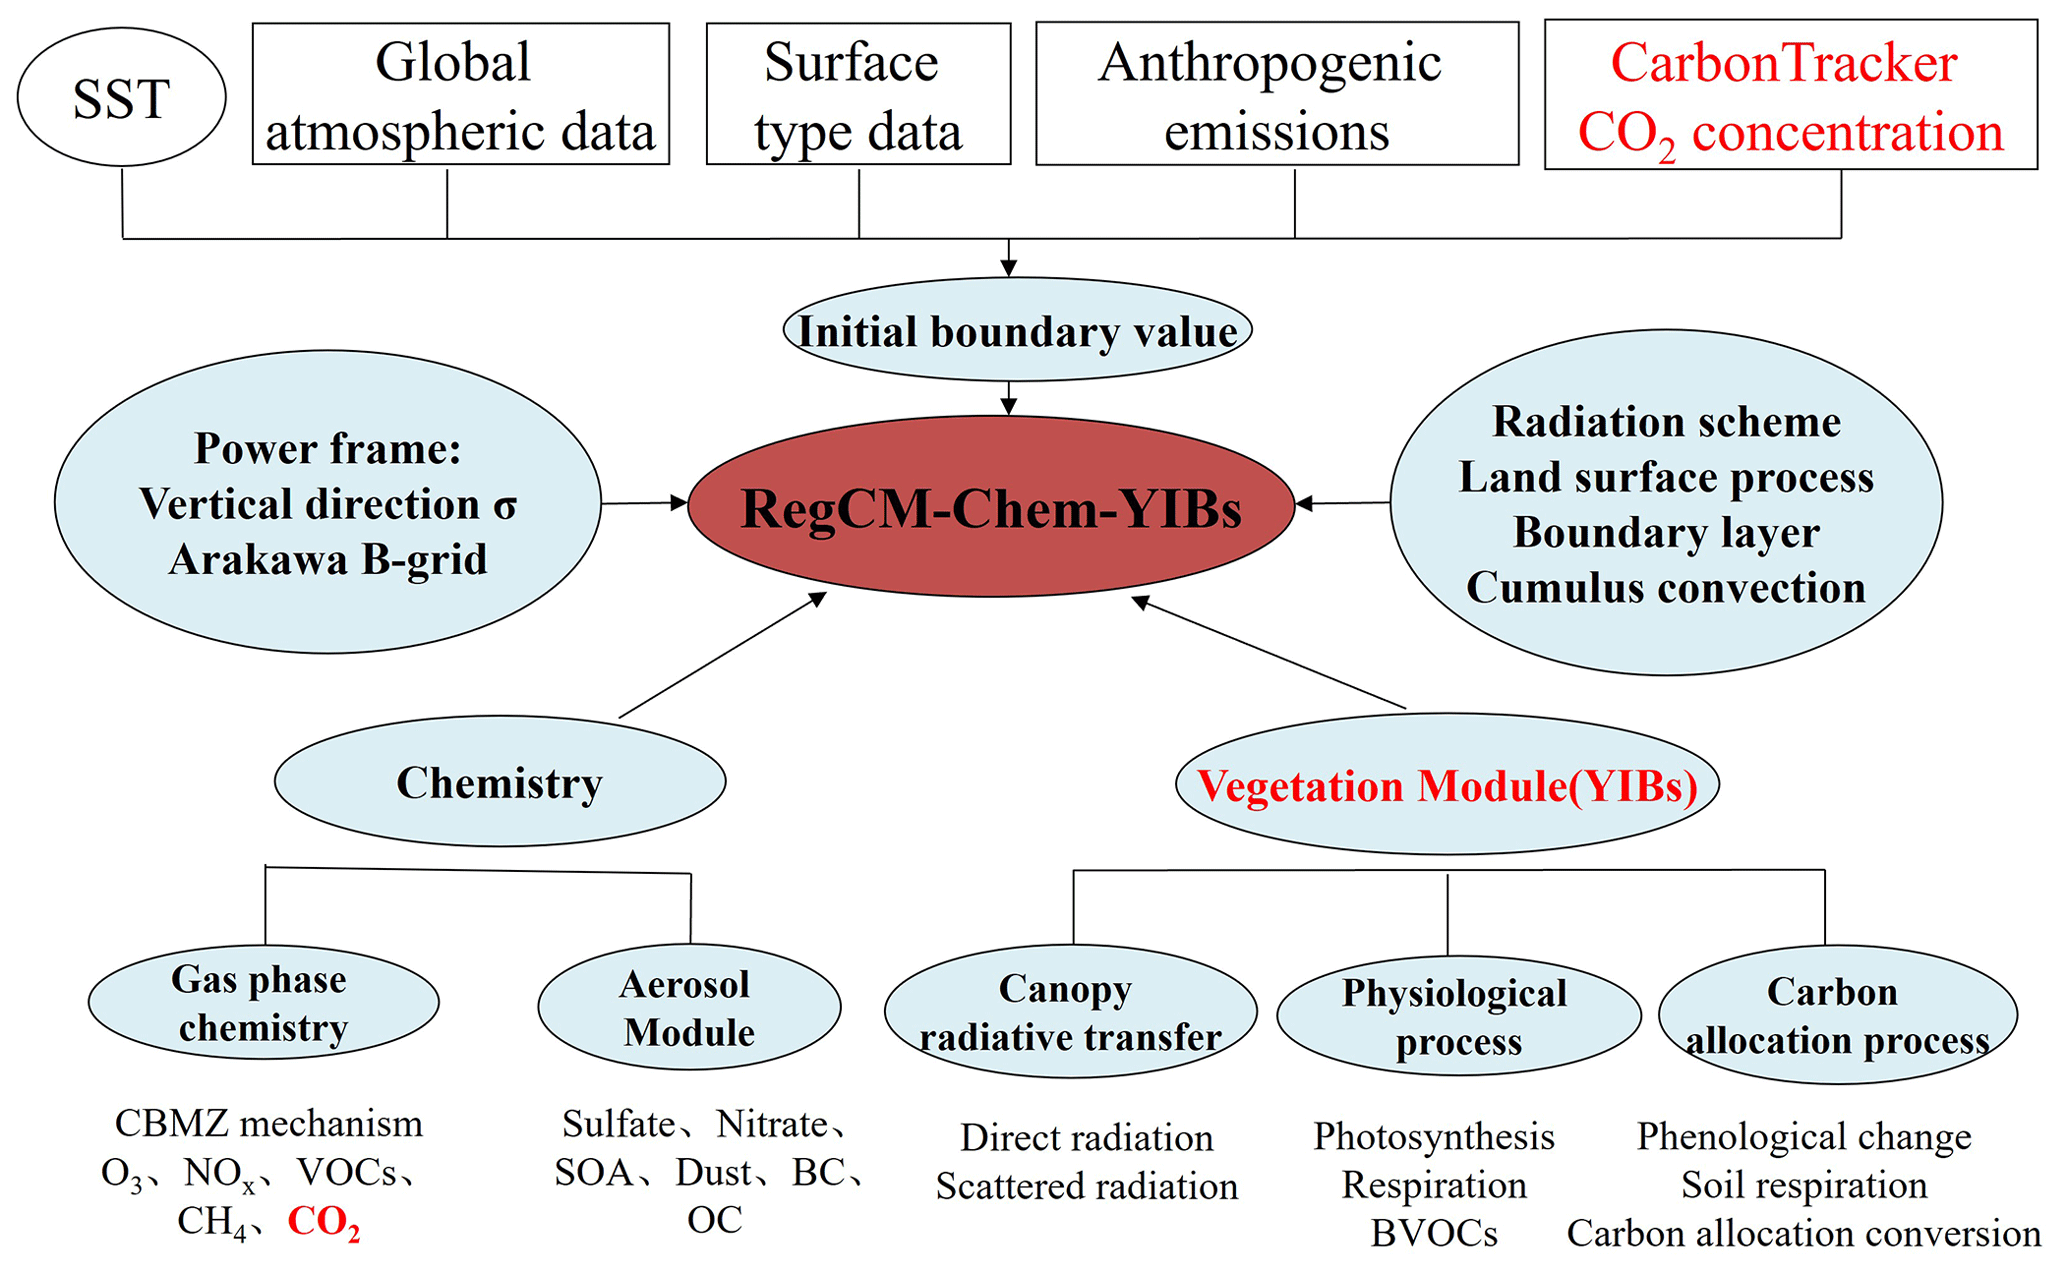
In RegCM-Chem–YIBs, the atmospheric variables produced by RegCM (temperature, humidity, precipitation, radiation, etc.) and atmospheric chemical compounds, such as O3 and PM2.5, produced by the chemistry–aerosol module are input into YIBs, which simulates the physiological processes of vegetation (photosynthesis, respiration, etc.) and calculates land process variables such as CO2 fluxes, biogenic volatile organic compound (BVOC) emissions, and stomatal conductance. The output from YIBs is then fed back to RegCM-Chem, which adjusts the CO2, O3, and PM2.5 concentrations and their radiative and microphysical effects on the meteorological fields in the lower atmosphere, thereby achieving a full coupling between climate, chemistry, and ecology. Figure 1 shows the basic framework of the RegCM-Chem–YIBs coupled model.
2.2 Descriptions of the RegCM-Chem model
The inception of the RegCM system can be traced back to the late 1980s and early 1990s, when the NCAR (the US National Center for Atmospheric Research) RegCM1 model was first developed for climate downscaling (Giorgi, 1990; Giorgi and Bates, 1989; Dickinson et al., 1989). After a series of developments, subsequent versions were introduced, such as RegCM2 (Giorgi et al., 1993), RegCM2.5 (Giorgi and Mearns, 1999), RegCM3 (Pal et al., 2007), and RegCM4 (Giorgi et al., 2012). The RegCM system presently managed, maintained, and expanded by the Earth System Physics (ESP) section of the Abdus Salam International Centre for Theoretical Physics (ICTP) is open-source and extensively employed in regional climate studies, contributing to the establishment of a comprehensive Regional Climate Research Network (RegCNET) (Giorgi et al., 2006). The model can be applied to all regions of the globe (Giorgi et al., 2012) and is moving into a fully coupled regional Earth system model framework through coupling with the ocean (Turuncoglu et al., 2013; Artale et al., 2010), lakes (Small et al., 1999), aerosols (Solmon et al., 2006), dust (Zakey et al., 2006), chemistry (Shalaby et al., 2012), hydrology (Coppola et al., 2003), and land surface processes (Oleson et al., 2008). Of specific interest for our study, Shalaby et al. (2012) added a radiatively interactive gas-phase chemical module (CBM-Z) to RegCM4, generating RegCM-Chem, in which atmosphere physics and chemistry are fully coupled.
2.2.1 Aerosol mechanisms
The RegCM model integrates a simplified aerosol framework, enabling the simulation of sulfate, black carbon (BC), organic carbon (OC), sea salt, and desert dust. The model specifies an external mix of aerosols and accounts for the influence of horizontal advection, turbulent diffusion, vertical transport, emissions, dry and wet deposition, and gas–liquid transition on aerosol concentration (Solmon et al., 2012; Giorgi et al., 2012; Zakey et al., 2006). The secondary organic aerosol scheme VBS (volatile basis set) has also been introduced into the model to further improve RegCM-Chem's simulation of tropospheric aerosols (Yin et al., 2015). The model incorporates the ISORROPIA thermodynamic equilibrium scheme to describe the formation process of secondary inorganic salts, thus enhancing the model's capability to simulate secondary inorganic aerosols (S. Li et al., 2016). The further addition of bioaerosols was carried out by Liu et al. (2016).
2.2.2 Gas-phase chemical mechanism
RegCM4-Chem includes the CBM-Z (Carbon Bond Mechanism-Z) atmospheric chemistry mechanism (Zaveri and Peters, 1999). The CBM-IV mechanism, recognized for its widespread use, serves as the basis for CBM-Z (Gery et al., 1989) and was developed to balance simulation accuracy and computational speed. Both CBM-IV and CBM-Z categorize volatile organic compounds (VOCs) into groups dependent on their carbon bond formation and use lumped species to represent each group. However, CBM-Z includes additional species and reactions compared to CBM-IV, which are crucial for simulating typical urban environments and long-term simulations at regional to global scales. Enhancements in CBM-Z include (1) the specific representation of stable alkanes; (2) updated parameters for higher alkanes; (3) the separation of olefins into two categories based on differing reactions; (4) the addition of peroxy alkane self-reactions significant in low-NOx conditions, such as remote regions; (5) the incorporation of reactions among alkanes, peroxyacyl radicals, and NO3, which are crucial nocturnally; (6) the inclusion of long-lived organic nitrates and peroxides; and (7) the refinement of isoprene and its peroxy radical chemistry. Collectively, these updates to the CBM-Z chemistry mechanism enhance the model's ability to more accurately simulate long-lived VOCs and address the atmospheric chemistry transition from urban to rural settings.
2.2.3 Radiation scheme
RegCM4 adopts the CCM3 radiation scheme, which uses the delta-Eddington approximation for solar spectral radiation and accounts for the attenuation effect of atmospheric components such as O3, H2O, CO2, and O2 on solar radiation (Kiehl et al., 1998). The CCM3 radiation scheme, implemented in RegCM4, extends from 0.2 to 5 µm and is segmented into 18 bands. It uses the cloud scattering and absorption parameter scheme and cloud optical characteristics. As cumulus clouds form, the cloud optical characteristics stretch from the cloud base up to the cloud top, and the radiation calculations assume random overlap. It is assumed in the model that the cloud thickness is equivalent to that of the model's vertical layers, with distinctive cloud water and ice contents assigned to high, middle, and low clouds (Slingo, 1989).
2.2.4 Photolysis rate
Meteorological conditions and chemical input fields determine the photolysis rate, with most variables dynamically produced by the RegCM's modules and updated every 3–30 min. SO2 and NOx, inverted from the US standard atmosphere's vertical profile, are model-defined. Owing to the computational demands of precise photolysis rates from the Tropospheric Ultraviolet and Visible (TUV) model method (Madronich and Flocke, 1999) and eight-data-stream spherical-harmonics discretization, a lookup table and an interpolation method are adopted. Considering the significant impact of clouds on the photolysis rate, it becomes crucial to adjust the cloud amount. Here we use the cloud optical depth information for each grid cell within the model. As the absorption and scattering of ultraviolet radiation by clouds reduce the photolysis rate inside and below the cloud while enhancing it above the cloud, the correction value for the photolysis rate under clear-sky conditions depends on the position relative to the cloud layer. Hence, cloud height and optical depth are necessary for the photolysis rate computation (Chang et al., 1987).
2.2.5 Deposition processes
In the model, dry deposition serves as the principal removal process for trace gases, with the deposition velocity being determined by three categories of resistance: aerodynamic; quasi-laminar sublayer; and surface resistance, encompassing soil and vegetation absorption. The latter is inclusive of both stomatal and nonstomatal absorption. The dry-deposition module, taken from the CLM4 surface scheme, covers 29 gas-phase species and comprises 11 types of land cover. To enhance the accuracy of the daily variation in dry-deposition simulation, both stomatal and nonstomatal resistances are accounted for in the dry-deposition scheme. The calculation of all deposition resistances is performed within the CLM land surface model (Wesely, 1989). Wet deposition uses the MOZART global model's wet-deposition parameterization scheme (Emmons et al., 2010; Horowitz et al., 2003), including 26 gas-phase species in CBM-Z, and the wet-deposition amount is based on the simulated precipitation.
2.3 Descriptions of the YIBs model
The YIBs model, pioneered by Yale University, integrates plant physiological mechanisms to simulate how photosynthesis, respiration, and other physiological processes respond to environmental drivers such as radiation, temperature, and moisture. Moreover, YIBs simulates the carbon cycle both regionally and globally (Yue and Unger, 2015). For example, its simulation of terrestrial carbon flux closely matches ground flux observations and satellite-derived data in diverse geographical areas such as the United States and China (Yue and Unger, 2017; Yue et al., 2017).
2.3.1 The main processes in YIBs
In the YIBs model, eight distinct plant functional types (PFTs) are incorporated, encompassing evergreen coniferous forest, evergreen broad-leaved forest, deciduous broad-leaved forest, shrub forest, tundra, C3 grassland, C4 grasslands, and crops. The model employs the Michaelis–Menten enzyme-kinetics scheme for simulating plant photosynthesis (Farquhar et al., 1980), and the total photosynthesis (Atot) of leaves is affected by Rubisco enzyme activity (Jc), the electron transfer rate (Je), and photosynthetic-product (triose phosphate) transport capacity (JS) limitation.
2.3.2 Canopy radiation scheme
A multilayer canopy radiation transmission scheme is adopted in YIBs for canopy radiation transmission (Spitters et al., 1986), consisting of a radiation transfer model based on the total leaf area index, extinction coefficient, and vegetation height. The entire vegetation canopy is usually divided into 2 to 16 layers, and the specific number of layers can be automatically adjusted according to the height of the canopy.
2.3.3 Biogenic volatile organic compound emission scheme
Differently from the traditional MEGAN scheme, the YIBs model applies a biogenic volatile organic compound (BVOC) emission scheme on a leaf scale, which is better suited to describing the photosynthesis process in vegetation (Guenther et al., 1995). This introduces an effect of plant photosynthesis on BVOC emissions which is more closely related to the real physiological process of vegetation. BVOC emissions from leaves to the canopy are integrated to obtain total canopy emissions. The intensity of the leaf BVOC emission depends on the rate of photosynthesis Je under electron transfer rate limitation, leaf surface temperature, and intracellular CO2 concentration (Yue and Unger, 2015):
where I is the intensity of the leaf BVOC emission in units of µmol m−2 leaf s−1. Je is the electron-transport-limited photosynthesis rate, and its calculation formula is as follows:
where aleaf is the leaf-specific light absorbance, PAR is photosynthetically active radiation, and αqe is the intrinsic quantum efficiency for photosynthetic CO2 uptake in the chlorophyll reaction system. Ci is the internal leaf CO2 concentration. Γ* is the CO2 concentration compensation point in the absence of non-photorespiratory respiration (Collatz et al., 1991).
β is the coefficient for converting electron transfer flux into BVOC emissions (Niinemets et al., 2002; Pacifico et al., 2011):
κ is related to the internal leaf CO2 concentration:
where Ci_standard is the internal leaf CO2 concentration under standard conditions (when atmospheric CO2 is 370 ppm). The τ term reflects the response of BVOC emission intensity to temperature:
where T is the blade surface temperature and Tref is the standard temperature (30 °C). When the blade temperature is 40 °C, the BVOC emission intensity is maximum. As the temperature further rises, the BVOC emission gradually weakens. In reality, such high temperatures are relatively rare and may only occur under extremely dry climate conditions.
2.3.4 Ozone damage protocol
When tropospheric ozone enters plants through stomata, it can directly damage plant cell tissues, thereby slowing the photosynthesis rate and further weakening the carbon sequestration capacity of vegetation. The YIBs model incorporates a semi-mechanistic parameterization scheme to delineate ozone's effect on plants (Sitch et al., 2007):
where A is photosynthesis minus the influence of ozone; Atot is the total photosynthesis of leaves; and F is the proportion of photosynthesis minus the influence of ozone, which depends on the ozone flux from the stomata into the vegetation that exceeds the threshold.
where a is the sensitivity parameter of vegetation to ozone obtained based on observation data. Fozncrit represents the threshold corresponding to the damage caused by ozone to vegetation, and Fozn represents the flux of ozone entering the leaf through the stomata:
Here [O3] is the ozone concentration at the top of the canopy, rb is the boundary layer resistance, is the ratio of O3 leaf resistance to water vapor blade resistance, and rs is the stomatal resistance considering the influence of ozone:
gs is the leaf conductance without O3 effects. The set of Eqs. (7), (8), and (9) yields a quadratic term in F that can be solved analytically.
2.4 Descriptions of the RegCM-Chem–YIBs model
2.4.1 Coupling between RegCM-Chem and YIBs
The integrated RegCM-Chem–YIBs model, an enhancement to the original RegCM-Chem, introduces CO2 as an atmospheric constituent, incorporating its source–sink dynamics, transport, and diffusion processes. Atmospheric CO2 concentration is primarily influenced by atmosphere–ocean CO2 exchange flux, biomass combustion emissions, fossil fuel emissions, and terrestrial ecosystem CO2 flux. The model prescribes fossil fuel emissions, biomass combustion emissions, and atmosphere–ocean CO2 fluxes, while the terrestrial ecosystem CO2 fluxes are computed in real time via the coupled YIBs terrestrial ecosystem model.
Within the coupled model system, meteorological variables (temperature, humidity, precipitation, radiation, etc.) and atmospheric pollutant concentrations (O3 and PM2.5) generated by RegCM-Chem are incorporated into the YIBs model in 6 min intervals. This integration step is to be consistent with the integration time step of the chemistry module, thus maintaining synchronization between modules. Considering the complexity of chemical reactions and ecological processes, dynamic adjustments at short intervals enable the model to better capture transient interactions between ecology and the atmosphere. The choice of this adjustment frequency balances the representation of actual processes with computational efficiency, ensuring that simulation results are both accurate and efficient. YIBs then simulates vegetation physiological processes such as photosynthesis and respiration, computing land surface parameters including CO2 flux, BVOC, and stomatal conductance. These outputs from YIBs are subsequently integrated back into the RegCM-Chem model in 6 min intervals; the intricacies of this integration process lead to significant changes in various environmental parameters. The major direct changes that prominently influence the model's behavior arise from alterations in CO2 concentration. These changes are directly attributed to intricate physiological processes within the vegetation, including photosynthesis and respiration. The fluxes of CO2 through these biological processes play a pivotal role in shaping the atmospheric composition. On the indirect front, the integration of YIBs outputs induces intricate variations in PM2.5 and O3 concentrations. These indirect changes are primarily orchestrated by shifts in BVOC emissions. The dynamic nature of these emissions contributes to the complexity of atmospheric chemistry, influencing the levels of PM2.5 and O3. Simultaneously, the integration process plays a crucial role in shaping the temporal variations in atmospheric temperature, humidity, and circulation. These changes over time are intricately linked to variations in land surface parameters. The interplay of these variables illustrates the dynamic feedback loops between climate, chemical composition, and ecological processes within the integrated model system.
2.4.2 Model input data
The input data of RegCM-Chem–YIBs mainly include four categories – surface data, initial boundary data, anthropogenic emission data, and CO2 surface flux data – which are detailed below.
-
Surface data include the surface vegetation cover type, terrain, and leaf area index. Land cover type information is obtained from the MODIS and AVHRR satellites, employing the classification scheme suggested by Lawrence and Chase (2007), which uses MODIS data to preliminarily distinguish forest, grassland, bare soil, etc. and combines this with AVHRR data to make a detailed forest classification. The dataset contains a total of 16 different vegetation functional types. To align with the classification conventions of the YIBs model, the original 16 vegetation functional types were converted into the corresponding 8 types recognized by the YIBs model. The results are shown in Fig. S1.
-
Initial and boundary data include initial and boundary conditions of meteorological variables and atmospheric chemical composition. Here we use ERA-Interim reanalysis meteorological data, a product from the European Centre for Medium-Range Weather Forecasts (ECMWF) created through four-dimensional variational assimilation. The data are on 37 vertical levels, with a horizontal resolution of 0.125°×0.125° and time resolution of 6 h. Data for sea surface temperature (SST) are provided by the weekly averaged Optimum Interpolation SST product (OI_WK) of the National Oceanic and Atmospheric Administration (NOAA) (Reynolds et al., 2002). The initial and boundary conditions of atmospheric chemical components (e.g., O3) come from simulations carried out with the global chemistry model MOZART (Emmons et al., 2010; Horowitz et al., 2003). In addition, the initial and boundary conditions for CO2 species come from the CarbonTracker global carbon assimilation system (Peters et al., 2007) developed by NOAA ESRL (Earth System Research Laboratories), which uses the ensemble Kalman filter algorithm to assimilate ESRL greenhouse gas observations and CO2 observation data provided by the network of collaborating institutions worldwide. The assimilated data include not only conventional fixed-site observations but also mobile monitoring data such as from aircraft and ships. Since 2007, yearly updated carbon assimilation products have been provided by CarbonTracker, delivering global CO2 three-dimensional concentration data products every 3 h. In this study, we utilized the CT2019 product, updated in 2019, spanning a period from 1 January 2000 to 29 March 2019.
-
Anthropogenic emission data include precursors of ozone and particulate matter such as NOx, VOC, BC, or OC. The MIX Asian anthropogenic emission inventory developed by Tsinghua University is used (Li et al., 2017b), which integrates the results of the emission inventories of various regions in Asia. The emissions in China come from China's multi-scale emission inventory MEIC (Multi-resolution Emission Inventory for China) and the high-resolution NH3 emission inventory developed by Peking University. The anthropogenic emissions in India come from the Indian local emission inventory developed by ANL (Argonne National Laboratory), while the anthropogenic emissions in South Korea come from CAPSS (the South Korean local emission inventory developed by the Policy Support System) and the anthropogenic emissions in other regions are provided by REAS (Regional Emission inventory in ASia) version 2.1. The anthropogenic emissions of major pollutants in the simulated area are shown in Fig. S2.
-
Data pertaining to fossil fuel CO2 emissions are sourced from the MIX Asian anthropogenic emission inventory with a monthly time resolution. CO2 emissions resulting from biomass burning are derived from the FINN (Fire INventory from NCAR) inventory (Wiedinmyer et al., 2011) developed by the National Center for Atmospheric Research. The FINN inventory has a daily time resolution. The model's ocean–atmosphere CO2 exchange flux is obtained from the carbon flux product of the CarbonTracker assimilation system, constructed with the global atmospheric transport model TM5 and assimilating CO2 observation data via an ensemble Kalman filter algorithm. This provides global 1°×1° resolution CO2 exchange flux data between the ocean and the atmosphere updated every 3 h. The emissions are detailed in Fig. S3.
3.1 Model setup
To evaluate the performance of RegCM-Chem–YIBs, we carried out a 1-year simulation from 1 December 2015 through 31 December 2016. The initial month is used as the spin-up period, and thus it is not included in the analysis. The simulation domain is centered at 36° N, 107° E and covers a considerable part of East Asia, including China, Japan, the Korean Peninsula, and Mongolia, along with significant parts of India and Southeast Asia (Fig. S4). The horizontal grid spacing is 30 km, and we use 14 levels in the vertical, reaching up to 50 hPa. Section 2.4.2 provides a comprehensive description of the model input data.
3.2 Climate simulations in East Asia
Given the importance of the climate for the East Asia region, we first present an assessment of the simulation for the climate in 2016 by comparison with the ERA-Interim data. The simulated temperature, specific humidity, and wind fields at varying altitudes and seasons compared well with the reanalyzed data (Figs. S5–S9), especially temperature and specific humidity, while a tendency to overestimate wind speed is observed at the near surface and 850 hPa levels. The fields at 500 hPa show very close agreement with reanalysis data, indicating a strong mid-atmosphere forcing by the boundary conditions, while the simulated circulation patterns near the surface and at 850 hPa in summer tend to deviate more from the driving reanalysis. The simulated circulation patterns in the other seasons are basically consistent with the reanalysis data.
We first calculated the daily average of the meteorological variables, such as temperature, wind speed, and specific humidity, from the model simulation and from the reanalysis data. Then we calculate the corresponding statistical indicator correlation coefficient (R), mean bias (MB), and root mean square error (RMSE) based on the daily averages. Table 1 reports a number of statistical metrics of comparison between simulated and reanalysis meteorological variables at different heights. Correlation coefficients (R) range from 0.95 to 0.98 for temperature, 0.71 to 0.97 for longitudinal wind, 0.81 to 0.92 for latitudinal wind, and 0.91 to 0.92 for specific humidity, indicating a generally good consistency between model and driving data, in line with previous studies (Zhuang et al., 2018; Zhou et al., 2014; Wang et al., 2010).
Table 1Statistical indicators for comparison between model simulation results and reanalysis data.
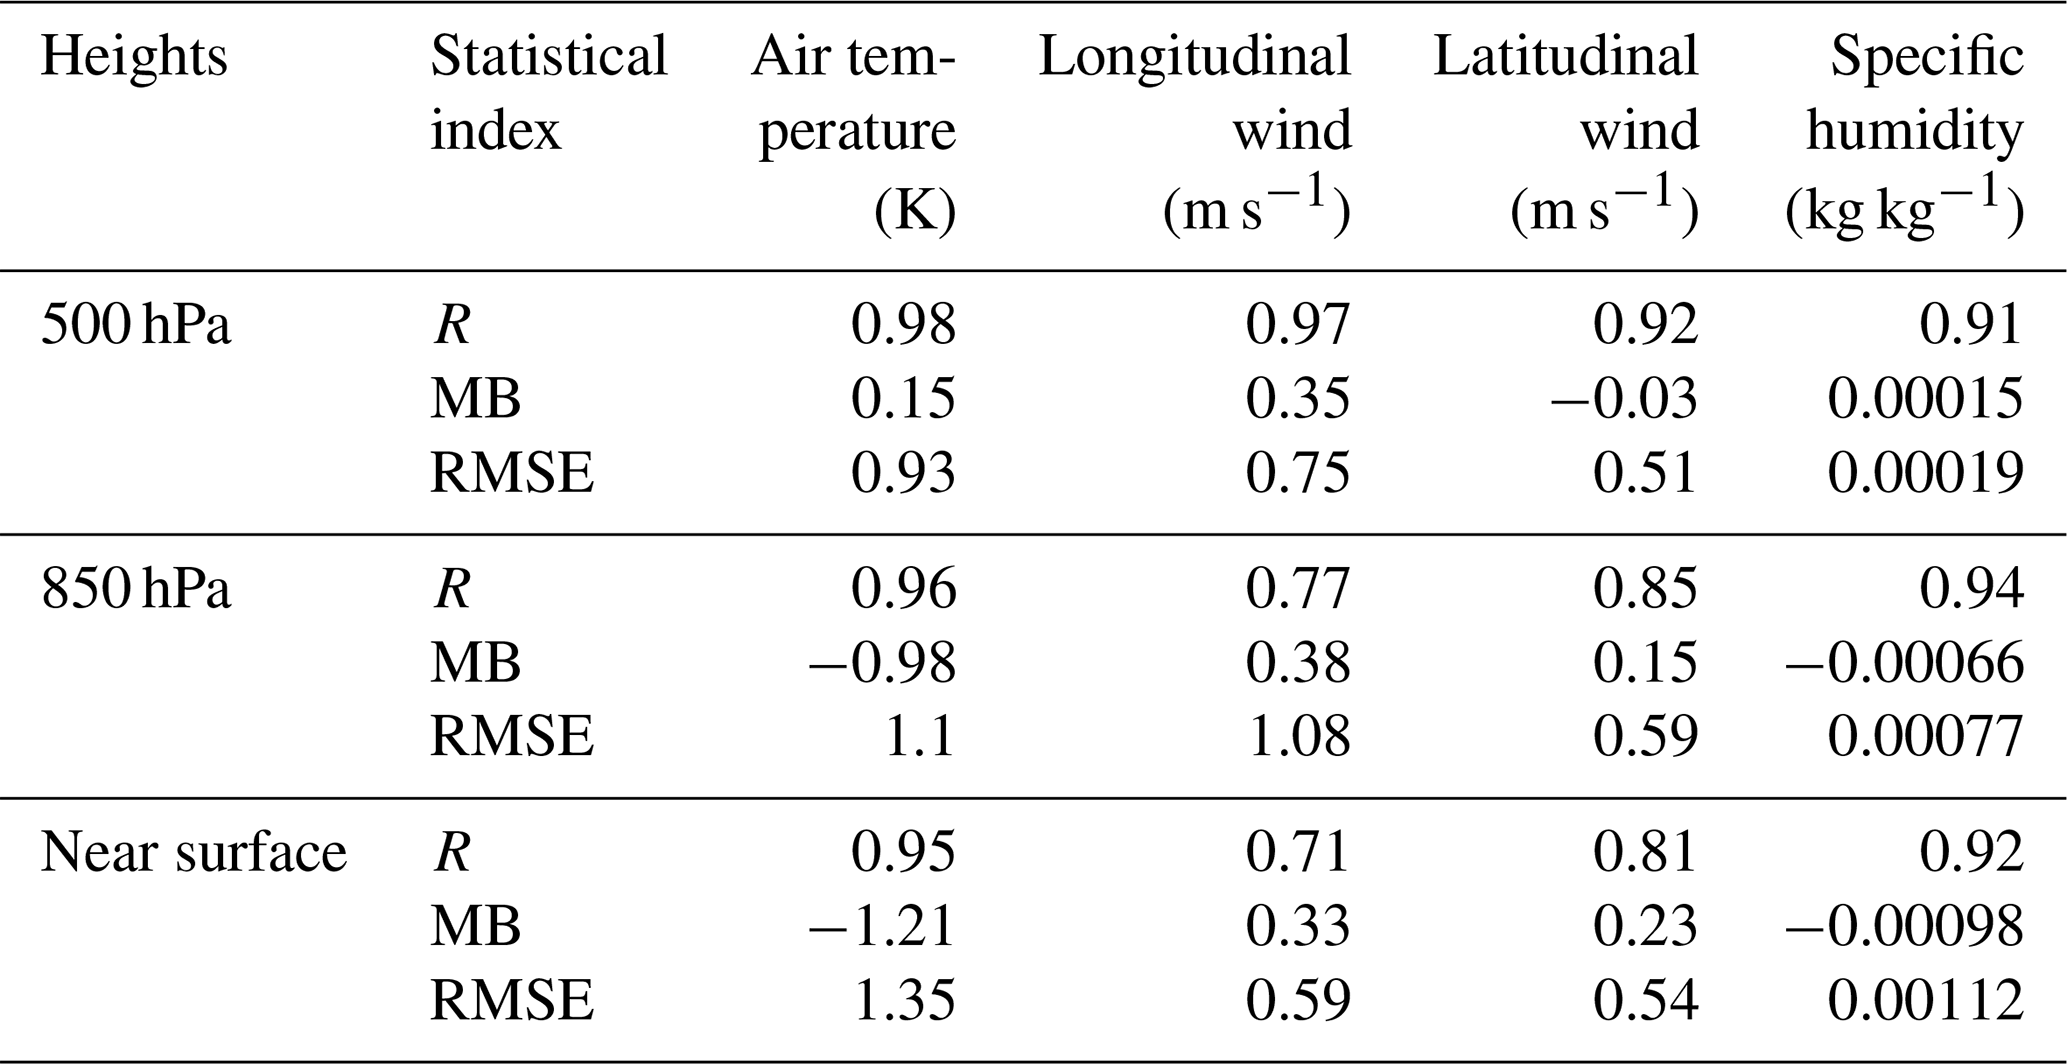
Correlation coefficient (R), mean bias (MB), and root mean square error (RMSE).
The magnitude of surface radiation flux directly determines the rates of photosynthesis in vegetation. For verification purposes, model surface solar fluxes were compared with data on solar energy at the surface retrieved from the Clouds and the Earth's Radiant Energy System (CERES) satellite, which has a 1°×1° horizontal and monthly temporal resolution. Figure S10 shows the simulated surface net shortwave radiation in different seasons and comparison with observational data. The model tends to overestimate surface net shortwave radiation in spring and winter over India and summer over north China (Yin et al., 2014). Overall, the simulated surface net shortwave radiation agrees well with the CERES satellite retrieval results, capturing the spatial distribution and seasonal fluctuation patterns of surface shortwave radiation. The simulation findings from our study are consistent with earlier research regarding surface net shortwave radiation (Han et al., 2016).
In conclusion, RegCM-Chem–YIBs demonstrates a good performance in simulating the climatological features of the East Asia atmospheric circulations, effectively reproducing the spatial distribution and seasonal variations in temperature, specific humidity, and radiation.
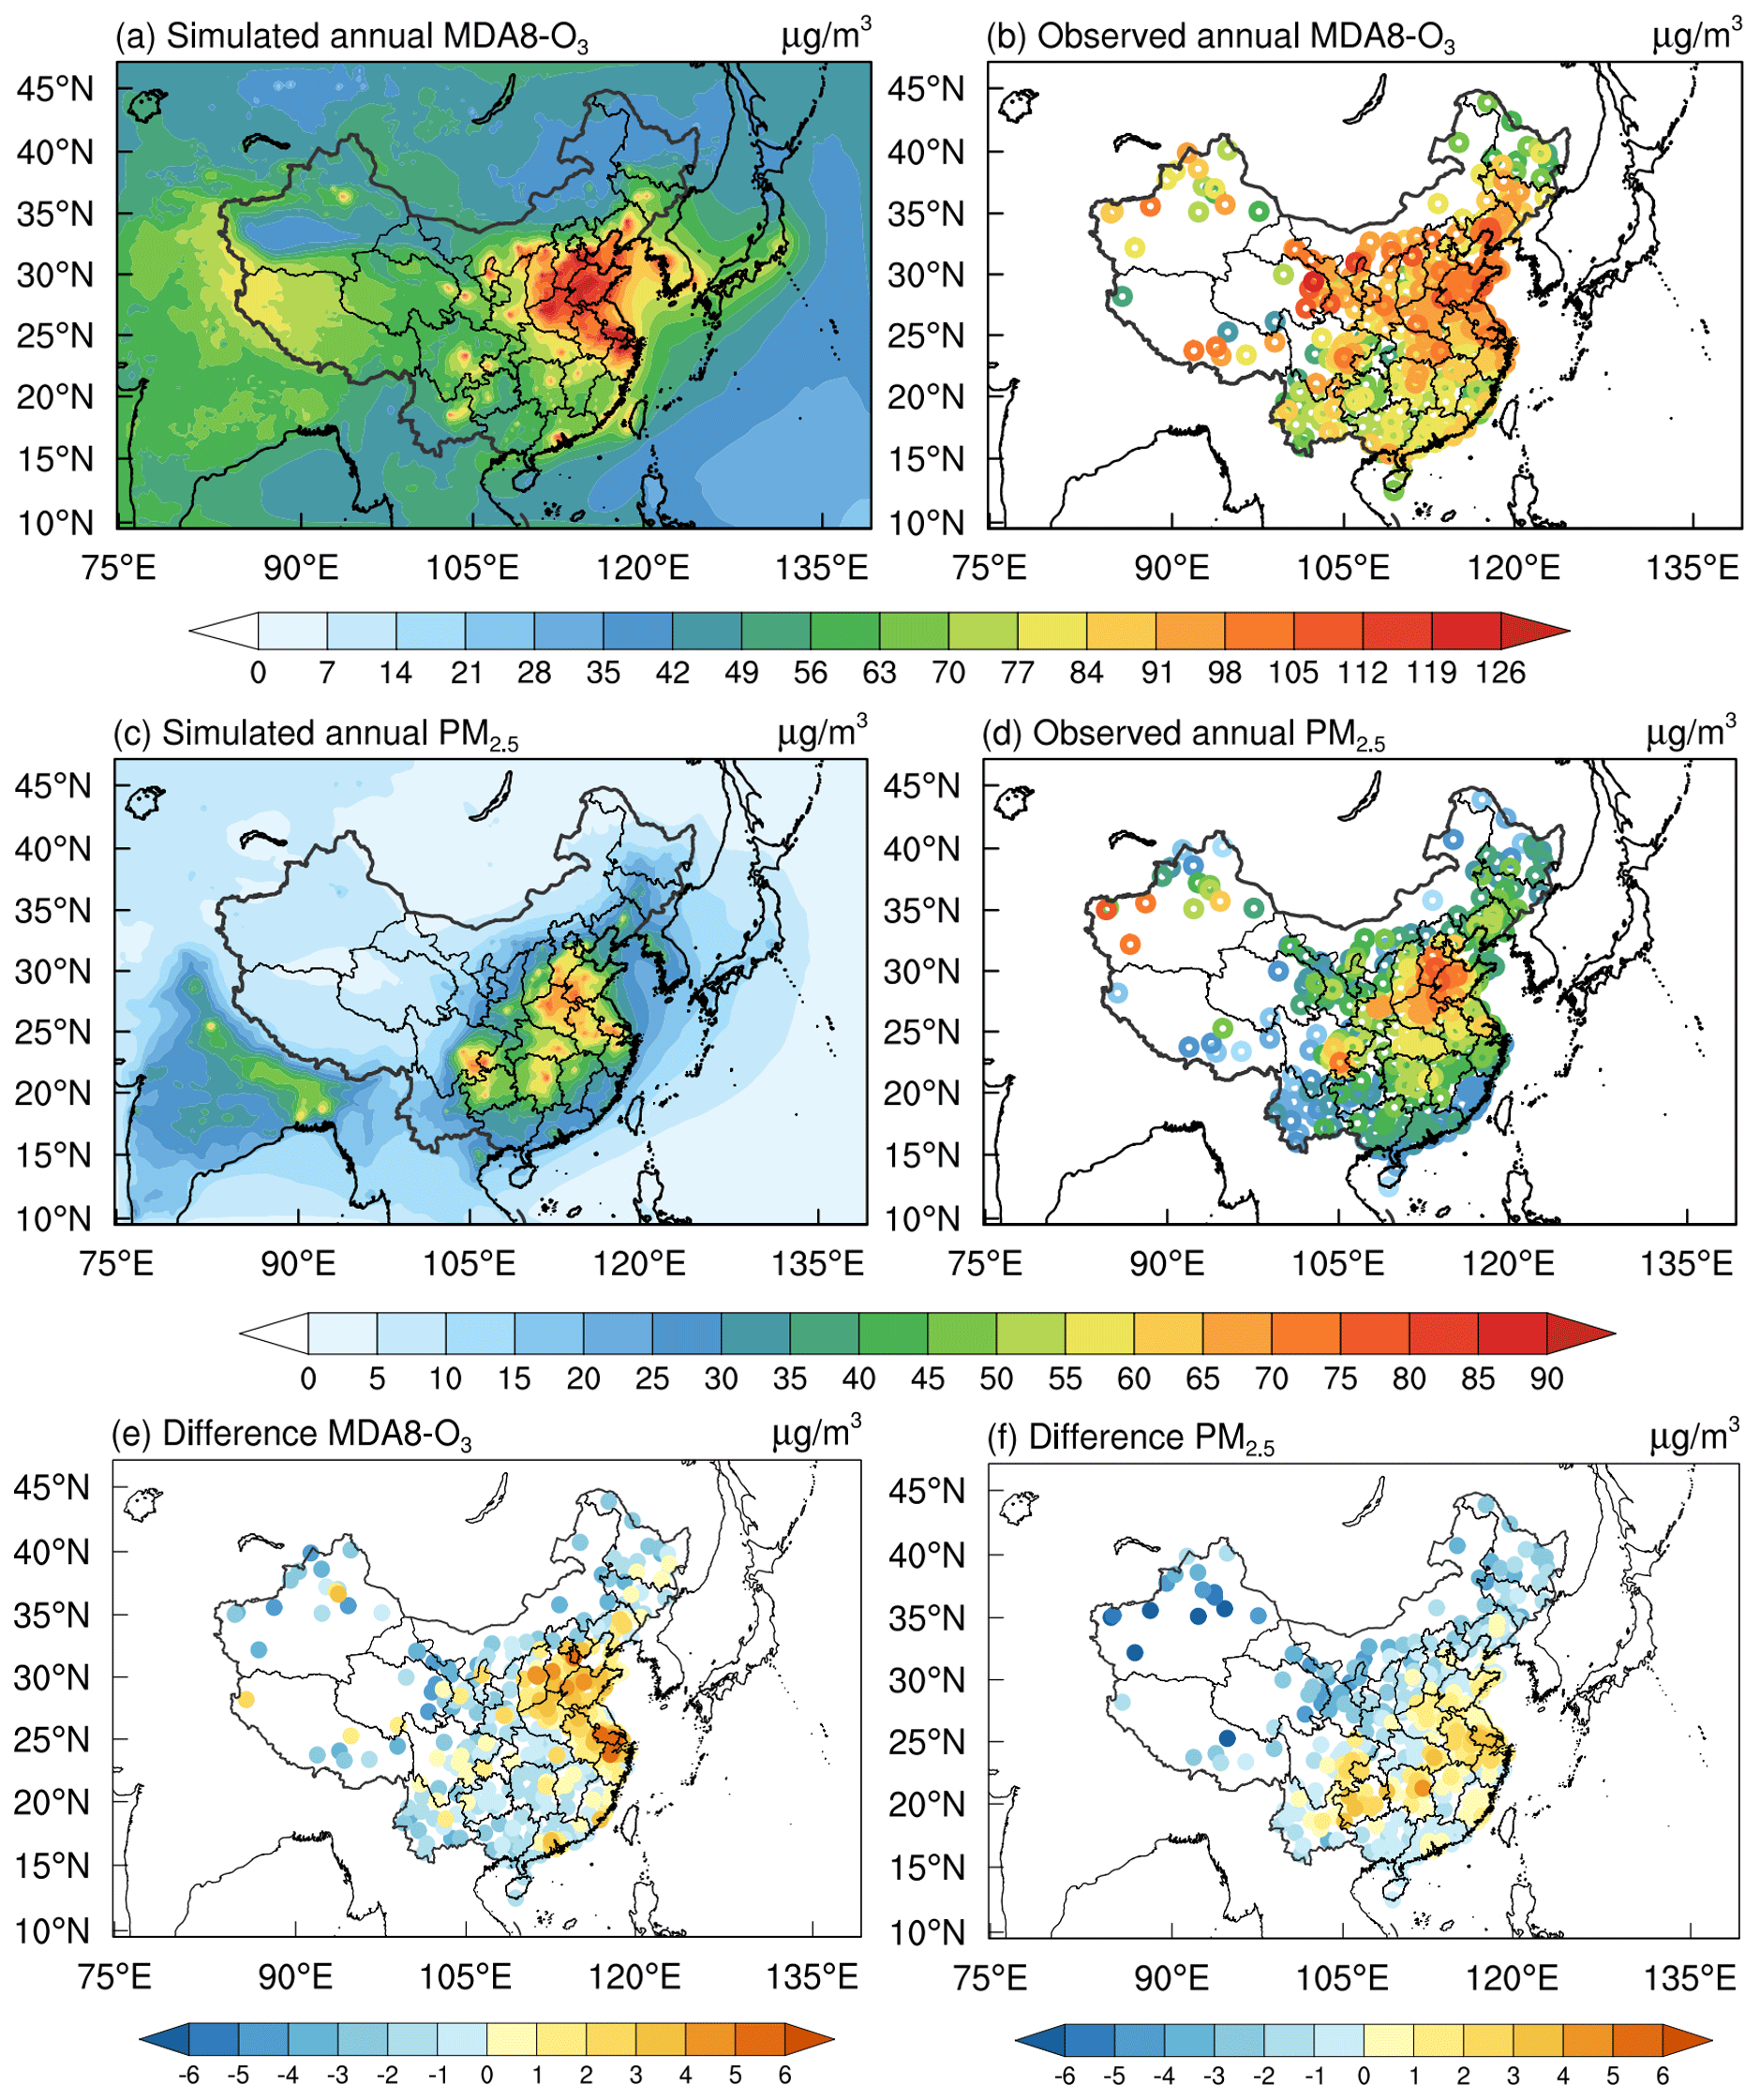
Figure 2Simulation and observation comparison of (a, b) O3 and (c, d) PM2.5 and their differences (e, f) in China. The differences are simulation minus observation. The colored circles in the figure represent station observations. Units: µg m−3
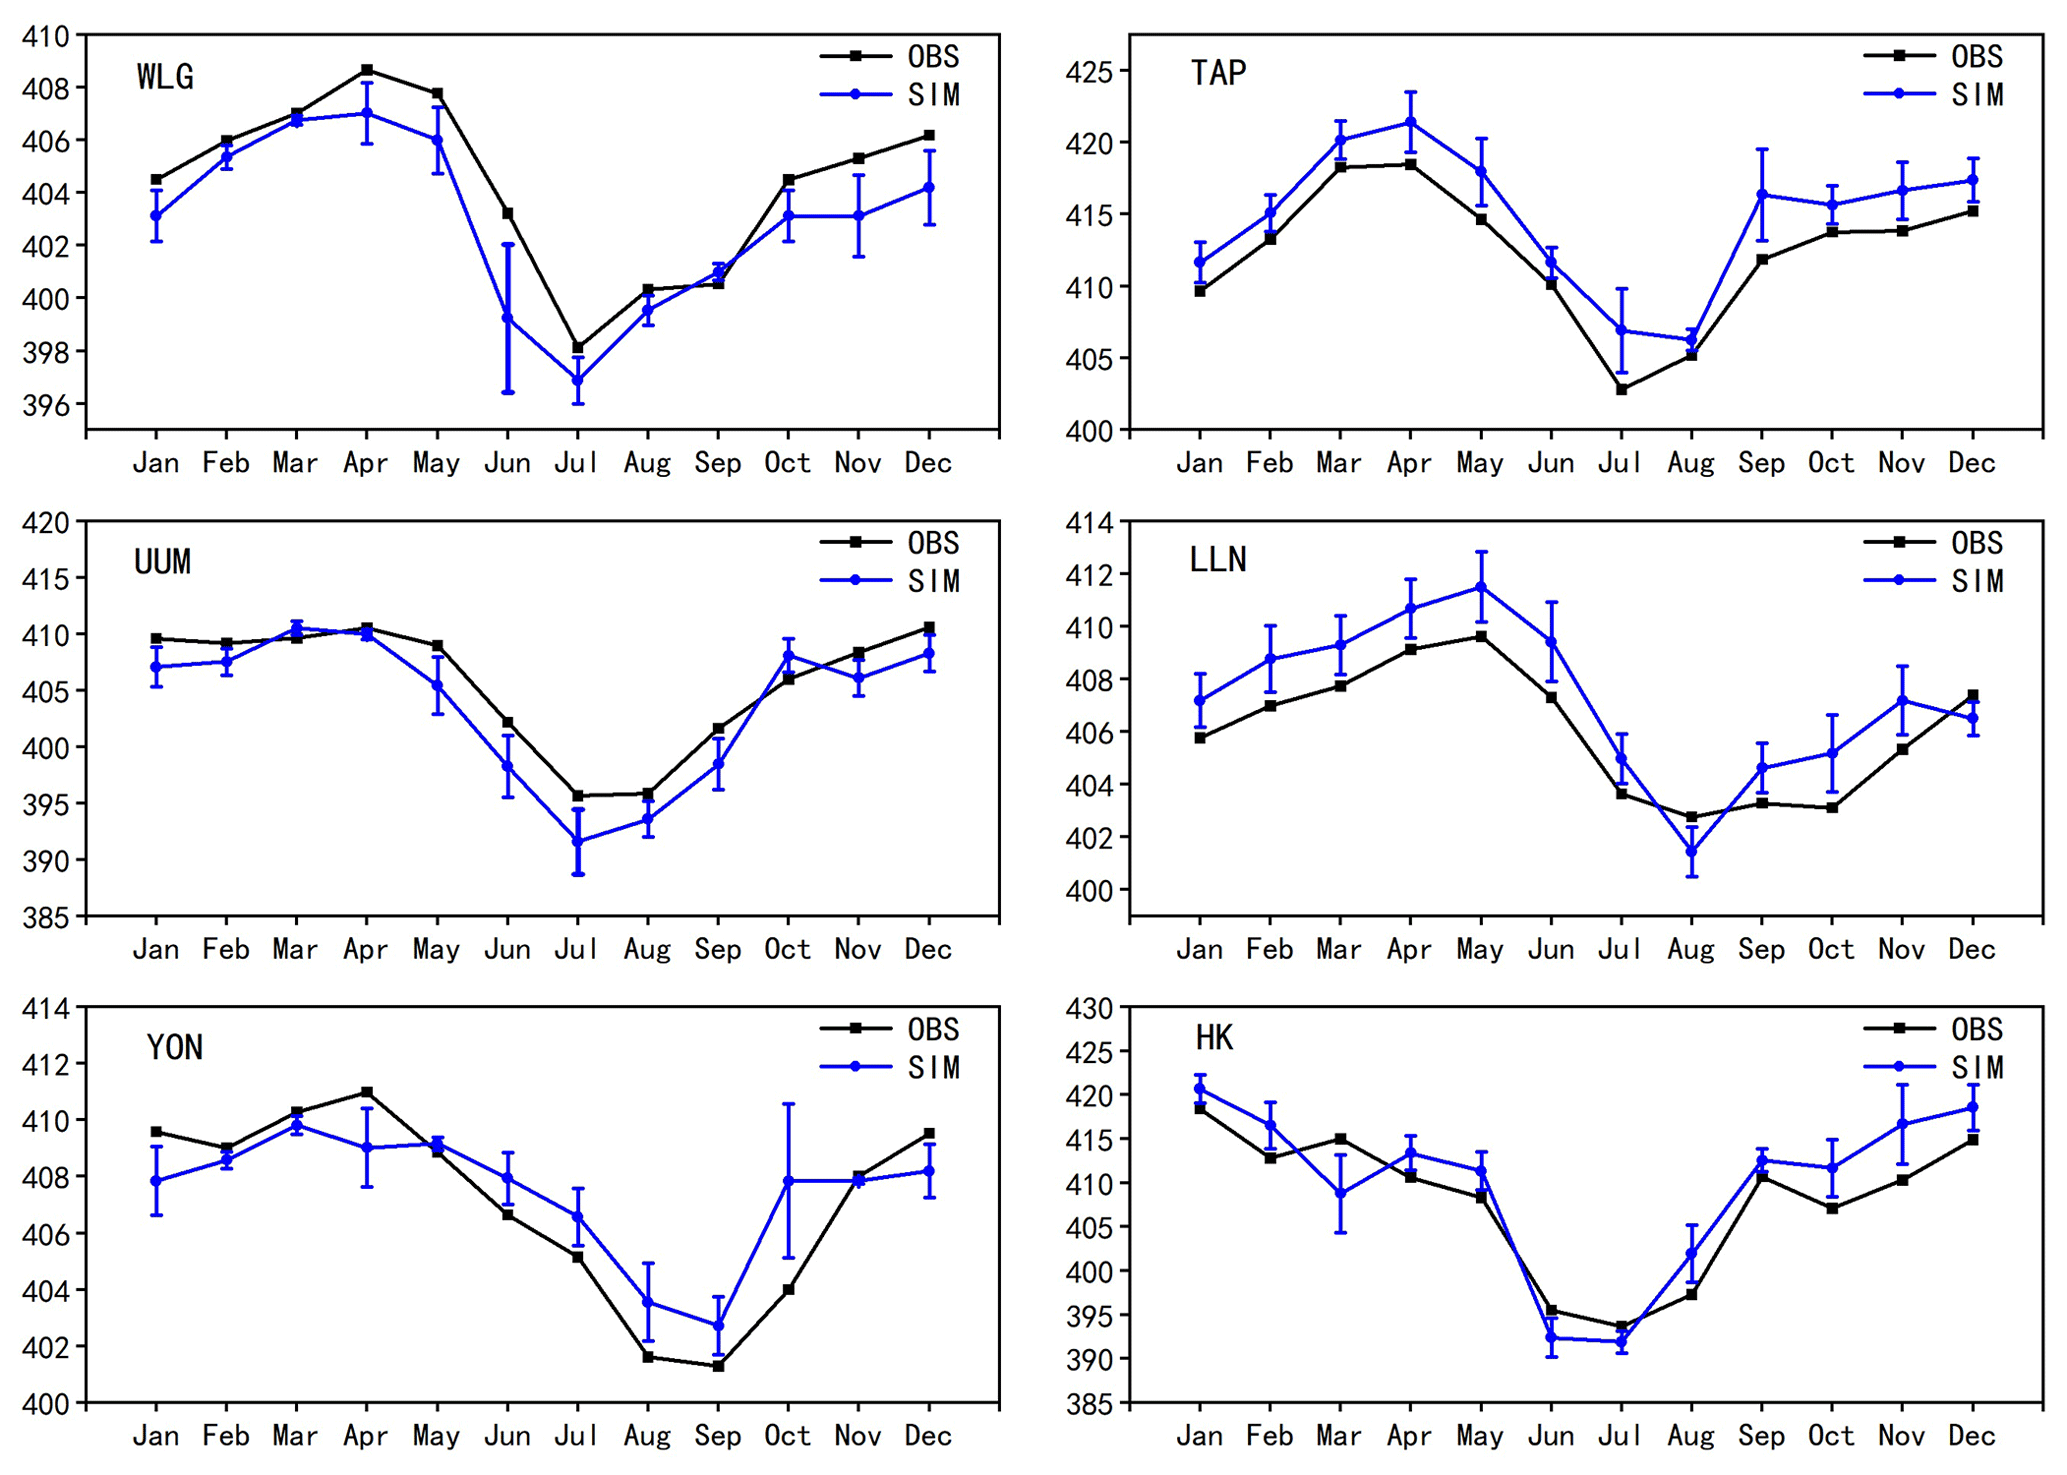
Figure 3Modeled (blue) and observed (black) monthly mean CO2 concentrations validated at six sites in East Asia. Units: ppm.
3.3 Simulations of PM2.5, O3, and CO2
In this section, we compare simulated PM2.5 and O3 concentrations against observational data from 366 stations provided by the China National Environmental Monitoring Centre (CNEMC). The geographical distribution of the simulated annual mean near-surface daily PM2.5 and maximum daily 8 h average (MDA8) O3 concentration, along with the observed values, are shown in Fig. 2. Figure S11 in the Supplement then compares the observation and simulation results in a scatterplot format. Both figures demonstrate that the model reproduces the spatial distribution patterns of PM2.5 and O3, with a significant agreement between modeled and measured values across all stations. The statistical indicators of simulated and measured surface PM2.5 and O3 levels are shown in Table S1, showing a correlation between simulation and observations of O3 and PM2.5 of 0.74 and 0.65, respectively. The simulated O3 concentrations are generally lower than observed in the Fenwei Plain of China, a discrepancy possibly attributable to uncertainties in the emission inventory for this region. In summary, the RegCM-Chem–YIBs model demonstrates a good ability to capture the spatial distribution of observed near-surface ozone and particulate matter, especially in highly polluted areas.
Measured and calculated monthly mean CO2 concentrations at six observation stations in East Asia from the World Data Centre for Greenhouse Gases (WDCGG) are shown in Fig. 3. Information on the six sites is listed in Table 2. The simulated CO2 concentration agrees well with observations, with correlation coefficients ranging from 0.89 to 0.97. However, in urban and coastal areas, the model performance deteriorates, likely due to local emission fluctuations and errors in biogenic fluxes. Nevertheless, the model overall captures the seasonal variations in CO2 concentrations (Fig. 3). This result likely stems from the complex relationship between biogenic and fossil fuel emissions, which are known contributors to observed seasonal CO2 patterns (Kou et al., 2015). A high CO2 mixing ratio (412.3 ppm) is observed at the TAP site, which is associated with strong local emissions. Further analysis into the specific sources contributing to elevated CO2 levels would provide valuable insights into localized patterns of emissions and their effects on regional carbon cycle processes. The model's ability to reproduce the geographical and seasonal CO2 patterns serves as an illustration of its ability to capture the main processes driving CO2 dynamics. In summary, while discrepancies in urban or coastal areas highlight the challenges associated with capturing localized CO2 dynamics, the model's overall performance and ability to reproduce geographical and seasonal CO2 patterns demonstrate its usefulness in studying CO2 dynamics at a regional scale.
Table 2Information on six CO2 stations in East Asia and statistical indicators of observed and modeled CO2.
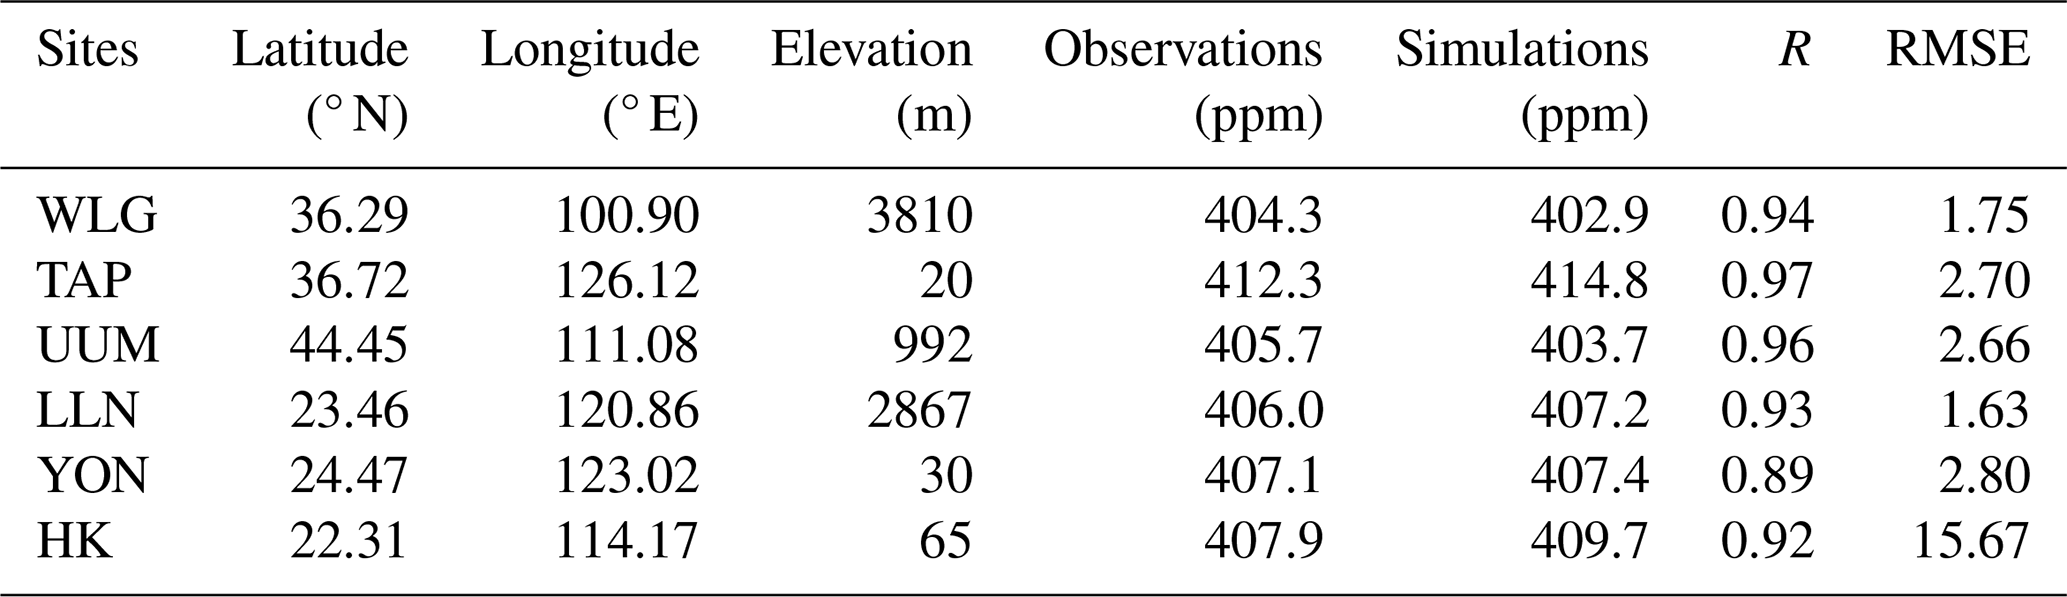
Correlation coefficient (R) and root mean square error (RMSE).
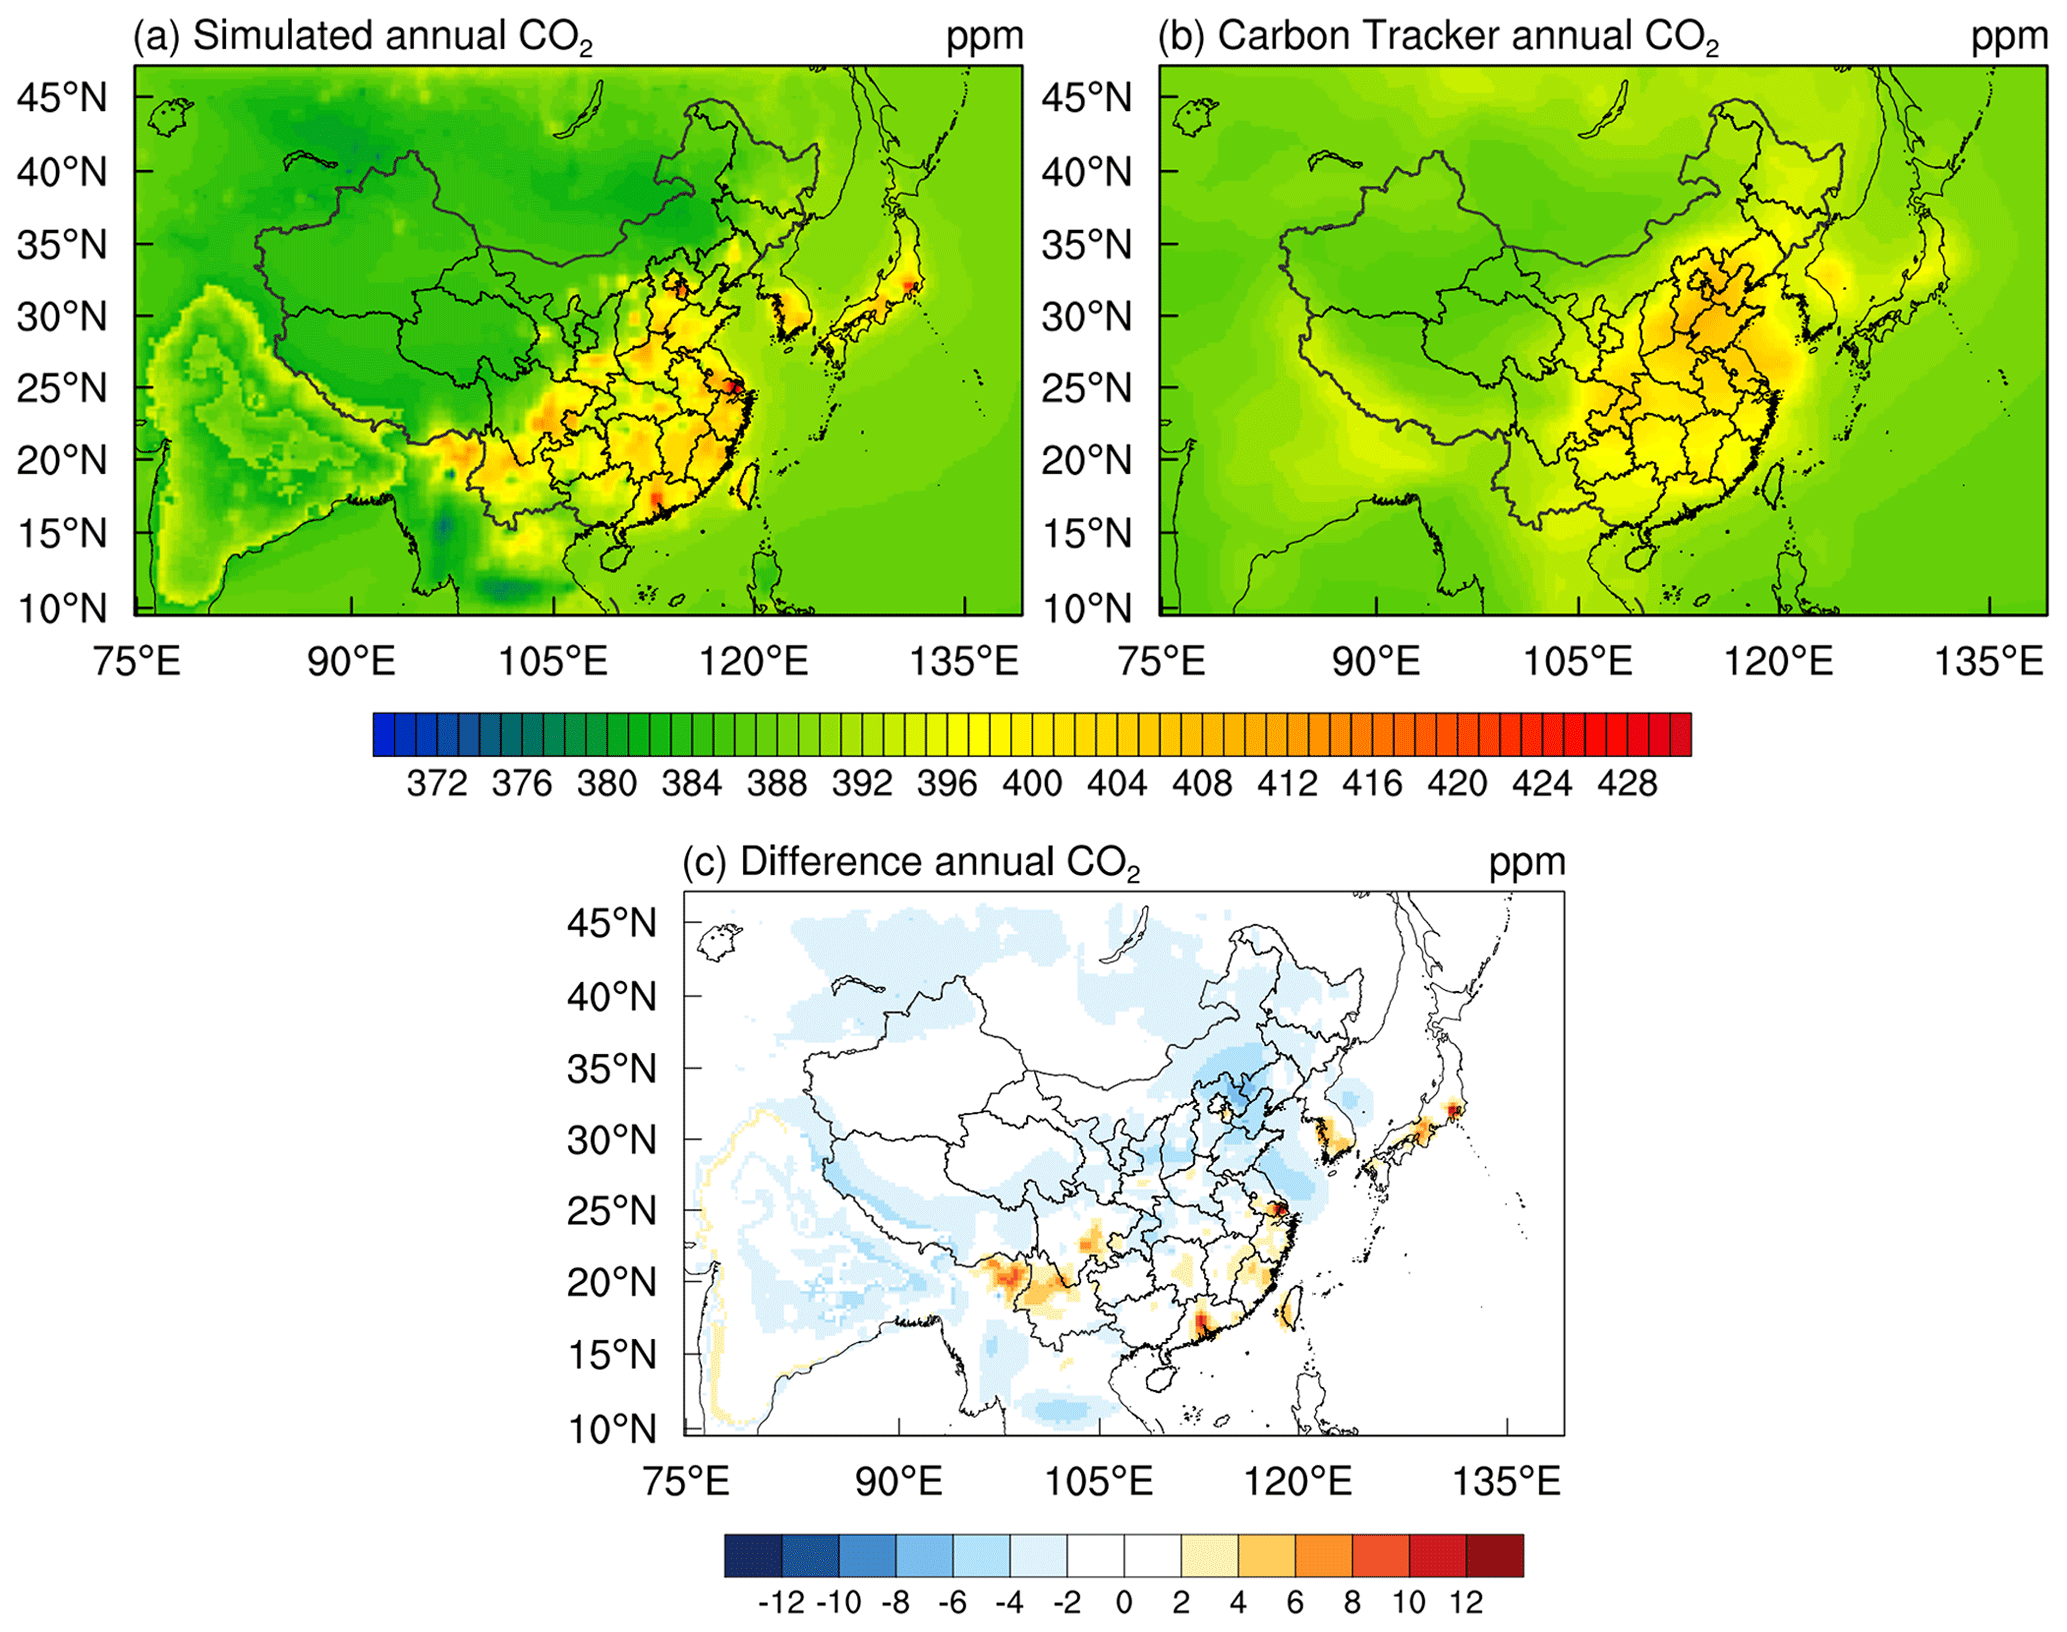
Figure 4Evaluation of simulated CO2 (a) and CO2 using CarbonTracker products (b) and their difference (c) in 2016. The differences are simulation minus observation. Units: ppm.
The limitations of ground-based CO2 observation stations, particularly their sparse spatial distribution, pose challenges in obtaining high-resolution CO2 data. To offset this limitation, data assimilation methods have been implemented to ensure a coherent global distribution of atmospheric CO2, effectively filling the void left by sparse ground-based observations. Here we utilize the CarbonTracker global carbon assimilation system developed by the NOAA Earth System Research Laboratory (ESRL) to validate the simulated CO2 concentrations (Peters et al., 2007). A comparison for the year 2016 is shown in Fig. 4. The simulated CO2 concentrations tend to be lower than observed in northeastern India and northeastern China, while they show a better agreement with observations in other regions. These discrepancies can be traced back to factors such as the underestimation of localized CO2 emissions along with the effects of complex topography and circulation patterns. However, the closer agreement in other regions suggests that the model effectively captures the primary processes driving CO2 concentrations.
Seasonal variations in the spatial distribution of CO2 concentrations for 2016 are illustrated in Fig. S12 in the Supplement. The simulations show marked seasonal variations, with elevated concentrations in spring and autumn and lower values during summer. In northern regions, including Russia, Mongolia, and northeast China, the lowest near-surface CO2 concentrations occur in summer. This pattern can be attributed to the enhanced photosynthetic activity of terrestrial vegetation in summer, leading to enhanced atmospheric CO2 sequestration. Conversely, winter months are characterized by lower solar radiation fluxes and reduced vegetation photosynthesis, resulting in relatively high CO2 concentrations. In specific regions, notably the eastern coastal zones of China and South Korea, the seasonal pattern of CO2 concentration is reduced, likely because of the high levels of urbanization, dense population, and intense anthropogenic emissions in these areas. In contrast, regions such as Yunnan, the southern side of the Qinghai–Tibet Plateau, and Southeast Asia exhibit consistently low CO2 concentrations during summer because of significant vegetation sinks in these densely vegetated areas. An increase in CO2 concentrations can be observed over these regions during spring due to local forest fires and straw-burning processes, which release substantial amounts of CO2 into the atmosphere (Chuang et al., 2014).
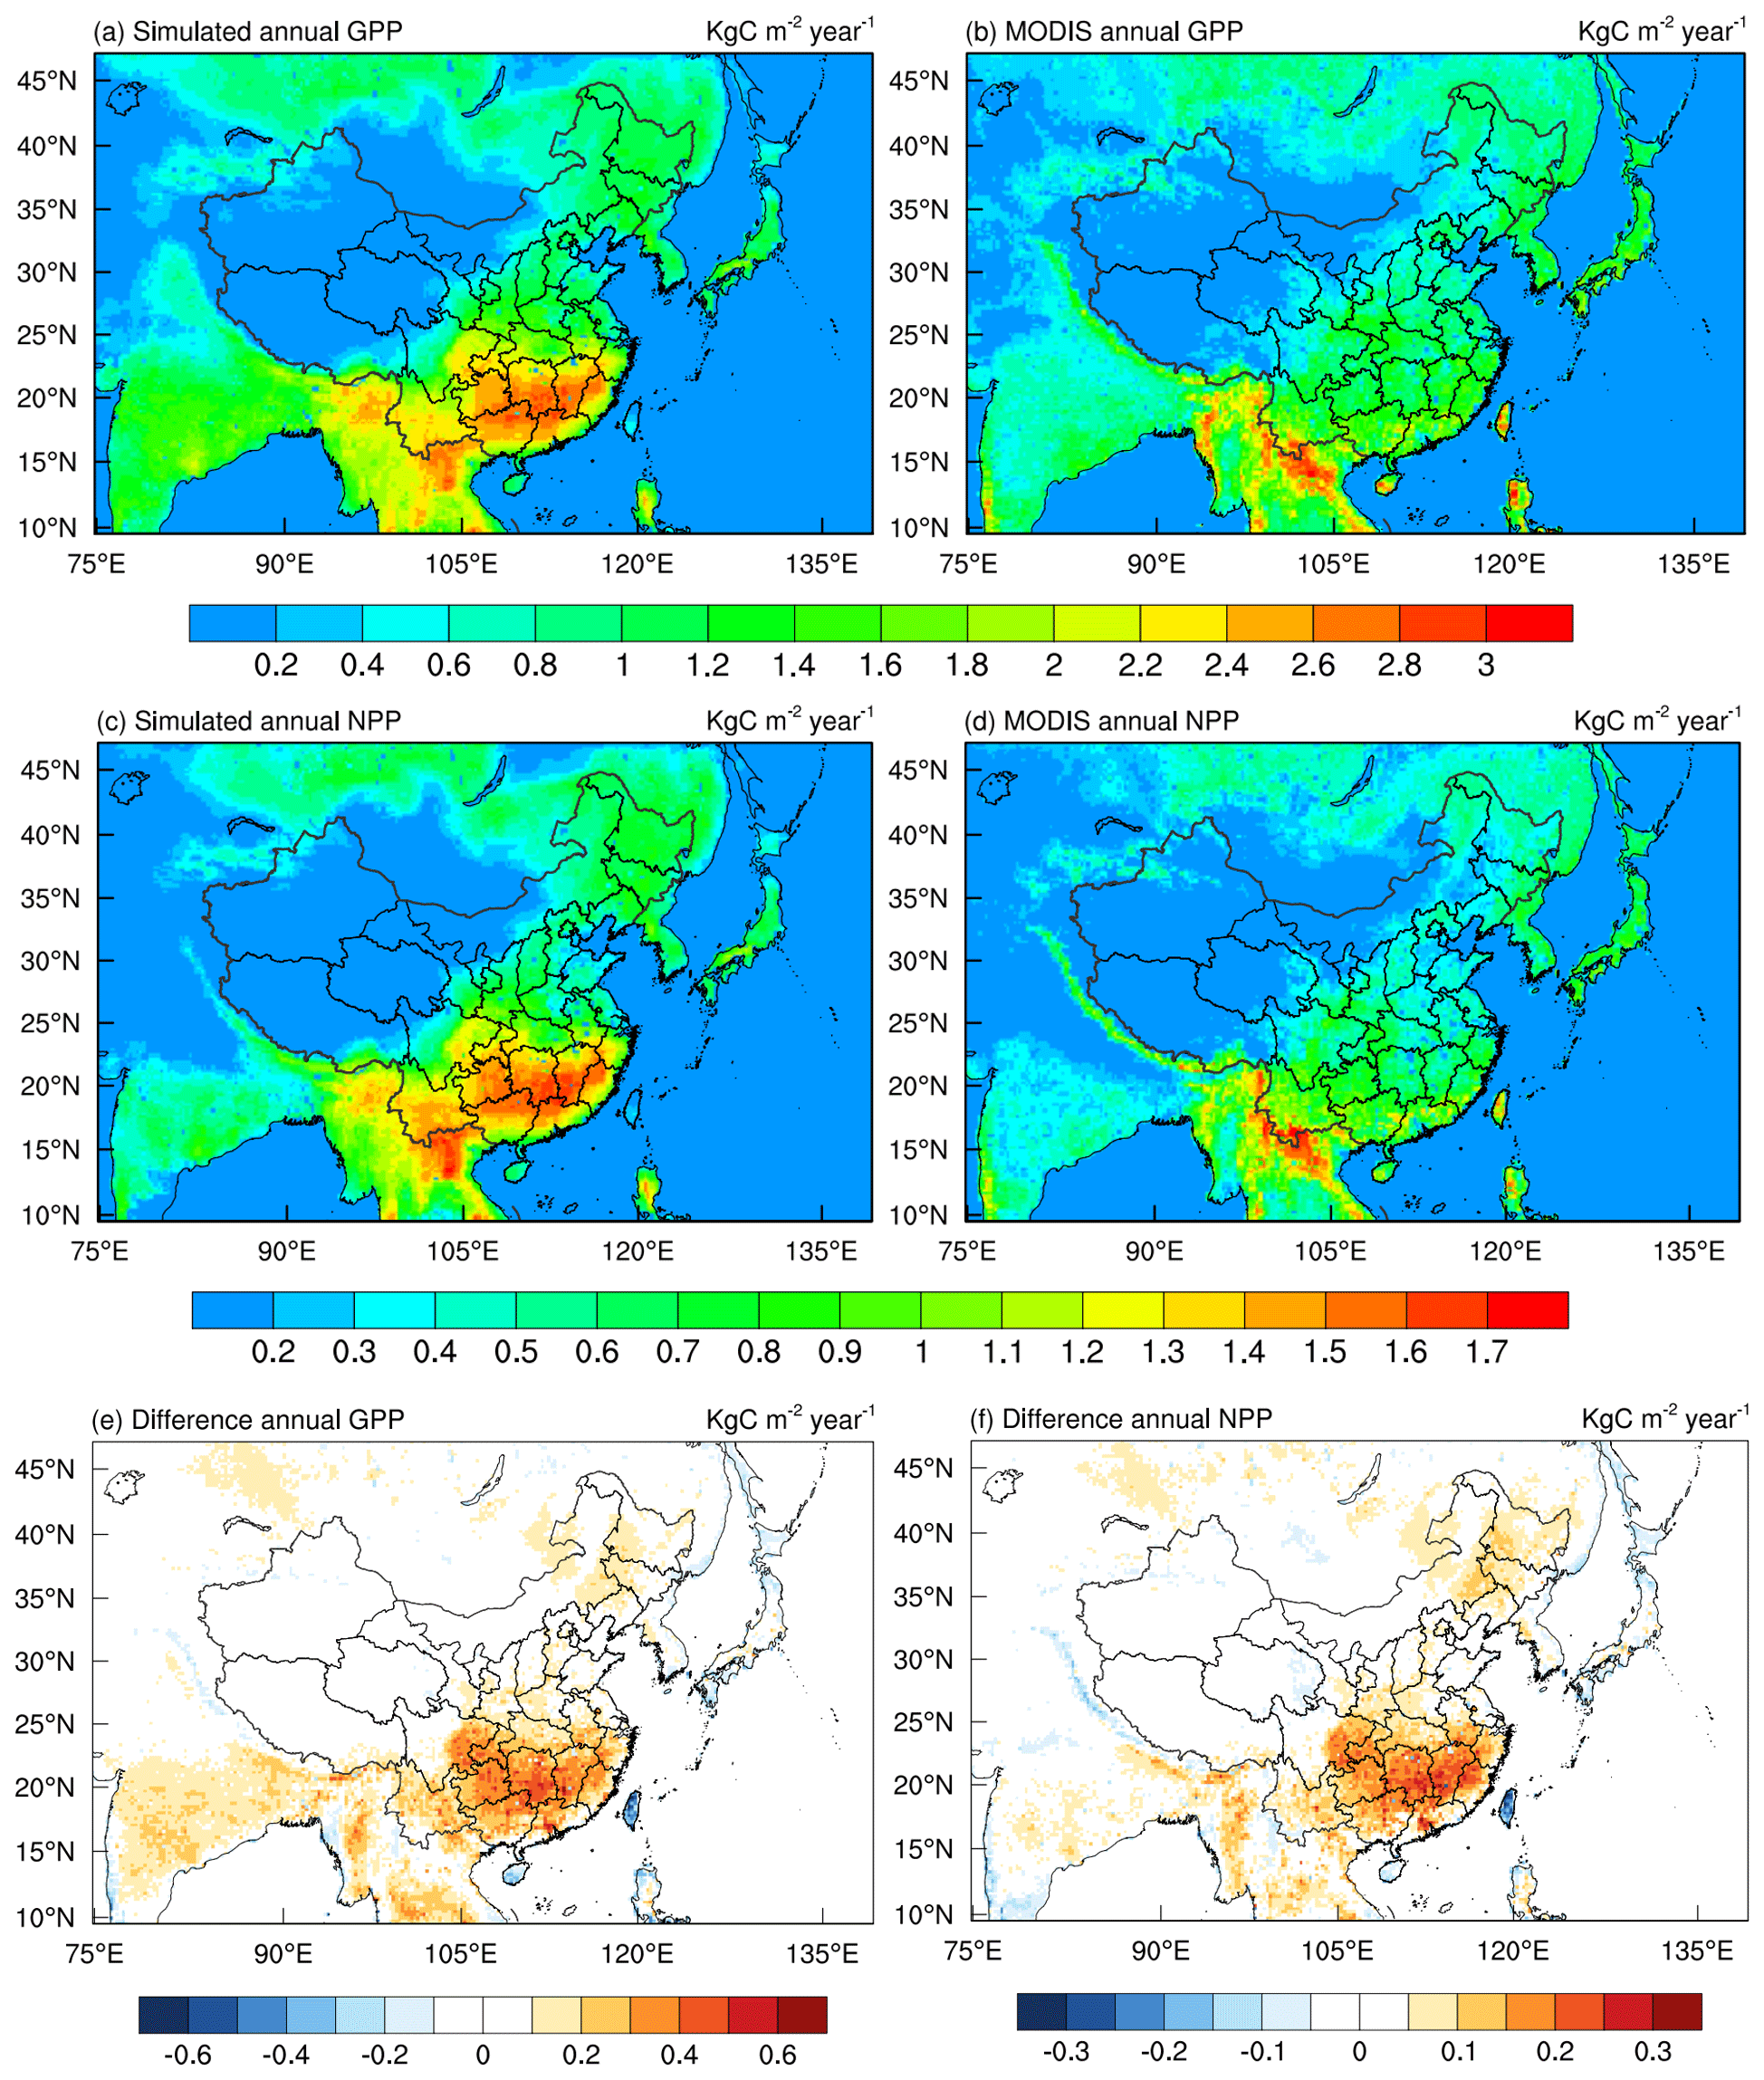
Figure 5Spatial distribution of modeled (a, c) and MODIS (b, d) annual mean GPP (a, b) and NPP (c, d) and their differences (e, f). The differences are simulation minus observation. Units: kg C m−2 yr−1.
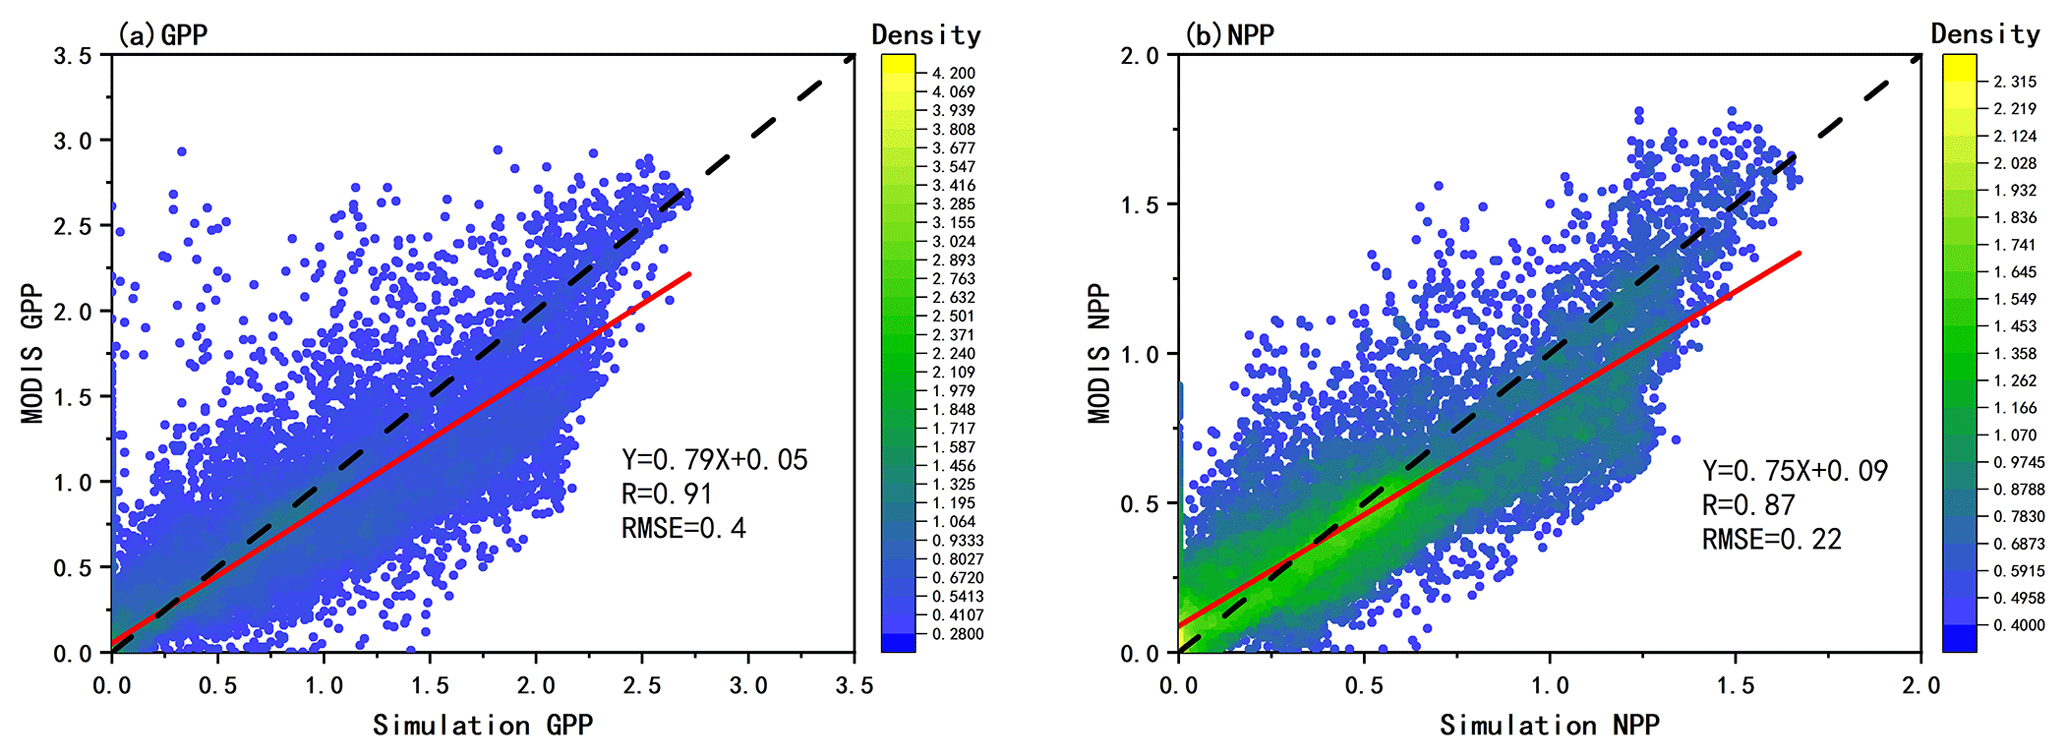
Figure 6Density scatterplots of (a) GPP and (b) NPP for model simulations and inversion-based products for 2016. Units: kg C m−2 yr−1.
3.4 Simulations of carbon fluxes in terrestrial systems
Our assessment of gross primary productivity (GPP) and net primary productivity (NPP) uses MOD17A3 Collection 6, a global product originating from MODIS satellite observations. GPP data include 8 d values with a resolution of 500 m, as produced in MOD17A2H Version 6 based on radiation use efficiency theory. Such data can be used as input to computations of terrestrial carbon and energy flows, water cycling processes, and vegetation biogeochemistry. Moreover, the MOD17A3H Version 6 product provides information on annual NPP, also on a resolution of 500 m. All 8 d net photosynthesis (PSN) products (MOD17A2H) from a particular year are combined to derive annual NPP values (He et al., 2018; Madani et al., 2014; Running, 2012).
Figure 5a, b, and e show the geographical distribution of the mean GPP in 2016 from the model simulations and MODIS products. RegCM-Chem–YIBs effectively captures the observed spatial GPP features, with high values mostly over southwest, central, and southeastern China, areas characterized by deciduous broad-leaf and evergreen coniferous forests (Fig. S1). The annual average GPP simulated by RegCM-Chem–YIBs is higher than observed over southwest and central China by 6.8 % and 12.7 %, respectively. The annual average simulated GPP over China is 6.18 Pg C yr−1, which is about 7.56 % higher than the GPP in MODIS.
Figure 6a and Table S2 show the scatterplots and statistics of the simulated annual average GPP at each model grid point compared with MODIS. A correlation coefficient of 0.91 and root mean square error of 0.4 kg C m−2 yr−1 are found, reflecting an overall good simulation by the model. Compared with the results obtained from the NASA ModelE2-YIBs global model (Yue and Unger, 2017), the GPP value estimated here compares better with the MODIS product, which may also be attributed to the higher spatial resolution of the regional system. Moreover, our GPP results are also in line with earlier findings, such as from X. L. Li et al. (2013), who estimated an annual average GPP over China of 6.04 Pg C yr−1 based on the light energy utilization model EC-LUE.
Figure 5c, d, and f show the spatial distribution of mean NPP for both the simulations and MODIS products in 2016. NPP, similarly to GPP, exhibits a gradual reduction from southeast to northwest China. The scatterplot comparing the simulated and MODIS annual average NPP across the model grid is illustrated in Fig. 6b. According to Table S2, a correlation coefficient of 0.87 is found between the simulated and MODIS NPP, with a root mean square error of 0.22 kg C m−2 yr−1. Notably, the simulated NPP shows a distinct underestimation over regions with higher NPP values. Compared with the MODIS NPP data products, the annual average NPP simulated for the entire China region in 2016 is overestimated by approximately 8.64 %, mostly because of the model overestimate in central China (16.6 %).
Part of the reason for this result is the relatively simple treatment of the nitrogen deposition process in YIBs (Yue and Unger, 2015). On the other hand, some studies have noted that due to the limitations of driving data and algorithm parameters, the MODIS NPP products have some problems in China (X. L. Li et al., 2013). Furthermore, the NPP value estimated by the model over China is 3.21 Pg C yr−1, in line with the mean value (2.92±0.12 Pg C yr−1) found in 37 previous studies (Wang et al., 2017).
Figures 7 and 8 illustrate the seasonal fluctuations in GPP and NPP, as simulated for 2016 in East Asia. Both GPP and NPP present pronounced seasonal variations, with negligible values during winter and a strong peak in summer. The winter minimum is attributable to limiting environmental factors such as reduced solar radiation, lower temperatures, and suppressed photosynthetic activity by vegetation. Conversely, summer shows the highest GPP and NPP values due to extended daylight hours, increased solar radiation, and temperatures facilitating increased photosynthetic activity and vegetation metabolism.
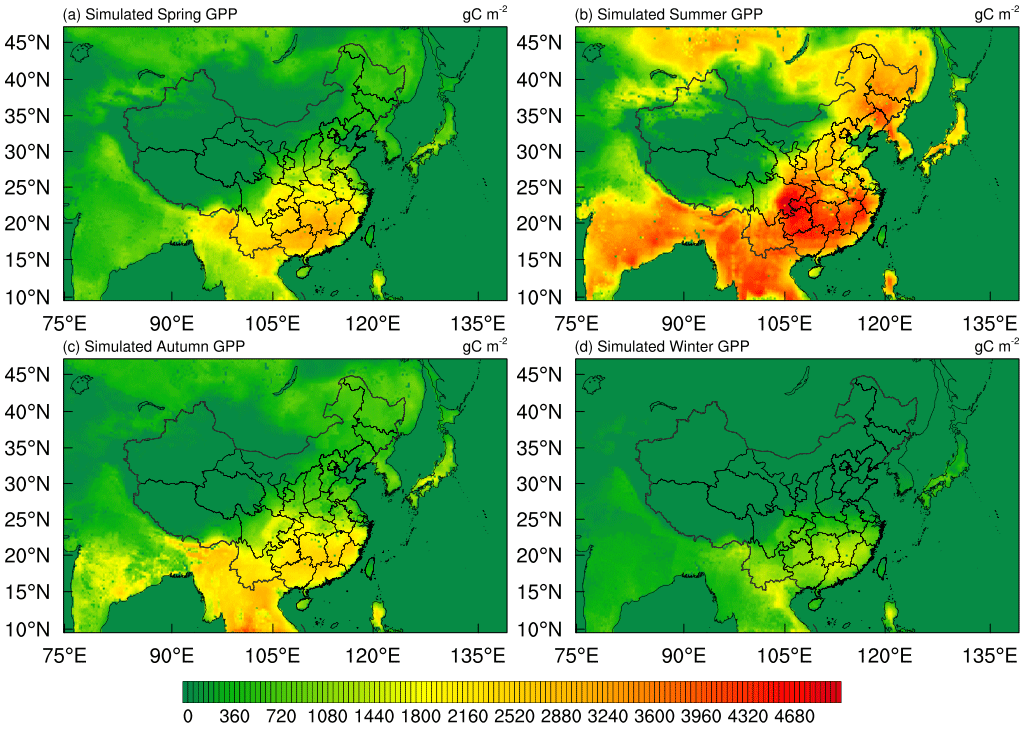
Figure 7Spatial distribution of GPP simulated by the models of spring (a), summer (b), autumn (c), and winter (d) in 2016. Units: g C m−2.
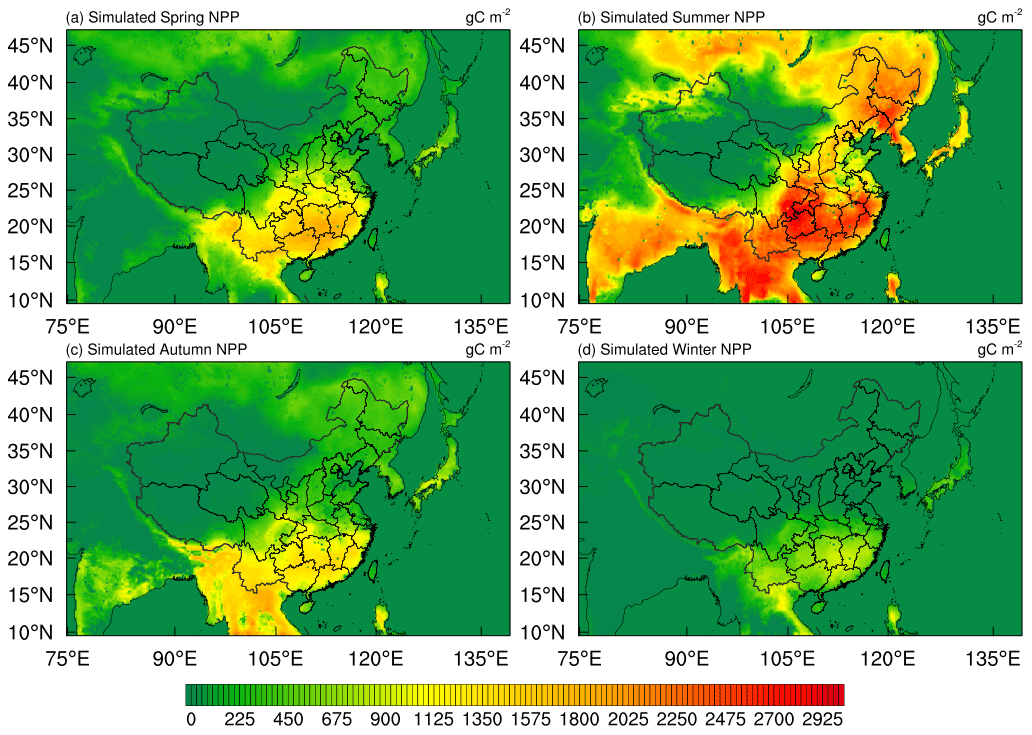
Figure 8Spatial distribution of NPP simulated by the models of spring (a), summer (b), autumn (c), and winter (d) in 2016. Units: g C m−2.
3.5 Simulations of other carbon-bearing species
The analysis of additional carbonaceous compounds such as BC, OC, and carbon monoxide (CO) is crucial due to their considerable influence on climate and the carbon cycle. The spatial distribution of simulated BC for each season of 2016 is shown in Fig. S13. BC concentrations are mainly centered in north China, central China, the Sichuan Basin, Chongqing, and northeast India, regions with a higher concentration of industrial and residential emission sources. BC displays a marked seasonal variation, with elevated levels in winter, possibly attributed to residential heating, more stagnant conditions, and reduced removal by precipitation.
Figure S14 then shows the spatial corresponding distribution of seasonal OC, which is also higher over north China, central China, Sichuan and Chongqing, and northeast India. Finally, Fig. S15 reports the annual mean near-surface CO concentrations for observations and simulation data across the monitoring sites in China. While simulated CO concentrations agree well spatially with observations, the simulations produce higher values than observed in central China, likely linked to uncertainties in emission inventories. Figure S16 presents the seasonal spatial distributions of CO, with simulated high values mostly localized in Sichuan–Chongqing and central China and a peak in winter.
Regional climate–chemistry coupled models can be used to study the characteristics of regional-scale climate and pollutants and are an important means to investigate the behavior of atmospheric pollutants and their radiative climate effects. However, current coupled regional climate models describe the physiological process of terrestrial vegetation relatively simply and do not consider the interaction between atmospheric pollutants (such as PM2.5 and O3) and CO2, as well as their impacts on terrestrial ecosystems.
To overcome this problem, in this work we coupled the YIBs biogeochemical model to the RegCM-CHEM regional climate–chemistry model and tested this coupled modeling system over a domain covering East Asia at a 30 km horizontal grid spacing for the year 2016. The model output was validated against reanalysis data, observational data, and satellite remote sensing data, for both the atmosphere and the carbon cycle.
Our simulations show that the coupled RegCM-Chem–YIBs system can effectively reproduce the spatio-temporal distribution of meteorological variables, atmospheric composition (PM2.5, O3, and CO2), and terrestrial carbon fluxes (GPP and NPP). Comparisons of the simulated temperature, longitudinal wind, latitudinal wind, and specific humidity for different seasons with the driving ERA-Interim reanalysis data showed correlation coefficients of 0.95–0.98, 0.71–0.97, 0.81–0.92, and 0.91–0.92, respectively. The correlation coefficients between observed and simulated O3 and PM2.5 levels in China were 0.74 and 0.65, respectively, while the corresponding correlations for CO2 were in the range of 0.89 to 0.97. Comparison of the ecological parameters GPP and NPP simulated in East Asia with the observed data showed correlation coefficients of 0.91 and 0.87, respectively. In addition, in all cases, the seasonal variation in the different variables was captured by the model. Therefore, we conclude that, overall, the RegCM-Chem–YIBs model demonstrates a good performance in simulating the spatio-temporal distribution characteristics of regional meteorological characteristics, atmospheric composition, and ecological parameters over East Asia.
In the future, we will continue to improve RegCM-Chem–YIBs in the following aspects. First, we will investigate the impact of CO2 and O3 inhomogeneity on radiation calculations by integrating temporally and spatially varying concentrations derived from YIBs and the Chem module into the RegCM radiation module. This will enable additional accurate computation of longwave radiation flux, improving the representation of the regional radiation balance. Second, we intend to assimilate a module representing various chemical transformations happening on the surfaces of aerosol particles. Finally, we will include the wet removal process of O3. These advancements will contribute to the refinement of RegCM-Chem–YIBs, enhancing our ability to investigate the interactions between the regional atmosphere, the carbon cycle, and vegetation processes.
The RegCM-Chem source code can be obtained from https://github.com/ICTP/RegCM (Giorgi et al., 2012). The YIBs model code is available at https://github.com/YIBS01/YIBs_site (Yue and Unger, 2015). The input data and source code for RegCM-Chem–YIBs have been archived on Zenodo at https://doi.org/10.5281/zenodo.8186164 (Xie et al., 2023). The CarbonTracker data are provided at https://doi.org/10.25925/20201008 (Jacobson et al., 2020). The CERES surface radiation data are available at https://doi.org/10.5067/TERRA+AQUA/CERES/SYN1DEGMON TH_L3.004A (NASA/LARC/SD/ASDC, 2017). WDCGG data are available at https://doi.org/10.15138/wkgj-f215 (Lan, 2023). CNEMC data are provided at https://doi.org/10.5281/zenodo.10792015 (Xie, 2024). MODIS data are available at https://doi.org/10.5067/MODIS/MOD17A2H.006 (Running et al., 2015).
The supplement related to this article is available online at: https://doi.org/10.5194/gmd-17-3259-2024-supplement.
TW led the development of RegCM-Chem–YIBs with significant contributions from NX and XX. NX performed the evaluation. NX and TW drafted the manuscript, and all authors contributed to the review and editing of the manuscript.
The contact author has declared that none of the authors has any competing interests.
Publisher’s note: Copernicus Publications remains neutral with regard to jurisdictional claims made in the text, published maps, institutional affiliations, or any other geographical representation in this paper. While Copernicus Publications makes every effort to include appropriate place names, the final responsibility lies with the authors.
We would like to acknowledge the anthropogenic emission inventory support from Tsinghua University and the observed data from the China National Environmental Monitoring Center. We are grateful to NASA and NOAA for providing the crucial MODIS data on GPP and NPP. We also gratefully acknowledge a wide range of other institutional partners.
This work was supported by the National Natural Science Foundation of China (grant no. 42077192), the National Key Basic Research and Development Program of China (grant no. 2020YFA0607802), the creative talent exchange program for foreign experts in the Belt and Road countries, and the Emory University–Nanjing University Collaborative Research Grant.
This paper was edited by Andrea Stenke and reviewed by two anonymous referees.
Ahlstrom, A., Raupach, M. R., Schurgers, G., Smith, B., Arneth, A., Jung, M., Reichstein, M., Canadell, J. G., Friedlingstein, P., Jain, A. K., Kato, E., Poulter, B., Sitch, S., Stocker, B. D., Viovy, N., Wang, Y. P., Wiltshire, A., Zaehle, S., and Zeng, N.: The dominant role of semi-arid ecosystems in the trend and variability of the land CO2 sink, Science, 348, 895–899, https://doi.org/10.1126/science.aaa1668, 2015.
Ainsworth, E. A., Yendrek, C. R., Sitch, S., Collins, W. J., and Emberson, L. D.: The Effects of Tropospheric Ozone on Net Primary Productivity and Implications for Climate Change, Annu. Rev. Plant Biol., 63, 637–661, https://doi.org/10.1146/annurev-arplant-042110-103829, 2012.
Artale, V., Calmanti, S., Carillo, A., Dell'Aquila, A., Herrmann, M., Pisacane, G., Ruti, P. M., Sannino, G., Struglia, M. V., Giorgi, F., Bi, X., Pal, J. S., Rauscher, S., and Grp, P.: An atmosphere-ocean regional climate model for the Mediterranean area: assessment of a present climate simulation, Clim. Dynam., 35, 721–740, https://doi.org/10.1007/s00382-009-0691-8, 2010.
Baklanov, A., Molina, L. T., and Gauss, M.: Megacities, air quality and climate, Atmos. Environ., 126, 235–249, https://doi.org/10.1016/j.atmosenv.2015.11.059, 2016.
Chang, J. S., Brost, R. A., Isaksen, I. S. A., Madronich, S., Middleton, P., Stockwell, W. R., and Walcek, C. J.: A three-dimensional Eulerian acid deposition model: Physical concepts and formulation, J. Geophys. Res.-Atmos., 92, 14681–14700, https://doi.org/10.1029/JD092iD12p14681, 1987.
Chuang, M. T., Lee, C. T., Chou, C. C. K., Lin, N. H., Sheu, G. R., Wang, J. L., Chang, S. C., Wang, S. H., Chi, K. H., Young, C. Y., Huang, H., Chen, H. W., Weng, G. H., Lai, S. Y., Hsu, S. P., Chang, Y. J., Chang, J. H., and Wu, X. C.: Carbonaceous aerosols in the air masses transported from Indochina to Taiwan: Long-term observation at Mt. Lulin, Atmos. Environ., 89, 507–516, https://doi.org/10.1016/j.atmosenv.2013.11.066, 2014.
Chutia, L., Ojha, N., Girach, I. A., Sahu, L. K., Alvarado, L. M. A., Burrows, J. P., Pathak, B., and Bhuyan, P. K.: Distribution of volatile organic compounds over Indian subcontinent during winter: WRF-chem simulation versus observations, Environ. Pollut., 252, 256–269, https://doi.org/10.1016/j.envpol.2019.05.097, 2019.
Collatz, G. J., Ball, J. T., Grivet, C., and Berry, J. A.: Physio-logical and Environmental-Regulation of Stomatal Conductance, Photosynthesis and Transpiration – a Model That Includes a Laminar Boundary-Layer, Agric. For. Meteorol., 54, 107–136, https://doi.org/10.1016/0168-1923(91)90002-8, 1991.
Coppola, E., Poulton, M., Charles, E., Dustman, J., and Szidarovszky, F.: Application of Artificial Neural Networks to Complex Groundwater Management Problems, Nat. Resour. Res., 12, 303–320, https://doi.org/10.1023/B:NARR.0000007808.11860.7e, 2003.
Dickinson, R. E., Errico, R. M., Giorgi, F., and Bates, G. T.: A Regional Climate Model for the Western United-States, Clim. Change, 15, 383–422, https://doi.org/10.1007/BF00240465, 1989.
Dunne, J. P., Horowitz, L. W., Adcroft, A. J., Ginoux, P., Held, I. M., John, J. G., Krasting, J. P., Malyshev, S., Naik, V., Paulot, F., Shevliakova, E., Stock, C. A., Zadeh, N., Balaji, V., Blanton, C., Dunne, K. A., Dupuis, C., Durachta, J., Dussin, R., Gauthier, P. P. G., Griffies, S. M., Guo, H., Hallberg, R. W., Harrison, M., He, J., Hurlin, W., McHugh, C., Menzel, R., Milly, P. C. D., Nikonov, S., Paynter, D. J., Ploshay, J., Radhakrishnan, A., Rand, K., Reichl, B. G., Robinson, T., Schwarzkopf, D. M., Sentman, L. T., Underwood, S., Vahlenkamp, H., Winton, M., Wittenberg, A. T., Wyman, B., Zeng, Y., and Zhao, M.: The GFDL Earth System Model Version 4.1 (GFDL-ESM 4.1): Overall Coupled Model Description and Simulation Characteristics, J. Adv. Model. Earth Syst., 12, e2019MS002015, https://doi.org/ARTNe2019MS00201510.1029/2019MS002015, 2020.
Emmons, L. K., Walters, S., Hess, P. G., Lamarque, J.-F., Pfister, G. G., Fillmore, D., Granier, C., Guenther, A., Kinnison, D., Laepple, T., Orlando, J., Tie, X., Tyndall, G., Wiedinmyer, C., Baughcum, S. L., and Kloster, S.: Description and evaluation of the Model for Ozone and Related chemical Tracers, version 4 (MOZART-4), Geosci. Model Dev., 3, 43–67, https://doi.org/10.5194/gmd-3-43-2010, 2010.
Farquhar, G. D., Caemmerer, S. V., and Berry, J. A.: A biochemical model of photosynthetic CO2 assimilation in leaves of C3 species, Planta, 149, 78–90, https://doi.org/10.1007/BF00386231, 1980.
Fiore, A. M., Naik, V., Spracklen, D. V., Steiner, A., Unger, N., Prather, M., Bergmann, D., Cameron-Smith, P. J., Cionni, I., Collins, W. J., Dalsoren, S., Eyring, V., Folberth, G. A., Ginoux, P. J., Cionni, I., Collins, W. J., Dalsoren, S., Eyring, V., Folberth, G. A., Ginoux, P., Horowitz, L. W., Josse, B., Lamarque, J. F., MacKenzie, I. A. Nagashima, T., O'Connor, F. M., Righi, M., Rumbold, S. T., Shindell, D. T., Skeie, R. B., Sudo, K., Szopa, S., Takemura, T., and Zeng, G.: Global air quality and climate, Chem. Soc. Rev., 41, 6663–6683, https://doi.org/10.1039/c2cs35095e, 2012.
Fiore, A. M., Naik, V., and Leibensperger, E. M.: Air Quality and Climate Connections, J. Air Waste Manage. Assoc., 65, 645–685, https://doi.org/10.1080/10962247.2015.1040526, 2015.
Forkel, M., Carvalhais, N., Rodenbeck, C., Keeling, R., Heimann, M., Thonicke, K., Zaehle, S., and Reichstein, M.: Enhanced seasonal CO2 exchange caused by amplified plant productivity in northern ecosystems, Science, 351, 696–699, https://doi.org/10.1126/science.aac4971, 2016.
Gao, Y. M., Zhuang, B. L., Wang, T. J., Chen, H. M., Li, S., Wei, W., Lin, H. J., and Li, M. M.: Climatic-Environmental Effects of Aerosols and Their Sensitivity to Aerosol Mixing States in East Asia in Winter, Remote Sens., 14, 3539, https://doi.org/10.3390/rs14153539, 2022.
Gery, M. W., Whitten, G. Z., Killus, J. P., and Dodge, M. C.: A Photochemical Kinetics Mechanism for Urban and Regional Scale Computer Modeling, J. Geophys. Res.-Atmos., 94, 12925–12956, https://doi.org/10.1029/JD094iD10p12925, 1989.
Giorgi, F.: Simulation of Regional Climate Using a Limited Area Model Nested in a General-Circulation Model, J. Climate, 3, 941–963, https://doi.org/10.1175/1520-0442(1990)003<0941:Sorcua>2.0.Co;2, 1990.
Giorgi, F. and Bates, G. T.: The Climatological Skill of a Regional Model over Complex Terrain, Mon. Weather Rev., 117, 2325–2347, https://doi.org/10.1175/1520-0493(1989)117<2325:TCSOAR>2.0.CO;2, 1989.
Giorgi, F. and Mearns, L. O.: Introduction to special section: Regional climate modeling revisited, J. Geophys. Res.-Atmos., 104, 6335–6352, https://doi.org/10.1029/98jd02072, 1999.
Giorgi, F., Marinucci, M. R., Bates, G. T., and Decanio, G.: Development of a Second-Generation Regional Climate Model (RegCM2). Part II: Convective Processes and Assimilation of Lateral Boundary Conditions, Mon. Weather Rev., 121, 2814–2832, https://doi.org/10.1175/1520-0493(1993)121<2814:Doasgr>2.0.Co;2, 1993.
Giorgi, F., Pal, J. S., Bi, X., Sloan, L., Elguindi, N., and Solmon, F.: Introduction to the TAC special issue: The RegCNET network, Theor. Appl. Climatol., 86, 1–4, https://doi.org/10.1007/s00704-005-0199-z, 2006.
Giorgi, F., Coppola, E., Solmon, F., Mariotti, L., Sylla, M. B., Bi, X., Elguindi, N., Diro, G. T., Nair, V., Giuliani, G., Turuncoglu, U. U., Cozzini, S., Guttler, I., O'Brien, T. A., Tawfik, A. B., Shalaby, A., Zakey, A. S., Steiner, A. L., Stordal, F., Sloan, L. C., and Brankovic, C.: RegCM4: model description and preliminary tests over multiple CORDEX domains, Clim. Res., 52, 7–29, https://doi.org/10.3354/cr01018, 2012.
Guenther, A., Hewitt, C. N., Erickson, D., Fall, R., Geron, C., Graedel, T., Harley, P., Klinger, L., Lerdau, M., Mckay, W. A., Pierce, T., Scholes, B., Steinbrecher, R., Tallamraju, R., Taylor, J., and Zimmerman, P.: A Global-Model of Natural Volatile Organic-Compound Emissions, J. Geophys. Res.-Atmos., 100, 8873–8892, https://doi.org/10.1029/94jd02950, 1995.
Han, Z. W., Li, J. W., Xia, X. G., and Zhang, R. J.: Investigation of direct radiative effects of aerosols in dust storm season over East Asia with an online coupled regional climate-chemistry-aerosol model, Atmos. Environ., 54, 688–699, https://doi.org/10.1016/j.atmosenv.2012.01.041, 2012.
Han, Z. W., Xie, Z. X., Wang, G. H., Zhang, R. J., and Tao, J.: Modeling organic aerosols over east China using a volatility basis-set approach with aging mechanism in a regional air quality model, Atmos. Environ., 124, 186–198, https://doi.org/10.1016/j.atmosenv.2015.05.045, 2016.
He, M. Z., Kimball, J. S., Maneta, M. P., Maxwell, B. D., Moreno, A., Begueria, S., and Wu, X. C.: Regional Crop Gross Primary Productivity and Yield Estimation Using Fused Landsat-MODIS Data, Remote Sens., 10, 372, https://doi.org/10.3390/rs10030372, 2018.
Hong, C. P., Zhang, Q., Zhang, Y., Davis, S. J., Tong, D., Zheng, Y. X., Liu, Z., Guan, D. B., He, K. B., and Schellnhuber, H. J.: Impacts of climate change on future air quality and human health in China, P. Natl. Acad. Sci. USA, 116, 17193–17200, https://doi.org/10.1073/pnas.1812881116, 2019.
Horowitz, L. W., Walters, S., Mauzerall, D. L., Emmons, L. K., Rasch, P. J., Granier, C., Tie, X. X., Lamarque, J. F., Schultz, M. G., Tyndall, G. S., Orlando, J. J., and Brasseur, G. P.: A global simulation of tropospheric ozone and related tracers: Description and evaluation of MOZART, version 2, J. Geophys. Res.-Atmos., 108, D24, https://doi.org/10.1029/2002jd002853, 2003.
Jacobson, A. R., Schuldt, K. N., Miller, J. B., Oda, T., Tans, P., Arlyn Andrews, Mund, J., Ott, L., Collatz, G. J., Aalto, T., Afshar, S., Aikin, K., Aoki, S., Apadula, F., Baier, B., Bergamaschi, P., Beyersdorf, A., Biraud, S. C., Bollenbacher, A., and Zimnoch, M.: CarbonTracker CT2019B, NOAA Global Monitoring Laboratory [data set], https://doi.org/10.25925/20201008, 2020.
Kan, H. D., Chen, R. J., and Tong, S. L.: Ambient air pollution, climate change, and population health in China, Environ. Int., 42, 10–19, https://doi.org/10.1016/j.envint.2011.03.003, 2012.
Kiehl, J. T., Hack, J. J., Bonan, G. B., Boville, B. A., Williamson, D. L., and Rasch, P. J.: The National Center for Atmospheric Research Community Climate Model: CCM3, J. Climate, 11, 1131–1149, https://doi.org/10.1175/1520-0442(1998)011<1131:Tncfar>2.0.Co;2, 1998.
Kim, K. H., Kabir, E., and Kabir, S.: A review on the human health impact of airborne particulate matter, Environ. Int., 74, 136–143, https://doi.org/10.1016/j.envint.2014.10.005, 2015.
Kou, X. X., Zhang, M. G., Peng, Z., and Wang, Y. H.: Assessment of the biospheric contribution to surface atmospheric CO2 concentrations over East Asia with a regional chemical transport model, Adv. Atmos. Sci., 32, 287–300, https://doi.org/10.1007/s00376-014-4059-6, 2015.
Lamarque, J.-F., Dentener, F., McConnell, J., Ro, C.-U., Shaw, M., Vet, R., Bergmann, D., Cameron-Smith, P., Dalsoren, S., Doherty, R., Faluvegi, G., Ghan, S. J., Josse, B., Lee, Y. H., MacKenzie, I. A., Plummer, D., Shindell, D. T., Skeie, R. B., Stevenson, D. S., Strode, S., Zeng, G., Curran, M., Dahl-Jensen, D., Das, S., Fritzsche, D., and Nolan, M.: Multi-model mean nitrogen and sulfur deposition from the Atmospheric Chemistry and Climate Model Intercomparison Project (ACCMIP): evaluation of historical and projected future changes, Atmos. Chem. Phys., 13, 7997–8018, https://doi.org/10.5194/acp-13-7997-2013, 2013.
Lan, X.: Atmospheric Carbon Dioxide Dry Air Mole Fractions from the NOAA GML Carbon Cycle Cooperative Global Air Sampling Network, 1968–2022, Version: 2023-08-28, NOAA Global Monitoring Laboratory Data Repository [data set], https://doi.org/10.15138/wkgj-f215, 2023.
Lawrence, P. J. and Chase, T. N.: Representing a new MODIS consistent land surface in the Community Land Model (CLM 3.0), J. Geophys. Res.-Biogeo., 112, G01023, https://doi.org/10.1029/2006jg000168, 2007.
Li, B., Gasser, T., Ciais, P., Piao, S., Tao, S., Balkanski, Y., Hauglustaine, D., Boisier, J.-P., Chen, Z., Huang, M., Li, L. Z., Li, Y., Liu, H., Liu, J., Peng, S., Shen, Z., Sun, Z., Wang, R., Wang, T., Yin, G., Yin, Y., Zeng, H., Zeng, Z., and Zhou, F.: The contribution of China's emissions to global climate forcing, Nature, 531, 357–361, https://doi.org/10.1038/nature17165, 2016.
Li, J. W., Han, Z. W., and Xie, Z. X.: Model analysis of long-term trends of aerosol concentrations and direct radiative forcings over East Asia, Tellus B, 65, 20410, https://doi.org/10.3402/tellusb.v65i0.20410, 2013.
Li, J. W., Han, Z. W., and Zhang, R. J.: Influence of aerosol hygroscopic growth parameterization on aerosol optical depth and direct radiative forcing over East Asia, Atmos. Res., 140, 14–27, https://doi.org/10.1016/j.atmosres.2014.01.013, 2014.
Li, M., Wang, T., Han, Y., Xie, M., Li, S., Zhuang, B., and Chen, P.: Modeling of a severe dust event and its impacts on ozone photochemistry over the downstream Nanjing megacity of eastern China, Atmos. Environ., 160, 107–123, https://doi.org/10.1016/j.atmosenv.2017.04.010, 2017a.
Li, M., Zhang, Q., Kurokawa, J.-I., Woo, J.-H., He, K., Lu, Z., Ohara, T., Song, Y., Streets, D. G., Carmichael, G. R., Cheng, Y., Hong, C., Huo, H., Jiang, X., Kang, S., Liu, F., Su, H., and Zheng, B.: MIX: a mosaic Asian anthropogenic emission inventory under the international collaboration framework of the MICS-Asia and HTAP, Atmos. Chem. Phys., 17, 935–963, https://doi.org/10.5194/acp-17-935-2017, 2017b.
Li, S., Wang, T. J., Zhuang, B. L., and Han, Y.: Indirect radiative forcing and climatic effect of the anthropogenic nitrate aerosol on regional climate of China, Adv. Atmos. Sci., 26, 543–552, https://doi.org/10.1007/s00376-009-0543-9, 2009.
Li, S., Wang, T. J., Solmon, F., Zhuang, B. L., Wu, H., Xie, M., Han, Y., and Wang, X. M.: Impact of aerosols on regional climate in southern and northern China during strong/weak East Asian summer monsoon years, J. Geophys. Res.-Atmos., 121, 4069–4081, https://doi.org/10.1002/2015jd023892, 2016.
Li, X. L., Liang, S. L., Yu, G. R., Yuan, W. P., Cheng, X., Xia, J. Z., Zhao, T. B., Feng, J. M., Ma, Z. G., Ma, M. G., Liu, S. M., Chen, J. Q., Shao, C. L., Li, S. G., Zhang, X. D., Zhang, Z. Q., Chen, S. P., Ohta, T., Varlagin, A., Miyata, A., Takagi, K., Saiqusa, N., and Kato, T.: Estimation of gross primary production over the terrestrial ecosystems in China, Ecol. Model., 261, 80–92, https://doi.org/10.1016/j.ecolmodel.2013.03.024, 2013.
Liu, L., Solmon, F., Vautard, R., Hamaoui-Laguel, L., Torma, C. Z., and Giorgi, F.: Ragweed pollen production and dispersion modelling within a regional climate system, calibration and application over Europe, Biogeosciences, 13, 2769–2786, https://doi.org/10.5194/bg-13-2769-2016, 2016.
Liu, Z., Deng, Z., He, G., Wang, H. L., Zhang, X., Lin, J., Qi, Y., and Liang, X.: Challenges and opportunities for carbon neutrality in China, Nat. Rev. Earth Env., 3, 141–155, https://doi.org/10.1038/s43017-021-00244-x, 2022.
Lu, X., Zhang, S. J., Xing, J., Wang, Y. J., Chen, W. H., Ding, D., Wu, Y., Wang, S. X., Duan, L., and Hao, J. M.: Progress of Air Pollution Control in China and Its Challenges and Opportunities in the Ecological Civilization Era, Engineering, 6, 1423–1431, https://doi.org/10.1016/j.eng.2020.03.014, 2020.
Lu, X. L., Chen, M., Liu, Y. L., Miralles, D. G., and Wang, F. M.: Enhanced water use efficiency in global terrestrial ecosystems under increasing aerosol loadings, Agric. For. Meteorol., 237, 39–49, https://doi.org/10.1016/j.agrformet.2017.02.002, 2017.
Ma, D., Wang, T., Wu, H., Qu, Y., Liu, J., Liu, J., Li, S., Zhuang, B., Li, M., and Xie, M.: The effect of anthropogenic emission, meteorological factors, and carbon dioxide on the surface ozone increase in China from 2008 to 2018 during the East Asia summer monsoon season, Atmos. Chem. Phys., 23, 6525–6544, https://doi.org/10.5194/acp-23-6525-2023, 2023a.
Ma, D. Y., Wang, T. J., Xu, B. Y., Song, R., Gao, L. B., Chen, H. M., Ren, X. J., Li, S., Zhuang, B. L., Li, M. M., Xie, M., and Saikawa, E.: The mutual interactions among ozone, fine particulate matter, and carbon dioxide on summer monsoon climate in East Asia, Atmos. Environ., 299, 119668, https://doi.org/10.1016/j.atmosenv.2023.119668, 2023b.
Madani, N., Kimball, J. S., Affleck, D. L. R., Kattge, J., Graham, J., van Bodegom, P. M., Reich, P. B., and Running, S. W.: Improving ecosystem productivity modeling through spatially explicit estimation of optimal light use efficiency, J. Geophys. Res.-Biogeo., 119, 1755–1769, https://doi.org/10.1002/2014jg002709, 2014.
Madronich, S. and Flocke, S.: The Role of Solar Radiation in Atmospheric Chemistry, in: Environmental Photochemistry, edited by: Boule, P., The Handbook of Environmental Chemistry, Springer Berlin Heidelberg, 1–26, https://doi.org/10.1007/978-3-540-69044-3_1, 1999.
NASA/LARC/SD/ASDC: CERES and GEO-Enhanced TOA, Within-Atmosphere and Surface Fluxes, Clouds and Aerosols Monthly Terra-Aqua Edition4A, NASA Langley Atmospheric Science Data Center DAAC [data set], https://doi.org/10.5067/TERRA+AQUA/CERES/SYN1DEGM ONTH_L3.004A, 2017.
Niinemets, Ü., Tenhunen, J. D., Harley, P. C., and Steinbrecher, R.: A model of isoprene emission based on energetic requirements for isoprene synthesis and leaf photosynthetic properties for Liquidambar and Quercus, Plant Cell Environ., 22, 1319–1335, https://doi.org/10.1046/j.1365-3040.1999.00505.x, 2002.
Oleson, K. W., Niu, G. Y., Yang, Z. L., Lawrence, D. M., Thornton, P. E., Lawrence, P. J., Stockli, R., Dickinson, R. E., Bonan, G. B., Levis, S., Dai, A., and Qian, T.: Improvements to the Community Land Model and their impact on the hydrological cycle, J. Geophys. Res.-Biogeo., 113, G01021, https://doi.org/10.1029/2007jg000563, 2008.
Pacifico, F., Harrison, S. P., Jones, C. D., Arneth, A., Sitch, S., Weedon, G. P., Barkley, M. P., Palmer, P. I., Serça, D., Potosnak, M., Fu, T.-M., Goldstein, A., Bai, J., and Schurgers, G.: Evaluation of a photosynthesis-based biogenic isoprene emission scheme in JULES and simulation of isoprene emissions under present-day climate conditions, Atmos. Chem. Phys., 11, 4371–4389, https://doi.org/10.5194/acp-11-4371-2011, 2011.
Pal, J. S., Giorgi, F., Bi, X. Q., Elguindi, N., Solmon, F., Gao, X. J., Rauscher, S. A., Francisco, R., Zakey, A., Winter, J., Ashfaq, M., Syed, F. S., Bell, J. L., Diffenbaugh, N. S., Karmacharya, J., Konare, A., Martinez, D., da Rocha, R. P., Sloan, L. C., and Steiner, A. L: Regional climate modeling for the developing world – The ICTP RegCM3 and RegCNET, B. Am. Meteorol. Soc., 88, 1395–1410, https://doi.org/10.1175/Bams-88-9-1395, 2007.
Peters, W., Jacobson, A. R., Sweeney, C., Andrews, A. E., Conway, T. J., Masarie, K., Miller, J. B., Bruhwiler, L. M. P., Petron, G., Hirsch, A. I., Worthy, D. E. J., van der Werf, G. R., Randerson, J. T., Wennberg, P. O., Krol, M. C., and Tans, P. P.: An atmospheric perspective on North American carbon dioxide exchange: CarbonTracker, P. Natl. Acad. Sci. USA, 104, 18925–18930, https://doi.org/10.1073/pnas.0708986104, 2007.
Pu, X., Wang, T. J., Huang, X., Melas, D., Zanis, P., Papanastasiou, D. K., and Poupkou, A.: Enhanced surface ozone during the heat wave of 2013 in Yangtze River Delta region, China, Sci. Total Environ., 603, 807–816, https://doi.org/10.1016/j.scitotenv.2017.03.056, 2017.
Reynolds, R. W., Rayner, N. A., Smith, T. M., Stokes, D. C., and Wang, W. Q.: An improved in situ and satellite SST analysis for climate, J. Climate, 15, 1609–1625, https://doi.org/10.1175/1520-0442(2002)015<1609:Aiisas>2.0.Co;2, 2002.
Running, S. W.: A Measurable Planetary Boundary for the Biosphere, Science, 337, 1458–1459, https://doi.org/10.1126/science.1227620, 2012.
Running, S., Mu, Q., Zhao, M.: MOD17A2H MODIS/Terra Gross Primary Productivity 8-Day L4 Global 500 m SIN Grid V006, NASA EOSDIS Land Processes Distributed Active Archive Center [data set], https://doi.org/10.5067/MODIS/MOD17A2H.006, 2015.
Scheuch, M., Hoper, D., and Beer, M.: RIEMS: a software pipeline for sensitive and comprehensive taxonomic classification of reads from metagenomics datasets, BMC Bioinf., 16, 69, https://doi.org/10.1186/s12859-015-0503-6, 2015.
Shalaby, A., Zakey, A. S., Tawfik, A. B., Solmon, F., Giorgi, F., Stordal, F., Sillman, S., Zaveri, R. A., and Steiner, A. L.: Implementation and evaluation of online gas-phase chemistry within a regional climate model (RegCM-CHEM4), Geosci. Model Dev., 5, 741–760, https://doi.org/10.5194/gmd-5-741-2012, 2012.
Shindell, D. T., Lamarque, J.-F., Schulz, M., Flanner, M., Jiao, C., Chin, M., Young, P. J., Lee, Y. H., Rotstayn, L., Mahowald, N., Milly, G., Faluvegi, G., Balkanski, Y., Collins, W. J., Conley, A. J., Dalsoren, S., Easter, R., Ghan, S., Horowitz, L., Liu, X., Myhre, G., Nagashima, T., Naik, V., Rumbold, S. T., Skeie, R., Sudo, K., Szopa, S., Takemura, T., Voulgarakis, A., Yoon, J.-H., and Lo, F.: Radiative forcing in the ACCMIP historical and future climate simulations, Atmos. Chem. Phys., 13, 2939–2974, https://doi.org/10.5194/acp-13-2939-2013, 2013.
Sitch, S., Cox, P. M., Collins, W. J., and Huntingford, C.: Indirect radiative forcing of climate change through ozone effects on the land-carbon sink, Nature, 448, 791–795, https://doi.org/10.1038/nature06059, 2007.
Slingo, A.: A Gcm Parameterization for the Shortwave Radiative Properties of Water Clouds, J. Atmos. Sci., 46, 1419–1427, https://doi.org/10.1175/1520-0469(1989)046<1419:Agpfts>2.0.Co;2, 1989.
Small, E. E., Sloan, L. C., Hostetler, S., and Giorgi, F.: Simulating the water balance of the Aral Sea with a coupled regional climate-lake model, J. Geophys. Res.-Atmos., 104, 6583–6602, https://doi.org/10.1029/98jd02348, 1999.
Solmon, F., Giorgi, F., and Liousse, C.: Aerosol modelling for regional climate studies: application to anthropogenic particles and evaluation over a European/African domain, Tellus B, 58, 51–72, https://doi.org/10.1111/j.1600-0889.2005.00155.x, 2006.
Solmon, F., Elguindi, N., and Mallet, M.: Radiative and climatic effects of dust over West Africa, as simulated by a regional climate model, Clim. Res., 52, 97–113, https://doi.org/10.3354/cr01039, 2012.
Spitters, C. J. T., Toussaint, H., and Goudriaan, J.: Separating the diffuse and direct component of global radiation and its implications for modeling canopy photosynthesis Part I. Components of incoming radiation, Agric. For. Meteorol., 38, 217–229, https://doi.org/10.1016/0168-1923(86)90060-2, 1986.
Strada, S. and Unger, N.: Potential sensitivity of photosynthesis and isoprene emission to direct radiative effects of atmospheric aerosol pollution, Atmos. Chem. Phys., 16, 4213–4234, https://doi.org/10.5194/acp-16-4213-2016, 2016.
Turuncoglu, U. U., Dalfes, N., Murphy, S., and DeLuca, C.: Toward self-describing and workflow integrated Earth system models: A coupled atmosphere-ocean modeling system application, Environ. Model. Software, 39, 247–262, https://doi.org/10.1016/j.envsoft.2012.02.013, 2013.
Wang, T., Xue, L. K., Brimblecombe, P., Lam, Y. F., Li, L., and Zhang, L.: Ozone pollution in China: A review of concentrations, meteorological influences, chemical precursors, and effects, Sci. Total Environ., 575, 1582–1596, https://doi.org/10.1016/j.scitotenv.2016.10.081, 2017.
Wang, T., Xie, M., Gao, L., and Yang, H.: Development and Preliminary Application of a Coupled Regional Climate-Chemistry Model System, J. Nanjing Univ., 40, 711–727, 2004.
Wang, T. J., Li, S., Shen, Y., Deng, J. J., and Xie, M.: Investigations on direct and indirect effect of nitrate on temperature and precipitation in China using a regional climate chemistry modeling system, J. Geophys. Res.-Atmos., 115, D00K26, https://doi.org/10.1029/2009jd013264, 2010.
Wang, T. J., Zhuang, B. L., Li, S., Liu, J., Xie, M., Yin, C. Q., Zhang, Y., Yuan, C., Zhu, J. L., Ji, L. Q., and Han, Y.: The interactions between anthropogenic aerosols and the East Asian summer monsoon using RegCCMS, J. Geophys. Res.-Atmos., 120, 5602–5621, https://doi.org/10.1002/2014jd022877, 2015.
Wesely, M. L.: Parameterization of Surface Resistances to Gaseous Dry Deposition in Regional-Scale Numerical-Models, Atmos. Environ., 23, 1293–1304, https://doi.org/10.1016/0004-6981(89)90153-4, 1989.
Wiedinmyer, C., Akagi, S. K., Yokelson, R. J., Emmons, L. K., Al-Saadi, J. A., Orlando, J. J., and Soja, A. J.: The Fire INventory from NCAR (FINN): a high resolution global model to estimate the emissions from open burning, Geosci. Model Dev., 4, 625–641, https://doi.org/10.5194/gmd-4-625-2011, 2011.
Xie, N., Wang, T., and Xie, X.: RegCM-Chem-YIBs: RegCM-Chem-YIBs_v1.0, Zenodo [code], https://doi.org/10.5281/zenodo.8186164, 2023.
Xie, N: CNEMC ozone and fine particulate matter site monitoring data, Zenodo [data set], https://doi.org/10.5281/zenodo.10792015, 2024.
Xie, X. D., Wang, T. J., Yue, X., Li, S., Zhuang, B. L., Wang, M. H., and Yang, X. Q.: Numerical modeling of ozone damage to plants and its effects on atmospheric CO2 in China, Atmos. Environ., 217, 116970, https://doi.org/10.1016/j.atmosenv.2019.116970, 2019.
Xie, X. D., Wang, T. J., Yue, X., Li, S., Zhuang, B. L., and Wang, M. H.: Effects of atmospheric aerosols on terrestrial carbon fluxes and CO2 concentrations in China, Atmos. Res., 237, 104859, https://doi.org/10.1016/j.atmosres.2020.104859, 2020.
Xiong, Z., Fu, C. B., and Yan, X. D.: Regional integrated environmental model system and its simulation of East Asia summer monsoon, Chin. Sci. Bull., 54, 4253–4261, https://doi.org/10.1007/s11434-009-0669-2, 2009.
Xu, B. Y., Wang, T. J., Ma, D. Y., Song, R., Zhang, M., Gao, L. B., Li, S., Zhuang, B. L., Li, M. M., and Xie, M.: Impacts of regional emission reduction and global climate change on air quality and temperature to attain carbon neutrality in China, Atmos. Res., 279, 106384, https://doi.org/10.1016/j.atmosres.2022.106384, 2022.
Xu, B. Y., Wang, T. J., Gao, L. B., Ma, D. Y., Song, R., Zhao, J., Yang, X. G., Li, S., Zhuang, B. L., Li, M. M., and Xie, M.: Impacts of meteorological factors and ozone variation on crop yields in China concerning carbon neutrality objectives in 2060, Environ. Pollut., 317, 120715, https://doi.org/10.1016/j.envpol.2022.120715, 2023.
Yahya, K., Wang, K., Campbell, P., Chen, Y., Glotfelty, T., He, J., Pirhalla, M., and Zhang, Y.: Decadal application of WRF/Chem for regional air quality and climate modeling over the U.S. under the representative concentration pathways scenarios. Part 1: Model evaluation and impact of downscaling, Atmos. Environ., 152, 562–583, https://doi.org/10.1016/j.atmosenv.2016.12.029, 2017.
Yin, C. Q., Wang, T. J., Solmon, F., Mallet, M., Jiang, F., Li, S., and Zhuang, B. L.: Assessment of direct radiative forcing due to secondary organic aerosol over China with a regional climate model, Tellus B, 67, 24634, https://doi.org/10.3402/tellusb.v67.24634, 2015.
Yin, J. F., Wang, D. H., Zhai, G. Q., and Xu, H. B.: An investigation into the relationship between liquid water content and cloud number concentration in the stratiform clouds over north China, Atmos. Res., 139, 137–143, https://doi.org/10.1016/j.atmosres.2013.12.004, 2014.
Young, P. J., Archibald, A. T., Bowman, K. W., Lamarque, J.-F., Naik, V., Stevenson, D. S., Tilmes, S., Voulgarakis, A., Wild, O., Bergmann, D., Cameron-Smith, P., Cionni, I., Collins, W. J., Dalsøren, S. B., Doherty, R. M., Eyring, V., Faluvegi, G., Horowitz, L. W., Josse, B., Lee, Y. H., MacKenzie, I. A., Nagashima, T., Plummer, D. A., Righi, M., Rumbold, S. T., Skeie, R. B., Shindell, D. T., Strode, S. A., Sudo, K., Szopa, S., and Zeng, G.: Pre-industrial to end 21st century projections of tropospheric ozone from the Atmospheric Chemistry and Climate Model Intercomparison Project (ACCMIP), Atmos. Chem. Phys., 13, 2063–2090, https://doi.org/10.5194/acp-13-2063-2013, 2013.
Yue, X. and Unger, N.: The Yale Interactive terrestrial Biosphere model version 1.0: description, evaluation and implementation into NASA GISS ModelE2, Geosci. Model Dev., 8, 2399–2417, https://doi.org/10.5194/gmd-8-2399-2015, 2015.
Yue, X. and Unger, N.: Aerosol optical depth thresholds as a tool to assess diffuse radiation fertilization of the land carbon uptake in China, Atmos. Chem. Phys., 17, 1329–1342, https://doi.org/10.5194/acp-17-1329-2017, 2017.
Yue, X., Strada, S., Unger, N., and Wang, A.: Future inhibition of ecosystem productivity by increasing wildfire pollution over boreal North America, Atmos. Chem. Phys., 17, 13699–13719, https://doi.org/10.5194/acp-17-13699-2017, 2017.
Zakey, A. S., Solmon, F., and Giorgi, F.: Implementation and testing of a desert dust module in a regional climate model, Atmos. Chem. Phys., 6, 4687–4704, https://doi.org/10.5194/acp-6-4687-2006, 2006.
Zaveri, R. A. and Peters, L. K.: A new lumped structure photochemical mechanism for large-scale applications, J. Geophys. Res.-Atmos., 104, 30387–30415, https://doi.org/10.1029/1999jd900876, 1999.
Zhang, H., Wang, Z. L., Wang, Z. Z., Liu, Q. X., Gong, S. L., Zhang, X. Y., Shen, Z. P., Lu, P., Wei, X. D., Che, H. Z., and Li, L.: Simulation of direct radiative forcing of aerosols and their effects on East Asian climate using an interactive AGCM-aerosol coupled system, Clim. Dynam., 38, 1675–1693, https://doi.org/10.1007/s00382-011-1131-0, 2012.
Zhang, H., Jing, X., and Li, J.: Application and evaluation of a new radiation code under McICA scheme in BCC_AGCM2.0.1, Geosci. Model Dev., 7, 737–754, https://doi.org/10.5194/gmd-7-737-2014, 2014.
Zheng, B., Tong, D., Li, M., Liu, F., Hong, C., Geng, G., Li, H., Li, X., Peng, L., Qi, J., Yan, L., Zhang, Y., Zhao, H., Zheng, Y., He, K., and Zhang, Q.: Trends in China's anthropogenic emissions since 2010 as the consequence of clean air actions, Atmos. Chem. Phys., 18, 14095–14111, https://doi.org/10.5194/acp-18-14095-2018, 2018.
Zhou, Y., Huang, A. N., Jiang, J., and La, M. K.: Modeled interaction between the subseasonal evolving of the East Asian summer monsoon and the direct effect of anthropogenic sulfate, J. Geophys. Res.-Atmos., 119, 1993–2016, https://doi.org/10.1002/2013jd020612, 2014.
Zhuang, B. L., Jiang, F., Wang, T. J., Li, S., and Zhu, B.: Investigation on the direct radiative effect of fossil fuel black-carbon aerosol over China, Theor. Appl. Climatol., 104, 301–312, https://doi.org/10.1007/s00704-010-0341-4, 2011.
Zhuang, B. L., Li, S., Wang, T. J., Deng, J. J., Xie, M., Yin, C. Q., and Zhu, J. L.: Direct radiative forcing and climate effects of anthropogenic aerosols with different mixing states over China, Atmos. Environ., 79, 349–361, https://doi.org/10.1016/j.atmosenv.2013.07.004, 2013.
Zhuang, B. L., Li, S., Wang, T. J., Liu, J., Chen, H. M., Chen, P. L., Li, M. M., and Xie, M.: Interaction between the Black Carbon Aerosol Warming Effect and East Asian Monsoon Using RegCM4, J. Climate., 31, 9367–9388, https://doi.org/10.1175/Jcli-D-17-0767.1, 2018.