the Creative Commons Attribution 4.0 License.
the Creative Commons Attribution 4.0 License.
 | 16 Apr 2024
The 4DEnVar-based weakly coupled land data assimilation system for E3SM version 2
Pengfei Shi
Bin Wang
Kai Zhang
Samson M. Hagos
Shixuan Zhang
A new weakly coupled land data assimilation (WCLDA) system based on the four-dimensional ensemble variational (4DEnVar) method is developed and applied to the fully coupled Energy Exascale Earth System Model version 2 (E3SMv2). The dimension-reduced projection four-dimensional variational (DRP-4DVar) method is employed to implement 4DVar using the ensemble technique instead of the adjoint technique. With an interest in providing initial conditions for decadal climate predictions, monthly mean anomalies of soil moisture and temperature from the Global Land Data Assimilation System (GLDAS) reanalysis from 1980 to 2016 are assimilated into the land component of E3SMv2 within the coupled modeling framework with a 1-month assimilation window. The coupled assimilation experiment is evaluated using multiple metrics, including the cost function, assimilation efficiency index, correlation, root-mean-square error (RMSE), and bias, and compared with a control simulation without land data assimilation. The WCLDA system yields improved simulation of soil moisture and temperature compared with the control simulation, with improvements found throughout the soil layers and in many regions of the global land. In terms of both soil moisture and temperature, the assimilation experiment outperforms the control simulation with reduced RMSE and higher temporal correlation in many regions, especially in South America, central Africa, Australia, and large parts of Eurasia. Furthermore, significant improvements are also found in reproducing the time evolution of the 2012 US Midwest drought, highlighting the crucial role of land surface in drought lifecycle. The WCLDA system is intended to be a foundational resource for research to investigate land-derived climate predictability.
- Article
(6156 KB) - Full-text XML
- BibTeX
- EndNote


The intrinsic chaos of the atmosphere limits traditional weather forecasting to roughly 2 weeks (Simmons and Hollingsworth, 2002). The feasibility of atmospheric predictability beyond 2 weeks lies in the interactions of the atmosphere with slowly varying components of the Earth system, such as the ocean or land surface or from predictable external forcings (Guo et al., 2012). Climate prediction can therefore be conceptually divided into both an initial value and a forced boundary value problem (Collins and Allen, 2002; Conil et al., 2007). One of the biggest technical challenges for improving the quality of climate predictions is the initialization of coupled models from observations (Taylor et al., 2012).
Much work has been devoted to initializing climate system models for practicable decadal climate predictions (DCPs). These models couple various components, such as models of the atmosphere, ocean, sea ice, land, and rivers. Due to their complexity, coupled models are often more susceptible to initial conditions (ICs) than their individual model components, underscoring the importance of data assimilation (DA) (Sakaguchi et al., 2012). The application of DA methods is essential to incorporate reanalysis data into the components of coupled model and produce the optimal ICs to improve DCPs. The initialization for DCPs uses both uncoupled DA and coupled data assimilation (CDA) methods. Uncoupled DA performs DA under the framework of an individual component model (e.g., standalone land surface model forced by atmospheric observations or reanalysis data rather than coupled with an atmospheric model), and then the uncoupled DA analyses from different individual components are combined to form the ICs of a coupled model (Zhang et al., 2020). For example, most existing reanalysis data were produced using uncoupled DA approaches, and these reanalysis datasets are then directly used to initialize DCPs in some studies (Du et al., 2012; Bellucci et al., 2013). However, such uncoupled DA often exhibits poor consistency among the ICs of different component models, and eventually produces low prediction skills (Balmaseda et al., 2009; Boer et al., 2016; Ardilouze et al., 2017).
To obtain balanced multi-component ICs in coupled models, recent studies focus on the development of CDA methods under the coupled modeling framework (Penny and Hamill, 2017; He et al., 2020a). The purpose of CDA is to produce balanced and coherent ICs for all components within the climate system by incorporating reanalysis information from one or more components in the coupled model, providing great potential for improving seamless climate predictions (Dee et al., 2014). Some studies underscore the superior advantages of CDA over traditional uncoupled DA methods (Lea et al., 2015; Zhang et al., 2005). CDA methods are categorized into two main types: weakly coupled data assimilation (WCDA) and strongly coupled data assimilation (SCDA). WCDA assimilates the observations or existing reanalysis into the respective component of the coupled model and then transfers reanalysis information to the other components through the coupled model integration (He et al., 2020b; Zhang et al., 2020). Considering that sequential DA encompasses both the analysis and the forecast steps, WCDA allows no direct influence of reanalysis information from a single component to other components in the analysis step as the cross-component background error covariances are not used, but coupling in the forecast step allows interactions across different components during the model integration (Browne et al., 2019) and propagates reanalysis information to other components. In contrast, SCDA utilizes cross-component background error covariances to directly assimilate reanalysis information from one component into all components, treating the entire Earth system model as one unified system (Penny et al., 2019). Furthermore, similar to WCDA, SCDA also allows coupling in the forecast step to propagate reanalysis information from one component to the other components (Yoshida and Kalnay, 2018). Several studies indicate that SCDA typically exhibits more pronounced improvements in assimilation performance relative to WCDA (Smith et al., 2015; Sluka et al., 2016). However, the application of SCDA poses substantial technical challenges, particularly in the establishment of effective cross-component background error covariances. Consequently, the majority of contemporary CDA systems still utilize the WCDA framework.
Recent research efforts have started to implement the CDA system to initialize DCPs using a diverse range of DA techniques from simple to complex. The simplest method is nudging, which adjusts the model states towards the observations or existing reanalysis (Hoke and Anthes, 1976; Zhang et al., 2020). Although the nudging method saves time and is easy to implement, its application in CDA is restricted primarily due to the limited types of observations and the required interpolation of observations at every time step of model integration (He et al., 2017). Previous studies have developed advanced CDA systems using variational and filtering approaches, such as three-dimensional variational data assimilation (3DVar) (Fujii et al., 2009; Yao et al., 2021), and ensemble-based techniques like the ensemble Kalman filter (EnKF) (Zhang et al., 2007). The former generally utilizes the stationary background error covariance and assimilates observations sequentially (Lin et al., 2017). In contrast, the latter uses the flow-dependent forecast error covariance and recursively integrates observations into the model (Lei and Hacker, 2015). Several studies also show encouraging progress in constructing CDA systems using the four-dimensional variational data assimilation (4DVar) method (Smith et al., 2015; Fowler and Lawless, 2016). The objective of 4DVar is to optimize four-dimensional model states and provide a compatible temporal trajectory that matches observational records across each assimilation window (Mochizuki et al., 2016). The 4DVar method is an advanced assimilation technique that exhibits superiority over other assimilation techniques like nudging and 3DVar in multiple aspects. Initial shocks that influence prediction skills can be significantly minimized by the 4DVar approach due to the dynamical consistency between the model and ICs (Sugiura et al., 2008). However, it is difficult to apply the 4DVar method for CDA systems in the fully coupled model because of the challenge in adjoint integration of the coupled model and its high computational cost in the analysis step. Finally, to capitalize on the strengths of both ensemble and variational techniques, recent studies focus on developing new hybrid data assimilation methods (Wang et al., 2010; Buehner et al., 2018). The hybrid approach utilizes an ensemble forecast to generate flow-dependent forecast error covariances and presents a way to perform 4DVar optimization without the need for tangent linear and adjoint models (Lorenc et al., 2015). However, most studies on CDA have focused on assimilating observations or reanalysis data of the ocean, the atmosphere, and even sea ice (He et al., 2017; Li et al., 2021; Kimmritz et al., 2018). There have been relatively few instances of CDA studies assimilating land observations or land reanalysis data.
In this study, we introduce the development of the four-dimensional ensemble variational (4DEnVar)-based weakly coupled land data assimilation (WCLDA) system for the Energy Exascale Earth System Model version 2 (E3SMv2) (Golaz et al., 2022). The 4DEnVar method in this WCLDA system is the dimension-reduced projection 4DVar (DRP-4DVar; Wang et al., 2010) that utilizes the ensemble technique as an alternative to the adjoint technique for implementing 4DVar. In this WCLDA system, monthly mean anomalies of soil moisture and temperature from a global land reanalysis product are assimilated into the land component of a coupled climate model in the analysis step, and subsequently during the forecast step the land reanalysis information incorporated into the ICs of the land component is propagated to the other components (e.g., atmosphere and ocean) through the fully coupled model integration and influences the ICs of all components for the next assimilation window. The primary goal of the WCLDA system is intended to be a foundational resource for exploring predictability of the Earth system by the E3SM community, specifically focusing on understanding the sources of predictability provided by land versus ocean, with an initial focus on DCPs. This WCLDA system also provides the groundwork for future actionable predictions of Earth system variability using E3SM.
The objective of this paper is to introduce the implementation of the 4DEnVar-based WCLDA system for the land component of E3SMv2. In Sect. 2, we provide an overview of the E3SMv2 model, describe the 4DEnVar methodology in detail, and outline the framework of the 4DEnVar-based WCLDA system. Preliminary evaluation of the WCLDA system is presented in Sect. 3. Finally, conclusions are discussed in Sect. 4.
2.1 Model description
The model used in this study is a relatively new state-of-the-art Earth system model known as Energy Exascale Earth System Model version 2 (E3SMv2), supported by the U.S. Department of Energy (DOE) to improve actionable Earth system predictions and projections (Leung et al., 2020). The atmospheric component is the E3SM Atmosphere Model version 2 (EAMv2), which is built on the spectral-element atmospheric dynamical core with 72 vertical levels (Dennis et al., 2012; Taylor et al., 2020). At the standard resolution, EAMv2 is applied on a cubed sphere with a grid spacing of ∼ 100 km for the dynamics. The ocean component is the Model for Prediction Across Scales-Ocean (MPAS-O), which applies the underlying spatial discretization to the primitive equations with 60 layers using a z-star vertical coordinate (Petersen et al., 2018; Reckinger et al., 2015). The sea ice component is MPAS-SI, which uses the same Voronoi mesh as MPAS-O, with mesh spacing varying between 60 km in the mid-latitudes and 30 km at the Equator and poles (Golaz et al., 2022). The land component is the E3SM Land Model version 2 (ELMv2), which is based on the Community Land Model version 4.5 (CLM4.5) (Oleson et al., 2013). Simulations are run in a satellite phenology mode with prescribed leaf area index, and the prescribed vegetation distribution has been updated for better consistency between land use and changes in plant functional types described by Golaz et al. (2022). The river transport component is the Model for Scale Adaptive River Transport version 2 (MOSARTv2), which provides detailed representation of riverine hydrologic variables (Li et al., 2013). These five components exchange fluxes through the top-level coupling driver version 7 (CPL7) (Craig et al., 2012). Further details on the E3SMv2 model are described in Golaz et al. (2022).
2.2 Datasets
Monthly mean soil moisture and soil temperature data in a total of 10 soil layers are produced by the Global Land Data Assimilation System (GLDAS; Rodell et al., 2004). The GLDAS product generates optimal fields of land surface states and fluxes in near-real time by forcing multiple offline land surface models with observation-based data fields. These reliable and high-resolution global land surface datasets from GLDAS are extensively utilized in weather and climate studies, hydrometeorological investigations, and water cycle research (Chen et al., 2021; Zhang et al., 2018). The GLDAS datasets have been available globally at high spatial resolution since January 1979 and can be accessed through the Goddard Earth Science Data and Information Service Center. For more consistency with ELMv2, we utilize GLDAS data produced by CLM. In contrast to decadal timescales, data signals with temporal resolutions shorter than 1 month can potentially introduce undesirable noise, which can adversely affect DCPs when high temporal resolution data are assimilated into the ICs. Moreover, it is very computationally demanding to assimilate complex actual observations in the initialization for DCPs that require long-term DA cycles. Therefore, similar to most existing initialization approaches for DCPs that assimilate reanalysis data, this study describes the implementation of a data assimilation approach for initializing DCPs by assimilating monthly mean GLDAS data within the 1-month assimilation window.
Monthly mean surface soil moisture data from the Advanced Microwave Scanning Radiometer (AMSR) and land surface temperature data from the Moderate Resolution Imaging Spectrometer (MODIS) are utilized for validation. (1) The AMSR data provide surface soil moisture estimations by measuring the microwave emission from the Earth's surface (Njoku et al., 2003). The soil moisture data from AMSR are widely used in scientific research to study surface water cycles, drought conditions, and hydrologic modeling (Du et al., 2019; McCabe et al., 2008). (2) MODIS is an essential instrument on board the Terra and Aqua satellite platforms (Remer et al., 2005). The MODIS datasets provide comprehensive global observations describing atmospheric, terrestrial, and oceanic conditions, including land surface temperature, vegetation indices, and cloud properties (Justice et al., 2002). The MODIS products are extensively utilized for monitoring environmental changes and supporting climate change research (Gao et al., 2015; Mertes et al., 2015).
Current initialization techniques are broadly classified into two categories: full-field assimilation with reanalysis values, and anomaly assimilation with reanalysis anomalies (Hu et al., 2020; Polkova et al., 2019). The full-field assimilation is commonly performed to reduce the influence of systematic model biases by replacing the initial model state with the optimal available estimate of the reanalysis state (Volpi et al., 2017). However, the model trajectory tends to drift away from the observations and revert to the model's inherent preferred state because of model deficiencies (Smith et al., 2013). This problem is partially addressed with the anomaly assimilation by assimilating the reanalysis anomalies added to the model climatology (Carrassi et al., 2014). In this study, we conduct the anomaly assimilation for the WCLDA system with bias correction applied to GLDAS data before assimilation. For bias correction, the difference between GLDAS data and its long-term average is calculated as anomalies and then added to the simulated model climatology.
2.3 Data assimilation scheme
The 4DEnVar algorithm in this study is based on the DRP-4DVar technique, which is an efficient pathway for applying 4DVar through using the ensemble method rather than the adjoint technique (Wang et al., 2010). The DRP-4DVar method generates the optimal estimation in the sample space through aligning the observations with ensemble samples along the coupled model trajectory (Liu et al., 2011).
DRP-4DVar is an economical approach that minimizes the cost function of the standard 4DVar by using the ensemble technique instead of the adjoint technique (Wang et al., 2010). The background error covariance matrix B is estimated using the pure ensemble covariance. The ensemble members originate from historical or ensemble forecasts. Considering the high computational cost of ensemble forecasts for the coupled model in our study, we utilize outputs from the pre-industrial control (PI-CTRL) experiment of E3SMv2 to generate ensemble members. The instantaneous state at the beginning of each month and the corresponding monthly mean state of this month from the 100-year balanced PI-CTRL simulation are used as the samples of initial condition (xi) and forecast samples (yi). The corresponding perturbation samples are calculated as and , where and are the 100-year average values of xi and yi at the same month, respectively. Following this, m pairs of perturbation samples ) and ) are selected at each DA analysis step according to the correlations between and the observational innovation , ensuring that each y′ sample is selected independently of the other samples in the ensemble. In this study, m=30. The estimation of the background error covariance matrix B is then represented by the formula in Eq. (1) utilizing the selected x′ samples. We implement both horizontal and vertical localizations to reduce sampling errors due to the finite ensemble size and to alleviate the spurious remote influence from distant grid points. Our approach to horizontal localization is to apply a distance-dependent weighting function to the background error covariance. The vertical localization is employed to limit the influence of reanalysis information on specific soil layers. Please refer to Wang et al. (2018) for more detailed descriptions of the localization methodology in our study.
According to Wang et al. (2010), DRP-4DVar produces the analysis increment () by minimizing the 4DVar cost function in the incremental form (Courtier et al., 1994).
Here represents the increment of model variables relative to the background; ) denotes the weighted observational innovation for monthly mean anomalies of soil moisture and temperature; R=rrT is the observational error covariance matrix that is usually diagonal; ) is the weighted projection of the increment (x′) onto the observation space; and the superscript T represents the transpose.
To simplify the calculation of the minimization, the increment of model state variables x′ and the corresponding weighted observation increment are projected onto the dimension-reduced sample space through the following projection transformations:
where α is the m-dimension column vector containing the weight coefficients ). Px and Py denote the projection matrices that incorporate the initial condition perturbations and the corresponding monthly mean samples as follows:
where (. The original 4DVar cost function defined in Eq. (2) is then transformed into the following new cost function, and the analysis can be computed in the sample space by minimizing this new cost function:
The solution to this minimization problem is formulated as follows:
In this study, the DRP-4DVar-based WCLDA system is used to incorporate the land reanalysis data only. The optimal analysis for the land state variables () is obtained by adding the analysis increment () to the background of land ICs (), as expressed in Eq. (7):
In the analysis step, only the land state variables are updated to the optimal analysis (). Subsequently, we proceed with a 1-month freely coupled integration of the E3SMv2 model during the forecast step. This integration is initialized from the optimal land ICs () along with the background fields as the ICs of other components (e.g., atmosphere and ocean). Throughout this 1-month free integration, the interactions among the model components indirectly enhance the background states of these components (e.g., atmosphere and ocean) for the next assimilation window due to the more realistic land state variables. Moreover, this coupled integration also contributes to the balance between the ICs of different components.
2.4 4DEnVar-based WCLDA system
The 4DEnVar-based WCLDA system is developed to assimilate the monthly mean soil moisture and temperature data from the GLDAS analysis dataset into the land component of E3SMv2 using the DRP-4DVar method. Two sets of numerical experiments are conducted to evaluate the performance of land data assimilation in the WCLDA system. The control simulation (CTRL) is a 37-year freely coupled integration driven by observed external forcings (e.g., solar radiation, greenhouse gas, and aerosol concentrations) from 1980 to 2016. In the freely coupled simulation, the various components of the Earth system model, namely the atmosphere, land, river, ocean, and sea ice, interact dynamically without any constraints. The observed external forcing mainly acts on the atmospheric component and then influences other components (e.g., land surface, ocean, and sea ice) through their coupling with the atmosphere. CTRL provides the benchmark for assessing the performance of the WCLDA system. The assimilation experiment (Assim) is conducted from 1980 to 2016 based on the WCLDA system in which the GLDAS data are assimilated into the land state variables from the 1st to the 10th layer with a 1-month assimilation window under the coupled modeling framework. The effectiveness of the WCLDA system is evaluated through the comparison between Assim and CTRL. In both Assim and CTRL, the transient historical external forcings are prescribed following the CMIP6 protocol (Eyring et al., 2016).
The flowchart of the 4DEnVar-based WCLDA system is illustrated in Fig. 1. The DRP-4DVar method incorporates three inputs: model background, observational innovation, and 30 perturbation samples. First, the E3SMv2 model is executed for 1 month, during which state variables such as model background (xb), observational operator (H), and observational background (yb) are stored. The model background (xb) denotes the monthly initial states before assimilation, and the observational operator (H) represents a 1-month integration by the coupled model to generate monthly mean model outputs (yb). Second, upon completion of the 1-month coupled run, the observational innovation () is determined by calculating the differences in soil moisture and temperature between the monthly mean GLDAS data (yobs) and the model outputs (yb). From the 100-year sample database of the E3SMv2 PI-CTRL simulation, 30 samples of monthly mean perturbation () are chosen with the highest absolute correlation with the observational innovation. The corresponding 30 monthly IC samples (x′) are also obtained. Finally, the analysis increment is generated in the sample space, and the optimal analysis (xa) is calculated using the DRP-4DVar algorithm.
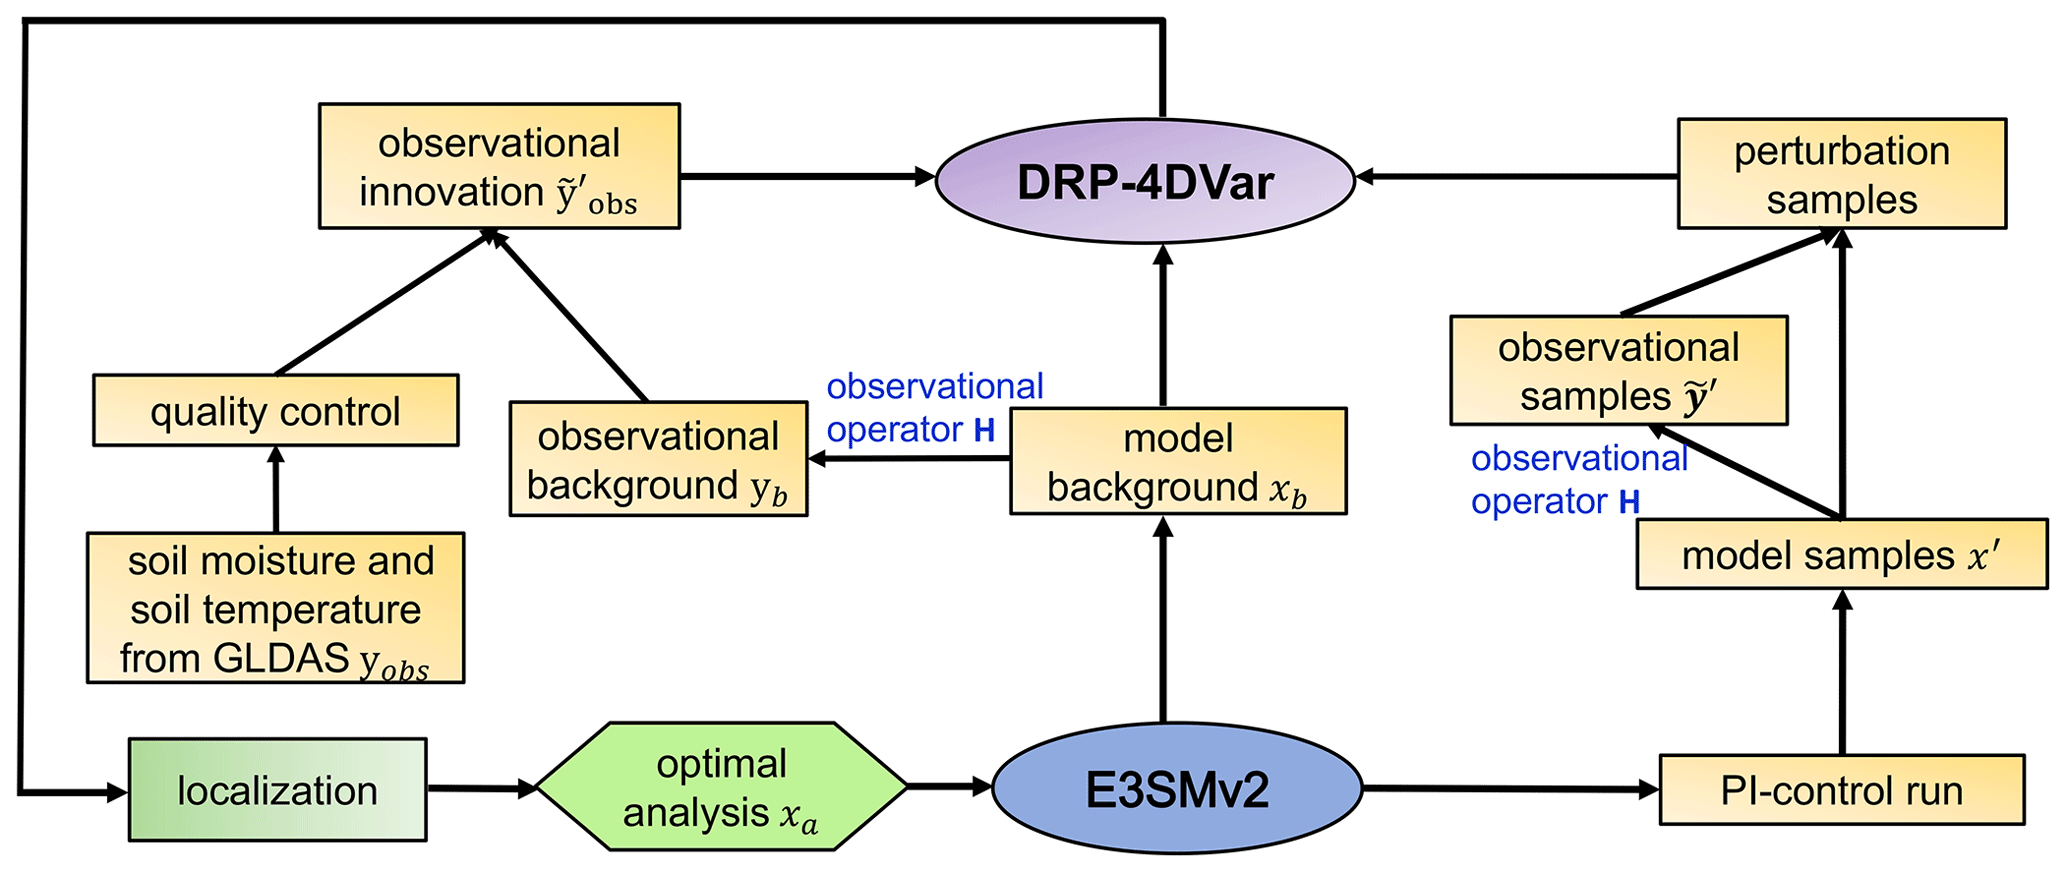
Figure 1Flowchart of the 4DEnVar-based WCLDA system in E3SMv2 based on the DRP-4DVar method.
The schematic diagram in Fig. 2 outlines the assimilation process of the 4DEnVar-based WCLDA system in E3SMv2. The incorporation of GLDAS data into the E3SMv2 model consists of the analysis step and the forecast step. In the analysis step, the differences between monthly mean GLDAS data and model outputs are calculated and utilized to produce the optimal assimilation analysis at the beginning of a 1-month assimilation window. Subsequently, in the forecast step, this optimal assimilation analysis is used as the land ICs combined with the background ICs for other components to conduct 1-month forecast using the E3SMv2 model. This forecast generates the backgrounds of all model components for the next assimilation window. As a result, the forecasted backgrounds for all components are influenced by the land reanalysis information incorporated into the ICs of the land component. In general, when the coupled model is used in the forecast step while the optimal assimilation analysis is updated separately for the respective component, the assimilation approach is identified as WCDA (Penny et al., 2019; Zhang et al., 2020).
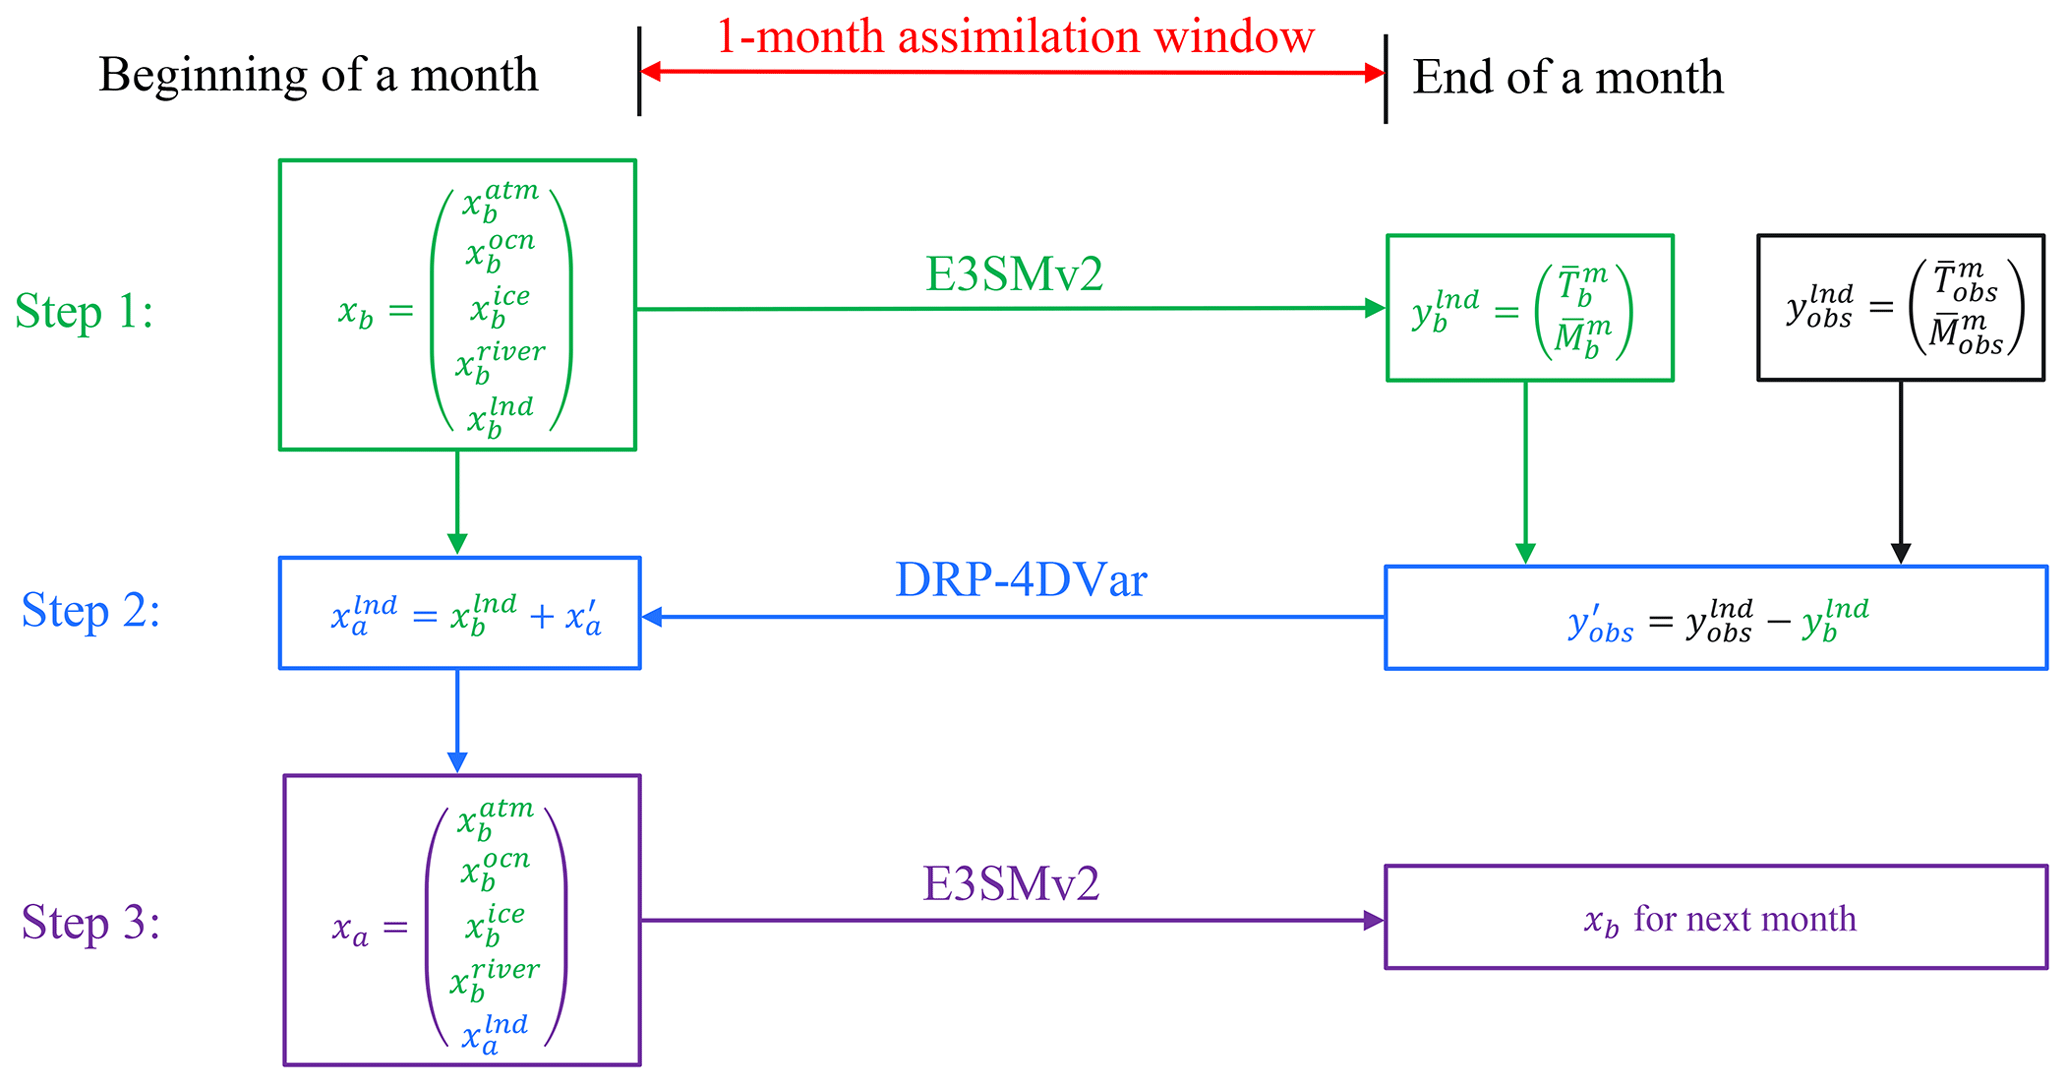
Figure 2Schematic flowchart of the 4DEnVar-based WCLDA system. The beginning of a month is at 00:00 UTC on the first day of the month, and the end of the month is at 00:00 UTC on the first day of the next month. xb denotes the background vector including the backgrounds of all E3SMv2 components (atmosphere (), ocean (), sea ice (), river transport () and land surface (. xa consists of the assimilation analysis of land surface () and the backgrounds of other components. represents the simulated monthly mean soil temperature () and moisture () by E3SMv2 using xb as the initial condition. denotes the monthly mean GLDAS data of soil temperature () and moisture (). denotes the observational innovation, which is the difference between the GLDAS data () and the observational background ().
The detailed assimilation process mainly consists of three steps within each 1-month assimilation window. (1) The E3SMv2 model is initially executed for 1 month to generate the simulated monthly mean soil moisture and temperature (). (2) The observational innovation () is obtained through subtracting the model simulation () from the monthly mean observation (). This innovation is then applied to formulate the optimal assimilation analysis of land surface () at the beginning of the assimilation window through the DRP-4DVar method. (3) The E3SMv2 model is rewound to the start of the month and the second 1-month model run is executed using the optimal ICs (xa) to generate the background for the next assimilation window. Due to multi-component interactions during the 1-month freely coupled integration, the land reanalysis information can potentially benefit other components (e.g., atmosphere and ocean) in the coupled modeling framework (Li et al., 2021; Shi et al., 2022). To assimilate the monthly mean GLDAS product, fully coupled integration by the E3SMv2 model is performed twice within each 1-month assimilation window: first to generate the observational innovation by computing the differences between the GLDAS data and model outputs for analysis, and second to forecast the backgrounds of all components for the next assimilation window. When the fully coupled model is executed for the second 1-month run, the land reanalysis information is transferred to the other components through multi-component interactions. This approach is similar to previous studies that employed the “two-step” scheme in which the land model integration is performed twice within the same month to assimilate the monthly Gravity Recovery and Climate Experiment (GRACE)-based terrestrial water storage (TWS) observations (Houborg et al., 2012; Girotto et al., 2016).
2.5 Evaluation metrics
The reduction rate of the cost function is a significant metric for verifying the effectiveness of the WCLDA system and evaluating the extent of reanalysis information assimilated by the coupled model, which is formulated as follows:
where J0 and J1 denote the cost function before and after assimilation, respectively; yobs represents the GLDAS data; ya denotes the monthly mean analyses; yb is the observation space background; and R is the observation error covariance matrix. The observation error covariance matrix R can be determined statistically by estimating the variance and covariance of the GLDAS data. A negative value for this metric indicates that reanalysis information has been correctly incorporated into the model variables.
Following Yin et al. (2014), the assimilation efficiency (AE) index is defined to evaluate the efficiency of the WCLDA system as follows:
In this equation, RMSEAssim is the root-mean-square error (RMSE) between the analysis value from Assim and the reference data, while RMSECTRL represents the RMSE between CTRL and the reference data. Negative (positive) AE value indicates improvements (degradations) by the assimilation. In the following sections, we use the GLDAS data as the main reference data to verify the correctness of the WCLDA system, but some analyses are also performed using AMSR surface soil moisture and MODIS land surface temperature as the reference data.
3.1 Evaluation of the cost function
Figure 3 displays the time series of the monthly reduction rate of the cost function in the 4DEnVar-based WCLDA system. In the first month, the reduction rate reaches approximately 26.06 % in Assim. Over the subsequent months, Assim maintains the average reduction rate of 7.73 % throughout the entire 37-year period. Furthermore, negative reduction rates are observed in 98.65 % of the total months, indicating the effectiveness of the WCLDA system. These results suggest that the WCLDA system is correctly implemented, with GLDAS data successfully assimilated into the coupled model.
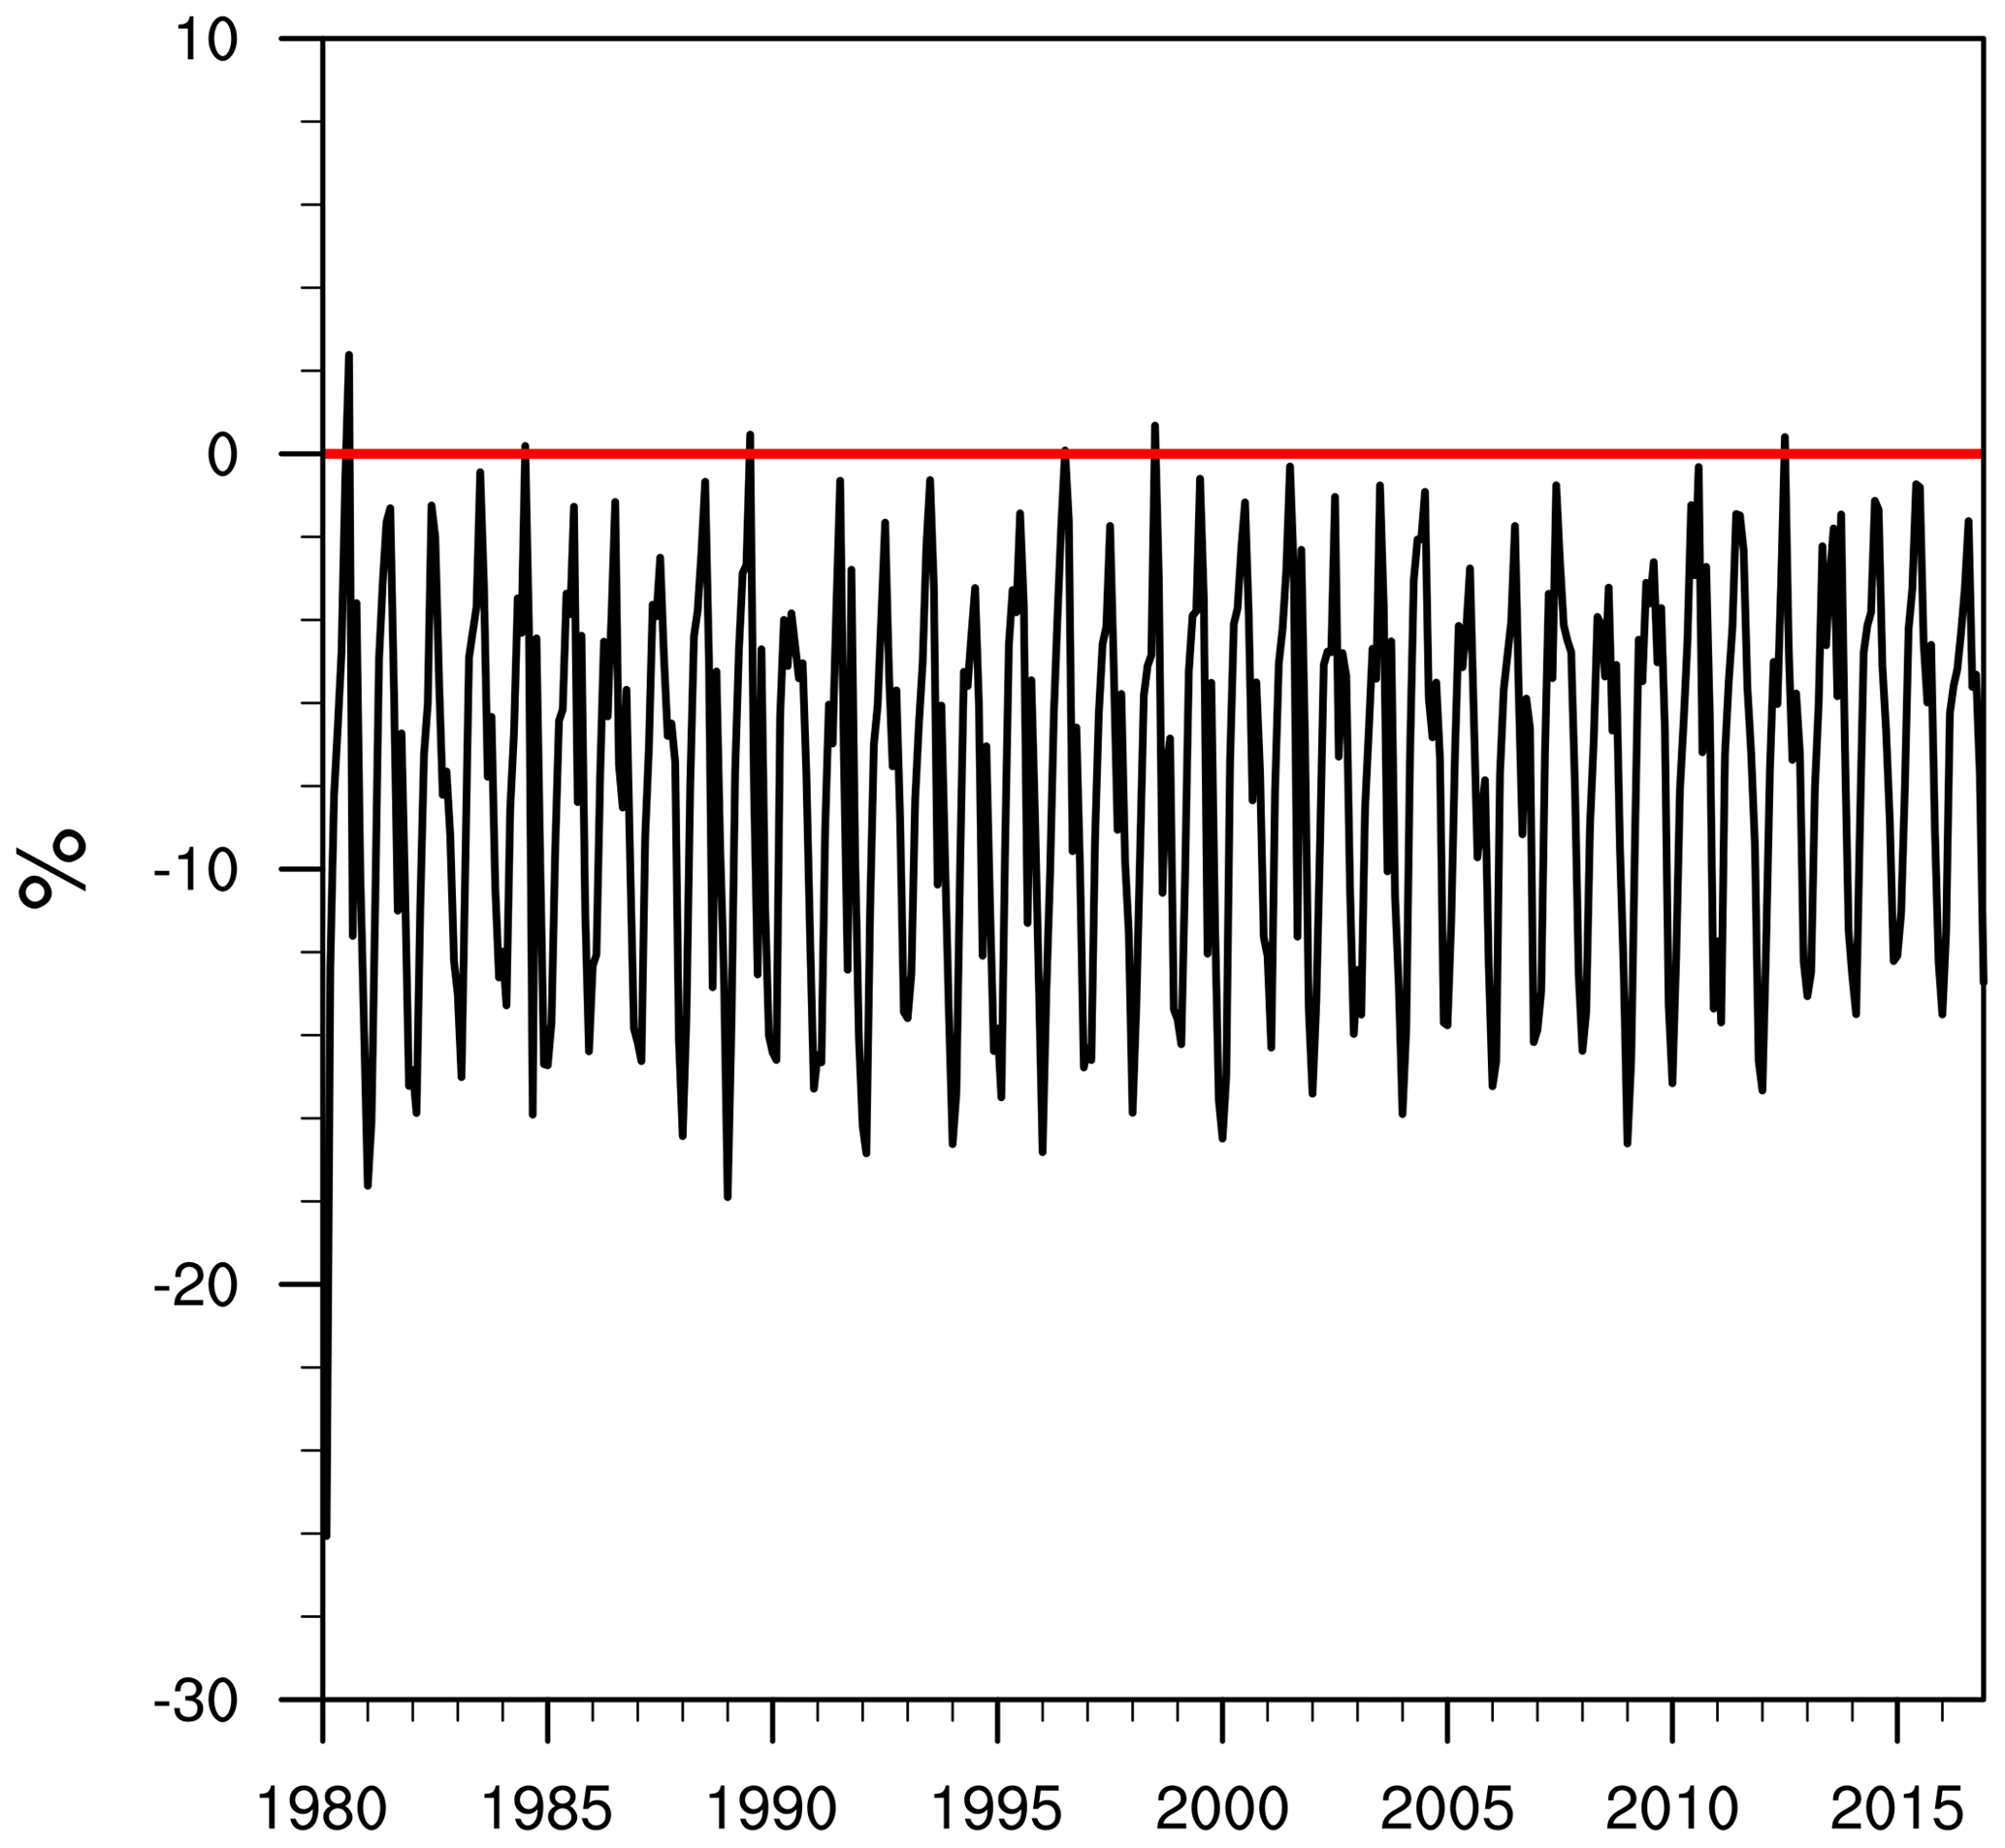
Figure 3Time series of the reduction rate of the cost function from 1980 to 2016 in the 4DEnVar-based WCLDA system.
3.2 Evaluation of the AE index
The spatial pattern of the AE index for soil moisture at different depths is depicted in Fig. 4. The AE value exhibits negative signal in most areas for a total of 10 soil layers, suggesting the reduction in RMSE for soil moisture after assimilation. Significant improvements appear over North America, South America, southern Africa, Europe, and Asia. However, assimilation performance is degraded in the northern part of Russia and northern Africa. This is consistent with the findings in other studies that assimilation updates in northern Russia are limited due to the complexities of accurately representing frozen ground and snow processes in high latitudes (Edwards et al., 2007; Ireson et al., 2013). As surface soil moisture is highly susceptible to atmospheric conditions, assimilation performance of surface soil moisture is limited by the accuracy of atmospheric forcing. Furthermore, some degradations found in the deep layers could be attributed to the substantial influence of various terrestrial factors, such as subsurface runoff and interactions with groundwater, similar to the findings in previous studies (Liu and Mishra, 2017; Zeng and Decker, 2009).
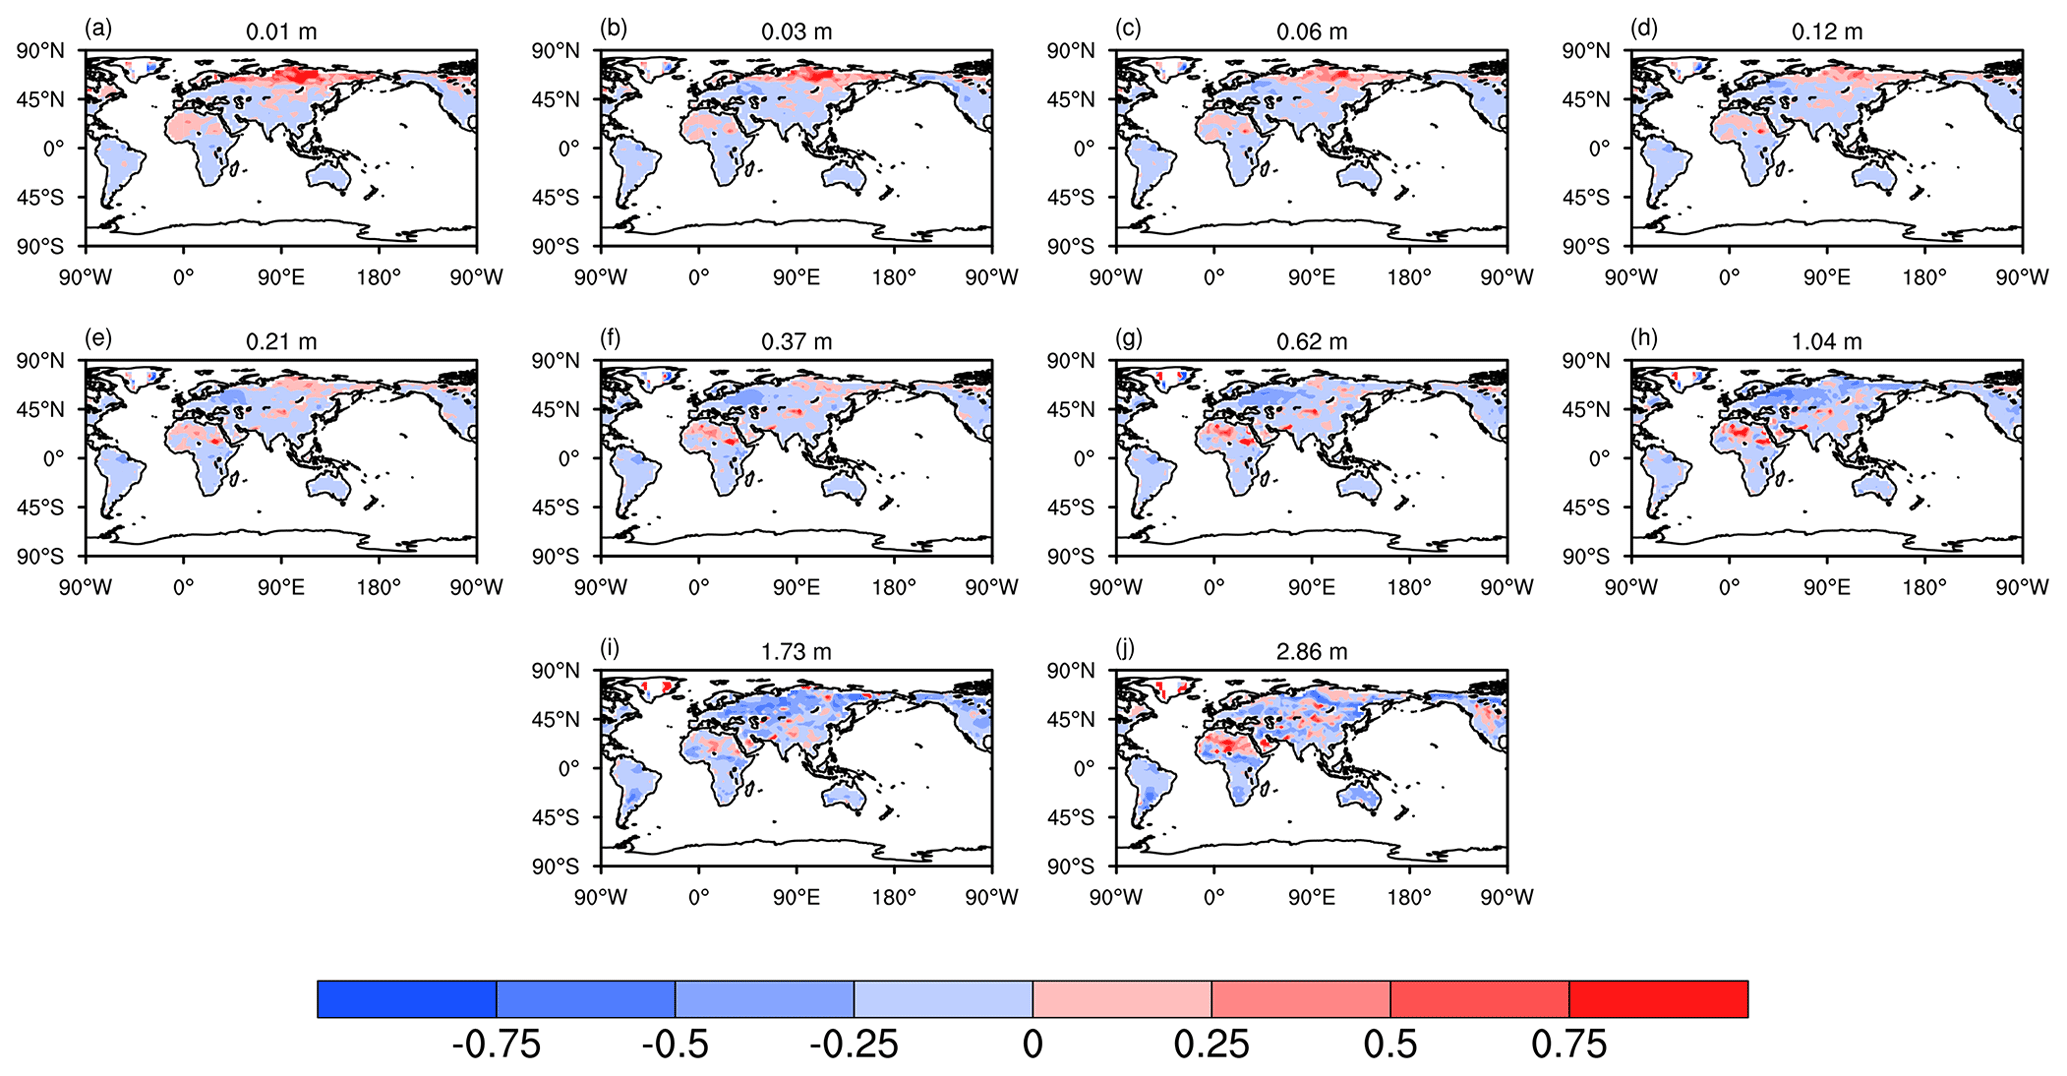
Figure 4Spatial distribution of the AE index for soil moisture from the surface to deep layers during the 1980–2016 period. The number at the top center denotes the depth of each soil layer.
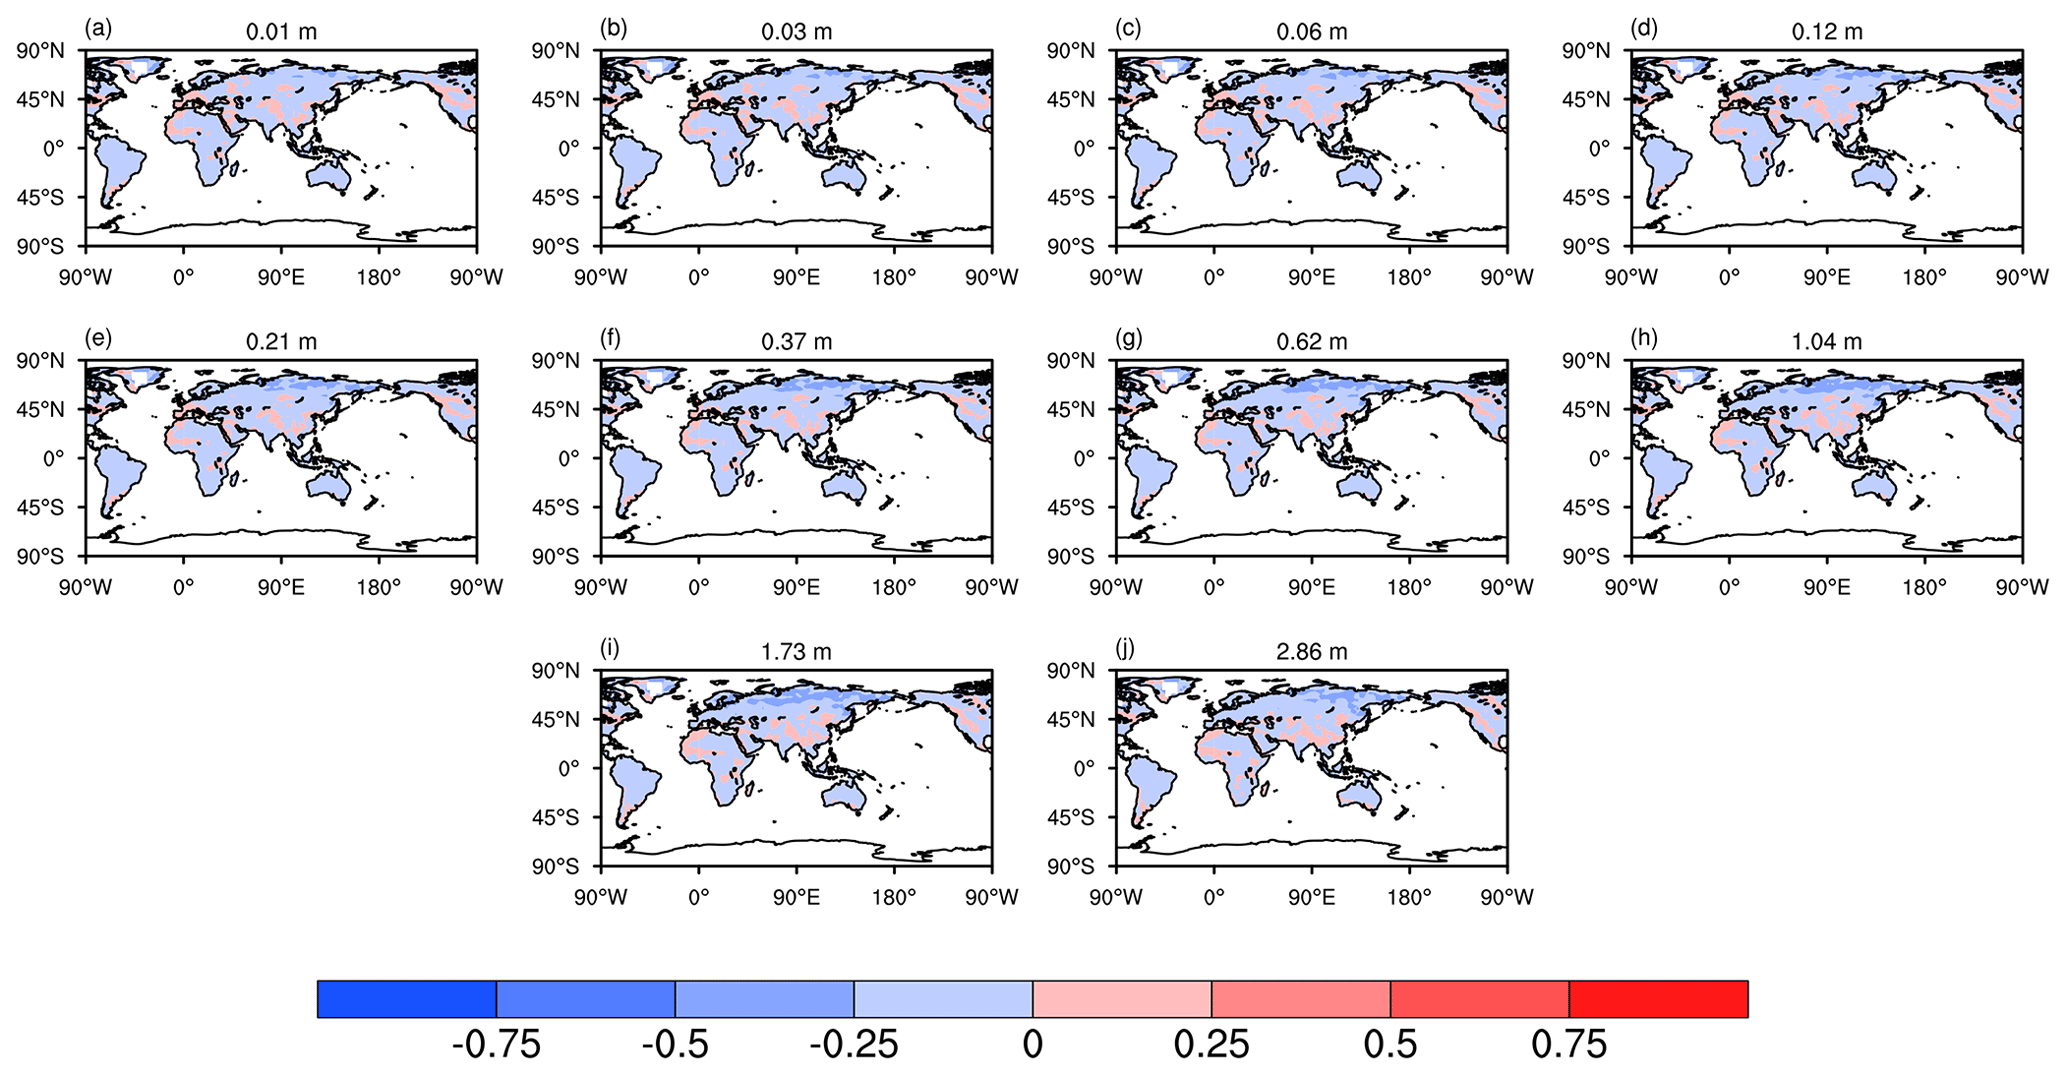
Figure 5The same as Fig. 4 but for soil temperature.
Figure 5 shows the spatial distribution of the AE index for soil temperature from the surface to deep layers. Most grid cells from the 10 soil layers are dominated by negative AE signals, indicating improved performance for soil temperature after assimilation. Moreover, the spatial patterns across different soil layers are highly consistent with each other and exhibit similar magnitudes in most areas. Notable improvements are observed in central Europe, South America, eastern Russia, and large parts of Eurasia and North America. In contrast, slight degradations appear over Southeast Asia and along the northern fringes of Africa. This may be partly related to model uncertainties and possible atmospheric noise, as shown by many past studies (Kwon et al., 2016; Lin et al., 2020).
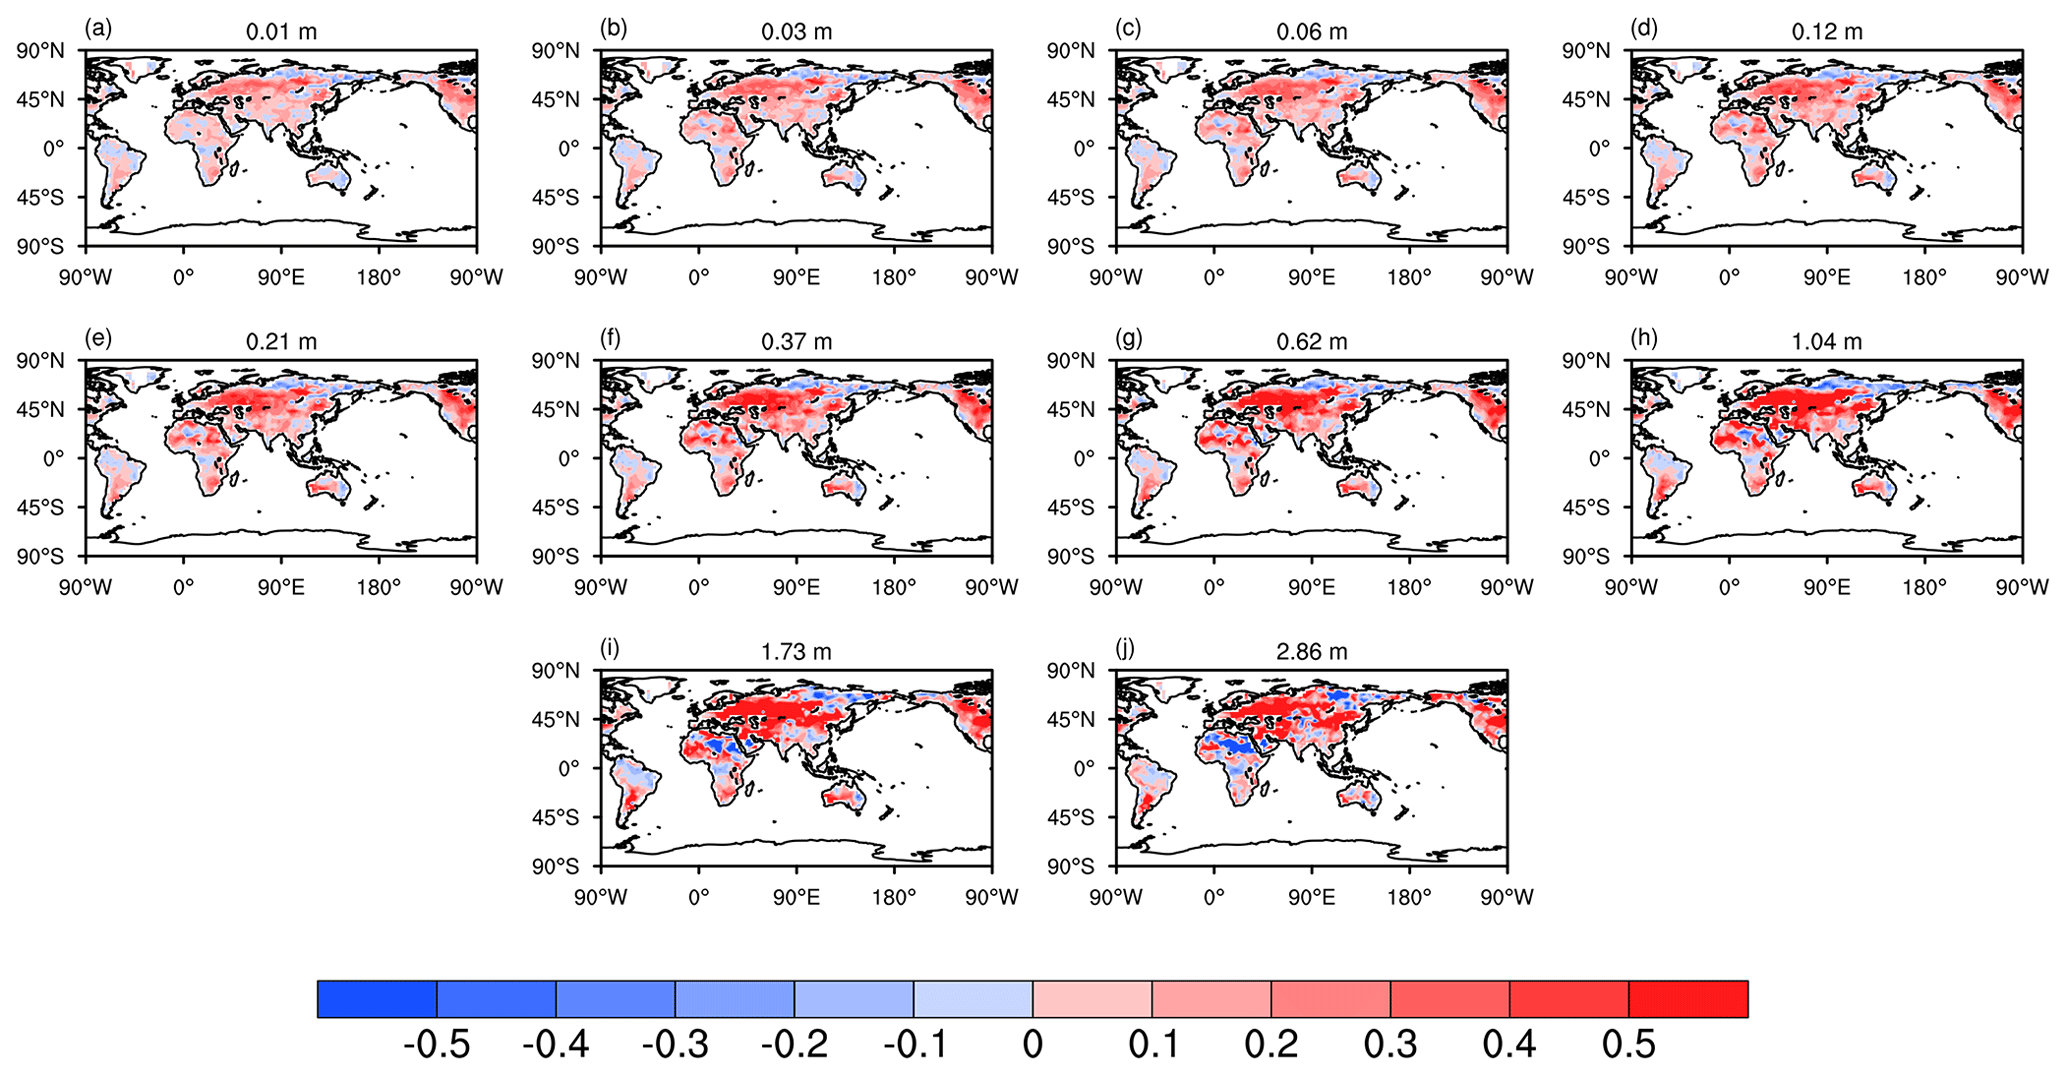
Figure 6Differences between correlations of soil moisture in Assim and CTRL with the GLDAS data from the surface to deep layers for the period of 1980–2016. The number at the top center denotes the depth of each soil layer.
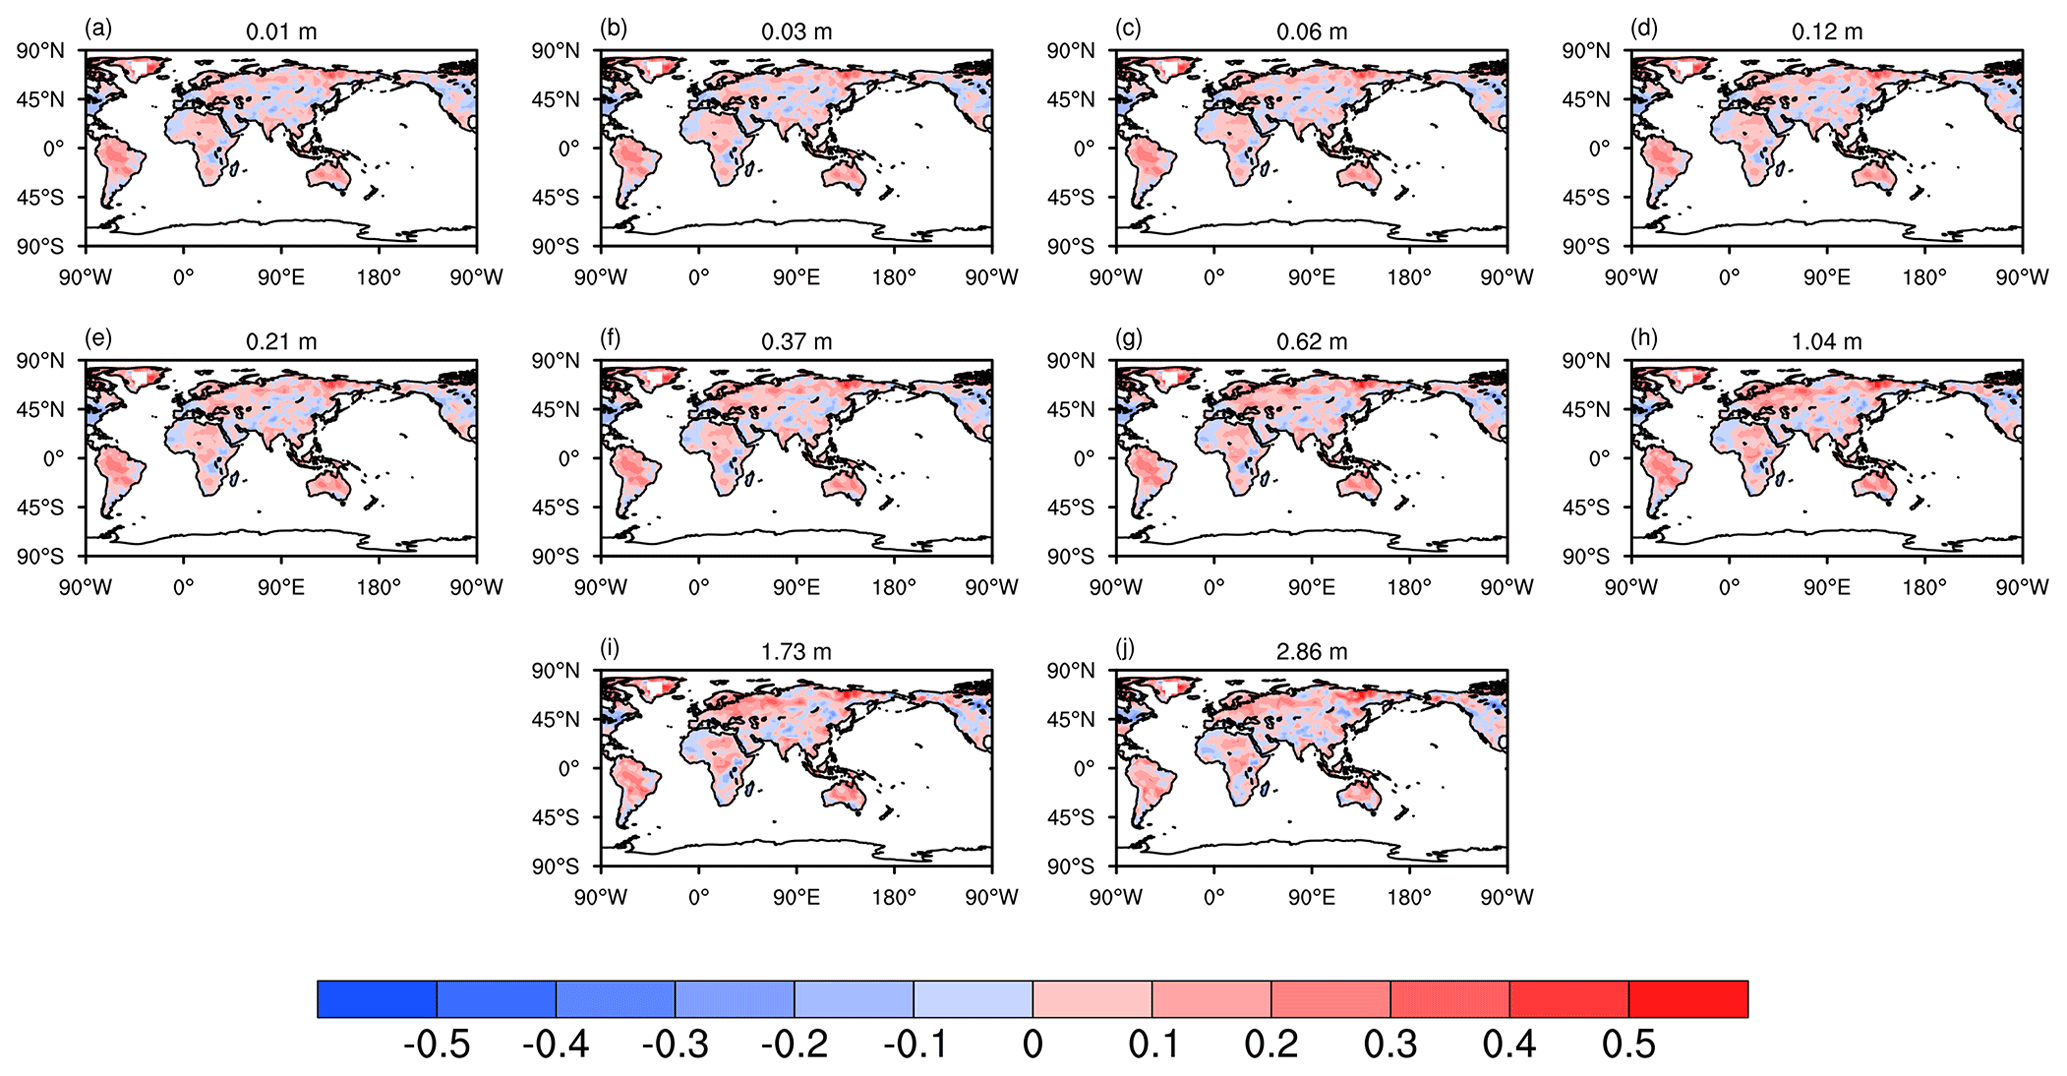
Figure 7The same as Fig. 6 but for soil temperature.
We further perform an analysis of the spatial pattern of the AE index for surface soil moisture and land surface temperature between satellite data and model simulations (Fig. A1). For surface soil moisture, the comparison with AMSR data suggests that the majority of global regions exhibit reduced RMSE after assimilation. The reduction in RMSE is pronounced in central North America, South America, southern Africa, Australia, and Europe. However, in high-latitude areas, significant degradations are observed in northern Russia, which may be related to model deficiencies in simulating the complex frozen ground and snow processes (Edwards et al., 2007; Ireson et al., 2013). Regarding land surface temperature, improved performances are evident over South America, Australia, southern Africa, and large parts of Eurasia when compared to MODIS data. In contrast, some degradations appear over parts of North America and central Asia, which still require further improvement.
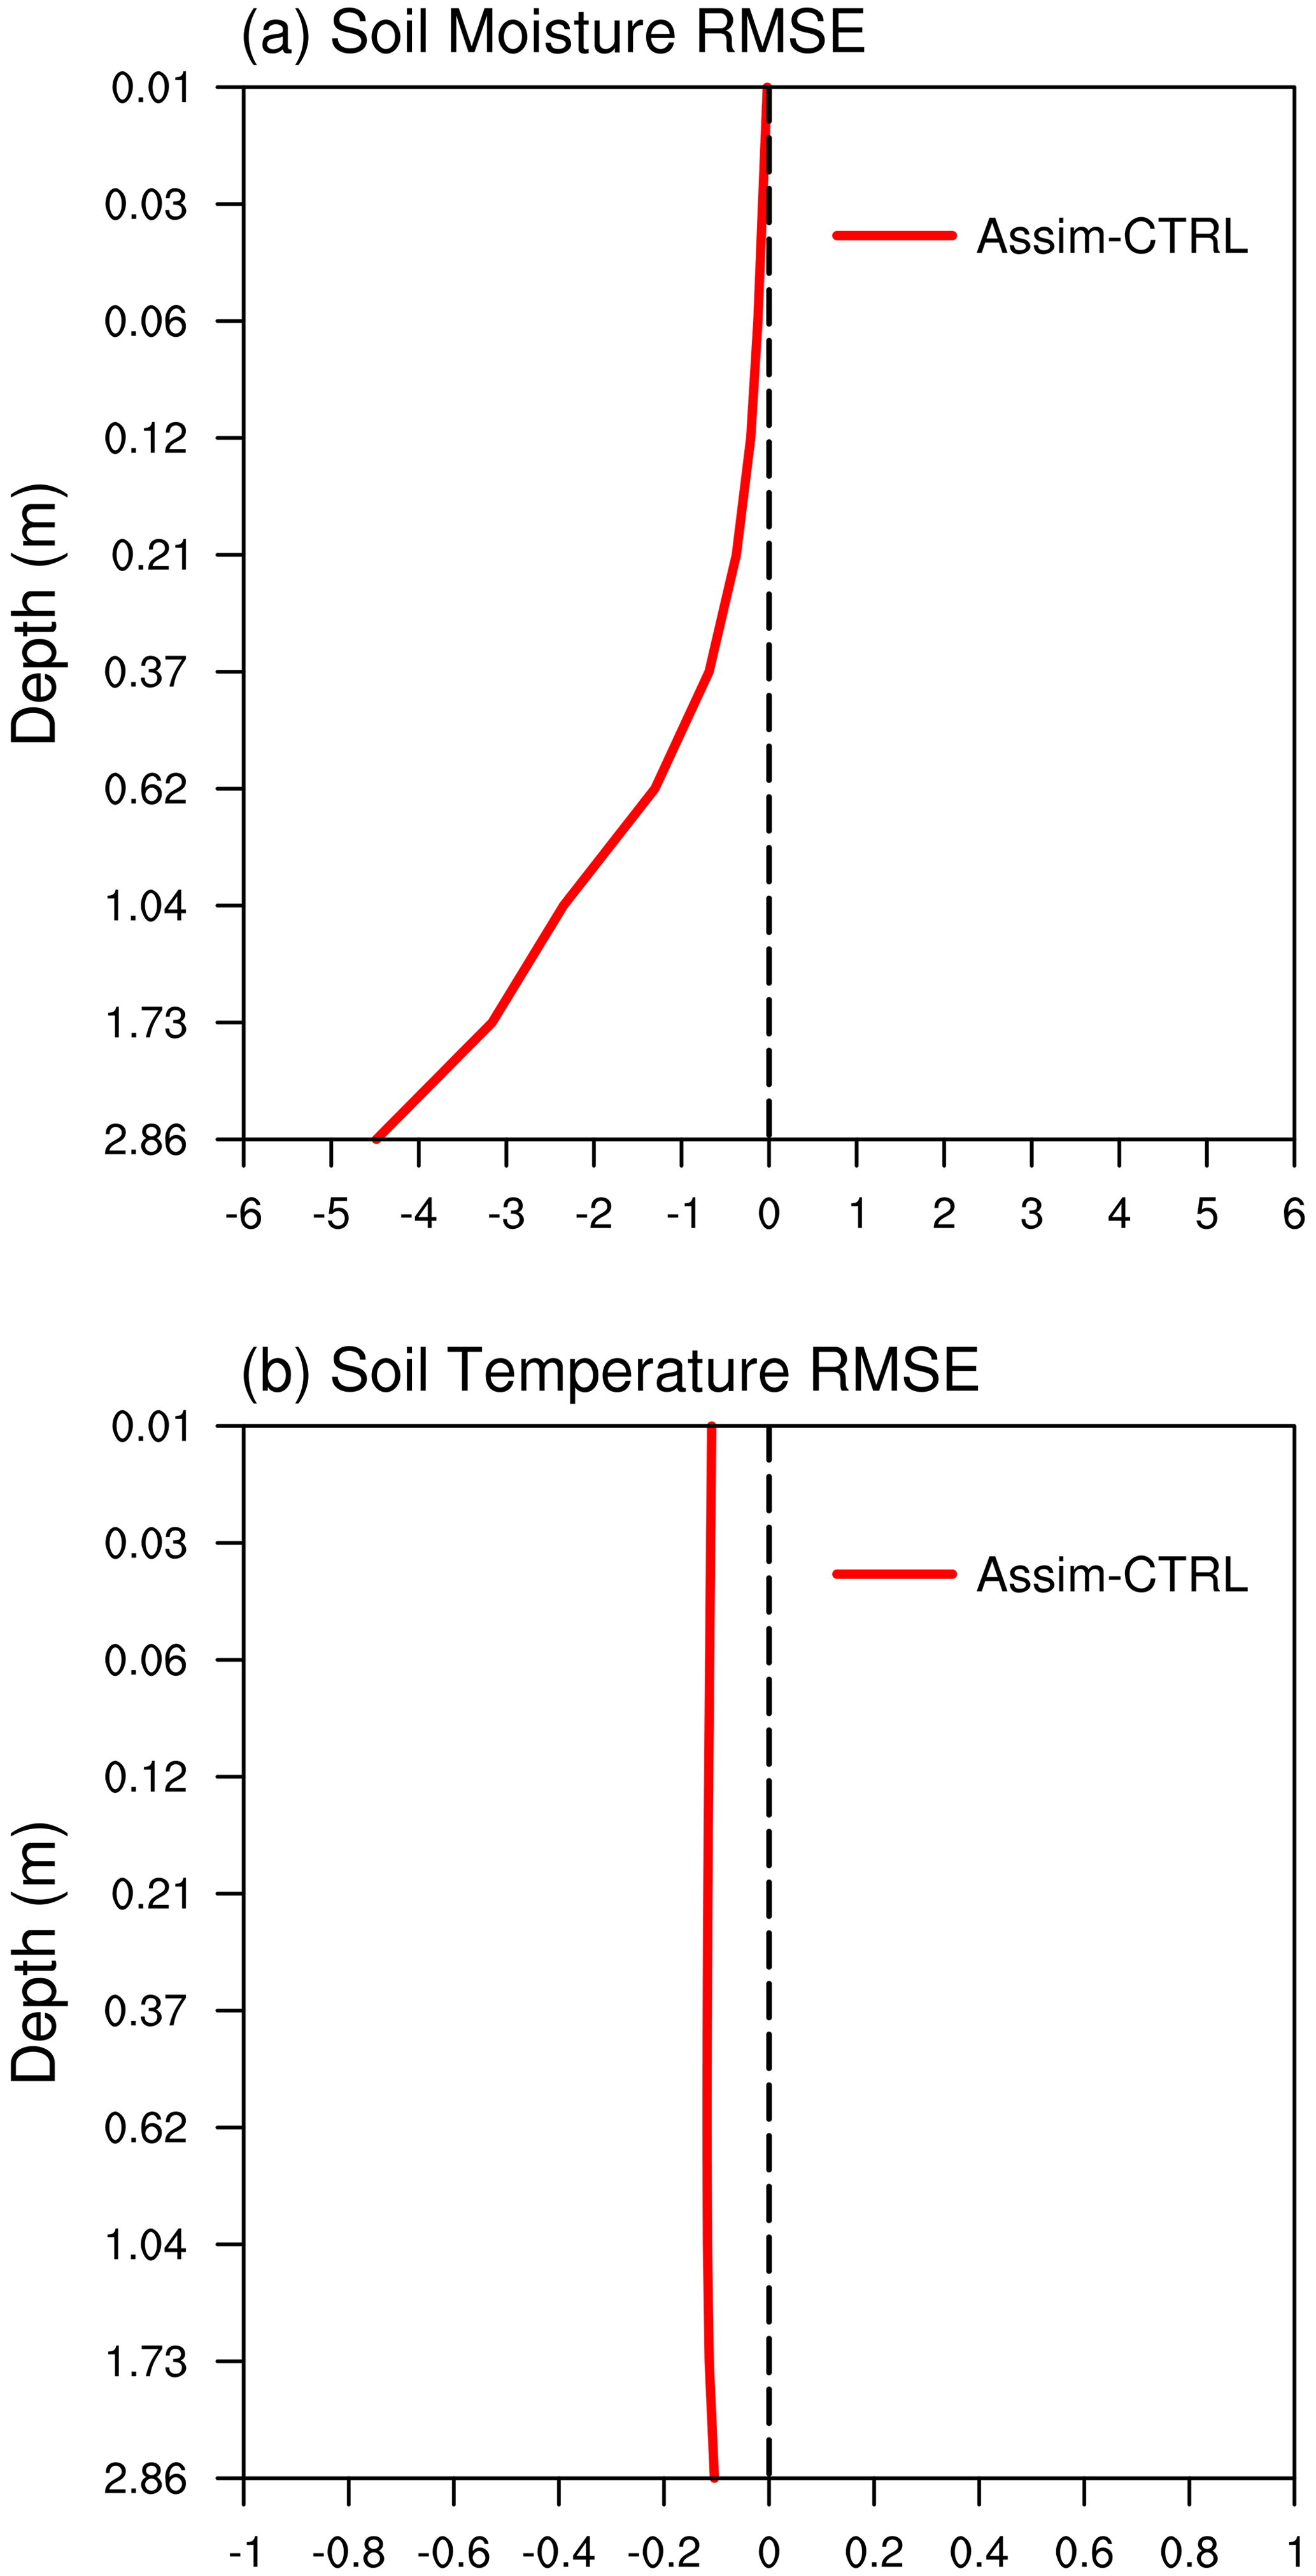
Figure 8Vertical distributions of RMSE differences (Assim minus CTRL) for (a) soil moisture and (b) soil temperature averaged over the global land during the 1980–2016 period.
3.3 Evaluation of the correlation
Figure 6 displays the spatial patterns of the differences in temporal correlations for soil moisture between Assim and CTRL with GLDAS data across different soil layers. The majority of global regions in Assim exhibit higher correlations from the 1st to the 10th layer compared with CTRL, suggesting the overall good performance of the WCLDA system. Enhanced correlations in deep soil layers are more pronounced than in shallow layers, which may be attributed to the longer memory of soil processes in the deeper soil layers (Wang et al., 2010). Improved correlations appear over North America, central Europe, Asia, and parts of Africa. However, some scattered areas show slight degradations, such as northern South America, central Africa, and eastern Russia. Overall, Assim outperforms CTRL with higher correlation (Fig. 6) and lower RMSE (Fig. 4) in many regions, such as Europe, North America, southern South America, and South Asia.
The correlation differences in soil temperature between Assim and CTRL from surface to deep layers are shown in Fig. 7. Assim yields improved correlations from the 1st to the 10th layer across the majority of global regions. Furthermore, similar spatial patterns and magnitudes are observed in the performance of different soil layers, implying the significant heat transfer from the surface to deep zone that constrains soil temperature across the soil column. Notable improvements are located over South America, central Africa, Australia, central Europe, and East Asia. Nevertheless, some degradations appear over North America, western Europe, and northeastern China. Assim shows superior performance over CTRL for soil temperature with higher correlation (Fig. 7) and lower RMSE (Fig. 5) in many regions, including South America, central Europe, Australia, and central Africa.
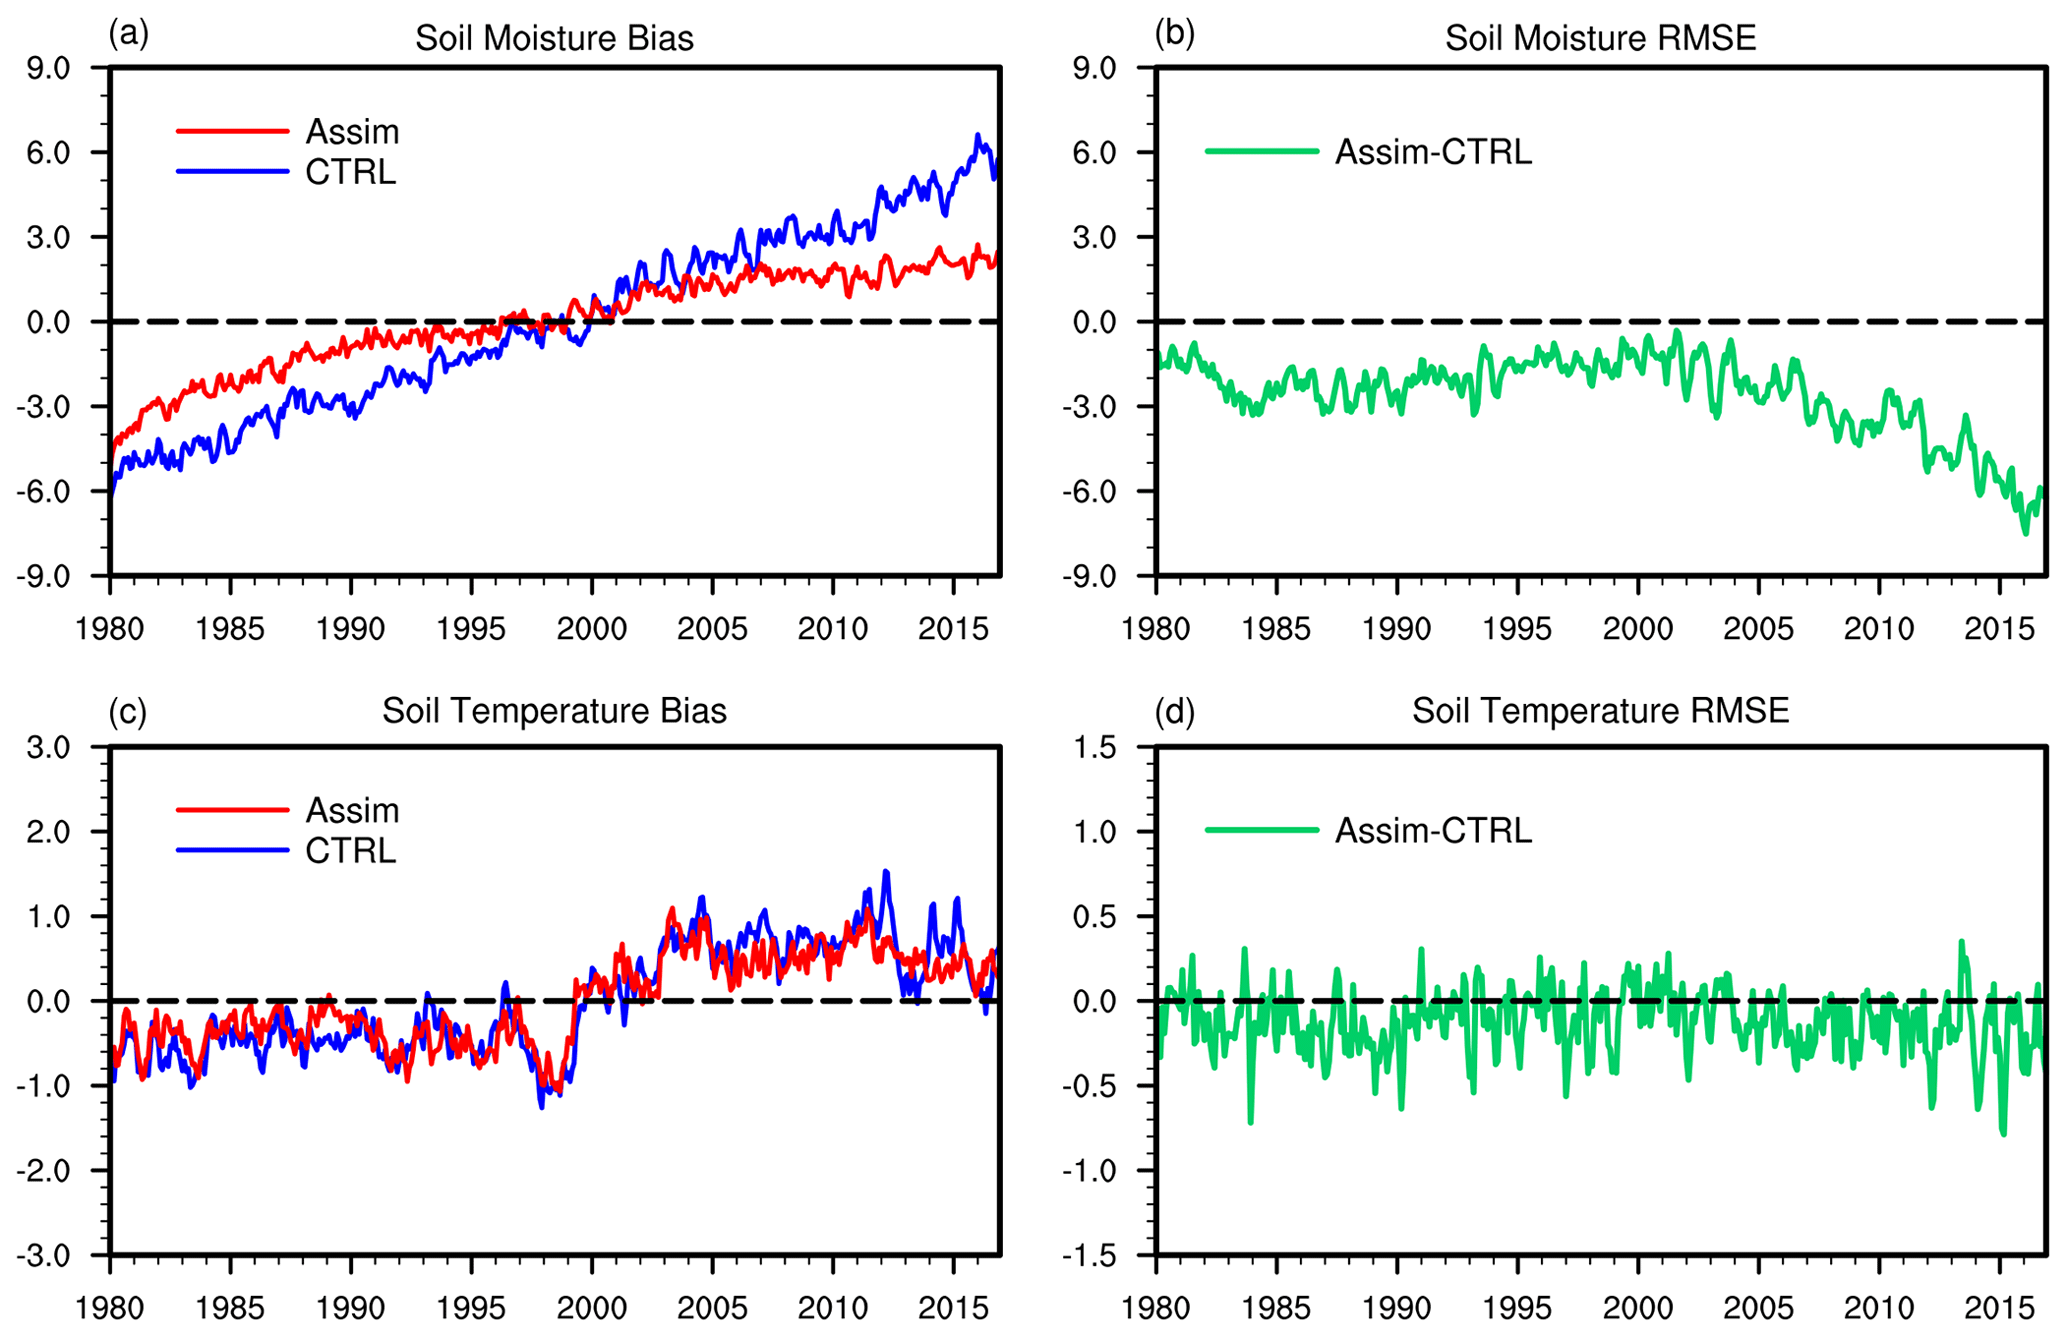
Figure 9Time series of the vertically averaged global mean soil moisture and temperature bias (a, c) for Assim (red line) and CTRL (blue line) and RMSE differences (b, d, green line) between Assim and CTRL from 1980 to 2016.
3.4 RMSE and bias of the global mean soil moisture and temperature
The vertical distributions of RMSE differences between Assim and CTRL for soil moisture and temperature are evaluated in Fig. 8. Compared with CTRL, Assim shows noticeable improvements with reduced RMSE for both soil moisture and temperature in all 10 soil layers. For soil moisture, the reduction in RMSE increases with depth from the upper to deep soil layers, reaching its maximum at the 10th layer. This could be attributed to the longer soil memory in deep layers than shallow layers. For soil temperature, the reduction in RMSE exhibits similar magnitude from the surface to deep soil layers, which may be explained by the significant heat transfer across different soil layers in regulating soil temperature throughout the soil column.
Figure 9 shows the time evolutions of the vertically averaged global mean soil moisture and temperature bias and RMSE differences. For soil moisture bias (Fig. 9a), CTRL exhibits dry biases during the first 20 years and wet biases afterwards. In contrast, Assim shows smaller biases during both periods by reducing the dry bias prior to ∼ 2000 and the wet bias thereafter. Assim also exhibits reduced RMSE (Fig. 9b) for soil moisture throughout the entire 37-year period. For soil temperature bias (Fig. 9c), CTRL and Assim display comparable performances, possibly due to the small magnitude of model deviation in soil temperature. The RMSE differences (Fig. 9d) suggest that Assim decreases the RMSE for soil temperature in the majority of months, with 74.10 % of the total months in Assim exhibiting lower RMSE than CTRL. In summary, the superior performance for both soil moisture and temperature in Assim demonstrates that land reanalysis information has been effectively incorporated into the model variables through the WCLDA system.
Noticeably, the simulated soil temperature and soil moisture display similar long-term trends, with cold and dry biases before ∼ 2000 and warm and wet biases afterwards. The soil temperature biases may be related to the global surface air temperature simulated in E3SMv2, which is notably too cold compared to the observed record during the 1970s and 1980s while the model warms up quickly after ∼ year 2000 (see Fig. 23 of Golaz et al., 2022). The global surface air temperature biases during the past decades in E3SMv1 and v2 have been attributed to the strong aerosol forcing in the model (Golaz et al., 2019, 2022). As the global mean precipitation scales with the surface temperature at ∼ 2 % per degree (Allen and Ingram, 2002), model biases in surface temperature are reflected in biases in precipitation and hence soil moisture, resulting in similar long-term trends between soil temperature and soil moisture biases in the simulations.
3.5 The 2012 US Midwest drought
To further evaluate the performance of the WCLDA system, we briefly investigate the impact of land data assimilation on simulating the temporal evolution of the US Midwest drought in 2012. Time series of soil moisture percentiles over the Midwest (36–50° N, 102–88° W) demonstrate significant improvements by Assim in reproducing the time evolution of agricultural drought in 2012 compared with CTRL (Fig. 10). From ERA-Interim data, the agricultural drought starts in August 2011, followed by a brief relief in early spring of 2012, a peak in September 2012, and recovery by January 2013. The drought developed rapidly between May and July 2012 over a widespread area including the central and midwestern US. This flash drought caused significant agricultural damages and economic losses.
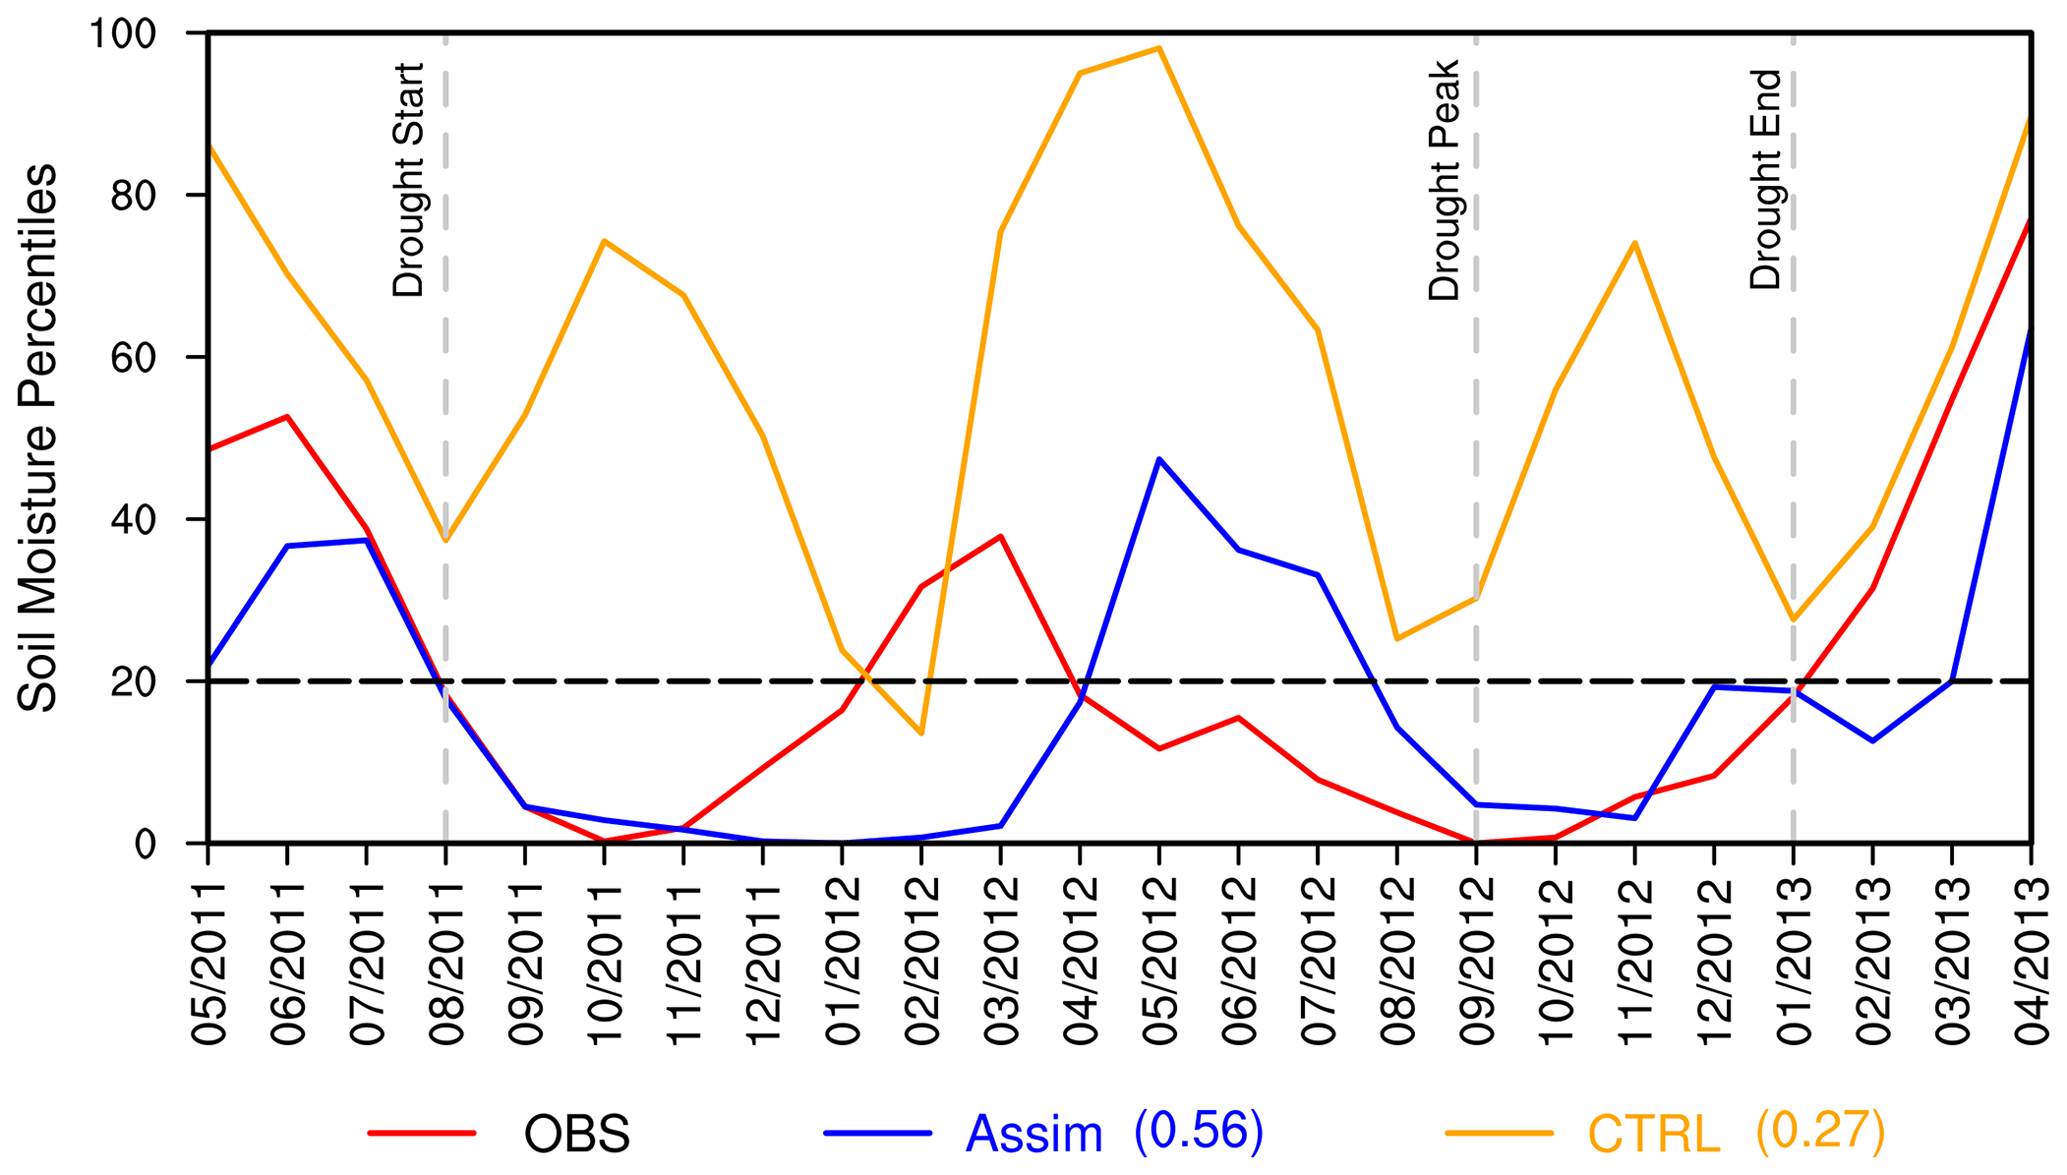
Figure 10Time series of soil moisture percentiles between May 2011 and April 2013 during the 2012 US Midwest drought. The red line shows the observation, the blue line shows Assim, and the orange line shows CTRL. The correlation coefficients of Assim and CTRL with observations are also shown. The three vertical dashed lines mark the timing of drought start, drought peak, and drought end, respectively. The start of the agricultural drought is defined as the month when soil moisture falls below the 20th percentile. The soil moisture percentiles are averaged over the US Midwest (36–50° N, 102–88° W). The observed soil moisture is derived from ERA-Interim monthly soil moisture data.
The free-running CTRL experiment fails to simulate the temporal evolution of the 2012 Midwest drought, with a correlation coefficient between CTRL and ERA-Interim of only 0.27. The onset and peak of the drought are remarkably well captured by Assim, although the drought recovery occurs 2 months later than observed. The correlation coefficient of the Assim time series with ERA-Interim is 0.56, which is statistically significant at the 95 % confidence level. Our results highlight the importance of land surface states for the drought lifecycle, with the potential to improve future drought predictions through the implementation of the WCLDA system.
In this study, we developed the 4DEnVar-based WCLDA system for the E3SMv2 model and evaluated the performance of this WCLDA system. The DRP-4DVar method was employed for implementing 4DVar using the ensemble method rather than the adjoint technique. Special attention is paid to directly assimilating monthly mean land reanalysis data in this system without interpolating to every time step. Within each 1-month assimilation window, we assimilate land reanalysis information into the coupled model without breaking the land–atmosphere interaction, which is important for the WCLDA system to be used to understand the potential sources of predictability provided by land.
Monthly mean anomalies of soil moisture and temperature from the GLDAS reanalysis are assimilated from 1980 to 2016 through the WCLDA system, and its performance is evaluated using multiple metrics, including the cost function, AE index, correlation, RMSE, and bias. Compared with CTRL, the cost function is reduced by Assim in most months, suggesting that the GLDAS reanalysis data has been effectively incorporated into the model. In terms of both soil moisture and temperature, Assim outperforms CTRL with lower RMSE and higher temporal correlation in many regions, especially in South America, central Africa, Australia, and large parts of Eurasia. For soil moisture bias, Assim further decreases the dry bias during the first 20 years and the wet bias thereafter. It is noteworthy that the subseasonal-to-seasonal time evolution of soil moisture percentiles during the 2012 US Midwest drought can be quite well captured in Assim, underscoring the significant role of land surface states in drought propagation.
Our current WCLDA system has some limitations and requires future improvements. Future enhancements of our WCLDA system will explore the assimilation of additional land products, particularly those derived from satellite observations. The incorporation of such satellite-based datasets is expected to further improve the performance of the WCLDA system. It is possible that the influence of the WCLDA system on atmospheric processes may be limited in some domains due to uncertainties of the model parameterizations, particularly in representing land–atmosphere interactions (Zhou et al., 2023). For example, in humid regions where the evaporation process is predominantly energy limited, the assimilation of soil moisture tends to exert limited influence. Instead, the assimilation of soil temperature may yield more substantial improvements. This underscores the importance of the unique characteristics and constraints presented by complicated regional conditions in the application of assimilation processes. To this end, the application of the WCLDA system would motivate future work to better understand the roles of the land surface in climate variability and provide a foundational resource for future predictability studies by the E3SM community.
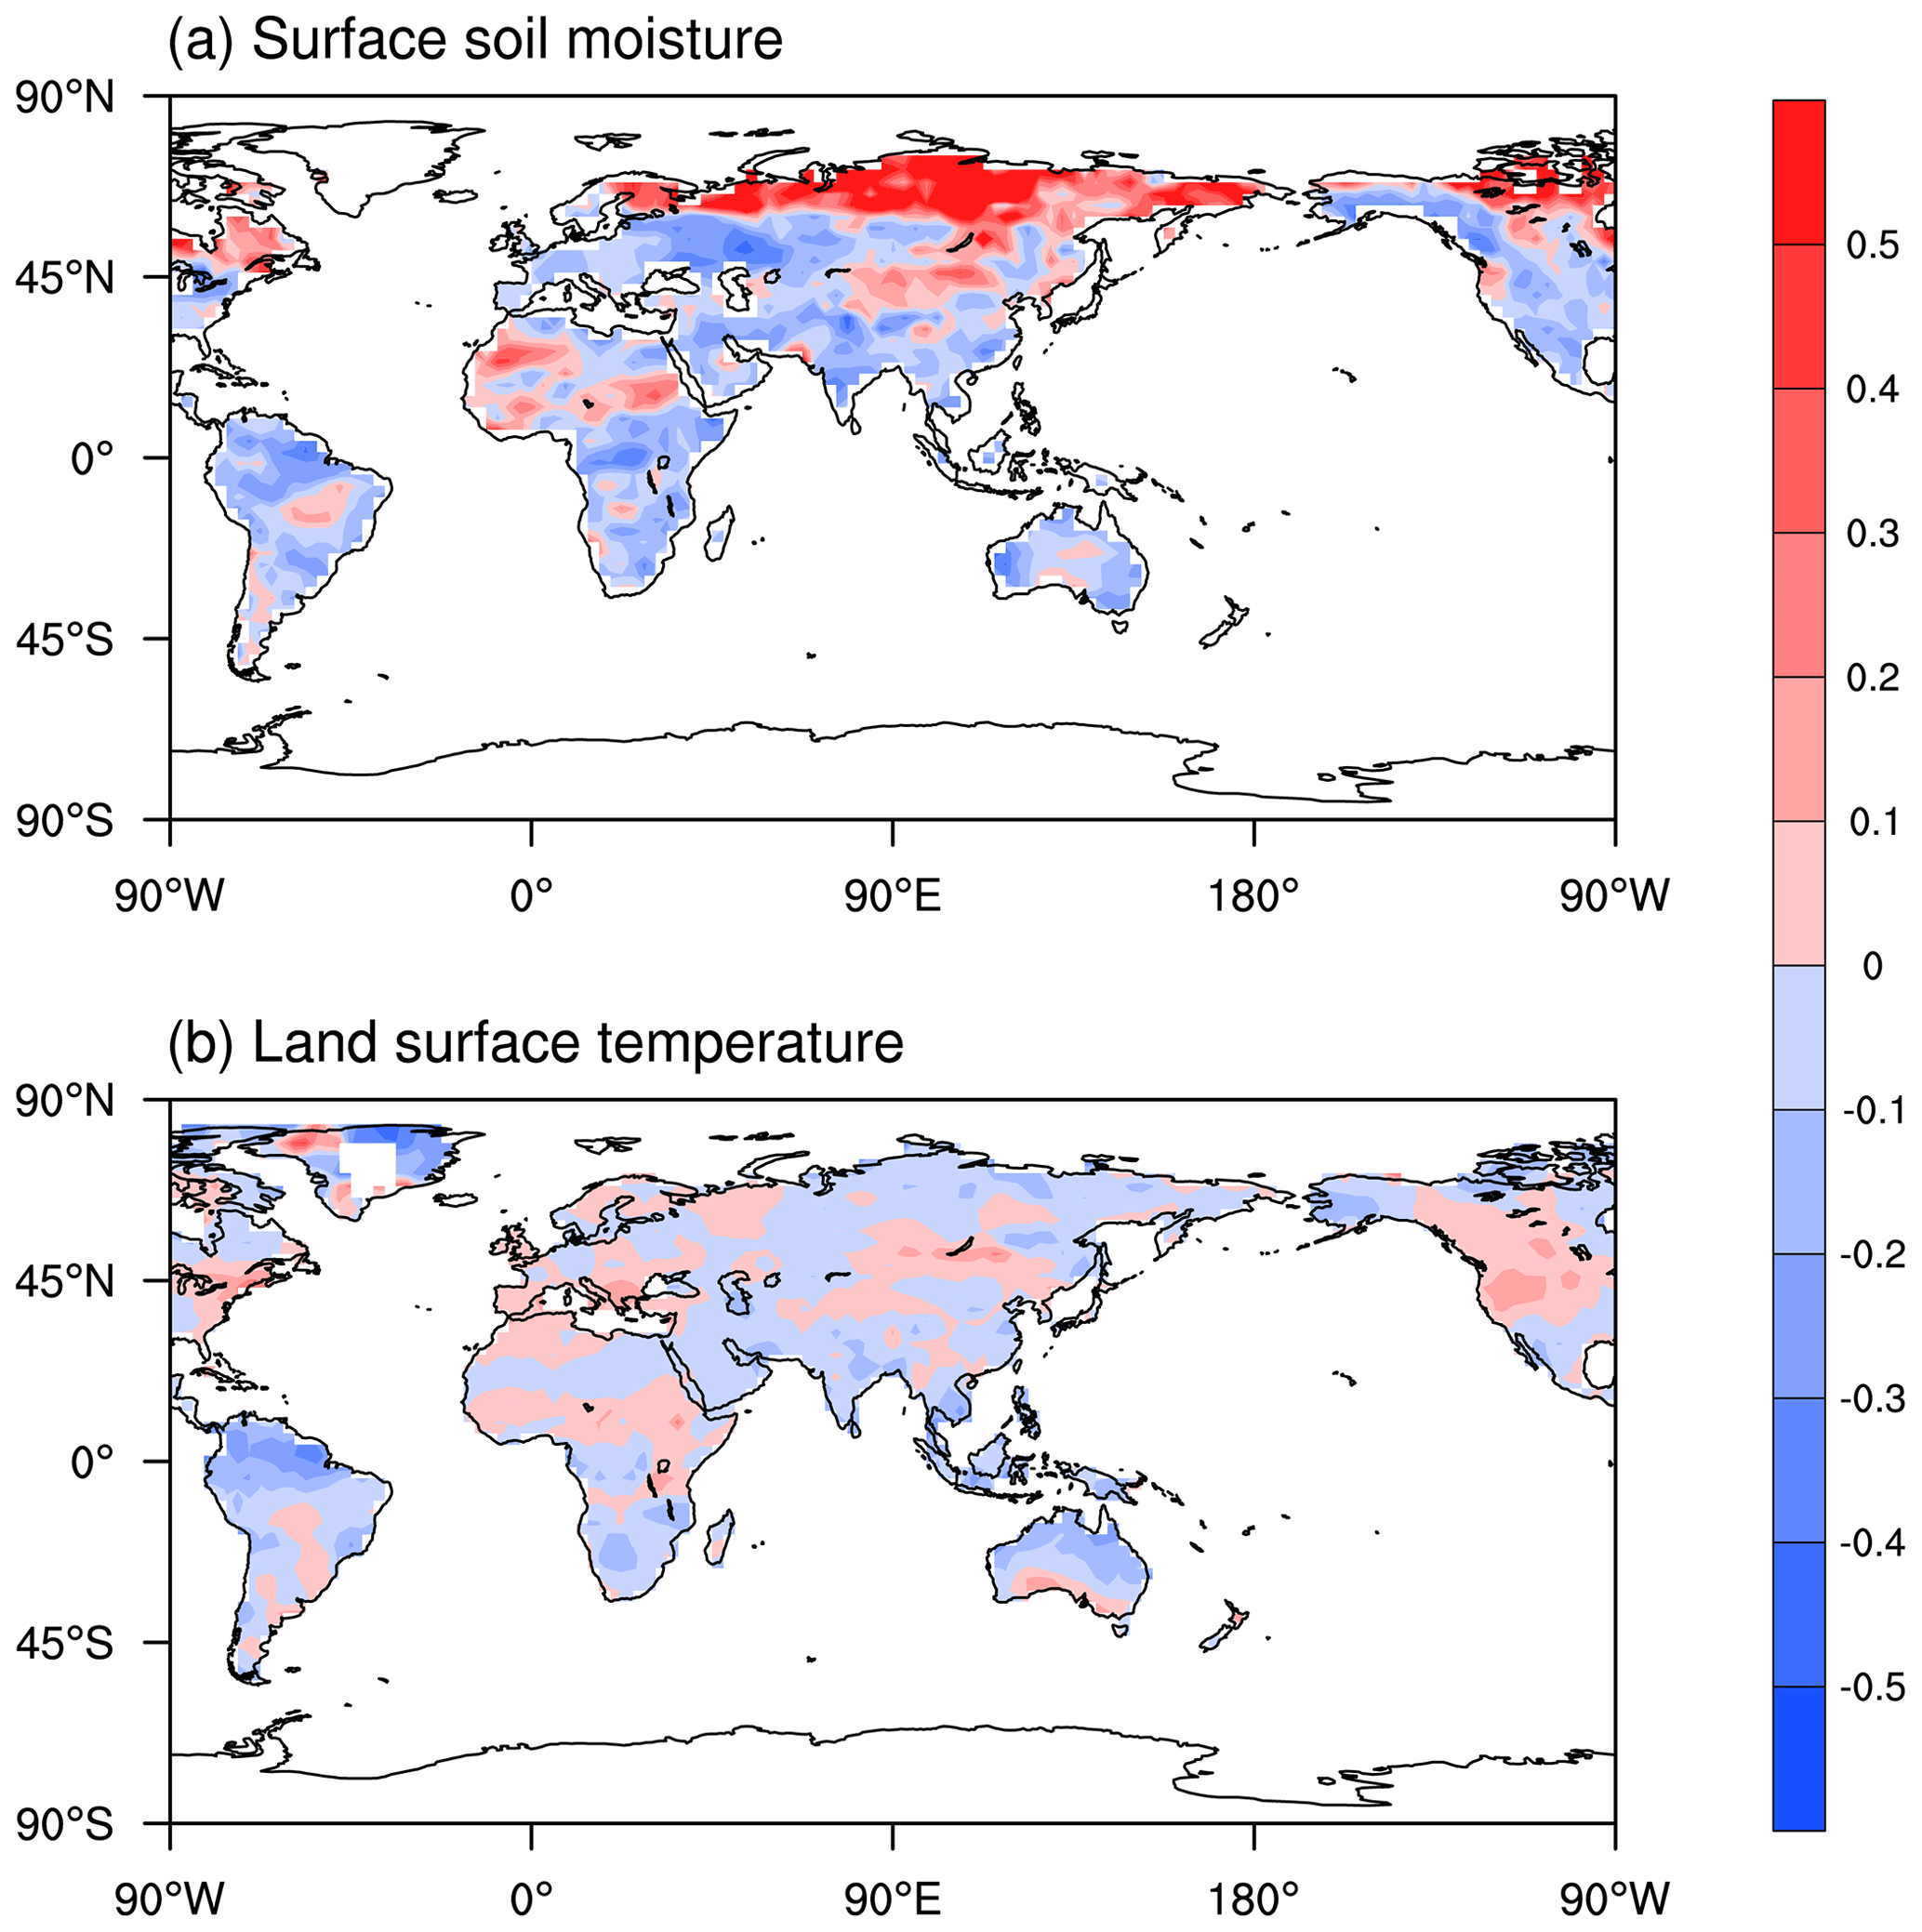
Figure A1Spatial distribution of the AE index for (a) surface soil moisture and (b) land surface temperature during the 2003–2014 period. The surface soil moisture and land surface temperature are derived from monthly AMSR and MODIS satellite data, respectively.
The E3SMv2 source codes used in this study can be accessed on Zenodo at https://doi.org/10.5281/zenodo.8194050 (Shi, 2023a). The GLDAS monthly soil moisture and soil temperature data are available online (https://disc.gsfc.nasa.gov/datasets?keywords=GLDAS, NASA Global Land Data Assimilation System, 2007). The MODIS monthly land surface temperature data can be downloaded from the website (https://doi.org/10.5067/4SI45J6G6BW5, GES DISC Northern Eurasian Earth Science Partnership Initiative Project, 2001). The AMSR monthly surface soil moisture data are available from https://doi.org/10.11888/Soil.tpdc.270960 (Yao and Lu, 2020). The ERA-Interim monthly soil moisture data are available at https://doi.org/10.5065/D6CR5RD9 (European Centre for Medium-Range Weather Forecasts, 2009). The model data used in this study can be found on Zenodo at https://doi.org/10.5281/zenodo.8148737 (Shi, 2023b).
LRL initiated this study. PS and LRL designed the experiments. PS developed the data assimilation code and performed the simulations. BW provided advice on the data assimilation technique, and KZ and SZ provided assistance with the E3SM model. PS and LRL analyzed and interpreted the data. PS and LRL wrote the paper. BW, KZ, SMH, and SZ contributed to the revision of the paper.
The contact author has declared that none of the authors has any competing interests.
Publisher's note: Copernicus Publications remains neutral with regard to jurisdictional claims made in the text, published maps, institutional affiliations, or any other geographical representation in this paper. While Copernicus Publications makes every effort to include appropriate place names, the final responsibility lies with the authors.
This research was supported by the Office of Science, Department of Energy Biological and Environmental Research as part of the Regional and Global Model Analysis program area. Pacific Northwest National Laboratory is operated by Battelle Memorial Institute for the U.S. Department of Energy under contract no. DE-AC05-76RL01830.
This research has been supported by the U.S. Department of Energy Office of Science Biological and Environmental Research through the Water Cycle and Climate Extremes Modeling (WACCEM) scientific focus area supported by the Regional and Global Model Analysis program area.
This paper was edited by Yuefei Zeng and reviewed by three anonymous referees.
Allen, M. R. and Ingram, W. J.: Constraints on future changes in climate and the hydrologic cycle, Nature, 419, 224–232, https://doi.org/10.1038/nature01092, 2002.
Ardilouze, C., Batté, L., Bunzel, F., Decremer, D., Déqué, M., Doblas-Reyes, F. J., Douville, H., Fereday, D., Guemas, V., MacLachlan, C., and Müller, W.: Multi-model assessment of the impact of soil moisture initialization on mid-latitude summer predictability, Clim. Dynam., 49, 3959–3974, https://doi.org/10.1007/s00382-017-3555-7, 2017.
Balmaseda, M. A., Alves, O. J., Arribas, A., Awaji, T., Behringer, D. W., Ferry, N., Fujii, Y., Lee, T., Rienecker, M., Rosati, T., and Stammer, D.: Ocean initialization for seasonal forecasts, Oceanography, 22, 154–159, https://doi.org/10.5670/oceanog.2009.73, 2009.
Bellucci, A., Gualdi, S., Masina, S., Storto, A., Scoccimarro, E., Cagnazzo, C., Fogli, P., Manzini, E., and Navarra, A.: Decadal climate predictions with a coupled OAGCM initialized with oceanic reanalyses, Clim. Dynam., 40, 1483–1497, https://doi.org/10.1007/s00382-012-1468-z, 2013.
Boer, G. J., Smith, D. M., Cassou, C., Doblas-Reyes, F., Danabasoglu, G., Kirtman, B., Kushnir, Y., Kimoto, M., Meehl, G. A., Msadek, R., Mueller, W. A., Taylor, K. E., Zwiers, F., Rixen, M., Ruprich-Robert, Y., and Eade, R.: The Decadal Climate Prediction Project (DCPP) contribution to CMIP6, Geosci. Model Dev., 9, 3751–3777, https://doi.org/10.5194/gmd-9-3751-2016, 2016.
Browne, P. A., De Rosnay, P., Zuo, H., Bennett, A., and Dawson, A.: Weakly coupled ocean-atmosphere data assimilation in the ECMWF NWP system, Remote Sens., 11, 234, https://doi.org/10.3390/rs11030234, 2019.
Buehner, M., Du, P., and Bédard, J.: A new approach for estimating the observation impact in ensemble–variational data assimilation, Mon. Weather Rev., 146, 447-465, https://doi.org/10.1175/MWR-D-17-0252.1, 2018.
Carrassi, A., Weber, R. J. T., Guemas, V., Doblas-Reyes, F. J., Asif, M., and Volpi, D.: Full-field and anomaly initialization using a low-order climate model: a comparison and proposals for advanced formulations, Nonlin. Processes Geophys., 21, 521–537, https://doi.org/10.5194/npg-21-521-2014, 2014.
Chen, Z., Zeng, Y., Shen, G., Xiao, C., Xu, L., and Chen, N. C.: Spatiotemporal characteristics and estimates of extreme precipitation in the Yangtze River Basin using GLDAS data, Int. J. Climatol., 41, 1812–1830, https://doi.org/10.1002/joc.6813, 2021.
Collins, M. and Allen, M. R.: Assessing the relative roles of initial and boundary conditions in interannual to decadal climate predictability, J. Climate, 15, 3104–3109, https://doi.org/10.1175/1520-0442(2002)015<3104:ATRROI>2.0.CO;2, 2002.
Conil, S., Douville, H., and Tyteca, S.: The relative influence of soil moisture and SST in climate predictability explored within ensembles of AMIP type experiments, Clim. Dynam., 28, 125–145, https://doi.org/10.1007/s00382-006-0172-2, 2007.
Courtier, P., Thépaut, J. M., and Hollingsworth, A.: A strategy for operational implementation of 4D-Var, using an incremental approach, Q. J. Roy. Meteor. Soc., 120, 1367–1387, https://doi.org/10.1002/qj.49712051912, 1994.
Craig, A. P., Vertenstein, M., and Jacob, R.: A new flexible coupler for Earth system modeling developed for CCSM4 and CESM1, Int. J. High Perform. C., 26, 31–42, https://doi.org/10.1177/1094342011428141, 2012.
Dee, D. P., Balmaseda, M., Balsamo, G., Engelen, R., Simmons, A. J., and Thépaut, J. N.: Toward a consistent reanalysis of the climate system, B. Am. Meteorol. Soc., 95, 1235–1248, https://doi.org/10.1175/BAMS-D-13-00043.1, 2014.
Dennis, J. M., Edwards, J., Loy, R., Jacob, R., Mirin, A. A., Craig, A. P., and Vertenstein, M.: An application-level parallel I/O library for Earth system models, Int. J. High Perform. C., 26, 43–53, https://doi.org/10.1177/1094342011428143, 2012.
Du, H., Doblas-Reyes, F. J., García-Serrano, J., Guemas, V., Soufflet, Y., and Wouters, B.: Sensitivity of decadal predictions to the initial atmospheric and oceanic perturbations, Clim. Dynam., 39, 2013–2023, https://doi.org/10.1007/s00382-011-1285-9, 2012.
Du, J., Kimball, J. S., Velicogna, I., Zhao, M., Jones, L. A., Watts, J. D., and Kim, Y.: Multicomponent satellite assessment of drought severity in the contiguous United States from 2002 to 2017 using AMSR-E and AMSR2, Water Resour. Res., 55, 5394–5412, https://doi.org/10.1029/2018WR024633, 2019.
Edwards, A. C., Scalenghe, R., and Freppaz, M.: Changes in the seasonal snow cover of alpine regions and its effect on soil processes: a review, Quaternary Int., 162, 172–181, https://doi.org/10.1016/j.quaint.2006.10.027, 2007.
European Centre for Medium-Range Weather Forecasts: ERA-Interim Project. Research Data Archive at the National Center for Atmospheric Research, Computational and Information Systems Laboratory [data set], https://doi.org/10.5065/D6CR5RD9, 2009.
Eyring, V., Bony, S., Meehl, G. A., Senior, C. A., Stevens, B., Stouffer, R. J., and Taylor, K. E.: Overview of the Coupled Model Intercomparison Project Phase 6 (CMIP6) experimental design and organization, Geosci. Model Dev., 9, 1937–1958, https://doi.org/10.5194/gmd-9-1937-2016, 2016.
Fowler, A. M. and Lawless, A. S.: An idealized study of coupled atmosphere–ocean 4D-Var in the presence of model error, Mon. Weather Rev., 144, 4007–4030, https://doi.org/10.1175/MWR-D-15-0420.1, 2016.
Fujii, Y., Nakaegawa, T., Matsumoto, S., Yasuda, T., Yamanaka, G., and Kamachi, M.: Coupled climate simulation by constraining ocean fields in a coupled model with ocean data, J. Climate, 22, 5541–5557, https://doi.org/10.1175/2009JCLI2814.1, 2009.
Gao, F., Hilker, T., Zhu, X., Anderson, M., Masek, J., Wang, P., and Yang, Y.: Fusing Landsat and MODIS data for vegetation monitoring, IEEE Geosci. Remote Sens., 3, 47–60, https://doi.org/10.1109/MGRS.2015.2434351, 2015.
GES DISC Northern Eurasian Earth Science Partnership Initiative Project: MODIS/Terra Monthly mean Day-Time Land Surface Temperature at 1x1 degree V005, Greenbelt, MD, USA, Goddard Earth Sciences Data and Information Services Center (GES DISC) [data set], https://doi.org/10.5067/4SI45J6G6BW5, 2001.
Girotto, M., De Lannoy, G. J., Reichle, R. H., and Rodell, M.: Assimilation of gridded terrestrial water storage observations from GRACE into a land surface model, Water Resour. Res., 52, 4164–4183, https://doi.org/10.1002/2015WR018417, 2016.
Golaz, J. C., Caldwell, P. M., Van Roekel, L. P., Petersen, M. R., Tang, Q., Wolfe, J. D., Abeshu, G., Anantharaj, V., Asay-Davis, X. S., Bader, D. C., Baldwin, S. A., Bisht, G., Bogenschutz, P. A., Branstetter, M., Brunke, M. A., Brus, S. R., Burrows, S. M., Cameron-Smith, P. J., Donahue, A. S., Deakin, M., Easter, R. C., Evans, K. J., Feng, Y., Flanner, M., Foucar, J. G., Fyke, J. G., Griffin, B. M., Hannay, C., Harrop, B. E., Hoffman, M. J., Hunke, E. C., Jacob, R. L., Jacobsen, D. W., Jeffery, N., Jones, P. W., Keen, N. D., Klein, S. A., Larson, V. E., Leung, L. R., Li, H. Y., Lin, W., Lipscomb, W. H., Ma, P. L., Mahajan, S., Maltrud, M. E., Mametjanov, A., McClean, J. L., McCoy, R. B., Neale, R. B., Price, S. F., Qian, Y., Rasch, P. J., Reeves Eyre, J. E. J., Riley, W. J., Ringler, T. D., Roberts, A. F., Roesler, E. L., Salinger, A. G., Shaheen, Z., Shi, X., Singh, B., Tang, J., Taylor, M. A., Thornton, P. E., Turner, A. K., Veneziani, M., Wan, H., Wang, H., Wang, S., Williams, D. N., Wolfram, P. J., Worley, P. H., Xie, S., Yang, Y., Yoon, J.-H., Zelinka, M. D., Zender, C. S., Zeng, X., Zhang, C., Zhang, K., Zhang, Y., Zheng, X., Zhou, T., and Zhu, Q.: The DOE E3SM Coupled Model Version 1: Overview and Evaluation at Standard Resolution, J. Adv. Model. Earth Sy., 11, 2089–2129, https://doi.org/https://doi.org/10.1029/2018MS001603, 2019.
Golaz, J. C., Van Roekel, L. P., Zheng, X., Roberts, A. F., Wolfe, J. D., Lin, W. Y., Bradley, A. M., Tang, Q., Maltrud, M. E., Forsyth, R. M., Zhang, C. Z., Zhou, T., Zhang, K., Zender, C. S., Wu, M. X., Wang, H. L., Turner, A. K., Singh, B., Richter, J. H., Qin, Y., Petersen, M. R., Mametjanov, A., Ma, P., Larson, V. E., Krishna, J., Keen, N. D., Jeffery, N., Hunke, E. C., Hannah, W. M., Guba, O., Griffin, B. M., Feng, Y., Engwirda, D., Vittorio, A. V., Cheng, D., Conlon, L. M., Chen, C., Brunke, M. A., Bisht, G., Benedict, J. J., Asay-Davis, X. S., Zhang, Y. Y., Zhang, M., Zeng, X. B., Xie, S. C., Wolfram, P. J., Vo, T., Veneziani, M., Tesfa, T. K., Sreepathi, S., Salinger, A. G., Jack Reeves Eyre, J. E., Prather, M. J., Mahajan, S., Li, Q., Jones, P. W., Jacob, R. L., Huebler, G. W., Huang, X. L., Hillman, B. R., Harrop, B. E., Foucar, J. G., Fang, Y. L., Comeau, D. S., Caldwell, P. M., Bartoletti, T., Balaguru, K., Taylor, M. A., McCoy, R. B., Leung, L. R., and Bader, D. C.: The DOE E3SM Model version 2: Overview of the physical model and initial model evaluation, J. Adv. Model. Earth Sy., 14, e2022MS003156, https://doi.org/10.1029/2022MS003156, 2022.
Guo, Z., Dirmeyer, P. A., Delsole, T., and Koster, R. D.: Rebound in atmospheric predictability and the role of the land surface, J. Climate, 25, 4744–4749, https://doi.org/10.1175/JCLI-D-11-00651.1, 2012.
He, Y., Wang, B., Liu, M., Liu, L., Yu, Y., Liu, J., Li, R., Zhang, C., Xu, S., Huang, W., Liu, Q., Wang, Y., and Li, F.: Reduction of initial shock in decadal predictions using a new initialization strategy, Geophys. Res. Lett., 44, 8538–8547, https://doi.org/10.1002/2017GL074028, 2017.
He, Y., Wang, B., Liu, L., Huang, W., Xu, S., Liu, J., Wang, Y., Li, L., Huang, X., Peng, Y., Lin, Y., and Yu, Y.: A DRP-4DVar-based coupled data assimilation system with a simplified off-line localization technique for decadal predictions, J. Adv. Model. Earth Sy., 12, e2019MS001768, https://doi.org/10.1029/2019MS001768, 2020a.
He, Y., Wang, B., Huang, W., Xu, S., Wang, Y., Liu, L., Li, L., Liu, J., Yu, Y., Lin, Y., Huang, X., and Peng, Y.: A new DRP-4DVar-based coupled data assimilation system for decadal predictions using a fast online localization technique, Clim. Dynam., 54, 3541–3559, https://doi.org/10.1007/s00382-020-05190-w, 2020b.
Hoke, J. E. and Anthes, R. A.: The initialization of numerical models by a dynamic-initialization technique, Mon. Weather Rev., 104, 1551–1556, https://doi.org/10.1175/1520-0493(1976)104<1551:TIONMB>2.0.CO;2, 1976.
Houborg, R., Rodell, M., Li, B., Reichle, R., and Zaitchik, B. F.: Drought indicators based on model-assimilated Gravity Recovery and Climate Experiment (GRACE) terrestrial water storage observations, Water Resour. Res., 48, W07525, https://doi.org/10.1029/2011WR011291, 2012.
Hu, S., Zhou, T., and Wu, B.: Improved ENSO prediction skill resulting from reduced climate drift in IAP-DecPreS: A comparison of full-field and anomaly initializations, J. Adv. Model. Earth Sy., 12, e2019MS001759, https://doi.org/10.1029/2019MS001759, 2020.
Ireson, A. M., Van Der Kamp, G., Ferguson, G., Nachshon, U., and Wheater, H. S.: Hydrogeological processes in seasonally frozen northern latitudes: understanding, gaps and challenges, Hydrogeol. J., 21, 53–66, https://doi.org/10.1007/s10040-012-0916-5, 2013.
Justice, C. O., Townshend, J. R. G., Vermote, E. F., Masuoka, E., Wolfe, R. E., Saleous, N., Roy, D. P., and Morisette, J. T.: An overview of MODIS Land data processing and product status, Remote Sens. Environ., 83, 3–15, https://doi.org/10.1016/S0034-4257(02)00084-6, 2002.
Kimmritz, M., Counillon, F., Bitz, C. M., Massonnet, F., Bethke, I., and Gao, Y.: Optimising assimilation of sea ice concentration in an Earth system model with a multicategory sea ice model, Tellus, 70A, 1435945, https://doi.org/10.1080/16000870.2018.1435945, 2018.
Kwon, Y., Yang, Z. L., Zhao, L., Hoar, T. J., Toure, A. M., and Rodell, M.: Estimating snow water storage in North America using CLM4, DART, and snow radiance data assimilation, J. Hydrometeorol., 17, 2853–2874, https://doi.org/10.1175/JHM-D-16-0028.1, 2016.
Lea, D. J., Mirouze, I., Martin, M. J., King, R. R., Hines, A., Walters, D., and Thurlow, M.: Assessing a new coupled data assimilation system based on the Met Office coupled atmosphere–land–ocean–sea ice model, Mon. Weather Rev., 143, 4678–4694, https://doi.org/10.1175/MWR-D-15-0174.1, 2015.
Lei, L. L. and Hacker, J. P.: Nudging, ensemble, and nudging ensembles for data assimilation in the presence of model error, Mon. Weather Rev., 143, 2600–2610, https://doi.org/10.1175/MWR-D-14-00295.1, 2015.
Leung, L. R., Bader, D. C., Taylor, M. A., and McCoy, R. B.: An introduction to the E3SM special collection: Goals, science drivers, development, and analysis, J. Adv. Model. Earth Sy., 12, e2019MS001821, https://doi.org/10.1029/2019MS001821, 2020.
Li, F., Wang, B., He, Y., Huang, W., Xu, S., Liu, L., Liu, J. and Li, L.: Important role of North Atlantic air–sea coupling in the interannual predictability of summer precipitation over the eastern Tibetan Plateau, Clim. Dynam., 56, 1433–1448, https://doi.org/10.1007/s00382-020-05542-6, 2021.
Li, H. Y., Wigmosta, M. S., Wu, H., Huang, M., Ke, Y., Coleman, A. M., and Leung, L. R.: A physically based runoff routing model for land surface and Earth system models, J. Hydrometeorol., 14, 808–828, https://doi.org/10.1175/JHM-D-12-015.1, 2013.
Lin, L. F., Ebtehaj, A. M., Wang, J., and Bras, R. L.: Soil moisture background error covariance and data assimilation in a coupled land-atmosphere model, Water Resour. Res., 53, 1309–1335, https://doi.org/10.1002/2015WR017548, 2017.
Lin, P., Yang, Z. L., Wei, J., Dickinson, R. E., Zhang, Y., and Zhao, L.: Assimilating multi-satellite snow data in ungauged Eurasia improves the simulation accuracy of Asian monsoon seasonal anomalies, Environ. Res. Lett., 15, 064033, https://doi.org/10.1088/1748-9326/ab80ef, 2020.
Liu, D. and Mishra, A. K.: Performance of AMSR_E soil moisture data assimilation in CLM4.5 model for monitoring hydrologic fluxes at global scale, J. Hydrometeorol., 547, 67–79, https://doi.org/10.1016/j.jhydrol.2017.01.036, 2017.
Liu, J. J., Wang, B., and Xiao, Q. N.: An evaluation study of the DRP-4-DVar approach with the Lorenz-96 model, Tellus A, 63, 256–262, https://doi.org/10.1111/j.1600-0870.2010.00487.x, 2011.
Lorenc, A. C., Bowler, N. E., Clayton, A. M., Pring, S. R., and Fairbairn, D.: Comparison of hybrid-4DEnVar and hybrid-4DVar data assimilation methods for global NWP, Mon. Weather Rev., 143, 212–229, https://doi.org/10.1175/MWR-D-14-00195.1, 2015.
McCabe, M. F., Wood, E. F., Wójcik, R., Pan, M., Sheffield, J., Gao, H., and Su, H.: Hydrological consistency using multi-sensor remote sensing data for water and energy cycle studies, Remote Sens. Environ., 112, 430–444, https://doi.org/10.1016/j.rse.2007.03.027, 2008.
Mertes, C. M., Schneider, A., Sulla-Menashe, D., Tatem, A. J., and Tan, B.: Detecting change in urban areas at continental scales with MODIS data, Remote Sens. Environ., 158, 331–347, https://doi.org/10.1016/j.rse.2014.09.023, 2015.
Mochizuki, T., Masuda, S., Ishikawa, Y., and Awaji, T.: Multiyear climate prediction with initialization based on 4D-Var data assimilation, Geophys. Res. Lett., 43, 3903–3910, https://doi.org/10.1002/2016GL067895, 2016.
NASA Global Land Data Assimilation System: GLDAS CLM Land Surface Model monthly 1.0 x 1.0 degree [data set], https://disc.gsfc.nasa.gov/datasets?keywords=GLDAS (last access: June 2007), 2007.
Njoku, E. G., Jackson, T. J., Lakshmi, V., Chan, T. K., and Nghiem, S. V.: Soil moisture retrieval from AMSR-E, IEEE T. Geosci. Remote, 41, 215–229, https://doi.org/10.1109/TGRS.2002.808243, 2003.
Oleson, K. W., Lawrence, D. M., Bonan, G. B., Drewniak, B., Huang, M., Koven, C. D., Levis, S., Li, F., Riley, W. J., Subin, Z. M., Swenson, S. C., Thornton, P. E., Bozbiyik, A., Fisher, R., Heald, C. L., Kluzek, E., Lamarque, J. F., Lawrence, P. J., Leung, L. R., Lipscomb, W., Muszala, S., Ricciuto, D. M., Sacks, W., Sun, Y., Tang, J., and Yang, Z. L.: Technical description of version 4.5 of the Community Land Model (CLM) (Tech. Rep. NCAR/TN-503+STR). Boulder, Colorado, USA: National Center for Atmospheric Research, https://doi.org/10.5065/D6RR1W7M, 2013.
Penny, S. G. and Hamill, T. M.: Coupled data assimilation for integrated earth system analysis and prediction, B. Am. Meteorol. Soc., 98, ES169–ES172, https://doi.org/10.1175/BAMS-D-17-0036.1, 2017.
Penny, S. G., Bach, E., Bhargava, K., Chang, C. C., Da, C., Sun, L., and Yoshida, T.: Strongly coupled data assimilation in multiscale media: Experiments using a quasi-geostrophic coupled model, J. Adv. Model. Earth Sy., 11, 1803–1829, https://doi.org/10.1029/2019MS001652, 2019.
Petersen, M., Asay-Davis, X. S., Jacobsen, D., Maltrud, M., Ringler, T., Van Roekel, L., and Wolfram, P.: MPAS ocean user's guide V6, Zenodo, https://doi.org/10.5281/zenodo.1246893, 2018.
Polkova, I., Köhl, A., and Stammer, D.: Climate-mode initialization for decadal climate predictions, Clim. Dynam., 53, 7097–7111, https://doi.org/10.1007/s00382-019-04975-y, 2019.
Reckinger, S. M., Petersen, M. R., and Reckinger, S. J.: A study of overflow simulations using MPAS-Ocean: Vertical grids, resolution, and viscosity, Ocean Model., 96, 291–313, https://doi.org/10.1016/j.ocemod.2015.09.006, 2015.
Remer, L. A., Kaufman, Y. J., Tanré, D., Mattoo, S., Chu, D. A., Martins, J. V., Li, R. R., Ichoku, C., Levy, R. C., Kleidman, R. G., Eck, T. F., Vermote, E., and Holben, B. N.: The MODIS aerosol algorithm, products, and validation, J. Atmos. Sci., 62, 947–973, https://doi.org/10.1175/JAS3385.1, 2005.
Rodell, M., Houser, P. R., Jambor, U., Gottschalck, J., Mitchell, K., Meng, C. J., Arsenault, K., Cosgrove, B., Radakovich, J., Bosilovich, M. and Entin, J. K., Walker, J. P., Lohmann, D., and Toll, D.: The global land data assimilation system, B. Am. Meteorol. Soc., 85, 381–394, https://doi.org/10.1175/BAMS-85-3-381, 2004.
Sakaguchi, K., Zeng, X., and Brunke, M. A.: The hindcast skill of the CMIP ensembles for the surface air temperature trend, J. Geophys. Res.-Atmos., 117, D1611, https://doi.org/10.1029/2012JD017765, 2012.
Shi, P.: E3SMv2 source codes, Zenodo [code], https://doi.org/10.5281/zenodo.8194050, 2023a.
Shi, P.: Data for the analyses, Zenodo [data set] https://doi.org/10.5281/zenodo.8148737, 2023b.
Shi, P. F., Wang, B., He, Y., Lu, H., Yang, K., Xu, S. M., Huang, W. Y., Liu, L., Liu, J. J., Li, L. J., and Wang, Y.: Contributions of weakly coupled data assimilation–based land initialization to interannual predictability of summer climate over Europe, J. Climate, 35, 517–535, https://doi.org/10.1175/JCLI-D-20-0506.1, 2022.
Simmons, A. J. and Hollingsworth, A.: Some aspects of the improvement in skill of numerical weather prediction, Q. J. Roy. Meteorol. Soc., 128, 647–677, https://doi.org/10.1256/003590002321042135, 2002.
Sluka, T. C., Penny, S. G., Kalnay, E., and Miyoshi, T.: Assimilating atmospheric observations into the ocean using strongly coupled ensemble data assimilation, Geophys. Res. Lett., 43, 752-759, https://doi.org/10.1002/2015GL067238, 2016.
Smith, D. M., Eade, R., and Pohlmann, H.: A comparison of full-field and anomaly initialization for seasonal to decadal climate prediction, Clim. Dynam., 41, 3325–3338, https://doi.org/10.1007/s00382-013-1683-2, 2013.
Smith, P. J., Fowler, A. M., and Lawless, A. S.: Exploring strategies for coupled 4DVar data assimilation using an idealised atmosphere–ocean model, Tellus A, 67, 27025, https://doi.org/10.3402/tellusa.v67.27025, 2015.
Sugiura, N., Awaji, T., Masuda, S., Mochizuki, T., Toyoda, T., Miyama, T., Igarashi, H., and Ishikawa, Y.: Development of a four-dimensional variational coupled data assimilation system for enhanced analysis and prediction of seasonal to interannual climate variations, J. Geophys. Res.-Oceans, 113, C10017, https://doi.org/10.1029/2008JC004741, 2008.
Taylor, K. E., Stouffer, R. J., and Meehl, G. A.: An overview of CMIP5 and the experiment design, B. Am. Meteorol. Soc., 93, 485–498, https://doi.org/10.1175/BAMS-D-11-00094.1, 2012.
Taylor, M. A., Guba, O., Steyer, A., Ullrich, P. A., Hall, D. M., and Eldrid, C.: An energy consistent discretization of the nonhydrostatic equations in primitive variables, J. Adv. Model. Earth Sy., 12, e2019MS001783, https://doi.org/10.1029/2019MS001783, 2020.
Volpi, D., Guemas, V., and Doblas-Reyes, F. J.: Comparison of full field and anomaly initialisation for decadal climate prediction: towards an optimal consistency between the ocean and sea-ice anomaly initialisation state, Clim. Dynam., 49, 1181–1195, https://doi.org/10.1007/s00382-016-3373-3, 2017.
Wang, B., Liu, J., Wang, S., Cheng, W., Liu, J., Liu, C., Xiao, Q., and Kuo, Y. H.: An economical approach to four-dimensional variational data assimilation, Adv. Atmos. Sci., 27, 715–727, https://doi.org/10.1007/s00376-009-9122-3, 2010.
Wang, B., Liu, J., Liu, L., Xu, S., and Huang, W.: An approach to localization for ensemble-based data assimilation, PloS one, 13, e0191088, https://doi.org/10.1371/journal.pone.0191088, 2018.
Wang, G., Dolman, A. J., Blender, R., and Fraedrich, K.: Fluctuation regimes of soil moisture in ERA-40 reanalysis data, Theor. Appl. Climatol., 99, 1–8, https://doi.org/10.1007/s00704-009-0111-3, 2010.
Yao, P. and Lu, H.: A long term global daily soil moisture dataset derived from AMSR-E and AMSR2 (2002–2022), National Tibetan Plateau/Third Pole Environment Data Center [data set], https://doi.org/10.11888/Soil.tpdc.270960, 2020.
Yao, Y., Luo, Y., Huang, J., and Ma, J.: Improving the downscaled springtime temperature in Central Asia through assimilating meteorological and snow cover observations, Atmos. Res., 258, 105619, https://doi.org/10.1016/j.atmosres.2021.105619, 2021.
Yin, J., Zhan, X., Zheng, Y., Liu, J., Hain, C. R., and Fang, L.: Impact of quality control of satellite soil moisture data on their assimilation into land surface model, Geophys. Res. Lett., 41, 7159–7166, https://doi.org/10.1002/2014GL060659, 2014.
Yoshida, T. and Kalnay, E.: Correlation-cutoff method for covariance localization in strongly coupled data assimilation, Mon. Weather Rev., 146, 2881–2889, https://doi.org/10.1175/MWR-D-17-0365.1, 2018.
Zeng, X. and Decker, M.: Improving the numerical solution of soil moisture–based Richards equation for land models with a deep or shallow water table, J. Hydrometeorol., 10, 308–319, https://doi.org/10.1175/2008JHM1011.1, 2009.
Zhang, H., Zhang, L. L., Li, J., An, R. D., and Deng, Y.: Climate and Hydrological Change Characteristics and Applicability of GLDAS Data in the Yarlung Zangbo River Basin, China, Water, 10, 254, https://doi.org/10.3390/w10030254, 2018.
Zhang, S., Harrison, M. J., Wittenberg, A. T., Rosati, A., Anderson, J. L., and Balaji, V.: Initialization of an ENSO forecast system using a parallelized ensemble filter, Mon. Weather Rev., 133, 3176–3201, https://doi.org/10.1175/MWR3024.1, 2005.
Zhang, S., Harrison, M. J., Rosati, A., and Wittenberg, A.: System design and evaluation of coupled ensemble data assimilation for global oceanic climate studies, Mon. Weather Rev., 135, 3541–3564, https://doi.org/10.1175/MWR3466.1, 2007.
Zhang, S., Liu, Z., Zhang, X., Wu, X., Han, G., Zhao, Y., Yu, X., Liu, C., Liu, Y., Wu, S., Lu, F., Li, M., and Deng, X.: Coupled data assimilation and parameter estimation in coupled ocean–atmosphere models: a review, Clim. Dynam., 54, 5127–5144, https://doi.org/10.1007/s00382-020-05275-6, 2020.
Zhou, J., Yang, K., Crow, W. T., Dong, J., Zhao, L., Feng, H., Zou, M., Lu, H., Tang, R. and Jiang, Y.: Potential of remote sensing surface temperature-and evapotranspiration-based land-atmosphere coupling metrics for land surface model calibration, Remote Sens. Environ., 291, 113557, https://doi.org/10.1016/j.rse.2023.113557, 2023.