the Creative Commons Attribution 4.0 License.
the Creative Commons Attribution 4.0 License.
 | 16 Apr 2024
Modeling boreal forest soil dynamics with the microbially explicit soil model MIMICS+ (v1.0)
Heleen A. de Wit
Terje K. Berntsen
Understanding carbon exchange processes between land reservoirs and the atmosphere is essential for predicting carbon–climate feedbacks. Still, considerable uncertainty remains in the representation of the terrestrial carbon cycle in Earth system models. An emerging strategy to constrain these uncertainties is to include the role of different microbial groups explicitly. Following this approach, we extend the framework of the MIcrobial-MIneral Carbon Stabilization (MIMICS) model with additional mycorrhizal groups and a nitrogen cycle that includes a novel representation of inorganic nitrogen sorption to particles via a Langmuir isotherm. MIMICS+ v1.0 is designed to capture and quantify relationships between soil microorganisms and their environment, with a particular emphasis on boreal ecosystems. We evaluated MIMICS+ against podzolic soil profiles in Norwegian forests as well as the conventional Community Land Model (CLM). MIMICS+ matched observed carbon stocks better than CLM and gave a broader range of C:N ratios, more in line with observations. This is mainly explained by a higher directly plant-derived fraction into the soil organic matter (SOM) pools. The model produces microbial biomass estimates in line with numbers reported in the literature. MIMICS+ also showed better representation of climate gradients than CLM, especially in terms of temperature. To investigate responses to changes in nutrient availability, we performed an N enrichment experiment and found that nitrogen sorbed to particles through the sorption algorithm served as a long-term storage of nutrients for the microbes. Furthermore, although the microbial groups responded considerably to the nitrogen enrichment, we only saw minor responses for carbon storage and respiration. Together, our results present MIMICS+ as an attractive tool for further investigations of interactions between microbial functioning and their (changing) environment.
- Article
(5035 KB) - Full-text XML
-
Supplement
(476 KB) - BibTeX
- EndNote


Among the carbon (C) stores in the terrestrial biosphere, soils are the largest, containing ca. 1700 Gt C, while vegetation accounts for ca. 450 Gt C globally (Friedlingstein et al., 2022). The active exchange of C between terrestrial pools and the atmosphere is affected by elevated CO2 concentrations and changes in N deposition, but quantifying the responses has proven to be a central challenge in climate science. Arora et al. (2020) highlight the uncertainty in terrestrial carbon–concentration and carbon–climate feedbacks from the last model intercomparison project, CMIP6. The uncertainty in carbon–cycle feedbacks is up to 1 order of magnitude larger for land than for ocean, illustrating the need to improve model representation of terrestrial processes. To do this, we need to represent complex C and nutrient cycle processes in a modeling framework, a task that requires careful consideration of how to translate real-world processes into an appropriate model form. Fisher and Koven (2020) suggest an approach based on modular complexity. Dividing a full-complexity land model into smaller modules allows for investigation of alternatives for structure and parameter choices, which helps in making good modeling choices and thereby constrain sources of uncertainty.
Large variations in responses between different biomes introduce an extra challenge to C cycle modeling. The impact of environmental changes on boreal systems is of particular interest for several reasons. For example, studies show that the kinetics of soil microbes accustomed to cooler climates are more temperature sensitive than microbes in warmer climates (German et al., 2012). Koven et al. (2017) also showed that soil carbon turnover times in cold areas are more sensitive to climatological temperature than in warm areas. Many boreal areas also experience treeline migration caused by an expansion of the temperature-limited area where tree species can grow (Hansson et al., 2021). Often this leads to a shift in mycorrhizal associations, for example from arbuscular mycorrhiza (AM) to ectomycorrhiza (EcM), which again can lead to changes in soil carbon dynamics and belowground carbon storage (Taylor et al., 2016; Tonjer et al., 2021). EcM has been found to alter decomposition, either negatively through increased nutrient competition with saprotrophs (Gadgil and Gadgil, 1971, 1975) or positively through priming effects (Brzostek et al., 2015; Phillips et al., 2012) based on environmental context (Fernandez and Kennedy, 2016). Recent findings also suggest that differences in decomposability of necromass from different mycorrhizal groups can impact soil C storage more than previously thought (Huang et al., 2022a, b). In Norwegian forests, vegetation is typically dominated by evergreen, coniferous trees, mainly associated with EcM. The dominating soil type in these forests is podzol (Strand et al., 2016). Podzols are typically nutrient poor, and competition for nutrients is expected to be important for the carbon dynamics in these systems. Despite the importance of boreal systems, many soil model structure and parameter choices are based on temperate or tropical observations. This bias may skew model results and make the modeled responses to climate change in boreal environments more uncertain.
Nitrogen (N) is one of the most important nutrients in an ecosystem, and the cycling of nitrogen between aboveground and belowground reservoirs can greatly affect carbon dynamics. In addition to regulating forest productivity, N availability regulates microbial carbon use efficiency (CUE), as microbes respire excess C to meet their stoichiometrical demand (Mooshammer et al., 2014b). This direct relationship between soil N and the C exchange between the atmosphere and soils emphasizes the importance of including microbial C–N relationships in C cycle models. One factor determining nitrogen availability in an ecosystem is inorganic N deposition from the atmosphere and agricultural fertilization. This inorganic N is subject to physical and chemical processes that affect how readily available the N is to microbes and plants. One such process is cation exchange, which controls storage and release of ammonium () from negatively charged clay particles and organic molecules (Bonan, 2015) and therefore impacts inorganic N availability for microbes and plants. This is a process that might be extra important in nutrient-poor boreal forest systems. There are studies that have examined this effect in agricultural soils (Sieczka and Koda, 2016), but few have looked at natural soils.
Traditionally, decomposition processes in models have been represented by first-order kinetics for litter, as well as active, slow, and passive pools of soil organic matter (SOM) (Parton et al., 1988). This approach limits the ability to examine the mechanisms and possible responses of the soil system during climate change (Todd-Brown et al., 2012). Newer work has introduced models that in different ways represent microbial activity explicitly (e.g., Wieder et al., 2015; Sulman et al., 2019; Fatichi et al., 2019; Yu et al., 2020; Huang et al., 2018; Wang et al., 2013). These models increase the possibility to capture carbon climate feedbacks of the future (Tang and Riley, 2014; Hararuk et al., 2015). Wieder et al. (2015) illustrated that by representing the functional traits of microbes in the MIMICS model, one can raise important hypotheses about how microbes can determine responses to, for example, N enrichment. Kyker-Snowman et al. (2020) further showed that adding an N cycle to the MIMICS model (MIMICS-CN) produced results in line with measurements from North American sites and comparable models. Wang et al. (2021) presented a vertically resolved C-only version of MIMICS and showed that microbial activity and root carbon inputs were more important than the soil carbon diffusion when simulating soil carbon concentration profiles.
Baskaran et al. (2017) introduced a model that emphasized the influence of EcM on decomposition, however without the ability to capture nutrient competition with saprotrophic microbes. We included EcM with parameterizations from Baskaran et al. (2017) in a modeling framework based on the MIMICS model (Wieder et al., 2015) that also includes explicit saprotrophic pools. To capture possible shifts in mycorrhizal associations, we also included an arbuscular mycorrhizal (AM) pool using methods presented by Sulman et al. (2019). In contrast to the always-available inorganic N pools in Sulman et al. (2019), we introduced an algorithm for representing sorption of ammonium to soil particles based on the Langmuir isotherm (Sieczka and Koda, 2016), which may be an important but underrepresented process determining the availability of inorganic N to soil microbes in boreal forests. We assume that by including processes and parameters thought to be particularly relevant for climate responses in colder areas, we can obtain a better understanding of the C dynamics and thereby reduce uncertainty connected to soil processes. A future goal is to couple the soil model to a land model with interactive vegetation, and although our present emphasis is on boreal systems, the incorporated processes are general and representative on a larger scale.
We introduce a vertically resolved, microbially explicit soil decomposition model, MIMICS+, which represents C and N flows between litter, microbial, and SOM pools. In this study the model is offline and forced with data produced by the Community Land Model v5.1 (CLM; Lawrence et al., 2019). C and N stock estimates from the CLM simulations represent a microbially implicit approach based on the traditional CENTURY model (Parton et al., 1988). Therefore, we compare the CLM and MIMICS+ results to investigate the implications of including the processes and mechanisms mentioned above. To evaluate the model, we use a collection of soil profile data from forested, podzolic sites in Norway, covering a range of conditions representative of boreal systems (Strand et al., 2016). Our experimental setup is as follows: for a selection of 50 sites in Norway, we ran simulations with the CLM model to produce (a) input data needed to run MIMICS+ and (b) estimates of C and N stocks. We then ran MIMICS+ with the produced forcing data. The aims of the study are (1) to formulate a standalone, microbially explicit model capable of representing soil processes in boreal systems; (2) to evaluate model performance and model structure by comparing simulated vertical soil C content along a climatic gradient with observations and simulated soil carbon from the microbially implicit model CLM; and (3) to apply the model to perform an N enrichment experiment to investigate belowground responses to nutrient changes.
2.1 Model description
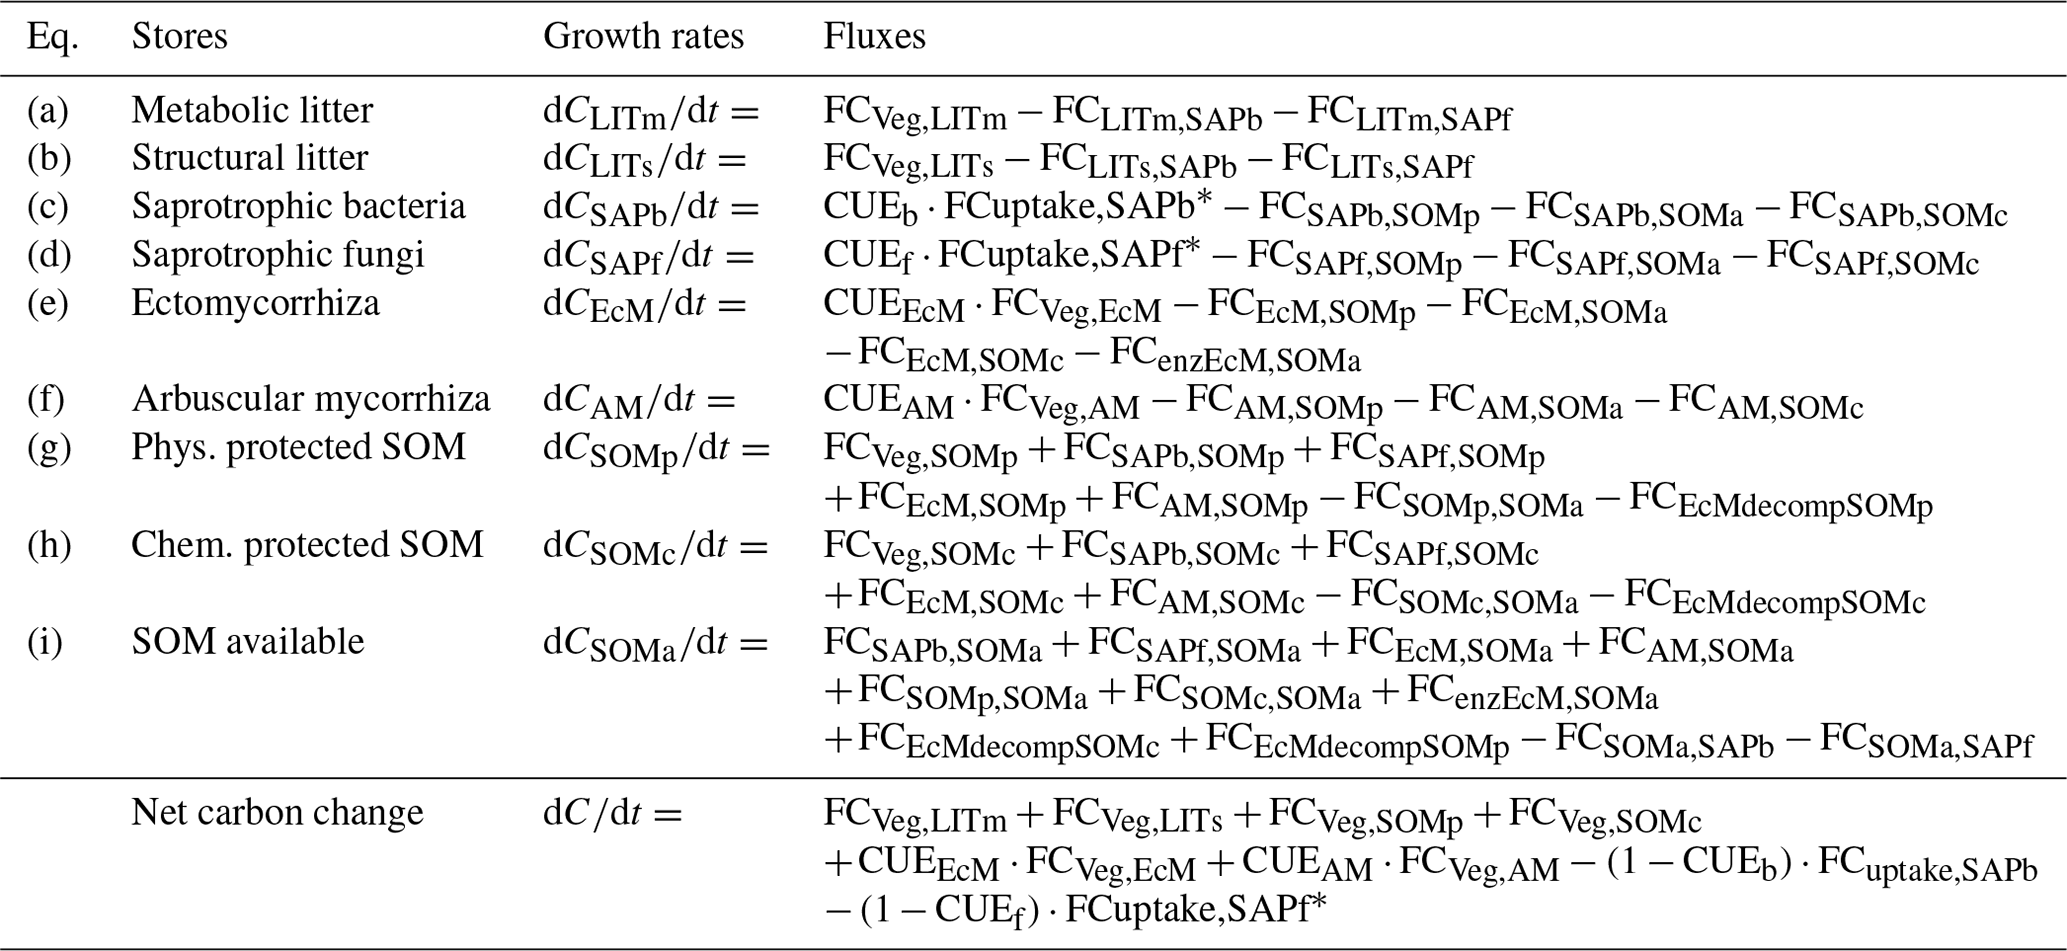
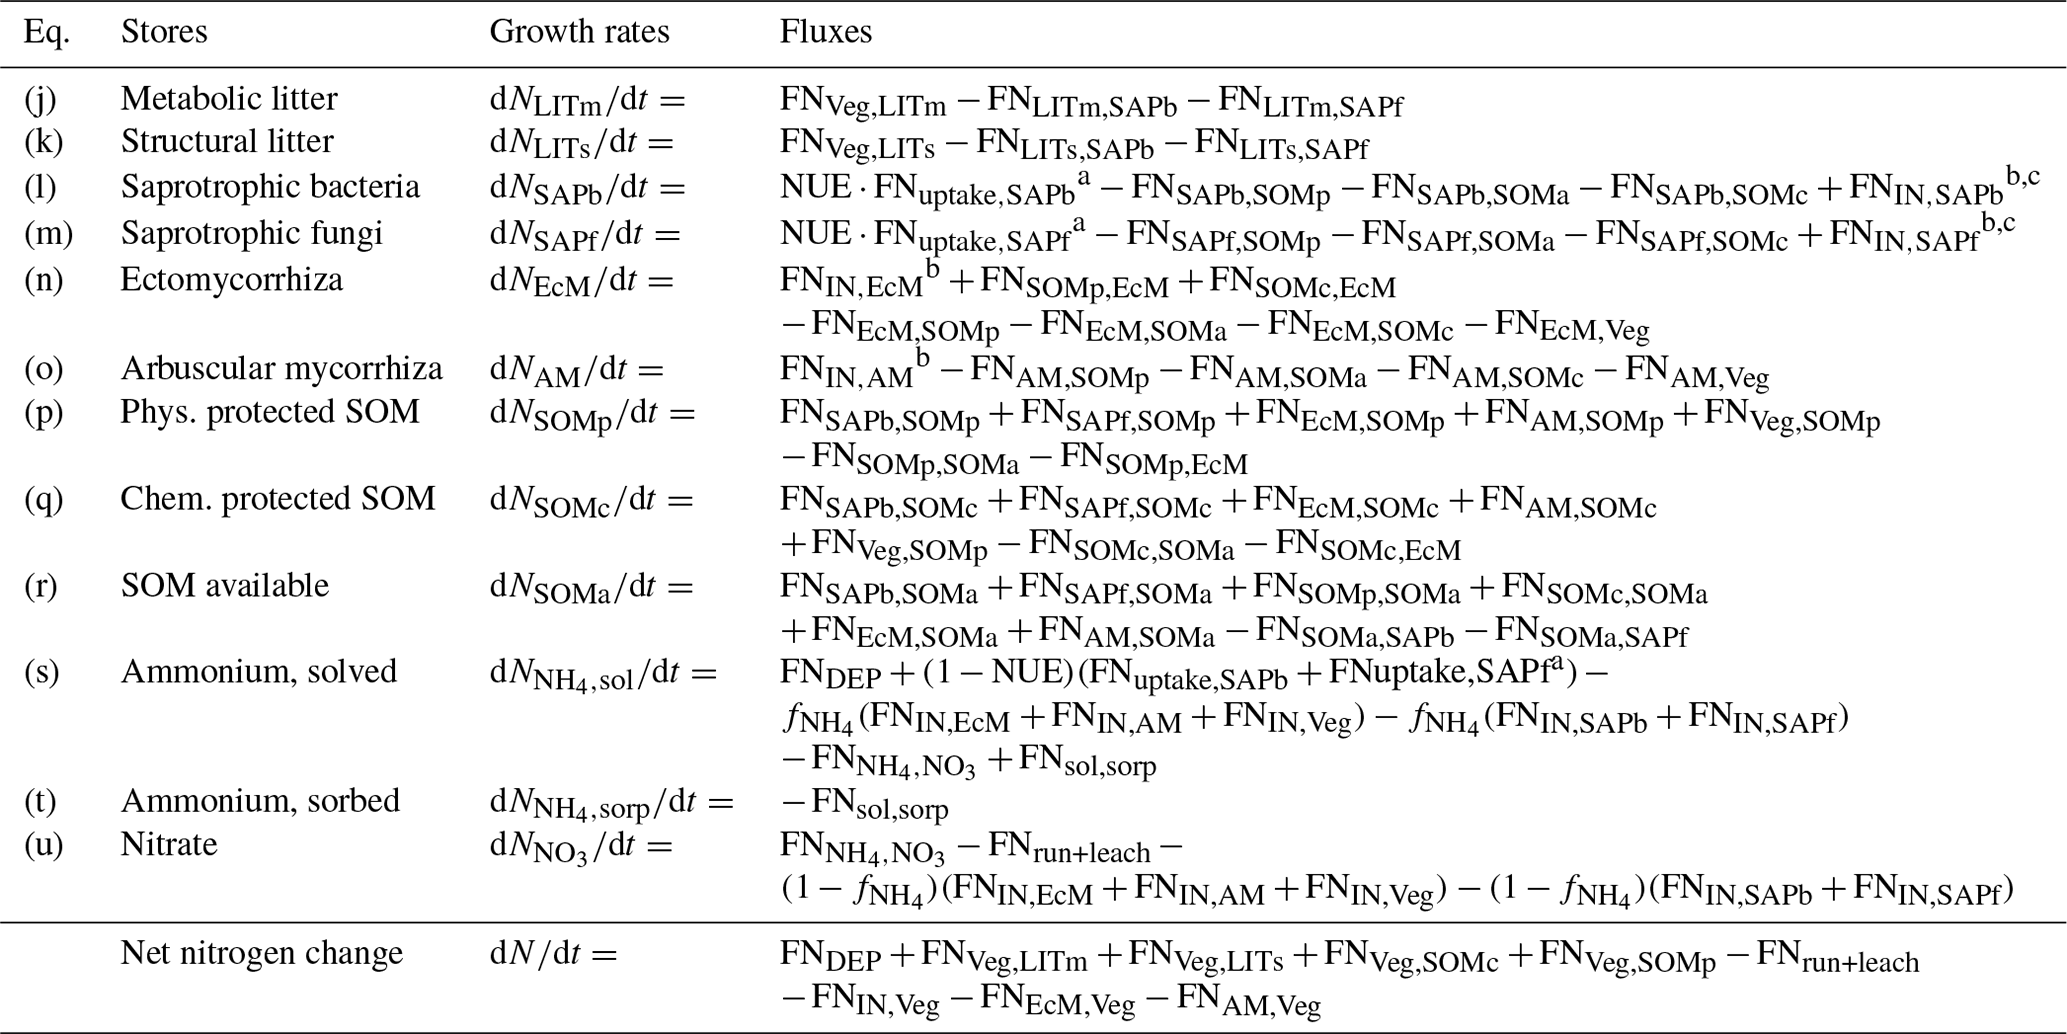
MIMICS+ is based on the MIMICS framework where microbial groups, litter, and soil organic matter are represented as separate pools (Wieder et al., 2015). In its current state, MIMICS+ is not coupled to a comprehensive land model and therefore needs prescribed C and N input and soil temperature and moisture, which it is set up to read from CLM history files. Mass balance equations, , determine the change at each time step for each pool, P. The model structure with pools and fluxes is illustrated in Fig. 1, and a detailed overview of mass balance and rate equations are provided in the Appendix; Tables A1 and A2 contain mass balance equations for C and N pools, respectively, while Tables A3 and A4 list C and N rate equations. Throughout the model description, fluxes referred to as CX or NX, where X is a number, can be found in the abovementioned tables and are illustrated as arrows in Figs. 1 and A1. A list of parameters is given in Table A5. By representing the same hydrologically and biogeochemically active layers as in CLM, MIMICS+ can represent the depth discretization of temperature- and moisture-dependent processes. For each layer the fluxes between the pools within the layer are calculated first, before the vertical transport is calculated. Unless otherwise stated, the equations below describe transport within one layer. The vertical transport is described in Sect. 2.1.4.
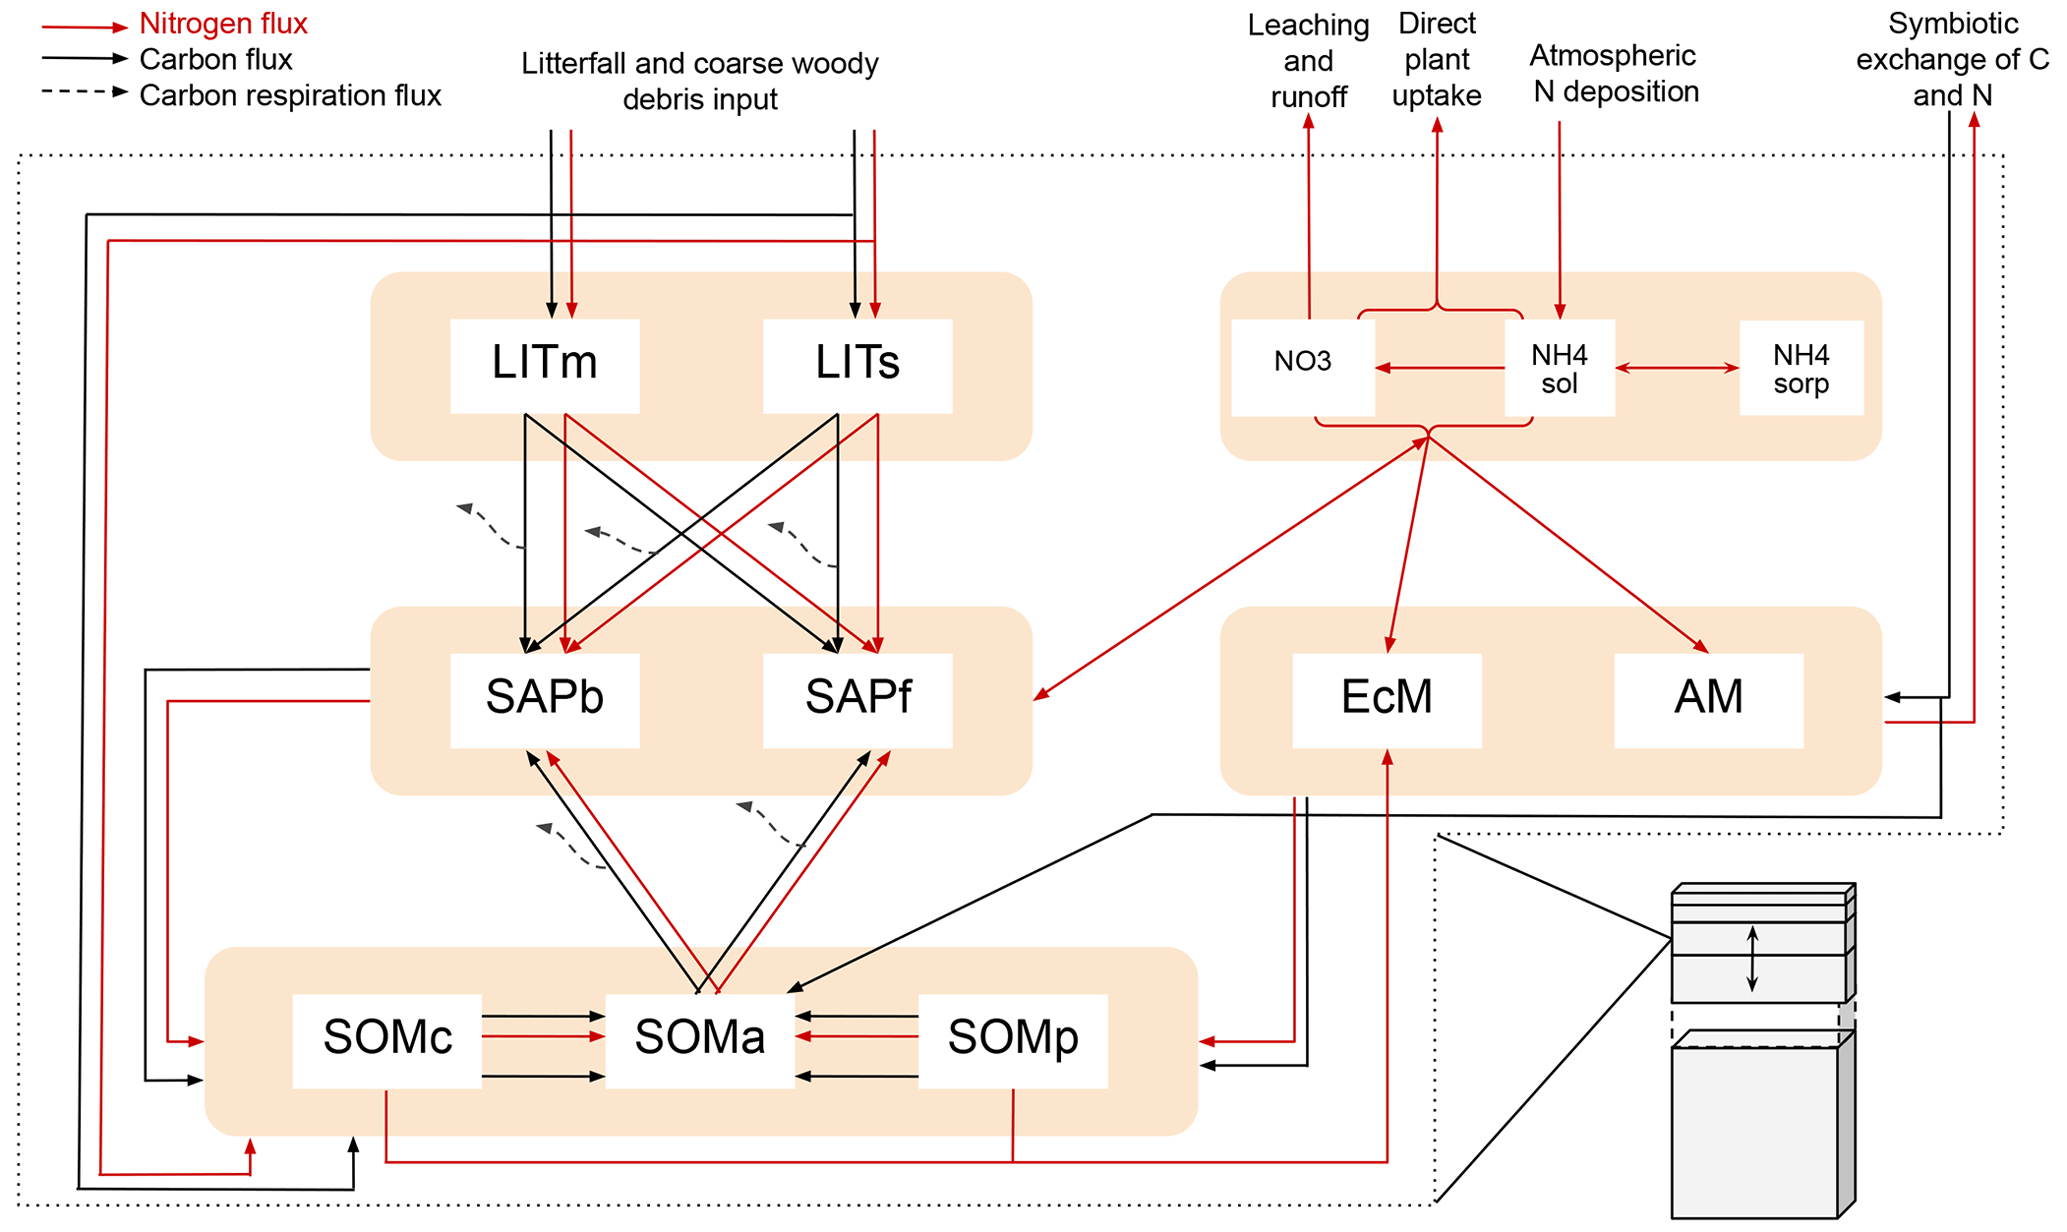
Figure 1Schematic showing C and N flows within each layer of the model. The black arrows indicate carbon fluxes (), while the red arrows indicate nitrogen fluxes (). The dashed black arrows symbolize C leaving the system as heterotrophic respiration. Metabolic and structural litter: LITm, LITs. Saprotrophic bacteria and fungi: SAPb, SAPf. Ecto- and arbuscular mycorrhizal fungi: EcM, AM. Chemically protected, available, and physically protected soil organic matter: SOMc, SOMa, SOMp. Inorganic N in the form of NO3, NH4 in solution, and NH4 sorbed to particles: NO3, NH4sol, and NH4sorb, respectively.
2.1.1 Litter and SOM pools
Organic C and N enter the litter and SOM pools as dead plant material. As in MIMICS (Wieder et al., 2015) and ORCHIDEE-SOM (Camino-Serrano et al., 2018), we separate between metabolic (labile) litter mainly originating from leaves and fine roots and structural litter, in which we also include coarse woody debris (CWD). For SOM we again follow the MIMICS approach with two protected SOM pools and one pool that is available for saprotrophic decomposition. Depolymerization and desorption move organic matter from chemically and physically protected pools, respectively, to the available pool (C11, C12, N11, N12). The depolymerization process represents the enzymatic breakdown of recalcitrant SOM and is thus modeled with an rMMK mechanism, while the desorption is a function of clay content, as this rate represents the physical desorption from mineral surfaces (Wieder et al., 2015). A total of 50 % of the incoming metabolic and structural litter go to physically and chemically protected SOM, respectively, as directly plant-derived SOM (C3, C4, N3, N4). The direct litter fluxes, together with microbial necromass (C13–C24, N13–N24) and a flux representing EcM enzyme production (C27), are the sources of input to the SOM pools. The microbial pools determine the rates of decomposition and thereby the transfer rates between the main storage pools – SOM and litter.
2.1.2 Microbial processes
MIMICS+ represents two different types of microbes: saprotrophs and mycorrhizal fungi. Within these two main groups we separate between two functional traits, giving four different microbial pools in total. We divide between saprotrophic fungi (SAPf; analogous to MIMICS k strategists) and bacteria (SAPb; analogous to MIMICS r strategists). Temperature-sensitive reverse Michaelis–Menten kinetics, together with a moisture modifier (Wieder et al., 2017), determine the rates at which saprotrophs decompose substrate from the two litter pools and the available SOM (C5–C10, N5–N10). The N fluxes are determined by the stoichiometry of the substrate pools. During decomposition, a fraction of the incoming C is lost from the soil as heterotrophic respiration (HR), while the rest contributes to saprotrophic biomass. The respired fraction is determined by the carbon use efficiencies CUEb and CUEf, which have maximum values of 0.4 and 0.7 for bacteria and fungi, respectively, but is reduced under low-nutrient conditions. This is based on the theory that microbes adjust their efficiencies to maintain a relatively constant, low C:N ratio despite the higher C:N ratio of substrates (Mooshammer et al., 2014b). The C:N ratio of the model saprotrophs is assumed to be constant (CNb=5 and CNf=8, Table A5). To ensure that this ratio is fulfilled in each layer and time step (in addition to potentially reducing CUE), N is exchanged between the saprotrophs and the inorganic pools (N36 and N37). The exchange rates can be positive or negative, leading to either immobilization or mineralization of inorganic N. We first calculate the uptake and demand of N to determine if there is enough to meet the requirement for optimal saprotrophic functioning.
Here, x represents either b (bacteria) or f (fungi), and NUE is nitrogen use efficiency, further described below. This results in one of four possibilities:
-
The N demand is greater than the uptake for both bacteria and fungi, meaning both groups will immobilize inorganic N. In this case we check if there is enough available inorganic N to fulfill the demand from both groups. If not, CUE is reduced (according to Eqs. 3 and 4) so that the saprotrophs utilize all N that is available to them, before the demand is recalculated. Here, Nfor_sap refers to the sum of the available N pools, and :
where fb determines the division of the available inorganic N between bacteria and fungi and is calculated as
Equations (3) and (4) reduce CUE (and increase the respired fraction) enough to maintain the C:N ratios under the prevailing conditions, and the resulting exchange rates are
-
N uptake is larger than demand for both saprotrophic groups, meaning both will mineralize inorganic N. The mineralized N will enter the pool.
-
Fungi will mineralize N (uptake > demand), while bacteria immobilize N (uptake < demand). In this case bacteria can access the N mineralized by fungi in addition to the inorganic N if needed.
-
Bacteria will mineralize N (uptake > demand), while fungi immobilize N (uptake < demand). In this case fungi can access the N mineralized by bacteria in addition to the inorganic N if needed.
Saprotrophic necromass is transferred to the SOM pools and is partitioned between the three pools based on clay content of the soil and the metabolic fraction of incoming litter (C13–C18 and N13–N18). Only a fraction of the N released during decomposition is directly available to saprotrophs, determined by the NUE (constant NUE=0.8, Mooshammer et al., 2014a). The remaining fraction is transferred to .
The model represents two different types of mycorrhizal fungi: EcM and AM. The mycorrhizal pools receive a C supply from plants and in return provides N to its associated plants. How the incoming carbon (Iveg,Myc, cf. C28 and C29) is partitioned between EcM and AM is determined dynamically through a return on investment (ROI) function based on the method from Sulman et al. (2019). The partition between EcM and AM is determined as a fraction,
where ROIi is the nitrogen return of the carbon investment from the mycorrhizal association i (EcM or AM):
EcM acquires N from the protected SOM and inorganic N pools (), while AM only acquires inorganic N (Nacquired,AM=N28). τmyc,som is the mycorrhizal turnover time, while CUEi is the growth efficiency for mycorrhizal association i. N25 and N26 represent ectomycorrhizal mining for N (Lindahl and Tunlid, 2015). By releasing enzymes (C27), EcM accesses N from protected SOM, and at the same time releases C to the available SOM pool (C25 and C26). The enzyme production is modeled as a fraction of the incoming carbon (C28) that is directed into the SOMa pool instead of the EcM pool (C27). The mining algorithm is based on Baskaran et al. (2017), with mycorrhizal “decomposition” modeled as a multiplicative function of mycorrhizal biomass, SOM, and a decay rate (Kmo, Table A5). We use this expression together with the C:N ratio of the substrate pool to determine the amount of nitrogen acquired through ectomycorrhizal mining (N25 and N26).
As the mycorrhizal pools are assumed to have constant C:N ratios, a part of the acquired N is used to fulfill the stoichiometric constraint. Any additional acquired N leaves the soil system as N supply to the plant. The prescribed C supply from CLM is zero during the winter months, so to ensure that the mycorrhizal fungi do not provide “free” N to the plant during this time, we introduce the following scaling factor:
Here, Iveg,myc(t) () is the time-varying C supply from vegetation (prescribed from CLM), and max(Iveg,myc) is the maximum value of Iveg,myc in the current year. This scaling factor means that the mycorrhizal fungi are most effective when they receive the most energy in the form of C. Since Iveg,myc(t) is prescribed in the current model version, the input flux will not respond to changes in soil N availability. Constant mortality rates determine the transfer from mycorrhizal fungi to the SOM pools (C19–C24 and N19–N24).
2.1.3 Inorganic N processes
Inorganic N is divided between nitrate and ammonium dissolved in soil water ( and ) and ammonium sorbed to soil particles (). Reactive nitrogen from atmospheric deposition enters (N32) where it can undergo nitrification to (N34) or become sorbed to particles (N35). is exposed to leaching and runoff based on CLM algorithms (N31). Both dissolved pools, and , can be taken up by mycorrhizal fungi (N27, N28) or directly by plants (N33). Since the model is not coupled to aboveground vegetation, direct plant uptake is a constant loss rate of the available inorganic N (kplant). We assume that processes in boreal forests are relatively slow and that the residence times of the pools are much longer than the 1 h time step. We therefore apply a sequential approach to model the mass balance of the inorganic N pools. Within a time step (1 h) the different processes affecting inorganic N are calculated in a sequence: (1) deposition, leaching, and runoff; (2) nitrification; (3) N from decomposition; (4) direct uptake by vegetation; (5) uptake by mycorrhiza; (6) exchange with saprotrophs; and (7) the Langmuir sorption algorithm. The Langmuir sorption algorithm is based on Sieczka and Koda (2016) and described below. The basis for this process is cation exchange, where positively charged ammonium is adsorbed to negatively charged clay particles. Before step (7) the total concentration of ammonium is
Using Eq. (11) together with the Langmuir isotherm equation, we find the equilibrium partition between and given the total concentration . The Langmuir isotherm equation is given by
where is a Langmuir constant related to adsorption energy and a function of soil water content. NH4sorp,max is the maximum adsorption capacity. We assume that the system moves towards the equilibrium value during the time step, via the following mechanism, derived from the pseudo-second-order kinetic model in Sieczka and Koda (2016):
Here k is a rate constant, and Δt is the time step. The top option corresponds to absorption, the middle option to desorption, and the third option to no N exchange between sorbed and in solution (i.e., equilibrium has already been reached). All parameter values are from Sieczka and Koda (2016), converted to appropriate model units (see Table A5).
2.1.4 Vertical structure
The discrete vertical layers of the model follow the same structure as CLM with increasing layer thickness with depth (Lawrence et al., 2019). This allows incoming litter and N deposition to be distributed following the same vertical profile as in CLM. We use vertically resolved soil temperature and soil moisture from CLM as inputs to MIMICS+. We also use drainage and runoff rates from CLM to determine N leaching. Within each time step the fluxes between the pools are calculated and applied first, then vertical transport is calculated and applied. This transport is calculated as a simple diffusion equation between adjacent layers (Soetaert and Herman, 2009), using a constant diffusion coefficient from Koven et al. (2013). As the vertically resolved soil temperature and soil moisture from CLM are used in MIMICS+, the saprotrophic decomposition rates that are functions of these variables have a depth dependency in the model. The mycorrhizal N uptake is a function of the amount of mycorrhizal biomass and inorganic N (and SOM for EcM) in the soil layer; hence uptake can vary with depth.
2.1.5 Parameter sensitivity analysis
To test the soil C sensitivity to different model parameters, we performed a sensitivity analysis on 16 key parameters. For one parameter at a time, we either increased or decreased the value by 25 % compared to the default, giving a total of 32 experiments which were performed for each of the 50 sites simulated in this study (see Sect. 2.2).
2.2 Soil profile database
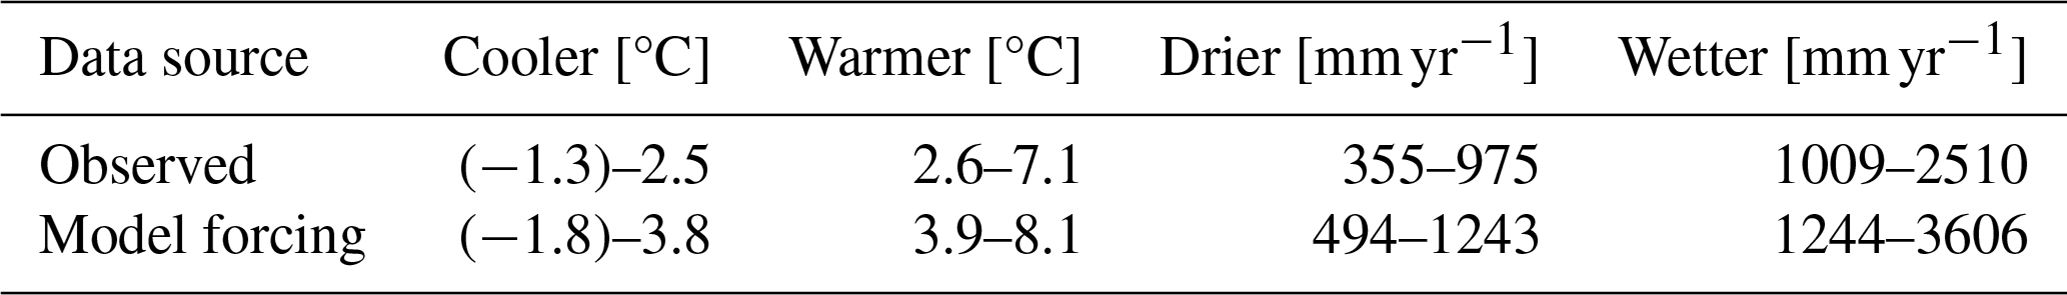
For comparison, a forest soil database collected in connection with the International Co-operative Programme on Assessment and Monitoring of Air Pollution Effects on Forests (ICP Forests) monitoring program level 1 sites was used (Lorenz, 1995). These data have been further analyzed by Strand et al. (2016) and provide a unique source of information about boreal soil conditions. A total of 1040 soil profiles were described, sampled, and analyzed between 1988 and 1992 (Esser and Nyborg, 1992). Soil profile descriptions were done according to standardized procedures (Sveistrup, 1984) and classified according to the Canadian System of Soil Classification (CSSC). Relevant information from the database includes C and N stocks, mean annual temperature (MAT), and mean annual precipitation (MAP). Specifically, the database contains C content down to 30, 50, and 100 cm, making it possible to compare vertically modeled C stocks to observations in these depth intervals. The dataset also contains separate measurements of C and N in the organic litter, fermented, and humic (LFH) layer and mineral soil. The organic layer consists of more or less decomposed litter, and although not directly comparable to modeled litter and SOM pools, the C:N ratio in organic vs. mineral soil is still a useful quantity for model evaluation purposes. A more detailed description of the database is given in Strand et al. (2016). Because podzols are the most common soil category in Norwegian forests, we chose to focus on the podzolic sites in the dataset, giving a total of 578 sites. Due to computational resource limitations, we chose a subset of 50 representative sites (out of the 578) for the site simulations with CLM and MIMICS+. The remaining 528 sites were used for further comparison with the modeled carbon stocks. The 50 sites cover an area from 5 to 70° N latitude and from 5 to 29° W longitude. The MAT varies from −1.3 to 7 °C, while MAP ranges from 356 to 2510 mm yr−1.
2.3 Simulation setup
For the subset of 50 sites, we performed single-site simulations using CLM5.1 in biogeochemistry (BGC) mode. Data from these simulations were used both to force MIMICS+ and to compare the C and N stocks as calculated by the standard decomposition model in CLM. The CLM variables that are used to force MIMICS+ are listed in Table A6. For the simulations we assume that all C allocated to active N uptake by plants in CLM is directed to mycorrhiza (in default CLM this C is assumed to directly respire).
The observations were performed during the years 1988–1992, so we ran the models up to and including 1992 and averaged model values over the 5 years. Unless otherwise stated, these averages are what is used for the comparisons. The three datasets each containing data from 50 sites are referred to as observations from the database (OBS), CLM simulations (CLM), and MIMICS+ simulations with CLM forcing (MIMICS+). An overview of the yearly mean input of carbon and nitrogen is shown in Fig. C1.
For the CLM simulations, a single-site configuration with 100 % natural vegetation was used together with atmospheric forcing from the Global Soil Wetness Project forcing dataset (GSWP3; https://hydro.iis.u-tokyo.ac.jp/GSWP3/, last access: 1 September 2023). This is the default atmospheric forcing for CLM and provides 3 h data with 0.5° resolution. Following CLM spin-up protocol (Lawrence et al., 2019), all sites were spun up for 500 years in “accelerated-decomposition” mode followed by 700 years of “regular spin-up” by recycling atmospheric forcing for 1901–1930. For the 1850–1900 period, the atmospheric forcing cycles the years 1901–1920, then historical forcing was used until the end of the simulation.
As with the CLM simulations, MIMICS+ needs to be spun up to equilibrium before running a historical period. The spin-up was performed from arbitrary initial concentrations by recycling monthly averages of soil temperature and moisture, N deposition, litter, and C input from the CLM history files for the years 1850–1869 (during which atmospheric forcing was used from 1901–1920) for 1000 years.
2.3.1 Comparison of climate gradient profiles
To examine how well the models capture variation with temperature, the three datasets (OBS, MIMICS+, CLM) were sorted by increasing MAT. The first half (N=25) was labeled “cooler”, while the second half (N=25) was labeled “warmer”. To capture variation in moisture, the sites were sorted by MAP in the same manner, with the first half labeled “drier” and the second half labeled “wetter”. Because the MAP and MAT data from the observations and the model forcing differ, some sites ended up in different categories depending on whether they were sorted by the observed or forcing climate data (12 sites for MAT and 8 sites for MAP). We split the dataset in the following way – OBS by observed climate and MIMICS+ and CLM by model forcing climate – because we investigated sensitivities to temperature and precipitation. (Figure S1 in the Supplement shows results of this analysis with all points classified according to their OBS climate.) The MAT and MAP intervals for each category are given in Table 1. For some sites the measured soil depth was shallower than 50 or 100 cm. These sites, where the depth to bedrock was less than 50 or 100 cm, were removed from both the model and the observation datasets before making distribution boxplots for these depth intervals.
Table 1MAT and MAP intervals for dividing the sites into climate categories.
2.3.2 N enrichment experiment
To investigate the response modeled by MIMICS+ to N enrichment, we performed an idealized N addition experiment. Starting from spun-up conditions, we ran two parallel simulations for all 50 sites for 30 years: one “control”, using N deposition from the CLM runs, and one “treatment”, with an extra amount of 15 deposited. This is a common amount used in forest fertilization (Högberg et al., 2017). The additional nitrogen was added equally in each time step throughout the second simulation year to give a total of 15 g N m−2. We used these simulations to investigate the temporal response ratios (RRs: treatment : control) for different C and N pools, as well as for HR.
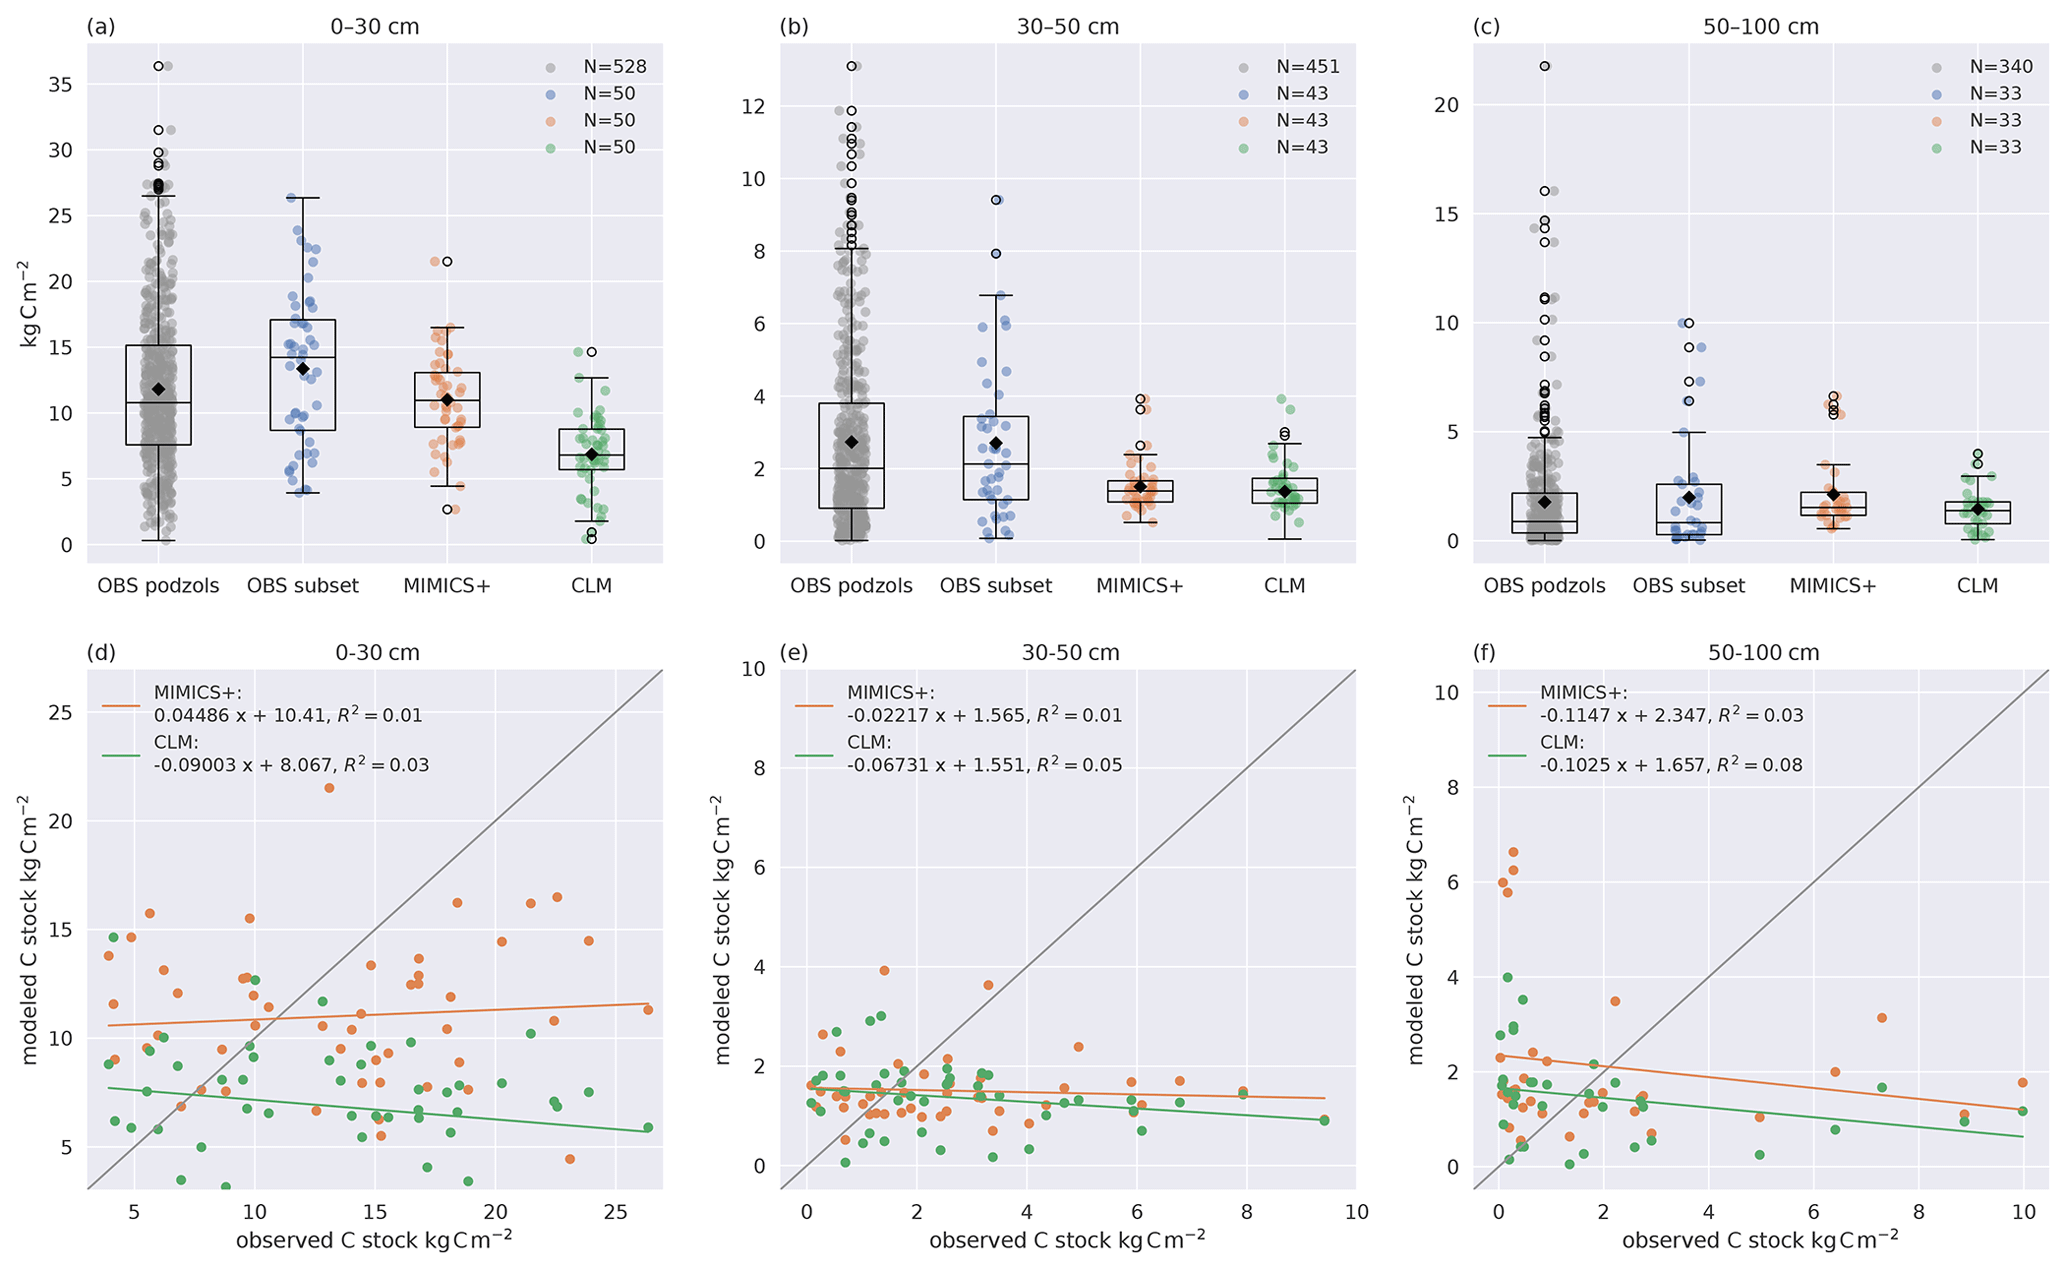
Figure 2Modeled and observed C stocks. (a–c) Boxplots of C stocks in (a) 0–30, (b) 30–50, and (c) 50–100 cm soil depths for all observed podzols except the 50 modeled ones (left) and the 50 modeled sites (center left) from Strand et al. (2016), simulated with MIMICS+ (center right) and with CLM (right). The line in each box is the median, while the diamonds mark the mean values. The box's upper and lower edges are the 75th and 25th percentiles, respectively. The whiskers extend from the box by 1.5 times the interquartile range. Note the different scales on the y axes. As not all observed soil profiles reach a depth of 30–50 or 50–100 cm, these sites are omitted in all boxplots for these depths; hence N=43 for (b) and N=33 for (c). (d–f) Scatterplots of observed (x axis) and modeled (y axis) C stocks in (d) 0–30, (e) 30–50, and (f) 50–100 cm soil depths. The legend shows the slope, intercept, and R2 for the linear regression line fitted to the scatter points. The 1:1 line is added in grey for reference.
3.1 Comparison of modeled and empirical C and N stocks
Observed and modeled soil carbon stocks are shown in Fig. 2. Both models capture the general trend of decreasing C concentration with increasing depth. The modeled mean C stocks of MIMICS+ across the 50 sites are closer to observations in the 0–30 cm depth interval, while the CLM simulations clearly underestimate C stocks (both models are significantly different from the subset of observations, p<0.05). The models both underestimate carbon at the 30–50 cm interval, while there is no significant difference between the modeled and observed C content in the deepest layer. Due to the heterogeneous nature of real soils and the impact of differences in litter production between the sites, a larger variability in the observations compared to the simulations is not unexpected. However, site-to-site comparisons with observations are poor for both models but marginally better for MIMICS+ (Fig. 2d–f). This is likely explained by subgrid variability in the observations that are not captured by the models and their forcing. As the model is intended to work on larger spatial scales within an ESM model, a good one-to-one match with specific sites is of less importance than being able to capture larger patterns in temperature and moisture. By looking at the collection of sites together, we remove some of the uncertainty related to the variability between the sites and focus on larger patterns in our analyses. There is no significant difference between the two observational subsets, meaning that the 50 sites chosen for the direct model comparison are representative of the broader region.
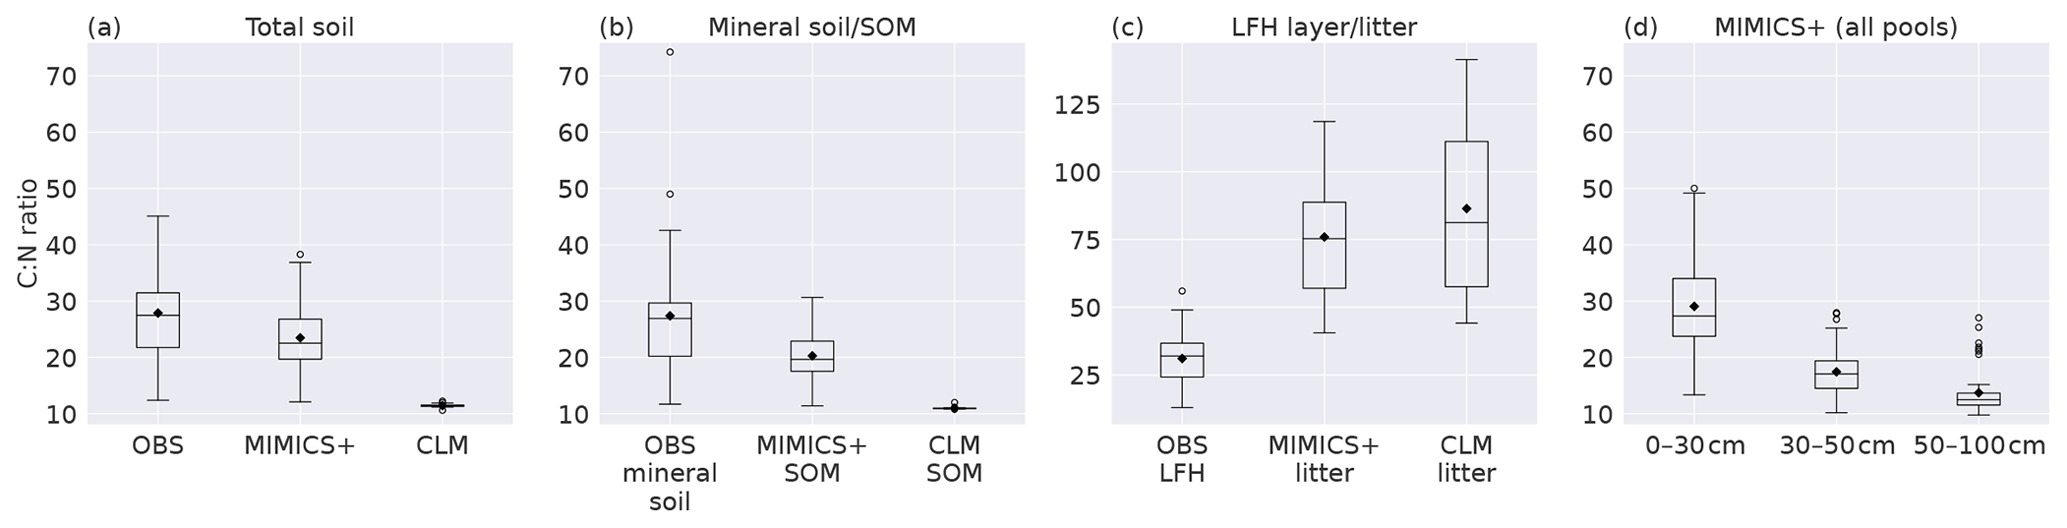
Figure 3Boxplots of C:N ratios for observed values from Strand et al. (2016), MIMICS+, and CLM simulations of (a) the total soil, (b) mineral soil (observations) sum of SOM pools (models), (c) observed forest floor compared to the C:N ratio of simulated litter pools, and (d) total soil at different depths as simulated by MIMICS+. Inorganic N is not considered in any of the plots. The line in each box is the median, while the diamonds mark the mean values. The box's upper and lower edges are the 75th and 25th percentiles, respectively. The whiskers extend from the box by 1.5 times the interquartile range. N=50 sites.
Looking at C:N ratios, the overall picture with a higher ratio in the forest floor (observations) and litter pools (models) than in the total soil is captured by both models, with MIMICS+ again being closer to the observed values (Fig. 3a and b). Both models have significantly lower C:N ratios in the total as well as in the mineral soil, but MIMICS+ has significantly higher values than CLM (p<0.05). For the litter pools, the pattern is the opposite, and the models have significantly higher C:N litter ratios than those observed in the LFH layer. The modeled litter pools are not directly comparable to the LFH layer, but we get an indication of how the modeled C:N ratio compares to the partly decomposed matter. Both models have higher mean values and greater variability than the observations (Fig. 3c). This is expected as the observed LFH layer is partly decomposed and would therefore have lost some C compared to the simulated litter pools which have not yet been affected by the decomposition processes. In addition, the modeled litter pools contain some low-quality (high C:N ratio) CWD, which is not included in the LFH samples.
The observed total C:N ratio ranges from 12–45 with a mean value of 28, while MIMICS+ and CLM have mean values of 23 and 11, respectively. The range of C:N values from the models is narrower than that of the observations, with MIMICS+ values ranging from 12–38 and CLM only between 11–12. The large variability among the observations indicates the influence of local conditions on a subgrid scale. The fact that MIMICS+ has a larger variability than CLM indicates that differences in soil quality are captured better with the improved modeling framework. Microbial competition for N and a higher fraction of directly plant-derived SOM are factors contributing to this difference between the modeled C:N ratios. Figure 3d shows the C:N ratios simulated with MIMICS+ at three different depth layers. As expected, the top layer with more litter has the highest ratio, while in the middle and lowest layers the ratios are significantly lower. For the CLM simulations the C:N ratio is constant around 11 for all three depth intervals. Since we do not have access to observed vertical N stocks, it was not possible to produce this plot for the observed sites.
3.2 Modeled C pools in MIMICS+
In this section we look more in detail into model properties of MIMICS+. The sensitivity analysis showed that total soil C change using perturbed parameters was mostly within ±10 % of the default values (Fig. B1). Modeled soil C was the most sensitive to the fraction of structural litter going directly to protected SOM, as well as mycorrhiza-related parameters (maximum CUE and mining decay rate KMO). The sensitivity of total C to parameter values related to inorganic N was small.
With the current model parameterization, the SOM pools contain about 78 % of the total soil C (all nine pools, ref. Fig. 1), and 62 % of that are in the protected pools (SOMc and SOMp in Fig. 1). The litter pools contain most of the remaining C, while 1.2 % are microbial biomass (Fig. 4). The modeled percentage of microbes ranges from 0.3 %–2 % and is in agreement with the 1 %–3 % microbial biomass C typically reported for soils (Frey, 2019). The microbial respiration (HR) shows a clear seasonal pattern, with a stronger summer peak and winter limitation with MIMICS+ than with CLM (Fig. B4). Figure 4b shows the relative magnitude of each pool within a pool category. Mainly due to the relatively high CWD contribution to the input, the structural pool is the largest litter C pool (18 % of total C, 85 % of total litter C), while metabolic litter consisting of leaf and fine-root litter accounts for ca. 3 % of the total C and 15 % of total litter. The saprotrophic microbial biomass C dominates over the mycorrhizal fungi biomass C, and the saprotrophic fungi dominate over saprotrophic bacteria (mean saprotrophic F : B biomass ratio of 2 and above 1 for all sites). This is largely a consequence of the parameter choices in the model and are further discussed in Sect. 4.
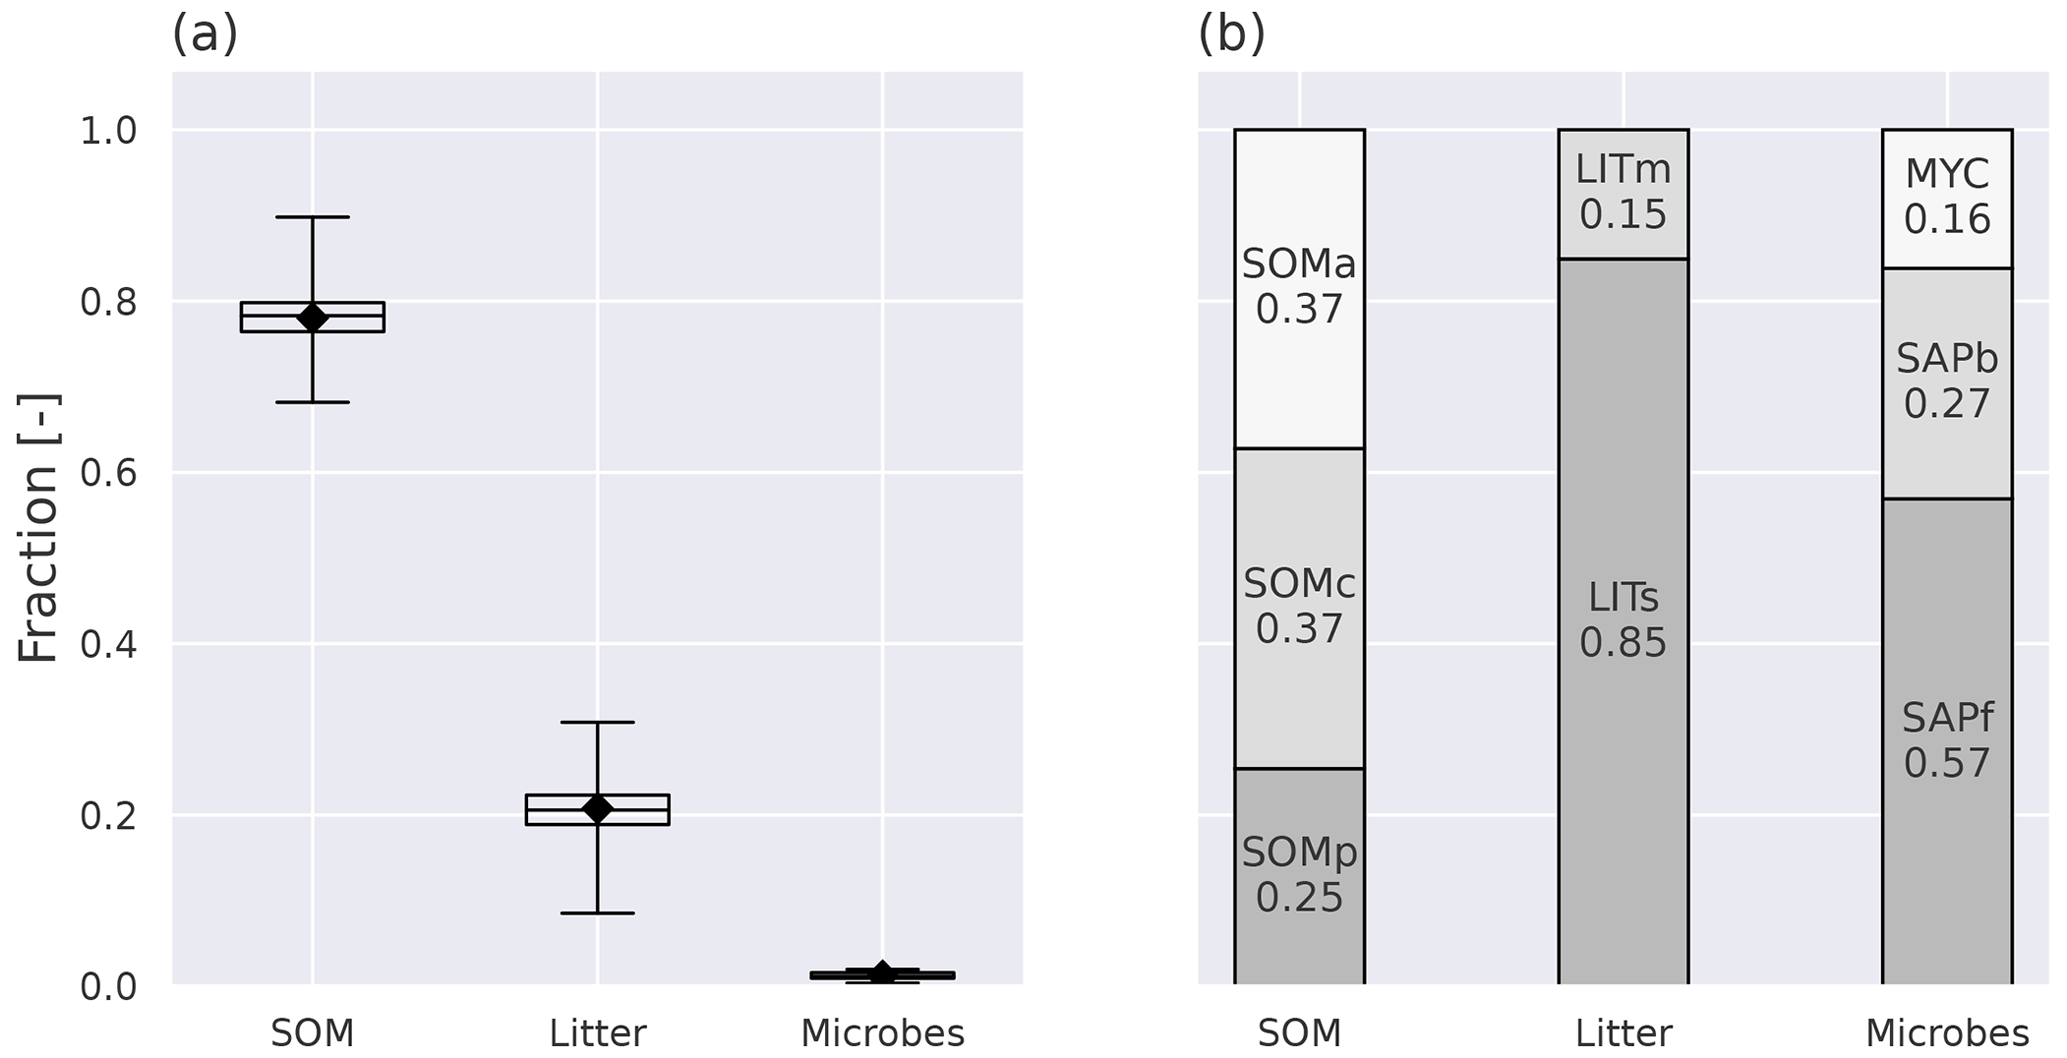
Figure 4Annual mean pool fractions as simulated by MIMICS+. (a) The fractions of total C stored in the main pool categories, soil organic matter (SOM), litter, and microbes. The box's upper and lower edges are the 75th and 25th percentiles, respectively. The whiskers extend from the box by 1.5 times the interquartile range, and N=50 sites. (b) The fraction of C in each pool within each main pool category. MYC covers both EcM and AM, as the AM contribution is so small that it would not be visible on its own.
For the focus region of this study (boreal sites in Norway), total C (TOTC) is strongly correlated with both MAT and C input (+0.49 and +0.65, respectively), indicating that higher plant productivity at warmer sites is an important control on total soil C in the MIMICS+ simulations (Fig. 5). The CUE presented in Fig. 5 is calculated as the ratio of the total microbial C uptake in biomass over the total C uptake (including respiration). CUE is positively correlated with available N, pointing to higher microbial efficiencies at sites with higher nutrient content. This is also illustrated by the positive relationship between the percentage of microbial biomass (pct_microbes) and available inorganic N (+0.41 for and +0.62 for ). The negative correlation between CUE and MAT is likely explained by lower-quality litter input at warmer sites, as there is a positive relationship between the C:N ratio of the litter input and temperature (, not shown). The lower litter quality causes reduced CUE and hence a negative relationship between temperature and CUE. The strong correlation between production (C_input) and HR (+0.81) indicates that most sites are close to equilibrium. Lower litter quality at high-production (and high-respiration) sites can explain the negative relationship between CUE and HR. There is a negative correlation (−0.64) between CUE and total C.
The fungal : bacterial saprotrophic biomass ratio (FB ratio) is negatively correlated to available inorganic N (−0.29 for and −0.27 for ), reflecting the stricter stoichiometrical constrain on bacteria. There is a strong negative correlation between the percentage of microbes and the fungal : bacterial ratio (−0.78), reflecting that sites with more available N are more favorable for microbial growth in both pools but most beneficial for bacteria.
All three inorganic N pools are negatively correlated with MAP (−0.30 for , −0.29 for , and −0.38 for ) and also with soil water (−0.37). This indicates that the modeled microbes also respond to moisture conditions through the effects of moisture on inorganic N processes (leaching, runoff, and sorption of NH4), which contribute to making N unavailable, and not only through the modifications of the reverse Michaelis–Menten kinetics.
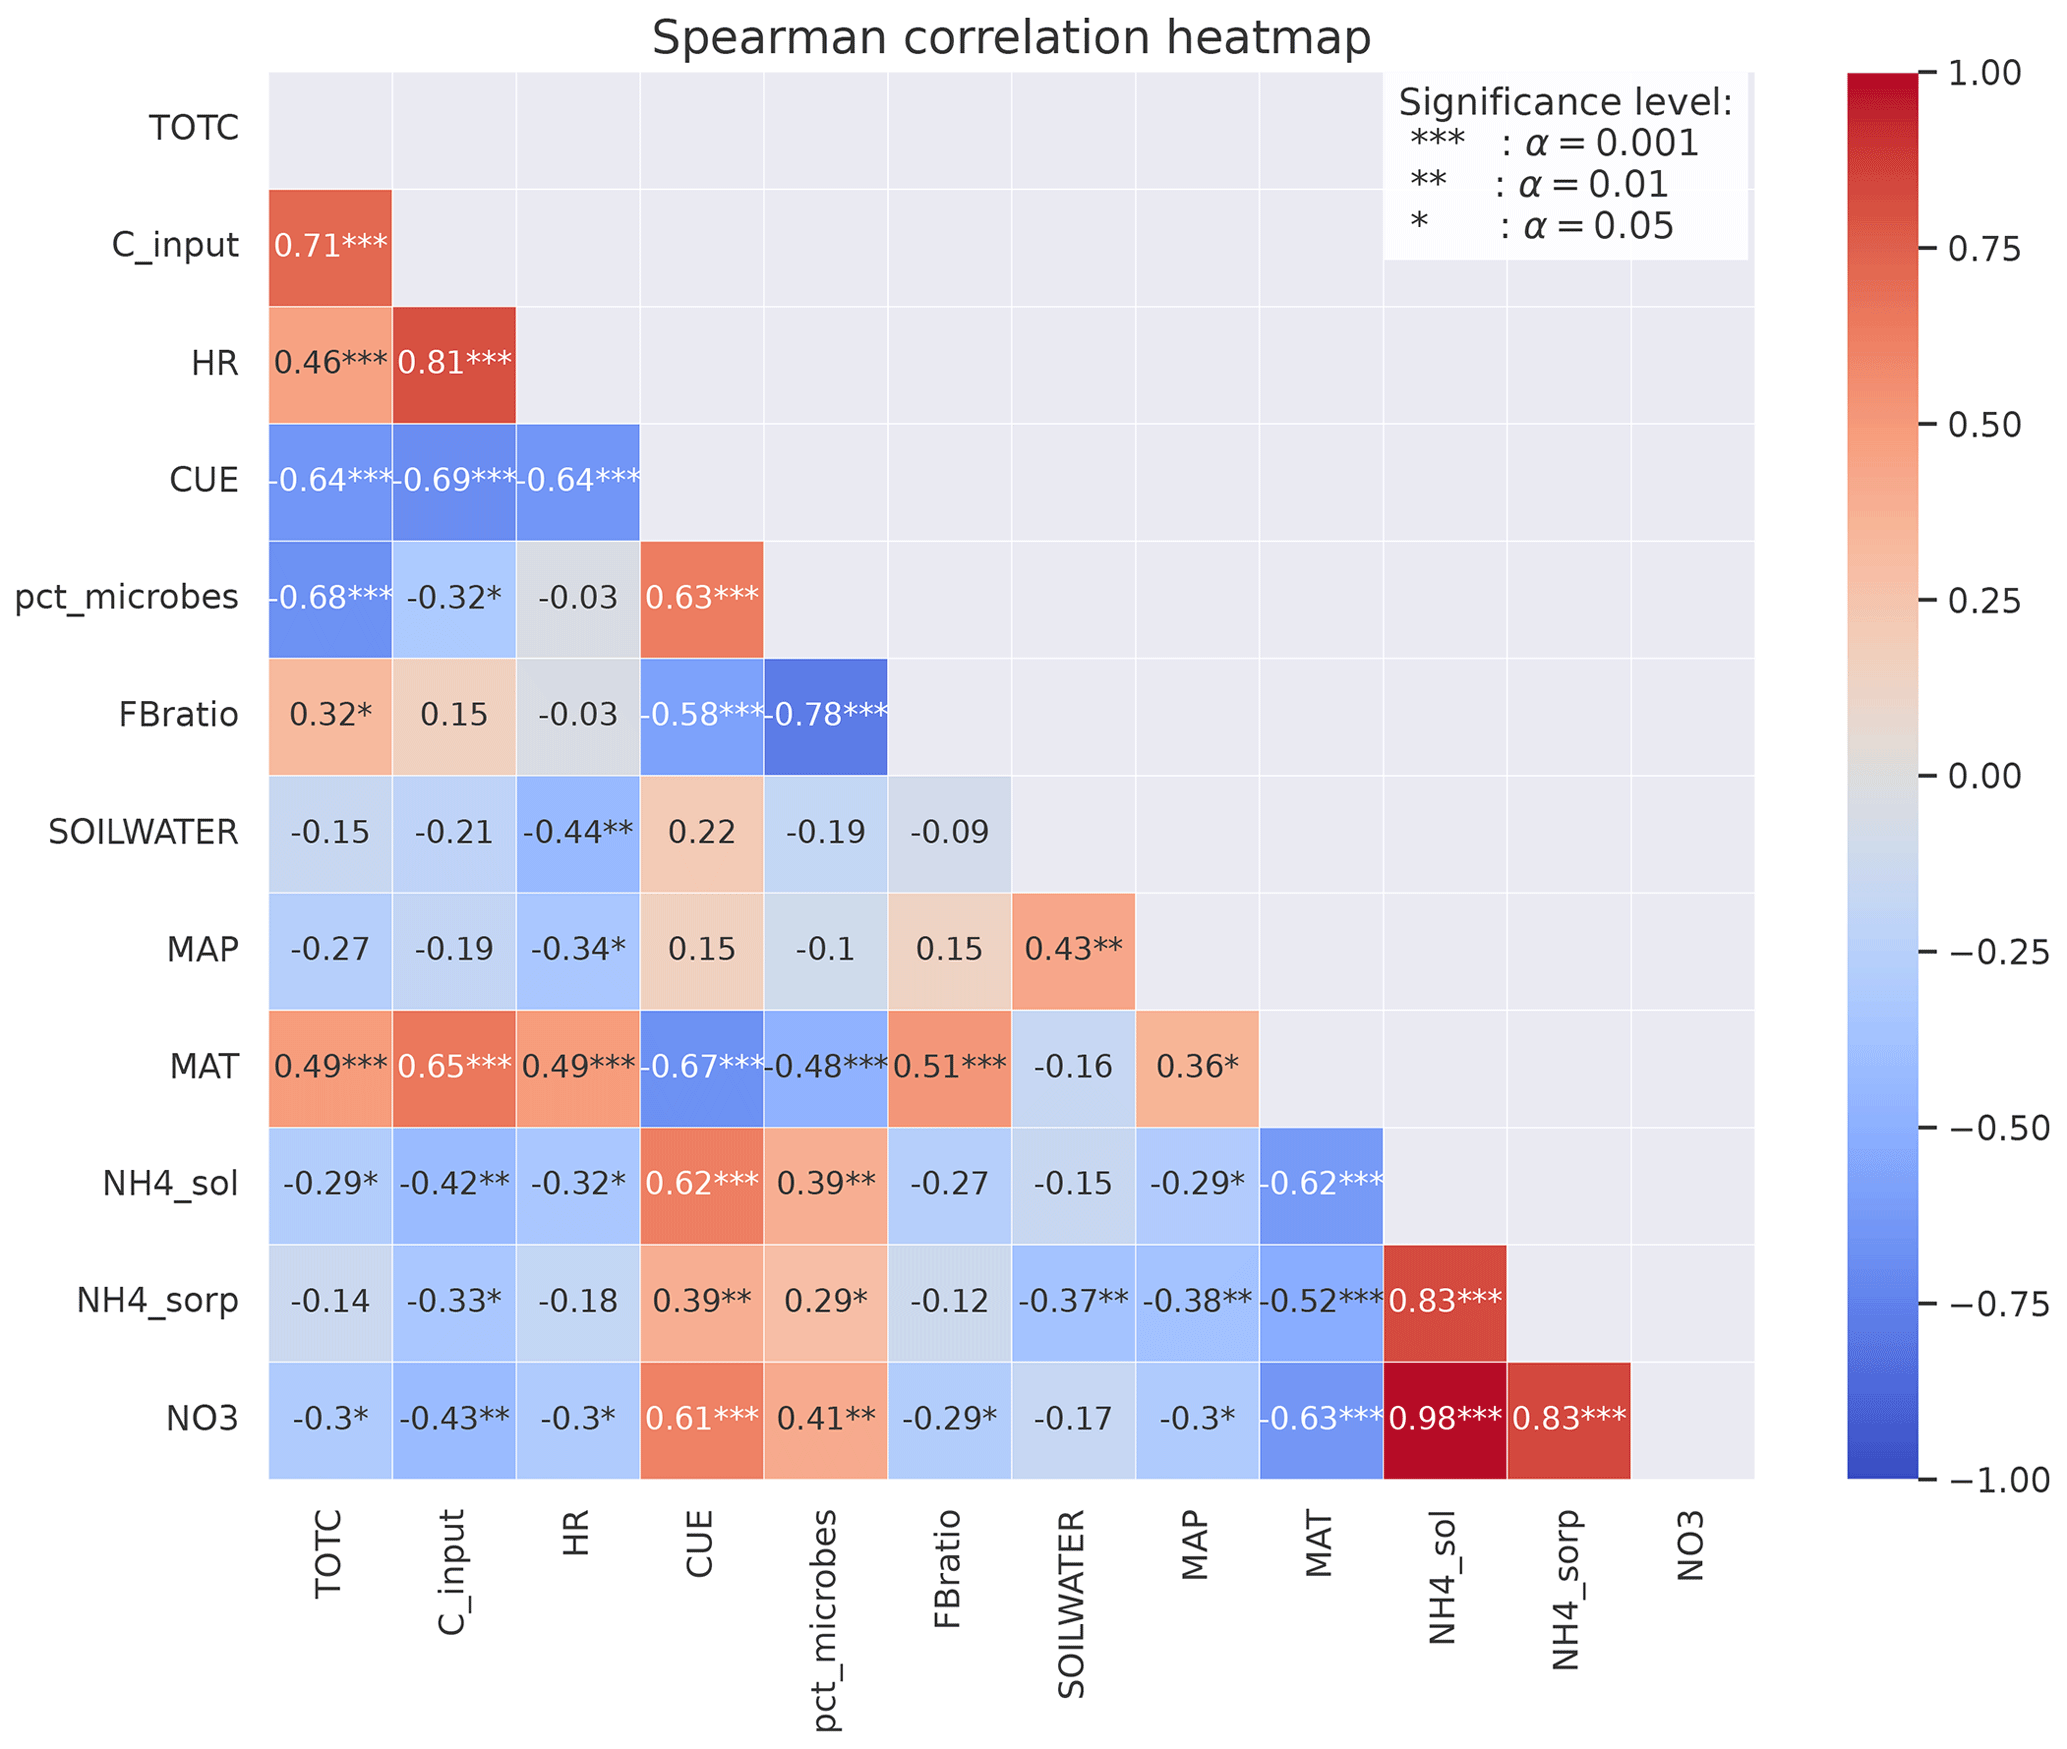
Figure 5Spearman's correlation coefficients between different variables calculated from MIMICS+ simulations of the 50 sites. The stars represent the significance level of the correlation. Numbers without stars are not significant (p>0.05). The colors indicate whether the correlation is positive (red) or negative (blue), and the shades indicate the strength of the correlation.
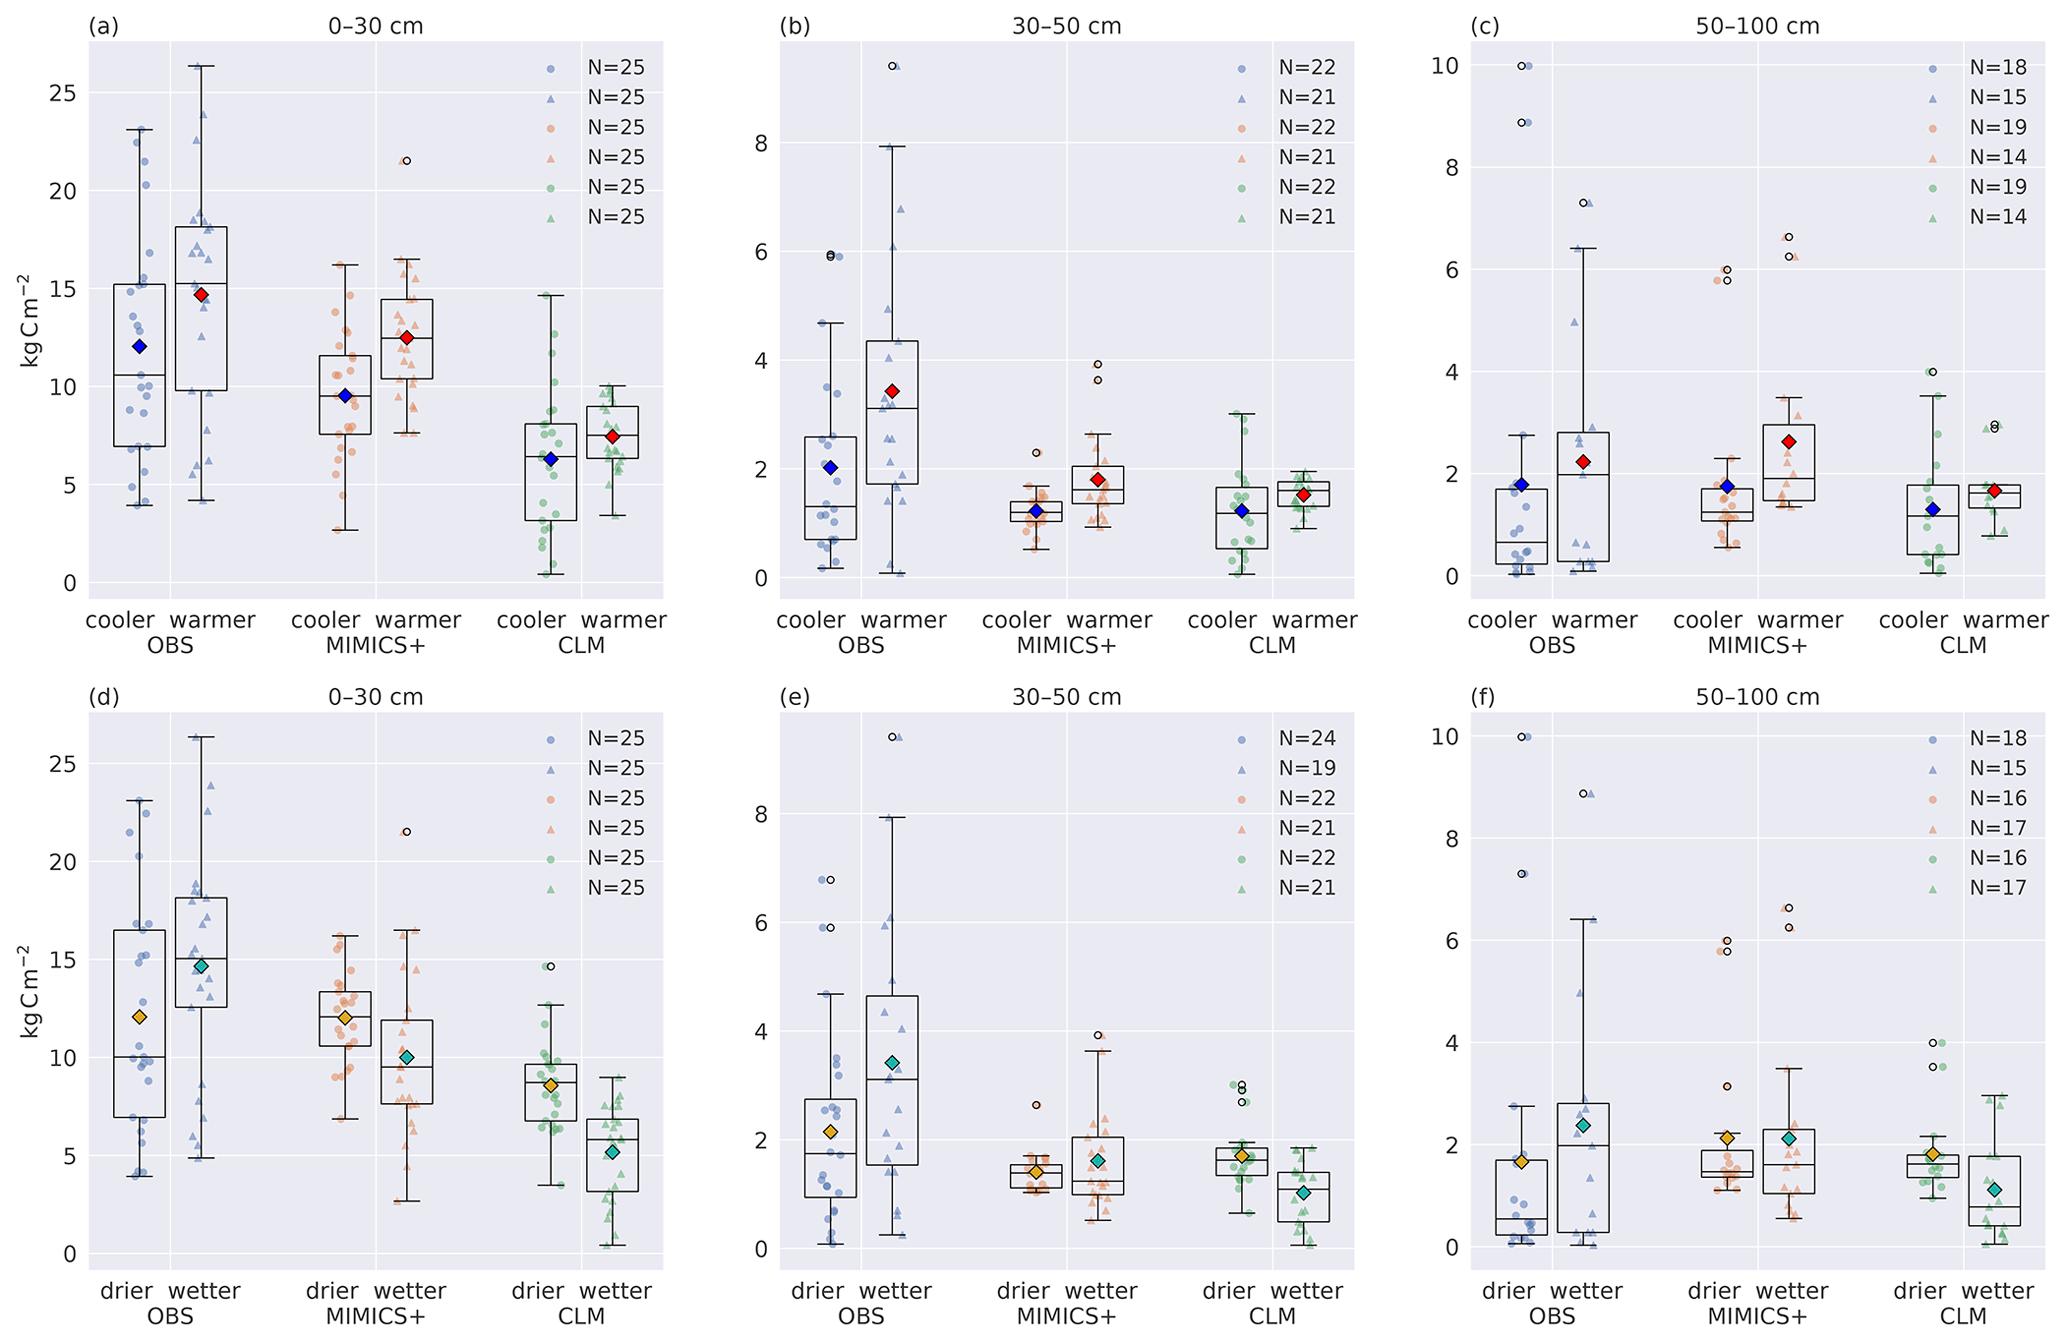
Figure 6Total carbon stocks for cooler and warmer (a–c) and dryer and wetter (d–f) parts of the dataset. Boxplots of carbon stocks in the (a, d) top 30, (b, e) 30–50, and (c, f) 50–100 cm soil depths for observed profiles from Strand et al. (2016) (left), simulated with MIMICS+ (center) and with CLM (right). In (a–c) the leftmost quartiles represent the coldest 50 % of the dataset, while the rightmost represent the warmest 50 % of the dataset. In (d–f) the leftmost boxes represent the drier 50 % of the total subset, while the rightmost represent the wetter 50 %. The line in each box is the median, while the diamonds mark the mean values. The diamond color represents the climate category: yellow – drier, turquoise – wetter, blue – cooler, red – warmer. The box's upper and lower edges are the 75th and 25th percentiles, respectively. The whiskers extend from the box by 1.5 times the interquartile range.
3.3 Comparison of climate gradient profiles
In Fig. 6 the 50 sites have been divided into two subsets of 25 sites based on the climate categories described in Sect. 2.3.1. (Figure S1 shows the result of the division of sites based only on the observed climate.) Figure 6a–c show lower carbon stocks for colder sites than for warmer sites for both models and observations for all three depth intervals, indicating that the models are broadly able to capture the temperature-dependent processes that govern the C storage in soils. As shown in Fig. 5, the modeled C input is positively correlated with MAT and total soil C, indicating that the difference is mainly caused by differences in litter input. The MIMICS+ simulations show a significant difference between the cold and warm mean C content (p<0.05) for all depth intervals, while the cold and warm means from the CLM simulations are not significantly different (). This indicates that MIMICS+ temperature dependencies have a larger impact on soil C sequestration than the standard CLM formulation since the C inputs and soil temperatures are the same for the two models.
Figure 6d–f show that in the observations, the drier sites have a lower mean C stock than the wetter sites (but not significantly). This is the opposite of the modeled results; both models show higher mean C content for the drier sites than for the wetter sites. For MIMICS+ this discrepancy is only evident in the top layer, whereas for the lower layers, there are no significant differences between the drier and wetter sites. For the CLM simulations, the pattern is consistent and significant for all three depth intervals (p<0.05). The influence of moisture on decomposition is represented differently in the two models, which can explain some of the difference between the modeled values. This is further discussed in Sect. 4.3.
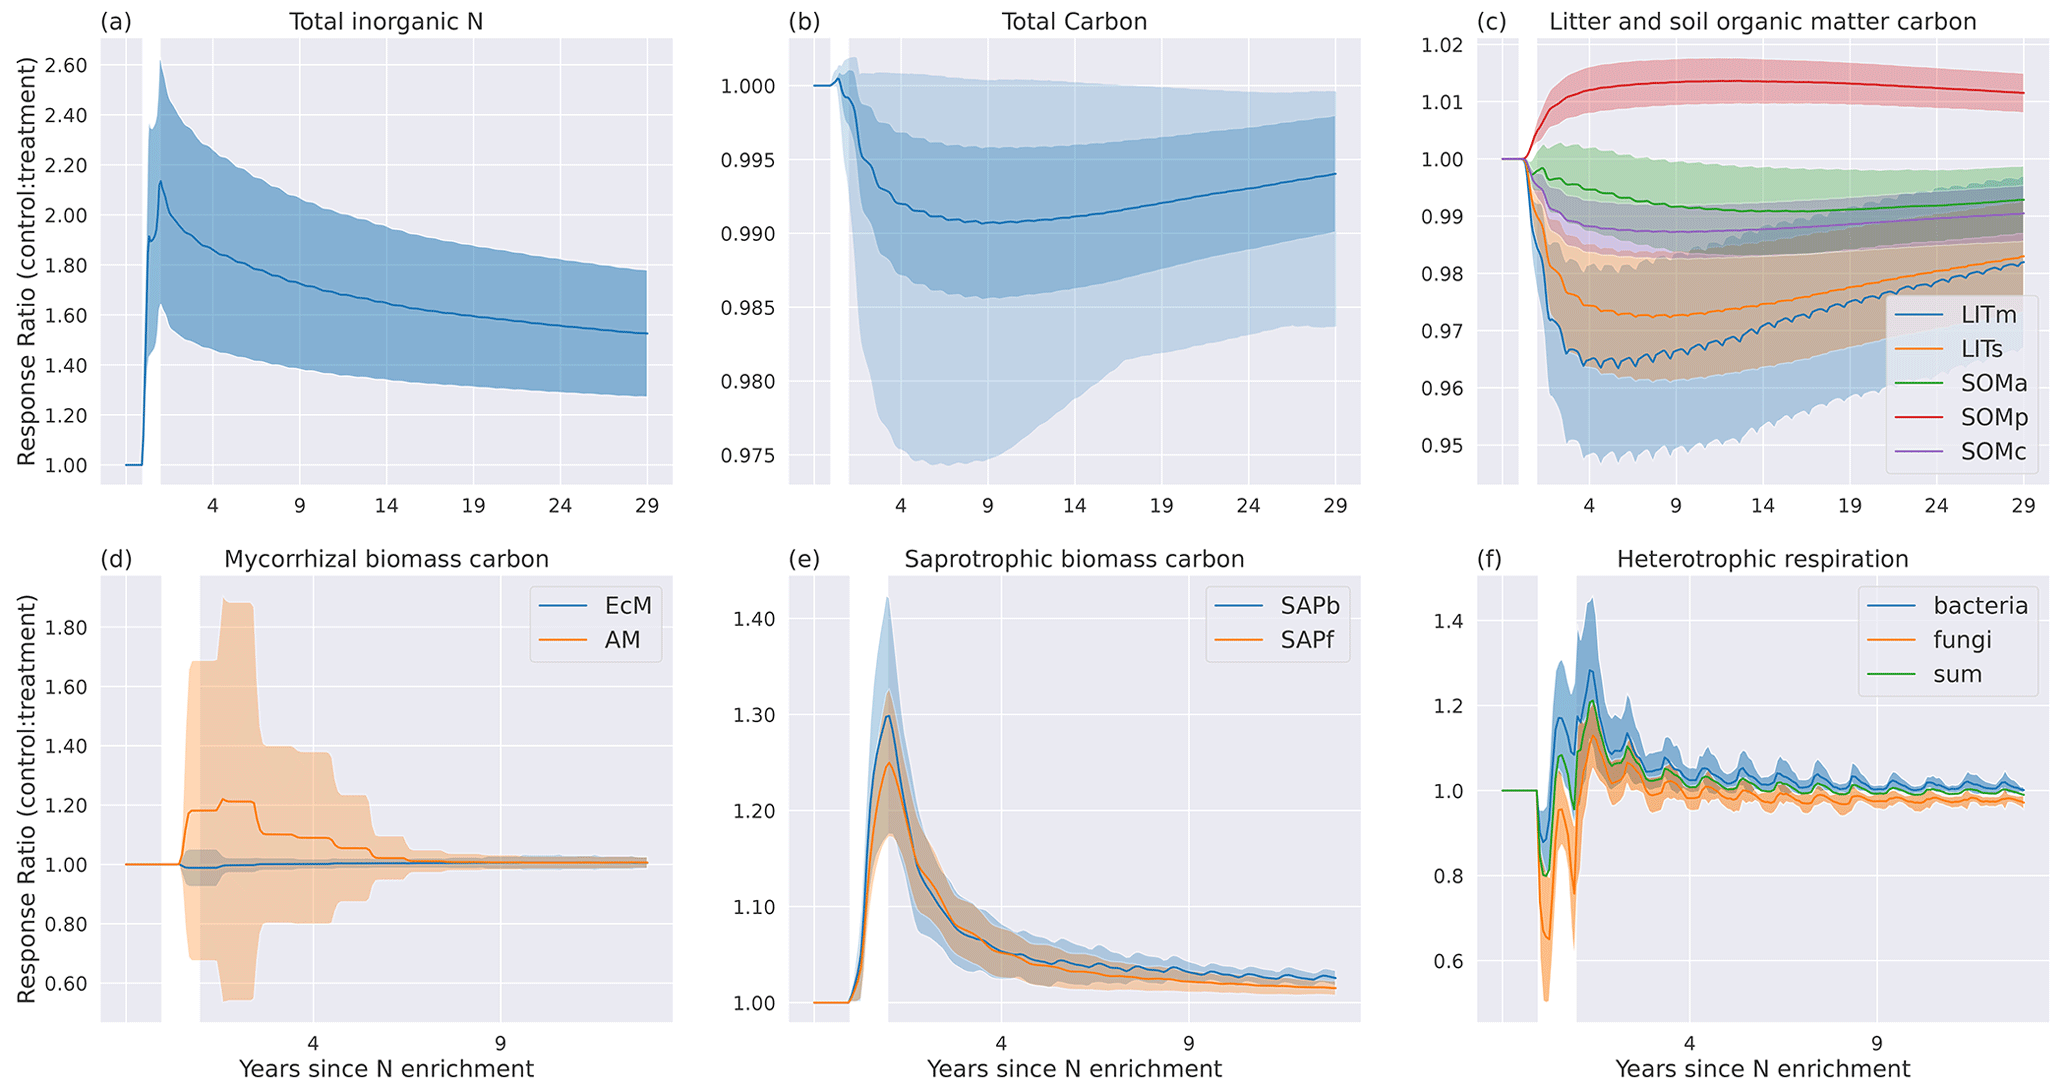
Figure 7Temporal mean (N=50 sites) response ratios (treatment : control) to experimental N enrichment for (a) , (b) , (c) , (d) mycorrhizal fungi pools, (e) saprotrophic pools, (f) heterotrophic respiration, (g) total soil C, (h) litter pools, and (i) soil organic matter pools. The white area marks the year of N enrichment, and the shading indicates the standard deviation. In (g) the lighter shading indicates the total spread of the values.
3.4 N enrichment experiment
The responses to the N enrichment experiment are a result of how the extra reactive N (15 g N m−2 distributed evenly during 1 year) is distributed between the inorganic nitrogen pools after addition (Fig. 7a). All extra N is added to the pool, which had the largest response ratio of the three inorganic N pools. Some of this N will gradually move to via nitrification or to through sorption. While N is lost from relatively fast via plant and microbial uptake and leaching, the extra sorbed N serves as a long-term supply of inorganic N, slowly releasing N back to the dissolved pool. This sustains the higher CUE of the microbes and leads to increased saprotrophic biomass for the duration of the 30-year simulation. Although has the largest relative response to N addition, the change in mass of N is the largest in the pool.
Looking at each C pool response separately, we see the largest responses in the microbial pools (Fig. 7d and e). The extra inorganic N gives a relatively higher return on investment (ROI; Eq. 9) for AM, resulting in more C allocated to AM and less to EcM. The initial large response declines gradually but remains positive throughout the simulation period. Although there is a shift to more AM, the EcM carbon pool is always larger than the AM pool.
Both saprotrophic C pools respond instantly and positively to the N enrichment, with a maximum increase of about 25 % for fungi and 30 % for bacteria at the end of the N addition year. The increase in saprotrophic biomass is a result of higher CUE made possible by more available N. After the N enrichment year, the response gradually decreases until it stabilizes at around 1 % after ca. 5 years. The long-term response is marginally higher for bacteria than for fungi.
The initial response in HR (Fig. 7f) is a result of a lower respired fraction, (1−CUE), leading to increased saprotrophic biomass and thus gradually increased rates of litter decomposition. After the initial negative response in HR in the N enrichment year, there is a positive response due to the higher decomposition rate. For bacterial HR, the response ratio stabilizes at a low positive value, while for fungi it stabilizes at a slightly negative value. Combined, the response ratio is close to 0 for HR after approximately 4 years.
The positive microbial biomass responses result in initial decreases in the substrate pools, LITm, LITs, and SOMa (Fig. 7c). Most microbial necromass ends up in either the physically protected pool (SOMp) or the available pool (SOMa), leading to a positive response for SOMp, while the increased decomposition of SOMa keeps the response ratio below 1. The chemically protected pool experiences a small negative response because increased microbial biomass increases the rate of the depolymerization process that moves chemically recalcitrant SOM to the available SOM pool (C11). The responses in SOM and litter pools are weak, and following 1 year of N enrichment the mean response of total C is a marginal decrease compared to the control. It is worth noting that some sites experience markedly larger responses in total C than others (shading in Fig. 7b).
The overall response of the model illustrates that shifts in N availability have consequences for microbial C and N dynamics, although not necessarily for the total C storage and respiration. It should be noted that in this experiment we did not increase plant productivity and thus carbon input to the soil, which is expected after N enrichment. This also means that possible changes in plant–microbe competition for N were not captured. The added value of this experiment is that we isolate the in-soil processes and quantify the effects of added nutrients available to microbes and how this affects the soil carbon pools.
This study aimed to introduce a microbially explicit soil decomposition model, MIMICS+, designed to represent key soil processes that control carbon and nitrogen processing in boreal ecosystems but still be general enough to be used within an ESM. The model was applied to investigate responses to an N enrichment experiment. The results show that the mean C stocks modeled with MIMICS+ match observations reasonably well, and for Norwegian forested podzolic sites the model performs on par with or better than the state-of-the-art land model CLM using a traditional decomposition formulation (Fig. 2a–c). However, both models showed poor one-to-one agreement with the observations (Fig. 2d–f), possibly due to local heterogeneity that is not captured by the models and inaccuracies in the model climate forcings. The C:N ratios from MIMICS+ are closer to observations than CLM, and the predicted fraction of microbial biomass matches well with values reported in the literature (Figs. 3 and 4). Several noteworthy correlations between variables were found from the MIMICS+ simulations (Fig. 5). Both models capture the climatic temperature pattern from the observed soil profiles, although they both struggle to represent the observed pattern in C concentrations emerging from the MAP categories (Fig. 6). The N enrichment experiment demonstrates the implications of adding the Langmuir algorithm for inorganic N, as the sorbed NH4 works as a long-term supply of N for the microbes. The overall effect of the idealized enrichment experiment on soil C storage and respiration was minor, but it had interesting effects on the relative distribution of the microbial groups and shows the need for further investigation into the role of sorption–desorption processes of inorganic N, especially in N-limited areas like boreal forests (Fig. 7).
4.1 Comparison of modeled and empirical C and N stocks
Looking at the total distribution for the 50 sites, MIMICS+ is closer than CLM to the observations for the top layer (0–30 cm), and models are similar in the middle layer (30–50 cm), while none of the modeled means are significantly different from the observations in the bottom layer (50–100 cm). The site-to-site comparisons with observations were poor for both models, showing that there is a discrepancy between observed and modeled stocks at local scales. This challenge of local factors was illustrated by Pierson et al. (2022), who used the C-only version of MIMICS with optimized parameters based on local observations and showed reduced error in C stocks on smaller scales (catchments<50 km2). Such methods would likely also reduce the errors in MIMICS+ at smaller scales. However, it is important to keep in mind that the intention with MIMICS+ is to develop a module that is simple and fast enough to be used in an ESM to simulate the soil carbon dynamics at a grid cell average scale. When forced with grid cell average input, it is not intended to and should not be expected to accurately describe local variation in soil carbon stocks. Upscaling of point observations of soil C stocks to a landscape level in our study area (Norwegian boreal forests) would be useful for comparison of ESM simulations with empirically based estimates of soil C stocks.
With the MIMICS-CN version, Kyker-Snowman et al. (2020) obtained soil C:N ratios that, although within observed ranges, had much lower maximums than the observed ratios. They suggested increasing the fraction of litter going directly to SOM, as forest soils (compared to agricultural and grassland soils) have been shown to contain a high fraction of C in plant residues (Grandy and Robertson, 2007). Our focus area is forested ecosystems, so we increased the fraction of litter going directly to protected SOM without going through microbial decomposition to 50 % for both structural and metabolic litter (these fractions also affect the total C; see Fig. B1). This leads to a longer lifetime of soil C (stored in protected pools) before it becomes available for microbial decomposition and respiration. The higher directly plant-derived fraction in the SOM pools increases the soil C:N ratio, although it is still lower than observed for total and mineral soil (Fig. 3). A recent study by Angst et al. (2021) indicates that the fraction of directly plant-derived SOM may be much higher than previously assumed, especially for forested sites and podzols. The high C:N ratios in our observational dataset point in the same direction, suggesting that the directly plant-derived fraction is an important factor to consider when modeling boreal soils. Our results demonstrate that we get closer to observed C:N ratios with MIMICS+ compared to the CLM formulation, a main reason being the high directly plant-derived fraction. In the CENTURY-based decomposition cascade in CLM, the C:N ratios of the SOM pools are fixed, which gives limited options to account for high C:N ratios and the implications that may have for soil C dynamics.
4.2 Modeled C pools in MIMICS+
The division of C between the different pools in MIMICS+ shows that most soil C is in the SOM pools (78 %), whereof 62 % are protected. This again reflects the relatively high fraction of litter going directly to protected SOM but also the lifetime of C in the protected pools before it is either depolymerized or desorbed into the available SOM pool. Compared to MIMICS-CN we doubled the desorption coefficient (see Table A5), but this is still 1 order of magnitude lower than the value used in the C-only version of MIMICS (Wieder et al., 2015). In the abovementioned studies and the present study, this parameter has been adjusted to match the observed data. In the model formulation, the desorption coefficient is a function of soil clay content, and more observational studies constraining this parameter as a function of clay content or other observable variables would benefit further model development.
Saprotrophic fungi are the dominant microbial group in our simulations. Fungi are assumed to have a higher maximum CUE than bacteria in the model (0.7 vs. 0.4, respectively) and are more efficient at decomposing structural litter than the bacterial pool (higher Vmax for decomposition of LITs by SAPf than SAPb). This is based on the assumption that fungal decomposers are more specialized towards recalcitrant substrates, while bacteria thrive on labile, easily accessible metabolic litter (Wardle et al., 2004). The fraction of CWD litter provided by CLM is relatively large at these forested sites, giving more substrate that is preferable for fungi. The Norwegian podzols we are looking at are nutrient poor, and fungal dominance is expected under N-limited conditions (Strickland and Rousk, 2010). Figure 5 indicates a negative relationship between available inorganic N and the F : B ratio, meaning a higher fraction of bacteria in more nutrient-rich conditions, in line with observations. Furthermore, the N enrichment experiment showed that bacteria had a larger positive response to the added N in the long term, which indicates that the model can capture shifts in microbial communities in response to N conditions.
The modeled saprotrophic fungal biomass C dominates over the mycorrhizal fungal biomass C. This is in contrast with an observational study on boreal forests that indicates that EcM can account for as much as 47 %–84 % of fungal biomass (Bååth et al., 2004). Moreover, Clemmensen et al. (2013) challenged the traditional view that C sequestration is mainly driven by the decomposition of aboveground litter by saprotrophs with their study that showed a dominance of root-associated fungi in deeper parts of the LFH in boreal forests. Few studies exist to inform models about fungal dominance in boreal systems, so parameters determining mycorrhizal growth and turnover are poorly constrained and not particularly adjusted for boreal conditions in this model iteration. The sensitivity analysis showed that the EcM mining rate (KMO) and maximum mycorrhizal CUE in particular impact total modeled C (Fig. B1), highlighting the need for informing these parameters with representative observations. The C supply to mycorrhizal pools is prescribed directly from CLM output, and the growth of these pools is therefore governed by this input rate. Coupling MIMICS+ to the aboveground vegetation will allow the plant C supply to react to nutrient conditions in the soil and is a priority in future model development.
Regarding the correlations presented in this study (Fig. 5), one should always keep in mind that correlation does not imply causation, especially in a coupled non-linear system like this model. The analysis should be regarded as a broad investigation into possible relationships within the soil dynamics. Recently, Tao et al. (2023) presented CUE as a strong predictor of SOC globally and argued for a positive correlation between CUE and soil carbon storage (SOC) based on a combination of global-scale datasets, a microbial-process explicit model, data assimilation, deep learning, and meta-analysis. In contrast, our analysis showed a negative correlation between microbial CUE and soil carbon storage, in addition to a strong correlation between total carbon and plant litter input. A relatively large fraction of the litter input in MIMICS+ (50 %) initially omits the microbial pathway (affected by CUE) as directly plant-derived organic matter into protected SOM pools, which weakens the relationship between microbial CUE and TOTC. A high fraction of microbial necromass ends up in SOMa (Eqs. C13–C18 in Table A3 and parameters in Table A5). This leads to a relatively rapid recycling of the C that initially goes through the microbial pathway, which can also contribute to a weaker relationship between CUE and C storage than if larger fractions of the necromass ended up in the protected SOM pools. However, more microbially derived mass in the protected SOM pools will decrease the C:N ratio, taking modeled values further away from the observed C:N ratios in Strand et al. (2016). Tao et al. (2023) used a process-guided deep learning and data-driven modeling (PRODA) approach to optimize parameters in a microbially explicit model (Allison et al., 2010) using observations. Default model parameters prior to optimization gave a negative relationship between CUE and SOC, illustrating how model estimates rely on parameter choices. Using a similar approach to inform MIMICS+ can lead to more robust parameter values in future model iterations.
In MIMICS+ the availability of inorganic N is highly dependent on soil water processes because both N leaching from and the Langmuir isotherm algorithm are dependent on soil moisture. This is evident from Fig. 5, where we see a negative correlation between inorganic N pools and moisture-related variables (MAP and SOILWATER). The available inorganic N pools are again positively correlated with the percentage of microbes, giving an indirect dependence of microbes on soil moisture. The total C is negatively correlated with the percentage of microbes and has a high correlation with the incoming C. With higher temperatures, the model gives a higher turnover rate and thereby more release of soil C to the atmosphere. However, increased temperatures also stimulate plant production, especially in boreal and arctic regions, which can exceed or offset the effect of higher decomposition rates (Hobbie et al., 2002). The correlation patterns from our simulation indicate that the effect of temperature on plant production dominates the effect of temperature on decomposition rates in the model. Pierson et al. (2022) found that increased temperature sensitivity of the decomposition kinetics compared to the original MIMICS parameter values reduced error compared to their observational data, indicating that the temperature sensitivity in MIMICS and MIMICS+ may be too weak. However, the agreement between models and observations in Fig. 6a–c indicates that more plant production is the dominating effect of higher temperatures in Norwegian forests.
4.3 Comparison of climate gradient profiles
Although simple, dividing sites into different climatic categories serves as an idealized “space-for-time” investigation of climate change responses. Assuming that the climate in boreal forests in general and Norwegian forests specifically will get warmer and wetter in the future (Hanssen-Bauer et al., 2017), the observations indicate higher soil C content at sites with higher MAP and MAT. The models indicate higher C content for warmer sites but lower C content for the wetter sites, especially in the 0–30 cm layer. There is a positive correlation between MAT and MAP, particularly for the observed climate forcing (Fig. B3). When dividing the observed sites into the climate categories, a large fraction ends up as either cold and dry or warm and wet. We therefore did a simple “temperature-dependence removal” on the total podzol dataset (N=578) by dividing the sites into narrow temperature intervals of 0.5 °C (Fig. S2). This did not reveal a clear pattern between the wetter and drier sites, and it is therefore difficult to disentangle the effects of moisture from the effects of temperature in the observed data. Since the models use soil moisture and not MAP to define parameters, we also analyzed the results using a soil moisture variable from the CLM simulations (SOILWATER_10CM) instead of MAP to discriminate between drier and wetter sites to investigate any effects on the climatic pattern (Fig. S3). This showed the same pattern as in Fig. 6d–f (more C in drier soils for the models and less C in drier soils for observations) for all three distributions, except for the deepest layer, where the trend shifted for the observations, but not significantly. The CLM simulations show a negative correlation between MAP and total C (−0.63, p<0.001, Fig. B2), while this is not evident for MIMICS+, indicating that it is different factors that determine the pattern from the two models. In MIMICS+, the moisture modifier on decomposition works on the fluxes from substrate to the microbial pools. The modeled microbes are the most abundant in the top 0–30 cm, which can explain why we observe a difference between drier and wetter sites only in this layer. In CLM, the moisture modification on decomposition rates works on every step in the decomposition cascade from litter to SOM pools. Since the SOM pools have more C in deeper layers, it can explain why we see the pattern in all three depth intervals for the CLM simulations. The moisture modifier used in MIMICS+ (see rmoist, Table A5, and Wieder et al., 2017; Sulman et al., 2014) is a bell-shaped function of soil moisture, limiting decomposition in the case of both very wet and very dry soil conditions. If the optimal soil moisture conditions according to this function do not represent the optimal soil moisture value of the real soils, this could explain why MIMICS+ predicts the opposite pattern between the drier and wetter soils. Moreover, soil moisture can vary with subgrid features like slope and aspect, variations not expected to be captured by CLM. Therefore, discrepancy between actual and modeled soil moisture can also be a contributing factor.
4.4 N enrichment experiment
Meta-analyses of observational N enrichment studies show that microbial biomass tends to decrease after enrichment, while the response in total soil C is relatively modest (Treseder, 2008; Janssens et al., 2010). The small modeled response of total soil C to N enrichment (Fig. 7b) is in line with these observations, but the modeled microbial biomass showed a marginal long-term increase after an initial high response (Fig. 7d and e). Treseder (2008) proposed several mechanisms for N effects on microbial growth (Fig. 1 in Treseder, 2008), some leading to an increase and others leading to a decrease in microbial biomass. The sites studied in our model simulations are mainly N limited (N immobilization via mechanism 1 in Sect. 2.1.2 dominates), and we see an accumulation of microbial biomass as a direct consequence of the increased N availability, which is one of the mechanisms suggested by Treseder (2008) for an increase in microbial biomass. Mechanisms proposed to reduce microbial biomass in response to N enrichment are a decrease in soil pH, a decrease in ligninase activity, an increase in melanoidins, and a decrease in belowground NPP. In this offline iteration of MIMICS+ we are unable to capture potential decreases in belowground NPP allocation. Coupling to a vegetation model will enable this possibility and might affect the modeled response of N enrichment. When dividing results into separate biomes, Treseder's (2008) analyses indicate that for boreal forests the response for bacteria is positive (RR=1.061), while for fungi it is negative (RR=0.717) but with a confidence interval covering both positive and negative responses (0.0402–1.434). This points to uncertainties in observations of responses of N enrichment as well. To cover more of the possible mechanisms for microbial biomass decline in the model, one or more of the other mechanisms mentioned above could be included.
The strong N limitation in the model is partly a consequence of using low, constant C:N requirements for the saprotrophic pools (CNb=5 and CNf=8, ref. Table A5). A less strict C:N requirement, or a dynamic C:N approach, as presented in the ORCHIMIC model (Huang et al., 2018, 2021), could lead to a weaker modeled N limitation and more microbial N mineralization, which can affect the response to N enrichment. This could also improve the modeled underestimation of the soil C:N ratio, as N in inorganic forms is subject to loss through direct plant uptake and leaching.
In the simulations, the largest loss of soil N is through the ectomycorrhizal pathway (N29). The parameter sensitivity analysis also shows a stronger sensitivity of total C to mycorrhizal parameters than to the plant uptake (Fig. B1). The high microbial immobilization of N, together with the simplified representations of direct plant uptake (constant loss rate of available inorganic N), might cause an overestimation of the loss of organic N through mycorrhiza at the expense of direct plant uptake of inorganic N (N33). To model a more realistic scenario, with increased plant production and changes in plant N acquisition strategies as a response to the extra N, it is therefore necessary to couple MIMICS+ to a vegetation model. In such an experiment, both the increase in litter production and the shifts in plant C allocation will affect the soil dynamics. The enrichment experiment presented in this study showed that the model is able to capture microbial responses, and in a coupled system it can be used to further study plant–microbe competition for nutrients.
4.5 Limitations and future improvements of the MIMICS+ framework
By expanding the MIMICS framework with extra microbial groups and an N cycle, we increase the possibilities to capture microbe–microbe interactions and, after coupling, plant–microbe interactions as well. However, we also introduce additional parameters and a more complex model structure that makes the model more prone to overfitting and equifinality issues. While acknowledging this possible drawback, we believe valuable insights can be gathered through a more detailed process representation, especially as new technologies allow for measurements that are suitable for constraining model parameters. Although the model produces results comparable to the observations from Strand et al. (2016), there are still poorly constrained parameters in the model, especially related to mycorrhizal C and N transfer. Recent insights into the mycorrhizal role in soil C dynamics are valuable contributions to future model development (Huang et al., 2022a, b). A more robust parameter optimization procedure like the PRODA approach (Tao et al., 2023) or a Monte Carlo approach (Pierson et al., 2022) will contribute to constraining model parameters. The model should also be evaluated against observations from other ecosystems, which will increase confidence in the model structure and parameter choices. This offline version of MIMICS+ does not capture plant–microbe interactions and feedbacks, which is essential for capturing terrestrial responses to climate change. Therefore, coupling with a vegetation model is a priority in future model development.
The soil model MIMICS+ provides a tool for investigating soil C processes and interactions with the N cycle, particularly relevant for boreal areas. Furthermore, the model framework will serve as a valuable soil module in ESMs as it is general enough to work on larger scales. The model produces soil C and N stocks comparable to observed values in Norwegian forest podzols. The explicit representation of microbial groups enhances performance compared to the traditional CLM and enables detection of soil dynamics not possible with a conventional model. In particular, the novel representation of sorbed inorganic N can be further developed to examine climate responses in N-limited systems like boreal forests but also possible impacts on other ecosystems not limited by N. In this study the MIMICS+ model is decoupled from vegetation, so we cannot directly detect feedbacks between nutrient availability and plant productivity. Coupling MIMICS+ to a dynamical vegetation model like FATES will further enable investigation of the interplay between soil microbes and changing aboveground vegetation.
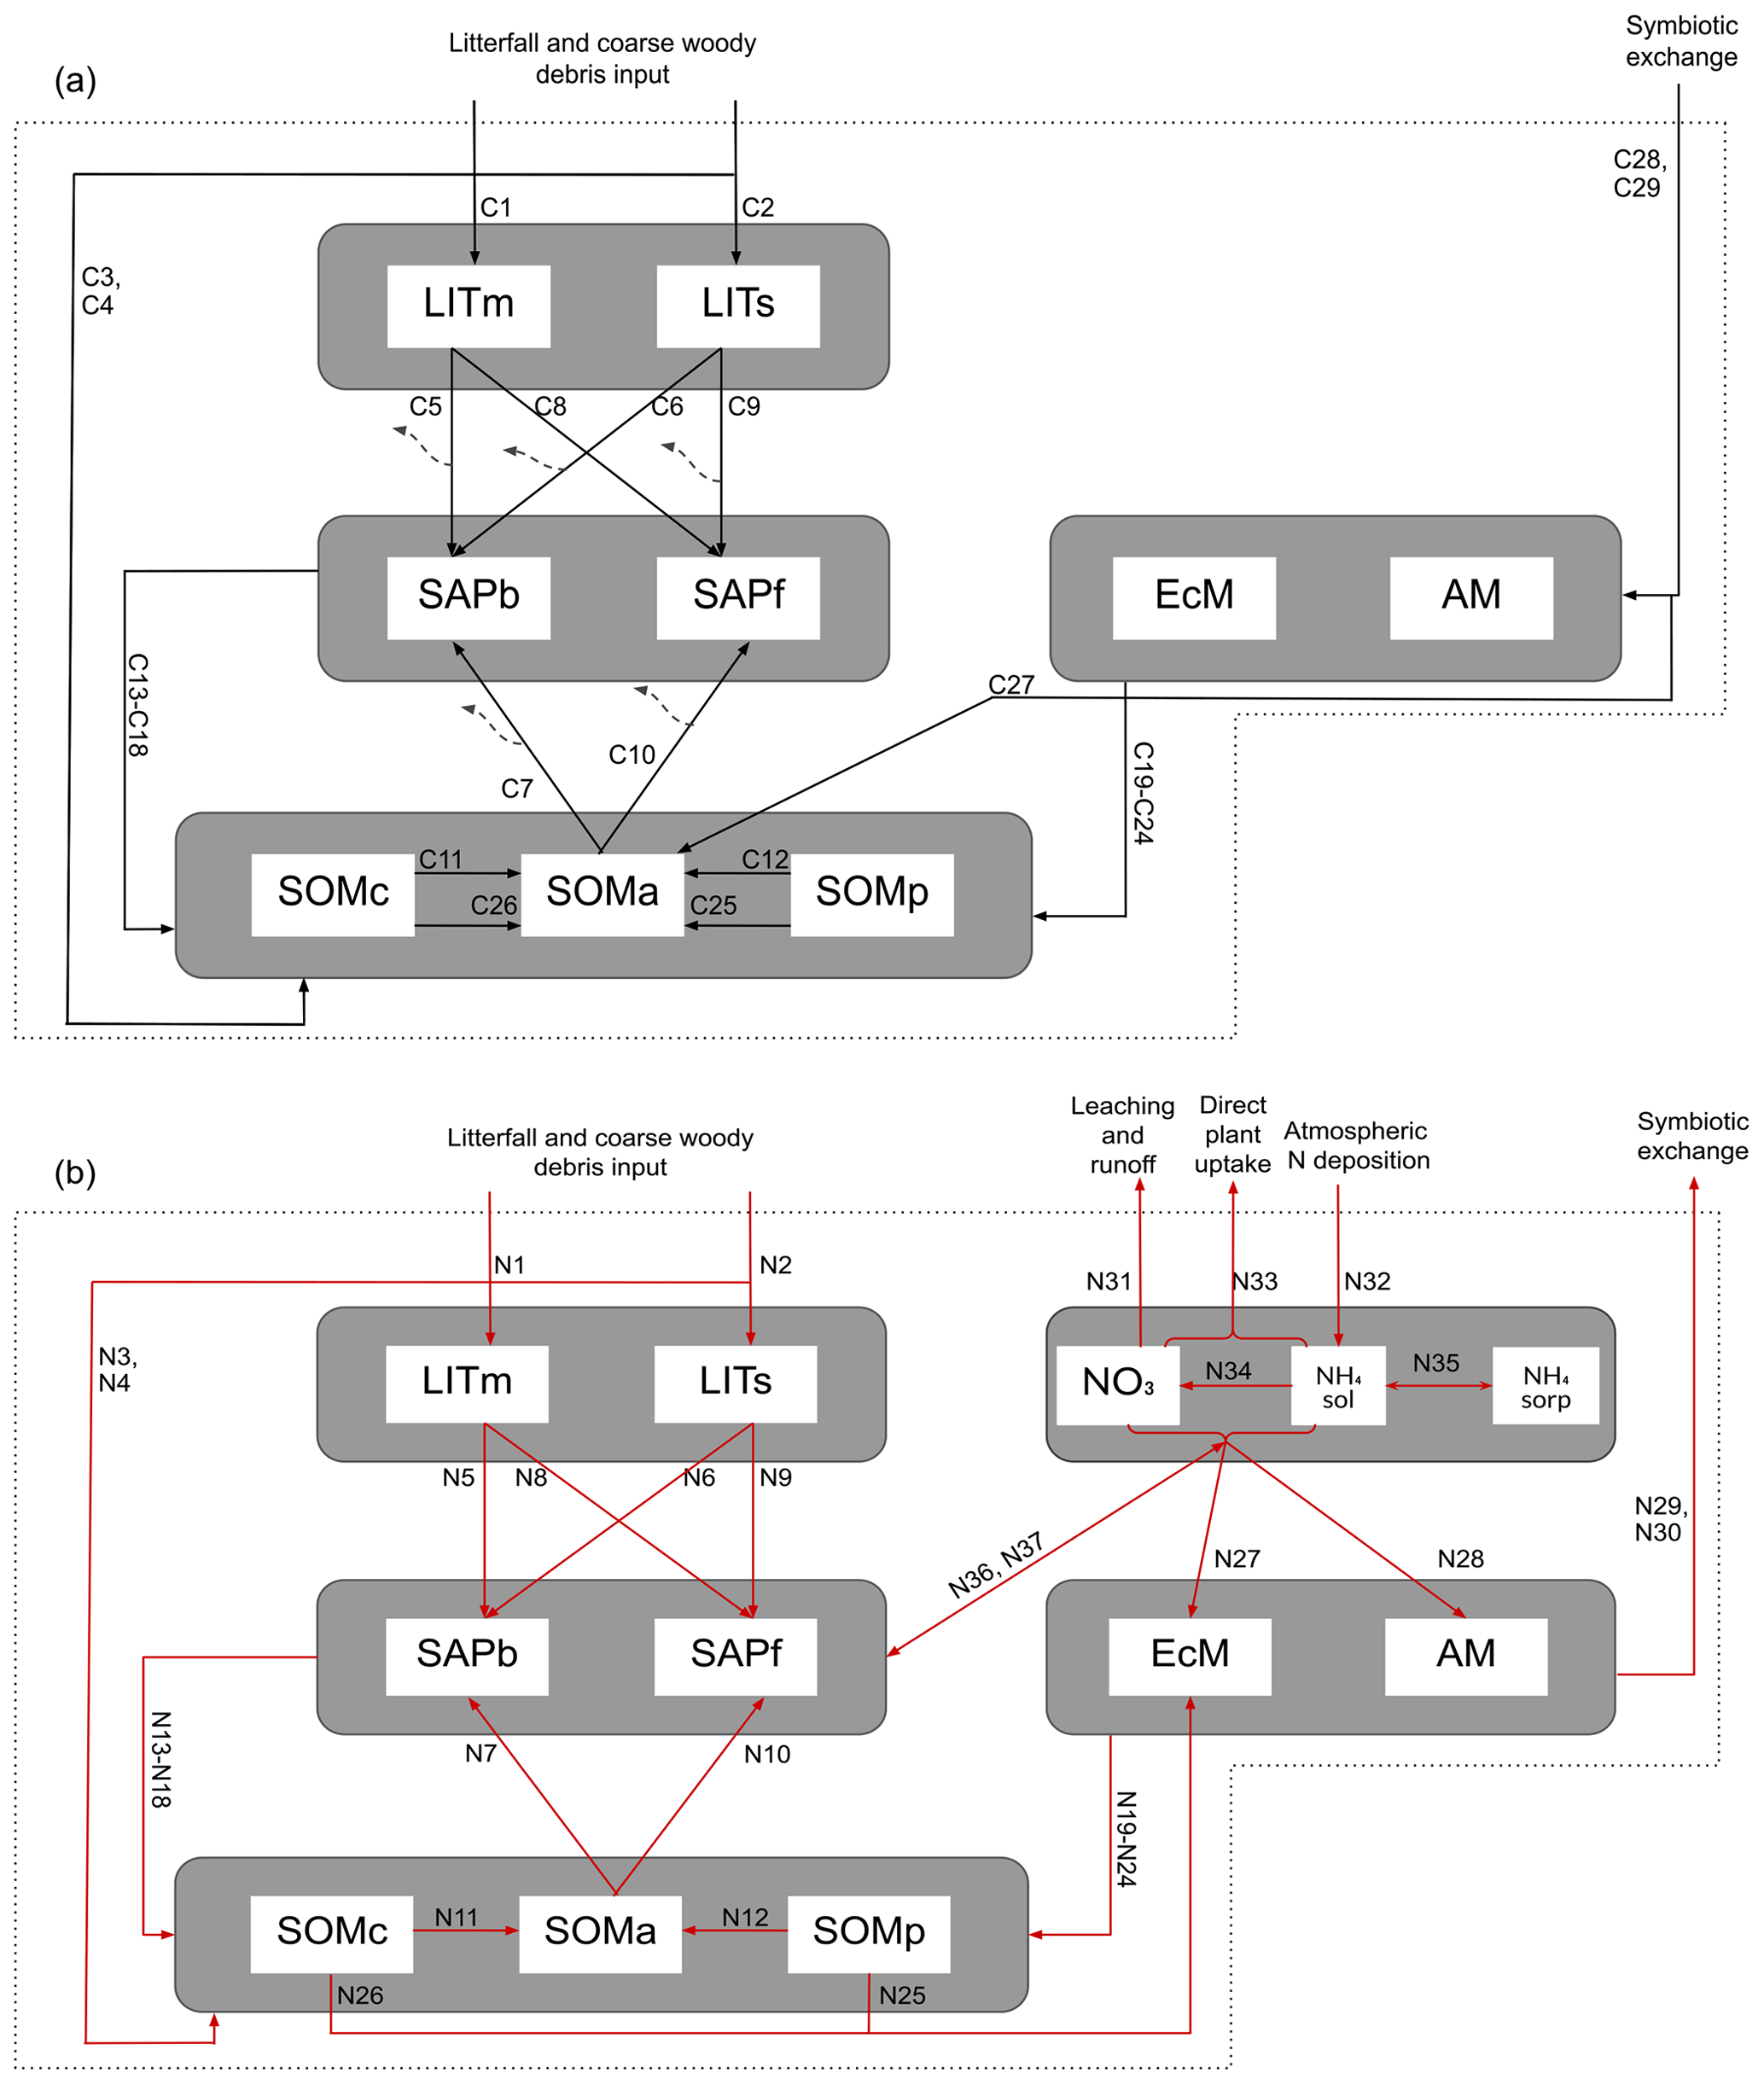
Table A1Mass balance equations for the carbon pools in the model, calculated for each vertical layer (subscript dropped for readability). FCdonor,receiver: . Details about the fluxes can be found in Table A3.
* .
Table A2Mass balance equations for the nitrogen pools in the model, calculated for each vertical layer (subscript dropped for readability). FNdonor,receiver: . Details about the fluxes can be found in Table A4.
a . b FNIN,receiver=FNNO3+NH4sol,receiver. c Can be either positive or negative.
Table A3Details about C fluxes in the model. The equation numbers correspond to the arrows in Fig. A1a. The letters in the fifth column match those given in Table A1. All FCdonor,receiver values are in . Parameters are described in Table A5.
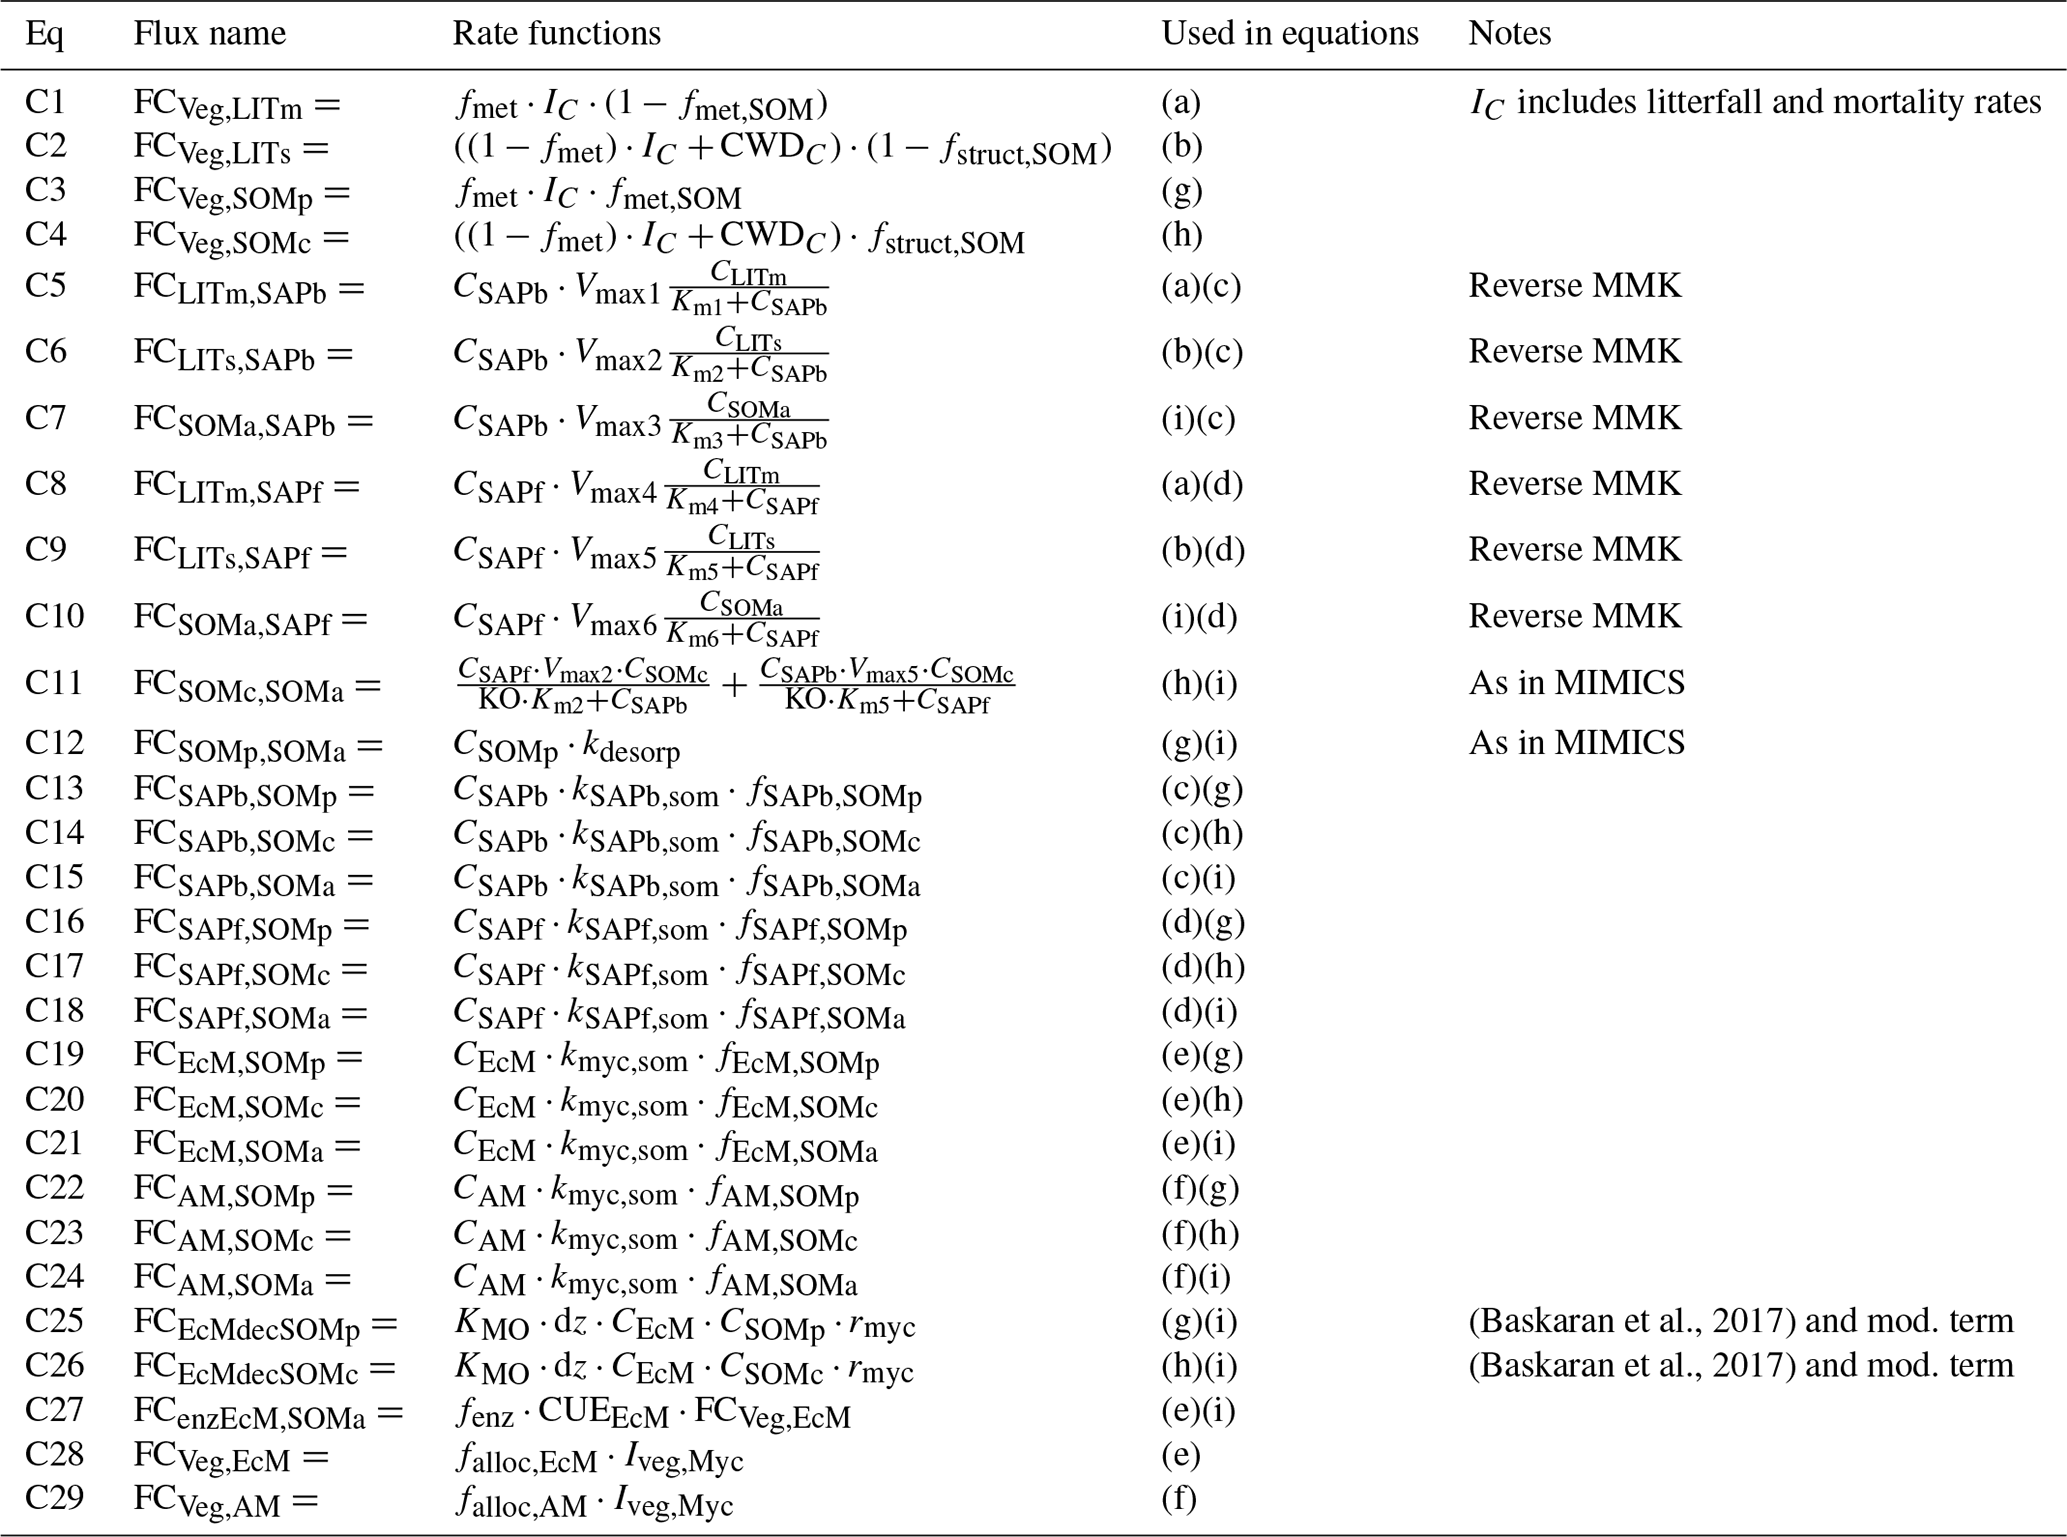
Table A4Details about N fluxes in the model. The equation numbers correspond to the arrows in Fig. A1b. The letters in the fifth column match those given in Table A2. Parameters are described in Table A5.
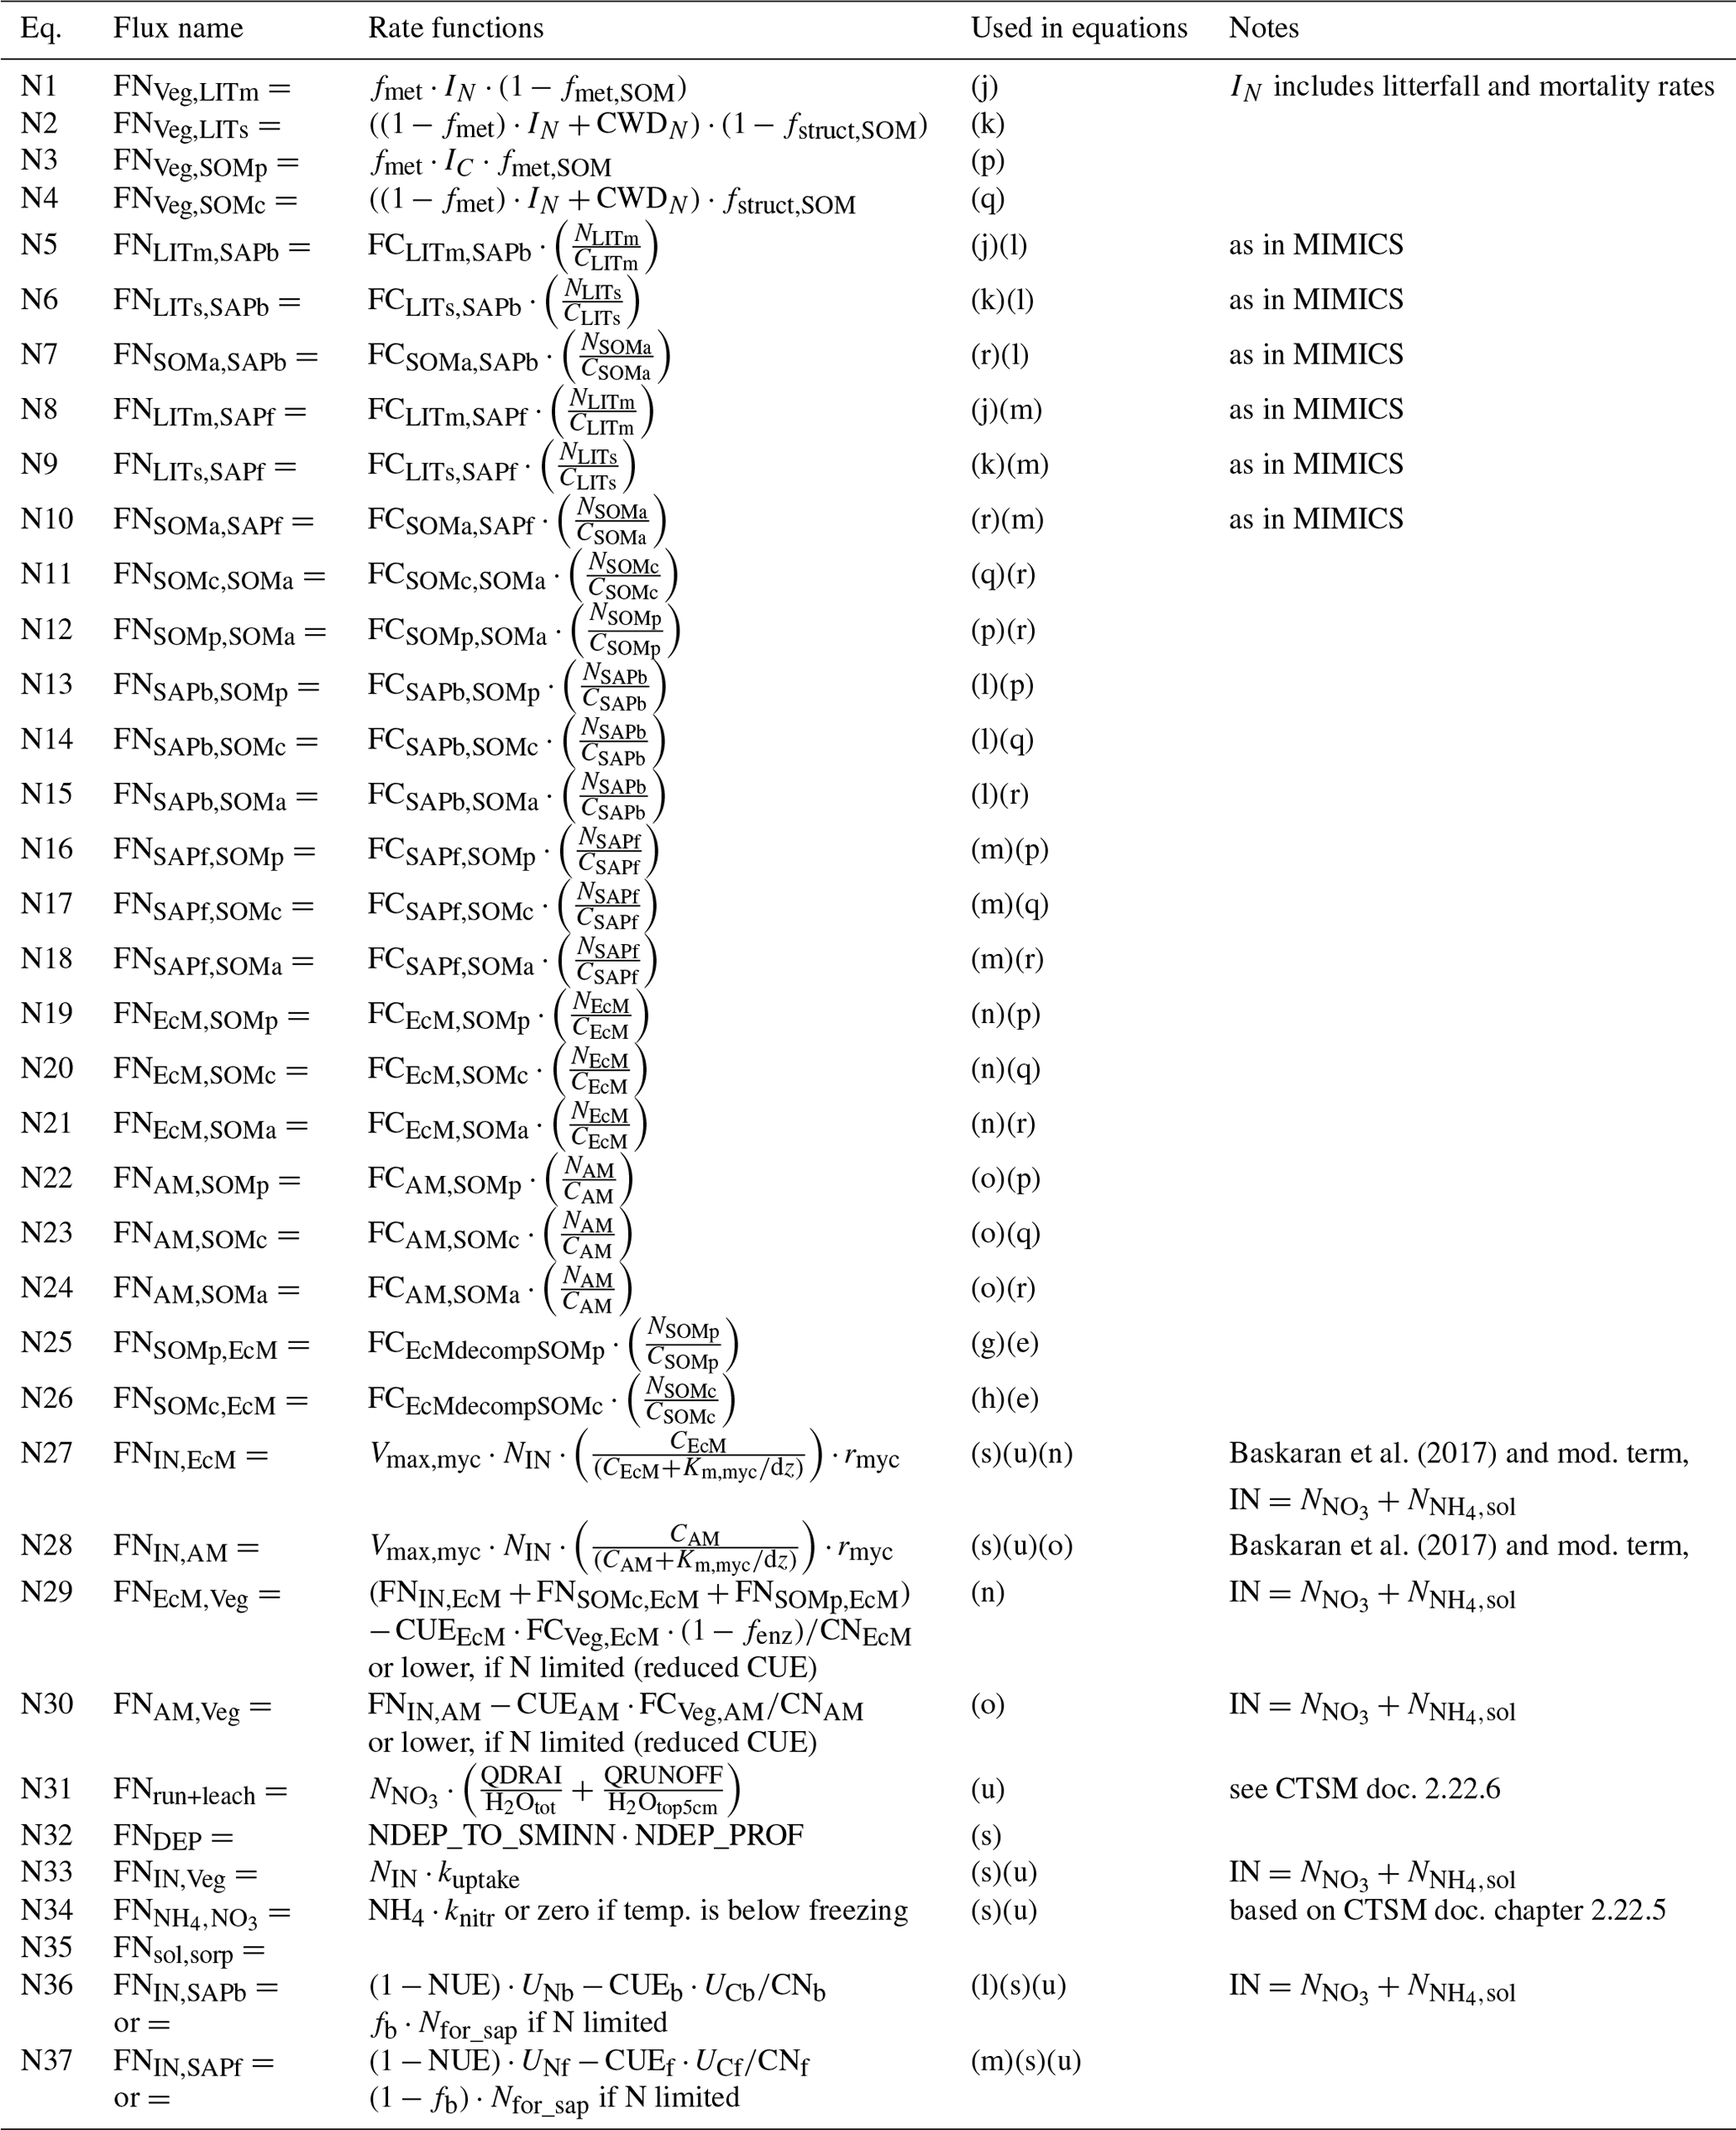
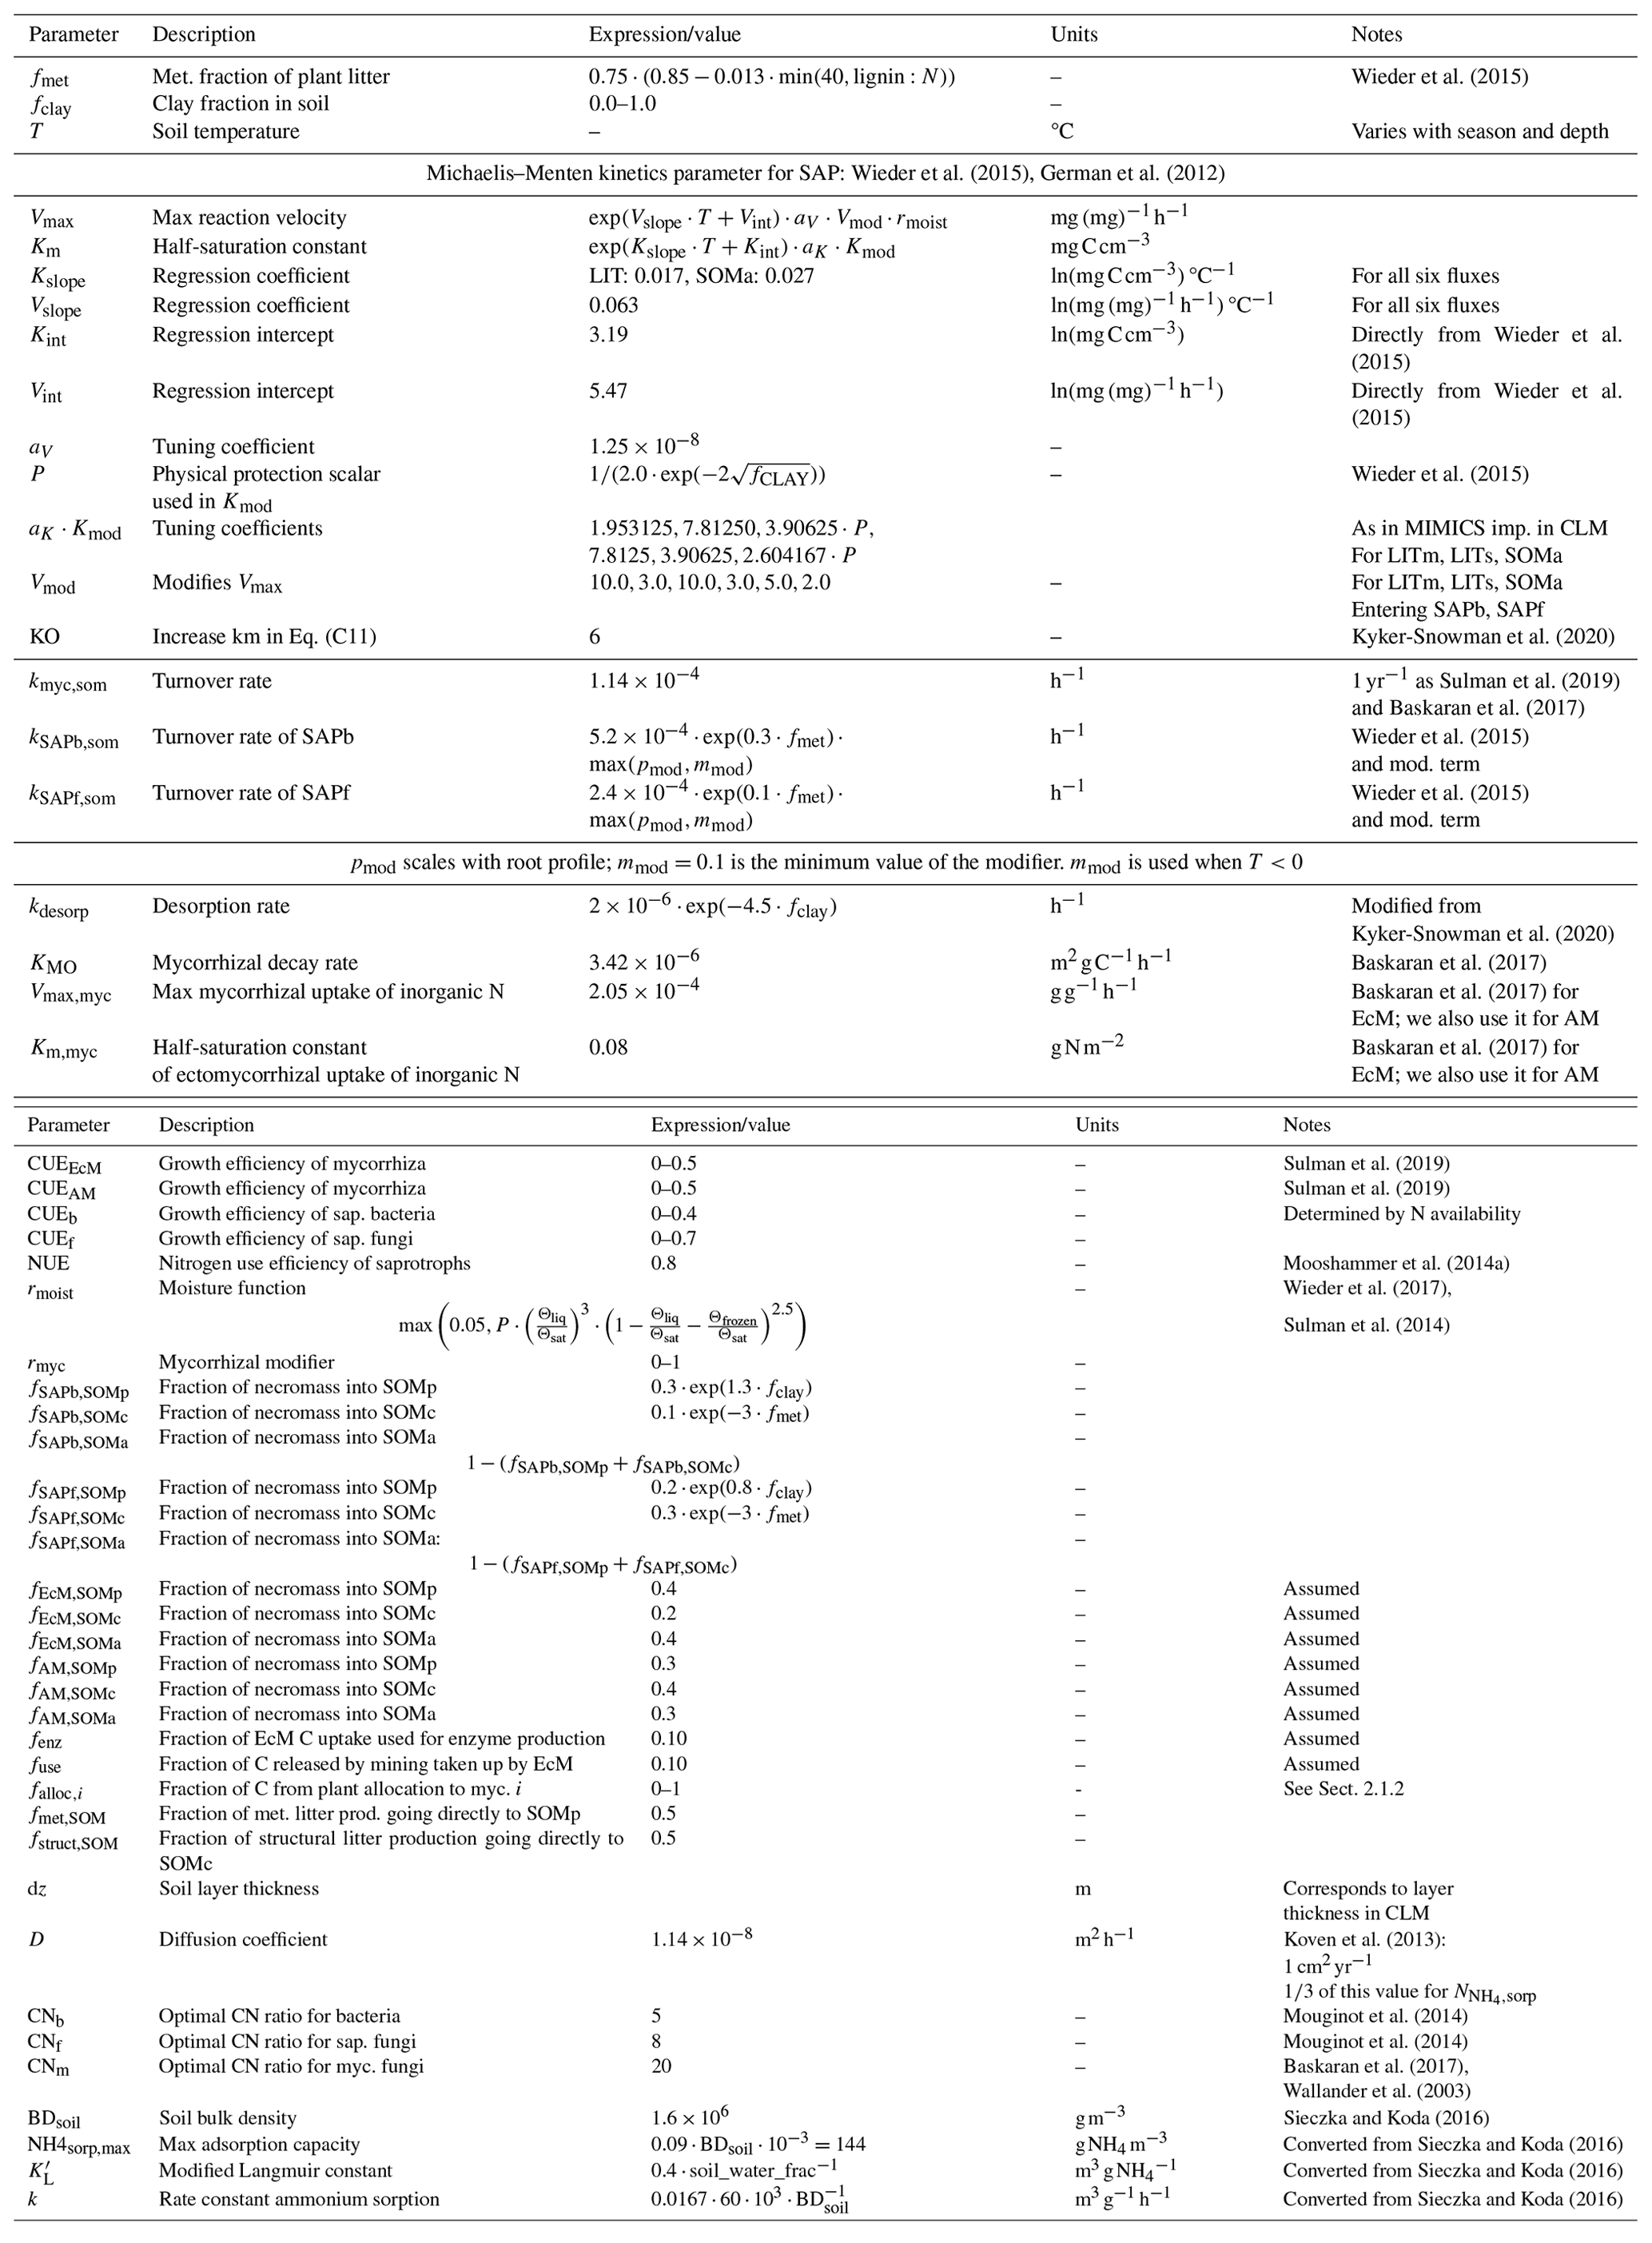
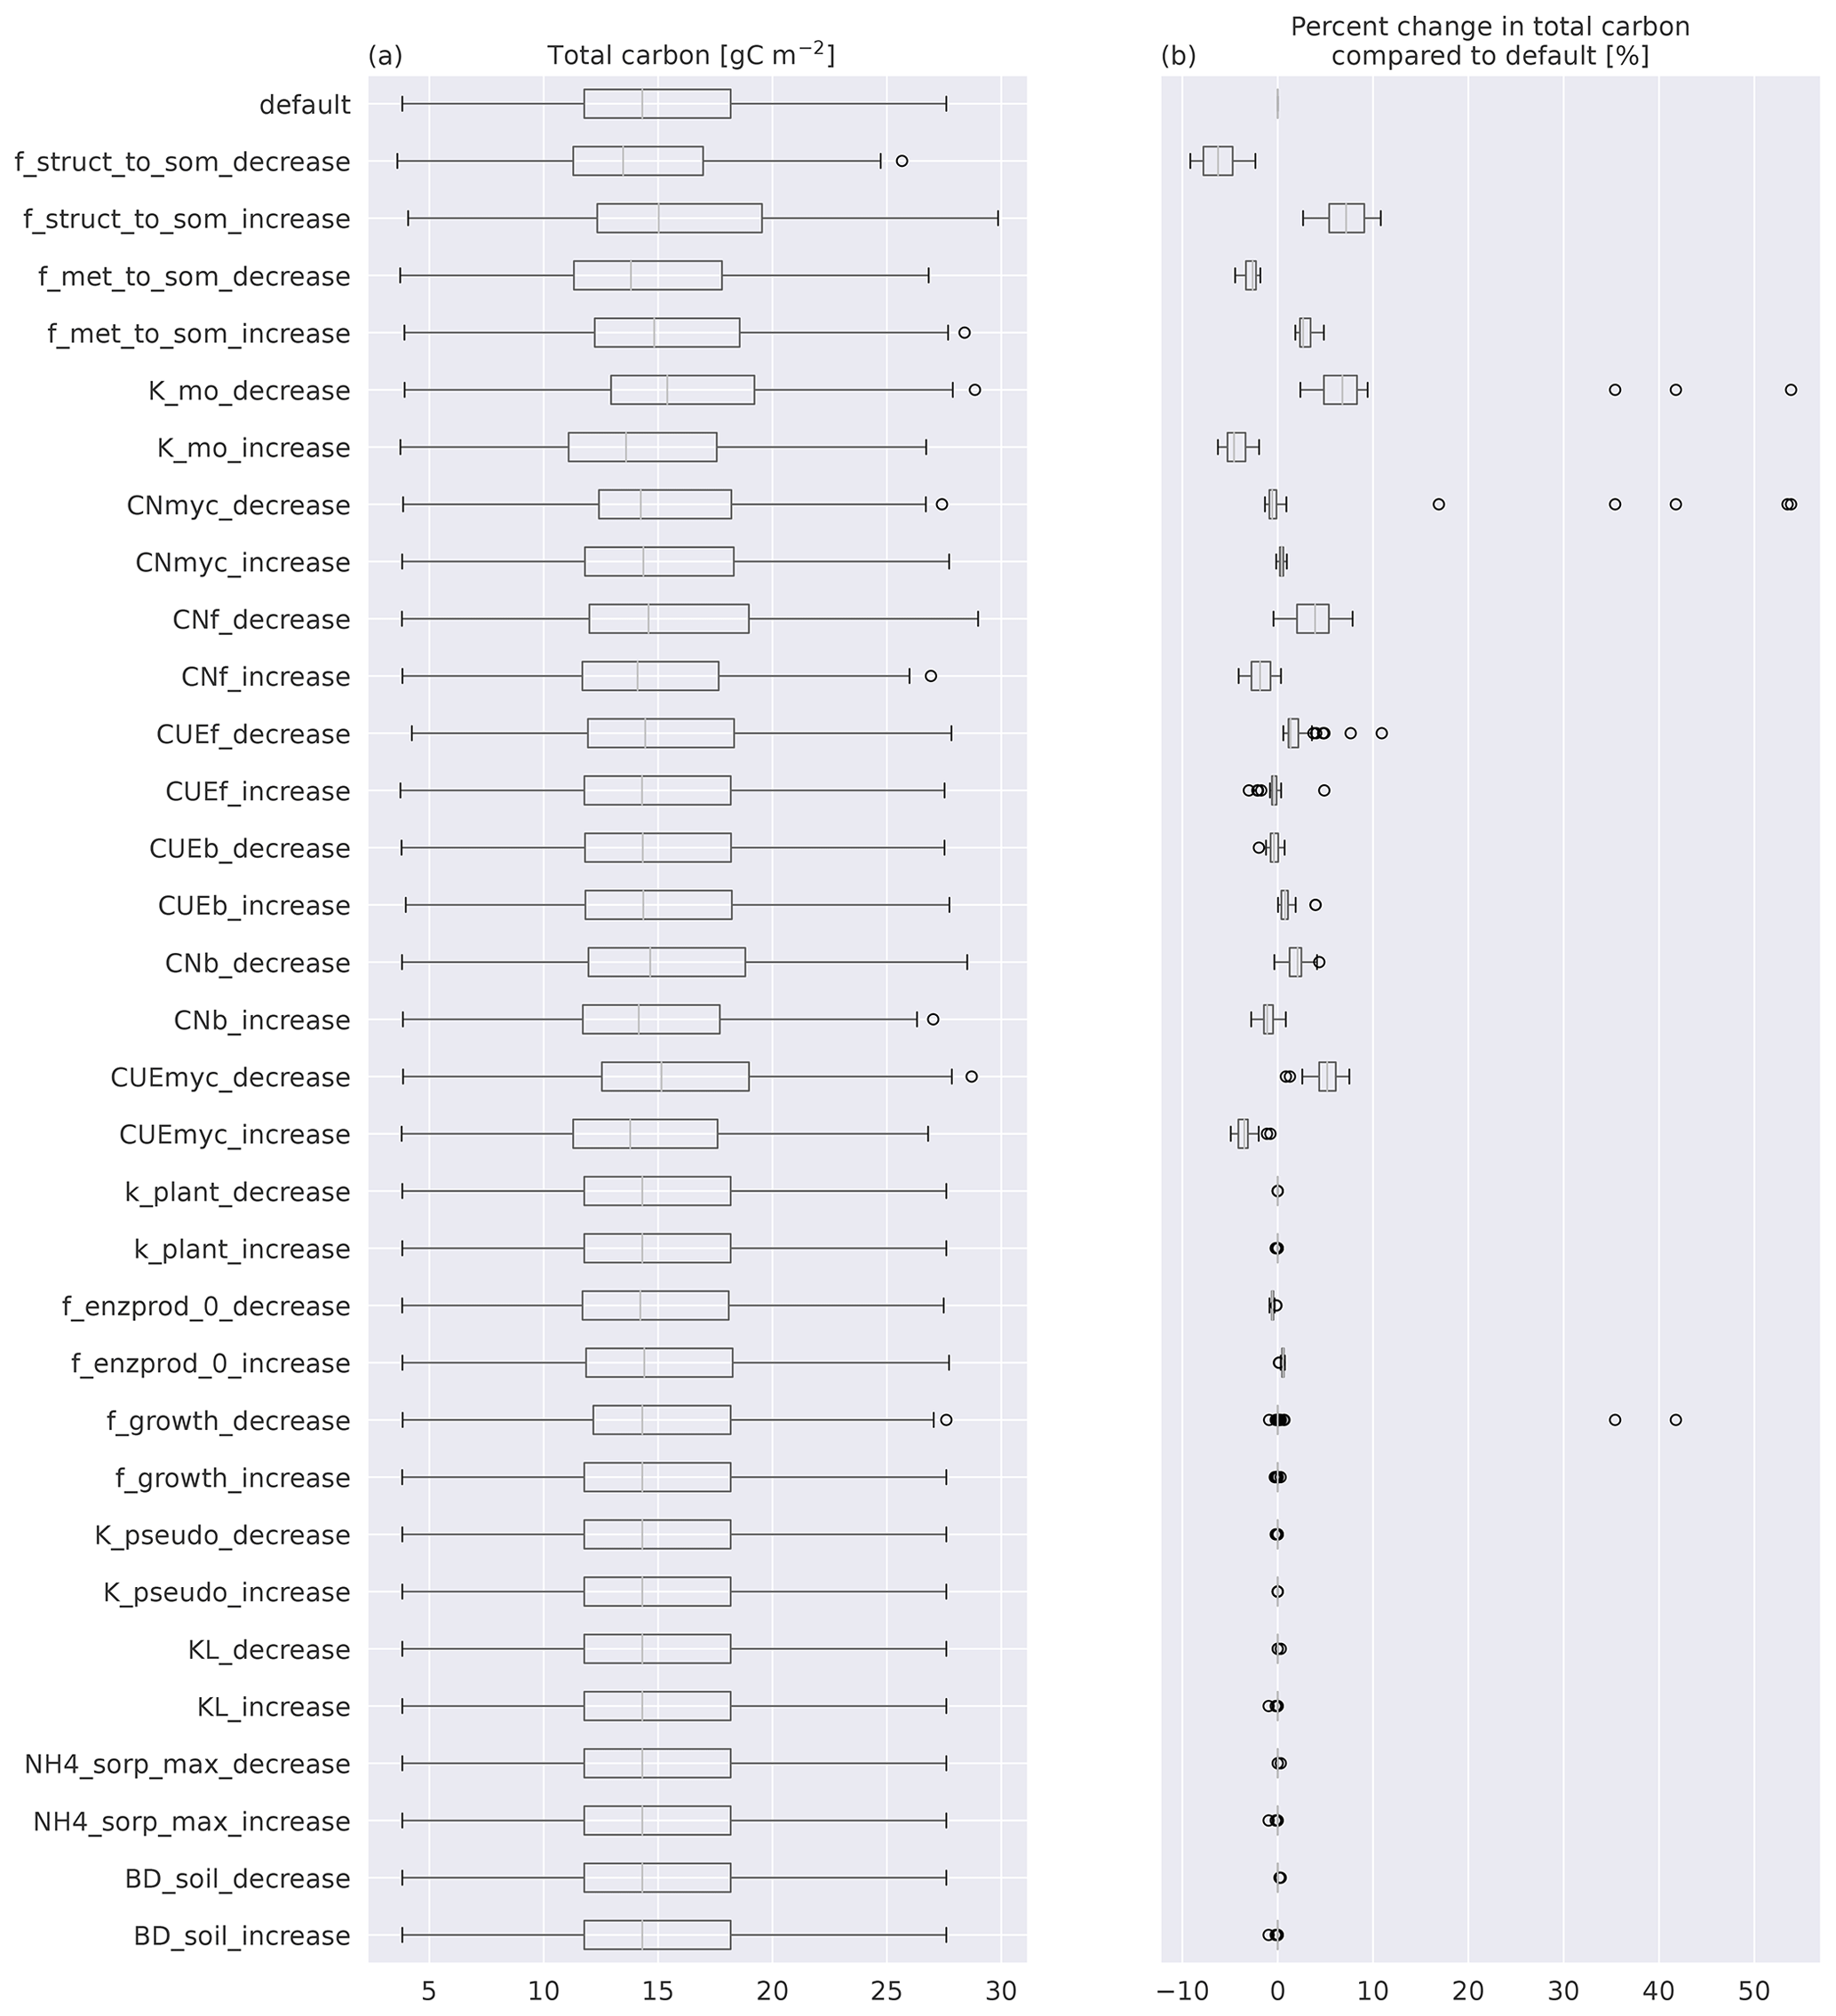
Figure B1(a) Boxplots of total C for the 50 sites modeled with MIMICS+. The top box is the default simulations, while the rest are simulations with one parameter perturbed with either a 25 % increase or a 25 % decrease compared to the default value. (b) Boxplots of the percentage change from the default of the same simulations as in (a). The line in each box is the median; the box's upper and lower edges are the 75th and 25th percentiles, respectively. The whiskers extend from the box by 1.5 times the interquartile range.
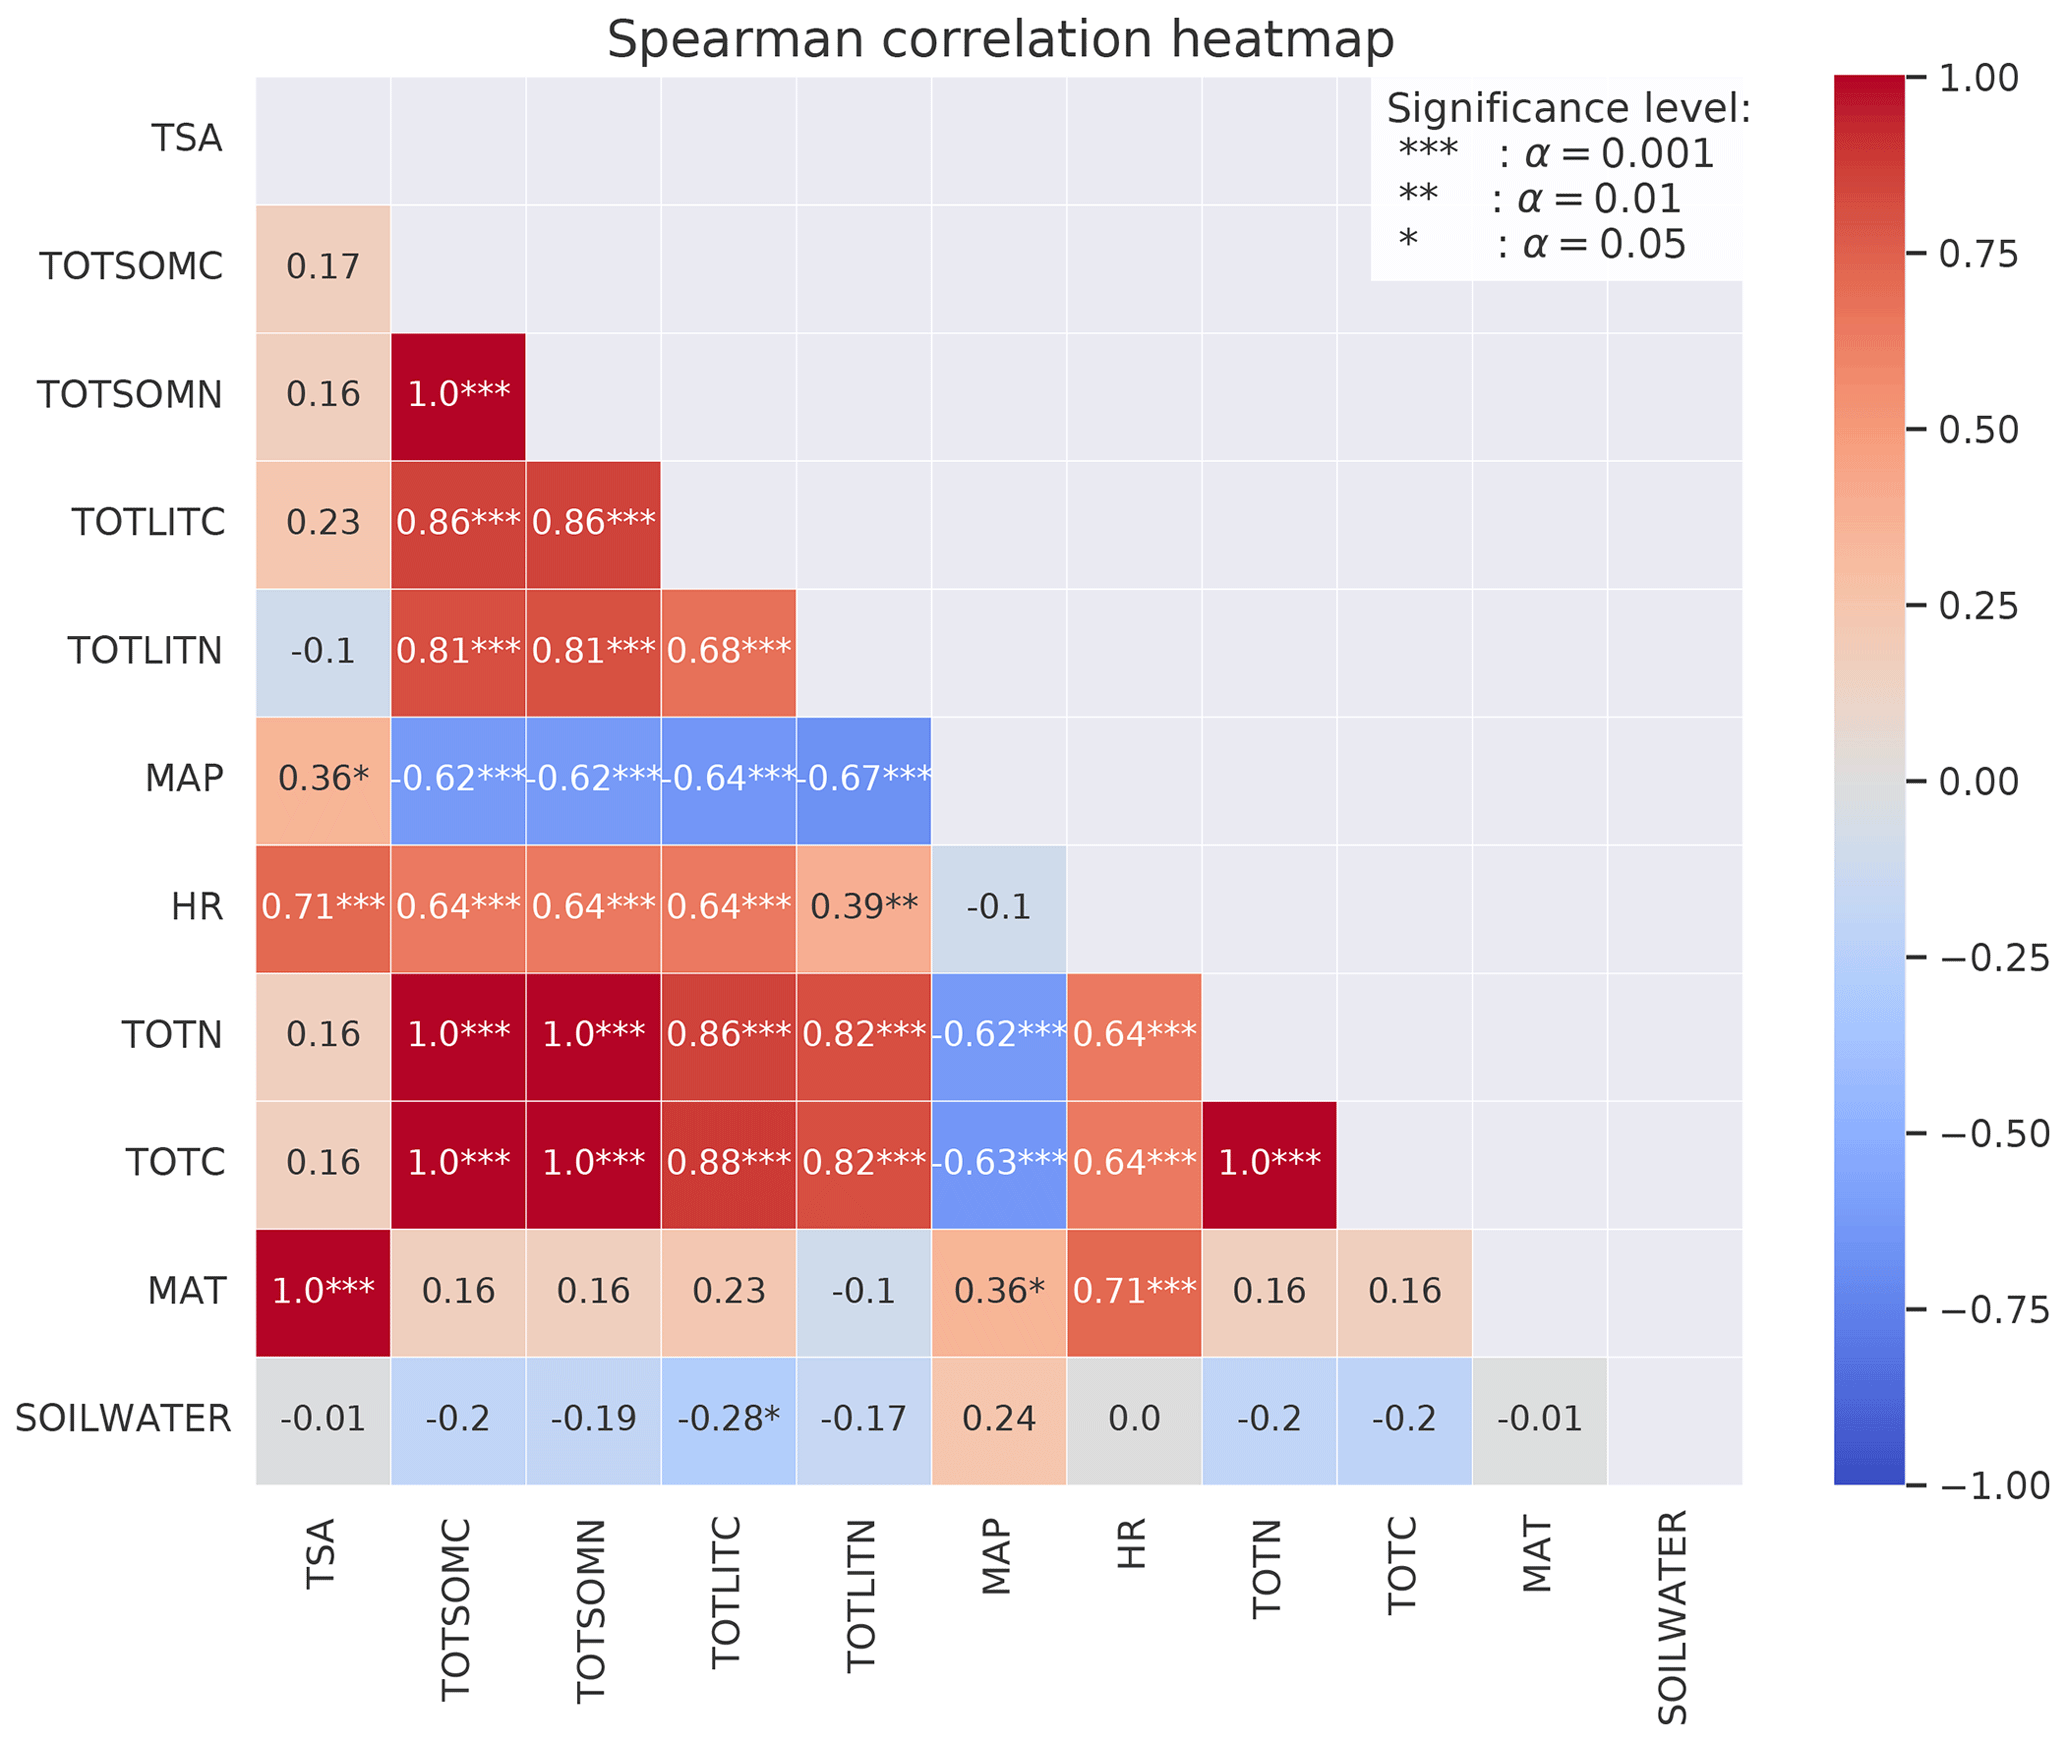
Figure B2Spearman's correlation coefficients between different variables calculated from the CLM simulations of the 50 sites. The stars represent the significance level of the correlation. Numbers without stars are not significant (p>0.05). The colors indicate whether the correlation is positive (red) or negative (blue), and the shades indicate the strength of the correlation.
Figure B3Spearman's correlation coefficients between different observed variables at 50 sites (Strand et al., 2016). The stars represent the significance level of the correlation. Numbers without stars are not significant (p>0.05). The colors indicate whether the correlation is positive (red) or negative (blue), and the shades indicate the strength of the correlation.
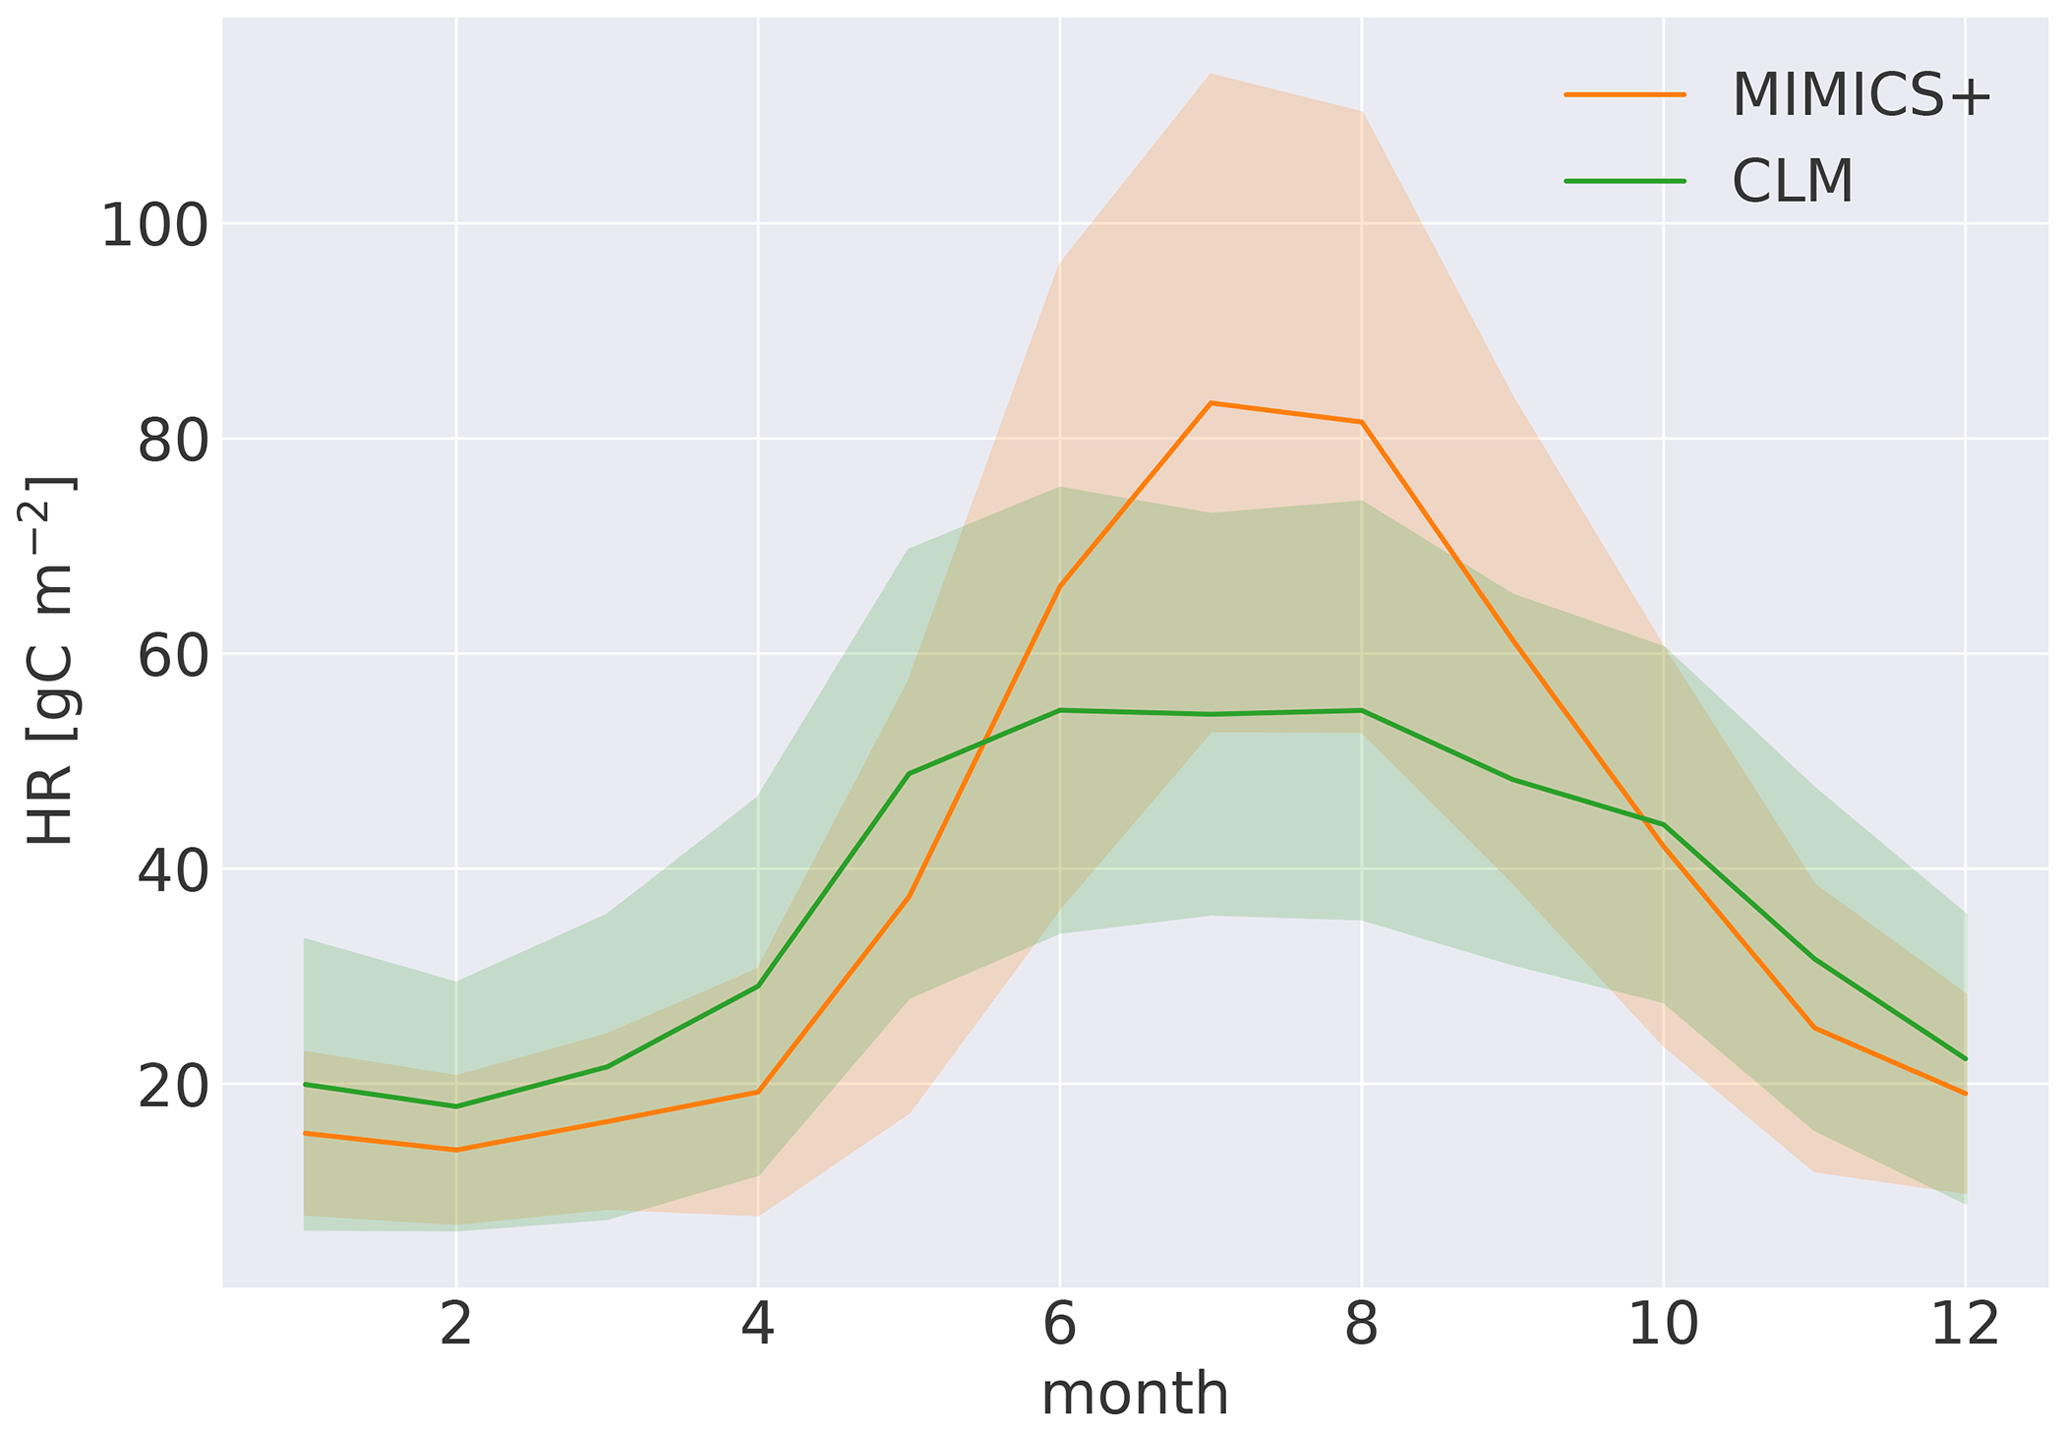
Figure B4Modeled mean seasonal heterotrophic respiration over the years 1988–1992 and the 50 modeled sites. The shading indicates the standard deviation among the 50 sites.
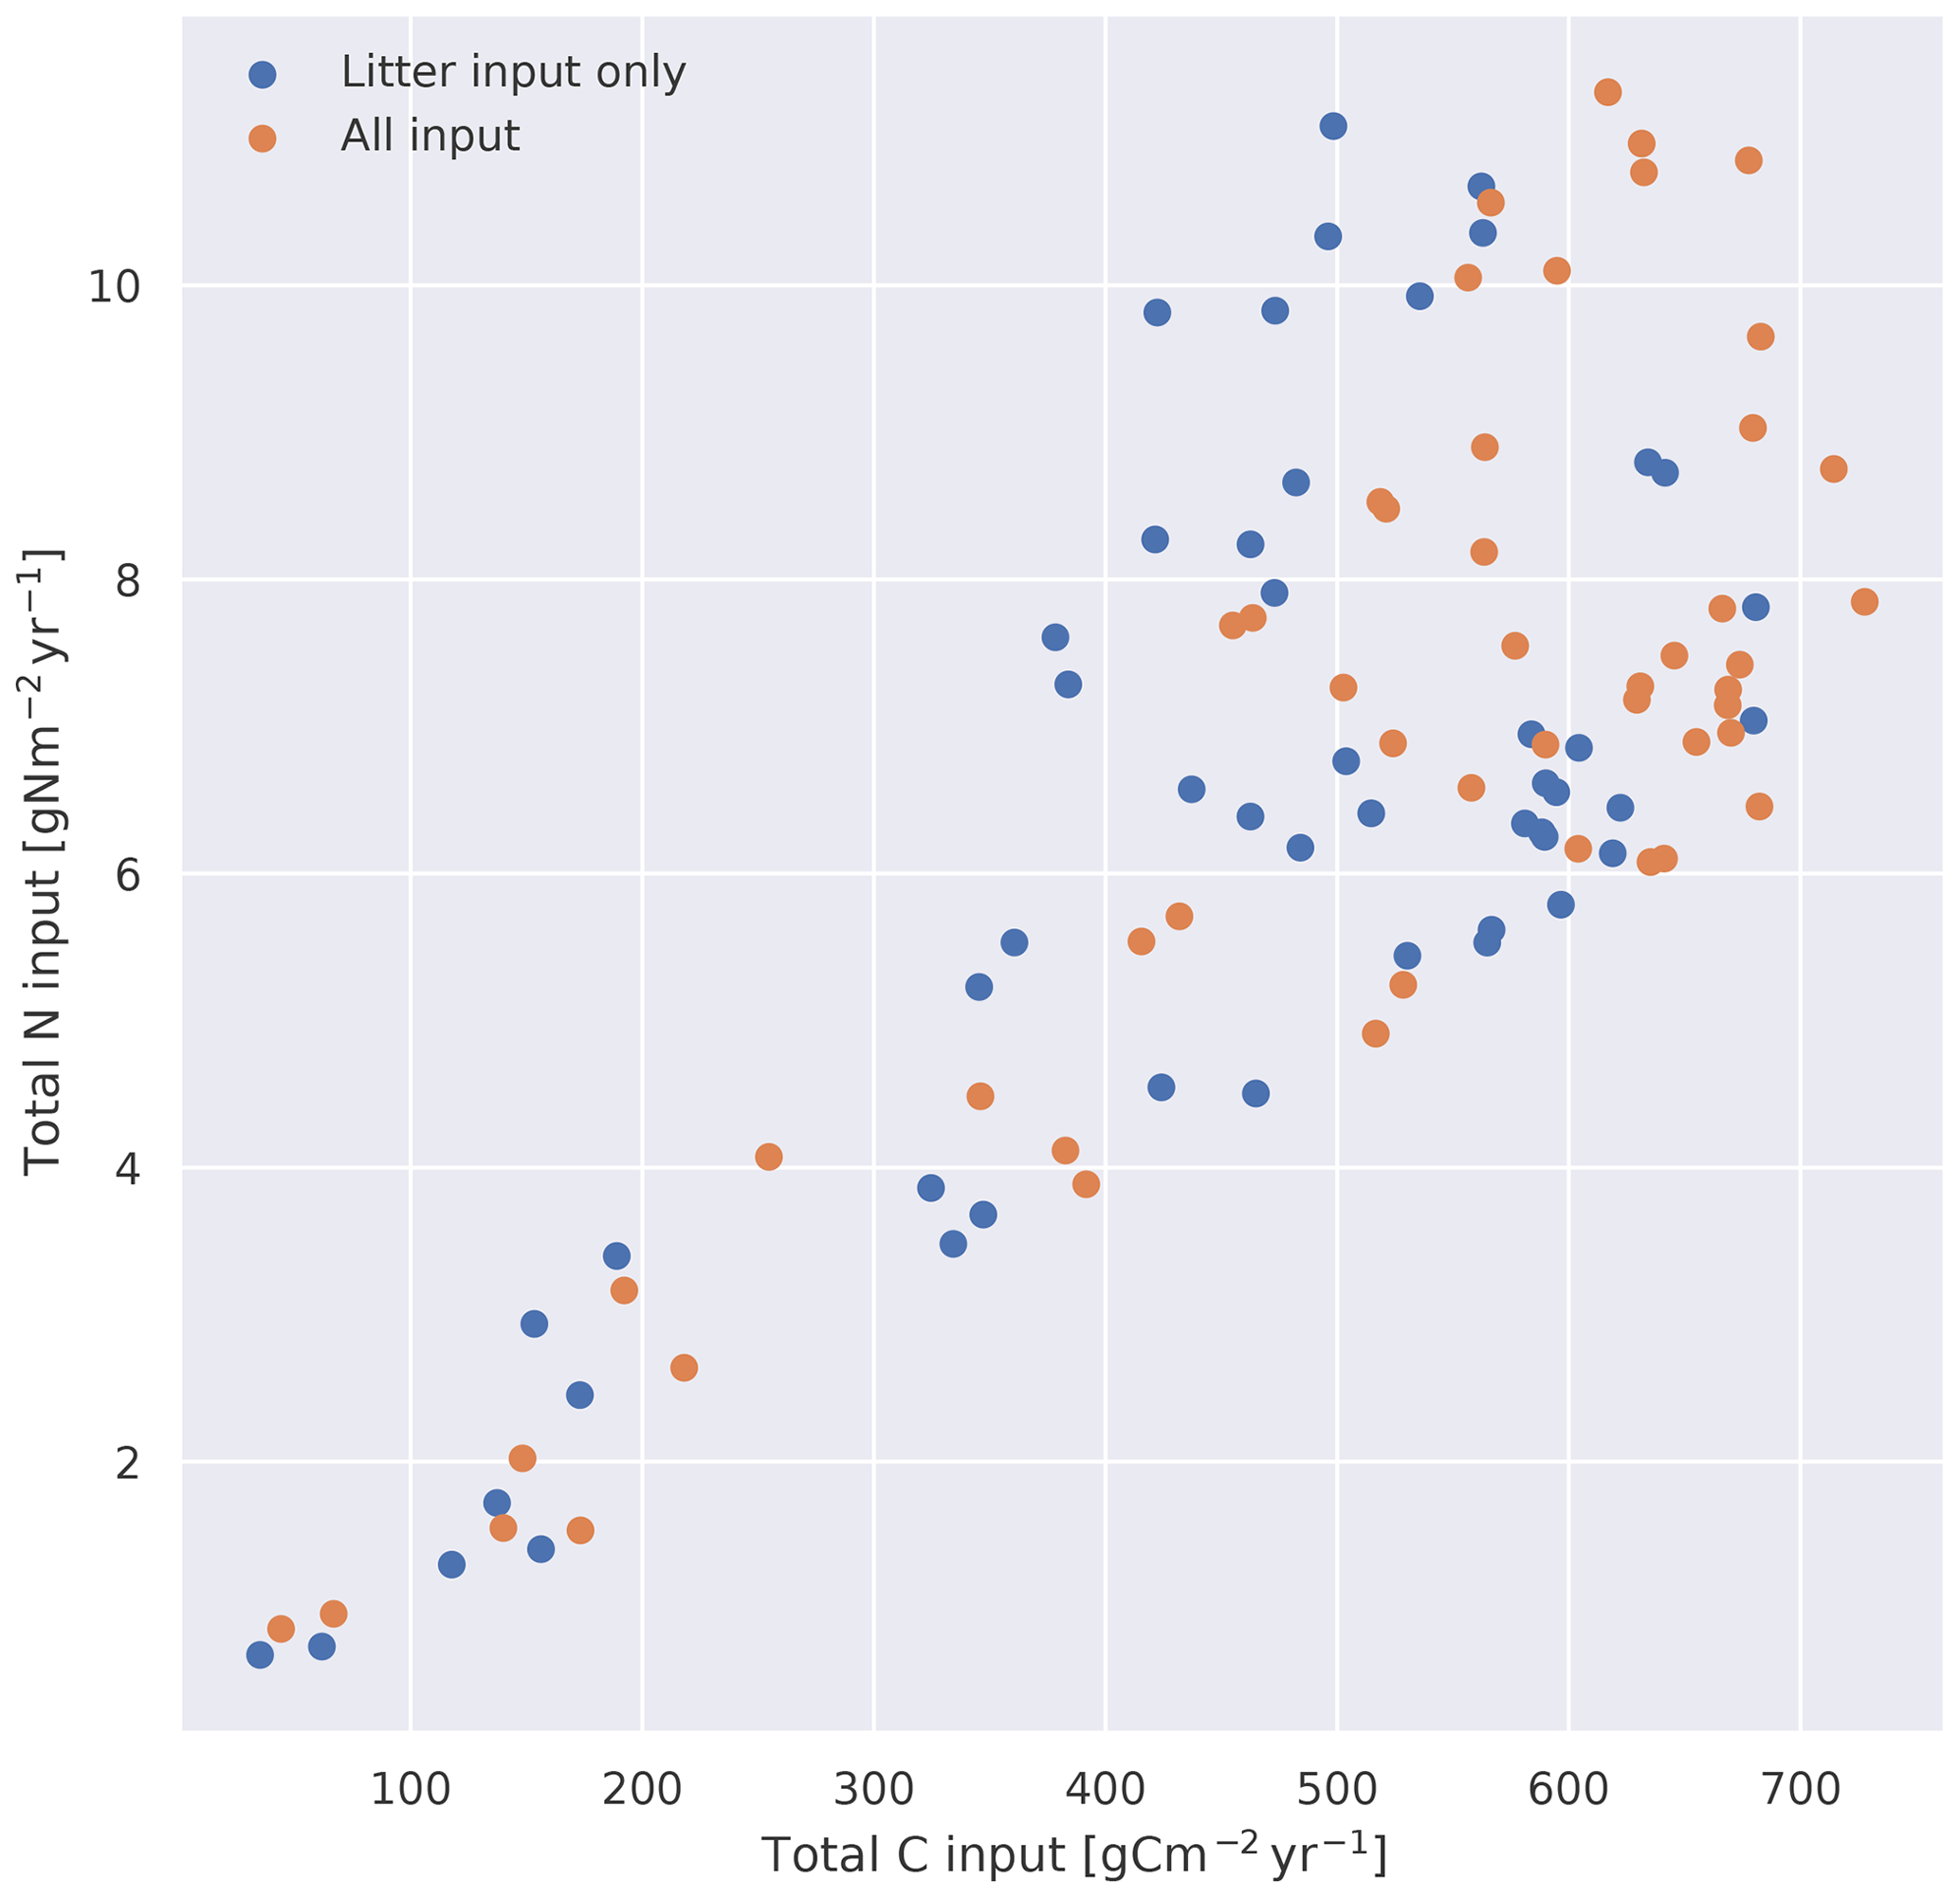
Figure C1Yearly mean input of carbon and nitrogen to MIMICS+ from CLM for each of the 50 site simulations (averaged over 1988–1992). The blue dots show litter input only, while the orange dots also include the C allocated to mycorrhizal pools and N deposition.
MIMICS+ (v1.0) is written in Fortran 90. The figures and analyses were produced with Python and Jupyter Notebook. The model code and Jupyter Notebook are available online at https://doi.org/10.5281/zenodo.10610814 (Aas and Woerner, 2024). CLM5.1 is publicly available through the Community Terrestrial System Model (CTSM) GitHub repository (https://github.com/ESCOMP/ctsm, last access: 8 April 2024). The version used for simulations in this paper is archived at https://doi.org/10.5281/zenodo.10946157 (CTSM Development Team, 2024). Input data for CLM and MIMICS+ and output files from MIMICS+ are archived at https://doi.org/10.5281/zenodo.10946217 (Aas, 2024). Access to the soil profile database can be granted upon request to the Norwegian Institute of Bioeconomy Research (NIBIO).
The supplement related to this article is available online at: https://doi.org/10.5194/gmd-17-2929-2024-supplement.
ERA and TKB developed the model. ERA ran simulations and wrote the paper. All authors contributed to the analyses and editing of the paper.
The contact author has declared that none of the authors has any competing interests.
Publisher's note: Copernicus Publications remains neutral with regard to jurisdictional claims made in the text, published maps, institutional affiliations, or any other geographical representation in this paper. While Copernicus Publications makes every effort to include appropriate place names, the final responsibility lies with the authors.
We are grateful to Line Tau Strand for providing access to and information about the soil profile database and to Alexander Eiler, Helge Hellevang, Håvard Kauserud, and Rosie Fisher for valuable feedback during the model development process. We are also grateful to Will Wieder and the other scientists at the NCAR lab for their help and discussions regarding MIMICS and CLM.
This work has been funded by the University of Oslo and the Research Council of Norway (RCN) through the EMERALD (project no. 294948), FUNDER (project no. 315249), and Green Blue (project no. 287490) research projects. The simulations were performed on resources provided by Sigma2 – the national infrastructure for high-performance computing and data storage in Norway, grant no. NN2806k/NS2806k. Heleen de Wit was supported by the Research Council of Norway (contract no. 160016; Global Change at Northern Latitudes) and the CatchCaN project (the fate and future of carbon in forests), funded by the Technology Agency of the Czech Republic (TACR; project no. TO 01000220).
This paper was edited by Sam Rabin and reviewed by two anonymous referees.
Aas, E. R.: Model inputs and outputs for “Modeling boreal forest soil dynamics with the microbially explicit soil model MIMICS+ (v1.0)”, Zenodo [data set], https://doi.org/10.5281/zenodo.10946217, 2024. a
Aas, E. R. and Woerner, E.: ecaas/MIMICSplus: MIMICSplus v1.0.1 with DOI, Zenodo [code], https://doi.org/10.5281/zenodo.10610814, 2024. a
Allison, S. D., Wallenstein, M. D., and Bradford, M. A.: Soil-carbon response to warming dependent on microbial physiology, Nat. Geosci., 3, 336–340, https://doi.org/10.1038/ngeo846, 2010. a
Angst, G., Mueller, K. E., Nierop, K. G., and Simpson, M. J.: Plant- or microbial-derived? A review on the molecular composition of stabilized soil organic matter, Soil Biol. Biochem., 156, 108189, https://doi.org/10.1016/J.SOILBIO.2021.108189, 2021. a
Arora, V. K., Katavouta, A., Williams, R. G., Jones, C. D., Brovkin, V., Friedlingstein, P., Schwinger, J., Bopp, L., Boucher, O., Cadule, P., Chamberlain, M. A., Christian, J. R., Delire, C., Fisher, R. A., Hajima, T., Ilyina, T., Joetzjer, E., Kawamiya, M., Koven, C. D., Krasting, J. P., Law, R. M., Lawrence, D. M., Lenton, A., Lindsay, K., Pongratz, J., Raddatz, T., Séférian, R., Tachiiri, K., Tjiputra, J. F., Wiltshire, A., Wu, T., and Ziehn, T.: Carbon–concentration and carbon–climate feedbacks in CMIP6 models and their comparison to CMIP5 models, Biogeosciences, 17, 4173–4222, https://doi.org/10.5194/bg-17-4173-2020, 2020. a
Bååth, E., Nilsson, L. O., Göransson, H., and Wallander, H.: Can the extent of degradation of soil fungal mycelium during soil incubation be used to estimate ectomycorrhizal biomass in soil?, Soil Biol. Biochem., 36, 2105–2109, https://doi.org/10.1016/j.soilbio.2004.06.004, 2004. a
Baskaran, P., Hyvönen, R., Berglund, S. L., Clemmensen, K. E., Ågren, G. I., Lindahl, B. D., and Manzoni, S.: Modelling the influence of ectomycorrhizal decomposition on plant nutrition and soil carbon sequestration in boreal forest ecosystems, New Phytol., 213, 1452–1465, https://doi.org/10.1111/nph.14213, 2017. a, b, c, d, e, f, g, h, i, j, k, l
Bonan, G.: Ecological climatology: concepts and applications, Cambridge University Press, https://doi.org/10.1017/cbo9781107339200.022, 2015. a
Brzostek, E. R., Dragoni, D., Brown, Z. A., and Phillips, R. P.: Mycorrhizal type determines the magnitude and direction of root-induced changes in decomposition in a temperate forest, New Phytol., 206, 1274–1282, https://doi.org/10.1111/nph.13303, 2015. a
Camino-Serrano, M., Guenet, B., Luyssaert, S., Ciais, P., Bastrikov, V., De Vos, B., Gielen, B., Gleixner, G., Jornet-Puig, A., Kaiser, K., Kothawala, D., Lauerwald, R., Peñuelas, J., Schrumpf, M., Vicca, S., Vuichard, N., Walmsley, D., and Janssens, I. A.: ORCHIDEE-SOM: modeling soil organic carbon (SOC) and dissolved organic carbon (DOC) dynamics along vertical soil profiles in Europe, Geosci. Model Dev., 11, 937–957, https://doi.org/10.5194/gmd-11-937-2018, 2018. a
Clemmensen, K. E., Bahr, A., Ovaskainen, O., Dahlberg, A., Ekblad, A., Wallander, H., Stenlid, J., Finlay, R. D., Wardle, D. A., and Lindahl, B. D.: Roots and associated fungi drive long-term carbon sequestration in boreal forest, Science, 340, 1615–1618, https://doi.org/10.1126/science.1231923, 2013. a
CTSM Development Team: ecaas/CTSM_Norway_sites: Version1 (Norway_site_runs), Zenodo [code], https://doi.org/10.5281/zenodo.10946157, 2024. a
Esser, J. M. and Nyborg, Å.: Jordsmonn i barskog : en oversikt for Norge, Norwegian Institute of Land Inventory, ISBN 82-7464-034-9, 1992. a
Fatichi, S., Manzoni, S., Or, D., and Paschalis, A.: A Mechanistic Model of Microbially Mediated Soil Biogeochemical Processes: A Reality Check, Global Biogeochem. Cy., 33, 620–648, https://doi.org/10.1029/2018GB006077, 2019. a
Fernandez, C. W. and Kennedy, P. G.: Revisiting the “Gadgil effect”: do interguild fungal interactions control carbon cycling in forest soils?, New Phytol., 209, 1382–1394, https://doi.org/10.1111/nph.13648, 2016. a
Fisher, R. A. and Koven, C. D.: Perspectives on the Future of Land Surface Models and the Challenges of Representing Complex Terrestrial Systems, J. Adv. Model. Earth Sy., 12, e2018MS001453, https://doi.org/10.1029/2018MS001453, 2020. a
Frey, S. D.: Mycorrhizal Fungi as Mediators of Soil Organic Matter Dynamics, Annu. Rev. Ecol. Evol. S., 50, 237–259, https://doi.org/10.1146/annurev-ecolsys-110617-062331, 2019. a
Friedlingstein, P., Jones, M. W., O'Sullivan, M., Andrew, R. M., Bakker, D. C. E., Hauck, J., Le Quéré, C., Peters, G. P., Peters, W., Pongratz, J., Sitch, S., Canadell, J. G., Ciais, P., Jackson, R. B., Alin, S. R., Anthoni, P., Bates, N. R., Becker, M., Bellouin, N., Bopp, L., Chau, T. T. T., Chevallier, F., Chini, L. P., Cronin, M., Currie, K. I., Decharme, B., Djeutchouang, L. M., Dou, X., Evans, W., Feely, R. A., Feng, L., Gasser, T., Gilfillan, D., Gkritzalis, T., Grassi, G., Gregor, L., Gruber, N., Gürses, Ö., Harris, I., Houghton, R. A., Hurtt, G. C., Iida, Y., Ilyina, T., Luijkx, I. T., Jain, A., Jones, S. D., Kato, E., Kennedy, D., Klein Goldewijk, K., Knauer, J., Korsbakken, J. I., Körtzinger, A., Landschützer, P., Lauvset, S. K., Lefèvre, N., Lienert, S., Liu, J., Marland, G., McGuire, P. C., Melton, J. R., Munro, D. R., Nabel, J. E. M. S., Nakaoka, S.-I., Niwa, Y., Ono, T., Pierrot, D., Poulter, B., Rehder, G., Resplandy, L., Robertson, E., Rödenbeck, C., Rosan, T. M., Schwinger, J., Schwingshackl, C., Séférian, R., Sutton, A. J., Sweeney, C., Tanhua, T., Tans, P. P., Tian, H., Tilbrook, B., Tubiello, F., van der Werf, G. R., Vuichard, N., Wada, C., Wanninkhof, R., Watson, A. J., Willis, D., Wiltshire, A. J., Yuan, W., Yue, C., Yue, X., Zaehle, S., and Zeng, J.: Global Carbon Budget 2021, Earth Syst. Sci. Data, 14, 1917–2005, https://doi.org/10.5194/essd-14-1917-2022, 2022. a
Gadgil, P. D. and Gadgil, R. L.: Suppression of litter decomposition by mycorrhizal roots of Pinus radiata, J. Genet., 5, 35–41, 1975. a
Gadgil, R. L. and Gadgil, P.: Mycorrhiza and litter decomposition, Nature, 233, 133–133, 1971. a
German, D. P., Marcelo, K. R. B., Stone, M. M., and Allison, S. D.: The Michaelis-Menten kinetics of soil extracellular enzymes in response to temperature: A cross-latitudinal study, Global Change Biol., 18, 1468–1479, https://doi.org/10.1111/j.1365-2486.2011.02615.x, 2012. a, b
Grandy, A. S. and Robertson, G. P.: Land-use intensity effects on soil organic carbon accumulation rates and mechanisms, Ecosystems, 10, 58–73, https://doi.org/10.1007/s10021-006-9010-y, 2007. a
Hanssen-Bauer, I., Førland, E. J., Haddeland, I., Hisdal, H., Mayer, S., Nesje, A., Nilsen, J., Sandven, S., Sandø, A., Sorteberg, A., and Ådlandsvik, B.: Climate in Norway 2100 – a knowledge base for climate adaptation, Tech. Rep. April, The Norwegian Environment Agency, https://www.researchgate.net/profile/Ingjerd-Haddeland/publication/316922280_Climate_in_Norway_2100/links/59194fab4585152e19a24c98/Climate-in-Norway-2100.pdf (last access: 7 April 2024), 2017. a
Hansson, A., Dargusch, P., and Shulmeister, J.: A review of modern treeline migration, the factors controlling it and the implications for carbon storage, J. Mt. Sci., 18, 291–306, https://doi.org/10.1007/S11629-020-6221-1, 2021. a
Hararuk, O., Smith, M. J., and Luo, Y.: Microbial models with data-driven parameters predict stronger soil carbon responses to climate change, Global Change Biol., 21, 2439–2453, https://doi.org/10.1111/GCB.12827, 2015. a
Hobbie, S. E., Nadelhoffer, K. J., and Högberg, P.: A synthesis: The role of nutrients as constraints on carbon balances in boreal and arctic regions, Plant Soil, 242, 163–170, https://doi.org/10.1023/A:1019670731128, 2002. a
Högberg, P., Näsholm, T., Franklin, O., and Högberg, M. N.: Tamm Review: On the nature of the nitrogen limitation to plant growth in Fennoscandian boreal forests, Forest Ecol. Manag., 403, 161–185, https://doi.org/10.1016/j.foreco.2017.04.045, 2017. a
Huang, W., Van Bodegom, P. M., Declerck, S., Heinonsalo, J., Cosme, M., Viskari, T., Liski, J., and Soudzilovskaia, N. A.: Mycelium chemistry differs markedly between ectomycorrhizal and arbuscular mycorrhizal fungi, Communications Biology, 5, 398, https://doi.org/10.1038/s42003-022-03341-9, 2022a. a, b
Huang, W., van Bodegom, P. M., Viskari, T., Liski, J., and Soudzilovskaia, N. A.: Implementation of mycorrhizal mechanisms into soil carbon model improves the prediction of long-term processes of plant litter decomposition, Biogeosciences, 19, 1469–1490, https://doi.org/10.5194/bg-19-1469-2022, 2022b. a, b
Huang, Y., Guenet, B., Ciais, P., Janssens, I. A., Soong, J. L., Wang, Y., Goll, D., Blagodatskaya, E., and Huang, Y.: ORCHIMIC (v1.0), a microbe-mediated model for soil organic matter decomposition, Geosci. Model Dev., 11, 2111–2138, https://doi.org/10.5194/gmd-11-2111-2018, 2018. a, b
Huang, Y., Guenet, B., Wang, Y. L., and Ciais, P.: Global Simulation and Evaluation of Soil Organic Matter and Microbial Carbon and Nitrogen Stocks Using the Microbial Decomposition Model ORCHIMIC v2.0, Global Biogeochem. Cy., 35, e2020GB006836, https://doi.org/10.1029/2020GB006836, 2021. a
Janssens, I. A., Dieleman, W., Luyssaert, S., Subke, J. A., Reichstein, M., Ceulemans, R., Ciais, P., Dolman, A. J., Grace, J., Matteucci, G., Papale, D., Piao, S. L., Schulze, E. D., Tang, J., and Law, B. E.: Reduction of forest soil respiration in response to nitrogen deposition, Nat. Geosci., 3, 315–322, https://doi.org/10.1038/NGEO844, 2010. a
Koven, C. D., Riley, W. J., Subin, Z. M., Tang, J. Y., Torn, M. S., Collins, W. D., Bonan, G. B., Lawrence, D. M., and Swenson, S. C.: The effect of vertically resolved soil biogeochemistry and alternate soil C and N models on C dynamics of CLM4, Biogeosciences, 10, 7109–7131, https://doi.org/10.5194/bg-10-7109-2013, 2013. a, b
Koven, C. D., Hugelius, G., Lawrence, D. M., and Wieder, W. R.: Higher climatological temperature sensitivity of soil carbon in cold than warm climates, Nat. Clim. Change, 7, 817–822, https://doi.org/10.1038/nclimate3421, 2017. a
Kyker-Snowman, E., Wieder, W. R., Frey, S. D., and Grandy, A. S.: Stoichiometrically coupled carbon and nitrogen cycling in the MIcrobial-MIneral Carbon Stabilization model version 1.0 (MIMICS-CN v1.0), Geosci. Model Dev., 13, 4413–4434, https://doi.org/10.5194/gmd-13-4413-2020, 2020. a, b, c, d
Lawrence, D. M., Fisher, R. A., Koven, C. D., Oleson, K. W., Swenson, S. C., Bonan, G., Collier, N., Ghimire, B., van Kampenhout, L., Kennedy, D., Kluzek, E., Lawrence, P. J., Li, F., Li, H., Lombardozzi, D., Riley, W. J., Sacks, W. J., Shi, M., Vertenstein, M., Wieder, W. R., Xu, C., Ali, A. A., Badger, A. M., Bisht, G., van den Broeke, M., Brunke, M. A., Burns, S. P., Buzan, J., Clark, M., Craig, A., Dahlin, K., Drewniak, B., Fisher, J. B., Flanner, M., Fox, A. M., Gentine, P., Hoffman, F., Keppel-Aleks, G., Knox, R., Kumar, S., Lenaerts, J., Leung, L. R., Lipscomb, W. H., Lu, Y., Pandey, A., Pelletier, J. D., Perket, J., Randerson, J. T., Ricciuto, D. M., Sanderson, B. M., Slater, A., Subin, Z. M., Tang, J., Thomas, R. Q., Martin, M. V., and Zeng, X.: The Community Land Model Version 5: Description of New Features, Benchmarking, and Impact of Forcing Uncertainty, J. Adv. Model. Earth Sy., 11, 4245–4287, https://doi.org/10.1029/2018MS001583, 2019. a, b, c
Lindahl, B. D. and Tunlid, A.: Ectomycorrhizal fungi – potential organic matter decomposers, yet not saprotrophs, New Phytol., 205, 1443–1447, https://doi.org/10.1111/nph.13201 2015. a
Lorenz, M.: International co-operative programme on assessment and monitoring of air pollution effects on forests -ICP forests-, Water Air Soil Poll., 85, 1221–1226, 1995. a
Mooshammer, M., Wanek, W., Hämmerle, I., Fuchslueger, L., Hofhansl, F., Knoltsch, A., Schnecker, J., Takriti, M., Watzka, M., Wild, B., Keiblinger, K. M., Zechmeister-Boltenstern, S., and Richter, A.: Adjustment of microbial nitrogen use efficiency to carbon : nitrogen imbalances regulates soil nitrogen cycling, Nat. Commun., 5, 1–7, https://doi.org/10.1038/ncomms4694, 2014a. a, b
Mooshammer, M., Wanek, W., Zechmeister-Boltenstern, S., and Richter, A.: Stoichiometric imbalances between terrestrial decomposer communities and their resources: Mechanisms and implications of microbial adaptations to their resources, Front. Microbiol., 5, 22, https://doi.org/10.3389/fmicb.2014.00022, 2014b. a, b
Mouginot, C., Kawamura, R., Matulich, K. L., Berlemont, R., Allison, S. D., Amend, A. S., and Martiny, A. C.: Elemental stoichiometry of Fungi and Bacteria strains from grassland leaf litter, Soil Biol. Biochem., 76, 278–285, https://doi.org/10.1016/j.soilbio.2014.05.011, 2014. a, b
Parton, W. J., Stewart, J. W. B., and Cole, C. V.: Dynamics of C, N, P and S in grassland soils: a model, Biogeochemistry, 5, 109–131, https://doi.org/10.1007/BF02180320, 1988. a, b
Phillips, R. P., Meier, I. C., Bernhardt, E. S., Grandy, A. S., Wickings, K., and Finzi, A. C.: Roots and fungi accelerate carbon and nitrogen cycling in forests exposed to elevated CO2, Ecol. Lett., 15, 1042–1049, https://doi.org/10.1111/j.1461-0248.2012.01827.x, 2012. a
Pierson, D., Lohse, K. A., Wieder, W. R., Patton, N. R., Facer, J., de Graaff, M.-A., Georgiou, K., Seyfried, M. S., Flerchinger, G., and Will, R.: Optimizing process-based models to predict current and future soil organic carbon stocks at high-resolution, Sci. Rep.-UK, 12, 10824, https://doi.org/10.1038/S41598-022-14224-8, 2022. a, b, c
Sieczka, A. and Koda, E.: Kinetic and equilibrium studies of sorption of ammonium in the soil-water environment in agricultural areas of central poland, Appl. Sci.-Basel, 6, 269, https://doi.org/10.3390/APP6100269, 2016. a, b, c, d, e, f, g, h, i
Soetaert, K. and Herman, P. M.: A practical guide to ecological modelling: using R as a simulation platform, Springer, https://doi.org/10.1007/978-1-4020-8624-3, 2009. a
Strand, L. T., Callesen, I., Dalsgaard, L., and de Wit, H. A.: Carbon and nitrogen stocks in Norwegian forest soils – the importance of soil formation, climate, and vegetation type for organic matter accumulation, Can. J. Forest Res., 46, 1459–1473, https://doi.org/10.1139/cjfr-2015-0467, 2016. a, b, c, d, e, f, g, h, i, j
Strickland, M. S. and Rousk, J.: Considering fungal : bacterial dominance in soils – Methods, controls, and ecosystem implications, Soil Biol. Biochem., 42, 1385–1395, https://doi.org/10.1016/j.soilbio.2010.05.007, 2010. a
Sulman, B. N., Phillips, R. P., Oishi, A. C., Shevliakova, E., and Pacala, S. W.: Microbe-driven turnover offsets mineral-mediated storage of soil carbon under elevated CO2, Nat. Clim. Change, 4, 1099–1102, https://doi.org/10.1038/nclimate2436, 2014. a, b
Sulman, B. N., Shevliakova, E., Brzostek, E. R., Kivlin, S. N., Malyshev, S., Menge, D. N., and Zhang, X.: Diverse Mycorrhizal Associations Enhance Terrestrial C Storage in a Global Model, Global Biogeochem. Cy., 33, 501–523, https://doi.org/10.1029/2018GB005973, 2019. a, b, c, d, e, f, g
Sveistrup, T. E.: Retningslinjer for beskrivelse av jordprofil, Jord og Myr, http://hdl.handle.net/11250/2489357 (last access: 5 July 2023), 1984. a
Tang, J. and Riley, W. J.: Weaker soil carbon–climate feedbacks resulting from microbial and abiotic interactions, Nat. Clim. Change, 5, 56–60, https://doi.org/10.1038/nclimate2438, 2014. a
Tao, F., Huang, Y., Hungate, B. A., Manzoni, S., Frey, S. D., Schmidt, M. W. I., Reichstein, M., Carvalhais, N., Ciais, P., Jiang, L., Lehmann, J., Wang, Y.-P., Houlton, B. Z., Ahrens, B., Viatkin, K., Vargas, R., Yigini, Y., Omuto, C., Malik, A. A., Peralta, G., Cuevas-Corona, R., Di Paolo, L. E., Luotto, I., Liao, C., Liang, Y.-S., Saynes, V. S., Huang, X., and Luo, Y.: Microbial carbon use efficiency promotes global soil carbon storage, Nature, 618, 981–985, https://doi.org/10.1038/s41586-023-06042-3, 2023. a, b, c
Taylor, M. K., Lankau, R. A., and Wurzburger, N.: Mycorrhizal associations of trees have different indirect effects on organic matter decomposition, J. Ecol., 104, 1576–1584, https://doi.org/10.1111/1365-2745.12629, 2016. a
Todd-Brown, K. E. O., Hopkins, F. M., Kivlin, S. N., Talbot, J. M., and Allison, S. D.: A framework for representing microbial decomposition in coupled climate models, Biogeochemistry, 109, 19–33, https://doi.org/10.1007/s10533-011-9635-6, 2012. a
Tonjer, L. R., Thoen, E., Morgado, L., Botnen, S., Mundra, S., Nybakken, L., Bryn, A., and Kauserud, H.: Fungal community dynamics across a forest–alpine ecotone, Mol. Ecol., 30, 4926–4938, https://doi.org/10.1111/mec.16095, 2021. a
Treseder, K. K.: Nitrogen additions and microbial biomass: a meta-analysis of ecosystem studies, Ecol. Lett., 11, 1111–1120, https://doi.org/10.1111/J.1461-0248.2008.01230.X, 2008. a, b, c, d
Wallander, H., Nilsson, L. O., Hagerberg, D., and Rosengren, U.: Direct estimates of C:N ratios of ectomycorrhizal mycelia collected from Norway spruce forest soils, Soil Biol. Biochem., 35, 997–999, https://doi.org/10.1016/S0038-0717(03)00121-4, 2003. a
Wang, G., Post, W. M., and Mayes, M. A.: Development of microbial-enzyme-mediated decomposition model parameters through steady-state and dynamic analyses, Ecol. Appl., 23, 255–272, https://doi.org/10.1890/12-0681.1, 2013. a
Wang, Y.-P., Zhang, H., Ciais, P., Goll, D., Huang, Y., Wood, J. D., Ollinger, S. V., Tang, X., and Prescher, A.-K.: Microbial Activity and Root Carbon Inputs Are More Important than Soil Carbon Diffusion in Simulating Soil Carbon Profiles, J. Geophys. Res.-Biogeo., 126, e2020JG006205, https://doi.org/10.1029/2020JG006205, 2021. a
Wardle, D. A., Bardgett, R. D., Klironomos, J. N., Setälä, H., Van Der Putten, W. H., and Wall, D. H.: Ecological linkages between aboveground and belowground biota, Science, 304, 1629–1633, https://doi.org/10.1126/science.1094875, 2004. a
Wieder, W. R., Grandy, A. S., Kallenbach, C. M., Taylor, P. G., and Bonan, G. B.: Representing life in the Earth system with soil microbial functional traits in the MIMICS model, Geosci. Model Dev., 8, 1789–1808, https://doi.org/10.5194/gmd-8-1789-2015, 2015. a, b, c, d, e, f, g, h, i, j, k, l, m, n
Wieder, W. R., Hartman, M. D., Sulman, B. N., Wang, Y.-P., Koven, C. D., and Bonan, G. B.: Carbon cycle confidence and uncertainty: Exploring variation among soil biogeochemical models, Global Change Biol., 24, 1563–1579, https://doi.org/10.1111/gcb.13979, 2017. a, b, c
Yu, L., Ahrens, B., Wutzler, T., Schrumpf, M., and Zaehle, S.: Jena Soil Model (JSM v1.0; revision 1934): a microbial soil organic carbon model integrated with nitrogen and phosphorus processes, Geosci. Model Dev., 13, 783–803, https://doi.org/10.5194/gmd-13-783-2020, 2020. a
- Abstract
- Introduction
- Model and methods
- Results
- Discussion
- Conclusions
- Appendix A: Model description details
- Appendix B: Additional figures
- Appendix C: Input plot
- Code and data availability
- Author contributions
- Competing interests
- Disclaimer
- Acknowledgements
- Financial support
- Review statement
- References
- Supplement