the Creative Commons Attribution 4.0 License.
the Creative Commons Attribution 4.0 License.
 | 05 Apr 2024
Modeling the effects of tropospheric ozone on the growth and yield of global staple crops with DSSAT v4.8.0
Jonas Jägermeyr
Elizabeth A. Ainsworth
Fabio A. A. Oliveira
Senthold Asseng
Kenneth Boote
Joshua Elliott
Lisa Emberson
Ian Foster
Gerrit Hoogenboom
David Kelly
Alex C. Ruane
Katrina Sharps
Elevated surface ozone (O3) concentrations can negatively impact growth and development of crop production by reducing photosynthesis and accelerating leaf senescence. Under unabated climate change, future global O3 concentrations are expected to increase in many regions, adding additional challenges to global agricultural production. Presently, few global process-based crop models consider the effects of O3 stress on crop growth. Here, we incorporated the effects of O3 stress on photosynthesis and leaf senescence into the Decision Support System for Agrotechnology Transfer (DSSAT) crop models for maize, rice, soybean, and wheat. The advanced models reproduced the reported yield declines from observed O3-dose field experiments and O3 exposure responses reported in the literature (O3 relative yield loss RMSE <10 % across all calibrated models). Simulated crop yields decreased as daily O3 concentrations increased above 25 ppb, with average yield losses of 0.16 % to 0.82 % (maize), 0.05 % to 0.63 % (rice), 0.36 % to 0.96 % (soybean), and 0.26 % to 1.23 % (wheat) per ppb O3 increase, depending on the cultivar O3 sensitivity. Increased water deficit stress and elevated CO2 lessen the negative impact of elevated O3 on crop yield, but potential yield gains from CO2 concentration increases may be counteracted by higher O3 concentrations in the future, a potentially important constraint to global change projections for the latest process-based crop models. The improved DSSAT models with O3 representation simulate the effects of O3 stress on crop growth and yield in interaction with other growth factors and can be run in the parallel DSSAT global gridded modeling framework for future studies on O3 impacts under climate change and air pollution scenarios across agroecosystems globally.
- Article
(1954 KB) - Full-text XML
-
Supplement
(1300 KB) - BibTeX
- EndNote


-
Effects of O3 stress on photosynthesis and leaf senescence were added to the DSSAT/pDSSAT maize, rice, soybean, and wheat crop models.
-
The modified models reproduced growth and yields under different O3 levels observed in field experiments and reported in the literature.
-
Expected detrimental interactions between O3, CO2, and water deficit were reproduced with the new models.
-
The updated crop models can be used to simulate impacts of O3 stress under future climate change and air pollution scenarios.
Surface or ground-level, ozone (O3) is a major air pollutant that causes adverse impacts on agricultural productivity worldwide (Mills et al., 2018a; Emberson et al., 2018; Tai et al., 2021). O3 is formed through photochemical reactions between incoming solar radiation and primary pollutants such as nitrogen oxides (NOx= NO + NO2), volatile organic compounds (VOCs), carbon monoxide (CO), or methane (CH4) across all areas of the globe (Cooper et al., 2014; Simpson et al., 2014). Global O3 concentrations have increased 2 %–7 % per decade in northern mid-latitude regions and 2 %–12 % per decade in tropical regions since the mid-1990s (IPCC, 2021; Arias et al., 2021). Future O3 concentrations are projected to continue increasing if O3 precursor emissions are not mitigated, i.e., following the shared socio-economic pathways where regional rivalry leads to doubling of CO2 emissions by 2100 (SSP3-7.0) or where fossil-fuel-enabled growth leads to doubling of CO2 emissions by 2050 (SSP5-8.5) (IPCC, 2021; Arias et al., 2021; Szopa et al., 2021; Griffiths et al., 2021).
Crops exposed to elevated levels of O3 concentrations can experience reduced photosynthesis, accelerated senescence, foliar chlorosis, and even necrosis from increased cumulative oxidative stress (Ainsworth, 2017). These negative effects lead to decreased productivity resulting in global yield losses between 2 %–16 % for the four main staple crops, maize, rice, soybean, and wheat (Ainsworth, 2017; Schiferl and Heald, 2018; Emberson, 2020), with global annual economic damages of approximately USD 34 billion (Sampedro et al., 2020; Feng et al., 2022). Climate change may exacerbate the negative effects from elevated O3 concentrations because O3 concentrations are highest in summer months, and the projected higher temperatures with more frequent heat waves may lead to a longer period of more active photochemical reactions (Zhang and Wang, 2016; Hou and Wu, 2016; Szopa et al., 2021). Elevated concentrations of atmospheric CO2 and increased periods of water deficit stress cause stomatal closure that can reduce crop O3 uptake (Khan and Soja, 2003; Biswas et al., 2013), but in turn potential yield gains associated with the CO2 fertilization effect (Toreti et al., 2020; Jagermeyr et al., 2021) may be constrained by elevated O3. Therefore, it is important to evaluate net O3 effects for crop growth and consider the effects of O3 in global agricultural assessments examining future scenarios.
Process-based crop simulation models have been used to evaluate the impacts of O3 on crop yields (Guarin et al., 2019; Tai et al., 2021), but most global gridded process-based crop models are still unable to respond to O3 stress. Recently, the global Lund–Potsdam–Jena managed Land (LPJmL) and Joint UK Land Environment Simulator (JULES) models were modified to include the effects of O3 stress on soybean and wheat growth (Schauberger et al., 2019; Leung et al., 2020). Additionally, the Agricultural Model Intercomparison and Improvement Project (AgMIP; Rosenzweig et al., 2013) ozone team has recently developed protocols for incorporating O3 stress into a wider body of crop models aiming to establish the first multi-model assessment of ozone impacts on agriculture at a global level (Emberson et al., 2018).
The aim of this study is to incorporate the effects of O3 concentrations into the stress response functions of the maize, rice, soybean, and wheat models within the established Decision Support System for Agrotechnology Transfer (DSSAT) v4.8.0 modeling platform (Jones et al., 2003; Hoogenboom et al., 2019, 2021), and consequently the parallel DSSAT (pDSSAT) v4.8.0 global gridded modeling platform that is used to run DSSAT in a global setup (Elliott et al., 2014), to simulate O3 effects on global crop development and yield for the four major staple crops. The observational data from the free-air CO2 enrichment (FACE) field experiments conducted in Champaign, Illinois, USA (Choquette et al., 2020; Betzelberger et al., 2012), and well-known O3 exposure relationships reported in the literature are used to develop and calibrate the model O3 response functions. Additionally, the observed interactions between O3, CO2, and water deficit stress are examined via sensitivity analyses conducted with the modified models.
2.1 Description of crop models
The crop models within the pDSSAT parallel modeling environment are based on the existing crop models within the widely used DSSAT crop modeling platform (Jones et al., 2003; Hoogenboom et al., 2019, 2021) combined with the Center for Robust Decision-making on Climate and Energy Policy (RDCEP) parallel System for Integrating Impact Models and Sectors (pSIMS) framework (Elliott et al., 2014) to allow for global gridded process-based crop modeling on high-performance computational systems. The O3 stress routines presented here are also applied in the standard DSSAT crop models and can be used for field-level simulations and point-based testing in addition to the global-level modeling applications.
The four DSSAT crop models used in this study are the Crop Environment Resource Synthesis (CERES) -Maize, CERES-Rice, Crop Growth Simulation (CROPGRO) -Soybean, and Nitrogen Wheat (NWheat) models that have been used in previous AgMIP crop model intercomparisons (Bassu et al., 2014; Li et al., 2015; Asseng et al., 2015; Kothari et al., 2022). The CERES-Maize and CERES-Rice models were previously used to estimate global ozone crop losses (Schiferl and Heald, 2018); however, their approach was based on the multiplication of the simulated global base production by the relative yield–O3 response functions to determine a response proxy. The approach used in this present study integrates daily process-based stress calculations to simulate daily crop growth and stress dynamics. Thus, the models are more applicable to a much broader range of scenarios given that they can combine daily stress interactions and can be used to scale across agroecosystems in a more robust way.
2.2 O3 incorporation into the crop models
The incorporation of O3 effects into the DSSAT crop models followed the same methodology as the O3 incorporation into the DSSAT-NWheat crop model (Guarin et al., 2019), which was based on the incorporation of previous abiotic stress routines (Asseng et al., 2004). O3 response was added to the models via the inclusion of daily photosynthesis reduction and leaf senescence acceleration functions. Additionally, the interaction between O3 and water deficit stress and/or atmospheric CO2 concentrations was incorporated into the models since these combined interactions can mitigate impacts from O3 on crop production and vice versa. For example, water deficit stress that induces stomatal closure in turn limits O3 stress because of reduced aerosol uptake (Khan and Soja, 2003; Biswas et al., 2013).
2.2.1 CERES-Maize and CERES-Rice models
The effects of O3 were incorporated into the CERES-Maize and CERES-Rice models using similar methodology since these two models share similar code. O3 was added into the models using a photosynthesis reduction stress factor (FO3) following Eq. (1):
where OZON7 is the daily mean 7 h (M7, 09:00–15:59) O3 concentration (ppb) and FOZ1 is the O3 stress parameter for photosynthesis calibrated for different O3 sensitivities of cultivars divided by a decimal correction factor of 100. The decimal correction factor ensures that the FOZ1 parameter value ranges between 0.0 and 1.0 in the model ecotype parameter file for comprehensible user input. A minimum M7 O3 threshold of 25 ppb was set as the reference value based on pre-industrial O3 concentrations and the United States National Crop Loss Assessment Network (NCLAN) studies indicating that O3 damage within crops occurs above this threshold (Heck et al., 1984; Lesser et al., 1990; Feng and Kobayashi, 2009). When the daily M7 O3 concentration exceeds this threshold, photosynthesis is reduced by a factor between 0.0 and 1.0 (Eq. 1), and leaf senescence is accelerated by a factor between 0.0 and 1.0 (Eq. 5). The M7 O3 metric was chosen as the model input because it is the most readily available metric in the literature, and conversion functions exist to convert between M7 and AOT40, daily mean 12 h (M12), or daily mean 24 h (M24) O3 metrics (Osborne et al., 2016).
Equation (1) does not include the interaction of O3 stress with water deficit stress or elevated atmospheric CO2. To consider these combined interactions on crop growth (PRFO3), FO3 was modified using Eq. (2):
where PCO2 is the atmospheric CO2 effect on potential daily dry matter production and SWFAC is the water stress factor on photosynthesis (Jones and Kiniry, 1986; Ritchie et al., 1987; Jones et al., 2003). Since PCO2 is always greater than 1, multiplying by the CO2 effect mitigates the reduction caused by FO3. Because SWFAC is a reduction factor between 0 and 1, dividing by this factor decreases the reduction from FO3 under increased water deficit stress conditions.
The simulated daily biomass production (CARBO, g plant−1 d−1) within the models was calculated based on the existing photosynthesis stress factors with the addition of PRFO3 using Eq. (3) for maize and Eq. (4) for rice:
where PCARB is daily potential dry matter production of the crop accounting for light interception, radiation use efficiency, and the CO2 effect on photosynthesis (g plant−1); PRFT, SWFAC, NSTRES, TSHOCK (CERES-Rice only), PSTRES1, KSTRES, and PRFO3 are the temperature, soil water, nitrogen, transplanting shock, phosphorous, potassium, and O3 stress factors on photosynthesis, respectively; and SLPF is the soil fertility factor (Jones and Kiniry, 1986; Ritchie et al., 1987; Jones et al., 2003).
Leaf senescence acceleration due to O3 stress (SLFO3) was added to the models using Eq. (5):
where SFOZ1 is the O3 stress parameter for leaf senescence calibrated for different O3 sensitivities of cultivars divided by a decimal correction factor of 1000 (to ensure the SFOZ1 parameter value ranges between 0.0 and 1.0 in the model ecotype file). The SLFO3 factor was then included in the existing daily rate of leaf area senescence function (PLAS, cm2 d−1) within the models as shown in Eq. (6) for maize and Eq. (7) for rice:
where PLA is daily plant leaf area (cm2 plant−1); SENLA is daily normal leaf senescence (cm2 plant−1); and SLFW, SLFC, SLFT, SLFN, SLFP, SLFK, and SLFO3 are the leaf senescence stress factors due to water, light competition, temperature, nitrogen, phosphorous, potassium (CERES-Rice only), and O3 stress, respectively (Jones and Kiniry, 1986; Ritchie et al., 1987; Jones et al., 2003).
2.2.2 CROPGRO-Soybean model
The effects of O3 were incorporated into the CROPGRO-Soybean model using a similar approach to that described in the CERES crop models. O3 was added into the model using the same FO3 and PRFO3 factors as in Eqs. (1) and (2) (for Eq. 2, PCO2 is called PRATIO in CROPGRO-Soybean). However, CROPGRO-Soybean calculates daily photosynthesis differently than the other models do and has two different photosynthesis calculation options: leaf or canopy photosynthesis (Wilkerson et al., 1983; Boote and Pickering, 1994; Jones et al., 2003). This study focuses on the default leaf photosynthesis calculation option (which was modified to read in the CO2 ratio effect for the PRFO3 interaction). The daily gross photosynthesis (PG, g [CH2O] m−2 d−1) within the model was calculated based on the limiting photosynthesis stress factors using Eq. (8) for leaf photosynthesis and Eq. (9) for canopy photosynthesis:
where PGDAY is daily potential photosynthesis (g [CH2O] m−2 d−1) and SWFAC, PSTRES1, and PRFO3 are the soil water, phosphorous, and O3 stress factors on photosynthesis, respectively. PTSMAX is the potential amount of CH2O that can be produced for the full canopy (g [CH2O] m−2 d−1), PGFAC is a factor to compute daily PG as a function of leaf area index, TPGFAC is a reduction factor due to less-than-optimal daytime temperature, EFAC is the effect of nitrogen and phosphorous stress on daily canopy photosynthesis, PGSLW is the relative effect of leaf thickness on daily canopy photosynthesis, and PRATIO is the relative effect of atmospheric CO2 on daily canopy photosynthesis (Boote and Pickering, 1994).
Leaf senescence acceleration due to O3 stress (SLFO3) was added to CROPGRO-Soybean using Eq. (10):
where WTLF is the dry mass of leaf tissue (gleaf m−2). The CROPGRO leaf senescence routine is based on existing WTLF using a different approach than the CERES leaf senescence reduction factor, so SLFO3 has the opposite trend when compared to the CERES model calculation (Fig. 1). The SLFO3 factor was then included in the existing daily defoliation due to daily leaf senescence (SLDOT, g m−2 d−1) calculation within the model as shown in Eq. (11):
where SLDOTn is the natural daily leaf senescence and SLNDOT and SLFO3 are the daily leaf senescence due to water and O3 stress (g m−2 d−1), respectively.
2.2.3 DSSAT-NWheat model
The incorporation of O3 into the NWheat crop model was described and validated in Guarin et al. (2019) and was used as the reference for the maize, rice, and soybean models. The approach used the same FO3 and PRFO3 equations as in Eqs. (1) and (2) (note that the NWheat equations were simplified from Guarin et al. (2019) by the decimal correction factor and single FOZ1 parameter as in Eq. (1) for consistency among all models) and a similar SLFO3 shown in Eq. (12):
The O3 effect for the different cultivar sensitivities is controlled by the FOZ1 and SFOZ1 parameters, as in the other models (the SFOZ1 parameter is divided by 10 to ensure that the value ranges between 0.0 and 1.0 in the model ecotype file). The decimal correction factors vary between the crop models because the different models calculate stresses using different magnitudes.
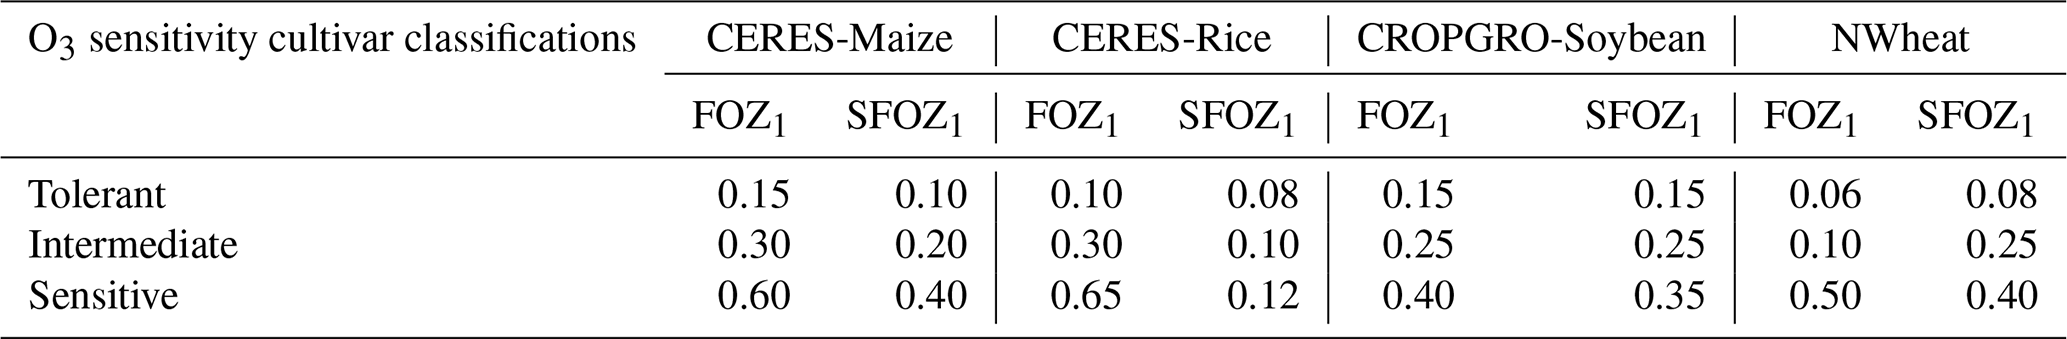
The FO3 and SLFO3 responses calculated over increasing M7 O3 concentrations are illustrated for each model in Fig. 1 using the parameter values for different O3 cultivar classifications shown in Table 1. The FOZ1 and SFOZ1 parameter values for all models were determined from the cultivar sensitivities observed in the field experiments (Sect. 2.3) and the sensitivities derived from the O3 exposure relationships from the literature (Sect. 2.5).
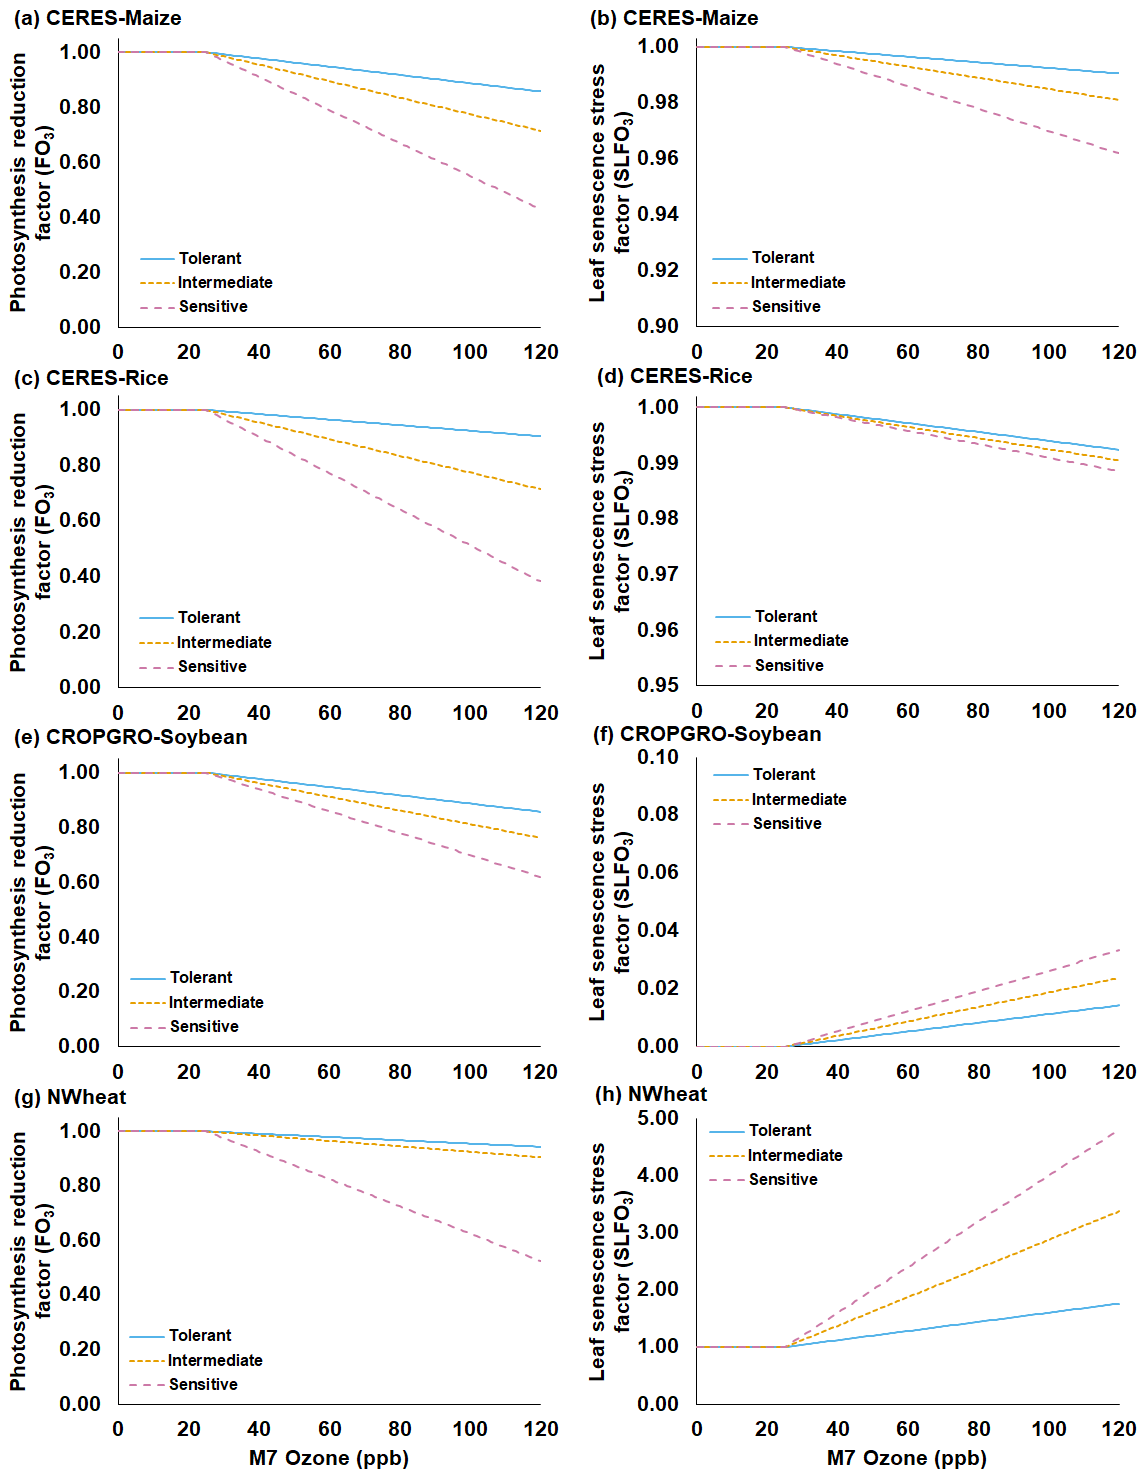
Figure 1Functions for the O3 photosynthesis reduction factor without interaction of water deficit stress and CO2 fertilization effect (FO3) (first column) and the O3 leaf senescence acceleration stress factor (SLFO3) (second column) under increasing mean 7 h (M7) O3 concentrations for the (a, b) CERES-Maize, (c, d) CERES-Rice, (e, f) CROPGRO-Soybean, and (g, h) NWheat models. Each figure shows three different O3 sensitivity cultivar classifications derived from the O3 exposure–yield responses from the literature: tolerant (solid blue line), intermediate (gold short-dashed line), and sensitive (magenta long-dashed line). SLFO3 for CROPGRO-Soybean (Eq. 10) is shown with leaf tissue dry mass (WTLF) of 1 g m−2 for simplicity. Steeper slopes indicate a higher sensitivity to O3 for both FO3 and SLFO3. Table 1 shows the parameters used in the equations for each classification of O3 sensitivity (Eqs. 1, 5, 10, and 12).
Table 1Summary of the O3 photosynthesis stress parameters (FOZ1) and the O3 leaf senescence stress parameters (SFOZ1) used in the FO3 and SLFO3 calculations (Eqs. 1, 5, 10, and 12) for the four DSSAT models under three different O3 sensitivity cultivar classifications. The CERES and CROPGRO parameter values were determined from the O3 exposure–yield responses in the literature (Figs. S2 and S3 in the Supplement). NWheat parameter values were from Guarin et al. (2019) and confirmed with the literature.
2.3 Observed O3 exposure field experiments
In general, detailed field experiments of crop growth under elevated O3 conditions for different crops are scarce and limit the granularity of model calibration. All field experiments examined in this study used dominant management conditions to limit other stresses besides O3, e.g., water deficit or N stress, so the simulations assumed negligible outside stresses. For each crop, the DSSAT phenological and growth parameters were calibrated based on the observed control treatment with minimal O3 stress to ensure that the models were functioning properly regardless of O3 impact. Then, the O3 response parameters, FOZ1 and SFOZ1, were calibrated based on the observed O3 exposure–yield response between the elevated O3 treatments and the control to simulate the O3 effect.
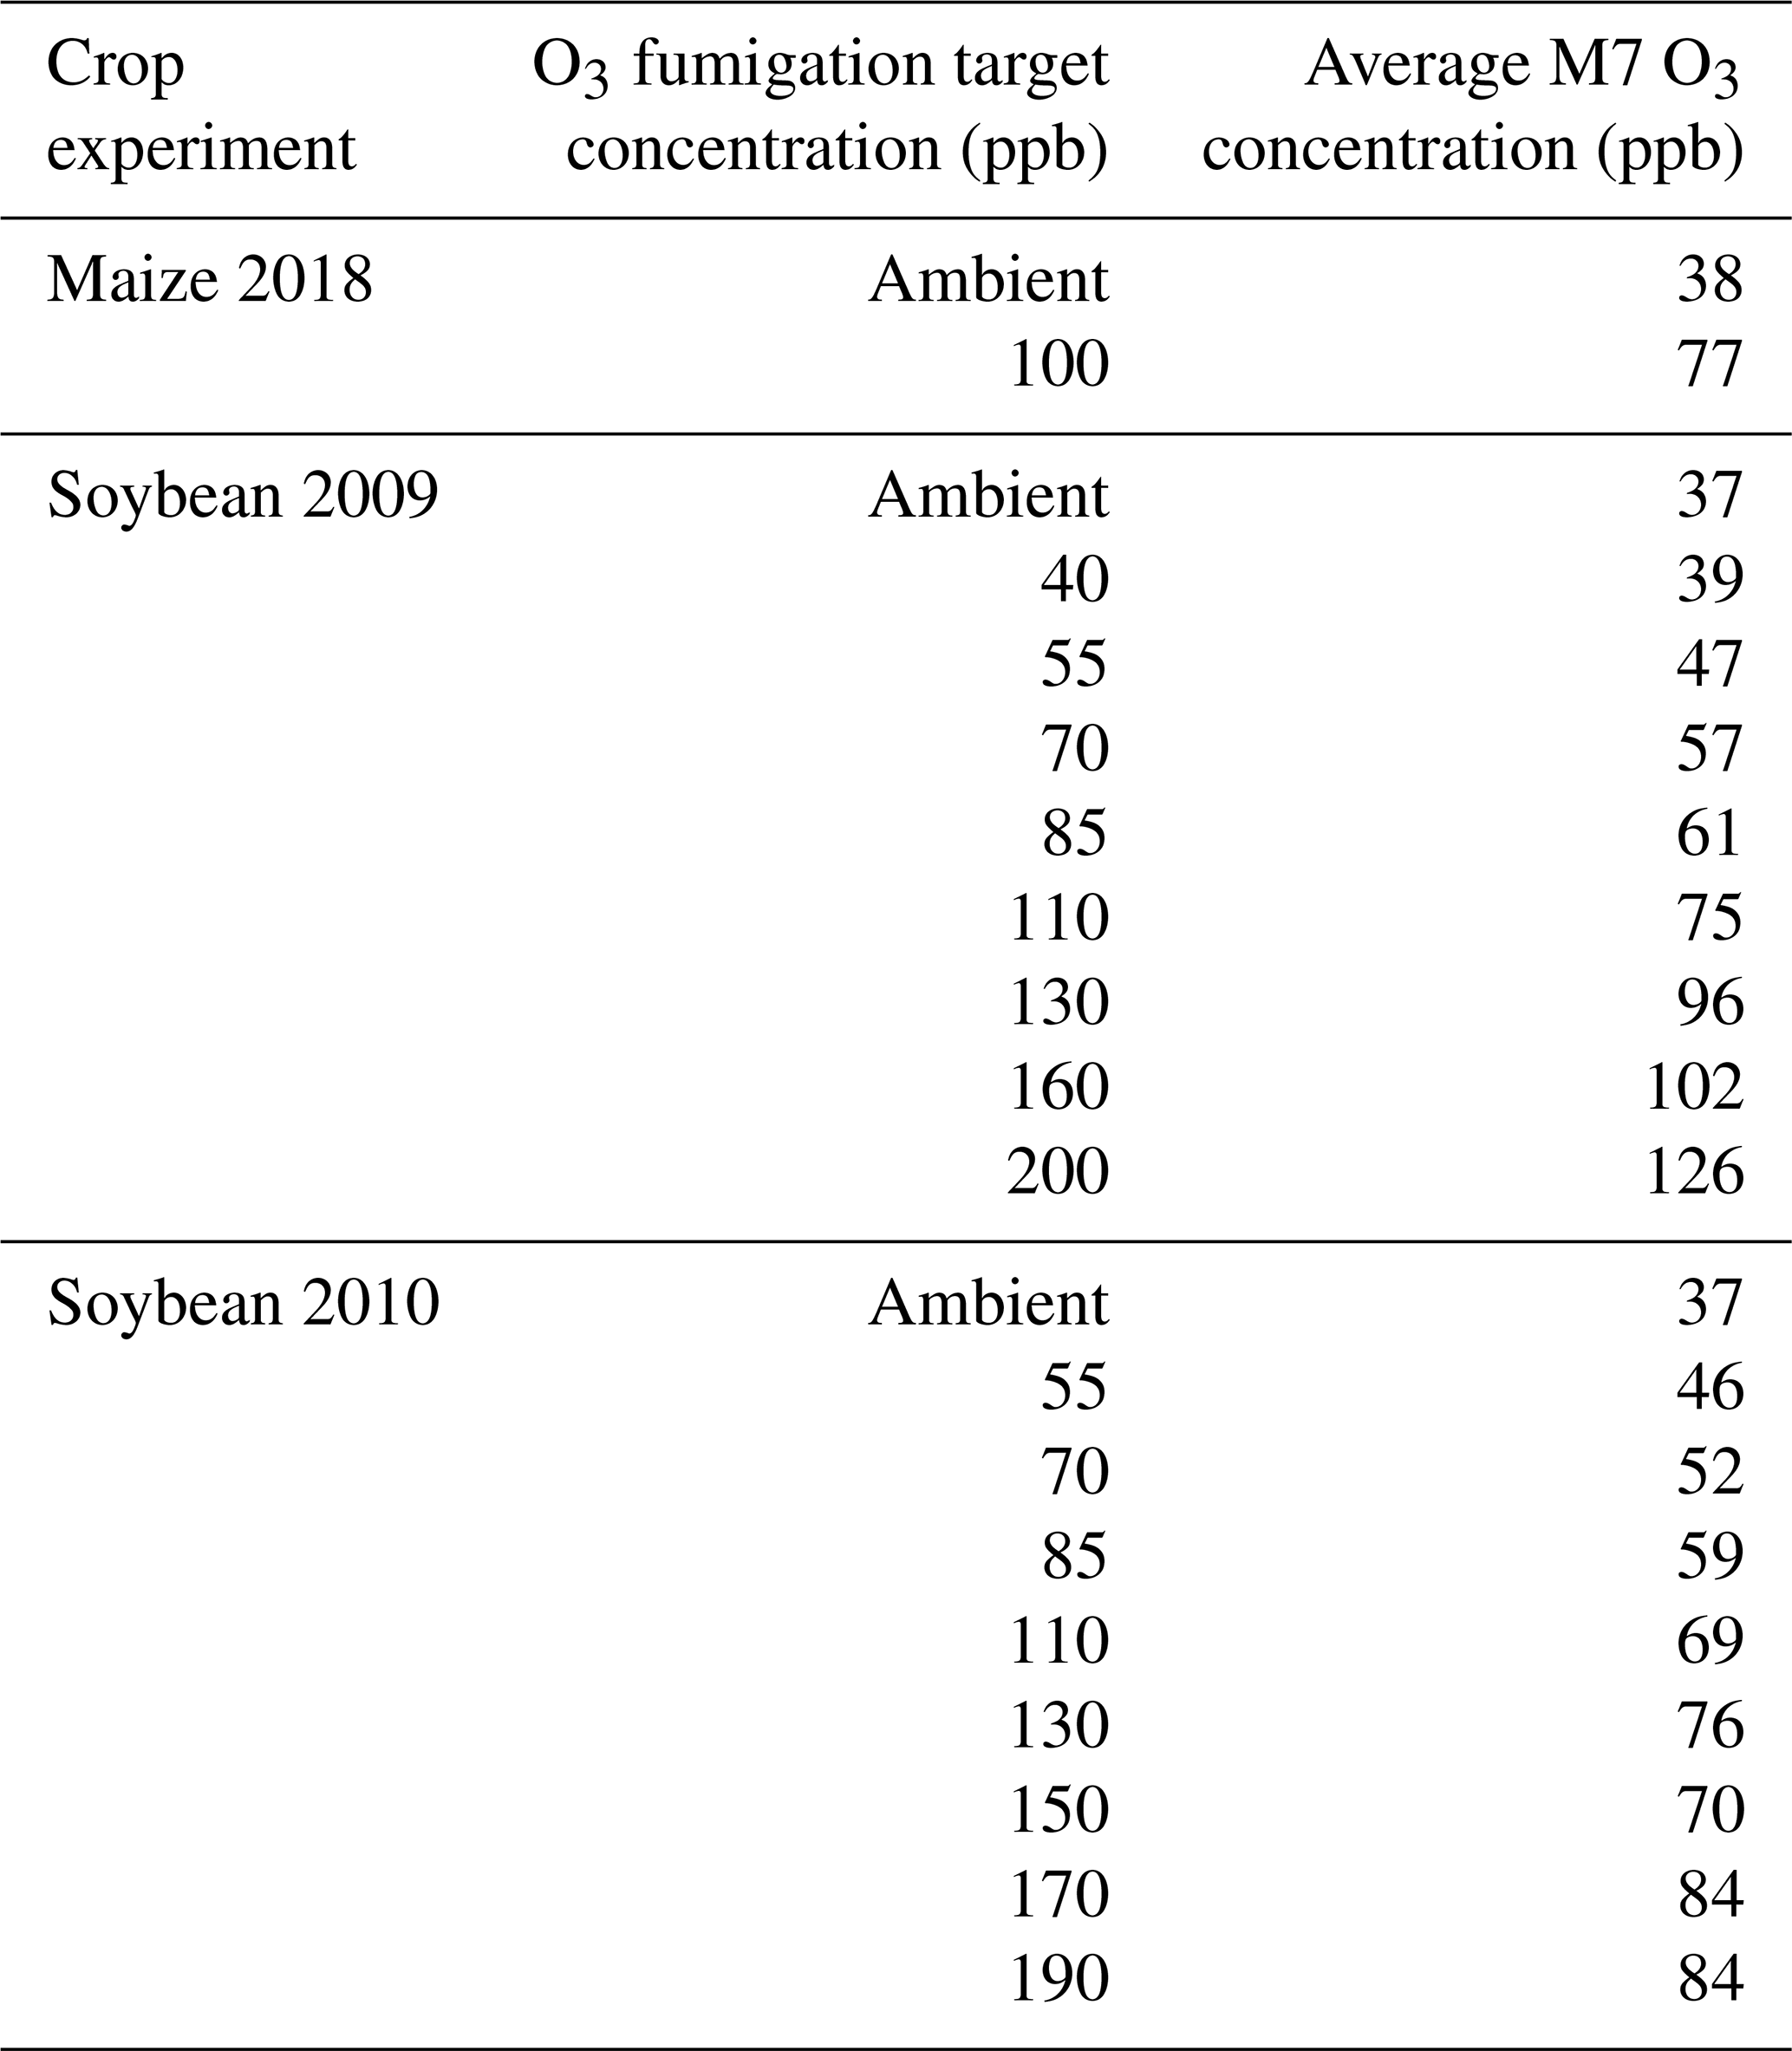
For maize, the FACE experiment conducted at Champaign, Illinois, USA (40.03° N, 88.27° W; 230 m elevation), in 2018 was used for calibrating the CERES-Maize model (Choquette et al., 2020). The maize FACE experiment consisted of six cultivars grown under an ambient and an elevated O3 treatment with n=4 (Table 2). Since there was only 1 year of data, the model was validated against the O3 exposure-relative yield response functions from the literature (Sect. 2.5). The daily maximum temperature (TMAX), minimum temperature (TMIN), and precipitation (RAIN) weather data were collected from the nearby National Oceanic and Atmospheric Administration (NOAA) Willard Airport weather station, and the daily incoming solar radiation (SRAD) was collected from the National Aeronautics and Space Administration (NASA) Prediction Of Worldwide Energy Resources (POWER) database (https://power.larc.nasa.gov/, last access: 14 September 2022). The soil consisted of the Drummer silty clay loam soil series, and the soil parameters for this series were obtained from the United States Department of Agriculture (USDA) Natural Resources Conservation Service (NRCS) Web Soil Survey database (Table S1 in the Supplement) (NRCS, 2023). The cultivars were planted in two 3.5 m rows with a row spacing of 0.76 m on 13 May 2018 (Choquette et al., 2020). The hourly O3 fumigation (from 10:00 to 18:00) began on 25 May 2018 and ended on 14 August 2018 and was used to calculate the daily M7 O3 concentrations. The cultivar plots were harvested at maturity on 21 September 2018. N and water deficit stress were reported to be non-limiting, so the simulations used the non-limiting N setting within the model, and the simulated water stress was confirmed to be non-limiting with the provided rainfall. The DSSAT cultivar parameters were calibrated for phenology and growth under negligible stress conditions using the treatment with the ambient O3 concentration (38 ppb) for each cultivar. After the phenology and growth cultivar parameters were calibrated, the FOZ1 and SFOZ1 O3 response parameters were calibrated using the yield response from the elevated O3 concentration treatments (Fig. S1a).
For soybean, data from the FACE experiment conducted at the same location in Champaign, Illinois, USA (40.03° N, 88.27° W; 230 m elevation), in 2009 and 2010 were used for model testing (Betzelberger et al., 2012). The 2009 data were used for model calibration, and the 2010 data were used for model validation. These data were previously used to incorporate O3 effects on leaf photosynthesis into the JULES model (Leung et al., 2020). The SoyFACE experiment consisted of seven soybean cultivars grown under nine O3 treatments with different target concentrations (Table 2). The hourly O3 fumigation data (plots fumigated for 8 to 9 h daily except when leaves were wet) for each treatment were recorded in situ and were used to calculate the daily M7 O3 concentrations (Betzelberger et al., 2012). The weather data were collected from the same sources as used in the maize experiment (NOAA and NASA POWER), and the soil consisted of either the Drummer silty clay loam or the Flanagan silt loam series which were obtained from the USDA NRCS Web Soil Survey database (Table S1). The initial soil conditions of the simulations were set at 95 % available water content and 100 kg N ha−1 to minimize water and N stress. The cultivars were planted in plots eight rows wide and 5.4 m long, with a row spacing of 0.38 m, on 9 June 2009 and 27 May 2010. The O3 fumigation started on 29 June 2009 and 6 June 2010 and ended on 27 September 2009 and 17 September 2010. The cultivar plots were harvested at maturity on 20 October 2009 and 30 September 2010. For each specified cultivar maturity group (Betzelberger et al., 2012), the corresponding default DSSAT maturity group parameters were used as reference and then calibrated for phenology and growth under negligible stress using the treatment with the ambient O3 concentration (37 ppb). After the phenology and growth cultivar parameters were calibrated, the FOZ1 and SFOZ1 O3 response parameters were calibrated using the yield response from the elevated O3 concentration treatments (Fig. S1b). The parameters for both maize and soybean were calibrated using the using the one-factor-at-at-time method (Morris, 1991) until the best fit was found for the phenology, aboveground biomass and yield, and relative yield loss for each cultivar across all O3 treatments.
Table 2O3 fumigation target concentration and average mean 7 h (M7, 09:00–15:59) O3 concentrations for the 2018 maize FACE experiment (Choquette et al., 2020) and the 2009 and 2010 soybean SoyFACE experiments (Betzelberger et al., 2012).
For rice, there were no O3 field experiment data readily available; thus a representative rice-producing location in the main North American rice-producing area in Stuttgart, Arkansas, USA (34.50° N, 91.55° W; 60 m elevation) (USDA NASS, 2010), was simulated with the default DSSAT North American rice cultivar. The year 2009 was selected for consistency with the soybean simulations. The weather data were collected from the NASA POWER database, and the dominant soil series for Arkansas County, Dewitt silt loam, was determined from the USDA NRCS Web Soil Survey database (Table S1) (NRCS, 2023). The initial soil conditions of the simulations were set at 100 % available water content and 100 kg N ha−1 to ensure negligible water and N stress. A total of four 50 kg N ha−1 fertilizer applications were applied throughout the season to ensure negligible N stress in the simulations. The cultivar was planted on 20 April 2009 based on the most active planting dates recorded for Arkansas in the USDA Field Crops handbook (USDA NASS, 2010), and the harvest date was automatically calculated based on when the model simulations reached physiological maturity. The default DSSAT North American rice cultivar parameters were used, and the FOZ1 and SFOZ1 O3 response parameters were calibrated using the yield response from the elevated O3 exposure functions from the literature (Sect. 2.5).
For wheat, the NWheat model was calibrated and validated using an air exclusion system O3 exposure wheat field experiment conducted in Wake County, North Carolina, USA (35.73° N, 78.68° W; 116 m elevation), and is described in detail in Guarin et al. (2019).
2.4 Sensitivity analysis of O3 equations and parameters
A sensitivity analysis for maize, rice, and soybean was conducted using simulations of nine constant daily M7 O3 concentrations of 25, 40, 50, 60, 70, 80, 90, 100, and 120 ppb with different FOZ1 and SFOZ1 parameter values under combinations between normal or 50 % reduced rainfall and 350 or 550 ppm CO2 concentrations to confirm that the O3 modifications and stress interactions within the models were behaving as expected. The simulated locations and management setup for each crop were the same as the field experiments described above (Sect. 2.3). For wheat, the sensitivity analysis was based on the 1993 FACE experiment conducted in Maricopa, Arizona (33.06° N, 111.98° W; 361 m elevation) (Hunsaker et al., 1996; Kimball et al., 1999, 2017). The simulation setup for the Maricopa FACE experiment used the same 9 M7 O3 concentrations with either a “Wet” irrigation schedule (total of 629 mm sub-surface drip irrigation at 0.23 m from planting to harvest) or a “Dry” irrigation schedule (total of 347 mm sub-surface drip irrigation at 0.23 m from planting to harvest) under 350 and 550 ppm CO2 concentrations to examine the O3–CO2–water interactions as detailed in Guarin et al. (2019). For all crops, each O3 parameter was first tested independently to examine the individual effects on photosynthesis and leaf senescence; i.e., when examining FOZ1, SFOZ1 was set to zero and vice versa.
2.5 Observed O3 exposure relationships based on the literature
To confirm that the models were able to reproduce the observed relative yield loss due to O3 stress, the simulated results were compared to well-known literature reports of O3 exposure metrics and yield response for each crop using the M7 O3 concentrations. The simulated locations and management conditions were the same experimental conditions as described above for each crop. For each crop, different O3 classifications of cultivar sensitivities were defined based on more severe response to O3 stress, i.e., tolerant, intermediate, and sensitive. These classifications of cultivar O3 sensitivity were determined using the extensive literature review data from Mills et al. (2018b) combined with the maize and soybean FACE data for a total of 9 maize cultivars, 50 rice cultivars, 49 soybean cultivars, and 23 wheat cultivars. The literature review consisted of O3 exposure experiments conducted in open-top chambers, experimental fields, or greenhouses and included the experiments that contributed to the widely applied Weibull O3 response function (Heck et al., 1984; Adams et al., 1989; Lesser et al., 1990; Wang and Mauzerall, 2004; Tai et al., 2021; Feng et al., 2022). The selection criteria of the data are described in detail in Mills et al. (2018b).
The yield data from the literature experiments were standardized as performed by Mills et al. (2018b) and described by Osborne et al. (2016). For each experiment, linear regression was used to determine the yield at 25 ppb M7 O3, and this value was the reference for calculating the relative yield; i.e., relative yield was calculated as the actual observed yield divided by the yield at 25 ppb O3. The 25 ppb M7 O3 threshold was chosen for proper comparison to the model results. After calculating the yield relative to 25 ppb M7 O3, a linear regression for each cultivar was performed using R statistical software, v4.3.0 (R Core Team, 2023; Wickham, 2016; Wickham et al., 2023), to determine the O3 exposure response (Fig. S2). The cultivar O3 exposure responses were then classified into three evenly distributed quantiles, 0 %–33 %, 33 %–66 %, and 66 %–100 %, chosen to represent the three O3 sensitivity classifications, sensitive, intermediate, and tolerant, respectively (Fig. S3). These data were used to determine the model FOZ1 and SFOZ1 values of each of the O3 cultivar classifications shown in Table 1 to evaluate if the models could accurately reproduce the O3 exposure–yield responses.
3.1 Calibration of crop models and simulated relative yield loss against O3 exposure field experiments
The simulated phenology (anthesis (flowering) and physiological maturity dates), biomass, yield, and relative yield due to elevated O3 stress from the maize and soybean experiments were compared to the field observations to determine performance of the O3 equations within the models (Tables 3–5; Figs. 2, 3, and S1). The relative yield due to O3 stress was calculated by dividing the yield of each corresponding O3 treatment over the control yield, i.e., the baseline O3 treatment, and multiplying by 100 to convert to a percentage. The relative yield loss was the difference between 100 % and the calculated relative yield. There were no O3 field experiment data for rice, so the rice O3 parameter values and performance were compared to the O3 exposure–yield response functions from the literature (Sect. 3.3).
The maize and soybean cultivars had different sensitivities to O3 stress which were accounted for by using different FOZ1 and SFOZ1 values (Fig. S1). The calibrated CERES-Maize and CROPGRO-Soybean models simulated the physiological maturity within 4 d of the observations (Table 5; root-mean-square error (RMSE) = 0.0 d for maize 2018, 3.70 d for soybean 2009, and 3.30 d for soybean 2010). The calibrated CERES-Maize model was able to reproduce the yield and relative yield loss very well across all six cultivars (Fig. 2; RMSE = 107 kg ha−1 and 2 %; r2=0.99 and 0.99, respectively). This ideal model performance was because only two O3 treatments were available for each maize cultivar which simplified the calibration process (Fig. S1a). The CROPGRO-Soybean model was able to reproduce the biomass, yield, and relative yield loss due to O3 stress well for the calibration year, 2009 (Fig. 3a, b, c; RMSE = 1179 kg ha−1, 328 kg ha−1, and 10 %; r2=0.81, 0.88, and 0.85), and acceptably for the evaluation year, 2010, across all seven cultivars (Fig. 3d, e, f; RMSE = 3339 kg ha−1, 1291 kg ha−1, and 16 %; r2=0.59, 0.71, and 0.66). The model overestimated biomass and yield for all cultivars and treatments in 2010, which was likely the result of a factor outside of the model setup that mitigated the increased incoming solar radiation when compared to 2009 (Sect. 4.3). The calibration and evaluation for the NWheat model was conducted and validated in Guarin et al. (2019), where the model reproduced the observed relative yield due to O3 stress with a normalized root-mean-square error (NRMSE) of 23 % and an r2 of 0.94, 0.91, and 0.88 for the tolerant, intermediate, and sensitive O3 sensitive cultivar classifications.
Table 3CERES-Maize cultivar and O3 parameters used to simulate the six maize cultivars from the 2018 FACE field experiment (Choquette et al., 2020). P1: thermal time from seedling emergence to the end of the juvenile phase (expressed in degree days above a base temperature of 8 °C). P2: extent to which daily development is delayed for each hour increase in photoperiod above the longest photoperiod at which development proceeds at a maximum rate (which is considered to be 12.5 h). P5: thermal time from silking to physiological maturity (expressed in degree days above a base temperature of 8 °C). G2: maximum possible number of kernels per plant. G3: kernel filling rate during the linear grain filling stage and under optimum conditions (mg d−1). PHINT: phyllochron interval, i.e., the interval in thermal time (degree days) between successive leaf tip appearances. FOZ1: O3 effect on photosynthesis. SFOZ1: O3 effect on leaf senescence.
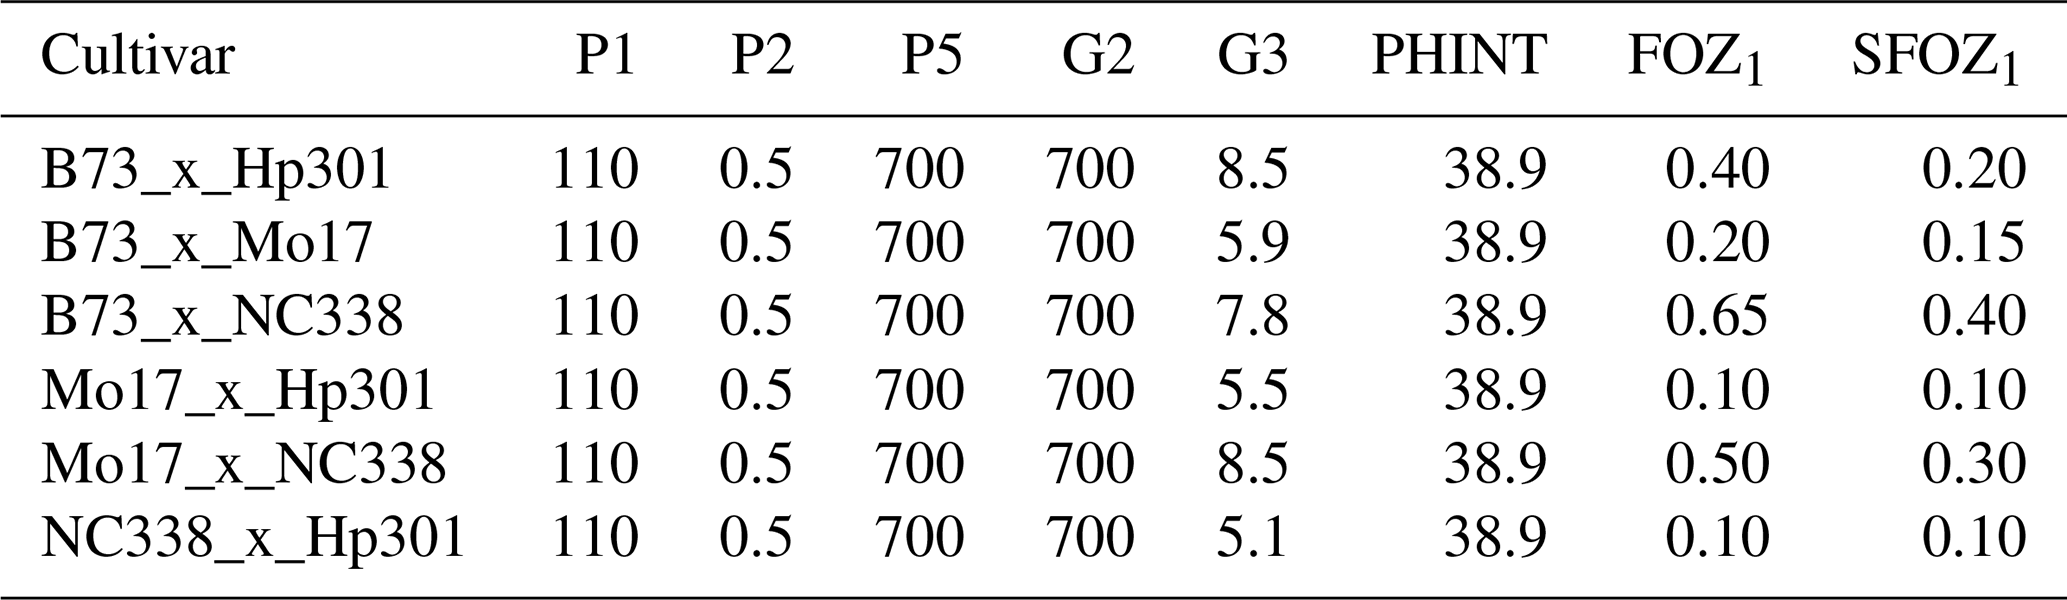
Table 4CROPGRO-Soybean cultivar and O3 parameters used to simulate the seven soybean cultivars based on the maturity groups defined in the SoyFACE field experiment (Betzelberger et al., 2012). CSDL: critical short-day length below which reproductive development progresses with no day length effect (for short-day plants) (hour). PPSEN: slope of the relative response of development to photoperiod with time (positive for short-day plants) (per hour). EM-FL: time between plant emergence and flower appearance (R1) (photothermal days). FL-SH: time between first flower and first pod (R3) (photothermal days). FL-SD: time between first flower and first seed (R5) (photothermal days). SD-PM: time between first seed (R5) and physiological maturity (R7) (photothermal days). FL-LF: time between first flower (R1) and end of leaf expansion (photothermal days). LFMAX: maximum leaf photosynthesis rate at 30 °C, 350 vpm CO2, and high light (mg CO2 m−2 s−1). SLAVR: specific leaf area of cultivar under standard growth conditions (cm2 g−1). SIZLF: maximum size of full leaf (three leaflets) (cm2). XFRT: maximum fraction of daily growth that is partitioned to seed and shell. WTPSD: maximum weight per seed (g). SFDUR: seed filling duration for pod cohort at standard growth conditions (photothermal days). SDPDV: average seed per pod under standard growing conditions (number per pod). PODUR: time required for cultivar to reach final pod load under optimal conditions (photothermal days). THRSH: threshing percentage. The maximum ratio of (seed per (seed + shell)) at maturity. SDPRO: fraction protein in seeds (g(protein) per g(seed)). SDLIP: fraction oil in seeds (g(oil) per g(seed)). FOZ1: O3 effect on photosynthesis. SFOZ1: O3 effect on leaf senescence.
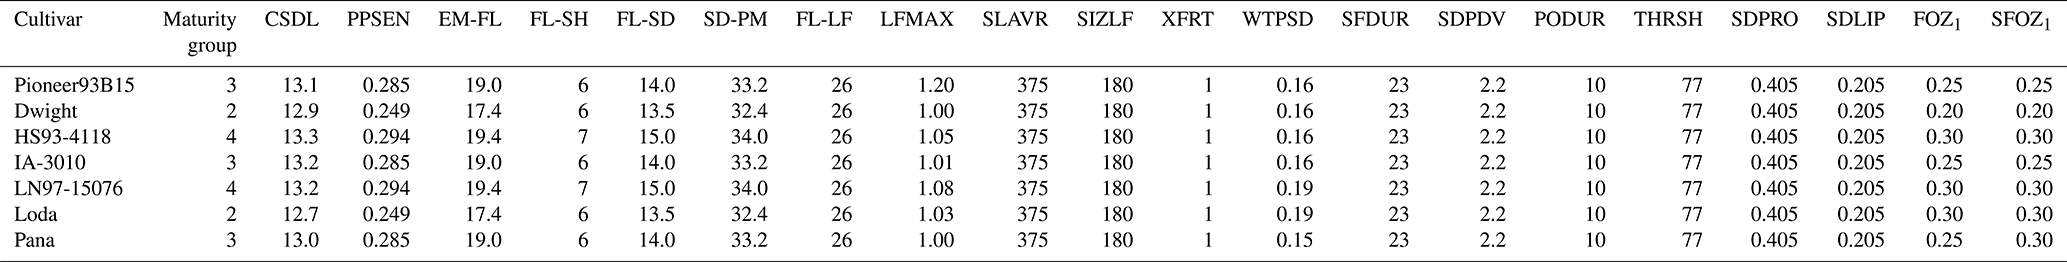
Table 5Observed and simulated anthesis day and maturity day for the six maize cultivars from the 2018 FACE experiment (Choquette et al., 2020) and the seven soybean cultivars from the 2009 and 2010 soybean SoyFACE experiments (Betzelberger et al., 2012). The observed maturity dates were estimated from the single reported harvest date for all cultivars, but there may have been minor variation between the different cultivars. Observed anthesis was not available for soybean.
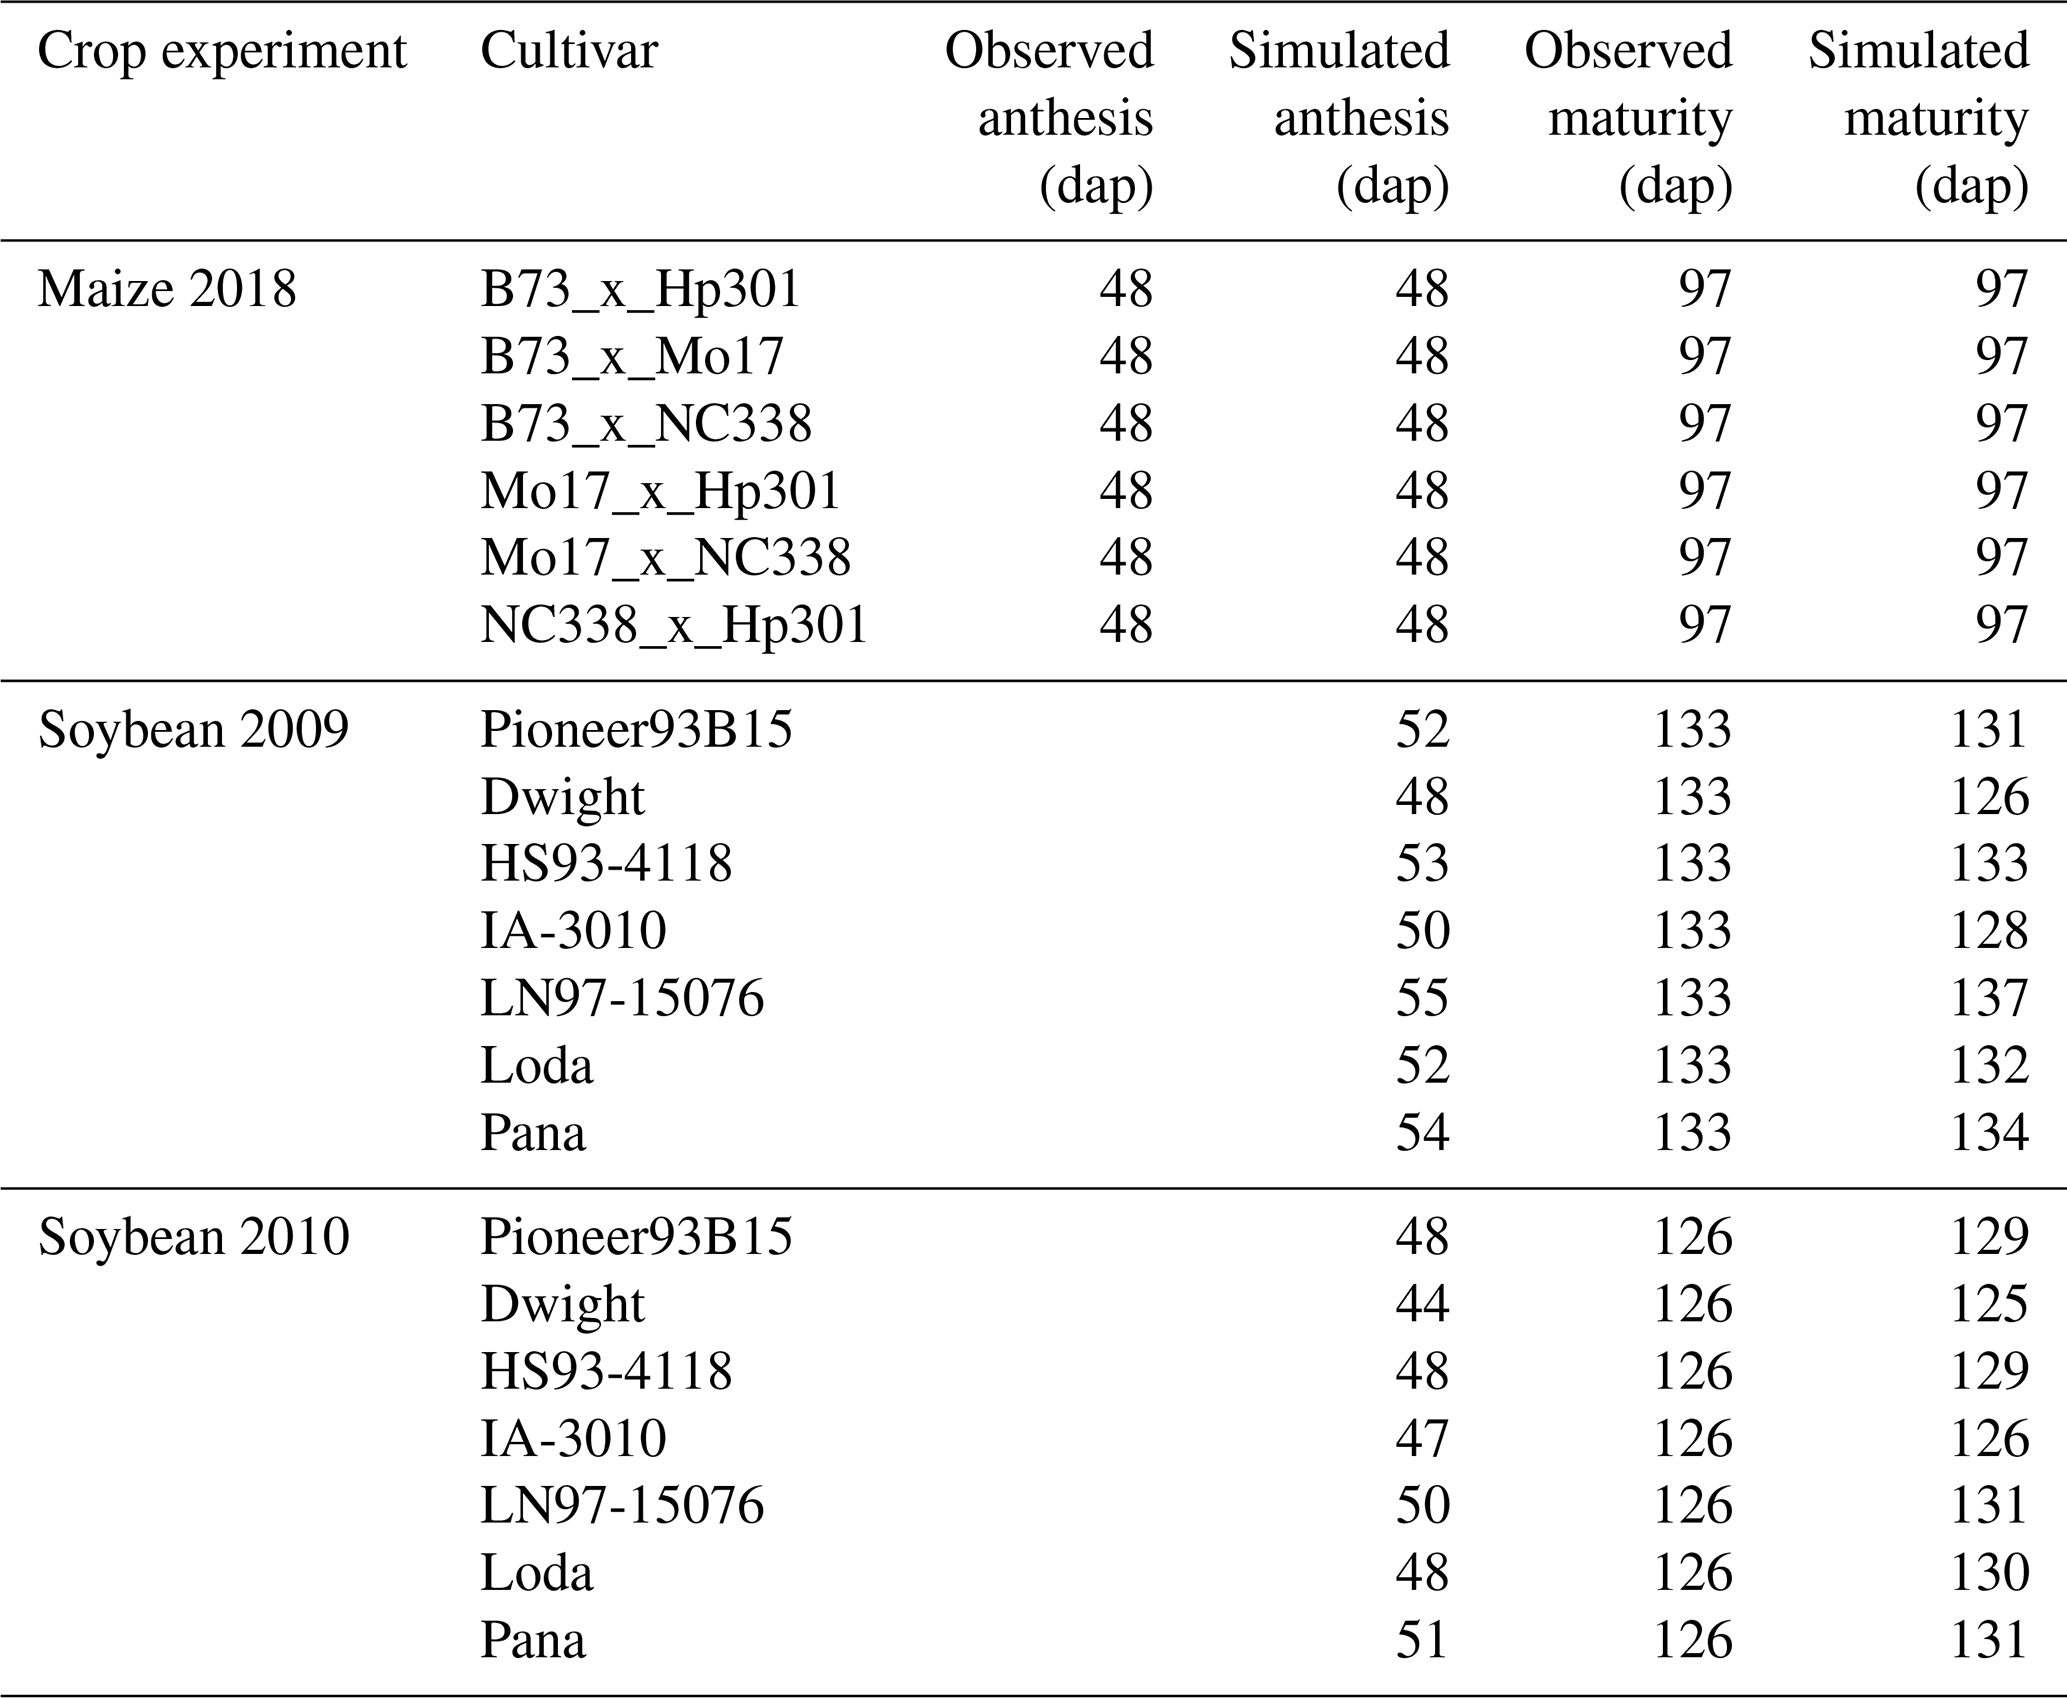
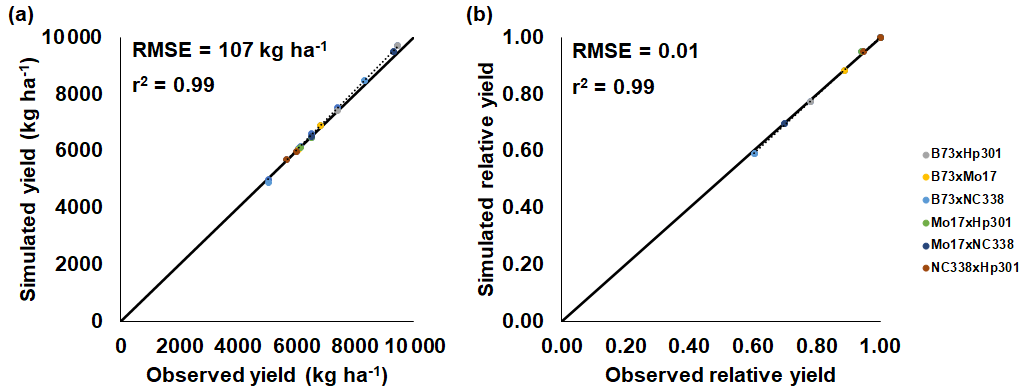
Figure 2CERES-Maize model calibration of the 2018 FACE O3 field experiment conducted in Champaign, Illinois, USA (Choquette et al., 2020). Simulated and observed (a) yield and (b) relative yield due to elevated O3 stress (compared to the ambient control treatment) for six maize cultivars (colored points). The root-mean-square error (RMSE) and coefficient of determination (r2) show the model performance across all cultivars. The solid black line shows 1:1 comparison, and the dotted black line shows linear fit across all cultivars. For maize, only 1 year of experimental data were available for calibration and evaluation. The model cultivar parameters are shown in Table 3.
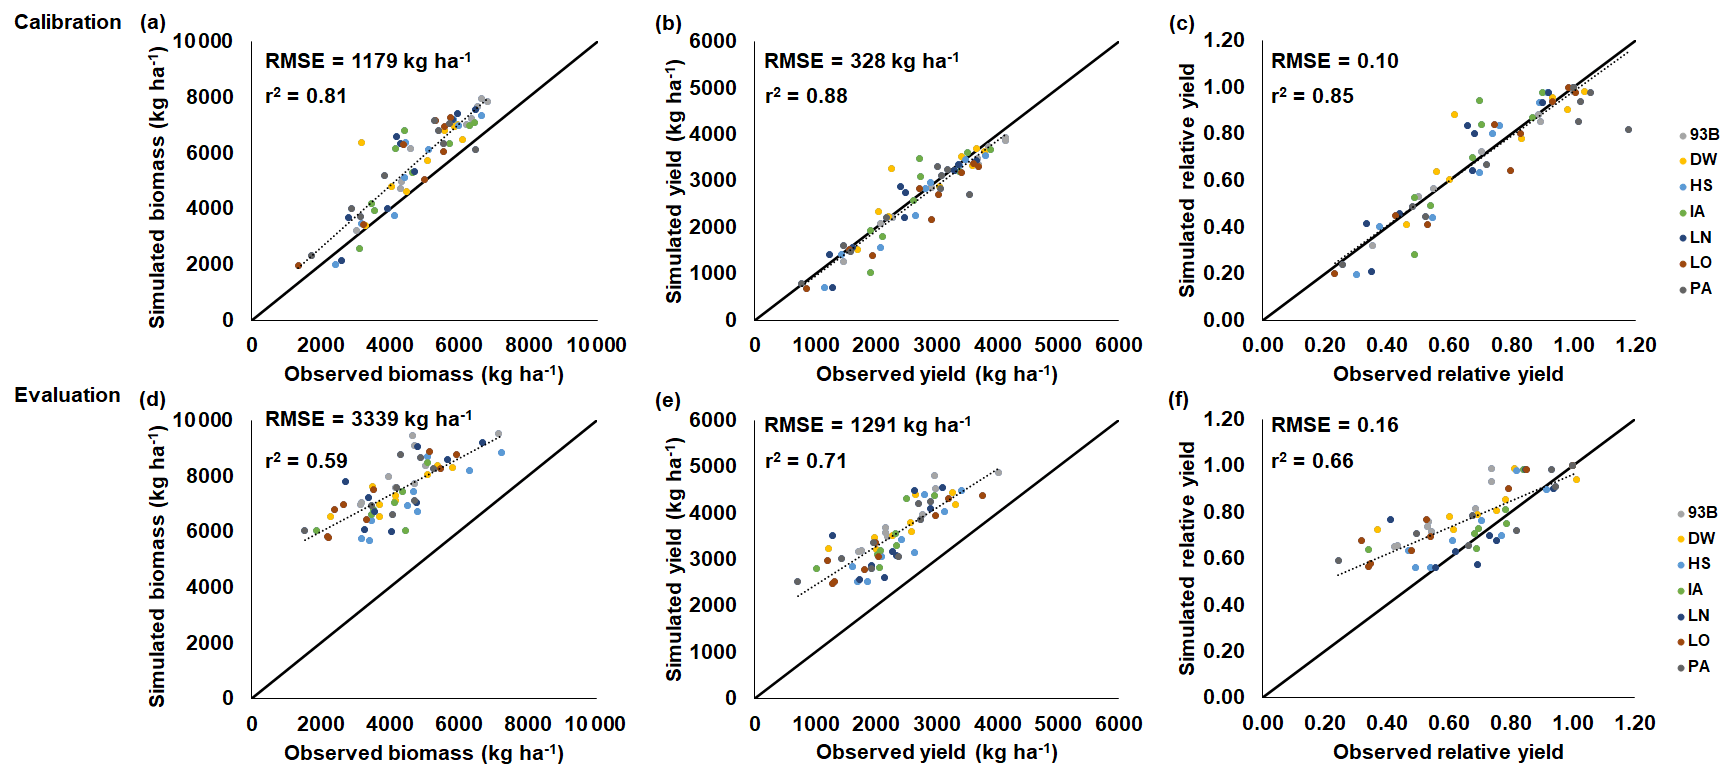
Figure 3CROPGRO-Soybean model performance and evaluation of the SoyFACE O3 field experiment conducted in Champaign, Illinois, USA (Betzelberger et al., 2012). Simulated and observed (a, d) above-ground biomass, (b, e) yield, and (c, f) relative yield in response to the nine progressive O3-increasing treatments (Table 2) for seven soybean cultivars (colored points). Relative yield is compared to the ambient control treatment within each year. The 2009 SoyFACE field experiment was used for model calibration (a, b, c), and the 2010 SoyFACE field experiment was used for model evaluation (d, e, f). The root-mean-square error (RMSE) and coefficient of determination (r2) show the model performance across all cultivars. The solid black line shows 1:1 comparison, and the dotted black line shows linear fit across all cultivars. The model cultivar parameters are shown in Table 4.
3.2 Sensitivity analysis and combined effects of O3, CO2, and water deficit stress on yields
The simulated relative yield losses due to O3 stress increased for all crops as the M7 O3 concentrations increased above the 25 ppb threshold when examining the photosynthesis and leaf senescence responses independently, as expected (Figs. 4–7). The simulated actual yields for all crops are shown in Tables S2–S9. Wheat was the most sensitive crop to O3 stress of the four crops examined (compare slopes in Figs. 4–7a and b), which agrees with previous literature (Mills et al., 2018b). For each model, simulations using an FOZ1 or SFOZ1 example value of 0.5 were examined in more detail to illustrate the O3–CO2–water interactions (Figs. 4–7c and d, respectively). For all crops, the Dry/reduced rainfall and low CO2 treatment produced the lowest yields, while the Wet/normal rainfall and high CO2 produced the highest yields (Tables S2–S9). The simulated O3 effect was larger when water was non-limiting; i.e., the higher rainfall and irrigated treatments experienced larger losses due to O3 stress because of increased stomatal uptake. The simulated O3 effect was reduced under the higher CO2 concentrations, thus capturing the responses from stomatal closure and the photosynthetic benefits from the CO2 fertilization effect.
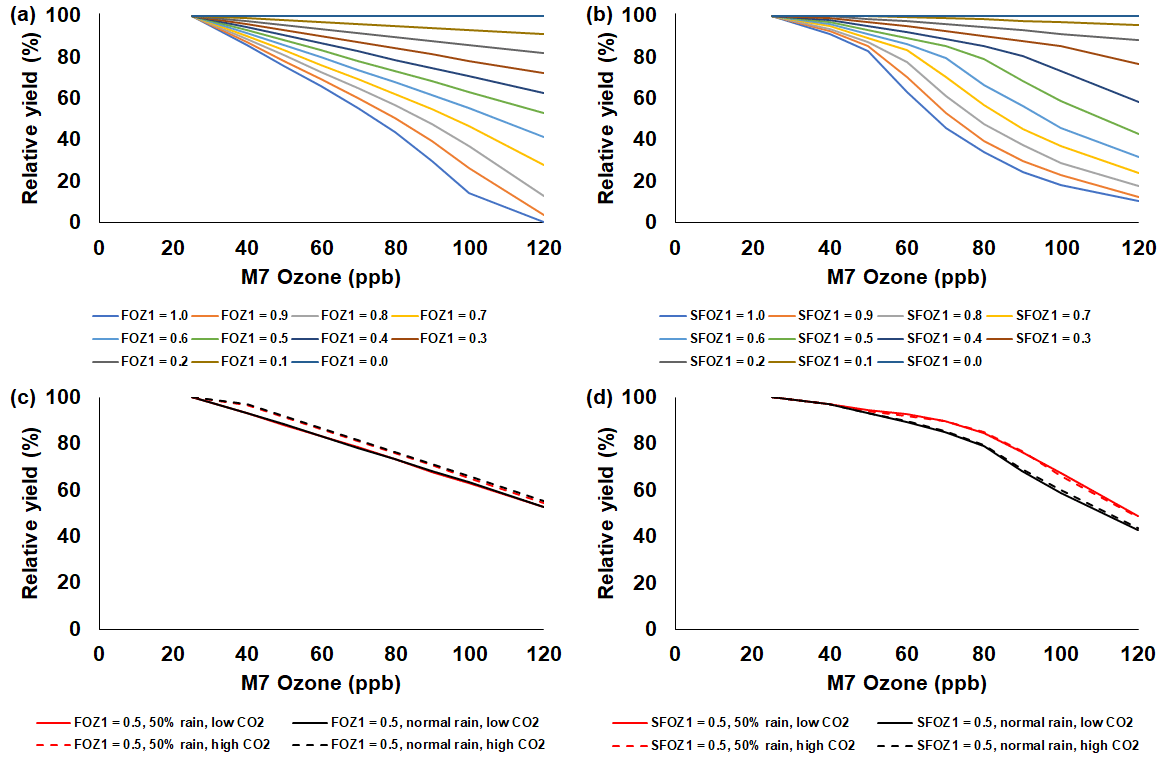
Figure 4Sensitivity analysis using the CERES-Maize model to simulate relative yield due to elevated O3 stress (relative to 25 ppb M7 O3) for a range of (a) the photosynthesis O3 stress parameter (FOZ1) and (b) the leaf senescence O3 stress parameter (SFOZ1) values under the normal rainfall and 350 ppm CO2 scenario and an example of (c) FOZ1 and (d) SFOZ1 set at 0.5 under the 50 % reduced rainfall and 350 ppm CO2 (solid red line), normal rainfall and 350 ppm CO2 (solid black line), 50 % less rainfall and 550 ppm CO2 (dashed red line), and normal rainfall and 550 CO2 (dashed black line) scenarios. The Champaign, Illinois, USA, 2018 FACE weather, soil, and dominant management conditions were used for the reference location. Each O3 parameter was tested independently; i.e., when examining FOZ1, SFOZ1 was set to zero and vice versa. The simulated actual yields are shown in Tables S2 and S3.
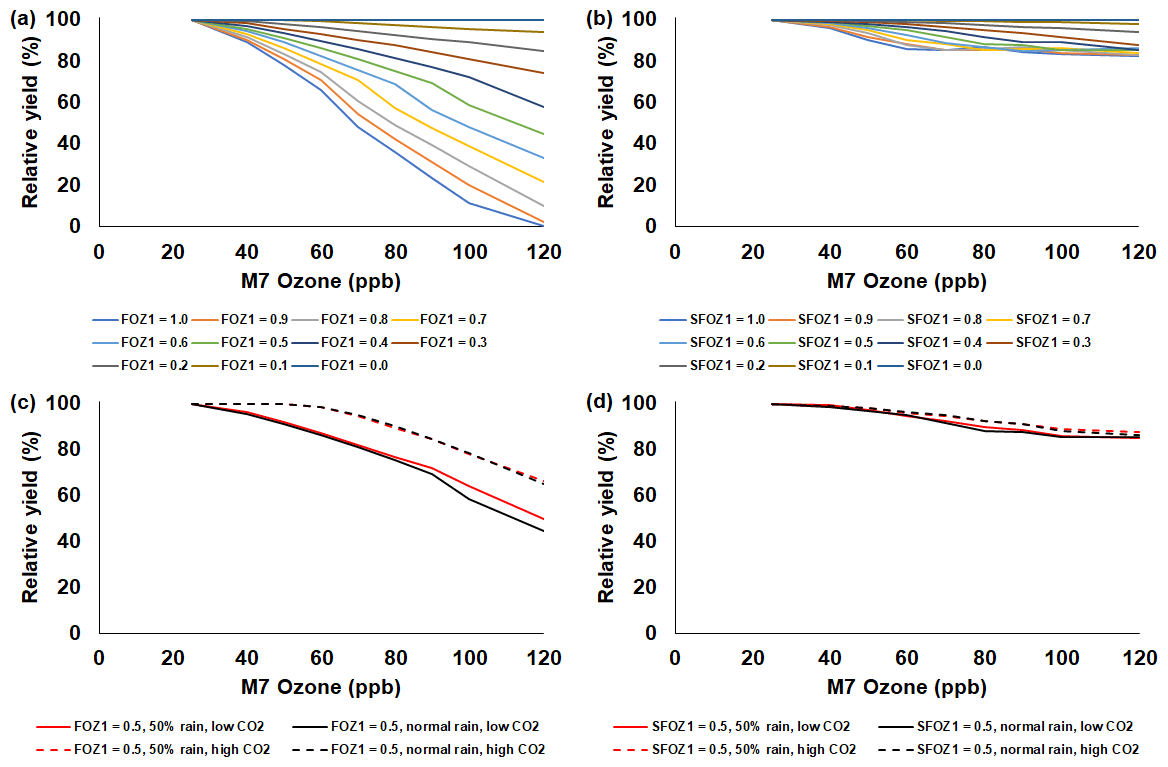
Figure 5Sensitivity analysis using the CERES-Rice model to simulate relative yield due to elevated O3 stress for a range of (a) FOZ1 and (b) SFOZ1 values under the normal rainfall and 350 ppm CO2 scenario and an example of (c) FOZ1 and (d) SFOZ1 set at 0.5 under the 50 % reduced rainfall and 350 ppm CO2 (solid red line), normal rainfall and 350 ppm CO2 (solid black line), 50 % less rainfall and 550 ppm CO2 (dashed red line), and normal rainfall and 550 CO2 (dashed black line) scenarios. The Stuttgart, Arkansas, USA, 2009 weather, soil, and dominant management conditions were used for the reference location. Each O3 parameter was tested independently; i.e., when examining FOZ1, SFOZ1 was set to zero and vice versa. The simulated actual yields are shown in Tables S4 and S5.
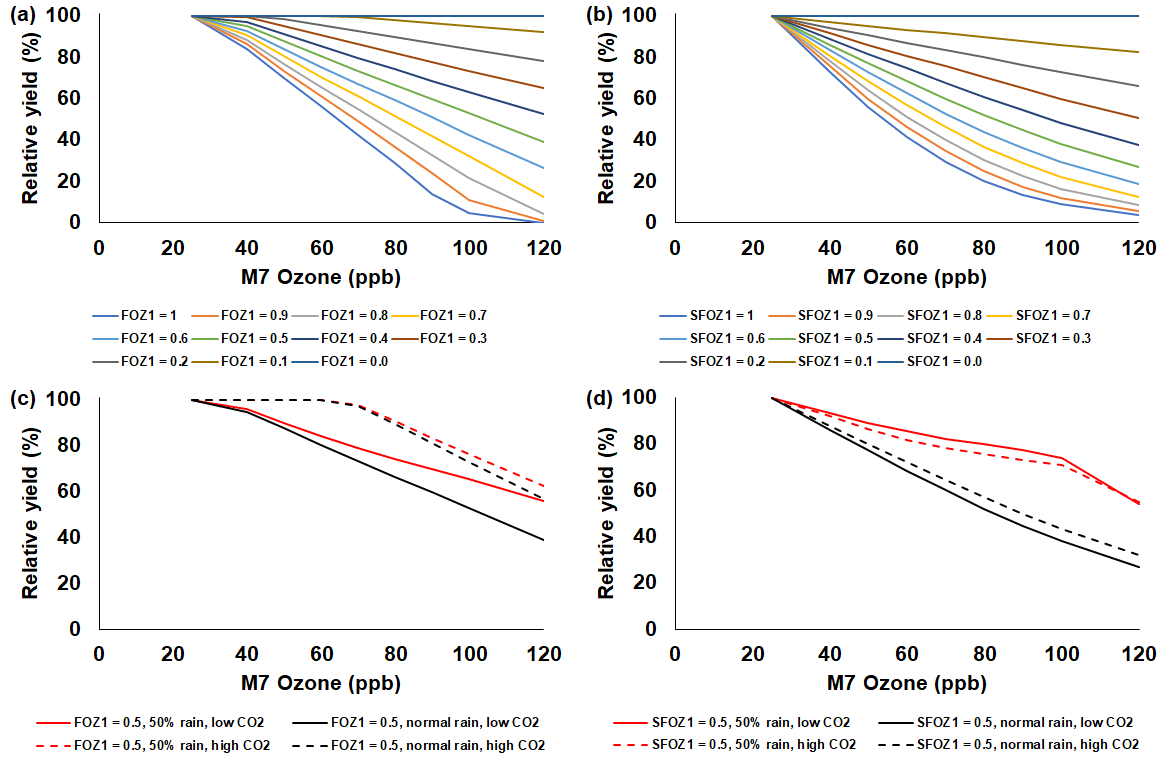
Figure 6Sensitivity analysis using the CROPGRO-Soybean model to simulate relative yield due to elevated O3 stress for a range of (a) FOZ1 and (b) SFOZ1 values under the normal rainfall and 350 ppm CO2 scenario and an example of (c) FOZ1 and (d) SFOZ1 set at 0.5 under the 50 % reduced rainfall and 350 ppm CO2 (solid red line), normal rainfall and 350 ppm CO2 (solid black line), 50 % less rainfall and 550 ppm CO2 (dashed red line), and normal rainfall and 550 CO2 (dashed black line) scenarios. The Champaign, Illinois, USA, 2009 SoyFACE weather, soil, and dominant management conditions were used for the reference location. Each O3 parameter was tested independently; i.e., when examining FOZ1, SFOZ1 was set to zero and vice versa. The simulated actual yields are shown in Tables S6 and S7. Figure S6 shows the relative biomass loss corresponding to SFOZ1 (d) to explain the inverted CO2 effect under the 50 % rainfall treatment.
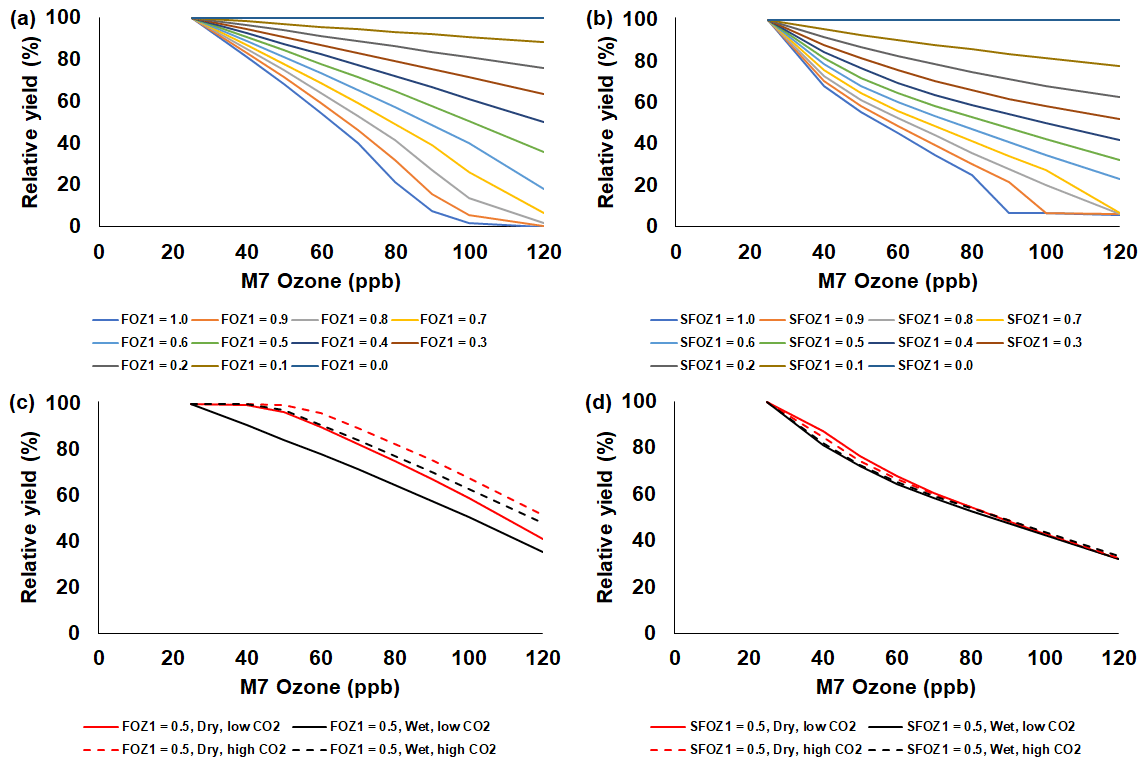
Figure 7Sensitivity analysis using the NWheat model to simulate relative yield due to elevated O3 stress for a range of (a) FOZ1 and (b) SFOZ1 values under the Wet irrigation and 350 ppm CO2 scenario and an example of (c) FOZ1 and (d) SFOZ1 set at 0.5 under the Dry irrigation and 350 ppm CO2 (solid red line), Wet irrigation and 350 ppm CO2 (solid black line), Dry irrigation and 550 ppm CO2 (dashed red line), and Wet irrigation and 550 CO2 (dashed black line) scenarios. The Maricopa, Arizona, USA, 1993 FACE weather, soil, and management conditions were used for the reference location (Kimball et al., 1999; Guarin et al., 2019). Each O3 parameter was tested independently; i.e., when examining FOZ1, SFOZ1 was set to zero and vice versa. The simulated actual yields are shown in Tables S8 and S9.
3.3 Simulated relative yield loss compared to O3 relationships in the literature
For all crops, the literature showed a large range of relative yield losses due to O3 stress caused by different cultivar O3 sensitivities (Fig. S2). Wheat was the most sensitive crop to O3 stress with an average yield loss of 0.70±0.39 % (mean ± SD) per ppb M7 O3 increase above 25 ppb, followed by soybean, maize, and then rice (average yield losses of 0.60±0.39 %, 0.39±0.26 %, and 0.32±0.37 % per ppb M7 O3 increase above 25 ppb, respectively) (average of slopes in Table S10). To encompass the high variability of yield losses, the cultivars were classified into the O3-tolerant, -intermediate, and -sensitive cultivar O3 sensitivities (Fig. S3). Since the cultivar sensitivities were not originally specified in the literature, the FOZ1 and SFOZ1 parameters used in the models were adjusted to provide the best fit across the O3 exposure responses (Table 1). Overall, the models reproduced the simulated O3 exposure relationships from the literature well: the RMSE for maize, rice, soybean, and wheat across all three O3 exposure sensitivities were 6.6 %, 7.8 %, 4.0 %, and 5.4 %, respectively (Fig. 8). The models performed better (lower RMSE) for the O3-tolerant and O3-intermediate cultivar sensitivities compared to the O3-sensitive cultivar sensitivity, but all models explained the variance well (r2>0.96 across all O3 sensitivities). This suggests that different combinations of FOZ1 and SFOZ1 can be calibrated for specific observations to emulate the variation in different O3 exposure responses.
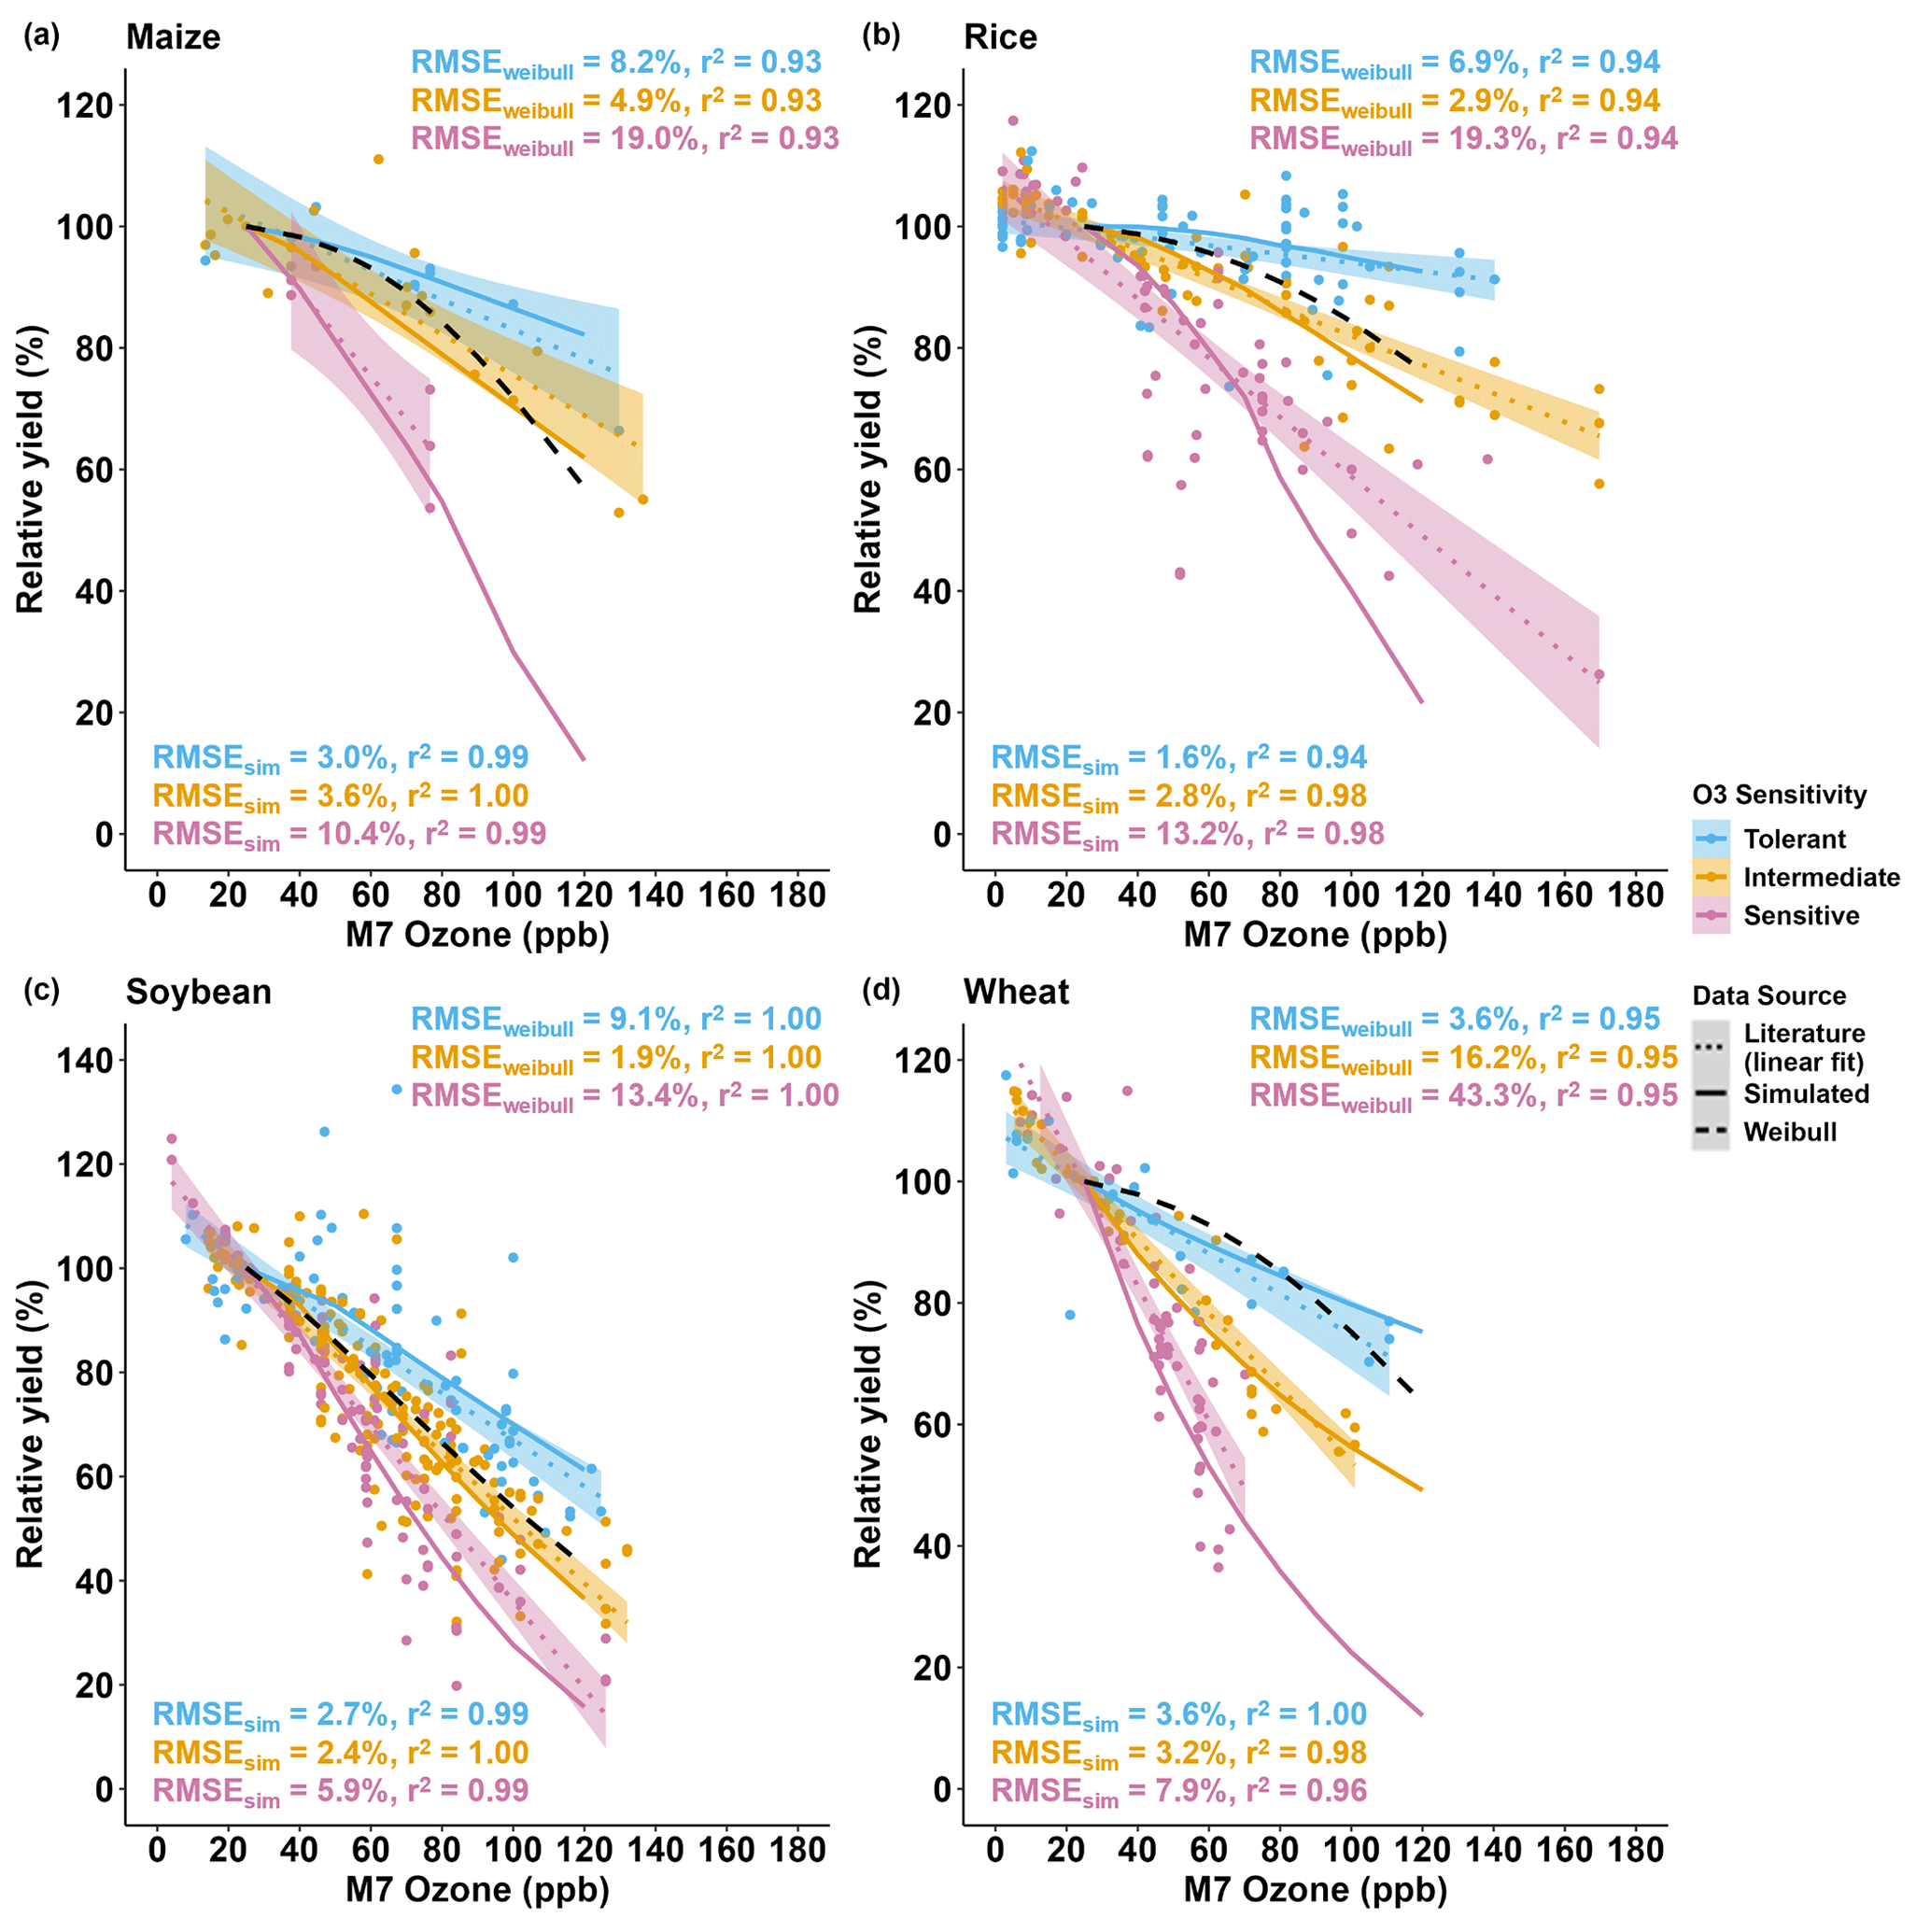
Figure 8Simulated relative yield due to O3 stress (solid lines) compared to the O3 exposure relationships (dotted lines) from the literature data (symbols) for the (a) CERES-Maize, (b) CERES-Rice, (c) CROPGRO-Soybean, and (d) NWheat models. The calculated relative yield from the well-known Weibull O3 response functions (dashed black lines, equations listed in Table S11) is based on the US NCLAN network O3 exposure field experiments conducted between the 1960s and the 1980s (Adams et al., 1989; Lesser et al., 1990; Wang and Mauzerall, 2004; Tai et al., 2021). The O3 exposure–yield response linear fits of the three O3 sensitivities, tolerant (blue), intermediate (gold), and sensitive (magenta), are given in Fig. S3. The cultivars were classified by grouping the cultivar O3 exposure–yield response (Fig. S2) into three evenly distributed quantiles: 66 %–100 %, 33 %–66 %, and 0 %–33 %, respectively. The O3 sensitivities determined for each cultivar are listed in Table S10. The simulated results for the crop models use the FOZ1 and SFOZ1 values from Table 1. For each model, the same weather, soil, and dominant management conditions as in the normal rainfall and 350 ppm CO2 treatment of the sensitivity analysis were used as reference (the O3 response functions from the literature included O3 field experiments conducted when the atmospheric CO2 concentration was ∼350 ppm). The literature data consist of the relative yields (scaled to 25 ppb M7 O3) of the cultivars examined in the Mills et al. (2018b) literature review combined with the maize and soybean cultivars used in this study for a total of 9 maize cultivars, 50 rice cultivars, 49 soybean cultivars, and 23 wheat cultivars (listed in Table S10). For the O3 sensitivity of each crop, the root-mean-square error (RMSE) and coefficient of determination (r2) show the crop model performance (RMSEsim) and the Weibull response function performance (RMSEweibull) compared to the linear fit of the O3 exposure literature data (text color corresponds to O3 sensitivity). The color-shaded area shows the standard error for the linear fit of the literature data for each of the cultivar O3 sensitivities.
4.1 Simulating O3 damage on crop yields
The measured yield losses for the maize FACE experiment were between 5 % and 40 % for the M7 O3 concentrations when increasing from the ambient concentration (38 ppb) to the elevated O3 treatment (77 ppb), a yield loss of 0.14 % to 1.01 % per ppb M7 O3 above the ambient concentration, depending on the O3 cultivar sensitivity (Fig. 2b). `NC338xHp301' and `Mo17xHp301' were classified as O3-tolerant because of relatively small yield losses of 5 % and 6 %, respectively; `B73xMo17' was classified as O3-intermediate with a yield loss of 11 %; and `B73xHp301', `Mo17xNC338', and `B73xNC338' were sensitive to O3 effects with yield losses of 22 %, 30 %, and 40 %, respectively (Fig. S1a, Table S10). These cultivar O3 sensitivities are based on a single experimental year, so additional testing is needed to further corroborate the classifications. Overall, the calibrated CERES-Maize model was able to reproduce these observed yield losses within 1 %, i.e., simulated yield losses between 5 % and 41 %, or 0.12 % and 1.05 % per ppb O3 increase above the ambient concentration. These yield losses were also calculated relative to 25 ppb (as described in Sect. 2.5) for consistency with the literature, which resulted in simulated yield losses between 0.12 % and 0.93 % per ppb M7 O3 increase above 25 ppb across the six cultivars.
When comparing the simulations to the maize O3 exposure–yield relationships from the literature, the model simulated average yield losses of 0.16 %, 0.36 %, and 0.82 % per ppb M7 O3 increase above 25 ppb for the O3-tolerant, -intermediate, and -sensitive cultivar O3 sensitivities, respectively (Fig. 8a solid lines). This agreed well with the literature yield losses of 0.24 %, 0.33 %, and 0.71 % per ppb M7 O3 increase above 25 ppb for the O3-tolerant, -intermediate, and -sensitive cultivar sensitivities, respectively (Figs. S3a, 8a dotted lines). The O3 parameter values used for the literature comparison were determined to provide the best fit across the literature experiments consisting of nine maize cultivars, but these O3 parameter values could be calibrated for other scenarios and cases, i.e., higher or lower cultivar O3 sensitivity.
The measured yield losses for the SoyFACE experiment were between 51 % and 77 % for the M7 O3 concentrations when increasing from the ambient concentration (37 ppb) to the highest O3 treatment (126 ppb) in 2009, a yield loss of 0.57 % to 0.86 % per ppb M7 O3 above the ambient concentration, depending on the cultivar O3 sensitivity (Fig. 3c). The calibrated CROPGRO-Soybean model reproduced observed yield losses within 10 %, i.e., simulated yield losses between 59 % to 80 %, or 0.66 % to 0.90 % per ppb O3 increase. Based on the calculated O3 classifications from the literature and low yield divergence across the seven cultivars (Fig. S1b), `Pioneer93B15', `Dwight', ` IA-3010', and `LN97-15076' were considered O3-intermediate, and `HS93-4118', `Loda', and `Pana' were considered O3-sensitive (Table S10). In 2010, the observed soybean yield losses ranged between 31 % and 76 % when increasing from the ambient concentration (37 ppb) to the highest O3 treatment (84 ppb), a yield loss of 0.65 % to 1.60 % per ppb M7 O3 above the ambient concentration. The model underestimated yield losses in 2010, between 27 % and 44 %, but, because the experimental setup was the same for both years, an external factor that was not considered in the simulations may have affected yields (Sect. 4.3). The 2010 yield losses were of a similar magnitude to the 2009 yield losses, but the 2010 experiment had higher yield loss and variation per ppb O3 increase with lower average M7 O3 concentrations (Table 2, Fig. S4a).
When comparing the simulations to the soybean O3 exposure–yield relationships from the literature (Fig. 8c), an average yield loss of 0.36 %, 0.64 %, and 0.96 % per ppb M7 O3 increase above 25 ppb was simulated for the O3-tolerant, -intermediate, and -sensitive cultivar O3 sensitivities, respectively. This was substantiated by the literature yield losses of 0.45 %, 0.63 %, and 0.84 % per ppb M7 O3 increase above 25 ppb for the O3-tolerant, -intermediate, and -sensitive cultivar O3 sensitivities, respectively (Figs. S3c, 8c dotted lines). The literature data consisted of 49 soybean cultivars, which had a smaller range of O3 sensitivities compared to the other crops, although there were outliers where yield increased under higher O3 concentrations (described in Sect. 4.2).
The CERES-Rice model simulated an average yield loss of 0.05 %, 0.23 %, and 0.66 % per ppb M7 O3 increase above 25 ppb for the O3-tolerant, -intermediate, and -sensitive cultivar O3 sensitivities, respectively (Fig. 8b solid lines). The rice literature had the most cultivars (50) of the four crops examined, and the simulated yield losses for the O3-tolerant and -intermediate cultivar O3 sensitivities agreed well with the literature yield losses of 0.07 % and 0.24 % per ppb M7 O3 increase above 25 ppb, respectively (Fig. 8b dotted lines). A larger discrepancy between the simulated yield loss for the O3-sensitive classification and the literature O3-sensitive yield loss of 0.49 % per ppb M7 O3 increase above 25 ppb was due to the higher variability within the literature data (Fig. 8b shaded area).
Using the calibrated NWheat model, the simulated yield losses were 0.26 %, 0.66 %, and 1.23 % per ppb M7 O3 increase above 25 ppb for the O3-tolerant, -intermediate, and -sensitive cultivar O3 sensitivities, respectively (Fig. 8d). These simulated yield losses were corroborated by the reported average yield losses of 0.33 %, 0.61 %, and 1.11 % per ppb M7 O3 increase above 25 ppb for the O3-tolerant, -intermediate, and -sensitive cultivar O3 sensitivities, respectively. The literature expanded across different ranges of O3 concentrations for all crops, and yield loss per ppb is not always constant over an expansive range of O3 concentrations, so the model O3 parameter values can be adjusted for higher or lower cultivar O3 sensitivity.
As an additional check of model performance, the calculated relative yield from the well-known Weibull O3 response functions (Table S11) were compared to the literature O3 exposure linear yield responses for each crop and O3 classification (Fig. 8). The Weibull function performance was then compared to the simulated crop model results. Overall, the crop model simulations performed better (lower RMSE and higher r2) than the Weibull response functions across all crops for all three O3 classifications, except the O3-intermediate classification for soybean which had <1 % difference between the RMSE (compare RMSE and r2 in Fig. 8). The performance results suggest that it is best to use calibrated crop models when available and that the Weibull response functions are mainly representative of O3-intermediate classifications for maize, rice, and soybean and O3-tolerant classifications for wheat.
4.2 Simulated relative yield loss with the combined effects of O3, CO2, and water deficit stress
The sensitivity analyses showed that the yield losses due to O3 stress were higher under the normal rainfall and low CO2 treatment, which agrees with previous literature that increased water availability increases O3 impact due to increased stomatal uptake (Khan and Soja, 2003; Biswas et al., 2013). It was unexpected that the simulated O3 photosynthetic response difference between the normal and reduced rainfall treatments for maize was less than 1 % (Fig. 4c). This was because the model simulated low water deficit stress under the 50 % reduced rainfall treatment which obscured the O3–water stress dynamics. Further reducing the rainfall to 40 % of the normal amount increased the simulated water deficit stress and produced the photosynthetic O3–water dynamics consistent with the other models (Fig. S5). The elevated CO2 concentration mitigated the detrimental effect of O3 stress in the photosynthetic response for all models (Figs. 4–7c), which agrees with recent global findings that elevated CO2 concentrations can mitigate and even negate elevated O3 impacts (Xia et al., 2021; Tai et al., 2021). Interestingly, the CROPGRO-Soybean model simulated an inverse O3–CO2 effect on relative yield under the 50 % rainfall condition when examining SFOZ1 in detail (Fig. 6d). This inverse yield response was due to the low actual yield simulated under the 50 % rainfall and low CO2 treatment (<2000 kg ha−1, Table S7) which resulted in smaller changes in yield compared to the 50 % rainfall and high CO2 treatment, but the overall simulated aboveground biomass O3–CO2–water interaction was as expected (Fig. S6).
For several of the observations from the actual soybean field experiment using `Pana', the yield increased under higher O3 concentrations (∼2 % to 18 %; Figs. 3c, S1b, and S7). In some cases it is possible that elevated O3 concentrations can benefit a crop via hormesis, a process where low levels of intermittent stress may benefit overall crop growth through improved resiliency (Calabrese, 2014). It is also possible that if elevated O3 concentrations reduce biomass growth throughout the season, and therefore reduce nutrient resource demand throughout the season, small yield increases can occur from a larger pool of resources available during the key reproductive/grain filling period (Asseng and Van Herwaarden, 2003; Guarin et al., 2019). This increase in yield under higher O3 concentrations was also observed under several other soybean and rice cultivars from the literature (Fig. S2b and c). However, a soybean cultivar from the literature, `Cumberland', was reported to have a 34 % increase under elevated O3 (67 ppb) compared to the control treatment (25 ppb), but such a large increase may indicate that another outside factor affected the yields. Mulchi et al. (1988) speculated that the large yield difference was due to changes in the seasonal water dynamics, thereby causing increased drought stress under the control treatment compared to the elevated O3 treatment. Reproducing rare occurrences where elevated O3 may result in yield increases can be a challenge for the models because of the linear response of the stress equations (Fig. S7). However, it may be possible depending on the simulated interactions between seasonal dynamics of resources, as shown with the sensitivity analysis of wheat yields in Guarin et al. (2019).
4.3 Uncertainty in model simulations and O3 exposure field experiments
Crop models contain uncertainties due to simplification of complex biological processes, but field experiments may also contribute uncertainty via measurement. The soybean simulations overestimated both biomass and yield across all cultivars and treatments for the 2010 SoyFACE experiment. Since both the ambient and elevated O3 treatments were overestimated, it is unlikely that the simulated O3 interactions caused the discrepancy. Examining the weather input showed a 14 % increase in cumulative incoming solar radiation for the 2010 growing season compared to the 2009 growing season (Fig. S4b). The 2010 season was warmer than the 2009 season, average seasonal temperature of 23.4 °C compared to 19.1 °C, but no heat stress was reported, and the difference in rainfall was negligible, 445 mm compared to 454 mm. Since management was the same for both years, and no water or N stresses were reported, it was expected that the 2010 yields would be higher than the 2009 yields due to the increased solar radiation, but the average 2010 yield across all cultivars for the ambient treatment decreased, 3300 kg ha−1 in 2010 compared to 3700 kg ha−1 in 2009. Therefore, it is possible that an outside stress factor not considered within the model limited soybean growth in the field in 2010 which led to the model overestimating biomass and yield. One possibility is that increased rainfall during the beginning of the 2010 season (221 mm in first 30 d compared to 153 mm in first 30 d of the 2009 season; Fig. S4c) may have resulted in germination or emergence stress due to excessive water such as flooding or lodging, which are factors not yet considered in the crop models.
The sensitivity analyses showed that the CO2 effect was more pronounced in the model photosynthesis response than in the leaf senescence response (compare solid and dashed lines in Figs. 4–7c and d). This is because the models do not have a CO2 effect directly applied to the daily leaf senescence calculation, whereas CO2 directly affects the daily photosynthesis calculation (PCARB in Eqs. 3 and 4 and PRATIO in Eq. 9). Improved CO2 representation within the crop models is being explored through the Agricultural Model Intercomparison and Improvement Project (AgMIP) studies (Ahmed et al., 2017, 2019; Toreti et al., 2020), but additional high-quality data is needed for model testing.
Crop responses to elevated O3 concentrations were incorporated into the DSSAT CERES-Maize, CERES-Rice, CROPGRO-Soybean, and NWheat crop models via functions reducing photosynthetic activity and accelerating leaf senescence. Model testing showed that each of the four models reproduced the observed O3 response from field experiments and previous literature and the expected interactions between O3, CO2, and water deficit stress. The simulated yield responses were also more representative of the O3 exposure literature data than the well-known Weibull O3 response functions for all crops. Thus, this incorporation allows improved simulation of the heterogeneity of O3 impacts across geographical regions and systems, and across years within seasons, which is more representative of real-world interactions than using a generic damage coefficient. Overall, increasing M7 O3 concentrations had a negative effect on growth and yield across all four crops, and this negative effect was exacerbated by increased water availability and ameliorated by elevated CO2 concentrations. The O3 impact and stress response of the crop depends on the stress severity, duration, frequency, cultivar sensitivity, and seasonal timing (i.e., developmental stage), which can be accounted for by using the updated crop models.
The addition of O3 stress functionality into crop models will improve both near- and long-term simulations of global environmental interactions using a key factor that is often not included in agricultural and climate change assessments. The DSSAT models in this study can be used to simulate the O3 impacts on crops in combination with climate change. The O3 parameter values in this study can be used as preliminary approximations, but, to further improve model performance and robustness of the O3 stress routines, the models and parameters should continue to be tested and calibrated with additional O3 exposure experimental data when available. In addition, the models should be compared with other O3-modified crop models as part of multi-model ensemble intercomparison and improvement assessments conducted by the AgMIP (https://agmip.org/, last access: 28 March 2024). As a next step, the AgMIP ozone team is currently conducting a multi-model ensemble study with crop models that have the capacity to evaluate the responses of future crop yields to different ozone concentrations. This effort will help produce more robust estimates of climate change impacts in global agriculture. The framework described here can be used by other process-based crop models, local or gridded, to incorporate O3 stress interactions into the model. This model improvement also suggests potential future collaboration between crop modelers and remote sensing experts using weather and climate models with dynamic chemistry components, such as the NASA Atmosphere Observing System (https://aos.gsfc.nasa.gov/, last access: 28 March 2024).
The current version of the DSSAT crop modeling platform is available to download from the DSSAT Foundation website (https://dssat.net/, Hoogenboom et al., 2019, 2021). The current version of the pSIMS framework is available to download from the RDCEP website (http://www.rdcep.org/research-projects/psims; RDCEP, 2024). The O3-modified version of the DSSAT crop models will be available with the next DSSAT version release, and the O3-modified version of the pDSSAT crop models is available from the GitHub repository at https://github.com/jguarin4/dssat-csm-os/tree/develop_v4.8_pdssat (last access: 28 March 2024). An archived version of the code is also available on Zenodo at https://doi.org/10.5281/zenodo.8284732 (Porter et al., 2023). The R code used to classify the cultivar O3 sensitivities is available on the Harvard Dataverse at https://doi.org/10.7910/DVN/0NN9MH (Guarin et al., 2023).
All field experimental and literature data used in this study are available from the sources referenced. The crop model simulated output data is available on the Harvard Dataverse at https://doi.org/10.7910/DVN/0NN9MH (Guarin et al., 2023).
The supplement related to this article is available online at: https://doi.org/10.5194/gmd-17-2547-2024-supplement.
JRG and JJ designed and conducted the study. EAA provided the O3 exposure field data. KS collated the O3 exposure literature data. JRG and FAAO incorporated the O3 modifications into the DSSAT/pDSSAT model code. SA, KB, LE, GH, and ACR provided insight on O3–crop interactions within the crop models. JE, IF, and DK provided technical support and guidance for the pSIMS/pDSSAT framework. JRG and JJ co-wrote the paper. All authors contributed to editing the paper.
The contact author has declared that none of the authors has any competing interests.
Publisher's note: Copernicus Publications remains neutral with regard to jurisdictional claims made in the text, published maps, institutional affiliations, or any other geographical representation in this paper. While Copernicus Publications makes every effort to include appropriate place names, the final responsibility lies with the authors.
The authors would like to thank Amy Betzelberger and Nicole Choquette for sharing the O3 field experiment data. Jose Rafael Guarin and Katrina Sharps would like to thank Stephanie Osborne for help with collecting the O3 exposure literature data. Contributions from Jose Rafael Guarin, Jonas Jägermeyr, and Alex C. Ruane were also enabled by the NASA Earth Science Division's support of the NASA GISS Climate Impacts group.
This research has been supported by the Open Philanthropy Project. Alex C. Ruane was funded by the NASA Earth Sciences Division support of the NASA GISS Climate Impacts Group.
This paper was edited by Klaus Klingmüller and reviewed by two anonymous referees.
Adams, R. M., Glyer, J. D., Johnson, S. L., and McCarl, B. A.: A reassessment of the economic effects of ozone on United States agriculture, J. Air Waste Manage. A., 39, 960–968, https://doi.org/10.1080/08940630.1989.10466583, 1989.
Ahmed, M., Stockle, C. O., Nelson, R., and Higgins, S.: Assessment of Climate Change and Atmospheric CO2 Impact on Winter Wheat in the Pacific Northwest Using a Multimodel Ensemble, Front. Ecol. Evol., 5, https://doi.org/10.3389/fevo.2017.00051, 2017.
Ahmed, M., Stockle, C. O., Nelson, R., Higgins, S., Ahmad, S., and Raza, M. A.: Novel multimodel ensemble approach to evaluate the sole effect of elevated CO2 on winter wheat productivity, Sci. Rep., 9, 7813., https://doi.org/10.1038/s41598-019-44251-x, 2019.
Ainsworth, E. A.: Understanding and improving global crop response to ozone pollution, Plant J., 90, 886–897, https://doi.org/10.1111/tpj.13298, 2017.
Arias, P. A., Bellouin, N., Coppola, E., Jones, R. G., Krinner, G., Marotzke, J., Naik, V., Palmer, M. D., Plattner, G.-K., Rogelj, J., Rojas, M., Sillmann, J., Storelvmo, T., Thorne, P. W., Trewin, B., Achuta Rao, K., Adhikary, B., Allan, R. P., Armour, K., Bala, G., Barimalala, R., Berger, S., Canadell, J. G., Cassou, C., Cherchi, A., Collins, W., Collins, W. D., Connors, S. L., Corti, S., Cruz, F., Dentener, F. J., Dereczynski, C., Di Luca, A., Diongue Niang, A., Doblas-Reyes, F. J., Dosio, A., Douville, H., Engelbrecht, F., Eyring, V., Fischer, E., Forster, P., Fox-Kemper, B., Fuglestvedt, J. S., Fyfe, J. C., Gillett, N. P., Goldfarb, L., Gorodetskaya, I., Gutierrez, J. M., Hamdi, R., Hawkins, E., Hewitt, H. T., Hope, P., Islam, A. S., Jones, C., Kaufman, D. S., Kopp, R. E., Kosaka, Y., Kossin, J., Krakovska, S., Lee, J.-Y., Li, J., Mauritsen, T., Maycock, T. K., Meinshausen, M., Min, S.-K., Monteiro, P. M. S., Ngo-Duc, T., Otto, F., Pinto, I., Pirani, A., Raghavan, K., Ranasinghe, R., Ruane, A. C., Ruiz, L., Sallée, J.-B., Samset, B. H., Sathyendranath, S., Seneviratne, S. I., Sörensson, A. A., Szopa, S., Takayabu, I., Tréguier, A.-M., van den Hurk, B., Vautard, R., von Schuckmann, K., Zaehle, S., Zhang, X., and Zickfeld, K.: Technical Summary, in: Climate Change 2021: The Physical Science Basis. Contribution of Working Group I to the Sixth Assessment Report of the Intergovernmental Panel on Climate Change, edited by: Masson-Delmotte, V., Zhai, P., Pirani, A., Connors, S. L., Péan, C., Berger, S., Caud, N., Chen, Y., Goldfarb, L., Gomis, M. I., Huang, M., Leitzell, K., Lonnoy, E., Matthews, J. B. R., Maycock, T. K., Waterfield, T., Yelekçi, O., Yu, R., and Zhou, B., Cambridge University Press, Cambridge, United Kingdom and New York, NY, USA, 33–144, https://doi.org/10.1017/9781009157896.002, 2021.
Asseng, S. and van Herwaarden, A. F.: Analysis of the benefits to wheat yield from assimilates stored prior to grain filling in a range of environments, Plant Soil, 256, 217–229, https://doi.org/10.1023/a:1026231904221, 2003.
Asseng, S., Jamieson, P. D., Kimball, B., Pinter, P., Sayre, K., Bowden, J. W., and Howden, S. M.: Simulated wheat growth affected by rising temperature, increased water deficit and elevated atmospheric CO2, Field Crops Res., 85, 85–102, https://doi.org/10.1016/s0378-4290(03)00154-0, 2004.
Asseng, S., Ewert, F., Martre, P., Rotter, R. P., Lobell, D. B., Cammarano, D., Kimball, B. A., Ottman, M. J., Wall, G. W., White, J. W., Reynolds, M. P., Alderman, P. D., Prasad, P. V. V., Aggarwal, P. K., Anothai, J., Basso, B., Biernath, C., Challinor, A. J., De Sanctis, G., Doltra, J., Fereres, E., Garcia-Vile, M., Gayler, S., Hoogenboom, G., Hunt, L. A., Izaurralde, R. C., Jabloun, M., Jones, C. D., Kersebaum, K. C., Koehler, A. K., Muller, C., Kumar, S. N., Nendel, C., O'Leary, G., Olesen, J. E., Palosuo, T., Priesack, E., Rezaei, E. E., Ruane, A. C., Semenov, M. A., Shcherbak, I., Stockle, C., Stratonovitch, P., Streck, T., Supit, I., Tao, F., Thorburn, P. J., Waha, K., Wang, E., Wallach, D., Wolf, I., Zhao, Z., and Zhu, Y.: Rising temperatures reduce global wheat production, Nat. Clim. Change, 5, 143–147, https://doi.org/10.1038/nclimate2470, 2015.
Bassu, S., Brisson, N., Durand, J. L., Boote, K., Lizaso, J., Jones, J. W., Rosenzweig, C., Ruane, A. C., Adam, M., Baron, C., Basso, B., Biernath, C., Boogaard, H., Conijn, S., Corbeels, M., Deryng, D., De Sanctis, G., Gayler, S., Grassini, P., Hatfield, J., Hoek, S., Izaurralde, C., Jongschaap, R., Kemanian, A. R., Kersebaum, K. C., Kim, S. H., Kumar, N. S., Makowski, D., Muller, C., Nendel, C., Priesack, E., Pravia, M. V., Sau, F., Shcherbak, I., Tao, F., Teixeira, E., Timlin, D., and Waha, K.: How do various maize crop models vary in their responses to climate change factors?, Global Change Biol., 20, 2301–2320, https://doi.org/10.1111/gcb.12520, 2014.
Betzelberger, A. M., Yendrek, C. R., Sun, J. D., Leisner, C. P., Nelson, R. L., Ort, D. R., and Ainsworth, E. A.: Ozone Exposure Response for U.S. Soybean Cultivars: Linear Reductions in Photosynthetic Potential, Biomass, and Yield, Plant Physiol., 160, 1827–1839, https://doi.org/10.1104/pp.112.205591, 2012.
Biswas, D. K., Xu, H., Li, Y. G., Ma, B. L., and Jiang, G. M.: Modification of photosynthesis and growth responses to elevated CO2 by ozone in two cultivars of winter wheat with different years of release, J. Exp. Bot., 64, 1485–1496, https://doi.org/10.1093/jxb/ert005, 2013.
Boote, K. J. and Pickering, N. B.: Modeling photosynthesis of row crop canopies, Hortscience, 29, 1423–1434, https://doi.org/10.21273/hortsci.29.12.1423, 1994.
Calabrese, E. J.: Hormesis: a fundamental concept in biology, Microb. Cell, 1, 145–149, https://doi.org/10.15698/mic2014.05.145, 2014.
Choquette, N. E., Ainsworth, E. A., Bezodis, W., and Cavanagh, A. P.: Ozone tolerant maize hybrids maintain Rubisco content and activity during long-term exposure in the field, Plant Cell Environ., 43, 3033–3047, https://doi.org/10.1111/pce.13876, 2020.
Cooper, O. R., Parrish, D. D., Ziemke, J., Balashov, N. V., Cupeiro, M., Galbally, I. E., Gilge, S., Horowitz, L., Jensen, N. R., Lamarque, J.-F., Naik, V., Oltmans, S. J., Schwab, J., Shindell, D. T., Thompson, A. M., Thouret, V., Wang, Y., and Zbinden, R. M.: Global distribution and trends of tropospheric ozone: An observation-based review, Elementa Science of the Anthropocene, 2, 000029, https://doi.org/10.12952/journal.elementa.000029, 2014.
Elliott, J., Kelly, D., Chryssanthacopoulos, J., Glotter, M., Jhunjhnuwala, K., Best, N., Wilde, M., and Foster, I.: The parallel system for integrating impact models and sectors (pSIMS), Environ. Model. Softw., 62, 509–516, https://doi.org/10.1016/j.envsoft.2014.04.008, 2014.
Emberson, L.: Effects of ozone on agriculture, forests and grasslands, Philos. T. Roy. Soc. A, 378, 27, https://doi.org/10.1098/rsta.2019.0327, 2020.
Emberson, L. D., Pleijel, H., Ainsworth, E. A., van den Berg, M., Ren, W., Osborne, S., Mills, G., Pandey, D., Dentener, F., Buker, P., Ewert, F., Koeble, R., and Van Dingenen, R.: Ozone effects on crops and consideration in crop models, Eur. J. Agron., 100, 19–34, https://doi.org/10.1016/j.eja.2018.06.002, 2018.
Feng, Z. Z. and Kobayashi, K.: Assessing the impacts of current and future concentrations of surface ozone on crop yield with meta-analysis, Atmos. Environ., 43, 1510–1519, https://doi.org/10.1016/j.atmosenv.2008.11.033, 2009.
Feng, Z. Z., Xu, Y. S., Kobayashi, K., Dai, L. L., Zhang, T. Y., Agathokleous, E., Calatayud, V., Paoletti, E., Mukherjee, A., Agrawal, M., Park, R. J., Oak, Y. J., and Yue, X.: Ozone pollution threatens the production of major staple crops in East Asia, Nature Food, 3, 47, https://doi.org/10.1038/s43016-021-00422-6, 2022.
Griffiths, P. T., Murray, L. T., Zeng, G., Shin, Y. M., Abraham, N. L., Archibald, A. T., Deushi, M., Emmons, L. K., Galbally, I. E., Hassler, B., Horowitz, L. W., Keeble, J., Liu, J., Moeini, O., Naik, V., O'Connor, F. M., Oshima, N., Tarasick, D., Tilmes, S., Turnock, S. T., Wild, O., Young, P. J., and Zanis, P.: Tropospheric ozone in CMIP6 simulations, Atmos. Chem. Phys., 21, 4187–4218, https://doi.org/10.5194/acp-21-4187-2021, 2021.
Guarin, J. R., Kassie, B., Mashaheet, A. M., Burkey, K., and Asseng, S.: Modeling the effects of tropospheric ozone on wheat growth and yield, Eur. J. Agron., 105, 13–23, https://doi.org/10.1016/j.eja.2019.02.004, 2019.
Guarin, J. R., Jägermeyr, J., Ainsworth, E. A., Oliveira, F. A. A., Asseng, S., Boote, K., Elliott, J., Emberson, L., Foster, I., Hoogenboom, G., Kelly, D., Ruane, A. C., and Sharps, K.: Data for modeling the effects of tropospheric ozone on the growth and yield of global staple crops with DSSAT v4.8.0, V2, Harvard Dataverse [data set], https://doi.org/10.7910/DVN/0NN9MH, 2023.
Heck, W. W., Cure, W. W., Rawlings, J. O., Zaragoza, L. J., Heagle, A. S., Heggestad, H. E., Kohut, R. J., Kress, L. W., and Temple, P. J.: Assessing impacts of ozone on agricultural crops: 2. Crop yield functions and alternative exposure statistics, J. Air Pollut. Control A., 34, 810–817, https://doi.org/10.1080/00022470.1984.10465815, 1984.
Hoogenboom, G., Porter, C. H., Boote, K. J., Shelia, V., Wilkens, P. W., Singh, U., White, J. W., Asseng, S., Lizaso, J. I., Moreno, L. P., Pavan, W., Ogoshi, R., Hunt, L. A., Tsuji, G. Y., and Jones, J. W.: The DSSAT crop modeling ecosystem, in: Advances in Crop Modeling for a Sustainable Agriculture, edited by: Boote, K. J., Burleigh Dodds Science Publishing, Cambridge, United Kingdom, 173–216, https://doi.org/10.19103/AS.2019.0061.10, 2019.
Hoogenboom, G., Porter, C. H., Shelia, V., Boote, K. J., Singh, U., White, J. W., Pavan, W., Oliveira, F. A. A., Moreno-Cadena, L. P., Lizaso, J. I., Asseng, S., Pequeno, D. N. L., Kimball, B. A., Alderman, P. D., Thorp, K. R., Jones, M. R., Cuadra, S. V., Vianna, M. S., Villalobos, F. J., Ferreira, T. B., Batchelor, W. D., Koo, J., Hunt, L. A., and Jones, J. W.: Decision Support System for Agrotechnology Transfer (DSSAT) Version 4.8, DSSAT Foundation, Gainesville, Florida, USA [code], http://www.DSSAT.net (last access: 28 March 2024), 2021.
Hou, P. and Wu, S. L.: Long-term Changes in Extreme Air Pollution Meteorology and the Implications for Air Quality, Sci. Rep., 6, 23792, https://doi.org/10.1038/srep23792, 2016.
Hunsaker, D. J., Kimball, B. A., Pinter, P. J., LaMorte, R. L., and Wall, G. W.: Carbon dioxide enrichment and irrigation effects on wheat evapotranspiration and water use efficiency, Transactions of the Asae, 39, 1345–1355, 1996.
IPCC: Climate Change 2021: The Physical Science Basis. Contribution of Working Group I to the Sixth Assessment Report of the Intergovernmental Panel on Climate Change, edited by: Masson-Delmotte, V., Zhai, P., Pirani, A., Connors, S. L., Péan, C., Berger, S., Caud, N., Chen, Y., Goldfarb, L., Gomis, M. I., Huang, M., Leitzell, K., Lonnoy, E., Matthews, J. B. R., Maycock, T. K., Waterfield, T., Yelekçi, O., Yu, R., and Zhou, B., Cambridge University Press, Cambridge, United Kingdom and New York, NY, USA, 2391, https://doi.org/10.1017/9781009157896, 2021.
Jagermeyr, J., Muller, C., Ruane, A. C., Elliott, J., Balkovic, J., Castillo, O., Faye, B., Foster, I., Folberth, C., Franke, J. A., Fuchs, K., Guarin, J. R., Heinke, J., Hoogenboom, G., Iizumi, T., Jain, A. K., Kelly, D., Khabarov, N., Lange, S., Lin, T. S., Liu, W. F., Mialyk, O., Minoli, S., Moyer, E. J., Okada, M., Phillips, M., Porter, C., Rabin, S. S., Scheer, C., Schneider, J. M., Schyns, J. F., Skalsky, R., Smerald, A., Stella, T., Stephens, H., Webber, H., Zabel, F., and Rosenzweig, C.: Climate impacts on global agriculture emerge earlier in new generation of climate and crop models, Nature Food, 2, 875, https://doi.org/10.1038/s43016-021-00400-y, 2021.
Jones, C. A. and Kiniry, J. R. (Eds.): CERES-Maize: A simulation model of maize growth and development, Texas A&M University Press, College Station, TX, ISBN 0890962693, 1986.
Jones, J. W., Hoogenboom, G., Porter, C. H., Boote, K. J., Batchelor, W. D., Hunt, L. A., Wilkens, P. W., Singh, U., Gijsman, A. J., and Ritchie, J. T.: The DSSAT cropping system model, Eur. J. Agron., 18, 235–265, https://doi.org/10.1016/s1161-0301(02)00107-7, 2003.
Khan, S. and Soja, G.: Yield responses of wheat to ozone exposure as modified by drought-induced differences in ozone uptake, Water Air Soil Pollut., 147, 299–315, https://doi.org/10.1023/a:1024577429129, 2003.
Kimball, B. A., LaMorte, R. L., Pinter, P. J., Wall, G. W., Hunsaker, D. J., Adamsen, F. J., Leavitt, S. W., Thompson, T. L., Matthias, A. D., and Brooks, T. J.: Free-air CO2 enrichment and soil nitrogen effects on energy balance and evapotranspiration of wheat, Water Resour. Res., 35, 1179–1190, https://doi.org/10.1029/1998wr900115, 1999.
Kimball, B. A., Pinter Jr., P. J., LaMorte, R. L., Leavitt, S. W., Hunsaker, D. J., Wall, G. W., Wechsung, F., Wechsung, G., Bloom, A. J., and White, J. W.: Data from the Arizona FACE (free-air CO2 enrichment) experiments on wheat at ample and limiting levels of water and nitrogen, Open Data J. Agric. Res., 3, 29–38, https://doi.org/10.18174/odjar.v3i1.15826, 2017.
Kothari, K., Battisti, R., Boote, K. J., Archontoulis, S. V., Confalone, A., Constantin, J., Cuadra, S. V., Debaeke, P., Faye, B., Grant, B., Hoogenboom, G., Jing, Q., van der Laan, M., da Silva, F. A. M., Marin, F. R., Nehbandani, A., Nendel, C., Purcell, L. C., Qian, B. D., Ruane, A. C., Schoving, C., Silva, E., Smith, W., Soltani, A., Srivastava, A., Vieira, N. A., Slone, S., and Salmeron, M.: Are soybean models ready for climate change food impact assessments?, Eur. J. Agron., 135, 15, https://doi.org/10.1016/j.eja.2022.126482, 2022.
Lesser, V. M., Rawlings, J. O., Spruill, S. E., and Somerville, M. C.: Ozone effects on agricultural crops: Statistical methodologies and estimated dose-response relationships, Crop Sci., 30, 148–155, https://doi.org/10.2135/cropsci1990.0011183X003000010033x, 1990.
Leung, F., Williams, K., Sitch, S., Tai, A. P. K., Wiltshire, A., Gornall, J., Ainsworth, E. A., Arkebauer, T., and Scoby, D.: Calibrating soybean parameters in JULES 5.0 from the US-Ne2/3 FLUXNET sites and the SoyFACE-O3 experiment, Geosci. Model Dev., 13, 6201–6213, https://doi.org/10.5194/gmd-13-6201-2020, 2020.
Li, T., Hasegawa, T., Yin, X. Y., Zhu, Y., Boote, K., Adam, M., Bregaglio, S., Buis, S., Confalonieri, R., Fumoto, T., Gaydon, D., Marcaida, M., Nakagawa, H., Oriol, P., Ruane, A. C., Ruget, F., Singh, B., Singh, U., Tang, L., Tao, F. L., Wilkens, P., Yoshida, H., Zhang, Z., and Bouman, B.: Uncertainties in predicting rice yield by current crop models under a wide range of climatic conditions, Global Change Biol., 21, 1328–1341, https://doi.org/10.1111/gcb.12758, 2015.
Mills, G., Sharps, K., Simpson, D., Pleijel, H., Broberg, M., Uddling, J., Jaramillo, F., Davies, W. J., Dentener, F., Van den Berg, M., Agrawal, M., Agrawal, S. B., Ainsworth, E. A., Buker, P., Emberson, L., Feng, Z. Z., Harmens, H., Hayes, F., Kobayashi, K., Paoletti, E., and Van Dingenen, R.: Ozone pollution will compromise efforts to increase global wheat production, Global Change Biol., 24, 3560–3574, https://doi.org/10.1111/gcb.14157, 2018a.
Mills, G., Sharps, K., Simpson, D., Pleijel, H., Frei, M., Burkey, K., Emberson, L., Uddling, J., Broberg, M., Feng, Z. Z., Kobayashi, K., and Agrawal, M.: Closing the global ozone yield gap: Quantification and cobenefits for multistress tolerance, Global Change Biol., 24, 4869–4893, https://doi.org/10.1111/gcb.14381, 2018b.
Morris, M. D.: Factorial sampling plans for preliminary computational experiments, Technometrics, 33, 161–174, https://doi.org/10.2307/1269043, 1991.
Mulchi, C. L., Lee, E., Tuthill, K., and Olinick, E. V.: Influence of ozone stress on growth-processes, yields and grain quality characteristics among soybean cultivars, Environ. Pollut., 53, 151–169, https://doi.org/10.1016/0269-7491(88)90031-0, 1988.
NRCS, S. S. S.: Natural Resources Conservation Service, United States Department of Agriculture, Web Soil Survey [data set], https://websoilsurvey.nrcs.usda.gov/app/ (last access: 20 January 2023), 2023.
Osborne, S. A., Mills, G., Hayes, F., Ainsworth, E. A., Buker, P., and Emberson, L.: Has the sensitivity of soybean cultivars to ozone pollution increased with time? An analysis of published dose-response data, Global Change Biol., 22, 3097–3111, https://doi.org/10.1111/gcb.13318, 2016.
Porter, C., Hoogenboom, G., Murilodsv, Pavan, W., Ferreira, T. B., Zhang, M., palderman, Thorp, K., Guarin, J., Mulugetaifdc, Vásquez-Jiménez, J., Villalobos, C., Clifford, D., YujingGao-git, singhu, and vshelia: jguarin4/dssat-csm-os: v4.8.0.27-pDSSAT-archive (v4.8.0.27_pDSSAT-archive), Zenodo [code], https://doi.org/10.5281/zenodo.8284732, 2023.
R Core Team: R: a language and environment for statistical computing, R Core Team [code], https://www.R-project.org/ (last access: 28 March 2024), 2023.
RDCEP: pSIMS, RDCEP [code], http://www.rdcep.org/research-projects/psims (last access: 28 March 2024), 2024.
Ritchie, J. T., Alocilja, E. C., Singh, U., and Uehara, G.: IBSNAT and the CERES-RICE model, in: Weather and Rice, Proceedings of the International Workshop on The Impact of Weather Parameters on Growth and Yield of Rice, IRRI, Philippines, 271–283, 1987.
Rosenzweig, C., Jones, J. W., Hatfield, J. L., Ruane, A. C., Boote, K. J., Thorburne, P., Antle, J. M., Nelson, G. C., Porter, C., Janssen, S., Asseng, S., Basso, B., Ewert, F., Wallach, D., Baigorria, G., and Winter, J. M.: The Agricultural Model Intercomparison and Improvement Project (AgMIP): Protocols and pilot studies, Agric. Forest Meteorol., 170, 166–182, https://doi.org/10.1016/j.agrformet.2012.09.011, 2013.
Sampedro, J., Waldhoff, S. T., Van de Ven, D. J., Pardo, G., Van Dingenen, R., Arto, I., del Prado, A., and Sanz, M. J.: Future impacts of ozone driven damages on agricultural systems, Atmos. Environ., 231, 11, https://doi.org/10.1016/j.atmosenv.2020.117538, 2020.
Schauberger, B., Rolinski, S., Schaphoff, S., and Muller, C.: Global historical soybean and wheat yield loss estimates from ozone pollution considering water and temperature as modifying effects, Agric. Forest Meteorol., 265, 1–15, https://doi.org/10.1016/j.agrformet.2018.11.004, 2019.
Schiferl, L. D. and Heald, C. L.: Particulate matter air pollution may offset ozone damage to global crop production, Atmos. Chem. Phys., 18, 5953–5966, https://doi.org/10.5194/acp-18-5953-2018, 2018.
Simpson, D., Arneth, A., Mills, G., Solberg, S., and Uddling, J.: Ozone – the persistent menace: interactions with the N cycle and climate change, Curr. Opin. Env. Sust., 9–10, 9–19, https://doi.org/10.1016/j.cosust.2014.07.008, 2014.
Szopa, S., Naik, V., Adhikary, B., Artaxo, P., Berntsen, T., Collins, W. D., Fuzzi, S., Gallardo, L., Kiendler-Scharr, A., Klimont, Z., Liao, H., Unger, N., and Zanis, P.: 2021: Short-Lived Climate Forcers, in: Climate Change 2021: The Physical Science Basis. Contribution of Working Group I to the Sixth Assessment Report of the Intergovernmental Panel on Climate Change, edited by: Masson-Delmotte, V., Zhai, P., Pirani, A., Connors, S. L., Péan, C., Berger, S., Caud, N., Chen, Y., Goldfarb, L., Gomis, M. I., Huang, M., Leitzell, K., Lonnoy, E., Matthews, J. B. R., Maycock, T. K., Waterfield, T., Yelekçi, O., Yu, R., and Zhou, B., Cambridge University Press, Cambridge, United Kingdom and New York, NY, USA, 817–922, https://doi.org/10.1017/9781009157896.008, 2021.
Tai, A. P. K., Sadiq, M., Pang, J. Y. S., Yung, D. H. Y., and Feng, Z. Z.: Impacts of Surface Ozone Pollution on Global Crop Yields: Comparing Different Ozone Exposure Metrics and Incorporating Co-effects of CO2, Front. Sust. Food Syst., 5, 18, https://doi.org/10.3389/fsufs.2021.534616, 2021.
Toreti, A., Deryng, D., Tubiello, F. N., Muller, C., Kimball, B. A., Moser, G., Boote, K., Asseng, S., Pugh, T. A. M., Vanuytrecht, E., Pleijel, H., Webber, H., Durand, J. L., Dentener, F., Ceglar, A., Wang, X. H., Badeck, F., Lecerf, R., Wall, G. W., van den Berg, M., Hoegy, P., Lopez-Lozano, R., Zampieri, M., Galmarini, S., O'Leary, G. J., Manderscheid, R., Contreras, E. M., and Rosenzweig, C.: Narrowing uncertainties in the effects of elevated CO2 on crops, Nature Food, 1, 775–782, https://doi.org/10.1038/s43016-020-00195-4, 2020.
USDA NASS: Field crops usual planting and harvest dates (October 2010), Agricultural Handbook Number 628, https://usda.library.cornell.edu/concern/publications/vm40xr56k (last access: 20 January 2023), 2010.
Wang, X. P. and Mauzerall, D. L.: Characterizing distributions of surface ozone and its impact on grain production in China, Japan and South Korea: 1990 and 2020, Atmos. Environ., 38, 4383–4402, https://doi.org/10.1016/j.atmosenv.2004.03.067, 2004.
Wickham, H.: ggplot2: Elegant Graphics for Data Analysis, Springer-Verlag NY [code], ISBN 978-3-319-24277-4, https://ggplot2.tidyverse.org (last access: 28 March 2024), 2016.
Wickham, H., François, R., Henry, L., Müller, K., and Vaughan, D.: dplyr: A Grammar of Data Manipulation, R package version 1.1.2, GitHub [code], https://github.com/tidyverse/dplyr (last access: 28 March 2024), 2023.
Wilkerson, G. G., Jones, J. W., Boote, K. J., Ingram, K. T., and Mishoe, J. W.: Modeling soybean growth for crop management, Transactions of the Asae, 26, 63–73, 1983.
Xia, L. L., Lam, S. K., Kiese, R., Chen, D. L., Luo, Y. Q., van Groenigen, K. J., Ainsworth, E. A., Chen, J., Liu, S. W., Ma, L., Zhu, Y. H., and Butterbach-Bahl, K.: Elevated CO2 negates O3 impacts on terrestrial carbon and nitrogen cycles, One Earth, 4, 1752–1763, https://doi.org/10.1016/j.oneear.2021.11.009, 2021.
Zhang, Y. Z. and Wang, Y. H.: Climate-driven ground-level ozone extreme in the fall over the Southeast United States, P. Natl. Acad. Sci. USA, 113, 10025–10030, https://doi.org/10.1073/pnas.1602563113, 2016.