the Creative Commons Attribution 4.0 License.
the Creative Commons Attribution 4.0 License.
 | 16 Feb 2024
Benchmarking GOCART-2G in the Goddard Earth Observing System (GEOS)
Allison B. Collow
Peter R. Colarco
Arlindo M. da Silva
Virginie Buchard
Huisheng Bian
Mian Chin
Sampa Das
Ravi Govindaraju
Dongchul Kim
Valentina Aquila
The Goddard Chemistry Aerosol Radiation and Transport (GOCART) model, which controls the sources, sinks, and chemistry of aerosols within the Goddard Earth Observing System (GEOS), recently underwent a major refactoring and update, including a revision of the emissions datasets and the addition of brown carbon. A 4-year benchmark simulation utilizing the new version of the model code, termed GOCART Second Generation (GOCART-2G) and coupled to the Goddard Earth Observing System (GEOS) model, was evaluated using in situ and spaceborne measurements to develop a baseline and prioritize future development. A comparison of simulated aerosol optical depth between GOCART-2G and MODIS retrievals indicates the model captures the overall spatial pattern and seasonal cycle of aerosol optical depth but overestimates aerosol extinction over dusty regions and underestimates aerosol extinction over Northern Hemisphere boreal forests, requiring further investigation and tuning of emissions. This MODIS-based analysis is corroborated by comparisons to MISR and selected AERONET stations; however, discrepancies between the Aqua and Terra satellites indicate there is a diurnal component to biases in aerosol optical depth over southern Asia and northern Africa. Despite the underestimate of aerosol optical depth in biomass burning regions in GEOS, there is an overestimate in the surface mass of organic carbon in the United States, especially during the summer months. Over Europe, GOCART-2G is unable to match the summertime peak in aerosol optical depth, opposing the observed late fall and early spring peaks in surface mass concentration. A comparison of the vertical profile of attenuated backscatter to observations from CALIPSO indicates the GEOS model is capable of capturing the vertical profile of aerosol; however, the mid-troposphere plumes of dust in the North Atlantic and smoke in the southeastern Atlantic are perhaps too low in altitude. The results presented highlight priorities for future development with GOCART-2G, including improvements for dust, biomass burning aerosols, and anthropogenic aerosols.
- Article
(3181 KB) - Full-text XML
-
Supplement
(4059 KB) - BibTeX
- EndNote


Aerosols are an important component of the atmosphere, with implications for air quality, cloud lifecycle, and the radiation budget. As general circulation models strive to take a comprehensive Earth system approach, aerosol modules have become coupled to the atmosphere for use in numerical weather prediction (Colarco et al., 2010; Rémy et al., 2019), seasonal prediction (Molod et al., 2020), and reanalyses (Buchard et al., 2017; Randles et al., 2017) and have been shown to increase forecast skill through changes in temperature (Bozzo et al., 2020). Aerosol modules handle the sources, sinks, and chemistry within models; however, they vary in complexity and their diverse assumptions result in uncertainty and diversity in the simulated aerosol life cycle and optical properties (Textor et al., 2006; Tsigaridis et al., 2014; Gliß et al., 2021). A commonly used bulk aerosol module is the Goddard Chemistry Aerosol Radiation and Transport (GOCART) module, which traces its origin to an offline aerosol transport model driven by the assimilated meteorological fields from the Goddard Earth Observing System (GEOS; Chin et al., 2002, 2004). GOCART was later coupled to GEOS to enable short-term aerosol forecasts and provide a platform for aerosol data assimilation (Colarco et al., 2010). It has also been implemented in NOAA's Unified Forecast System (Lu et al., 2016; Zhang et al., 2022) and the Weather Research and Forecasting Model (WRF). In its legacy form, GOCART has handled the aerosols within the GEOS model and its individual systems. Near-real-time aerosol forecasts began in GEOS Forward Processing (FP) in 2011 (Fig. S1 in the Supplement), though GOCART had previously been used within GEOS for field campaign support. An aerosol analysis has been produced retrospectively in reanalysis systems such as the Modern Era Retrospective Analysis for Research and Applications, version 2 (MERRA-2, Randles et al., 2017; Buchard et al., 2017), and GOCART is included in the subseasonal-to-season forecast system, GEOS S2S (Molod et al., 2020). This paper serves to outline updates that have been implemented in GOCART since the production of MERRA-2, including a suite of science changes and code improvements that encompass GOCART second generation (GOCART-2G). GOCART-2G is intended to be used in future versions of GEOS numerical weather prediction, subseasonal-to-seasonal prediction, and reanalysis products. Although GEOS is a modular system that can be run with other aerosol modules for research purposes (e.g., Case et al., 2023), sectional and modal schemes are too computationally expensive to be used in a near-real-time, operational environment. Therefore, proper documentation and evaluation for GOCART-2G is a necessity.
Embedded within the GEOS model, GOCART has participated in aerosol model intercomparison studies associated with AeroCom and is included in the International Cooperative for Aerosol Prediction (ICAP) multi-model ensemble (MME) (Xian et al., 2019). Notable features of the module have been documented in the literature as a result. The all-sky aerosol optical depth (AOD) in GEOS-GOCART is very close to the median for the models that participated in AeroCom Phase III; however, there is variability among the aerosol species (Gliß et al., 2021). The optical depth and mass burden for nitrate and dust in GEOS-GOCART is above the AeroCom Phase III model median. In fact, the burden for nitrate in GEOS-GOCART was the highest among the AeroCom models (Gliß et al., 2021). Focusing on African dust, Kim et al. (2014) showed that GOCART had over double the dust emissions from all other models investigated, leading to an overestimate of AOD over northern Africa yet and underestimated AOD in the transport region of the North Atlantic. Yu et al. (2021) noted that GEOS underestimated emissions of dust from haboobs and did not loft dust high enough into the middle troposphere for sufficient transport, resulting in an underestimate of the dust AOD in the Caribbean during a substantial dust event in June 2020. It was also pointed out by Kramer et al. (2020) that transported dust is overabundant in the boundary layer and has a particle size that is too large. Concerns have also been documented for organic aerosol, which was shown to have a median burden on par with other AeroCom models yet an optical depth and mass extinction coefficient over 10 % larger than the participating aerosol models (Gliß et al., 2021). Corroborated with respect to observations by Collow et al. (2022), Burgos et al. (2020) demonstrated that GEOS-GOCART has an excessive hygroscopic growth rate for carbonaceous aerosol and a smaller variability for f(RH) relative to the other participating models. This indicates that even if the mass burden is the same, the optical depth could be very different from other models solely due to relative humidity and vice versa.
As described in Sect. 2, a recent overhaul of the GOCART module has been completed to pave the way for future development of the aerosol module. A 4-year simulation is then evaluated in Sect. 4 to benchmark the performance of GOCART-2G and provide a reference for future development of aerosol modeling within GEOS. One major difference between the evaluation presented here compared to prior evaluations of aerosols within GEOS from the MERRA-2 system (Randles et al., 2017; Buchard et al., 2017) is that here aerosol optical depth (AOD) is not assimilated as in Colarco et al. (2010). While meteorology is constrained in the benchmark simulation, no aerosol data assimilation is included, and aerosol distributions are governed solely by processes in the model.
2.1 Background
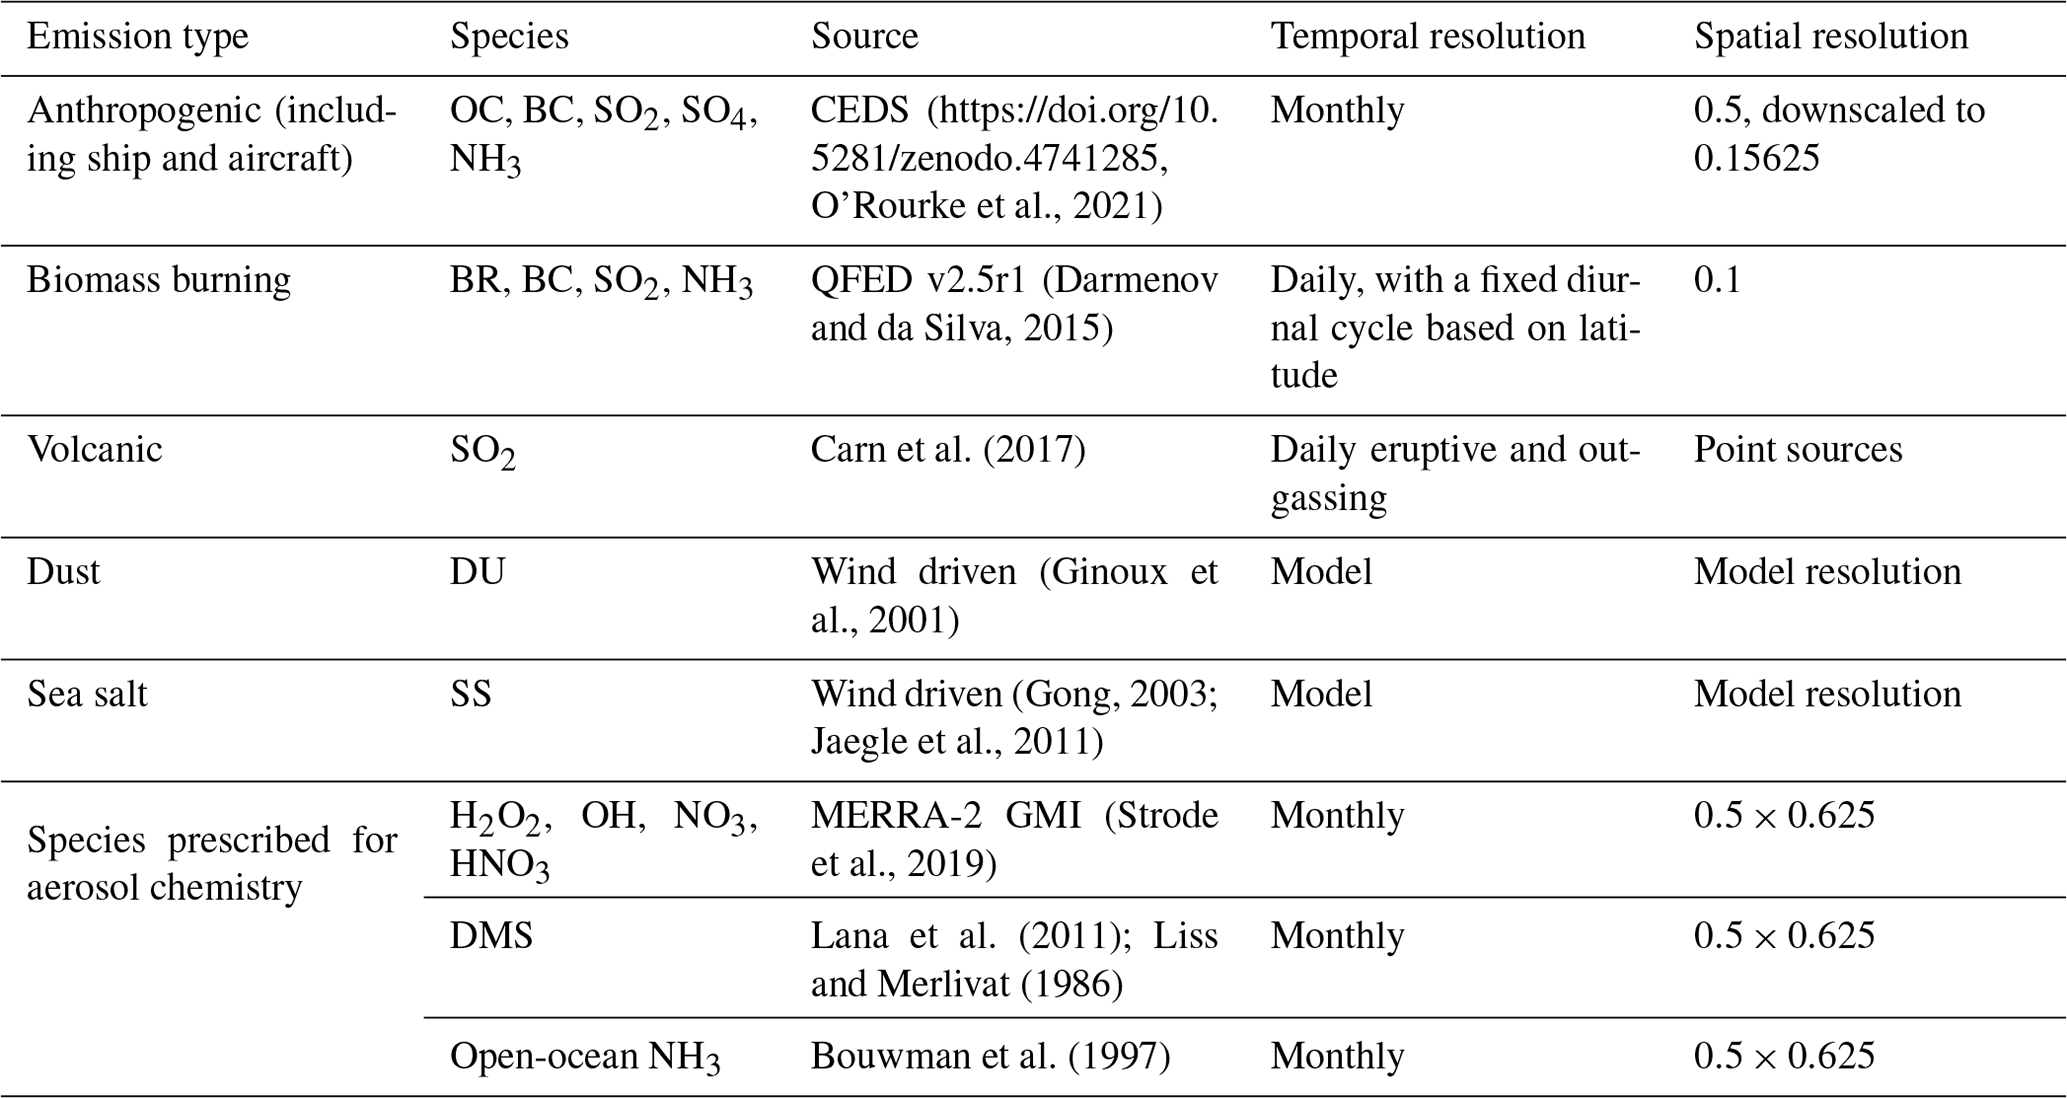
GOCART-2G includes seven radiatively active aerosol tracers that are considered externally mixed: sea salt, dust, organic carbon, brown carbon, black carbon, sulfate, and nitrate. Like in MERRA-2, sea salt (SS) and dust (DU) are comprised of five non-interacting size bins (Table A1). Sea salt emissions are based on Gong (2003), with the following key modifications: (1) friction velocity is used instead of 10 m wind speed, which required tuning for the constants within the parameterization, and (2) addition of a correction term dependent on sea surface temperature, similar to the work of Jaegle et al. (2011) but tuned to improve the agreement of simulated sea salt AOD with MODIS retrieved AOD. Default dust emissions follow Ginoux et al. (2001); see Table 1. Organic (OC), brown (BR), and black (BC) carbon have hydrophobic and hydrophilic components. Upon emission, 50 % of organic carbon, 50 % of brown carbon, and 80 % of black carbon are considered hydrophobic (Chin et al., 2002) and transition to hydrophilic at an e-folding timescale of 2.5 d (Maria et al., 2004). A factor of 1.8 is implemented upon emission to convert organic carbon, including the tracer for brown carbon, to particulate organic matter (POM), which has been increased from the factor of 1.4 used in MERRA-2 based on observations from recent airborne campaigns (Hodzic et al., 2020). Emission sources of carbonaceous aerosol include biomass burning, biogenic, and anthropogenic emissions. Biomass burning emissions are released uniformly throughout the planetary boundary layer (PBL) depth, while anthropogenic emissions enter only in the lowest model level. While the source data for biomass burning emissions is consistent with MERRA-2 (the Quick Fire Emissions Dataset, QFED; Darmenov and da Silva, 2015), anthropogenic emissions now come from the Community Emissions Data System (CEDS) v_2021_04_21 (Table 1; Hoesly et al., 2018; https://doi.org/10.5281/zenodo.4741285, O'Rourke et al., 2021); currently CEDS emissions are available up to 2019. The CEDS emissions dataset was chosen to be consistent with other modeling efforts including the Coupled Model Intercomparison Project Phase 6 (CMIP6; Feng et al., 2020) and the Chemistry-Climate Model Initiative. Additional information is provided in the Supplement pertaining to the implementation of brown carbon and secondary organic aerosol (SOA) as these tracers were added as part of GOCART-2G.
A single tracer is used for the sulfate ion, SO. Volcanic emissions of SO2 are from Carn et al. (2017) with explosive emissions updated through 2021 as of this writing, while biomass burning and anthropogenic emissions of SO2 and SO are consistent with the carbon emissions (Table 1). Sulfate chemistry follows Chin et al. (2000) in which sulfate is formed from the oxidation of SO2 and the precursor dimethyl sulfide (DMS) in the presence of hydroxide (OH) and NO3 and aqueously via titration of hydrogen peroxide (H2O2). In a traditional GOCART-2G simulation, these oxidant fields are provided in archived monthly data from previous full chemistry simulations, and the diurnal cycle is imposed on the OH field. GOCART-2G can also run interactively with a gas chemistry module in which these oxidant fields are updated at every time step.
Nitrate was incorporated into GEOS in 2017, after production began for MERRA-2, based on the approach used for the Global Modeling Initiative (GMI) chemistry transport model (CTM) (Bian et al., 2017). Three particle size groups are included for nitrate aerosol in GOCART-2G: a fine-mode bin and two coarse-mode bins (Table 1 in Bian et al., 2017). The fine-mode bin for nitrate is simulated using the thermodynamic equilibrium model Regional Particulate Model Aerosol Reacting System (RPMARES) (Saxena et al., 1986) for the gas phase, aqueous chemical cycling of nitrate gas–aerosol partitioning in a system of SO–NO–NH–H2O (Table 2 in Bian et al., 2017), and a first-order heterogenous reaction of HNO3 on mineral dust and sea salt. The two coarse-mode bins form from heterogenous production only. Additional tracers are included for ammonia (NH3) and the ammonium ion (NH) that are necessary for the SO–NO–NH–H2O system. Biomass burning, anthropogenic, and oceanic emissions of NH3 are prescribed from emission datasets (Table 2). Precursor gases for sulfate and nitrate are prescribed based on a prior GEOS simulation that was coupled to the GMI stratosphere–troposphere chemical mechanism and constrained by MERRA-2 meteorology (MERRA-2 GMI; Strode et al., 2019).
Table 1Summary of aerosol emissions in the GOCART-2G benchmark simulation. GOCART-2G can be run with differing emissions sources and dataset resolutions if desired.
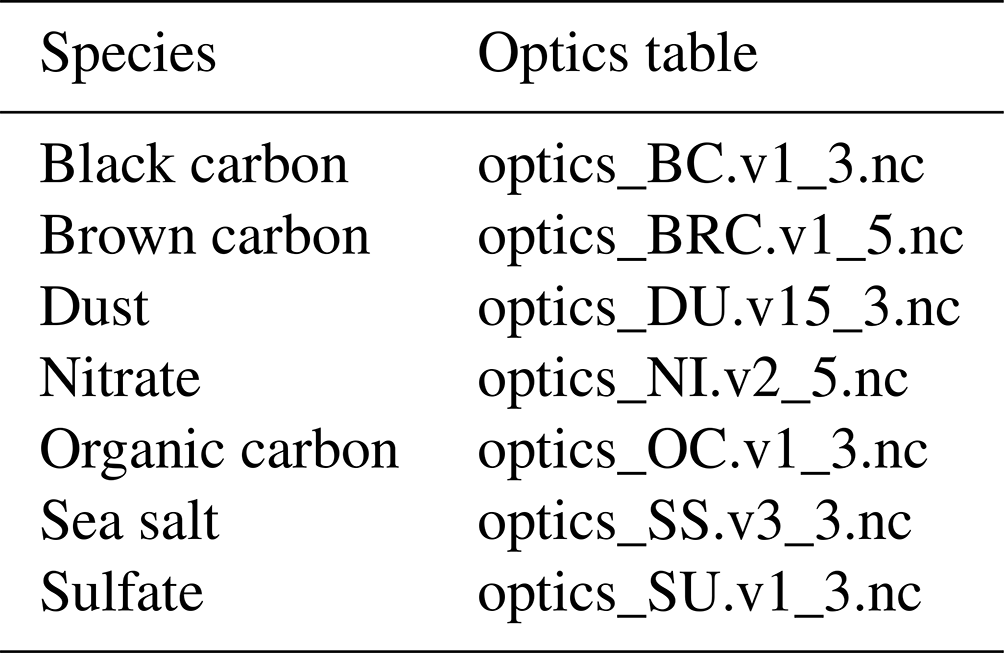
Optics lookup tables (LUTs) to convert from the simulated aerosol masses to optical quantities such as aerosol optical depth (AOD) are derived from Mie (spherical) calculations using parameters from the Optical Properties of Aerosols and Clouds (OPAC; Hess et al., 1998) and as described in Chin et al. (2002) and Colarco et al. (2010), except for dust, which is based on Colarco et al. (2014), and for brown carbon (see below). Optical properties are a function of aerosol species, particle size, and relative humidity (except for dust which is assumed hydrophobic). From an optics perspective, hygroscopic growth occurs based on a specified growth factor as listed in the Appendices of Kemppinen et al. (2022). The resulting optics tables are available for download at https://portal.nccs.nasa.gov/datashare/iesa/aerosol/AerosolOptics/ (last access: 5 December 2022), and the versions used in the initial release of GOCART-2G are given in Table A2. These high spectral resolution tables are useful for computing diagnostic optical quantities like AOD and backscatter, as shown later. They are also available in an aggregated format to provide optical properties needed to compute aerosol forcing at the spectral bands used in the model's radiative transfer code, RRTMG (Clough et al., 2005; Iacono et al., 2008).
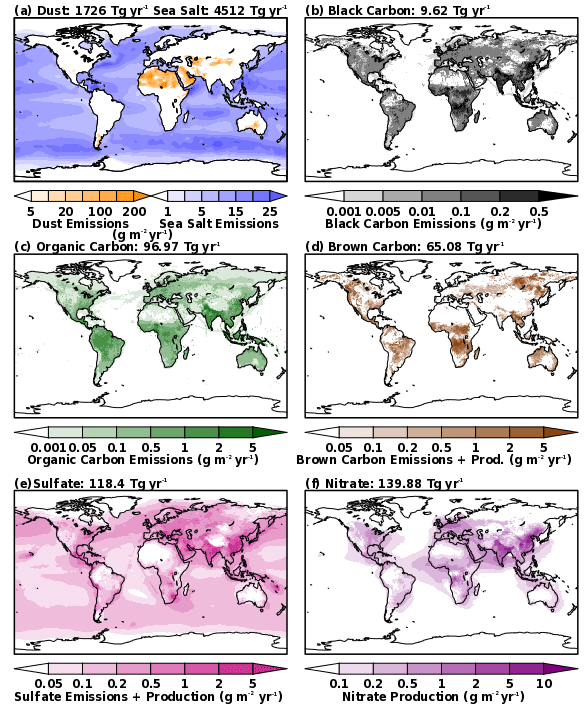
Figure 1Emissions of (a) dust, sea salt, (b) black carbon, (c) organic carbon, (d) brown carbon, and (e) sulfate as well as the production of (d) brown carbon from secondary organic aerosol, (e) sulfate, and (f) nitrate averaged for the period of January 2016 through December 2019 in the GEOS GOCART-2G benchmark simulation.
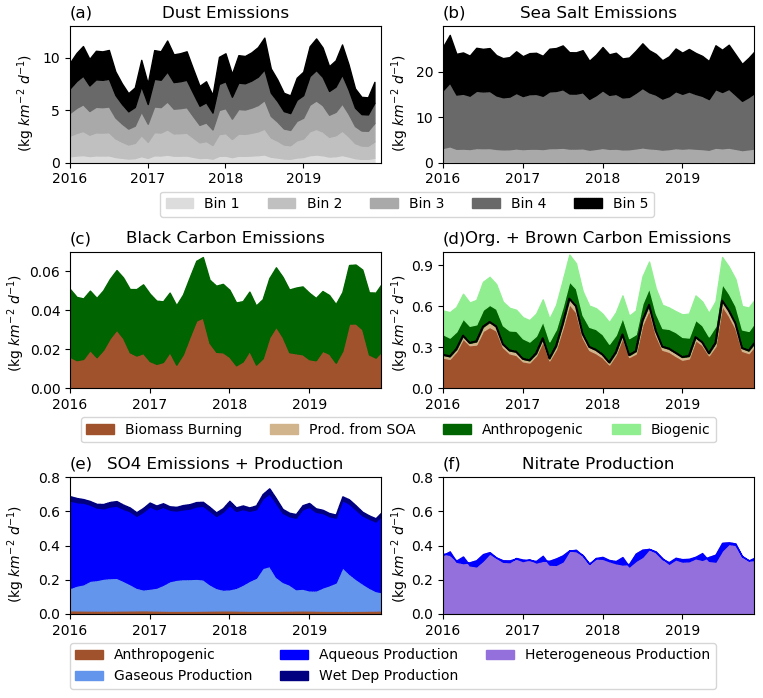
Figure 2Time series of emissions and production of (a) dust, (b) sea salt, (c) black carbon, (d) organic carbon, brown carbon, (e) sulfate, and (f) nitrate for the period of January 2016 through December 2019 in the GEOS GOCART-2G benchmark simulation.
2.2 Updates incorporated into GOCART-2G
Three major changes with regards to aerosol speciation were implemented as part of GOCART-2G to either represent processes that were previously not included or improve the interaction between aerosols and radiation. Brown carbon was added as a new radiatively active sub-species of carbon. This was done to account for differences in absorption properties between organic carbon emitted by biomass burning (from QFED) and anthropogenic sources (from CEDS), as described by Colarco et al. (2017). Secondary organic aerosol (SOA) is now used to form brown and organic carbon from volatile organic carbon (VOC). Finally, a mechanism to produce sulfate in the stratosphere (StratChem; Nielsen et al., 2017) has been added to simulate sulfate more realistically at higher altitudes. StratChem is too computationally expensive to employ in a near-real-time system like GEOS FP but can be used for research purposes.
A major refactoring of the GOCART source code was completed to improve performance, flexibility, and code quality within GOCART-2G. This was essential to allow for future development of the aerosol module and for the code to be effectively shared with external organizations. The code refactoring itself is intended to produce identical results, within roundoff errors, to the legacy GOCART code. An important improvement in terms of flexibility was the addition of user supplied wavelengths for aerosol diagnostics. Previously, GOCART provided aerosol optical properties at the specific bands required by the radiation package, but diagnostic file output was restricted to the 550 nm wavelength. To better support data assimilation of multi-wavelength aerosol data, the model is now able to directly output aerosol optical properties at multiple wavelengths without the need for an offline utility. The model is also able to output stratospheric AOD using the GEOS tropopause height. Additional details on the code changes and refactoring are in the Supplement.
3.1 Moderate Resolution Imaging Spectroradiometer (MODIS) Neural Net Retrieval (NNR)
Here we evaluate AOD at 550 nm in GOCART-2G using observations from Collection 6.1 of the Moderate Resolution Imaging Spectroradiometer (MODIS) aboard the Aqua satellite (Levy et al., 2015). The particular MODIS dataset used for this evaluation is the Neural Net Retrieval (NNR) described in Sect. 3.2.2 of Randles et al. (2016), which bias corrects and homogenizes MODIS observations to be consisted with AERONET. The NNR algorithm relies on cloud-cleared, gas-corrected reflectances used by the Deep Blue (Sayer et al., 2019) and Dark Target (Remer et al., 2020) retrievals and uses a neural net trained on co-located AERONET direct sun AOD measurements. The monthly mean NNR AOD retrievals are obtained by a weighted average based on the number of pixels available for a given 0.25∘ latitude by 0.3125∘ longitude grid box. The same NNR-based analysis was also carried out for the Terra satellite, complemented by additional measurements from the Multi-angle Imaging SpectroRadiometer (MISR); these results are presented in the Supplement. GEOS has been sampled such that model data is only included when and where MODIS observations are available at the 3-hourly time step of the MODIS NNR product.
3.2 AERONET
The AErosol RObotic NETwork (AERONET) is a collection of ground-based stations equipped with Cimel sun photometers for measuring spectral sun irradiance and sky irradiances (Holben et al., 1998). Under cloud-free conditions, AOD is computed as the total optical depth measured by the sun photometer minus the contribution from Rayleigh scattering and trace gases. For comparison to GEOS, version 3 of the level 2 product, which includes cloud screening, is utilized (Giles et al., 2019). Although AERONET provides spectrally varying AOD, only AOD at 550 nm is examined in addition to the Ångström exponent computed using 470 and 870 nm. For stations that do not report AOD at 550 nm, the Ångström exponent for 440 and 675 nm is used to convert the AOD at 500 to 550 nm.
3.3 OMPS-LP
The Ozone Mapping and Profiler Suite (OMPS) aboard the Joint Polar Satellite System (JPSS) Suomi National Polar-orbiting Partnership (S-NPP) satellite contains a limb profiler (LP) that can observe aerosol in the stratosphere. Stratospheric AOD at 869 nm is evaluated using observations from OMPS-LP (Taha et al., 2021) to validate volcanic eruptions and pyrocumulonimbus (PyroCB) reaching the stratosphere. The data from OMPS-LP are presented as the daily, zonal mean of the stratospheric AOD, evaluated by integrating the retrieved extinction from the GEOS-derived tropopause altitude to the 40 km top altitude of the OMPS-LP retrievals. Data are not available during periods of instrument issues and under low-sun or no-sun conditions (e.g., polar night). Although the algorithm includes cloud screening, some polar stratospheric clouds are evident in the dataset, as shown below.
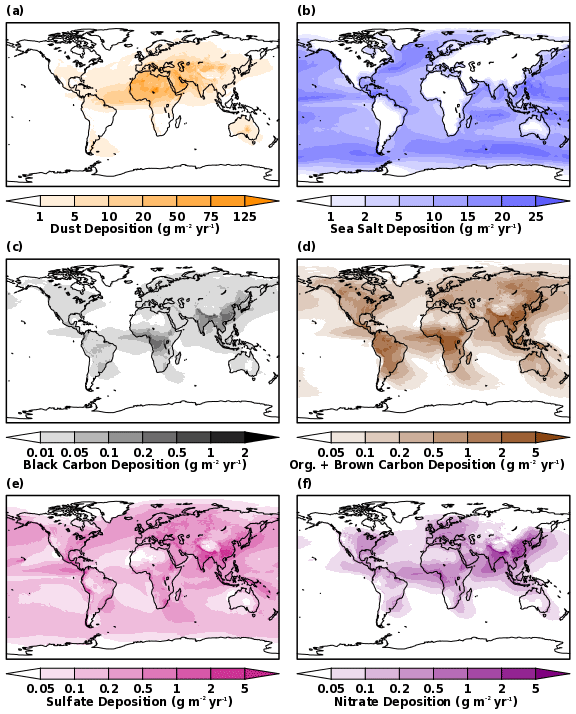
Figure 3Deposition of (a) dust, sea salt, (b) black carbon, (c) organic carbon, (d) brown carbon, (e) sulfate, and (f) nitrate averaged for the period of January 2016 through December 2019 in the GEOS GOCART-2G benchmark simulation.
3.4 CALIOP
Since 2006, the Cloud Aerosol Lidar with Orthogonal Polarization (CALIOP), aboard NASA's CALIPSO A-train satellite (Winker et al., 2007, 2009), has provided insights about aerosol vertical structure. For this study, the highest-quality lidar Level 1.5 standard data product version V1.00 was employed (NASA/LARC/SD/ASDC, 2019): a cloud-cleared dataset with a 20 km horizontal and 60 m vertical resolution for a height up to 20.2 km. The observations include contributions from both aerosols and gas molecules (Rayleigh scattering), so our analysis is limited to the total (aerosols + molecular) attenuated backscatter coefficient.
3.5 Surface particulate matter from IMPROVE and EMEP
Like in Buchard et al. (2016) and Provençal (2017), surface aerosol mass is evaluated over the United States using data provided by the Interagency Monitoring of Protected Visual Environments (IMPROVE, http://vista.cira.colostate.edu/Improve/, last access: 12 February 2024) Program and over Europe using data from the European Monitoring and Evaluation Programme (EMEP, https://ebas.nilu.no/, last access: 12 February 2024). IMPROVE and EMEP monitoring sites are typically located in rural areas representative of the region and with minimal influence from localized urban pollution. Following the module description for the IMPROVE network (Hand et al., 2011), PM2.5 in GOCART-2G was computed using the equation below for aerosol with an aerodynamic diameter of 2.5 µm (Collow et al., 2023a). Variable names in the equation are consistent with those given in the file specification document for GEOS Forward Processing (Lucchesi, 2018). The multiplication factors of 0.9614 for bin 1 of dust and 0.4752 for bin 3 of sea salt account for a conversion to aerodynamic diameter and the fact that only a portion of the bin is smaller than 2.5 µm. Though not done here, other studies have used the entirety of bin 1 for dust in comparison to IMPROVE observations due to a wide range in the shape factor for dust (Kim et al., 2021).
Reconstructed PM2.5 is given by
where the growth factor with relative humidity, fx,rh, for each species is calculated as
using the radius specified for a given relative humidity from the optics files listed in Table A2 as rrh and the radius at 0 % relative humidity for r0.
Following their respective documentation, PM2.5 for the IMPROVE sites in the United States was computed using a relative humidity of 35 % (Hand et al., 2011) while PM2.5 for the EMEP sites in Europe was computed using a relative humidity of 50 %. GEOS was sampled according to when and where observations were available. Note that IMPROVE observations are collected every 3 d while data from EMEP ranges in temporal frequency from 1 h to 6 d. EMEP observations are also not homogeneous with respect to the instruments and measurements of individual aerosol species at each site.
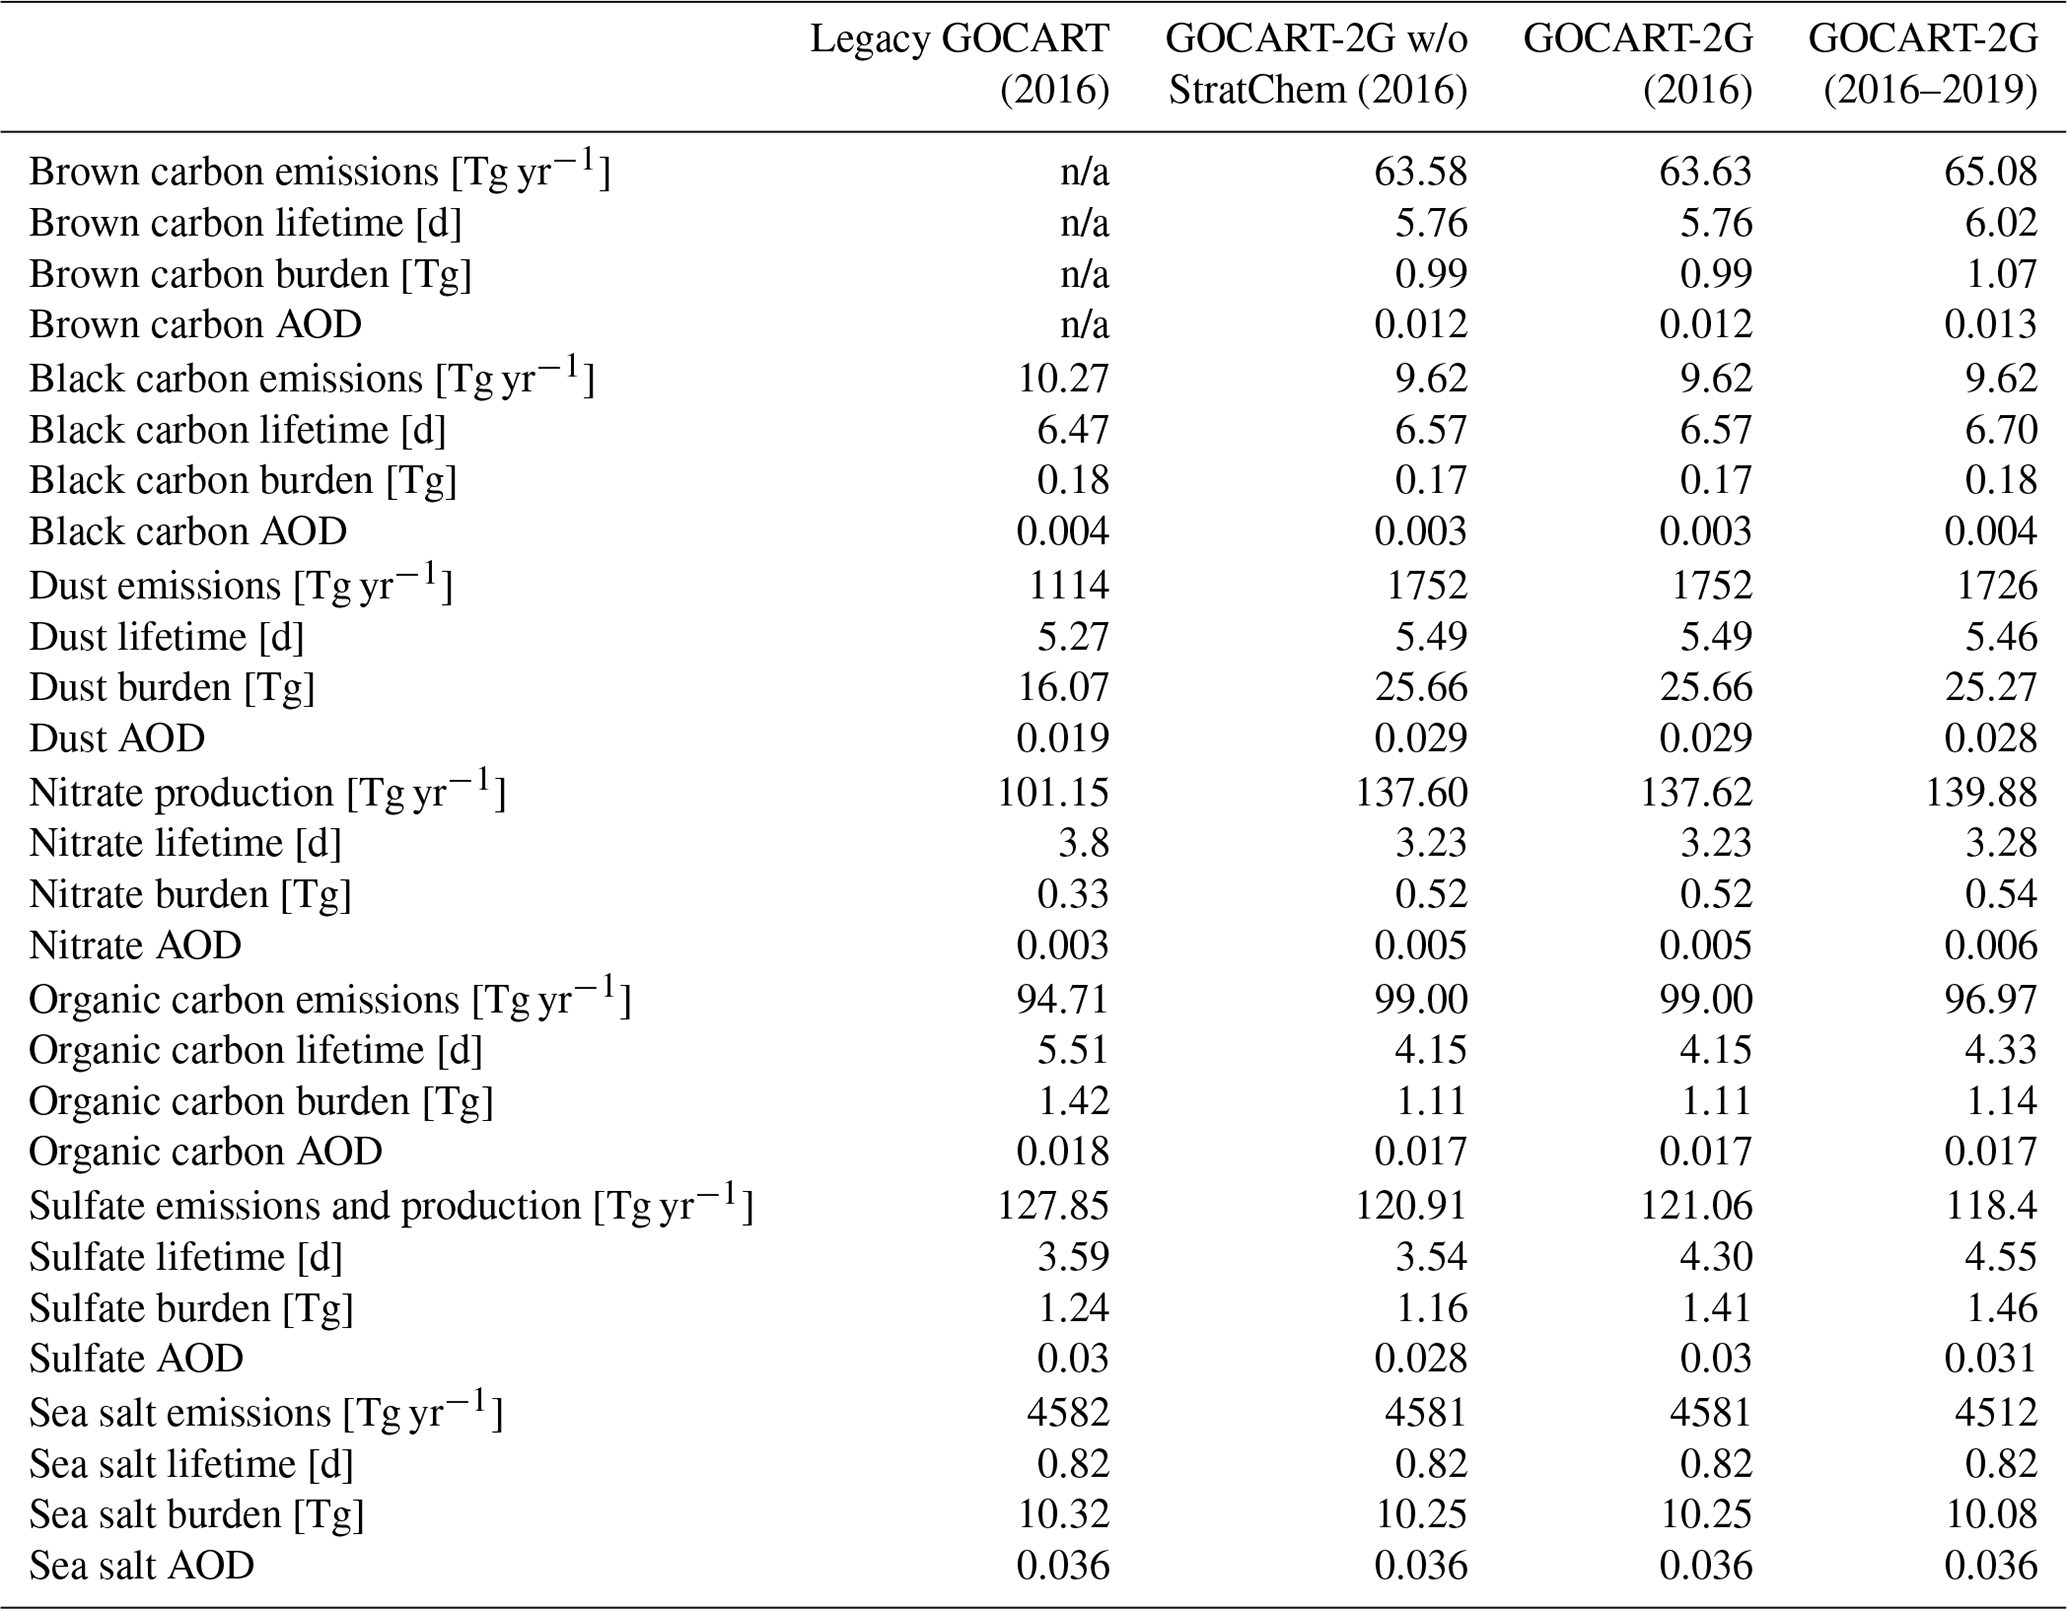
Table 3Global annual mean emission and/or production, lifetime, and burden of aerosols in GEOS-Legacy GOCART and GEOS-GOCART2G for 2016 and GEOS-GOCART-2G for 2016 through 2019. n/a – not applicable
A benchmark simulation for GOCART-2G was carried out for the period of 2016 through 2019 using GEOS Release 10.23.0 (https://github.com/GEOS-ESM/GEOSgcm/releases/tag/v10.23.0, last access: 12 February 2024; https://doi.org/10.5281/zenodo.8059710, Global Modeling and Assimilation Office, 2023) on a cubed-sphere c180 grid (∼ 0.5∘ spatial resolution) with 72 vertical levels. Meteorology, particularly atmospheric temperature, specific humidity, and winds were replayed to the analysis from MERRA-2 (Gelaro et al., 2017), while boundary conditions for sea surface temperature and sea ice concentration were from the Reynolds analysis (Reynolds et al., 2002). The benchmark simulation uses a one-moment microphysics scheme such that aerosols are not used as cloud condensation nuclei for the formation of liquid or ice clouds. Two pyroCb events were included in the simulation for British Columbia in 2017 (Torres et al., 2020; Das et al., 2021) and Australia in late December 2019 (Schwartz et al., 2020) and the StratChem mechanism is turned on. There is no assimilation of aerosol optical depth or observational constraint for aerosol extinction or mass. Therefore, all observations used for comparison are independent from the model simulation. Additional 1-year simulations, overlapping for 2016, were completed using the legacy GOCART configuration of GEOS as well as GOCART-2G without the stratospheric sulfate mechanism. Aside from the code changes described in Sect. 2, the legacy GOCART configuration used an older dataset for anthropogenic emissions as described in Randles et al. (2017).
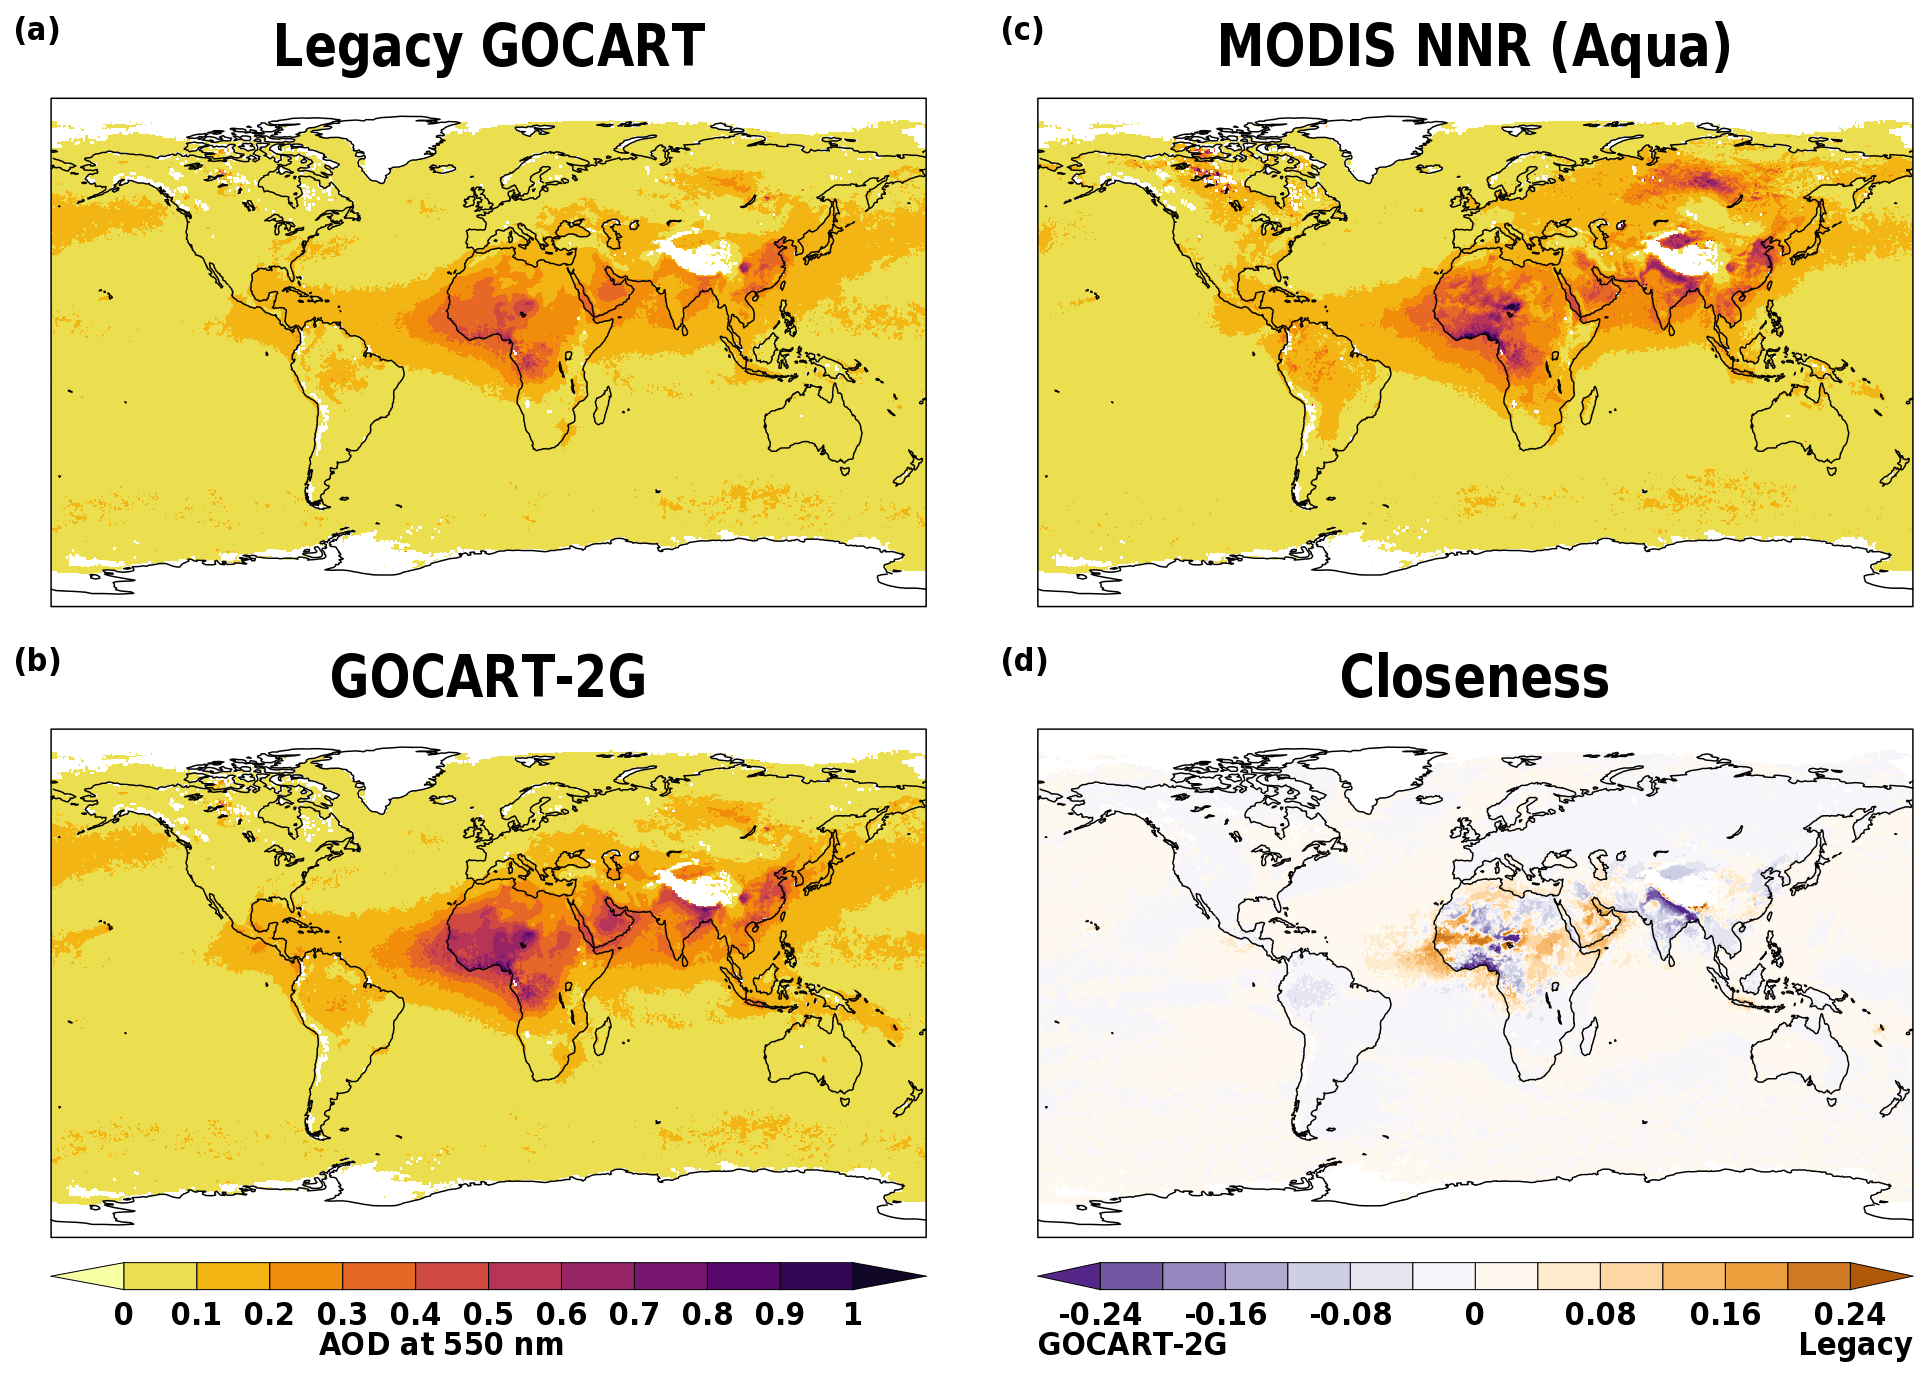
Figure 4Average AOD at 550 for the period of January 2016 through December 2016 in the (a) GEOS Legacy GOCART simulation, (b) GEOS GOCART-2G benchmark simulation, (c) MODIS NNR observational product from Aqua, and (d) the closeness to the observations defined as | GOCART-2G-MODIS | – | Legacy GOCART-MODIS |.
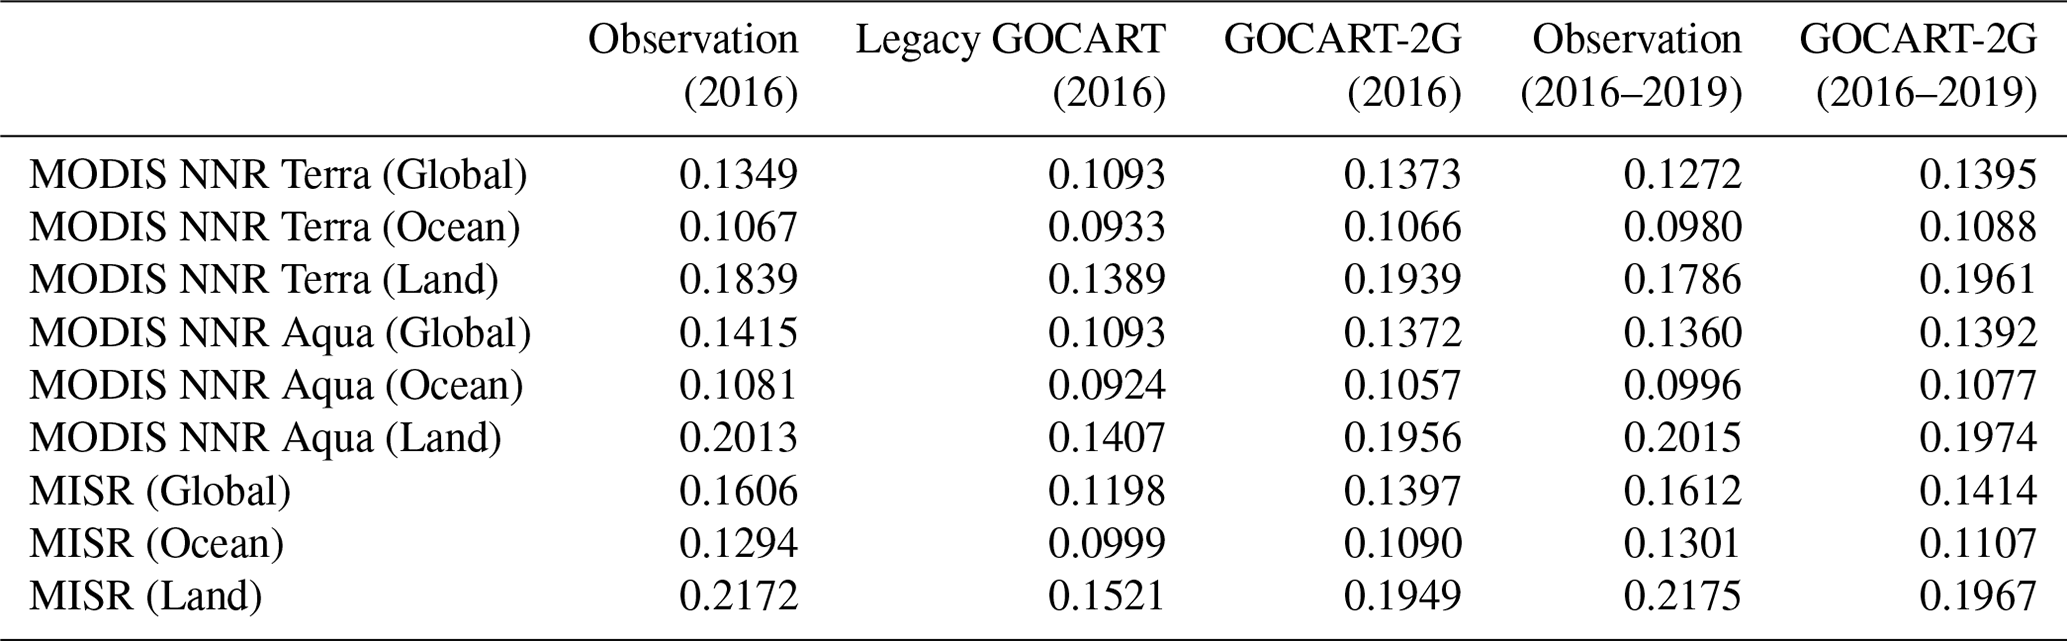
Table 4Global annual mean AOD at 550 nm for 2016 in legacy GOCART, GOCART-2G, and the satellite-based datasets as well as for the period of 2016 through 2019 in the GEOS-GOCART2G model and the satellite-based datasets.
4.1 Aerosol mass budget
Emissions and production from each aerosol species are presented in Figs. 1 and 2, while details pertaining to the global mass budget can be found in Table 3. Wind-driven dust is emitted primarily over Saharan Africa, Saudi Arabia, the Asian deserts, the Simpson Desert of Australia, and the southern tip of South America (Fig. 1a), in agreement with Colarco et al. (2010), Randles et al. (2017) and Rémy et al. (2019). The seasonal cycle of dust emissions peaks in boreal spring and is minimized during the fall months (Fig. 2a). An increase in dust emissions is present in GOCART-2G relative to legacy GOCART due to an intentional increase in the emissions scaling factor to match the global mean AOD for dust of 0.028 from Kok et al. (2021). Most dust is deposited near the source regions; however, there is notable transport of Saharan dust across the Atlantic Ocean (Fig. 3a).
Sea salt emissions are enhanced along the northern and southern hemisphere storms tracks as well as the Intertropical Convergence Zone (ITCZ), with little variability across the seasonal cycle. While the spatial pattern is similar, sea salt emissions have decreased from MERRA-2 (Randles et al., 2017). In a correction since MERRA-2, sea salt is not emitted over the Great Lakes or Caspian Sea. Most sea salt is emitted in the coarse mode, with the largest contribution from bin 3 (mode radius of 2.4 µm). Relative to the largest three bins, emissions from bins 1 and 2 are negligible to the total mass (Fig. 2b). Nearly all sea salt is deposited over the ocean, in elevated quantities over the storm tracks and ITCZ (Fig. 3b). The global mean AOD for sea salt did not change with the version of GOCART and remains slightly below the median relative to other AeroCom Phase III models (Table 3; Gliß et al., 2021).
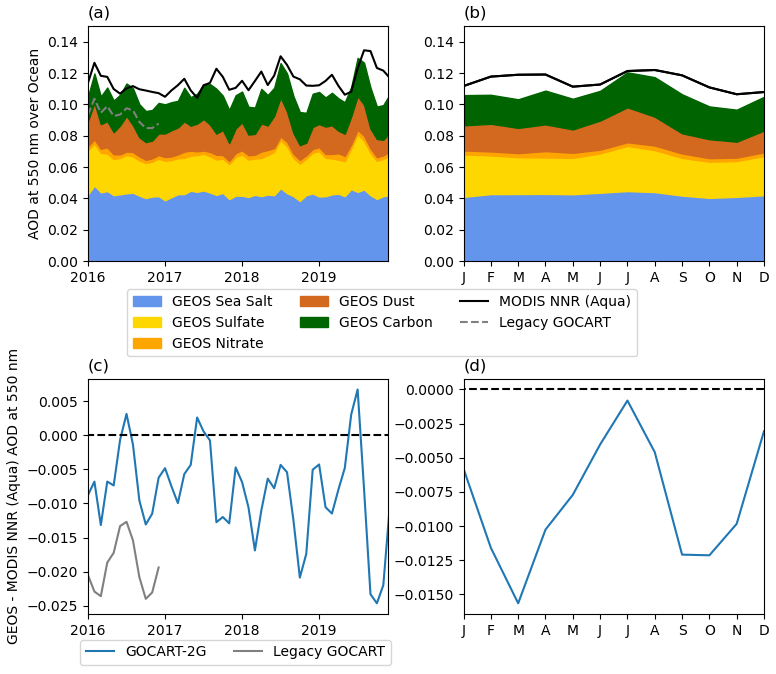
Figure 5Time series of ocean area-averaged (a) monthly mean AOD from the Aqua MODIS NNR observational product and the speciated AOD from the GEOS GOCART-2G benchmark simulation, (b) mean seasonal cycle, and the difference between the model and observations for the (c) monthly mean AOD and (d) seasonal cycle of AOD. Total AOD in the Legacy GOCART simulation is added in grey lines for reference in (a) and (c).
Carbonaceous aerosol is emitted over land (Fig. 1b–d), with a seasonal cycle that peaks in the boreal summer due to the temporal variability in biomass burning (Fig. 2c–d). Anthropogenic emissions account for, on average, 62 % of the total black carbon emissions and 21 % of the organic aerosol emissions. Brown carbon, emitted through biomass burning, ranges from 37 % to 65 % of the monthly emissions of organic aerosol. There is also a contribution of brown carbon produced from SOA. Due to the mechanism for biogenic emissions introduced in GOCART-2G, there is an increase in the total emissions of organic matter relative to legacy GOCART (Table 3). Subsequently, there is an increase in burden for organic and brown carbon that is near the median for the AeroCom Phase III models (Gliß et al., 2021).
Sulfate is directly emitted within GEOS from the anthropogenic emissions and has a contribution that is produced from the oxidation of dimethyl sulfide (DMS), methane sulfonic acid (MSA), and sulfur dioxide (SO2). Emission and production of sulfate is maximized in densely populated areas including China, India, Europe, and the eastern United States (Fig. 1e). Anthropogenic emission of SO2 is the largest contribution to sulfate production and is responsible for the subtle downward trend of sulfate production over the 4-year time series. The summertime peaks in sulfate production during 2018 and 2019 are in response to the explosive volcanic eruptions of Kilauea in May 2018 and Raikoke in June 2019 (Fig. 2e) while the broader summertime peaks in gaseous production of sulfate are associated with biomass burning emissions of SO2. There is a small impact of the stratospheric sulfate mechanism on the total burden and AOD for sulfate (Table 3).
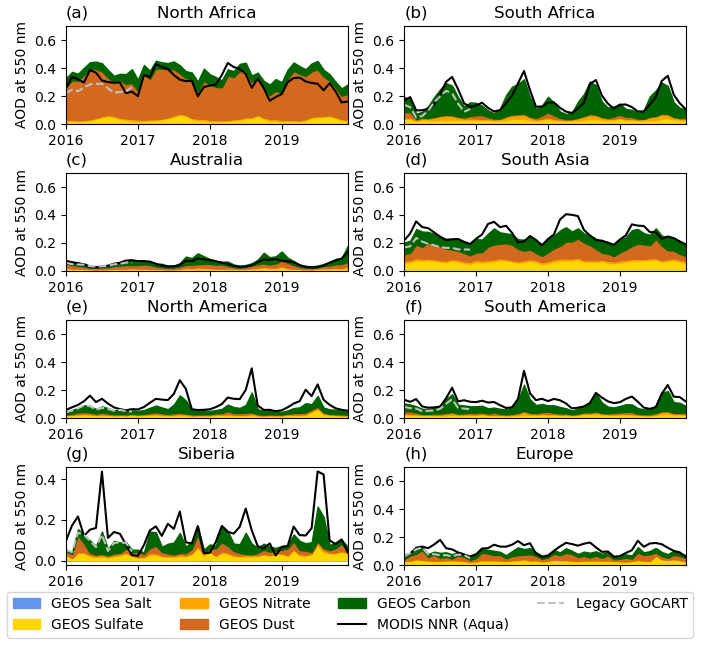
Figure 6Time series of area-averaged monthly mean AOD from the Aqua MODIS NNR observational product and the speciated AOD from the GEOS GOCART-2G benchmark simulation over (a) northern Africa, (b) southern Africa, (c) Australia, (d) southern Asia, (e) North America, (f) South America, (g) Siberia, and (h) Europe. Total AOD in the Legacy GOCART simulation is added in dashed grey lines for reference.
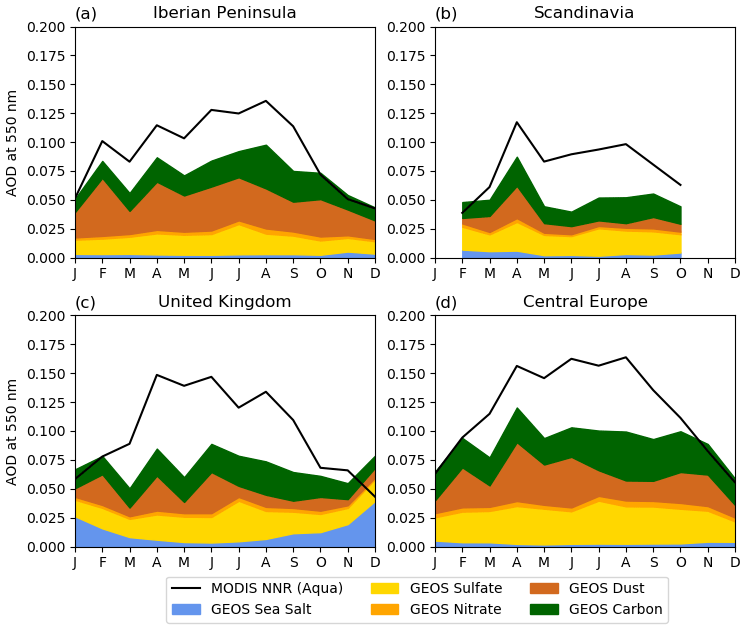
Figure 7Time series of area-averaged monthly mean AOD from the Aqua MODIS NNR observational product and the speciated AOD from the GEOS GOCART-2G benchmark simulation over (a) the Iberian Peninsula, (b) Scandinavia, (c) the United Kingdom, and (d) central Europe.
Nitrate aerosol is not directly emitted. Most nitrate forms in response to heterogenous production on dust and sea salt aerosols (Fig. 2f). A somewhat bimodal seasonal cycle in the production of nitrate occurs due to spring and fall peaks in the emission of ammonia (NH3). Due to the anthropogenic and agricultural nature of ammonia emissions, the spatial pattern of nitrate deposition is very similar to that for organic and brown carbon. Most nitrate aerosol is deposited close to the source while some is transported over the ocean by the atmospheric circulation (Fig. 3f). An increase in nitrate production in GOCART-2G relative to legacy GOCART resulted in an overall increase in the nitrate burden and optical depth, which brings the nitrate burden even further from the median of the AeroCom III participating models (Gliß et al., 2021). The increase in nitrate is likely in response to the newer emissions and a change in the input dataset for the oxidant fields relevant for nitrate chemistry.
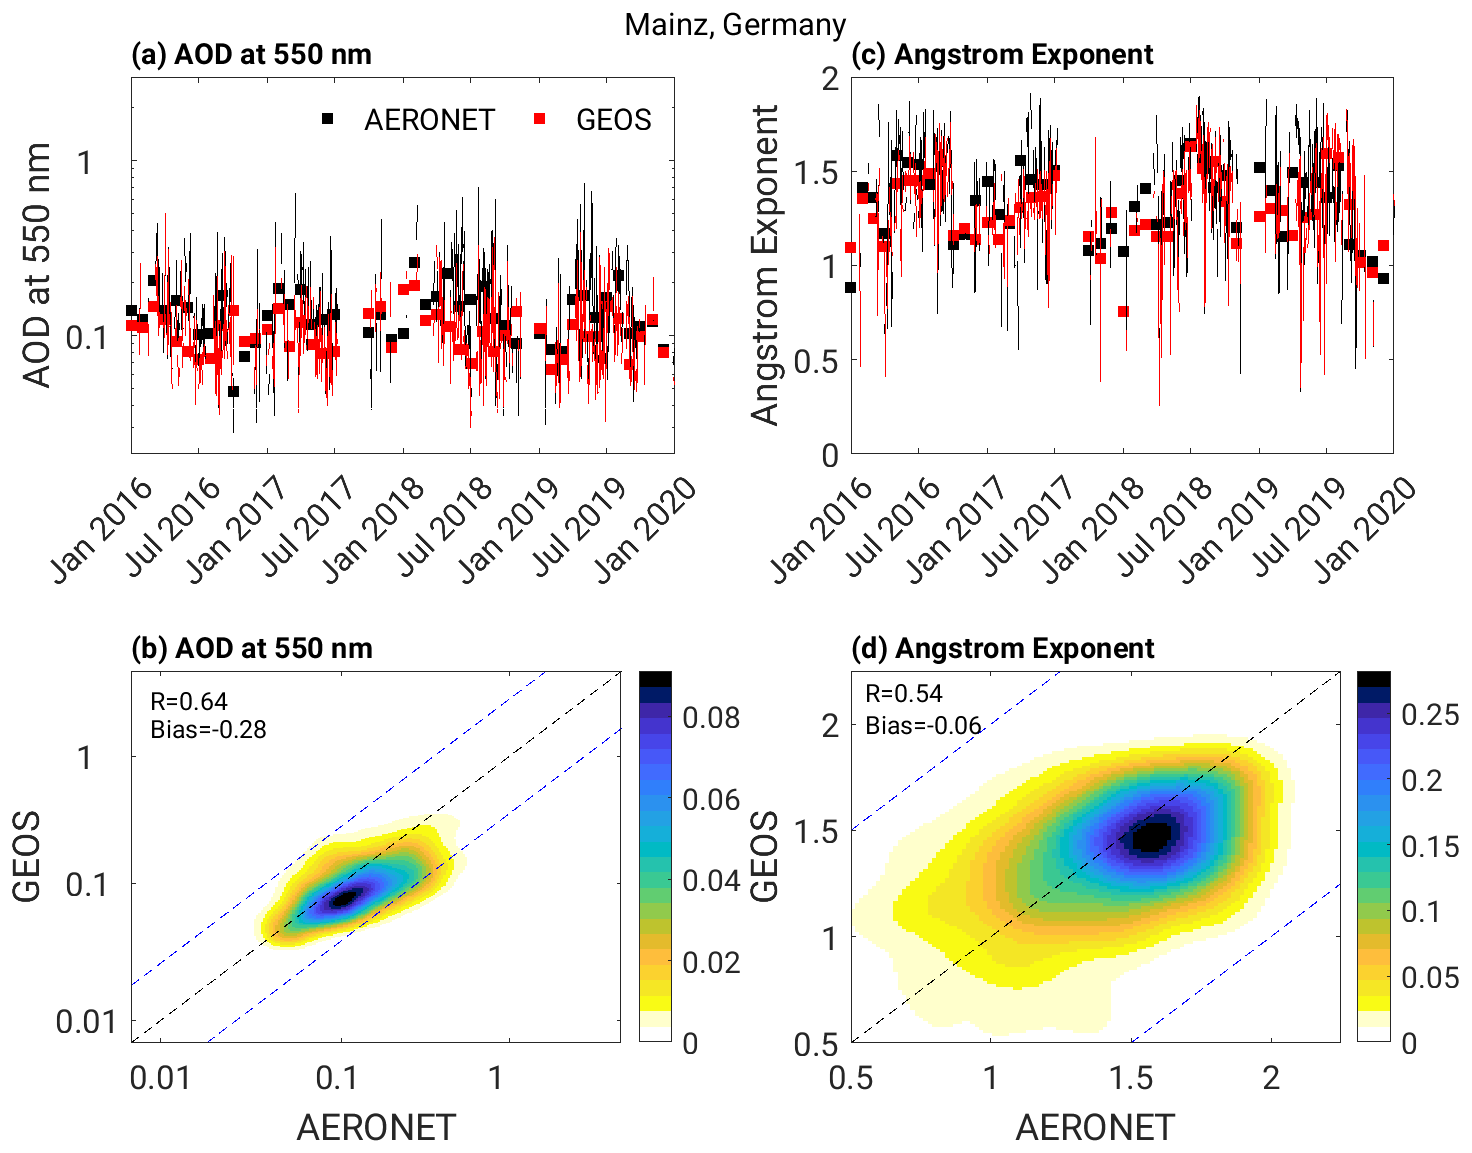
Figure 8(a) Time series of hourly AOD at 550 nm, (b) 2-D kernel density estimate for AOD at 550 nm computed as log(AOD+0.01), (c) time series of Ångström exponent, and (d) 2-D kernel density estimate for Ångström exponent over the AERONET station in Mainz, Germany, for all co-located data points from the observations and GEOS GOCART-2G benchmark simulation. The statistics in (b) are computed as log(AOD+0.01). The dashed black line in (b) and (d) indicates the one-to-one line, while the dashed blue lines are the one-to-one line plus or minus one of the one-to-one line.
4.2 Comparison to observational datasets
4.2.1 Satellite-based aerosol optical depth
A broad, global comparison of the AOD between MODIS Aqua and both versions of GOCART for 2016 is shown in Fig. 4. Over the ocean there is little difference in the annual mean AOD between legacy GOCART and GOCART-2G, and the model generally performs well over the ocean relative to MODIS (Fig. 4a–c). However, there are notable biases and differences between the model versions over land (Fig. 4; Table 4). Most notably, AOD increased in the model over northern South America, Africa, Saudi Arabia, and southern Asia. While this increase led to an improvement in AOD compared to MODIS over South America and southern Asia, there are indications that an increase in dust led to a degradation in GOCART-2G elsewhere. A positive bias in AOD with GOCART-2G is present across Saudi Arabia and northern Africa, extending over the central Atlantic, presumably from transported dust. The positive bias in AOD is larger in magnitude when GEOS with GOCART-2G is compared to MODIS aboard Terra relative to Aqua (Fig. S5). This suggests there could be a further issue with the diurnal cycle of dust emissions as Terra has a morning overpass while Aqua has an afternoon overpass. However, this positive bias in AOD in dusty regions is not as large when GEOS with GOCART-2G is compared to MISR, also aboard Terra, (Fig. S6) or AERONET (Fig. 9, shown later). Conversely, a negative bias in AOD is present in the Northern Hemisphere boreal regions that is larger in magnitude when the comparison is made to Aqua, again indicating a concern in the diurnal cycle. In general, the AOD over land is larger for Aqua than Terra in the MODIS NNR product (Table 4), in disagreement with what is presented by Levy et al. (2018) for the Dark Target algorithm. However, Levy et al. (2018) points out that differences due to satellite should not be used to indicate diurnal biases.
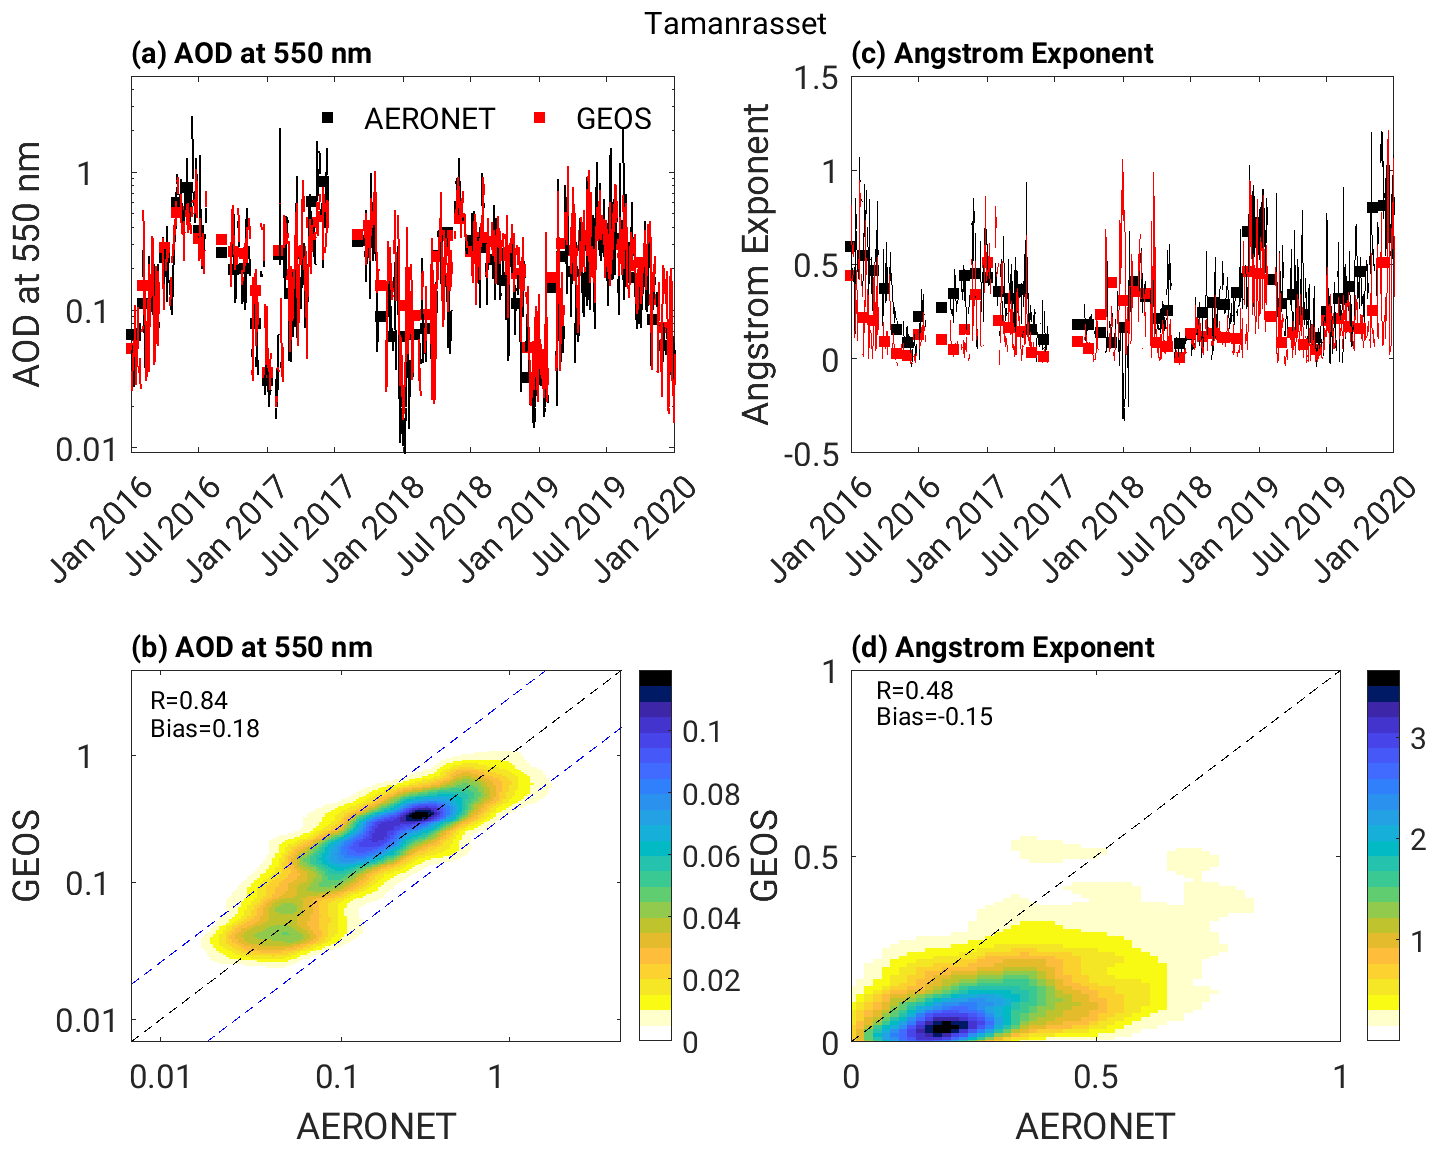
Figure 9(a) Time series of hourly AOD at 550 nm, (b) 2-D kernel density estimate for AOD at 550 nm computed as log(AOD+0.01), (c) time series of Ångström exponent, and (d, e) 2-D kernel density estimate for Ångström exponent over the AERONET station in Tamanrasset, Algeria, for all co-located data points from the observations and GEOS GOCART-2G benchmark simulation. The statistics in (b) are computed as log(AOD+0.01). The dashed black line in (b) and (d) indicates the one-to-one line, while the dashed blue lines are the one-to-one line plus or minus one of the one-to-one line.
Monthly mean time series of global mean AOD over ocean, in addition to the mean seasonal cycles, can be found in Fig. 5. In the top two panels, the solid black line represents the MODIS observations, while the colored shading accumulates the optical depth for each aerosol species in GEOS. Though difficult to see in the global spatial map, it is evident that AOD is underestimated in the model over the ocean, and this bias has been reduced in GOCART-2G (Fig. 5c). However, this could have resulted from an overestimate in the outflow of Saharan dust that was introduced in GOCART-2G (Fig. 4). There is a seasonal cycle in the bias such that it is maximized during the months of March, September, and October and minimized during the boreal summer and winter (Fig. 5d). MODIS indicates a bimodal seasonal cycle for total AOD, with one peak in the Northern Hemisphere late winter and early spring that is not present in GEOS, and another during the summer that persists later into the season than in the model. The largest contribution to the total AOD comes from sea salt, and in agreement with the fact that emissions cover a large fraction of the domain, there is little temporal variability in the optical depth for sea salt. Peaking in April, nitrate makes up the smallest contribution to the total AOD over the ocean. Peaks in sulfate are present in the boreal summers of 2018 and 2019, coincident with peaks in the gaseous production of sulfate due to large volcanic eruptions as shown in Fig. 2e.
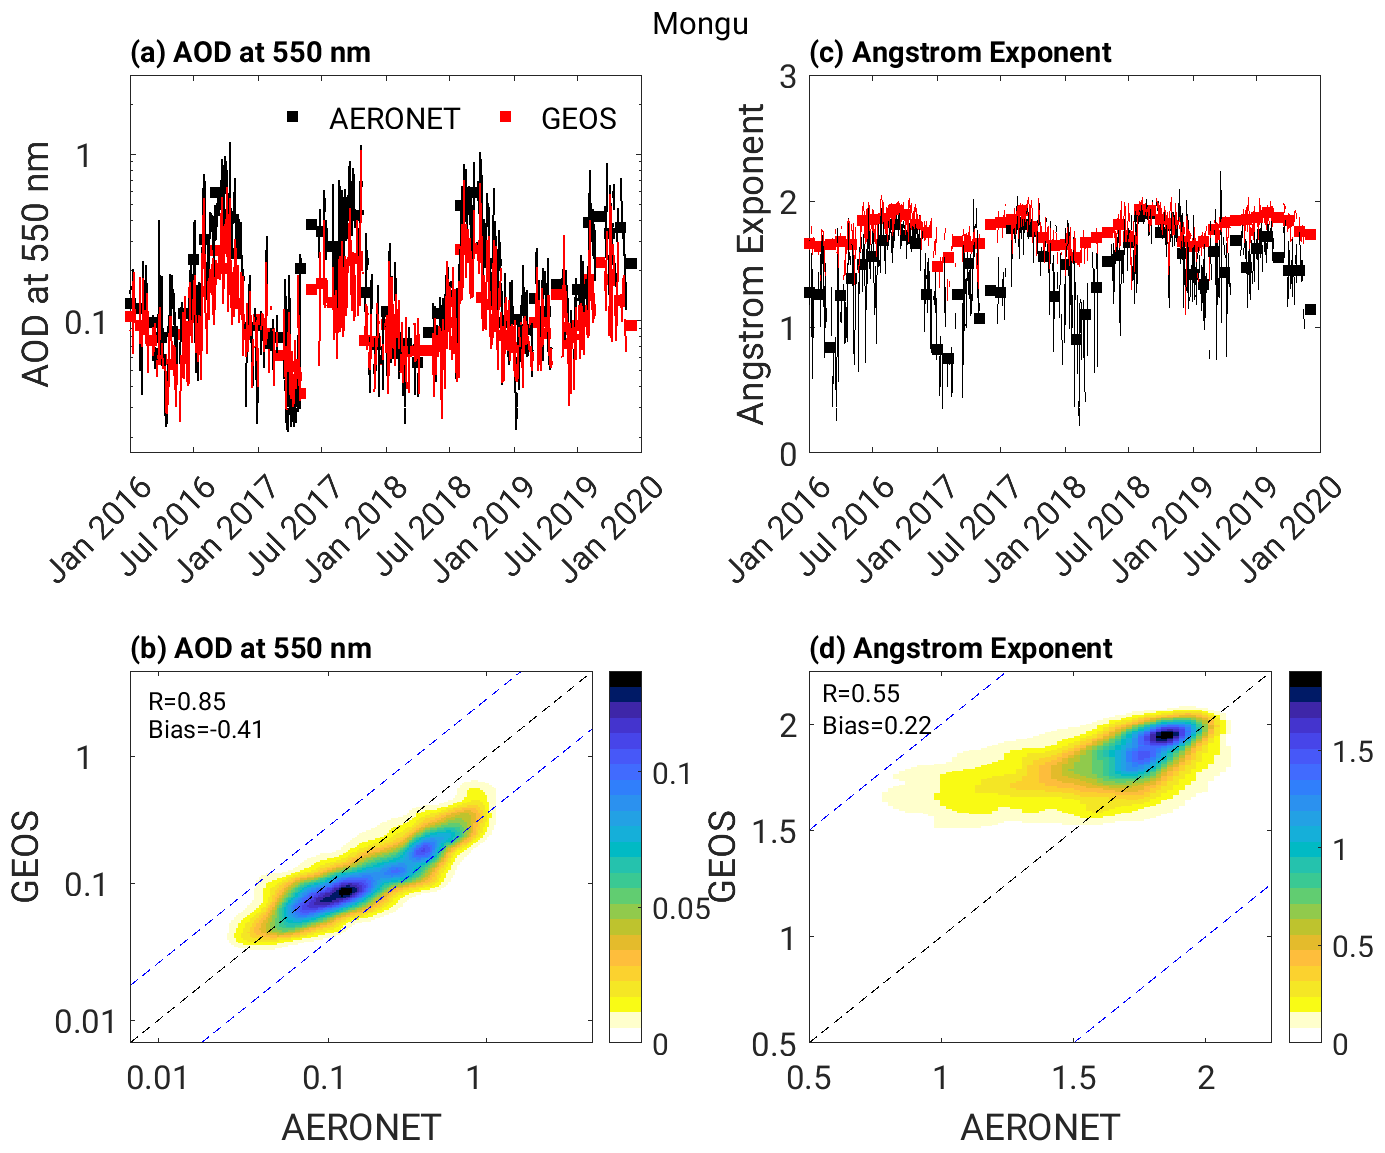
Figure 10(a) Time series of hourly AOD at 550 nm, (b) 2-D kernel density estimate for AOD at 550 nm computed as log(AOD+0.01), (c) time series of Ångström exponent, and (d, e) 2-D kernel density estimate for Ångström exponent over the AERONET station in Mongu, Zambia, for all co-located data points from the observations and GEOS GOCART-2G benchmark simulation. The statistics in (b) are computed as log(AOD+0.01). The dashed black line in (b) and (d) indicates the one-to-one line, while the dashed blue lines are the one-to-one line plus or minus one of the one-to-one line.
The analysis of AOD over land is broken down into eight continental scale regions. A spatial map demonstrating the geographic extent of each region is in the Supplement (Fig. S8). Beginning with northern Africa in Fig. 6a, the region is dominated by dust that typically peaks in the spring and summer months. GEOS can produce the observed temporal variability in AOD; however, the magnitude of AOD is higher than MODIS throughout the entire time series. This is likely due to an overestimate of dust emissions in GOCART-2G.
GEOS underestimates the AOD in southern Asia, North America, South America, Siberia, and Europe (Fig. 6d–h). The Americas, Siberia, and southern Asia are influenced by biomass burning aerosol. Biomass burning aerosol is often underestimated in models, including GEOS, and in many cases the datasets contain errors due to assumptions made for the particle properties (Zhong et al., 2022, and references within). Collow et al. (2022) demonstrated the GEOS struggles to match the observed mass extinction efficiency within a smoke plume. It is likely that the negative bias in these regions is in response to biomass burning aerosol. Europe and southern Asia are more complicated due to higher relative proportions of dust and sulfate. Dust emissions are tuned in GEOS using a global metric. It is therefore plausible that there are errors in the transport of dust to Europe and the overall life cycle of dust from Asian deserts such as the Gobi and Taklamakan deserts. A lack of the negative bias in AOD over southern Asia in comparison to Terra indicates that the underestimation of AOD in GEOS contains a diurnal cycle (Fig. S9d).
GEOS completely misses the observed seasonal cycle in AOD over Europe, regardless of the version of GOCART. For this reason, Europe was further divided into subregions as indicated by Fig. 7 (See Fig. S12 for the geographical depiction of the subregions). There is decent agreement with respect to the annual cycle in AOD between MODIS and GEOS over the Iberian Peninsula and Scandinavia. Conversely, GEOS does not capture the summertime maxima in AOD across central Europe or the United Kingdom. This will be further elaborated upon through a comparison with AERONET observations in Sect. 4.2.2 and an evaluation of surface mass in Sect. 4.2.5.
There is remarkable agreement in the AOD over southern Africa and Australia, with GEOS capturing the seasonal cycle and magnitude from the observations (Fig. 6b–c). The fact that southern Africa is also dominated by biomass burning aerosol but does not have the negative bias seen in other biomass burning regions suggests there could be an overestimate of AOD due to another species or that the optical properties for brown and organic carbon in GEOS are better suited for the fuel types burned in Africa rather than the boreal forests of North America and Siberia and the rainforests of South America.

Figure 11(a) Time series of hourly AOD at 550 nm, (b) 2-D kernel density estimate for AOD at 550 nm computed as log(AOD+0.01), (c) time series of Ångström exponent, and (d, e) 2-D kernel density estimate for Ångström exponent over the AERONET station in Langley, Virginia, USA, for all co-located data points from the observations and GEOS GOCART-2G benchmark simulation. The statistics in (b) are computed as log(AOD+0.01). The dashed black line in (b) and (d) indicates the one-to-one line, while the dashed blue lines are the one-to-one line plus or minus one of the one-to-one line.
4.2.2 AERONET
Representative AERONET stations were selected for evaluation based on a comparison among dozens of stations in North America, Europe, and northern Africa. Due to the poor agreement in the seasonal cycle of AOD in Europe between GEOS and MODIS, Mainz, Germany, was selected as the site demonstrates characteristics of others in the area. The AERONET site is adjacent to both rural and urban landscapes and is in a moderately to highly polluted region. In agreement with the comparisons to MODIS, GEOS tends to underestimate the AOD with respect to the AERONET observations and has a mean negative bias of 0.28 in log space that tends to be larger in magnitude during the summer months (Fig. 8). In addition to smaller values of AOD occurring more frequently in GEOS compared to the observations, there is also less variability in the AOD. GEOS has a better agreement for the Ångström exponent, computed using 440 and 675 nm, accurately having the dominant aerosol in the fine mode. Potential reasons for the underestimate in AOD may be due to uncertainties in the CEDS dataset (McDuffie et al., 2020) or insufficient biomass burning aerosol that is transported from North America.
Comparisons between GEOS and AERONET stations across northern Africa and Saudi Arabia are consistent with respect to the mean bias in the model relative to MODIS NNR. Tamanrasset was chosen for additional evaluation since it is in northern Africa where GEOS overestimates AOD compared to MODIS (Fig. 9). The AERONET site is in the highlands of the Algerian Sahara, away from industrial activity, making dust the primary aerosol species. Here, there is a positive mean bias in the modeled AOD of 0.18 and a reasonable correlation between GEOS and AERONET of R=0.84, computed using log(AOD+0.01) (Fig. 9b). GEOS overestimates the AOD when the AERONET observations lie between 0.1 and 0.5 as demonstrated in Fig. 9b. Agreement between the model and observations is not as good for the Ångström exponent as the correlation is only 0.48 and there is a mean bias of −0.15, indicating that aerosol in the model is often coarser than seen by AERONET.
As shown in the comparison to MODIS, Southern Africa is dominated by biomass burning aerosol. Mongu, located in central southern Africa within Zambia, was selected as a representative site for smoke. Despite good agreement between GEOS and MODIS on a continental scale for southern Africa, there is considerable underestimation in AOD within the model when compared to AERONET at a local scale (Fig. 10a and b). This is especially the case for the Southern Hemispheric winter months when biomass burning is prevalent. The correlation of 0.85 at Mongu is on par with what was reported for the M2Replay, a MERRA-2-like simulation without the assimilation of AOD, in Randles et al. (2017). As shown by the kernel density estimate in Fig. 10b, the correlation between the observations and GEOS is weaker for lower values of AOD. GEOS has a smaller amplitude in the Ångström exponent such that there is an underestimate during the Southern Hemisphere summer months (Fig. 10c). GEOS is likely correctly characterizing the July peaks in AOD as biomass burning aerosol but is missing coarse-mode aerosols, perhaps dust, during the warmer months.
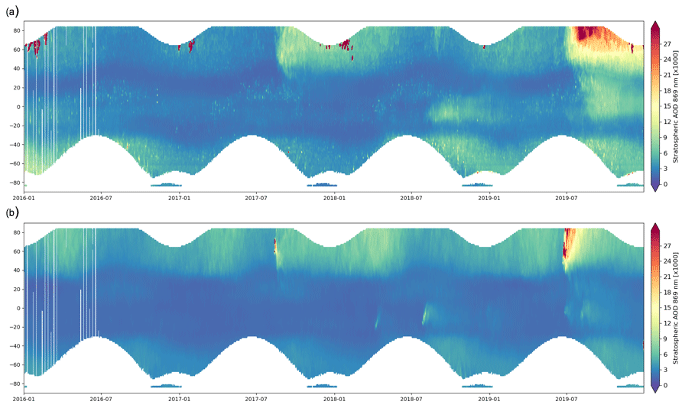
Figure 12Time series of zonal mean stratospheric AOD at 869 nm from (a) OMPS-LP observations and (b) the GEOS GOCART-2G benchmark simulation.
The AERONET station in Langley, Virginia, demonstrates behavior typical of other stations and is close to the national average time series for AOD across the United States. Located on the southern tip of the Chesapeake Bay less that 40 km from Norfolk, Virginia, the Langley AERONET site often experiences urban and marine aerosol regimes, with occasional intrusions of smoke and dust. At this station, GEOS overestimates the lower values of AOD and underestimates the higher values of AOD (Fig. 11a), giving a poorer correlation than at the sites in Europe and the Sahel (Fig. 11b). GEOS does not have as much variability in the Ångström exponent as the observations but accurately represents that there is fine-mode aerosol. A summary for 77 AERONET stations across the United States and Canada is given in the form of a kernel density estimate in Fig. S15. Numerous stations underestimate AOD during the summer months, in agreement with the MODIS evaluation. Exceptions to this are stations in the desert southwest including Tucson, Flagstaff, Table Mountain (CA), and USC, where GEOS simulates higher AOD than AERONET. These stations are characterized by a measured AOD below national average (Fig. S15).
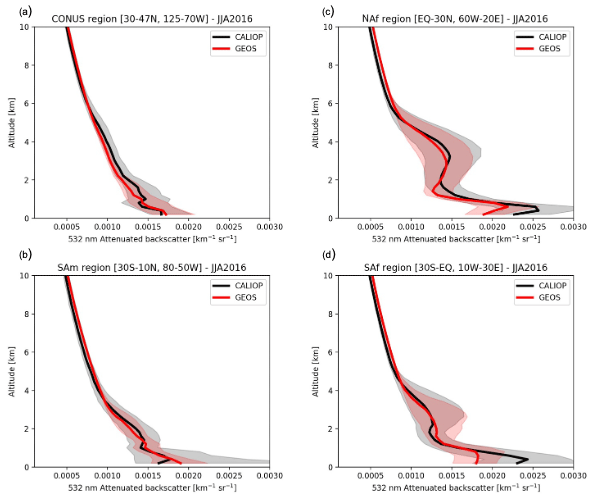
Figure 13Vertical profiles of total (aerosols + molecular) attenuated backscatter coefficient (km−1 sr−1) at 532 nm and derived from GEOS GOCART-2G simulations sampled on the CALIOP path and averaged over the continental United States, northern Africa (a, b), South America, and southern Africa (c, d) for the period of June–July–August 2016. The solid lines are the median of all profiles for CALIOP (black) and GEOS GOCART-2G (red). Shaded areas represent the 25th–75th percentile of all modeled and observed profiles.
4.2.3 OMPS-LP stratospheric AOD
Newly added diagnostics in GOCART-2G include total aerosol scattering and extinction in the stratosphere, which allows for comparison to observations from OMPS-LP. Figure 12 shows the daily, zonal mean stratospheric AOD at 870 nm from OMPS LP (Fig. 12a) and the GEOS simulation (Fig. 12b). GEOS modeled fields are masked where OMPS LP does not report retrievals either due to polar night conditions, scattering angle filtering, or missing data from spacecraft operation issues. Note some high AOD values along the northernmost points hugging the polar night line, particularly evident in January; these are unfiltered polar stratospheric cloud artifacts present in the OMPS LP data set (Ghassan Taha, personal communication, 2023) not included in the GEOS simulation. Generally, the model reproduces the observed seasonal variability and magnitude of the stratospheric AOD and has markers for significant stratospheric perturbing events such as volcanic eruptions (Aoba in the tropics in 2018, Ulawun in the tropics in 2019, Raikoke at high northern latitudes in 2019) and pyrocumulonimbus events (notably the British Columbia fires in high northern latitudes in late 2017). Even the seasonal variability evident exiting polar night is captured well in the model. Persistence of volcanic plumes following events, however, is not well captured in the model, suggesting difficulties with vertical placement and so long-range transport.
4.2.4 Vertical profile of attenuated backscatter
To assess the vertical structure of aerosols in the GEOS-GOCART-2G model, we selected four regions of particular interest, as defined by Buchard et al. (2017). These included the dust transport region from northern Africa to the North Atlantic, the biomass burning regions of southern Africa and the Amazon, and an area over the continental United States. Figure 13 shows the June–July–August 2016 regional average of CALIOP 532 nm aerosol attenuated backscatter in black, and the corresponding attenuated backscatter sampled in space and time from GEOS-GOCART-2G in red (Supplement Figs. S17–S20 show curtain plots of attenuated backscatter coefficients over the same regions). Generally, the GEOS-GOCART-2G attenuated backscatter profile tends to exhibit comparable vertical structure to CALIOP in all four regions of study. Notably, GEOS-GOCART-2G attenuated backscatter values agree well with CALIOP values within the CALIOP 25th–75th percentile range, and their maximum values are located at around the same height. GEOS-GOCART-2G overestimates attenuated backscatter near the surface and underestimates attenuated backscatter just above the boundary layer over the United States and South American regions, which may be due to insufficient convective transport between the boundary layer and free troposphere, or the lack of a plume rise parameterization for intense fires. Similar biases in the vertical profile in aerosol extinction over the southern African region in the GEOS model were pointed out by Das et al. (2017) and attributed to the transport of smoke.
As observed in our MERRA-2 study (Buchard et al., 2017), near-surface attenuated backscatter is underestimated relative to CALIOP in the northern and southern African regions, particularly for sea salt type aerosols near the ocean (Figs. S19–S20). This could be due to either errors in the aerosol mass or in the hygroscopic growth assumption during the conversion from aerosol mass to optical properties. Nonetheless, calibration errors in CALIOP also need to be considered as they tend to accumulate near the surface, making it difficult to place too much confidence in CALIOP values near the surface.
4.2.5 Surface mass
Across the United States, surface particulate matter is evaluated in the GEOS-GOCART-2G model relative to the IMPROVE network. GEOS overestimates PM2.5 throughout the entire period of 2016 through 2019; however, the model is well correlated to the observations (Fig. 14). The 2017 and 2018 wildfire seasons were particularly bad in the United States, as indicated by the summertime maxima in PM2.5 in the IMPROVE observations and GEOS. The total fine surface matter is further divided into individual aerosol species in Fig. 15. Like with the total PM2.5, sulfate aerosol is consistently overestimated in GEOS. The IMPROVE observations indicate a seasonal cycle in sulfate that peaks in the summer, which is muted in GEOS. GEOS also struggles with the seasonal cycle for fine-mode nitrate, overexaggerating the summertime minimum and wintertime maximum. The largest contributor to the overestimate of PM2.5 in GEOS is organic carbon. During biomass burning events in the summers of 2017 and 2018, the mean surface concentration of organic matter in the model exceeds the mean plus 1 standard deviation in the observations. Although the sampling differs, AOD is underestimated with respect to satellite observations during the same events (Fig. 6e). This indicates either too much aerosol is at the surface and not transported higher in the atmosphere and/or that the mass extinction efficiency for smoke is too low in the model. Dust suffers from the opposite problem. Both the mean and the variability are underestimated by GEOS, with the largest bias during the summer months. Dust emissions were tuned for more prominent regions such as the Sahara Desert. It is likely that the emissions are not representative of the soil conditions in the United States in addition to deficiencies in the long-range transport (Kim et al., 2019, 2021).
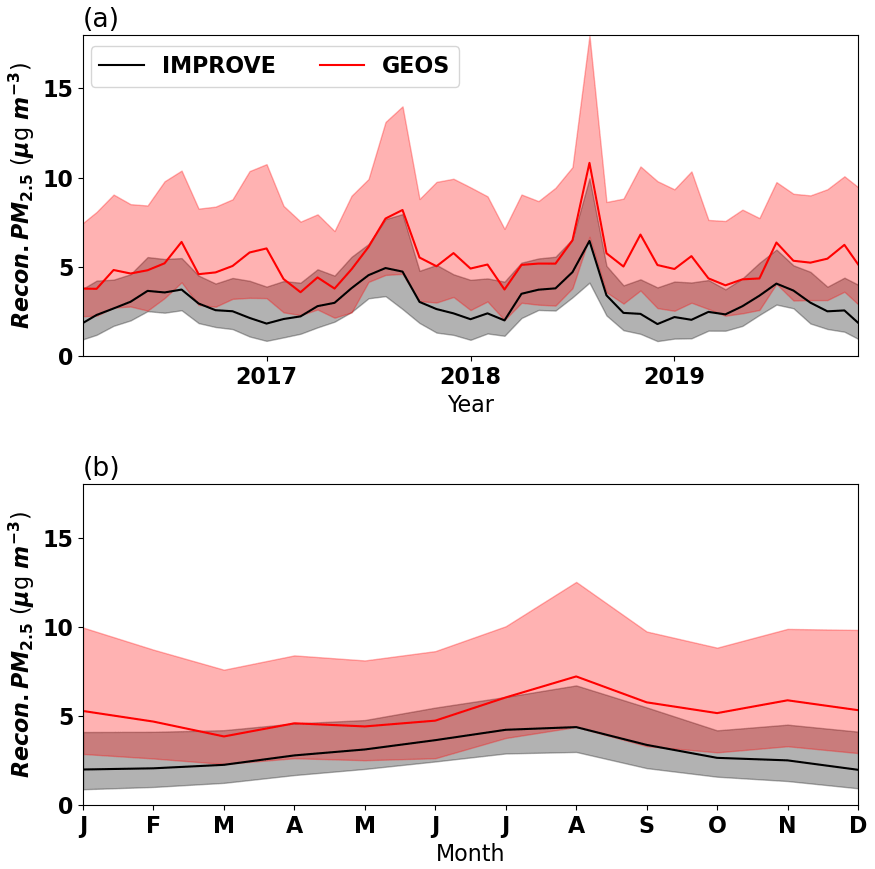
Figure 14(a) Time series of monthly median and (b) median seasonal cycle of reconstructed PM2.5 for the IMPROVE monitoring stations across the United States from the observations and GEOS GOCART-2G benchmark simulation. Shading lies between the 25th and 75th percentiles.
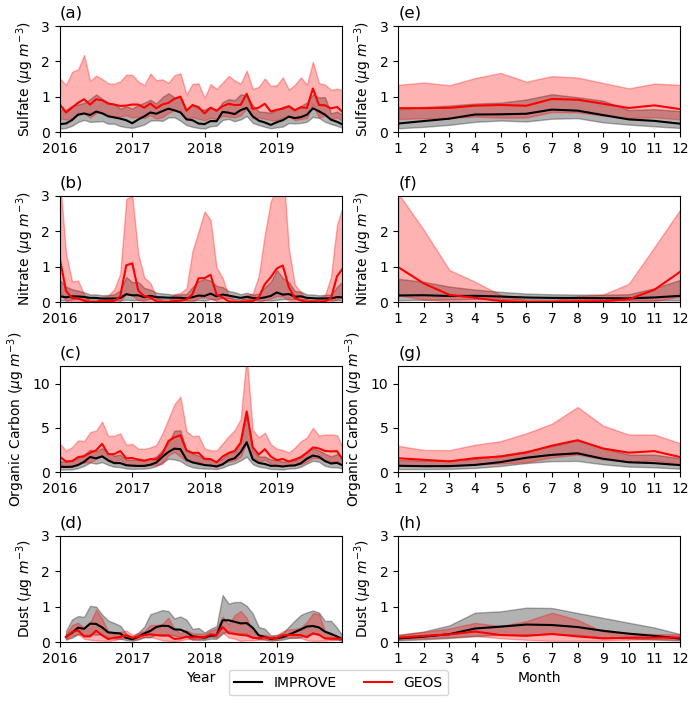
Figure 15Time series of the monthly median and median seasonal cycle for fine (a, e) sulfate, (b, f) nitrate, (c, g) organic carbon, and (d, h) dust averaged for the IMPROVE monitoring stations across the United States from the observations and GEOS GOCART-2G benchmark simulation. Shading lies between the 25th and 75th percentiles.
The European Monitoring and Evaluation Programme (EMEP) had 67 stations across Europe with PM2.5 data for the period of 2016 through 2019; however, only a fraction of those also provided sulfate, nitrate, and carbon. There were no observations of dust available. Four representative stations within Germany and one in Poland have been selected due to their availability of data and consistency with instrumentation. GOCART-2G overestimates surface PM2.5, especially during the winter months (Fig. 16). This is the opposite bias from Provençal et al. (2017), which evaluated the MERRAero reanalysis, and there are multiple reasons as to why there could be a larger aerosol concentration in the GOCART-2G simulations (which do not assimilate aerosol data). Aside from investigating a later time period for a subset of stations, nitrate and brown carbon were not included in MERRAero, although data assimilation may have apportioned the mass adjustments to the represented species. Additionally, we used an aerodynamic diameter for the particle size and accounted for hygroscopic growth since the observations are acclimated to a relative humidity of 50 % prior to being recorded, in contrast to the geometric diameter and assumption of dry aerosol used by Provençal et al. (2017). Relating the seasonal cycle of surface aerosol mass in Central Europe to the AOD in Fig. 7d, there is an evident mismatch.
To further diagnose potential contributions to positive bias in PM2.5 over Europe, sulfate, nitrate, and carbon are evaluated. Like with PM2.5, all species are overestimated by the model (Fig. 17). Most easily seen by comparing the spread between the 25th and 75th percentiles, GEOS captures the seasonal cycle of nitrate, organic carbon, and black carbon to some extent. The late winter peak in nitrate occurs a month too early in the model, with a drastic decrease in the spring, perhaps indicating an issue with the emissions. While the seasonal cycle of carbonaceous aerosols is exaggerated in GOCART-2G, it correctly predicts a summertime minimum and a November maximum in black carbon. Given that PM2.5, sulfate, nitrate, and carbon are all overestimated in Europe, it is evident that there is a concern much larger than processes related to a single species, as was the case for the United States. With only five stations analyzed, representativeness becomes a concern when comparing a single point to a box with a resolution of roughly 50 km. However, the site description for Melpitz, one of the stations used, states that the site is representative of the Central European background troposphere following comparison with multiple other sites (https://gawsis.meteoswiss.ch/GAWSIS/#/search/station/stationReportDetails/0-20008-0-MEL, last access: 24 February 2023). Other plausible explanations include biases in the modeled planetary boundary layer height and aggressive hygroscopic growth to match a relative humidity of 50 %.
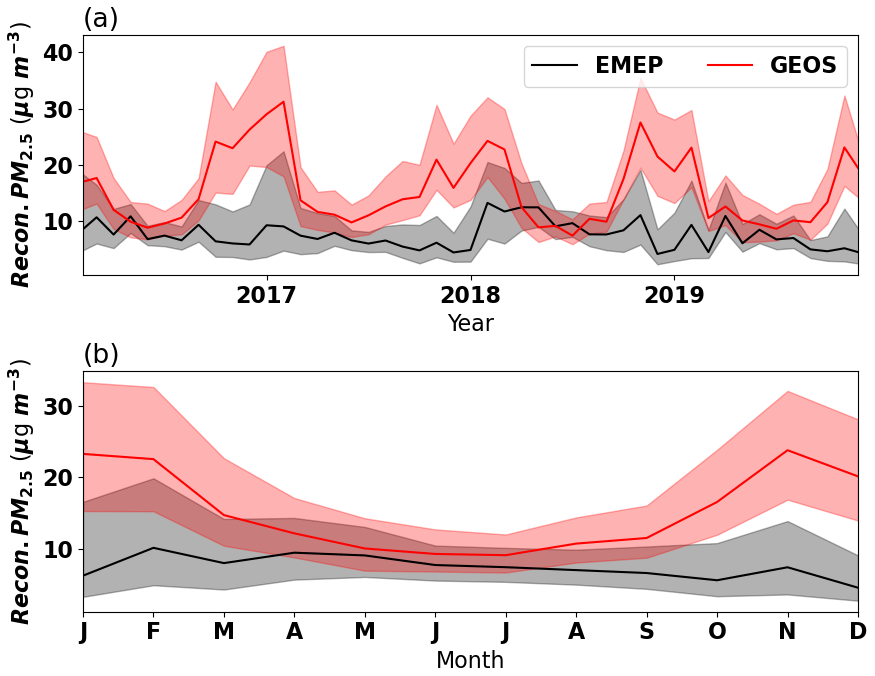
Figure 16(a) Time series of monthly median and (b) median seasonal cycle of reconstructed PM2.5 from four EMEP monitoring stations across Germany and one in Poland from the observations and GEOS GOCART-2G benchmark simulation. Shading lies between the 25th and 75th percentiles.
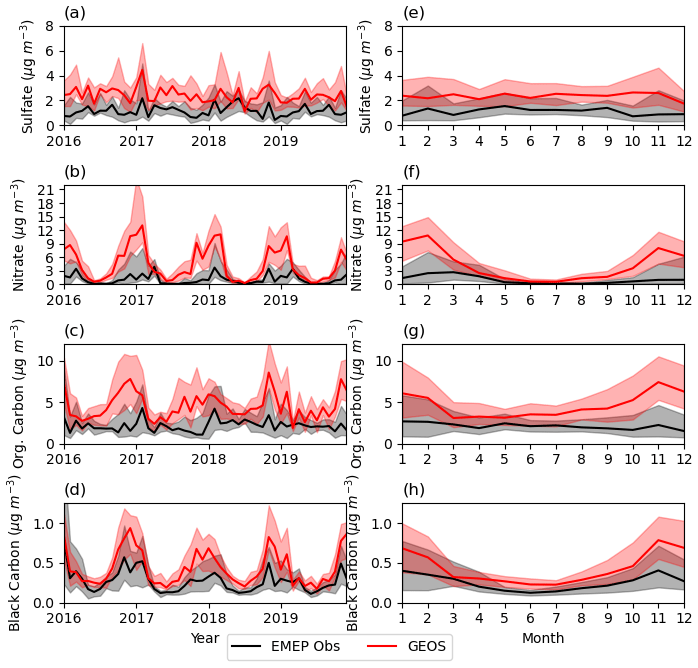
Figure 17Time series of the monthly median and median seasonal cycle for fine (a, e) sulfate, (b, f) nitrate, (c, g) organic carbon, and (d, h) black carbon for four EMEP stations across Germany and one in Poland from the observations and GEOS GOCART-2G benchmark simulation. Shading lies between the 25th and 75th percentiles.
GOCART, the underlying aerosol module within the Goddard Earth Observing System (GEOS), underwent an overhaul that coupled science changes with a code refactoring to enable future development of modeled aerosols within the system. Primary science changes focused on a repartitioning of carbonaceous aerosol, distinguished based on the emission sources for organic matter. Scientifically, no changes were made to dust, sea salt, nitrate, or sulfate when moving from the legacy GOCART code to GOCART-2G. Therefore, any biases in these species in GOCART-2G were either inherited from prior versions of GOCART or introduced based on changes to emissions.
The modernization of GOCART-2G was necessary to enable future development. The use of multiple instances for a single species is employed for the three sub-species of carbon. This development could be expanded upon in future versions with, for example, ash as an additional instance of dust. The ability to have diagnostics provided in multiple user selected wavelengths is particularly useful for aerosol assimilation and facilitates the comparison of the model with other sensors, such as OMPS LP. At the present time, GEOS assimilates AOD at 550 nm. It is anticipated that additional wavelengths will be added for aerosol assimilation after GEOS transitions to a Joint Effort for Data assimilation Integration (JEDI)-based system. Assimilated information pertaining to the Ångström exponent will be highly beneficial, giving the model a sense of the aerosol speciation from the observations.
In its current form, GOCART-2G can reproduce observed aerosol properties but has some notable potential for improvement. The spatial pattern of AOD across the globe is generally captured, and the magnitude and seasonal cycle of AOD agrees well with MODIS satellite observations. Conversely, regions characterized by dust or biomass burning aerosols have overestimated and underestimated AOD, respectively. Further evaluation of surface aerosol mass in the United States suggests the mass extinction efficiency for biomass burning aerosol is too low in GOCART-2G. This is corroborated by evaluations of GEOS with GOCART-2G using data collected from recent airborne field campaigns (Collow et al., 2022). An additional concern elucidated by comparing the seasonal cycle of AOD over North America with the seasonal cycle of surface mass is the loading of nitrate as both are overestimated in the winter and underestimated in the summer. Nitrate loading is likely only part of the reasoning behind the AOD bias as nitrate is minor contributor to the total aerosol. Nevertheless, the seasonal cycle of nitrate, controlled by the prescribed oxidant fields from the MERRA-2 GMI simulation, should be further evaluated. Finally, the modeled surface mass concentration of dust is biased low during the summer months across the United States, coinciding with the underestimate in AOD. GOCART-2G is likely missing local sources of agricultural dust in the United States.
The concerns regarding the seasonal cycle of the AOD bias over Europe are more complicated. The EMEP database did not include surface observations of dust for the time period of our benchmark simulation. On occasion, African dust is transported northward into Europe with the occurrence of dust atmospheric rivers peaking in the spring months (Chakraborty et al., 2022), and this is a feature that was not sufficiently evaluated here. Should dust in the model be deposited too quickly and not reach central Europe, a negative bias in AOD would occur. Another possibility for the summertime AOD bias in GOCART2G is a deficiency in the aerosol extinction from long-range transported smoke from boreal wildfires. As was the case with the 2017 pyroCB events in British Columbia, wildfire smoke was lofted high enough such that it could circumnavigate the Northern Hemisphere and cause aerosol extinction to occur in the stratosphere over Europe. Das et al. (2021) demonstrated the GEOS modeled aerosol extinction in Germany was underestimated within the smoke plume that was transported from a PyroCB event in British Columbia, while Shang et al. (2023) showed that MERRA-2 struggled with the aerosol speciation during a smoke transport event that impacted Europe. In a situation such as this, the total column AOD would be impacted by the upper-level smoke; however, this is not corroborated by an increase in the concentration of surface particulate matter. Furthermore, we only included select PyroCB events, which means there could be additional cases in which smoke from Canada reaches Europe that are not represented in the model because the aerosol was emitted too low in altitude and deposited before crossing the Atlantic Ocean. Finally, the seasonal cycle of surface nitrate is amplified compared to observations. Uncertainty remains pertaining to the wet deposition of aerosols and how that may contribute to biases in the seasonal cycle of AOD of Europe, warranting future investigation.
Prescribed anthropogenic emissions are a source of uncertainty in the GEOS-GOCART2G modeled AOD and surface mass concentrations, particularly for regions such as North America, Europe, and southern Asia. Emissions of SO2 over China, India, western Europe, and the United States from the CEDS inventory are in general lower than version 6 of the Emissions Database for Global Atmospheric Research (EDGAR) and the recent estimates from the Copernicus Atmosphere Monitoring Service (Soulie et al., 2023). The spread between the different emission data products is particularly large over Asia. Moreover, these data products provide monthly estimates that the GEOS-GOCART2G model linearly interpolates to a daily timescale. When doing so, the model does not impose a scaling based on the day of the week or the time of day, which could be an important indicator of the emissions on a sub-monthly timescale.
Based on the analysis presented here and results from previous studies found in literature, priorities for future development within GOCART-2G should include the following steps:
-
implementing a more physically based emission scheme and size distribution for dust to ease the overestimate in AOD over northern Africa and improve the long-range transport of dust,
-
increasing the mass extinction efficiency for biomass burning aerosol to decrease the overestimate in particulate matter while increasing the AOD in biomass burning regions,
-
quantifying the uncertainty in AOD and surface particulate matter due to anthropogenic emissions and how this may change with a scaling factor for the day of the week or time of day,
-
investigating the seasonal cycle of nitrate and precursor gaseous species that lead to the production of nitrate aerosol.
Although this evaluation was comprehensive in terms of aerosol optical depth, surface mass, and the vertical profile of attenuated backscatter, the sources and sinks of individual aerosol species were not thoroughly evaluated and warrant future study.
Table A1Aerosol particle size ranges for dust, sea salt, carbon, sulfate, and nitrate in GOCART-2G. Note a lower and upper radius is not given for carbon or sulfate as there are not discrete size bins. The smallest size bin for dust is further divided into four sub-bins for optics calculations according to Tegen and Lacis (1996).
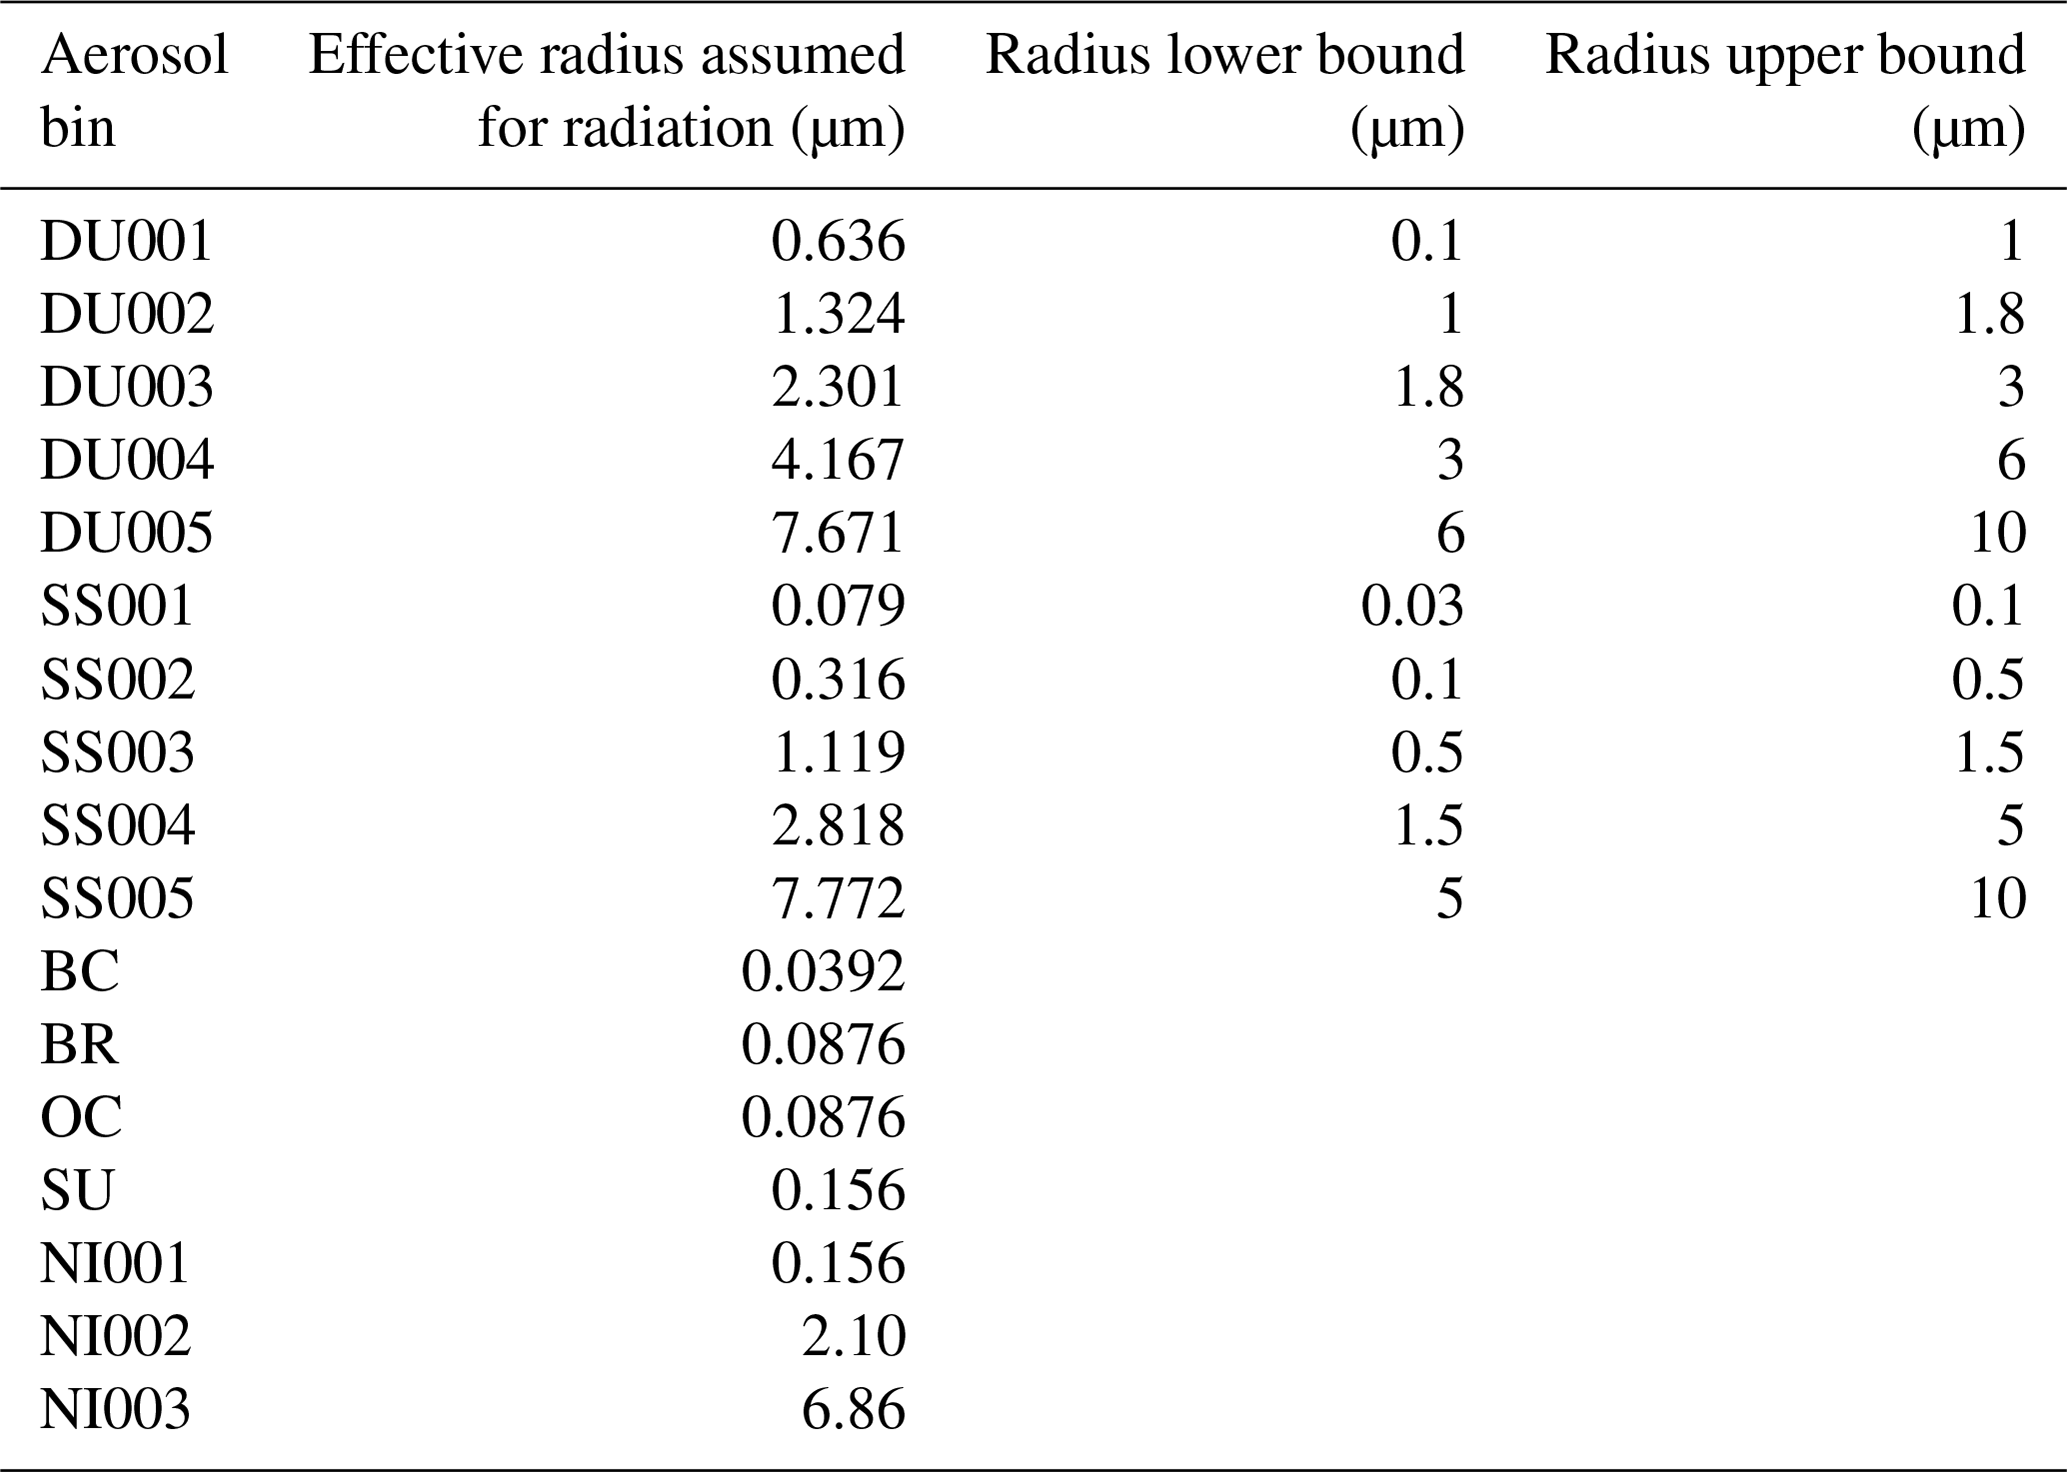
Table A2Optics table versions in the initial release of GOCART-2G.
GEOS, including GOCART-2G, is a publicly available Earth System model with source code at https://github.com/GEOS-ESM and https://doi.org/10.5281/zenodo.8059710 (Global Modeling and Assimilation Office, 2023). The archived code includes software to set up and run the model, compute AOD from MODIS Level 2 reflectances, and post process the model output.
All observational data used are from publicly available datasets. MODIS Level 2 reflectances are available from https://doi.org/10.5067/MODIS/MOD04_L2.006 (Levy et al., 2015a), for Terra and https://doi.org/10.5067/MODIS/MYD04_L2.006 (Levy et al., 2015b) for Aqua, CALIOP data can be downloaded at https://doi.org/10.5067/CALIOP/CALIPSO/LID_L15-STANDARD-V1-00 (NASA/LARC/SD/ASDC, 2019), AERONET observations can be downloaded at https://aeronet.gsfc.nasa.gov/cgi-bin/webtool_aod_v3 (last access: 13 February 2024, Giles et al., 2019), IMPROVE data can be downloaded from the Federal Land Manager Environmental Database (2024) at http://views.cira.colostate.edu/fed/DataWizard/Default.aspx, and EMEP data can be downloaded from EBAS at https://ebas-data.nilu.no/ (European Monitoring and Evaluation Programme, 2024). Model data, in addition to the observational data used, is archived at https://doi.org/10.5281/zenodo.8212822 (Collow et al., 2023b).
The supplement related to this article is available online at: https://doi.org/10.5194/gmd-17-1443-2024-supplement.
ABC, PRC, and VB contributed to the visualization. PRC, AMdS, and RG contributed to the software and data curation. ABC was responsible for original draft preparation and PRC, AMdS, VB, MC, HB, DK, SD, and VA contributed to review and editing.
The contact author has declared that none of the authors has any competing interests.
Publisher's note: Copernicus Publications remains neutral with regard to jurisdictional claims made in the text, published maps, institutional affiliations, or any other geographical representation in this paper. While Copernicus Publications makes every effort to include appropriate place names, the final responsibility lies with the authors.
This work was accomplished through computing resources from the NASA Center for Climate Simulation (NCCS). Elliot Sherman is acknowledged for his work in refactoring GOCART. The software infrastructure team at NASA's Global Modeling Assimilation was invaluable throughout the process of developing GOCART-2G. We wish to thank Tom Clune, Ben Auer, Weiyuan Jiang, Matt Thompson, and Atanas Trayanov for their assistance, as well as Anton Darmenov for providing his expertise throughout the code refactoring.
We thank the AERONET principal investigators and co-investigators and their staff, for establishing and maintaining the 80 sites used in this investigation.
IMPROVE is a collaborative association of state, tribal, and federal agencies, and international partners. The U.S. Environmental Protection Agency is the primary funding source, with contracting and research support from the National Park Service. The Air Quality Group at the University of California, Davis, is the central analytical laboratory, with ion analysis provided by Research Triangle Institute, and carbon analysis is provided by the Desert Research Institute.
This research has been supported by the NASA Earth Sciences Division, Modeling, Analysis, and Prediction (MAP) Program.
This paper was edited by Po-Lun Ma and reviewed by three anonymous referees.
Balkanski, Y. J., Jacob, D. J., Gardner, G. M., Graustein, W. C., and Turekian, K. K.: Transport and residence times of tropospheric aerosols inferred from a global three-dimensional simulation of 210Pb, J. Geophys. Res., 98, 20573, https://doi.org/10.1029/93JD02456, 1993.
Bian, H., Chin, M., Hauglustaine, D. A., Schulz, M., Myhre, G., Bauer, S. E., Lund, M. T., Karydis, V. A., Kucsera, T. L., Pan, X., Pozzer, A., Skeie, R. B., Steenrod, S. D., Sudo, K., Tsigaridis, K., Tsimpidi, A. P., and Tsyro, S. G.: Investigation of global particulate nitrate from the AeroCom phase III experiment, Atmos. Chem. Phys., 17, 12911–12940, https://doi.org/10.5194/acp-17-12911-2017, 2017.
Bouwman, A. F., Lee, D. S., Asman, W. A. H., Dentener, F. J., Van Der Hoek, K. W., and Olivier, J. G. J.: A global high-resolution emission inventory for ammonia, Global Biogeochem. Cy., 11, 561–587, https://doi.org/10.1029/97GB02266, 1997.
Bozzo, A., Benedetti, A., Flemming, J., Kipling, Z., and Rémy, S.: An aerosol climatology for global models based on the tropospheric aerosol scheme in the Integrated Forecasting System of ECMWF, Geosci. Model Dev., 13, 1007–1034, https://doi.org/10.5194/gmd-13-1007-2020, 2020.
Buchard, V., Da Silva, A. M., Randles, C. A., Colarco, P., Ferrare, R., Hair, J., Hostetler, C., Tackett, J and Winker, D.: Evaluation of the surface PM2.5 in Version 1 of the NASA MERRA Aerosol Reanalysis over the United States, Atmos. Environ., 125, 100–111, https://doi.org/10.1016/j.atmosenv.2015.11.004, 2016.
Buchard, V., Randles, C. A., da Silva, A. M., Darmenov, A., Colarco, P. R., Govindaraju, R., Ferrare, R., Hair, J., Beyersdorf, A. J., Ziemba, L. D., and Yu, H.: The MERRA-2 Aerosol Reanalysis, 1980 Onward. Part II: Evaluation and Case Studies, J. Climate, 30, 6851–6872, https://doi.org/10.1175/JCLI-D-16-0613.1, 2017.
Burgos, M. A., Andrews, E., Titos, G., Benedetti, A., Bian, H., Buchard, V., Curci, G., Kipling, Z., Kirkevåg, A., Kokkola, H., Laakso, A., Letertre-Danczak, J., Lund, M. T., Matsui, H., Myhre, G., Randles, C., Schulz, M., van Noije, T., Zhang, K., Alados-Arboledas, L., Baltensperger, U., Jefferson, A., Sherman, J., Sun, J., Weingartner, E., and Zieger, P.: A global model–measurement evaluation of particle light scattering coefficients at elevated relative humidity, Atmos. Chem. Phys., 20, 10231–10258, https://doi.org/10.5194/acp-20-10231-2020, 2020.
Carn, S. A., Fioletov, V. E., McLinden, C. A., Li, C., and Krotkov, N. A.: A decade of global volcanic SO2 emissions measured from space, Sci. Rep., 7, 44095, https://doi.org/10.1038/srep44095, 2017.
Case, P., Colarco, P. R., Toon, B., Aquila, V., and Keller, C. A.: Interactive stratospheric aerosol microphysics-chemistry simulations of the 1991 Pinatubo volcanic aerosols with newly coupled sectional aerosol and stratosphere-troposphere chemistry modules in the NASA GEOS Chemistry-Climate Model (CCM), J. Adv. Model. Earth Sy., 15, e2022MS003147, https://doi.org/10.1029/2022MS003147, 2023.
Chakraborty, S., Guan, B., Waliser, D. E., and da Silva, A. M.: Aerosol atmospheric rivers: climatology, event characteristics, and detection algorithm sensitivities, Atmos. Chem. Phys., 22, 8175–8195, https://doi.org/10.5194/acp-22-8175-2022, 2022.
Chin, M., Rood, R. B., Lin, S.-J., Müller, J.-F., and Thompson, A. M.: Atmospheric sulfur cycle simulated in the global model GOCART: Model description and global properties, J. Geophys. Res.-Atmos., 105, 24671–24687, https://doi.org/10.1029/2000JD900384, 2000.
Chin, M., Ginoux, P., Kinne, S., Torres, O., Holben, B. N., Duncan, B. N., Martin, R. V., Logan, J. A., Higurashi, A., and Nakajima, T.: Tropospheric aerosol optical thickness from the GOCART model and comparisons with satellite and sun photometer measurements, J. Atmos. Sci., 59, 461–483, https://doi.org/10.1175/1520-0469(2002)059<0461:taotft>2.0.co;2, 2002.
Chin, M., Chu, A., Levy, R., Remer, L., Kaufman, Y., Holben, B., Eck, T., Ginoux, P., and Gao, Q.: Aerosol distribution in the Northern Hemisphere during ACE-Asia: Results from global model, satellite observations, and Sun photometer measurements, J. Geophys. Res.-Atmos., 109, 1–15, https://doi.org/10.1029/2004JD004829, 2004.
Clough, S. A., Shephard, M. W., Mlawer, E. J., Delamere, J. S., Iacono, M. J., Cady-Pereira, K., Boukabara, S., and Brown, P. D.: Atmospheric radiative transfer modeling: a summary of the AER codes, J. Quant. Spectrosc. Ra., 91, 233–244, 2005.
Colarco, P., Da Silva, A., Chin, M., and Diehl, T.: Online simulations of global aerosol distributions in the NASA GEOS-4 model and comparisons to satellite and ground-based aerosol optical depth, J. Geophys. Res.-Atmos., 115, D14207, https://doi.org/10.1029/2009JD012820, 2010.
Colarco, P. R., Nowottnick, E. P., Randles, C. A., Yi, B., Yang, P., Kim, K.-M., Smith, J. A., and Bardeen, C. G.: Impact of radiatively interactive dust aerosols in the NASA GEOS-5 climate model: Sensitivity to dust particle shape and refractive index, J. Geophys. Res.-Atmos., 119, 753–786, https://doi.org/10.1002/2013JD020046, 2014.
Colarco, P. R., Gassó, S., Ahn, C., Buchard, V., da Silva, A. M., and Torres, O.: Simulation of the Ozone Monitoring Instrument aerosol index using the NASA Goddard Earth Observing System aerosol reanalysis products, Atmos. Meas. Tech., 10, 4121–4134, https://doi.org/10.5194/amt-10-4121-2017, 2017.
Collow, A., Buchard, V., Chin, M., Colarco, P., Darmenov, A., and da Silva, A.: Supplemental Documentation for GEOS Aerosol Products, GMAO Office Note No. 22 (Version 1.0), 8 pp., https://gmao.gsfc.nasa.gov/pubs/docs/Collow1463.pdf (last access: 9 March 2023), 2023a.
Collow, A., Colarco, P., da Silva, A., Buchard, V., Bian, H., Chin, M., Das, S., Govindaraju, R., Kim, D., and Aquila, V.: Data for “Benchmarking GOCART-2G in the Goddard Earth Observing System (GEOS)” (Version 1), Zenodo [data set], https://doi.org/10.5281/zenodo.8212822, 2023b.
Collow, A. B. M., Buchard, V., Colarco, P. R., da Silva, A. M., Govindaraju, R., Nowottnick, E. P., Burton, S., Ferrare, R., Hostetler, C., and Ziemba, L.: An evaluation of biomass burning aerosol mass, extinction, and size distribution in GEOS using observations from CAMP2Ex, Atmos. Chem. Phys., 22, 16091–16109, https://doi.org/10.5194/acp-22-16091-2022, 2022.
Darmenov, A. and da Silva, A.: The quick fire emissions dataset (QFED) – Documentation of versions 2.1, 2.2 and 2.4. NASA//TM-2015-104606, Vol. 38, NASA Global Modeling and Assimilation Office, 183 pp., https://gmao.gsfc.nasa.gov/pubs/docs/Darmenov796.pdf (last access: 2 August 2022), 2015.
Das, S., Harshvardhan, H., Bian, H., Chin, M., Curci, G., Protonotariou, A.P., Mielonen, T., Zhang, K., Wang, H., and Liu, X.: Biomass burning aerosol transport and vertical distribution over the South African-Atlantic region, J. Geophys. Res.-Atmos., 122, 6391–6415, https://doi.org/10.1002/2016JD026421, 2017.
Das, S., Colarco, P. R., Oman, L. D., Taha, G., and Torres, O.: The long-term transport and radiative impacts of the 2017 British Columbia pyrocumulonimbus smoke aerosols in the stratosphere, Atmos. Chem. Phys., 21, 12069–12090, https://doi.org/10.5194/acp-21-12069-2021, 2021.
European Monitoring and Evaluation Programme: https://ebas-data.nilu.no/, last access: 13 February 2024.
Federal Land Manager Environmental Database: IMPROVE Aerosol, Federal Land Manager Environmental Database [data set], https://views.cira.colostate.edu/fed/Express/ImproveData.aspx, last access: 13 February 2024.
Feng, L., Smith, S. J., Braun, C., Crippa, M., Gidden, M. J., Hoesly, R., Klimont, Z., van Marle, M., van den Berg, M., and van der Werf, G. R.: The generation of gridded emissions data for CMIP6, Geosci. Model Dev., 13, 461–482, https://doi.org/10.5194/gmd-13-461-2020, 2020.
Fuchs, N. A.: The mechanics of aerosols, edited by: Davies, C. N., London, Pergamon Press, 408, Q. J. Roy. Meteor. Soc., 91, 249–249, https://doi.org/10.1002/qj.49709138822, 1965.
Gelaro, R., McCarty, W., Suarez, M. J., Todling, R., Molod, A., Takacs, L., Randles, C. A., Darmenov, A., Bosilovich, M. G., Reichle, R., Wargan, K., Coy, L., Cullather, R., Draper, C., Akella, S., Buchard, V., Conaty, A., Silva, A. M. da, Gu, W., Kim, G.-K., Koster, R., Lucchesi, R., Merkova, D., Nielsen, J. E., Partyka, G., Pawson, S., Putman, W., Rienecker, M., Schubert, S. D., Sienkiewicz, M., and Zhao, B.: The Modern-Era Retrospective Analysis for Research and Applications, Version 2 (MERRA-2), J. Climate, 30, 5419–5454, https://doi.org/10.1175/JCLI-D-16-0758.1, 2017.
Giles, D. M., Sinyuk, A., Sorokin, M. G., Schafer, J. S., Smirnov, A., Slutsker, I., Eck, T. F., Holben, B. N., Lewis, J. R., Campbell, J. R., Welton, E. J., Korkin, S. V., and Lyapustin, A. I.: Advancements in the Aerosol Robotic Network (AERONET) Version 3 database – automated near-real-time quality control algorithm with improved cloud screening for Sun photometer aerosol optical depth (AOD) measurements, Atmos. Meas. Tech., 12, 169–209, https://doi.org/10.5194/amt-12-169-2019, 2019.
Giorgi, F. and Chameides, L. W.: Rainout lifetimes of highly soluble aerosols and gases as inferred from simulations with a general circulation model, J. Geophys. Res., 91, 14367–14376, 1986.
Ginoux, P., Chin, M., Tegen, I., Prospero, J. M., Holben, B., Dubovik, O., and Lin, S.-J.: Sources and distributions of dust aerosols simulated with the GOCART model, J. Geophys. Res., 106, 20255–20273, https://doi.org/10.1029/2000JD000053, 2001.
Gliß, J., Mortier, A., Schulz, M., Andrews, E., Balkanski, Y., Bauer, S. E., Benedictow, A. M. K., Bian, H., Checa-Garcia, R., Chin, M., Ginoux, P., Griesfeller, J. J., Heckel, A., Kipling, Z., Kirkevåg, A., Kokkola, H., Laj, P., Le Sager, P., Lund, M. T., Lund Myhre, C., Matsui, H., Myhre, G., Neubauer, D., van Noije, T., North, P., Olivié, D. J. L., Rémy, S., Sogacheva, L., Takemura, T., Tsigaridis, K., and Tsyro, S. G.: AeroCom phase III multi-model evaluation of the aerosol life cycle and optical properties using ground- and space-based remote sensing as well as surface in situ observations, Atmos. Chem. Phys., 21, 87–128, https://doi.org/10.5194/acp-21-87-2021, 2021.
Global Modeling and Assimilation Office: GEOSgcm (10.23.0), Zenodo [code], https://doi.org/10.5281/zenodo.8059710, 2023.
Gong, S. L.: A parameterization of sea-salt aerosol source function for sub- and super-micron particles, Global Biogeochem. Cy., 17, 1097, https://doi.org/10.1029/2003GB002079, 2003.
Grell, G. A. and Freitas, S. R.: A scale and aerosol aware stochastic convective parameterization for weather and air quality modeling, Atmos. Chem. Phys., 14, 5233–5250, https://doi.org/10.5194/acp-14-5233-2014, 2014.
Hand, J. L., Copeland, S. A., Day, D. R., Dillner, A. M., Indresand, H., Malm, W. C., McDade, C. E., Moore, C. T., Pitchford, M. L., Schichtel, B. A., and Watson, J. G.: Spatial and Seasonal Patterns and Temporal Variability of Haze and its Constituents in the United States Report V, http://vista.cira.colostate.edu/Improve/wp-content/uploads/2016/04/Cover_TOC.pdf (last access: 24 August 2022), 2011.
Hess, M., Koepke, P., and Schult, I.: Optical properties of aerosols and clouds: The software package OPAC, B. Am. Meteorol. Soc., 79, 831–844, https://doi.org/10.1175/1520-0477(1998)079<0831:OPOAAC>2.0.CO;2, 1998.
Hodzic, A., Campuzano-Jost, P., Bian, H., Chin, M., Colarco, P. R., Day, D. A., Froyd, K. D., Heinold, B., Jo, D. S., Katich, J. M., Kodros, J. K., Nault, B. A., Pierce, J. R., Ray, E., Schacht, J., Schill, G. P., Schroder, J. C., Schwarz, J. P., Sueper, D. T., Tegen, I., Tilmes, S., Tsigaridis, K., Yu, P., and Jimenez, J. L.: Characterization of organic aerosol across the global remote troposphere: a comparison of ATom measurements and global chemistry models, Atmos. Chem. Phys., 20, 4607–4635, https://doi.org/10.5194/acp-20-4607-2020, 2020.
Hoesly, R. M., Smith, S. J., Feng, L., Klimont, Z., Janssens-Maenhout, G., Pitkanen, T., Seibert, J. J., Vu, L., Andres, R. J., Bolt, R. M., Bond, T. C., Dawidowski, L., Kholod, N., Kurokawa, J.-I., Li, M., Liu, L., Lu, Z., Moura, M. C. P., O'Rourke, P. R., and Zhang, Q.: Historical (1750–2014) anthropogenic emissions of reactive gases and aerosols from the Community Emissions Data System (CEDS), Geosci. Model Dev., 11, 369–408, https://doi.org/10.5194/gmd-11-369-2018, 2018.
Holben, B. N., Eck, T. F., Slutsker, I., Tanre, D., Buis, J. P., Setzer, A., Vermote, E., Reagan, J. A., Kaufman, Y., Nakajima, T., Lavenue, F., Jankowiak, I., and Smirnov, A.: AERONET – A federated instrument network and data archive for aerosol characterization, Remote Sens. Environ., 66, 1–16, https://doi.org/10.1016/S0034-4257(98)00031-5, 1998.
Iacono, M. J., Delamere, J. S., Mlawer, E. J., Shephard, M. W., Clough, S. A., and Collins, W. D.: Radiative forcing by long-lived greenhouse gases: Calculations with the AER radiative transfer models, J. Geophys. Res., 113, D13103, https://doi.org/10.1029/2008JD009944, 2008.
Jaeglé, L., Quinn, P. K., Bates, T. S., Alexander, B., and Lin, J.-T.: Global distribution of sea salt aerosols: new constraints from in situ and remote sensing observations, Atmos. Chem. Phys., 11, 3137–3157, https://doi.org/10.5194/acp-11-3137-2011, 2011.
Kemppinen, O., Colarco, P. R., and Castellanos, P.: GEOS aerosol optical table calculation package GEOSmie, NASA Technical Report Series on Global Modeling and Data Assimilation, Volume 63, https://gmao.gsfc.nasa.gov/pubs/docs/Kemppinen1447.pdf (last access: 13 January 2023), 2022.
Kim, D., Chin, M., Yu, H., Diehl, T., Tan, Q., Kahn, R. A., Tsigaridis, K., Bauer, S. E., Takemura, T., Pozzoli, L., Bellouin, N., Schulz, M., Peyridieu, S., Chédin, A., and Koffi, B.: Sources, sinks, and transatlantic transport of North African dust aerosol: A multimodel analysis and comparison with remote sensing data, J. Geophys. Res.-Atmos., 119, 6259–6277, https://doi.org/10.1002/2013JD021099, 2014.
Kim, D., Chin, M., Yu, H., Pan, X., Bian, H., Tan, Q., Kahn, R. A., Tsigaridis, K., Bauer, S. E., Takemura, T., Pozzoli, L., Bellouin, N., and Schulz, M.: Asian and Trans-Pacific Dust: A Multimodel and Multiremote Sensing Observation Analysis, J. Geophys. Res.-Atmos., 124, 13534–13559, https://doi.org/10.1029/2019JD030822, 2019.
Kim, D., Chin, M., Cruz, C. A., Tong, D., and Yu, H.: Spring dust in western North America and its interannual variability – Understanding the role of local and transported dust, J. Geophys. Res.-Atmos., 126, e2021JD035383, https://doi.org/10.1029/2021JD035383, 2021.
Kok, J. F., Adebiyi, A. A., Albani, S., Balkanski, Y., Checa-Garcia, R., Chin, M., Colarco, P. R., Hamilton, D. S., Huang, Y., Ito, A., Klose, M., Leung, D. M., Li, L., Mahowald, N. M., Miller, R. L., Obiso, V., Pérez García-Pando, C., Rocha-Lima, A., Wan, J. S., and Whicker, C. A.: Improved representation of the global dust cycle using observational constraints on dust properties and abundance, Atmos. Chem. Phys., 21, 8127–8167, https://doi.org/10.5194/acp-21-8127-2021, 2021.
Kramer, S. J., Alvarez, C., Barkley, A. E., Colarco, P. R., Custals, L., Delgadillo, R., Gaston, C. J., Govindaraju, R., and Zuidema, P.: Apparent dust size discrepancy in aerosol reanalysis in north African dust after long-range transport, Atmos. Chem. Phys., 20, 10047–10062, https://doi.org/10.5194/acp-20-10047-2020, 2020.
Lana, A., Bell, T. G., Simó, R., Vallina, S. M., Ballabrera-Poy, J., Kettle, A. J., Dachs, J., Bopp, L., Saltzman, E. S., Stefels, J., Johnson, J. E., and Liss, P. S.: An updated climatology of surface dimethlysulfide concentrations and emission fluxes in the global ocean, Global Biogeochem. Cy., 25, GB1004 https://doi.org/10.1029/2010GB003850, 2011.
Levy, R., Hsu, C., et al.: MODIS Atmosphere L2 Aerosol Product, NASA MODIS Adaptive Processing System, Goddard Space Flight Center [data set], USA, https://doi.org/10.5067/MODIS/MOD04_L2.006, 2015a.
Levy, R., Hsu, C., et al.: MODIS Atmosphere L2 Aerosol Product, NASA MODIS Adaptive Processing System, Goddard Space Flight Center [data set], USA, https://doi.org/10.5067/MODIS/MYD04_L2.061, 2015b.
Levy, R. C., Mattoo, S., Sawyer, V., Shi, Y., Colarco, P. R., Lyapustin, A. I., Wang, Y., and Remer, L. A.: Exploring systematic offsets between aerosol products from the two MODIS sensors, Atmos. Meas. Tech., 11, 4073–4092, https://doi.org/10.5194/amt-11-4073-2018, 2018.
Liss, P. S. and Merlivat, L.: Air-sea gas exchange rates: Introduction and synthesis, in: The Role of Air-Sea Exchange in Geochemical Cyclig, edited by: Buat-Menard, P., Dreidel, Norwell, Mass., 113–127, https://doi.org/10.1007/978-94-009-4738-2_5, 1986.
Liu, H., Jacob, D., Bey, I., and Yantosca, R.: Constraints from Pb-210 and Be-7 on wet deposition and transport in a global three-dimensional chemical tracer model driven by assimilated meteorological fields, J. Geophys. Res., 106, 12109–12128, https://doi.org/10.1029/2000JD900839, 2001.
Lock, A. P., Brown, A. R., Bush, M. R., Martin, G. M., and Smith, R. N. B.: A New Boundary Layer Mixing Scheme. Part I: Scheme Description and Single-Column Model Tests, Mon. Weather Rev., 128, 3187–3199, https://doi.org/10.1175/1520-0493(2000)128<3187:ANBLMS>2.0.CO;2, 2000.
Louis, J. F.: A parametric model of vertical eddy fluxes in the atmosphere, Bound.-Lay. Meteorol., 17, 187–202, https://doi.org/10.1007/BF00117978, 1979.
Lu, C.-H., da Silva, A., Wang, J., Moorthi, S., Chin, M., Colarco, P., Tang, Y., Bhattacharjee, P. S., Chen, S.-P., Chuang, H.-Y., Juang, H.-M. H., McQueen, J., and Iredell, M.: The implementation of NEMS GFS Aerosol Component (NGAC) Version 1.0 for global dust forecasting at NOAA/NCEP, Geosci. Model Dev., 9, 1905–1919, https://doi.org/10.5194/gmd-9-1905-2016, 2016.
Lucchesi, R.: File Specification for GEOS FP. GMAO Office Note No. 4 (Version 1.2), 61 pp, http://gmao.gsfc.nasa.gov/pubs/office_notes (last access: 9 March 2023), 2018.
Maria, S. F., Russell, L. M., Gilles, M. K., and Myneni, S. C. B.: Organic aerosol growth mechanisms and their climate-forcing implications, Science, 306, 1921–1924, https://doi.org/10.1126/science.1103491, 2004.
McDuffie, E. E., Smith, S. J., O'Rourke, P., Tibrewal, K., Venkataraman, C., Marais, E. A., Zheng, B., Crippa, M., Brauer, M., and Martin, R. V.: A global anthropogenic emission inventory of atmospheric pollutants from sector- and fuel-specific sources (1970–2017): an application of the Community Emissions Data System (CEDS), Earth Syst. Sci. Data, 12, 3413–3442, https://doi.org/10.5194/essd-12-3413-2020, 2020.
Molod, A., Hackert, E., Vikhliaev, Y., Zhao, B., Barahona, D., Vernieres, G., Borovikov, A., Kovach, R. M., Marshak, J., Schubert, S., Li, Z., Lim, Y.-K., Andrews, L. C., Cullather, R., Koster, R., Achuthavarier, D., Carton, J., Coy, L., Friere, J. L. M., Longo, K. M., Nakada, K., and Pawson, S.: GEOS-S2S Version 2: The GMAO High-Resolution Coupled Model and Assimilation System for Seasonal Prediction, J. Geophys. Res.-Atmos., 125, e2019JD031767, https://doi.org/10.1029/2019JD031767, 2020.
NASA/LARC/SD/ASDC: CALIPSO Lidar Level 1.5 Profile, V1-00, NASA Langley Atmospheric Science Data Center DAAC [data set], https://doi.org/10.5067/CALIOP/CALIPSO/LID_L15-STANDARD-V1-00, 2019.
Nielsen, J., Pawson, S., Molod, A., Auer, B., da Silva, A., Douglass, A., Duncan, B., Liang, Q., Manyin, M., Oman, L., Putman, W., Strahan, S., and Wargan, K.: Chemical Mechanisms and Their Applications in the Goddard Earth Observing System (GEOS) Earth System Model, J. Adv. Model. Earth Sy., 9, 3019–3044, https://doi.org/10.1002/2017MS001011, 2017.
O'Rourke, P., Smith, S. J., Mott, A. R., Ahsan, H., McDuffie, E. E., Crippa, M., Klimont, Z., McDonald, B., Wang, S., Nicholson, M. B., Hoesly, R. M., and Feng, L.: CEDS v_2021_04_21 Gridded emissions data, Zenodo [data set], https://doi.org/10.5281/zenodo.4741285, 2021.
Provençal, S., Buchard, V., da Silva, A. M., Leduc, R., and Barrette, N.: Evaluation of PM surface concentrations simulated by Version 1 of NASA's MERRA Aerosol Reanalysis over Europe, Atmos. Pollut. Res., 8, 374–382, https://doi.org/10.1016/j.apr.2016.10.009, 2017.
Randles, C. A., da Silva, A. M., Buchard, V., Darmenov, A., Colarco, P. R., Aquila, V., Bian, H., Nowottnick, E. P., Pan, X., Smirnov, A., Yu, H., and Govindaraju, R.: The MERRA-2 Aerosol Assimilation NASA Technical Report Series on Global Modeling and Data Assimilation, NASA/TM-2016-104606, Vol. 45, 143 pp., https://gmao.gsfc.nasa.gov/pubs/docs/Randles887.pdf (last access: 7 March 2023), 2016.
Randles, C. A., da Silva, A. M., Buchard, V., Colarco, P. R., Darmenov, A., Govindaraju, R., Smirnov, A., Holben, B., Ferrare, R., Hair, J., Shinozuka, Y., and Flynn, C. J.: The MERRA-2 Aerosol Reanalysis, 1980 Onward. Part I: System Description and Data Assimilation Evaluation, J. Climate, 30, 6823–6850, https://doi.org/10.1175/JCLI-D-16-0609.1, 2017.
Remer, L. A., Levy, R. C., Mattoo, S., Tanré, D., Gupta, P., Shi, Y., Sawyer, V., Munchak, L. A., Zhou, Y., Kim, M., Ichoku, C., Patadia, F., Li, R.-R., Gassó, S., Kleidman, R. G., and Holben, B. N.: The Dark Target Algorithm for Observing the Global Aerosol System: Past, Present, and Future, Remote Sens., 12, 2900, https://doi.org/10.3390/rs12182900, 2020.
Rémy, S., Kipling, Z., Flemming, J., Boucher, O., Nabat, P., Michou, M., Bozzo, A., Ades, M., Huijnen, V., Benedetti, A., Engelen, R., Peuch, V.-H., and Morcrette, J.-J.: Description and evaluation of the tropospheric aerosol scheme in the European Centre for Medium-Range Weather Forecasts (ECMWF) Integrated Forecasting System (IFS-AER, cycle 45R1), Geosci. Model Dev., 12, 4627–4659, https://doi.org/10.5194/gmd-12-4627-2019, 2019.
Reynolds, R. W., Rayner, N. A., Smith, T. M., Stokes, D. C., and Wang, W.: An Improved In Situ and Satellite SST Analysis for Climate, J. Climate, 15, 1609–1625, https://doi.org/10.1175/1520-0442(2002)015<1609:AIISAS>2.0.CO;2, 2002.
Saxena, P., Hudischewskyj, A. B., Seigneur, C., and Seinfeld, J. H.: A comparative study of equilibrium approaches to the chemical characterization of secondary aerosols, Atmos. Environ., 20, 1471–1483, https://doi.org/10.1016/0004-6981(86)90019-3, 1986.
Sayer, A. M., Hsu, N. C., Lee, J., Kim, W. V., and Dutcher, S. T.: Validation, Stability, and Consistency of MODIS Collection 6.1 and VIIRS Version 1 Deep Blue Aerosol Data Over Land, J. Geophys. Res.-Atmos., 124, 4658–4688, https://doi.org/10.1029/2018JD029598, 2019.
Schwartz, M. J., Pumphrey, H. C., Santee, M. L., Manney, G. L., Lambert, A., Livesey, N. J., Millán, L., Neu, J. L., Read, W. J., and Werner, F.: Australian New Year's PyroCb impact on Stratospheric Composition, Geophys. Res. Lett., 47, e2020GL090831, https://doi.org/10.1029/2020GL090831, 2020.
Shang, X., Lipponen, A., Filioglou, M., Sundström, A.-M., Parrington, M., Buchard, V., Darmenov, A. S., Welton, E. J., Marinou, E., Amiridis, V., Sicard, M., Rodríguez-Gómez, A., Komppula, M., and Mielonen, T.: Monitoring biomass burning aerosol transport using CALIOP observations and reanalysis models: a Canadian wildfire event in 2019, EGUsphere [preprint], https://doi.org/10.5194/egusphere-2023-1945, 2023.
Soulie, A., Granier, C., Darras, S., Zilbermann, N., Doumbia, T., Guevara, M., Jalkanen, J.-P., Keita, S., Liousse, C., Crippa, M., Guizzardi, D., Hoesly, R., and Smith, S.: Global Anthropogenic Emissions (CAMS-GLOB-ANT) for the Copernicus Atmosphere Monitoring Service Simulations of Air Quality Forecasts and Reanalyses, Earth Syst. Sci. Data Discuss. [preprint], https://doi.org/10.5194/essd-2023-306, in review, 2023.
Strode, S. A., Ziemke, J. R., Oman, L. D., Lamsal, L. N., Olsen, M. A., and Liu, J.: Global changes in the diurnal cycle of surface ozone, Atmos. Environ., 199, 323–333, https://doi.org/10.1016/j.atmosenv.2018.11.028, 2019.
Taha, G., Loughman, R., Zhu, T., Thomason, L., Kar, J., Rieger, L., and Bourassa, A.: OMPS LP Version 2.0 multi-wavelength aerosol extinction coefficient retrieval algorithm, Atmos. Meas. Tech., 14, 1015–1036, https://doi.org/10.5194/amt-14-1015-2021, 2021.
Tegen, I. and Lacis, A. A.: Modeling of particle size distribution and its influence on the radiative properties of mineral dust aerosol, J. Geophys. Res.-Atmos., 101, 19237–19244, https://doi.org/10.1029/95jd03610, 1996.
Textor, C., Schulz, M., Guibert, S., Kinne, S., Balkanski, Y., Bauer, S., Berntsen, T., Berglen, T., Boucher, O., Chin, M., Dentener, F., Diehl, T., Easter, R., Feichter, H., Fillmore, D., Ghan, S., Ginoux, P., Gong, S., Grini, A., Hendricks, J., Horowitz, L., Huang, P., Isaksen, I., Iversen, I., Kloster, S., Koch, D., Kirkevåg, A., Kristjansson, J. E., Krol, M., Lauer, A., Lamarque, J. F., Liu, X., Montanaro, V., Myhre, G., Penner, J., Pitari, G., Reddy, S., Seland, Ø., Stier, P., Takemura, T., and Tie, X.: Analysis and quantification of the diversities of aerosol life cycles within AeroCom, Atmos. Chem. Phys., 6, 1777–1813, https://doi.org/10.5194/acp-6-1777-2006, 2006.
Torres, O., Bhartia, P. K., Taha, G., Jethva, H., Das, S., Colarco, P., Krotkov, N., Omar, A., and Ahn, C.: Stratospheric Injection of Massive Smoke Plume From Canadian Boreal Fires in 2017 as Seen by DSCOVR-EPIC, CALIOP, and OMPS-LP Observations, J. Geophys. Res.-Atmos., 125, D032579, https://doi.org/10.1029/2020JD032579, 2020.
Tsigaridis, K., Daskalakis, N., Kanakidou, M., Adams, P. J., Artaxo, P., Bahadur, R., Balkanski, Y., Bauer, S. E., Bellouin, N., Benedetti, A., Bergman, T., Berntsen, T. K., Beukes, J. P., Bian, H., Carslaw, K. S., Chin, M., Curci, G., Diehl, T., Easter, R. C., Ghan, S. J., Gong, S. L., Hodzic, A., Hoyle, C. R., Iversen, T., Jathar, S., Jimenez, J. L., Kaiser, J. W., Kirkevåg, A., Koch, D., Kokkola, H., Lee, Y. H., Lin, G., Liu, X., Luo, G., Ma, X., Mann, G. W., Mihalopoulos, N., Morcrette, J.-J., Müller, J.-F., Myhre, G., Myriokefalitakis, S., Ng, N. L., O'Donnell, D., Penner, J. E., Pozzoli, L., Pringle, K. J., Russell, L. M., Schulz, M., Sciare, J., Seland, Ø., Shindell, D. T., Sillman, S., Skeie, R. B., Spracklen, D., Stavrakou, T., Steenrod, S. D., Takemura, T., Tiitta, P., Tilmes, S., Tost, H., van Noije, T., van Zyl, P. G., von Salzen, K., Yu, F., Wang, Z., Wang, Z., Zaveri, R. A., Zhang, H., Zhang, K., Zhang, Q., and Zhang, X.: The AeroCom evaluation and intercomparison of organic aerosol in global models, Atmos. Chem. Phys., 14, 10845–10895, https://doi.org/10.5194/acp-14-10845-2014, 2014.
Wesely, M. L.: Parameterization of Surface Resistances to Gaseous Dry Deposition in Regional-Scale Numerical-Models, Atmos. Environ., 23, 1293–1304, https://doi.org/10.1016/0004-6981(89)90153-4, 1989.
Winker, D. M., Hunt, W. H., and McGill, M. J.: Initial performance assessment of CALIOP, Geophys. Res. Lett., 34, L19803, https://doi.org/10.1029/2007GL030135, 2007.
Winker, D. M., Vaughan, M. A., Omar, A., Hu, Y., Powell, K. A., Liu, Z., Hunt, W. H., and Young, S. A.: Overview of the CALIPSO mission and CALIOP data processing algorithms, J. Atmos. Ocean. Tech., 26, 2310–2323, https://doi.org/10.1175/2009JTECHA1281., 2009.
Xian, P., Reid, J. S., Hyer, E. J., Sampson, C. R., Rubin, J. I., Ades, M., Asencio, N., Basart, S., Benedetti, A., Bhattacharjee, P. S., Brooks, M. E., Colarco, P. R., da Silva, A. M., Eck, T. F., Guth, J., Jorba, O., Kouznetsov, R., Kipling, Z., Sofiev, M., Perez Garcia-Pando, C., Pradhan, Y., Tanaka, T., Wang, J., Westphal, D. L., Yumimoto, K., and Zhang, J.: Current state of the global operational aerosol multi-model ensemble: An update from the International Cooperative for Aerosol Prediction (ICAP), Q. J. Roy. Meteor. Soc., 145, 176–209, https://doi.org/10.1002/qj.3497, 2019.
Yu, H., Tan, Q., Zhou, L., Zhou, Y., Bian, H., Chin, M., Ryder, C. L., Levy, R. C., Pradhan, Y., Shi, Y., Song, Q., Zhang, Z., Colarco, P. R., Kim, D., Remer, L. A., Yuan, T., Mayol-Bracero, O., and Holben, B. N.: Observation and modeling of the historic “Godzilla” African dust intrusion into the Caribbean Basin and the southern US in June 2020, Atmos. Chem. Phys., 21, 12359–12383, https://doi.org/10.5194/acp-21-12359-2021, 2021.
Zhang, L., Montuoro, R., McKeen, S. A., Baker, B., Bhattacharjee, P. S., Grell, G. A., Henderson, J., Pan, L., Frost, G. J., McQueen, J., Saylor, R., Li, H., Ahmadov, R., Wang, J., Stajner, I., Kondragunta, S., Zhang, X., and Li, F.: Development and evaluation of the Aerosol Forecast Member in the National Center for Environment Prediction (NCEP)'s Global Ensemble Forecast System (GEFS-Aerosols v1), Geosci. Model Dev., 15, 5337–5369, https://doi.org/10.5194/gmd-15-5337-2022, 2022.
Zhong, Q., Schutgens, N., van der Werf, G. R., Bauer, S. E., Tsigaridis, K., Mielonen, T., Checa-Garcia, R., Neubauer, D., Kipling, Z., Kirkevag, A., Olivie., D. J. L., Kokkola, H., Matsui, H., Ginoux, P., Takemura, T., Le Sager, P., Remy, S., Bian, H., and Chin, M.: Using modelled relationships and satellite observations to attribute modelled aerosol biases over biomass burning regions, Nat. Commun., 13, 5914, https://doi.org/10.1038/s41467-022-33680-4, 2022.
- Abstract
- Introduction
- GOCART aerosol module in GEOS
- Observational datasets used for model evaluation
- Evaluation of GOCART-2G
- Discussion
- Appendix A
- Code availability
- Data availability
- Author contributions
- Competing interests
- Disclaimer
- Acknowledgements
- Financial support
- Review statement
- References
- Supplement