the Creative Commons Attribution 4.0 License.
the Creative Commons Attribution 4.0 License.
 | 14 Dec 2023
A global grid model for the estimation of zenith tropospheric delay considering the variations at different altitudes
Liangke Huang
Shengwei Lan
Ge Zhu
Fade Chen
Junyu Li
Lilong Liu
The accuracy of tropospheric delay correction heavily depends on the quality of the tropospheric model, and the zenith tropospheric delay (ZTD) is an important factor affecting the tropospheric delay. Therefore, it is essential to establish a precise ZTD empirical model. The existing ZTD models are constrained by a single fitting function, lack consideration for daily cycle variations, and rely solely on data with one resolution for modeling. To address these limitations, we proposed a global piecewise ZTD empirical grid (GGZTD-P) model. This model considers the daily cycle variation and latitude factor of ZTD, using the sliding window algorithm based on fifth-generation European Centre for Medium-Range Weather Forecasts atmospheric reanalysis data (ERA5). The ZTD data from 545 radiosonde stations and the second Modern-Era Retrospective analysis for Research and Applications (MERRA-2) atmospheric reanalysis data are used to validate the accuracy of the GGZTD-P model. The results indicate that the GGZTD-P model outperforms the global pressure and temperature 3 (GPT3) model, exhibiting 26 % and 53 % lower bias and rms, respectively, when using radiosonde stations as reference values. Furthermore, when evaluated using MERRA-2 atmospheric reanalysis data, the GGZTD-P model consistently exhibits superior performance across various latitude regions. It is expected that the application of this new model will provide improved services for high-precision global navigation satellite system (GNSS) positioning and GNSS meteorology.
- Article
(11291 KB) - Full-text XML
- BibTeX
- EndNote


Global navigation satellite system (GNSS) signals experience time delay and bending effects as they pass through the neutral atmosphere, resulting in tropospheric delay. Depending on the satellite's altitude angle, tropospheric delay ranges from 2–20 m in the zenith direction (Li et al., 2018; Yao et al., 2018, 2019; Li et al., 2021), significantly affecting the positioning accuracy. Accurate zenith tropospheric delay (ZTD) information can improve GNSS positioning precision (Nafisi et al., 2012; Zhang et al., 2022; Zhao et al., 2023a; Zhang et al., 2020; Zhou et al., 2021). Currently, ZTD models can be divided into two categories: the one requires real-time measurement of meteorological parameters, and the other is for empirical models fitted according to a large volume of data and that do not require meteorological parameters.
Hopfield (1969) proposed the use of radiosonde data to establish the global tropospheric delay model, known as the Hopfield model. This model requires the input of temperature, pressure, water vapor pressure, and the station's location to calculate tropospheric data. Saastamoinen (1972) further divided the troposphere into two profiles using the standard atmospheric model of the United States and calculated other parameters of tropospheric delay indirectly with meteorological parameters to obtain ZTD. Based on Hopfield's work, Black (1978) refined the Hopfield model and established the famous Black model. These models provide high-precision tropospheric data through measured meteorological parameters. However, not all GNSS stations are equipped with expensive meteorological sensors, limiting the availability of real-time meteorological data and hindering the use of these models.
To overcome this limitation, researchers have developed several empirical models that do not rely on measured meteorological parameters (Li et al., 2020; Zhang et al., 2021). Leandro et al. (2006, 2008) developed the UNB series model, and Penna et al. (2001) developed the EGNOS model. Krueger et al. (2004) utilized the National Centre for Environmental Prediction (NCEP) atmospheric reanalysis data to establish the TropGrid model, which has a horizontal resolution of 1∘ × 1∘ and provides 25 % greater accuracy than the EGNOS model globally. Based on the TropGrid model, Schüler (2014) established the TropGrid2 model by taking into account the daily cycle variation of ZTD using multi-year Global Data Assimilation System (GDAS) data, which improves the time resolution but ignores the semi-annual cycle variation of ZTD. The global pressure and temperature (GPT) series models (Böhm et al., 2007; Lagler et al., 2013; Böhm et al., 2015; Landskron and Böhm, 2018) are based on European Centre for Medium-Range Weather Forecasts (ECMWF) atmospheric reanalysis data and consider the temperature and pressure in cycles. Lagler et al. (2013) constructed the GPT2 model based on the GPT model, using 10-year ERA-Interim data with a resolution of 5∘ × 5∘. Böhm et al. (2015) improved the GPT2 model and subsequently obtained the GPT2w model, which is currently widely used. The latest update to the GPT2w model is the GPT3 model, which only modifies the empirical mapping function (Sun et al., 2019; Ding and Chen, 2020) as compared to the GPT2w model. In order to address the limitations of current ZTD models, researchers have proposed the use of a sliding window algorithm (Huang et al., 2019, 2021) to construct models with different window sizes. This approach can further optimize the model parameters. Furthermore, Yang et al. (2021) employed an artificial neural network (ANN) to effectively mitigate the systematic deviation within the GPT3 model, leading to improved ZTD accuracy in Hong Kong SAR, China. Zhao et al. (2023b) took into account the residual term between the GPT3 model and GNSS observations of ZTD to develop a novel model specific to China (CHZ). Additionally, Li et al. (2023) discover the disparities between ERA5 and GNSS-based ZTD, prompting the creation of a new global model (IGGZTD-S). This new model demonstrated exceptional performance in precise point positioning (PPP), particularly in the vertical direction.
This paper proposes a new global piecewise ZTD empirical grid model called GGZTD-P derived from the established GZTD-P vertical adjustment model (Zhu et al., 2022). The GGZTD-P model takes into account the fine daily variation of ZTD and latitude factors to provide a more accurate representation of the atmosphere. The accuracy of the GGZTD-P model was evaluated by comparing it with profiled ZTD data from 545 radiosonde stations in 2017 and 2018, as well as the Modern-Era Retrospective analysis for Research and Applications, Version 2 (MERRA-2) atmospheric reanalysis data from 2017. It should be explained that the ZTD data of radiosonde and MERRA-2 are calculated by integration. The results were also compared with the GPT3 model to assess the performance of the GGZTD-P model. The aim of this study is to provide a more important reference for GNSS meteorology and positioning.
2.1 Atmospheric reanalysis data
The fifth-generation European Centre for Medium-Range Weather Forecasts atmospheric reanalysis data (ERA5) provide tropospheric parameters, such as temperature, pressure, and humidity, with a high spatial resolution of 0.25∘ × 0.25∘ (latitude × longitude) and a temporal resolution of 1 h. The ERA5 data are recognized as a valuable resource for research and applications in GNSS meteorology and positioning (Chen et al., 2021; Prado et al., 2022; Sun et al., 2023).
MERRA-2 is a state-of-the-art atmospheric reanalysis dataset developed by NASA (Chen et al., 2019; Huang et al., 2022; Randles et al., 2017). It represents a major advancement over its predecessor, MERRA, as it incorporates aerosol observations from space and their interactions with physical processes (Gupta et al., 2020; Huang et al., 2020; Zhao et al., 2022). MERRA-2 provides a wealth of surface and profile meteorological parameters. The data are distributed across 42 profiles according to standard atmospheric pressure. The surface parameters, such as surface pressure, surface temperature, specific humidity, and surface elevation, have a temporal resolution of 1 h and a spatial resolution of 0.5∘ × 0.625∘ (latitude × longitude). The profile parameters, such as temperature, specific humidity, and high potential, have a temporal resolution of 6 h and a spatial resolution of 0.5∘ × 0.625∘.
2.2 Radiosonde data
Sounding balloons are typically launched twice daily at 00:00 and 12:00 UTC and collect meteorological vertical profile information, such as pressure, temperature, and relative humidity, at specific pressure levels. Radiosonde data offer precise meteorological observations acquired through direct measurements. Zhao et al. (2019) found that ZTDs derived from radiosonde are validated using GNSS data, with an RMSE of 19.1 mm. Shangguan et al. (2023) discovered that the bias and rms of the ZTD data from 180 radiosonde stations compared with data from ERA5 worldwide were 8.5 and 13.2 mm, respectively. Radiosonde data are widely used to evaluate the precision of other atmospheric reanalysis data or tropospheric parameter models (Tang et al., 2013; Zhou et al., 2017; Bonafoni et al., 2019).
2.3 Calculation principle and methodology
Atmospheric reanalysis data can provide meteorological parameters according to standard atmospheric pressure profiles. The integration method is used to calculate the ZTD. First, the atmospheric refractivity index is calculated using the meteorological parameters of each profile. Next, the refractive index is integrated at the height of each profile to obtain the vertical profile information of ZTD at each grid point. Finally, by hierarchically combining the ZTD information obtained from the integration, the vertical profile information of ZTD at each grid point can be obtained. The integral formula used is as follows (Thayer, 1974):
where N stands for the total atmospheric refractivity, P stands for the atmospheric pressure (hPa), e stands for the water vapor pressure (hPa), Sh stands for the specific humidity, T stands for the temperature, h stands for the elevation, hL stands for the height at the bottom of the atmospheric data integration calculation, and htop stands for the height at the top of the atmospheric data integration calculation. k1=77.604 K Pa−1, k2=64.79 K Pa−1, K hPa−1, and k3= 375463 K2 hPa−1 are all constant coefficients.
3.1 Temporal characteristic analysis
To construct a high-precision global ZTD grid model, it is essential to analyze the spatiotemporal characteristics of ZTD over the globe. Six representative ERA5 grid sites' data, distributed evenly around the world, are used to calculate the average daily ZTD time series for each site from 2012–2016. These time series are then fitted using cosine and sine functions with annual and semi-annual periods. The results are presented in Figs. 1 and 2.
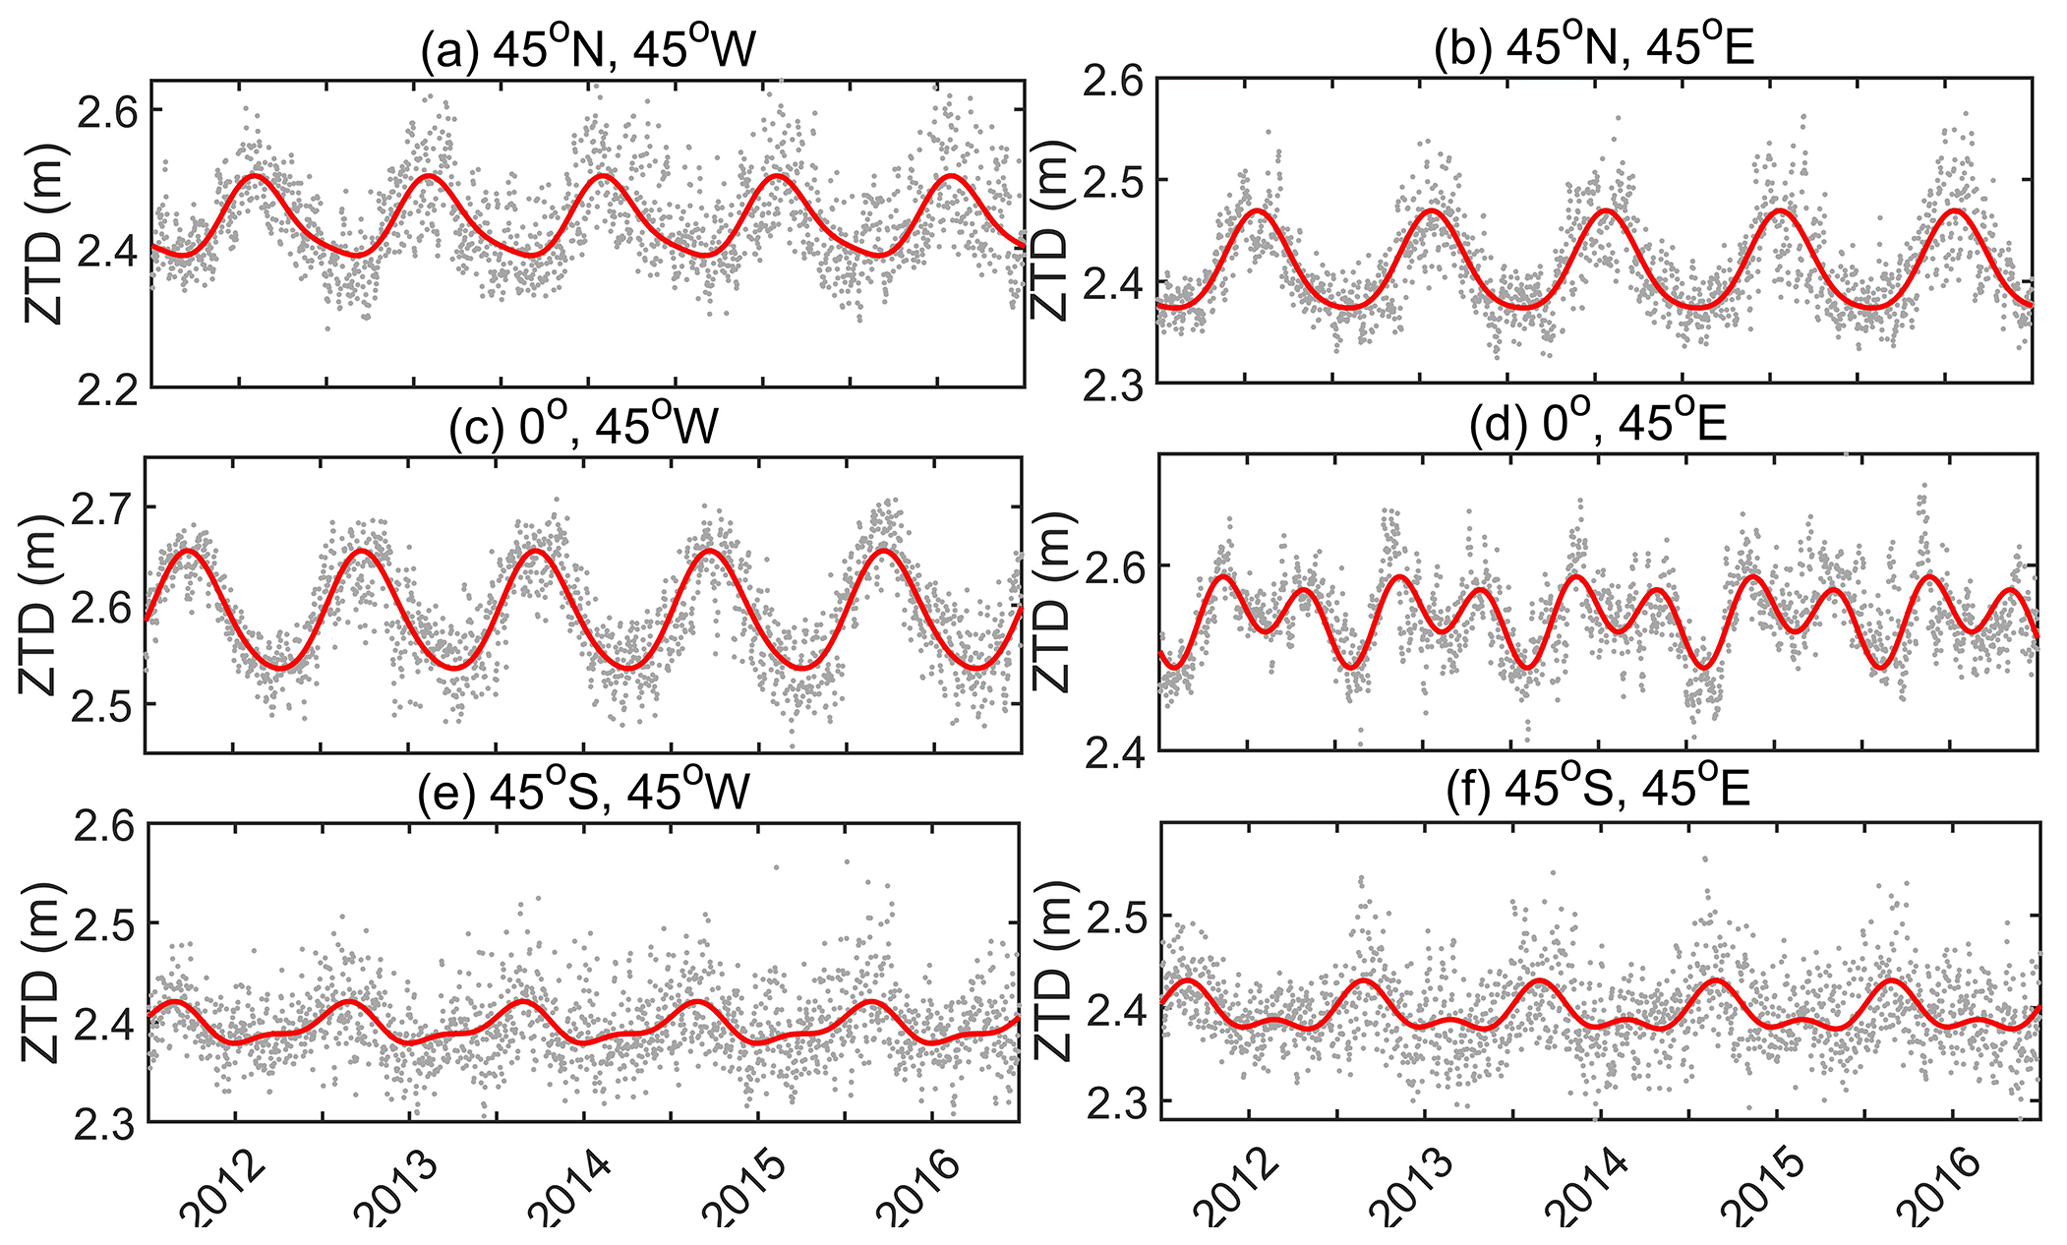
Figure 1Average daily ZTD time series from 2012 to 2016 for six ERA5 grid sites distributed in each hemisphere of the world.
In Fig. 1, the gray points represent the daily mean ZTD, while the red lines represent the fitted values. The figure reveals that ZTD exhibits a global fluctuation range of 2.2–2.7 m, with values ranging from 2.3–2.6 m in the Northern and Southern hemispheres and 2.4–2.7 m near the Equator. Notably, ZTD shows significant seasonal variations, with large fluctuations in the Northern Hemisphere and near the Equator. Conversely, ZTD shows a smaller fluctuation range in the Southern Hemisphere, with no apparent seasonal variations.
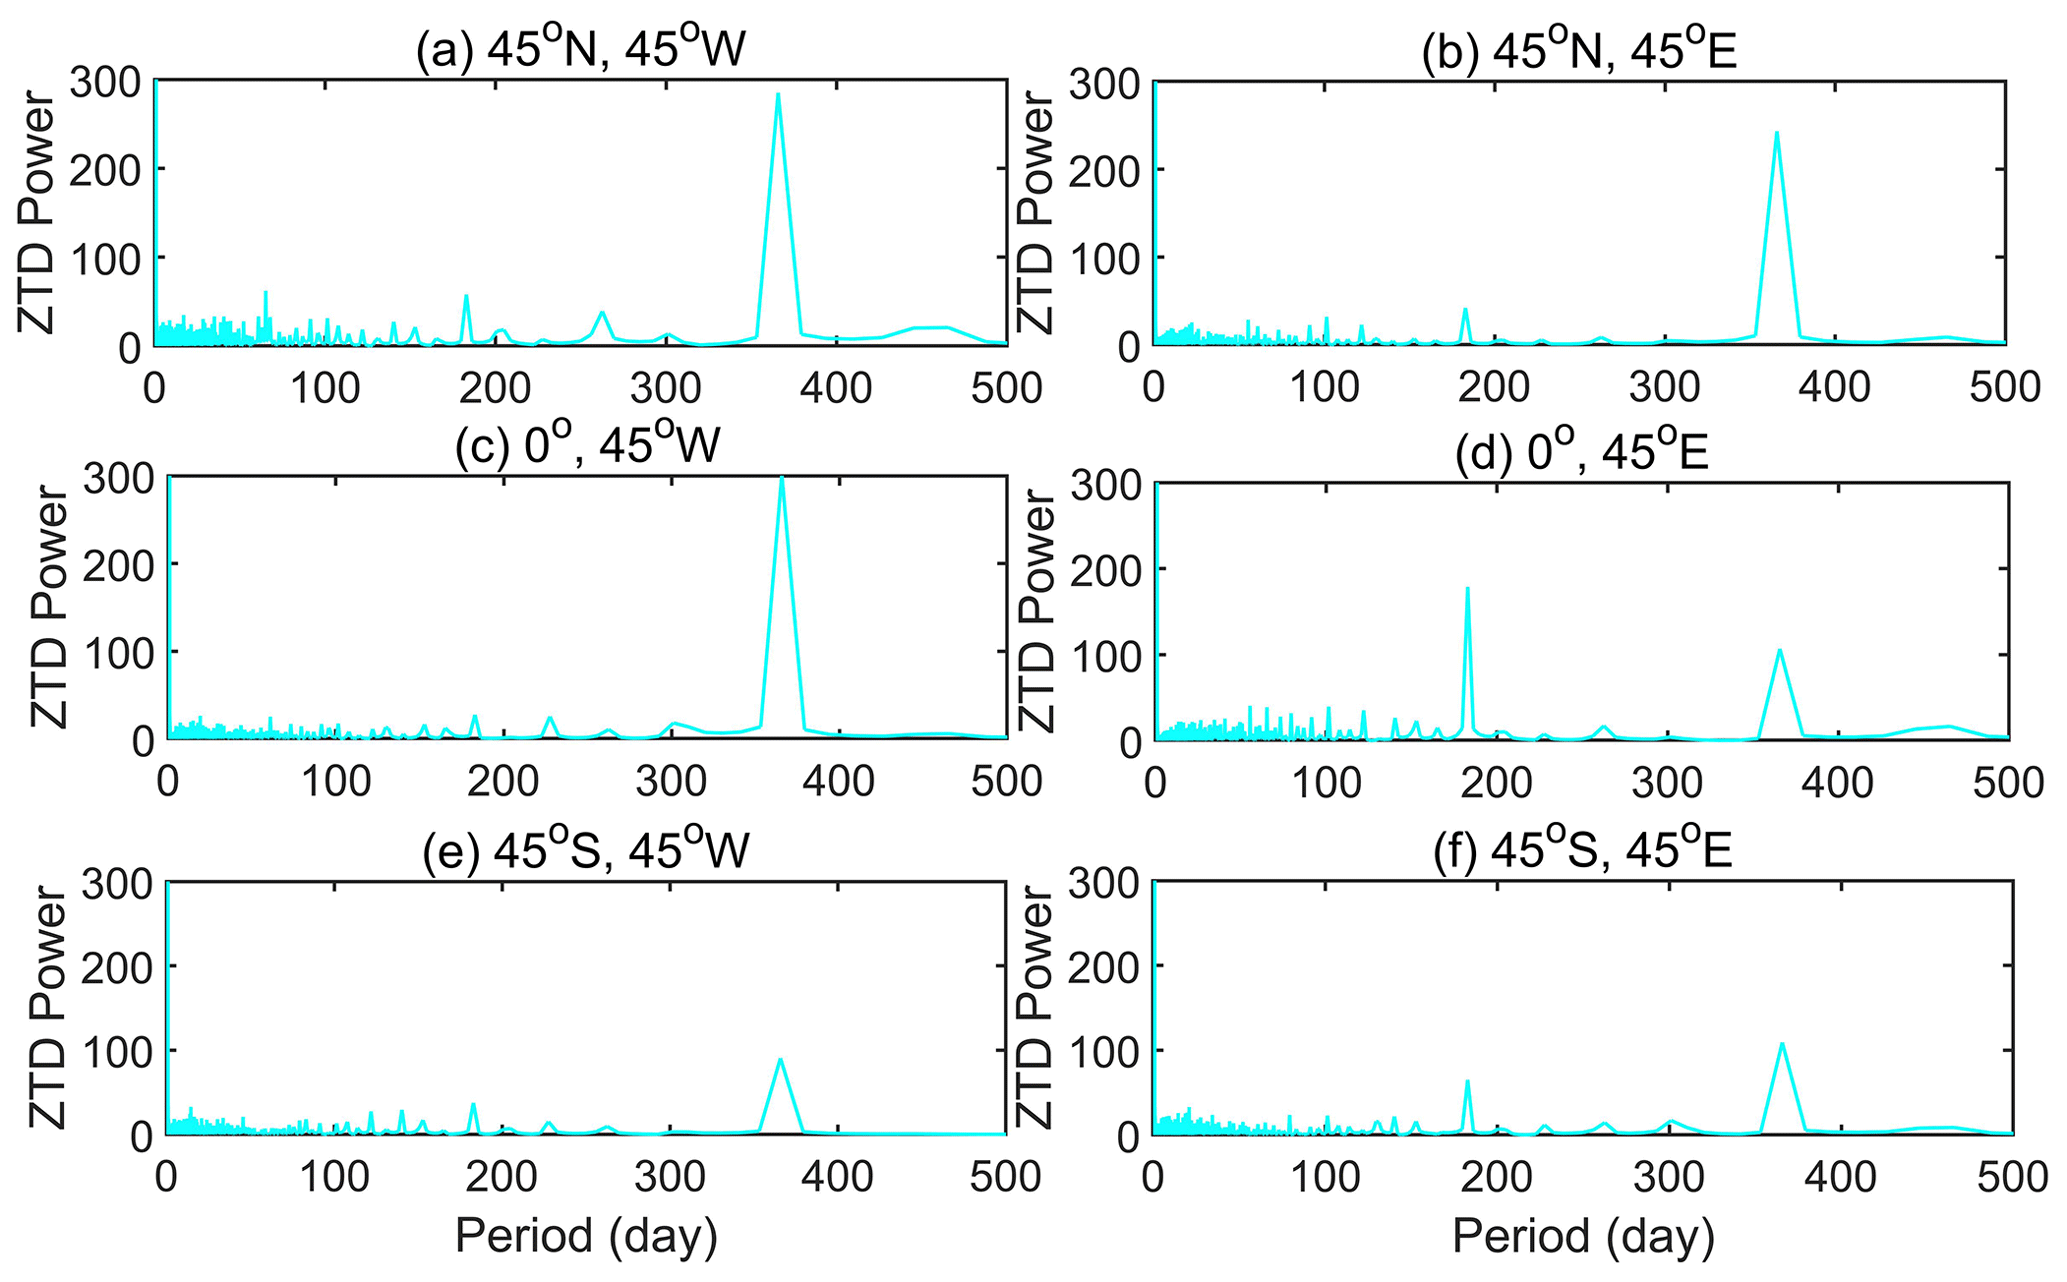
Figure 2ZTD fast Fourier transform spectrum analysis of six representative ERA5 grid points.
In Fig. 2, the fast Fourier transform (FFT) spectrum analysis was performed on six selected ERA5 grid points, uniformly distributed in each hemisphere of the globe. The results indicate that the highest annual-period power of ZTD is observed in the Northern Hemisphere, accompanied by notable annual-period and semi-annual-period variations. In contrast, the Southern Hemisphere shows a lower annual-period power but exhibits significant annual- and semi-annual-period variations. Near the Equator in the Western Hemisphere, the annual period power is greater, displaying clear annual-period variations. However, the semi-annual-period power is lower, indicating inconspicuous semi-annual-period variations. In the Eastern Hemisphere at the Equator, the semi-annual-period power is higher than the annual period power, indicating clear annual- and semi-annual-period variations.
To further confirm the daily period variations of ZTD, six ERA5 atmospheric data grid points are selected randomly for 1 January 2015. The results are presented in Fig. 3.
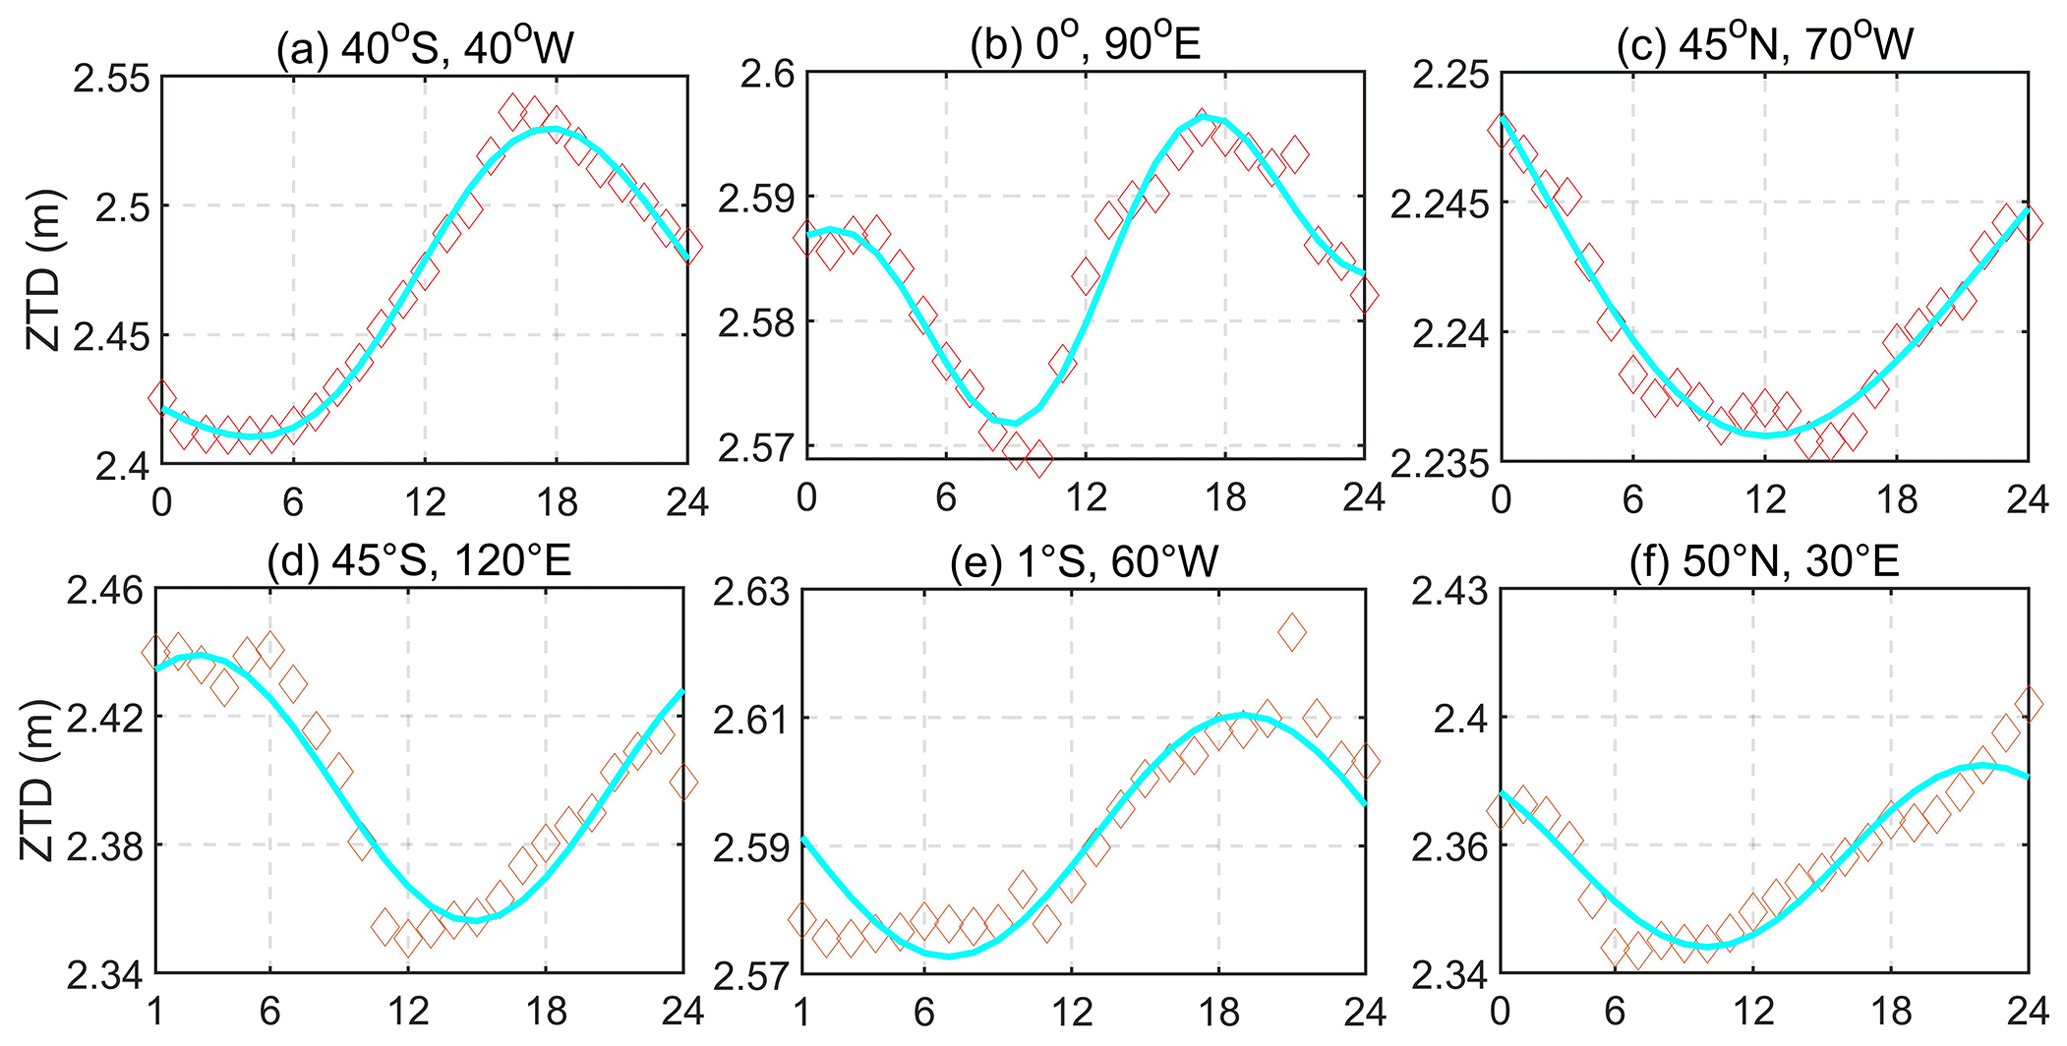
Figure 3 reveals that ZTD exhibits significant daily period variations in the six selected grid points, particularly at the grid points (0, 90∘ E) and (1∘ S, 60∘ W), where significant daily period characteristics are observed. Thus, when constructing global ZTD models, it is important to consider daily period variations.
3.2 Spatial characteristic analysis
To analyze the global distribution of ZTD, the average daily ZTD surface information of ERA5 atmospheric data is calculated for the year 2015. The results are presented in Figs. 4 and 5.
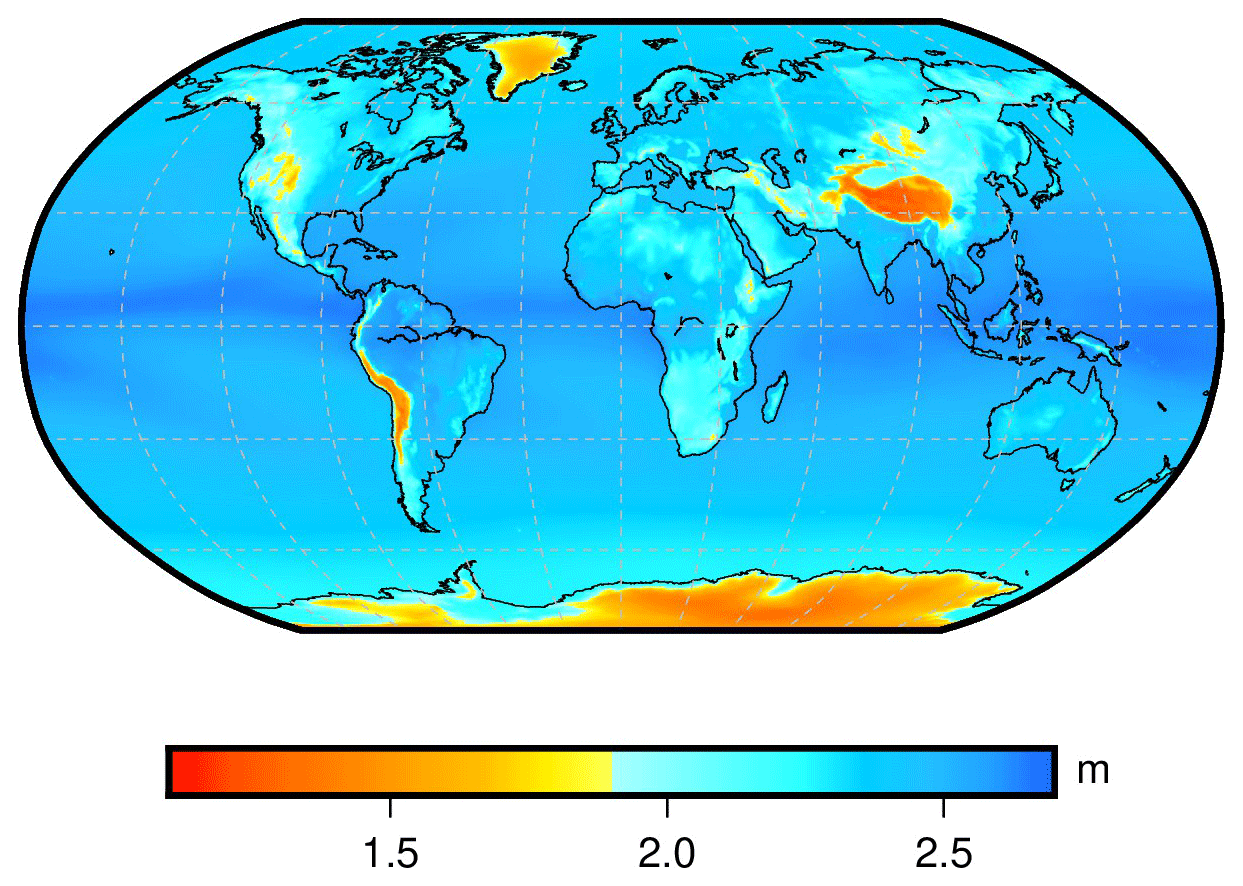
Figure 4Average daily surface ZTD values for ERA5.
Figure 4 reveals that ZTD has smaller values in the Arctic Ocean region, in the western regions of North and South America, in Antarctica, in southeastern Africa, and in Asia. This may be due to the undulating terrain and higher altitude in these areas, resulting in lower ZTD values. The lowest values were found in Asia and Antarctica.
To further verify the global distribution characteristics of ZTD, including the annual mean, annual period amplitude, semi-annual period amplitude, daily period amplitude, and semi-daily period amplitude, the results are presented in Fig. 5.
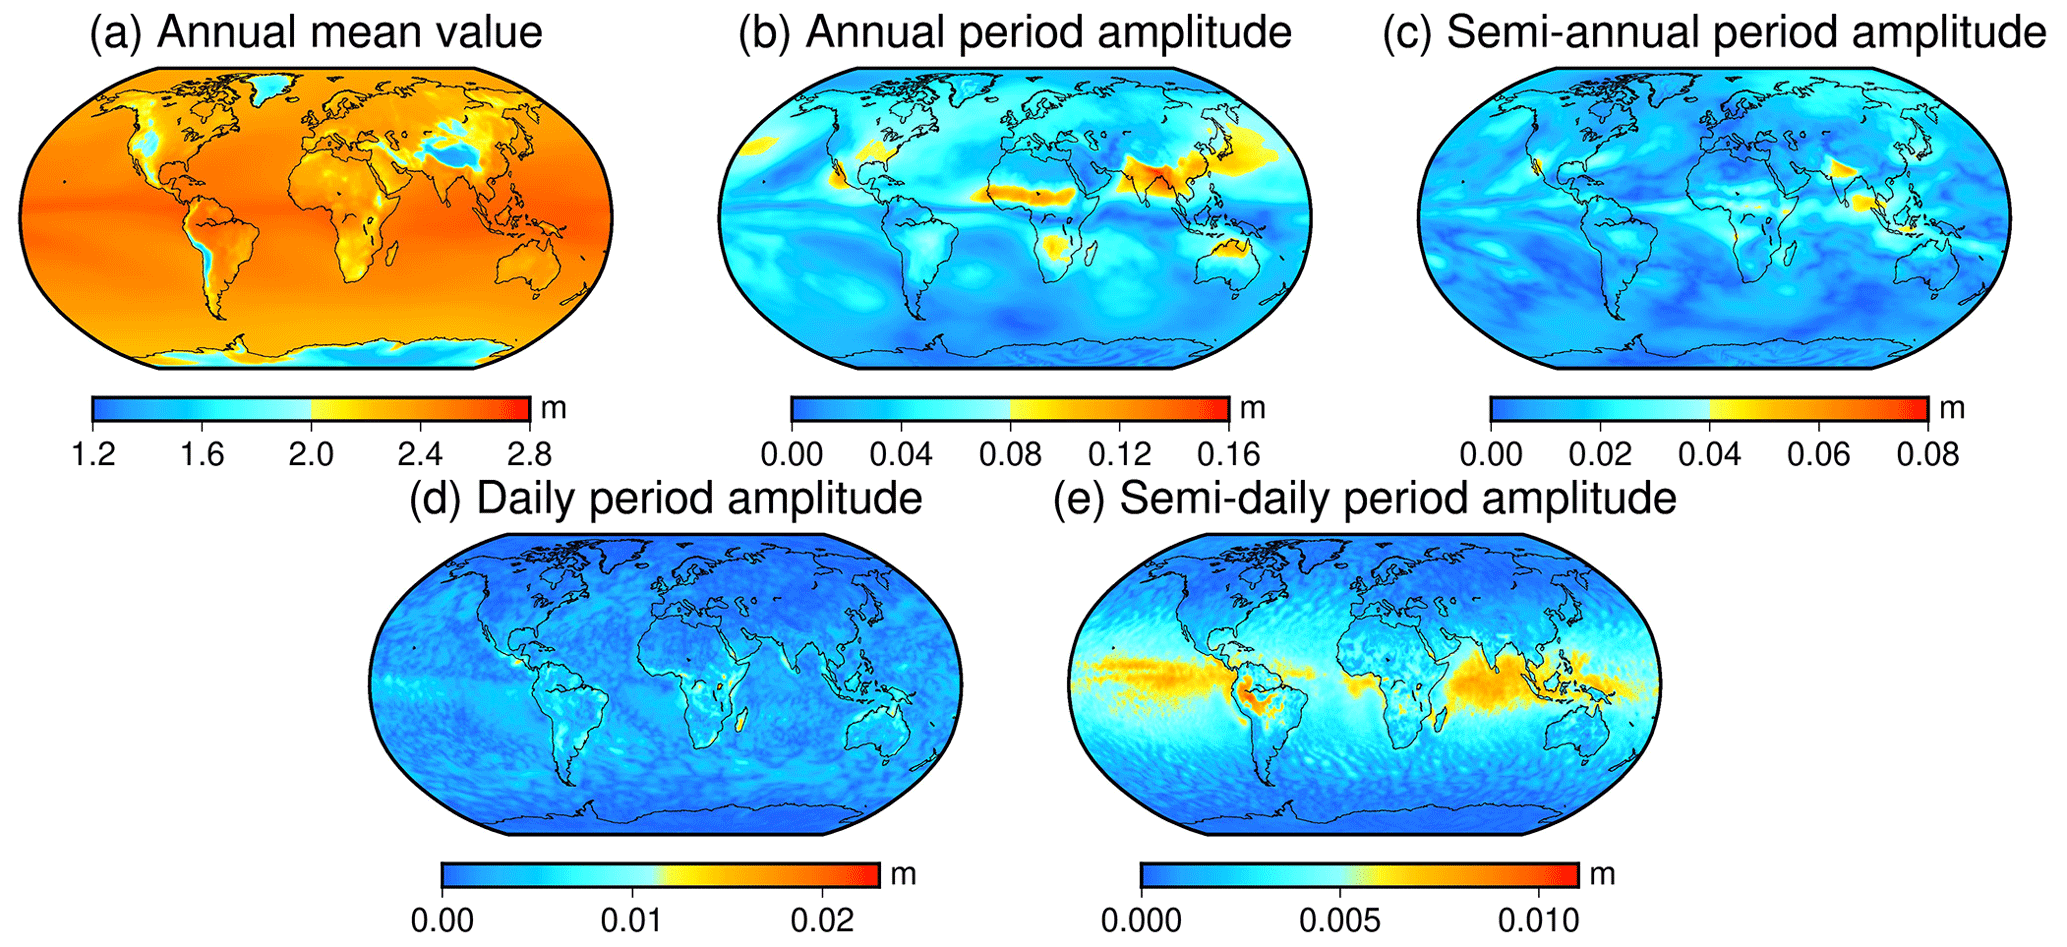
Figure 5Distribution characteristics of annual mean, annual period amplitude, semi-annual period amplitude, daily period amplitude, and semi-daily period amplitude of ZTD.
Figure 5 reveals that ZTD has a large annual mean value in the low-latitude region of the world and a small annual mean value in Antarctica, China, the Arctic Ocean, and the western regions of North and South America. The amplitude of the annual period is significant in southern Asia and central Africa, with the Northern Hemisphere showing a more obvious annual periodicity amplitude than the Southern Hemisphere. Northeast Asia, Oceania, southern Africa, and North America show obvious amplitudes of the semi-annual period. For the daily amplitude of ZTD, significant variations are observed in the low latitudes, particularly in South America, Africa, and Oceania, whereas the high latitudes show less prominent daily amplitude. Similarly, near the Equator, a significant semi-daily period amplitude is observed, particularly in the northern region of the Pacific, South America, and the Indian Ocean, where the largest semi-daily period amplitude is observed. This may be due to the fact that these regions are located at the junction of the ocean and land and are in the same direction as the northeast (Northern Hemisphere) and southeast (Southern Hemisphere) equatorial trade winds (Yao et al., 2012), indicating that the distribution of ZTD is not only related to meteorological variables and topography but also influenced by thermodynamic circulation (Yao et al., 2013). The low- and mid-latitude regions in the world have more apparent semi-daily period amplitude, whereas the high latitudes of the world show a less obvious amplitude of the semi-daily period.
According to relevant studies, ZTD values are primarily associated with latitude factors on a global scale, while showing a smaller correlation with longitude factors (Chen et al., 2020; Huang et al., 2023a). In order to further verify the distribution of ZTD values on a global scale, under the condition of controlling variables, the hierarchical ZTD vertical profile information of ERA5 atmospheric data at 00:00 UTC on 1 January 2015 is used to interpolate the ZTD values of each grid point at the height of 6 km. The results are shown in Fig. 6.
Figure 6 illustrates the global distribution of ZTD values obtained from the ERA5 atmospheric data. The analysis reveals a strong correlation between ZTD values and latitude factors. Specifically, ZTD values tend to be lower in high-latitude regions and higher in middle- and low-latitude regions. The smallest ZTD values are observed in the northeast region of North America and the Arctic Ocean region. On the other hand, the global distribution of ZTD values has minimal correlation with longitude factors. As a result, when developing the empirical grid model for global ZTD, the impact of latitude on model accuracy should be taken into account.
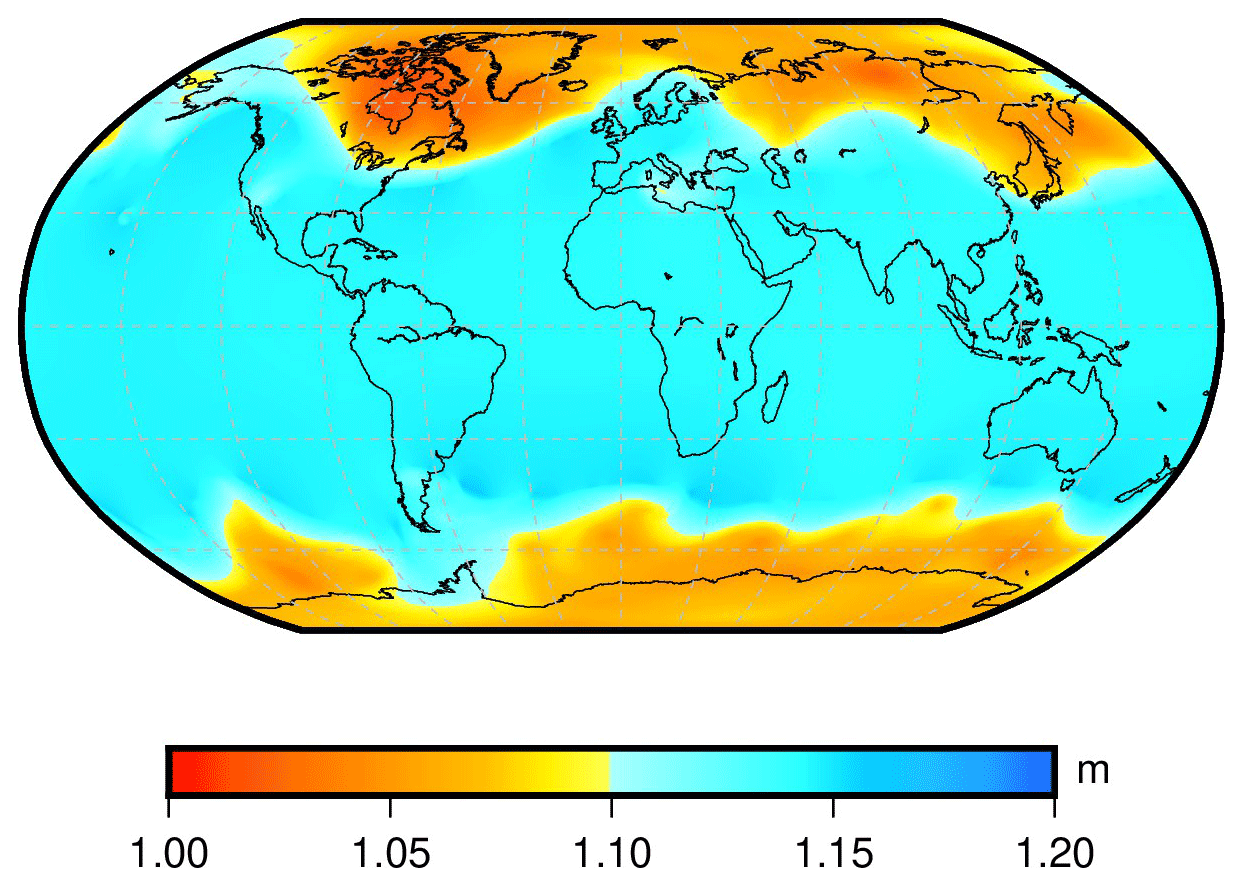
Figure 6Global distribution map of the ZTD value of ERA5 data at 6 km height at 00:00 UTC on 1 January 2015.
3.3 Construction of global piecewise ZTD vertical correction grid model
In order to optimize the model parameters, the grid was divided into a horizontal resolution of 2∘ × 2∘. A piecewise function was employed to accurately model each elevation interval of the grid, while also accounting for seasonal variations in the model. As a result, the global piecewise ZTD vertical profile model (GZTD-P) was developed, and it can be expressed by the following formula:
In Eqs. (4) and (5), Hs stands for the ZTD value at the average elevation, Ht stands for the target elevation, Hr stands for the reference elevation, and ZTDt stands for the ZTD value at the target elevation. αi stands for the constant, annual, and semi-annual period correction factor. ZTDr1, ZTDr2, ZTDr3, and ZTDr4 stand for ZTD values at the reference elevations of different piecewise functions, respectively.
3.4 Construction of global piecewise ZTD empirical grid model
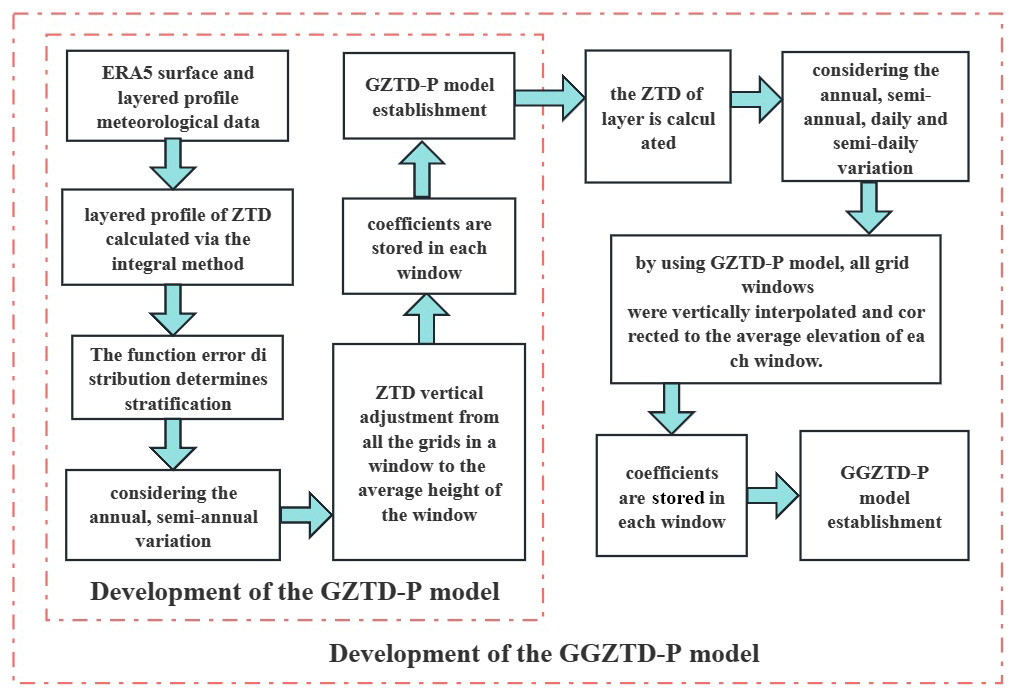
ERA5 atmospheric ZTD data on the surface will be uniformly converted to the position of the sliding window's average elevation. This conversion is based on the piecewise global ZTD vertical profile model (GZTD-P), taking into account the elevation position of each window. The model is based on the ZTD values at the sliding window's average elevation. Utilizing the GZTD-P model, ZTD data for all windows from 2012 to 2016 were vertically interpolated to calculate the ZTD value at the average elevation of each window after correction. The detailed process is shown in Fig. 7. To estimate the coefficients in each window, the least-squares adjustment is utilized, considering the annual, semi-annual, daily, and semi-daily variations as well as the latitude factor. Finally, the global ZTD empirical grid model (GGZTD-P) is developed based on a piecewise expression, with a resolution of 1∘ × 1∘. The model can be expressed as follows:
In Eqs. (6), (7), and (8), MP stands for the ZTD value at the average elevation: 3 km elevation, 8 km elevation, and 16 km elevation, respectively. Ai stands for the daily period coefficient. αi stands for the constant, latitude, annual, and semi-annual period correction factors; φ stands for latitude; DOY stands for the day of the year; and HOD stands for time.
The GGZTD-P model is easy to use. All that is required is the user's longitude and latitude, elevation, day of the year, and hour of the day to find the model coefficient closest to their position. The ZTD value at the average elevation can be corrected to the ZTD value at the target elevation using the formula provided. The GGZTD-P model can be used not only as an empirical grid model to estimate the ZTD value but also as a ZTD vertical profile model for vertical interpolation.
In order to verify the stability of the established model in the global region, two sets of data are used as reference values and compared with the GPT3 model. The GPT3 model was developed utilizing a 15-year dataset of monthly average ERA-Interim profiles. Currently, it functions as a highly accurate tropospheric model.
In Eq. (9), M represents the tropospheric meteorological parameters (temperature, water vapor pressure, specific humidity, etc.), and Si represents the annual mean value and the annual and semi-annual period coefficients. The Saastamoinen model and the Askne model were adopted to compute zenith hydrostatic delay (ZHD) and zenith wet delay (ZWD), with the obtained meteorological parameters.
In Eqs. (10) and (11), P stands for pressure; θ stands for latitude; h stands for elevation; gm stands for the average acceleration of gravity; λ stands for the drop factor of water vapor pressure; Tm stands for the atmospheric weighted mean temperature; and K hPa−1, k3=375463 K2 hPa−1, and Rd=287.054 J kg−1 K−1 are all constant coefficients.
4.1 Radiosonde stations' data were used for verification
In this study, the accuracy of the ZTD obtained by the GGZTD-P model is compared with that of the GPT3 model. The ZTD-layered profiles at 545 radiosonde stations in 2017 and 2018 are used as reference values. The accuracy of each model was statistically evaluated as shown in Table 1 and Fig. 8.
Table 1 presents the results of the ZTD profile verification for global radiosonde stations, indicating the performance of the GPT3 and GGZTD-P models. Both models exhibit a positive average bias, implying that the ZTD values obtained by these models are generally higher than the ZTD values obtained from radiosonde stations. However, the average bias of the GGZTD-P model is 0.86 cm, which is 3.02 cm (78 %) less than that of the GPT3 model. In terms of the root-mean-square error (RMSE), the average RMSE of the GPT3 model is 6.84 cm, while the average RMSE of the GGZTD-P model is 3.23 cm, resulting in an accuracy improvement of 3.61 cm (53 %) compared to the GPT3 model. The enhanced performance of the GGZTD-P model can be attributed to its ability to accurately simulate the variations of zenith tropospheric delay in the vertical direction through a piecewise fitting approach, which reduces the fitting error for each height interval. Overall, the GGZTD-P model demonstrates excellent performance in validating the ZTD values of radiosonde stations, showing its superior accuracy and suitability for ZTD estimation.
Table 1The accuracy of GGZTD-P model and GPT3 model was verified using ZTD profiled data at radiosonde stations in 2017 and 2018.
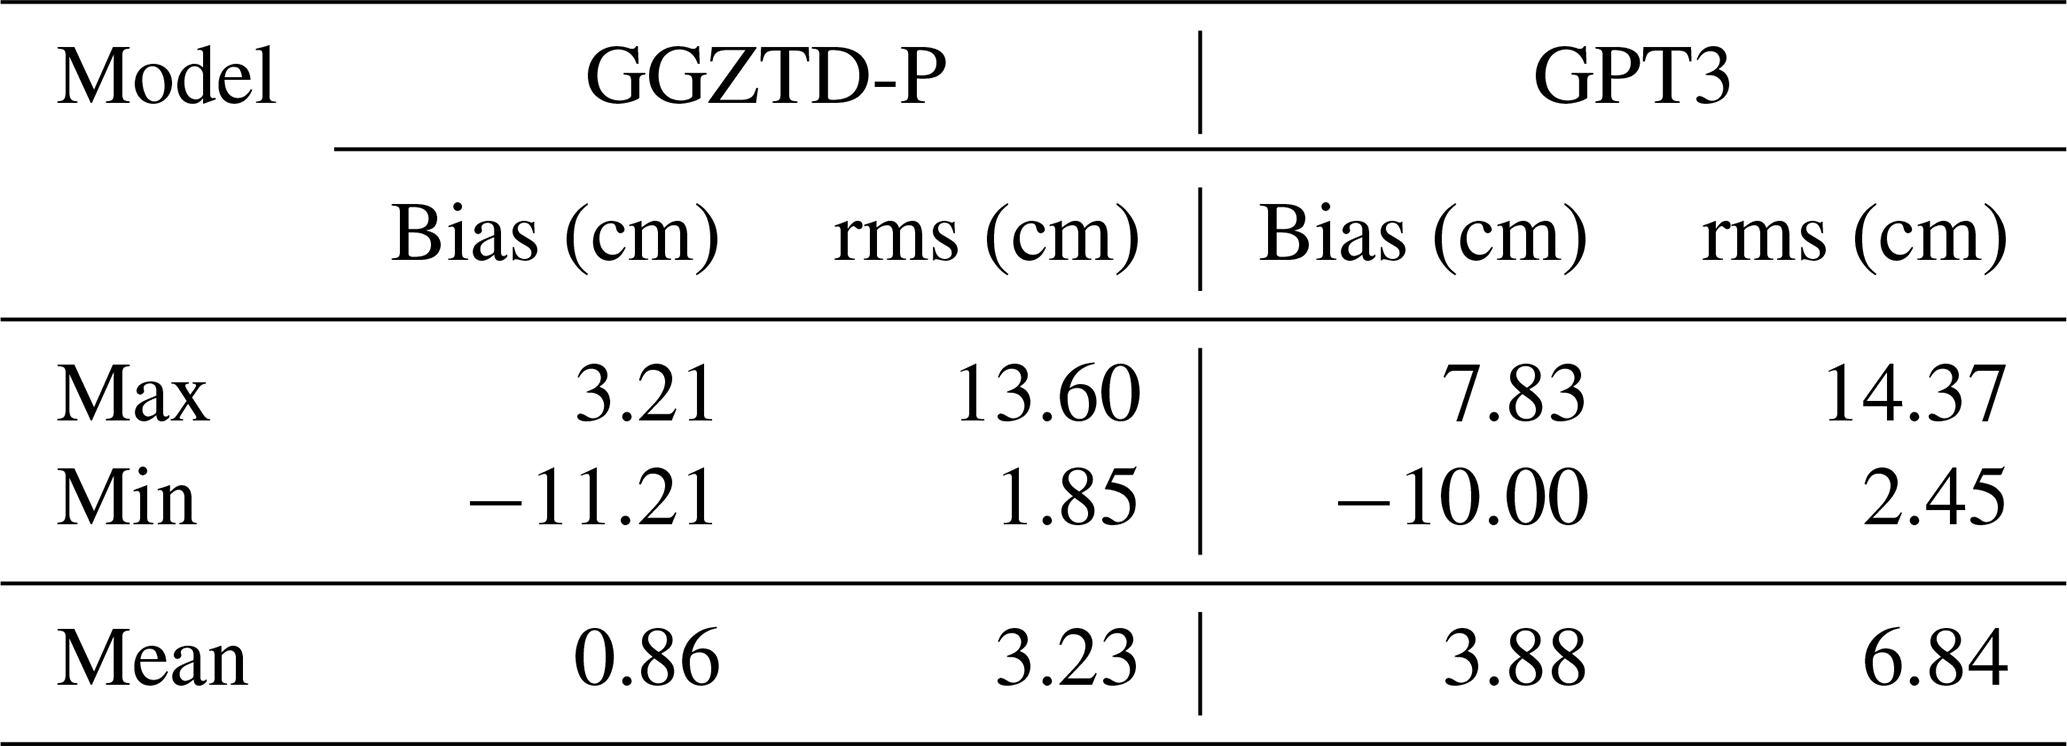
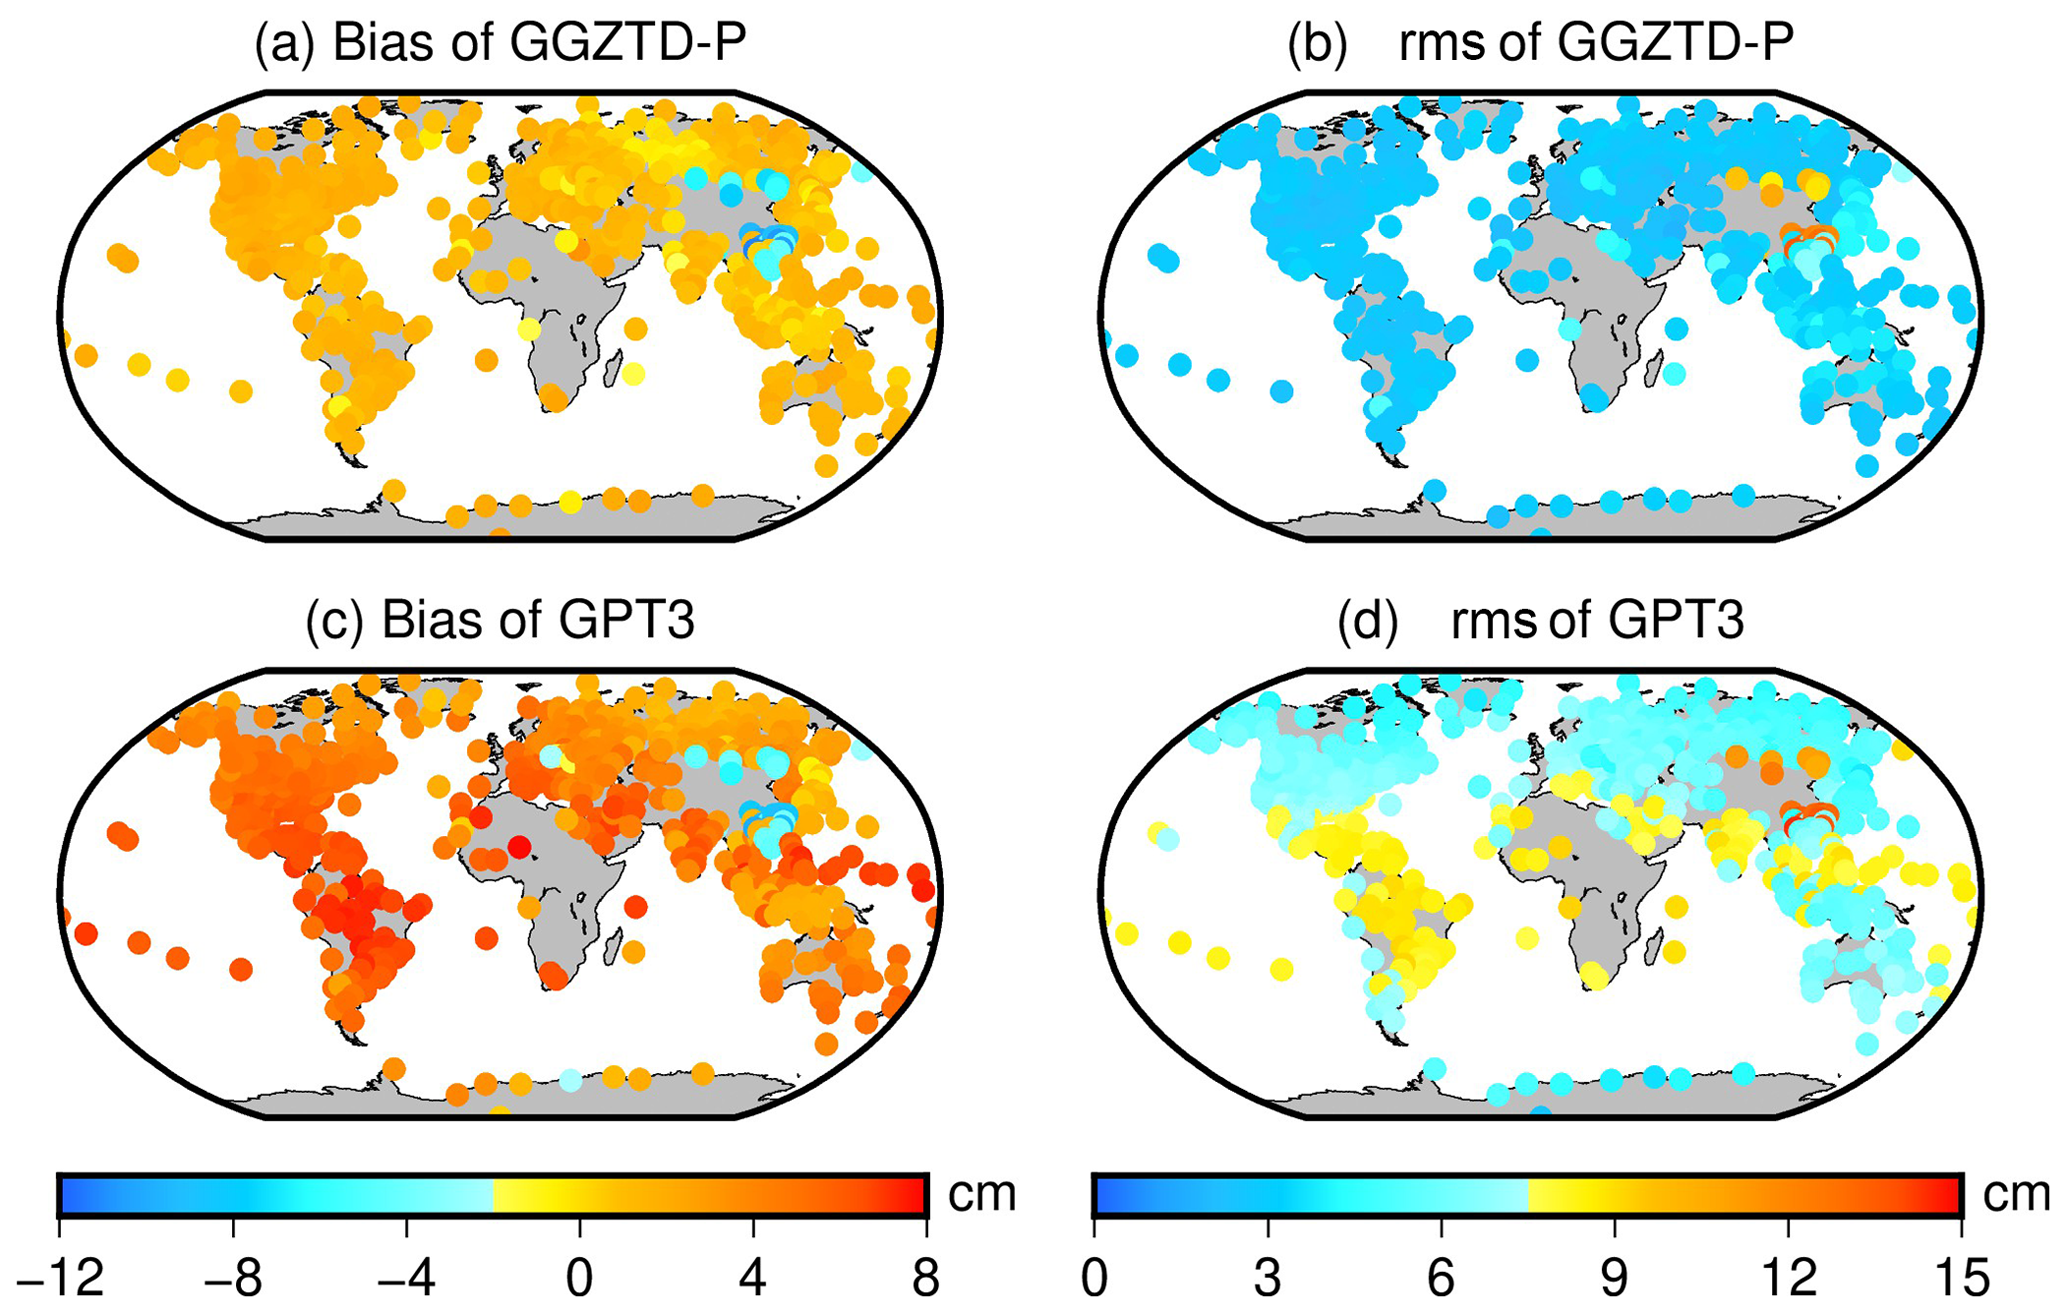
Figure 8ZTD profiled accuracy distribution of GGZTD-P model and GPT3 model for global radiosonde stations in 2017 and 2018.
In Fig. 8, the ZTD profiled values of radiosonde stations calculated by the GGZTD-P model on a global scale mainly exhibit a small positive bias, while those in the Asian region show a large negative bias. This indicates that the calculated ZTD values by the GGZTD-P model are generally larger than the ZTD values of the radiosonde stations on a global scale and smaller than the ZTD values in the Asian region. Similarly, the ZTD values of radiosonde stations calculated by the GPT3 model on a global scale exhibit a mainly positive bias, with large negative bias values in Asia and large positive bias values in North America, South America, Africa, and the Pacific region. Both the GGZTD-P and GPT3 models show obvious negative bias values in the China region, suggesting that the ZTD estimated by the two models in this region is lower than the ZTD values of the radiosonde stations. This could be due to the complex and volatile climate and the large topographic relief in China, which make it difficult to accurately simulate the ZTD.
The GPT3 model shows smaller rms values in North America, Europe, Antarctica, Oceania, and northern Asia but larger rms values in the central and southern parts of Asia, especially in China, which reflects the largest RMSE. This may be due to the more pronounced variations in terrain in the China region, making it challenging to accurately simulate the radiosonde stations. The GGZTD-P model shows a small rms value globally, particularly in North America, South America, Europe, Oceania, and Antarctica, reflecting better correction accuracy. However, it exhibits a large RMSE in the Asian region for the reasons mentioned above. Compared with the GPT3 model, the GGZTD-P model showed greater accuracy improvement in the Arctic Ocean, the Pacific Ocean, North America, South America, Africa, Europe, Oceania, and parts of Asia. Additionally, compared with the GPT3 model, the GGZTD-P model still shows some accuracy improvement in China. This improvement can be attributed to the fine detection of ZTD height intervals in the GGZTD-P model, allowing for a more accurate simulation of the vertical variations of ZTD across different height intervals. Therefore, the accuracy of the GGZTD-P model is improved to a certain extent in the China region, with a large topographic relief.
4.2 MERRA-2 data were used for verification
The MERRA-2 atmospheric reanalysis data with 6 h resolution in 2017 are also used as reference values to validate the accuracy of the models. To assess the performance of the models, the global distribution of ZTD was divided into nine latitude regions, with each region covering a 20∘ interval. Then the bias and root-mean-square error (RMSE) of the GGZTD-P and GPT3 models in different latitude intervals of the MERRA-2-profiled ZTD can be calculated. The results are presented in Fig. 9.
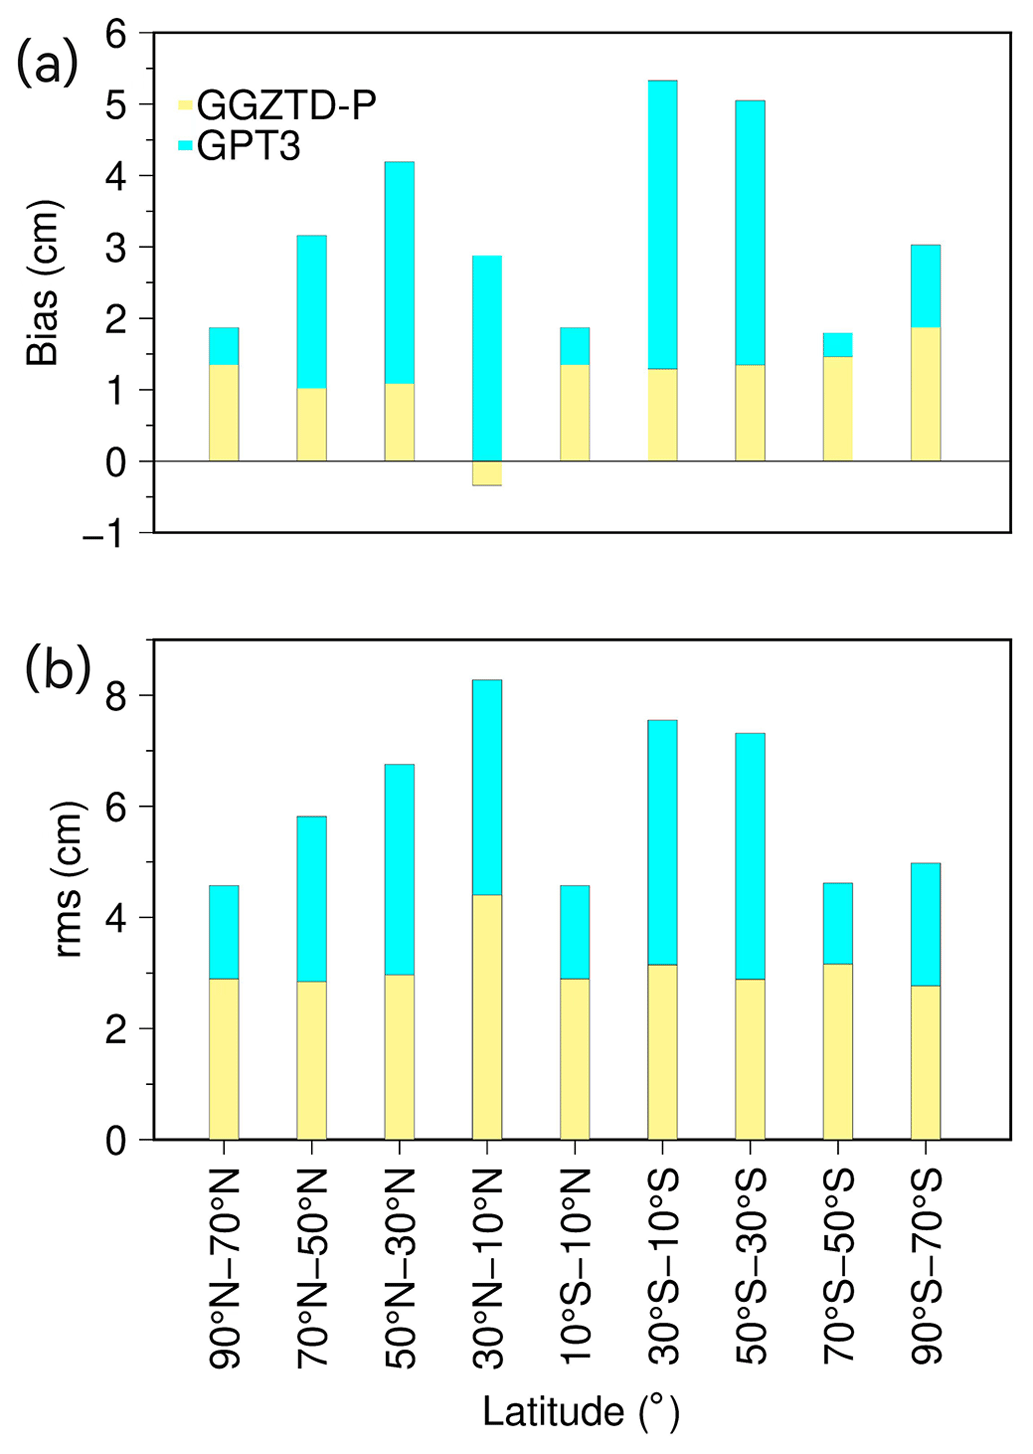
Figure 9Accuracy distribution of GGZTD-P model and GPT3 model in different latitude regions of MERRA-2-profiled ZTD.
Figure 9 reveals that the GPT3 model has positive bias values in each latitude interval. Specifically in the Northern Hemisphere, the bias gradually increases with decreasing latitude, reaching a maximum of approximately −4.5 cm. In the Southern Hemisphere, the bias of the GPT3 model reaches its largest value in the 10 to 30∘ S latitude interval. In contrast, the GGZTD-P model shows a small negative bias in the 10 to 30∘ S latitude interval but displays similar positive bias values to the GPT3 model in the other latitude ranges, indicating that the ZTD value calculated by the GGZTD-P model is larger than that of the radiosonde stations. The bias of the GGZTD-P model in the Northern Hemisphere does not show significant variations with decreasing latitude. In the Southern Hemisphere, however, the bias decreases with decreasing latitude. The GGZTD-P model exhibits smaller bias values in the low latitudes and higher bias values in the latitude range of 70 to 90∘ S.
The RMSE of the GPT3 model increases with decreasing latitude in the Northern Hemisphere. In the Southern Hemisphere, however, it does not show a clear pattern with latitude, and its largest RMSE occurs in the latitude range of 10 to 30∘ N. The GPT3 model exhibits the worst accuracy in the low-latitude region of the Northern Hemisphere and better accuracy in the high-latitude region. In the Southern Hemisphere, the accuracy is good at low and high latitudes but poor at mid-latitudes. In contrast, the rms value of the GGZTD-P model shows little variation with latitude in the Northern Hemisphere, indicating that it is less affected by latitude factors, and its RMSE value is relatively stable. In the Southern Hemisphere, the rms value also shows no obvious variation with latitude.
Overall, the GGZTD-P model exhibits the largest errors in the range of 10 to 30∘ N. Compared to the GPT3 model, the GGZTD-P model shows a greater improvement in accuracy in the low-latitude area, particularly in the latitude range of 10 to 50∘ S, where it shows significant performance optimization. Although the GGZTD-P model also exhibits slight improvement in accuracy in the high-latitude area, it is not as pronounced as in the low-latitude area. Consequently, the GGZTD-P model demonstrates better ZTD correction performance globally than the GPT3 model.
In this study, we establish a combined empirical grid model through the integration of model coefficients obtained at various resolutions. The model parameters are optimized under the condition of low-accuracy loss, which enhances the efficiency of the model. The surface parameters of the GGZTD-P model and vertical profile parameters are combined to form three different models: GGZTD-P-1, with 1∘ × 1∘ resolution for surface parameters and 2∘ × 2∘ resolution for vertical profile parameters; GGZTD-P-2, with 1∘ × 1∘ resolution for surface parameters and 5∘ × 5∘ resolution for vertical profile parameters; and GGZTD-P-5, with 5∘ × 5∘ resolution for both surface and vertical profile parameters. To evaluate the accuracy of the combined GGZTD-P model, the ZTD values of 545 radiosonde stations in 2017 and 2018 serve as reference values and are compared with that of 1∘ × 1∘ grid resolutions of the GPT3 model. Statistical analysis of the accuracy of the radiosonde-station-profiled ZTD in each model is presented in Table 2, and Figs. 10 and 11 provide visual representation of the results.
Table 2 reveals that the accuracy of the combined GGZTD-P model decreases gradually as the resolution decreases. Nonetheless, the GGZTD-P-5 model still surpasses the GPT3 models in accuracy. In comparison to the GGZTD-P-1 and GGZTD-P-2 models, the RMSE of the GGZTD-P-5 model increased by 0.25 cm (8 %) and 0.24 cm (7 %), respectively. Conversely, when compared to the GPT3 models, the RMSEs of the GGZTD-P-5 model decreased by 3.36 cm (49 %). Additionally, the RMSE of the GGZTD-P-2 model increased by 0.44 cm (16 %) relative to the GGZTD-P-1 model.
Table 2Verify the combined GGZTD-P model and the GPT3 model in radiosonde-profiled ZTD accuracy.
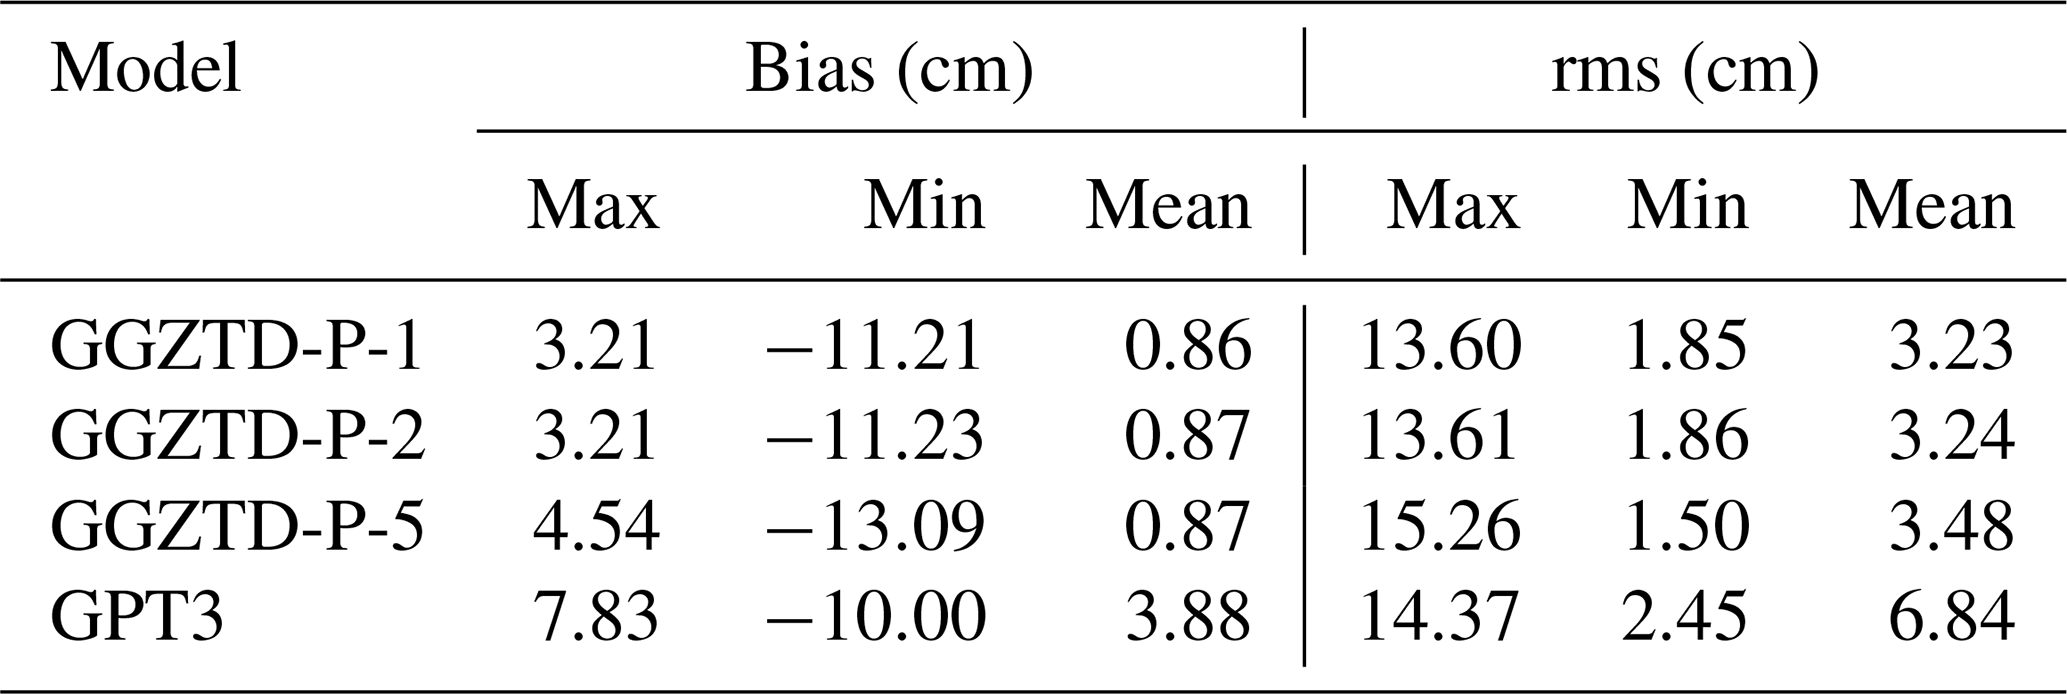
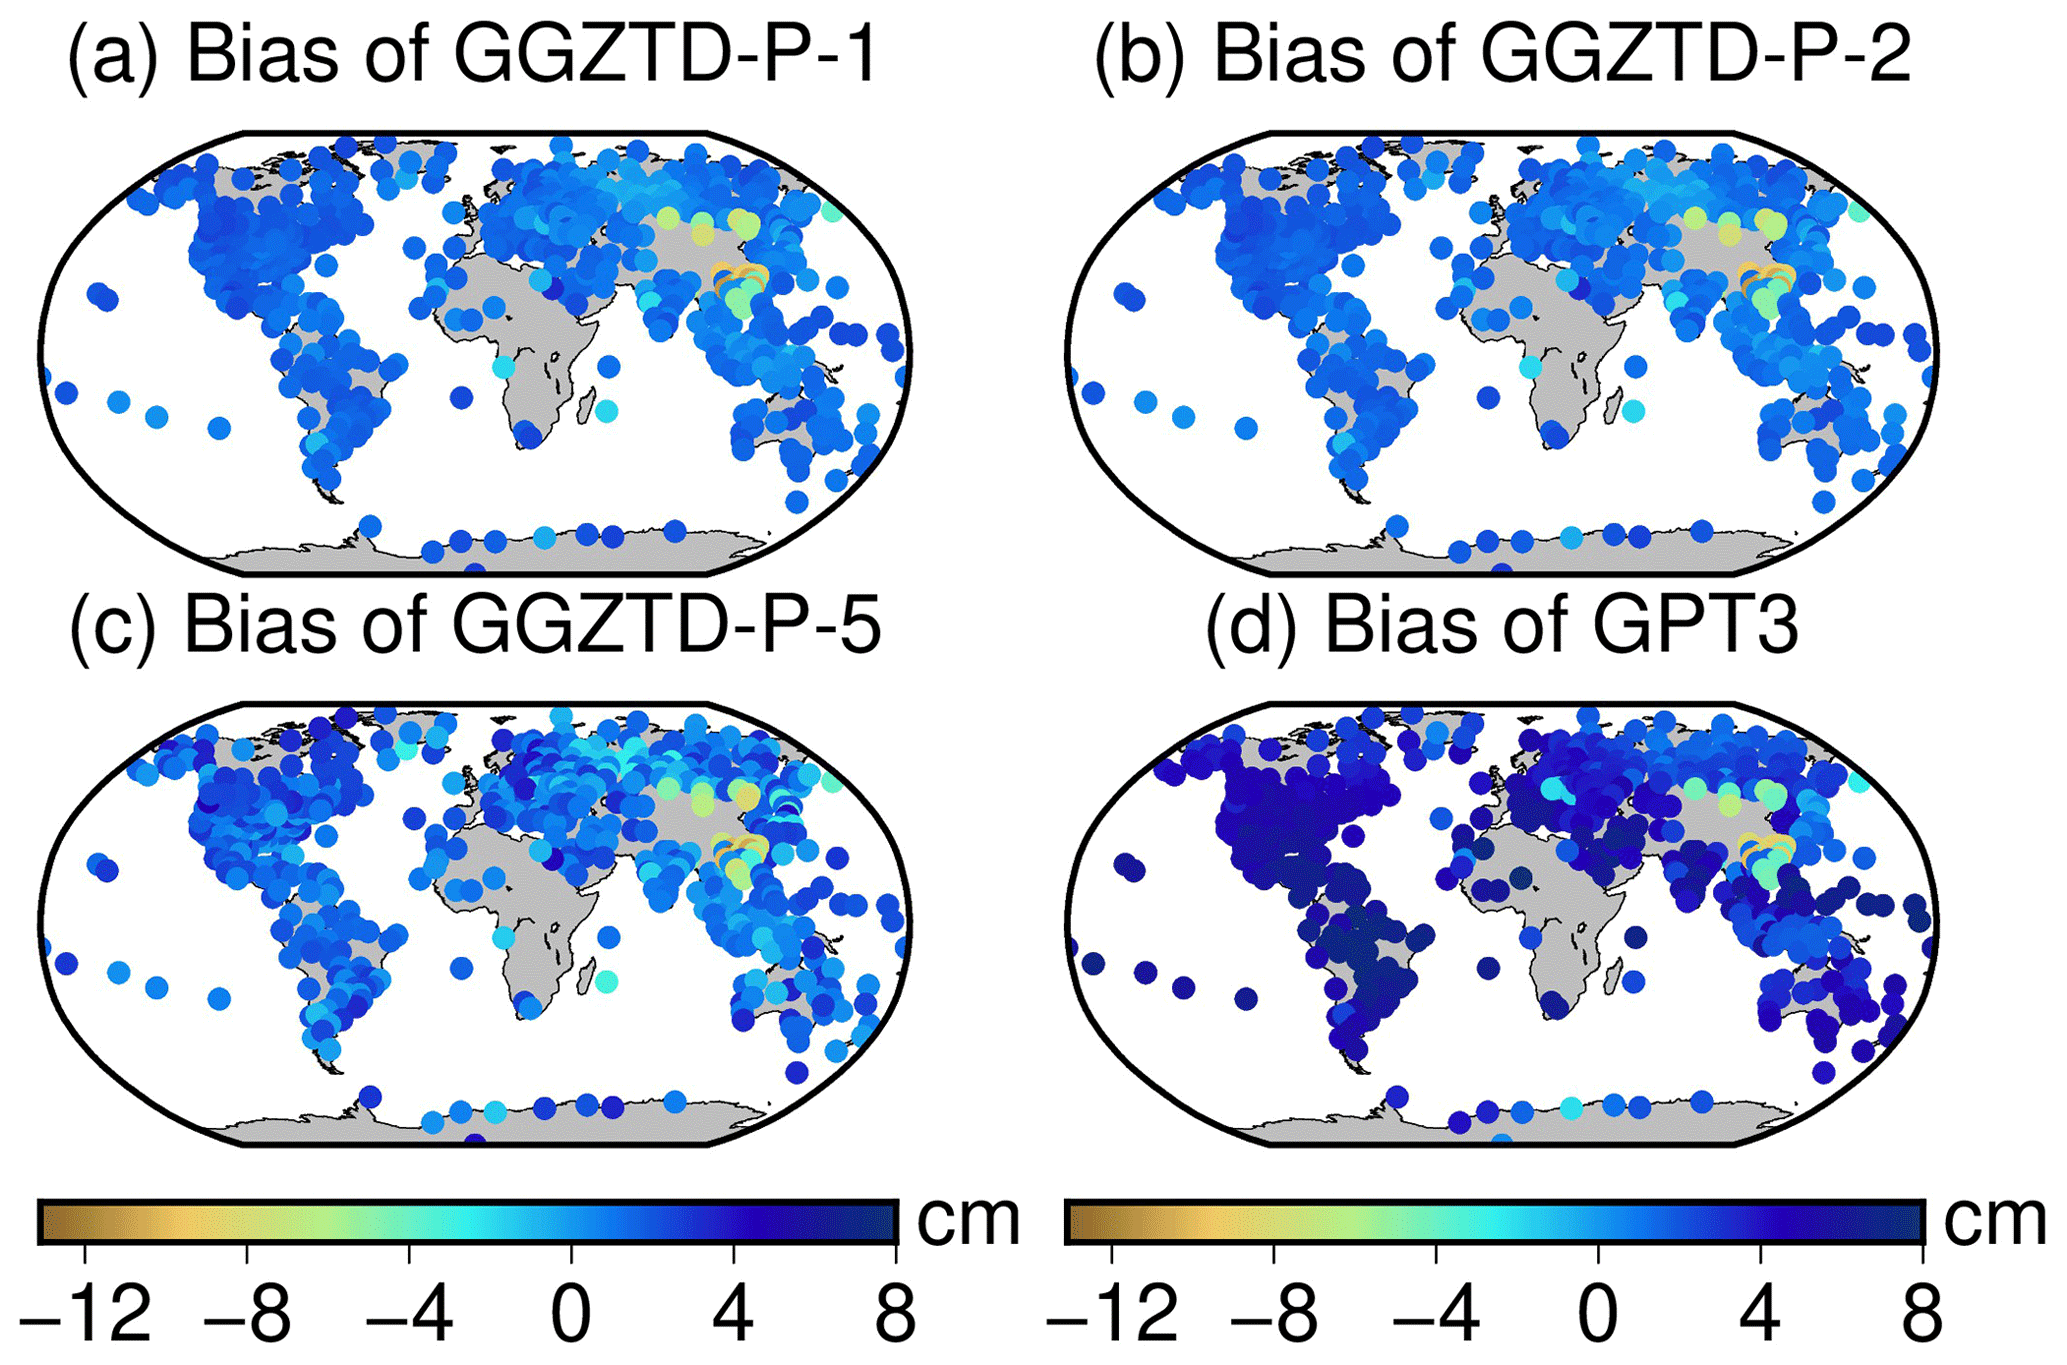
Figure 10Bias distribution of the GPT3 model and the combined GGZTD-P model in the global radiosonde-profiled ZTD accuracy.
Figures 10 and 11 reveal notable patterns in the ZTD values calculated by the combined GGZTD-P model. Overall, the ZTD values obtained from the radiosonde stations display a positive bias on a global scale, indicating that the ZTD values calculated by the combined GGZTD-P model tend to be higher than the ZTD values observed at the radiosonde stations. However, in the Asian region, a significant negative bias is observed (it exhibits a higher bias value when compared to other regions), suggesting that the ZTD values calculated by the combined GGZTD-P model are consistently lower than the ZTD values from radiosonde stations. The combined GGZTD-P model and the GPT3 model both show obvious negative bias values in the China region, indicating that the ZTD estimated by the two models in the China region is less than the ZTD value of the radiosonde station. It may be difficult to accurately simulate the ZTD due to the complex and volatile climate and the large terrain relief in the China region. Compared with the GGZTD-P-1 model and the GGZTD-P-2 model, the GGZTD-P-5 model has a large bias in North America, southern South America, Europe, Oceania, and Antarctica. In terms of the RMSE, the accuracy of GGZTD-P-5 model in parts of North America, parts of Europe, and China is relatively poor compared with the GGZTD-P-1 model and the GGZTD-P-2 model. The GPT3 model in the global radiosonde station ZTD shows high accuracy in Antarctica and the Arctic Ocean. Compared with the GPT3 model, the combined GGZTD-P model shows a certain improvement in accuracy and has a better performance.
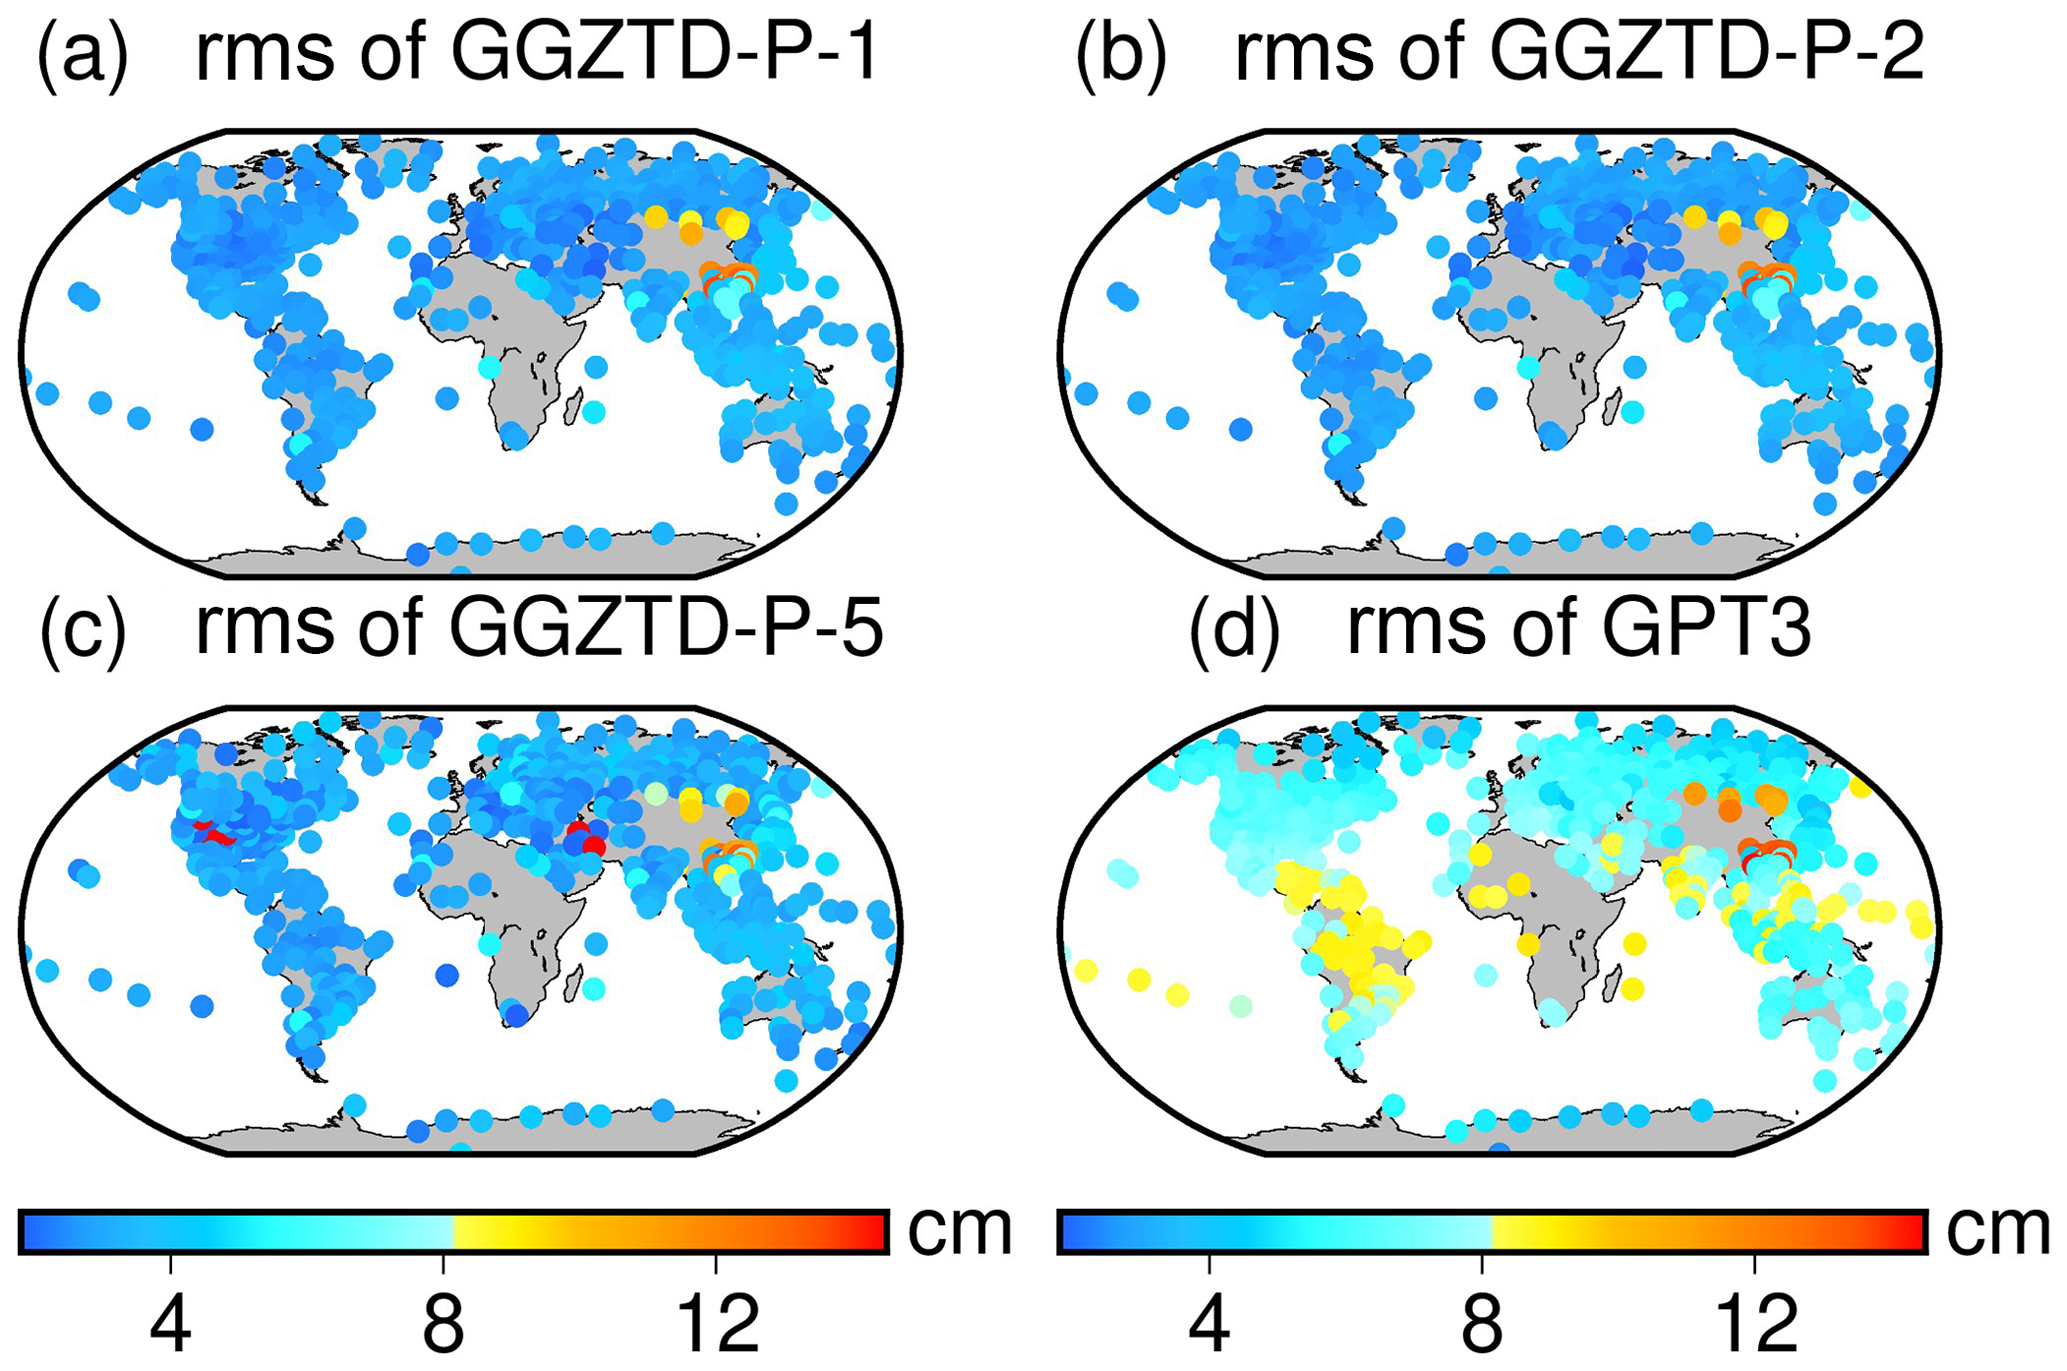
Figure 11The rms distribution of the GPT3 model and the combined GGZTD-P model in the global radiosonde-profiled ZTD accuracy.
ZTD is a critical parameter in GNSS positioning. Therefore, there is a pressing need to develop a new global ZTD model with high accuracy. In this study, we analyzed the temporal and spatial characteristics of global ERA5 data and used FFT to analyze the periodicity of ZTD. The ZTD vertical profile data calculated from the ERA5 atmospheric data are used to analyze the optimal elevation interval of ZTD. Then we propose the GGZTD-P model based on piecewise exponential functions. The accuracy of the combined GGZTD-P model and GPT3 model is validated using data from radiosonde stations and MERRA-2. Using the profiled ZTD of radiosonde stations as the reference value, the GGZTD-P model had an rms of 3.23 cm, which was 53 % higher than that of the GPT3 model. When MERRA-2 reanalysis data were used as the reference values, GGZTD-P performed better than the GPT3 model in each latitude region. We also established empirical grid models with different window sizes, using the sliding window algorithm. The models with different window sizes still showed relatively good performance, and users can choose an appropriate model based on their needs.
All of the data generated during the current study and the code are available on Zenodo (https://doi.org/10.5281/zenodo.8206173, Huang et al., 2023b).
LH: conceptualization, methodology, formal analysis, validation, data curation, writing (original draft, reviewing, and editing), funding acquisition. SL: conceptualization, methodology, formal analysis, software, validation, data curation, writing (original draft). GZ: conceptualization, methodology, formal analysis, data curation, writing (reviewing and editing). FC: validation, investigation. JL: investigation. LL: investigation, funding acquisition.
The contact author has declared that none of the authors has any competing interests.
Publisher’s note: Copernicus Publications remains neutral with regard to jurisdictional claims made in the text, published maps, institutional affiliations, or any other geographical representation in this paper. While Copernicus Publications makes every effort to include appropriate place names, the final responsibility lies with the authors.
The authors express gratitude to the reviewers and GMD editors for their valuable comments on the paper. Additionally, thanks are extended to the University of Wyoming for providing the radiosonde profiles, ECMWF for ERA5 reanalysis data, and NASA for the MERRA-2 reanalysis product.
This research has been funded by the National Natural Science Foundation of China (grant no. 41704027), the Guangxi Natural Science Foundation of China (grant no. 2023GXNSFAA026355), the Guangxi Key Laboratory of Spatial Information and Geomatics (grant no. 19-050-11-24), the “Ba Gui Scholars” program of the provincial government of Guangxi, the Innovation Project of GuangXi Graduate Education (grant no. YCSW2023338), the State Key Laboratory of Geodesy and Earth's Dynamics, the Innovation Academy for Precision Measurement Science and Technology, and the Chinese Academy of Sciences (grant no. SKLGED2023-3-1).
This paper was edited by Le Yu and reviewed by Zhenxin Liu and three anonymous referees.
Black, H. D.: An easily implemented algorithm for the tropospheric range correction, J. Geophys. Res., 83, 1825–1828, https://doi.org/10.1029/JB083iB04p01825, 1978.
Böhm, J., Heinkelmann, R., and Schuh, H.: Short note: A global model of pressure and temperature for geodetic applications, J. Geodesy, 81, 679–683, https://doi.org/10.1007/s00190-007-0135-3, 2007.
Böhm, J., Möller, G., Schindelegger, M., Pain, G., and Weber, R.: Development of an improved blind model for slant delays in the troposphere (GPT2w), GPS Solut., 19, 433–441, https://doi.org/10.1007/s10291-014-0403-7, 2015.
Bonafoni, S., Biondi, R., Brenot, H., and Anthes, R.: Radio occultation and ground-based GNSS products for observing, understanding and predicting extreme events: A review, Atmos. Res., 230, 104624, https://doi.org/10.1016/j.atmosres.2019.104624, 2019.
Chen, B. Y., Yu, W. K., Wang, W., Zhang, Z. T., and Dai, W. J.: A Global Assessment of Precipitable Water Vapor Derived From GNSS Zenith Tropospheric Delays With ERA5, NCEP FNL, and NCEP GFS Products, Earth and Space Science, 8, e2021EA001796, https://doi.org/10.1029/2021EA001796, 2021.
Chen, P., Ma, Y., Liu, H., and Zheng, N.: A new global tropospheric delay model considering the spatiotemporal variation characteristics of ZTD with altitude coefficient, Earth and Space Science, 7, e2019EA000888, https://doi.org/10.1029/2019EA000888, 2020.
Chen, S., Gan, T. Y., Tan, X. Z., Shao, D. G., and Zhu, J. Q.: Assessment of CFSR, ERA-Interim, JRA-55, MERRA-2, NCEP-2 reanalysis data for drought analysis over China, Clim. Dynam., 53, 737–757, https://doi.org/10.1007/s00382-018-04611-1, 2019.
Ding, J. S. and Chen, J. P.: Assessment of empirical troposphere model GPT3 based on NGL's global troposphere products, Sensors, 20, 3631, https://doi.org/10.3390/s20133631, 2020.
Gupta, P., Verma, S., Bhatla, R., Chandel, S. A., Singh, J., and Payra, S.: Validation of surface temperature derived from MERRA-2 Reanalysis against IMD gridded data set over India, Earth and Space Science, 7, e2019EA000910, https://doi.org/10.1029/2019EA000910, 2020.
Hopfield, H. S.: Two-Quartic tropospheric refractivity profile for correcting satellite data, J. Geophys. Res., 74, 4487–4499, https://doi.org/10.1029/JC074i018p04487, 1969.
Huang, L. K., Jiang, W. P., Liu, L. L., Chen, H., and Ye, S. R.: A new global grid model for the determination of atmospheric weighted mean temperature in GPS precipitable water vapor, J. Geodesy, 93, 159–176, https://doi.org/10.1007/s00190-018-1148-9, 2019.
Huang, L. K., Guo, L. J., Liu, L. L., Chen, H., Chen, J., and Xie, S. F.: Evaluation of the ZWD/ZTD values derived from MERRA-2 global reanalysis products using GNSS observations and radiosonde data, Sensors, 20, 6440, https://doi.org/10.3390/s20226440, 2020.
Huang, L. K., Zhu, G., Liu, L. L., Chen, H., and Jiang, W. P.: A global grid model for the correction of the vertical zenith total delay based on a sliding window algorithm, GPS Solut., 25, 98, https://doi.org/10.1007/s10291-021-01138-7, 2021.
Huang, L. K., Wang, X., Xiong, S., Li, J. Y., Liu, L. L., Mo, Z. X., Fu, B. L., and He, H. C.: High-precision GNSS PWV retrieval using dense GNSS sites and in-situ meteorological observations for the evaluation of MERRA-2 and ERA5 reanalysis products over China, Atmos. Res., 276, 106247, https://doi.org/10.1016/j.atmosres.2022.106247, 2022.
Huang, L., Zhu, G,, Peng, H., Liu, L., Ren, C., and Jiang, W.: An improved global grid model for calibrating zenith tropospheric delay for GNSS applications, GPS Solut., 27, 17, https://doi.org/10.1007/s10291-022-01354-9, 2023a.
Huang, L., Lan, S., Zhu, G., Chen, F., Li, J., and Liu, L.: A global grid model for the estimation of zenith tropospheric delay considering the variations at different altitudes, Zenodo [data set], https://doi.org/10.5281/zenodo.8206173, 2023b.
Krueger, E., Schüler, T., Hein, G., and Martellucci, A.: Galileo tropospheric correction approaches developed within GSTB-V1, in: Proceedings of ENC-GNSS 2004, Rotterdam, the Netherlands, 16–19 May 2004, https://www.researchgate.net/publication/228730717_Galileo_Tropospheric_Correction_Approaches_Developed_within_GSTB-V1 (last access: 20 June 2023), 2004.
Lagler, K., Schindelegger, M., Böhm, J., Krásná, H., and Nilsson, T.: GPT2: empirical slant delay model for radio space geodetic techniques, Geophys. Res. Lett., 40, 1069–1073, https://doi.org/10.1002/grl.50288, 2013.
Landskron, D. and Böhm, J.: VMF3/GPT3: Refined discrete and empirical troposphere mapping functions, J. Geodesy, 92, 349–360, https://doi.org/10.1007/s00190-017-1066-2, 2018.
Leandro, R., Santos, M., and Langley, R.: UNB neutral atmosphere models: development and performance, in: Proceedings of the ION NTM 2006 Monterey, California USA 18–20 January 2006, 564–573, https://doi.org/10.1007/s10291-007-0077-5, 2006.
Leandro, R., Langley, R., and Santos, M.: UNB3m_ pack: A neutral atmosphere delay package for radiometric space techniques, GPS Solut., 12, 65–70, 2008.
Li, H., Zhu, G., Kang, Q., and Wang, H.: A global zenith tropospheric delay model with ERA5 and GNSS-based ZTD difference correction, GPS Solut., 27, 154, https://doi.org/10.1007/s10291-023-01503-8, 2023.
Li, Q. Z., Yuan, L. G., Chen, P., and Jiang, Z. S.: Global grid-based Tm model with vertical adjustment for GNSS precipitable water retrieval, GPS Solut., 24, 73, https://doi.org/10.1007/s10291-020-00988-x, 2020.
Li, W., Yuan, Y. B., Ou, J. K., and He, Y. J.: IGGtrop_SH and IGGtrop_rH: two improved empirical tropospheric delay models based on vertical reduction functions, IEEE T. Geosci. Remote, 56, 5276–5288, https://doi.org/10.1109/TGRS.2018.2812850, 2018.
Li, X. X., Huang, J X., Li, X., Lyu, H. B., Wang, B., Xiong, Y., and Xie, W. L.: Multi-constellation GNSS PPP instantaneous ambiguity resolution with precise atmospheric corrections augmentation, GPS Solut., 25, 107, https://doi.org/10.1007/s10291-021-01123-0, 2021.
Nafisi, V., Urquhart, L., Santos, M., Cannon, M. E., and Work, D. B.: Comparison of ray-tracing packages for troposphere delays, IEEE T. Geosci. Remote Sens., 50, 469–480, https://doi.org/10.1109/TGRS.2011.2160952, 2012.
Penna, N., Dodson, A., and Chen, W.: Assessment of EGNOS tropospheric correction model, J. Navigation, 54, 37–55, https://doi.org/10.1017/S0373463300001107, 2001.
Prado, A., Vieira, T., and Fernandes, M. J.: Assessment of SIRGAS-CON tropospheric products using ERA5 and IGS, Journal of Geodetic Science, 12, 195–210, https://doi.org/10.1515/jogs-2022-0144, 2022.
Randles, C. A., Sliva, A. M., Buchard, V., Colarco, P. R., Darmenov, A., Govindaraju, R., Smirnov, A., Holben, B., Ferrare, R., Hair, J., Shinozuka, Y., and Flynn, C.: The MERRA-2 aerosol reanalysis, 1980 Onward. Part I: System Description and Data Assimilation Evaluation, J. Climate, 30, 6823–6850, https://doi.org/10.1175/JCLI-D-16-0609.1, 2017.
Saastamoinen, J.: Contributions to the theory of atmospheric refraction, B. Géod., 105, 279–298, https://doi.org/10.1007/BF02521844, 1972.
Schüler, T.: The TropGrid2 standard tropospheric correction model, GPS Solut., 18, 123–131, https://doi.org/10.1007/s10291-013-0316-x, 2014.
Shangguan, M., Cheng, X., Pan, X., Dang, M., Wu, L., and Xie, Z.: Assessments of global tropospheric delay retrieval from reanalysis based on GNSS data, Chinese Journal of Geophysics, 66, 939–950, https://doi.org/10.6038/cjg2022Q0023, 2023 (in Chinese).
Sun, Y. L., Yang, F., Liu, M. J., Li, Z., Gong, X., and Wang, Y. Y.: Evaluation of the weighted mean temperature over China using multiple reanalysis data and radiosonde, Atmos. Res., 285, 106664, https://doi.org/10.1016/j.atmosres.2023.106664, 2023.
Sun, Z. Y., Zhang, B., and Yao, Y. B.: An ERA5-based model for estimating tropospheric delay and weighted mean temperature over China with improved spatiotemporal resolutions, Earth and Space Science, 6, 1926–1941, https://doi.org/10.1029/2019EA000701, 2019.
Tang, Y. X., Liu, L. L., and Yao, C. L.: Empirical model for mean temperature and assessment of precipitable water vapor derived from GPS, Geodesy and Geodynamics, 4, 51–56, https://doi.org/10.3724/SP.J.1246.2013.04051, 2013.
Thayer, G. D.: An improved equation for the radio refractive index of air, Radio Sci., 9, 803–807, https://doi.org/10.1029/RS009i010p00803, 1974.
Yang, F., Guo, J., Zhang, C., Li, Y., and Li, J.: A Regional Zenith Tropospheric Delay (ZTD) Model Based on GPT3 and ANN, Remote Sensing, 13, 838, https://doi.org/10.3390/rs13050838, 2021.
Yao, Y., Zhu, S., and Yue, S.: A globally applicable, season-specific model for estimating the weighted mean temperature of the atmosphere, J. Geodesy, 86, 1125–1135, https://doi.org/10.1007/s00190-012-0568-1, 2012.
Yao, Y., He, C., Zhang, B., and Xv, C.: A new global zenith tropospheric delay model GZTD, Chinese Journal of Geophysics, 56, 2218–2227, https://doi.org/10.6038/cjg20130709, 2013.
Yao, Y. B., Xu, X. Y., Xu, C. Q., Peng, W. J., and Wan, Y. Y.: GGOS tropospheric delay forecast product performance evaluation and its application in real-time PPP, J. Atmos. Sol.-Terr. Phy., 175, 1–17, https://doi.org/10.1016/j.jastp.2018.05.002, 2018.
Yao, Y. B., Xu, X. Y., Xu, C. Q., Peng, W. J., and Wan, Y. Y.: Establishment of a real-time local tropospheric fusion model, Remote Sensing, 11, 1321, https://doi.org/10.3390/rs11111321, 2019.
Zhang, H., Yuan, Y., and Li, W.: An analysis of multisource tropospheric hydrostatic delays and their implications for GPS/GLONASS PPP-based zenith tropospheric delay and height estimations, J. Geodesy, 95, 83, https://doi.org/10.1007/s00190-021-01535-3, 2021.
Zhang, H., Yuan, Y., and Li, W.: Real-time wide-area precise tropospheric corrections (WAPTCs) jointly using GNSS and NWP forecasts for China, J. Geodesy, 96, 44, https://doi.org/10.1007/s00190-022-01630-z, 2022.
Zhang, W. X., Lou, Y. D., Liu, W. X., Huang, J. F., Wang, Z. P., Zhou, Y. Z., and Zhang, H. S.: Rapid troposphere tomography using adaptive simultaneous iterative reconstruction technique, J. Geodesy, 94, 76, https://doi.org/10.1007/s00190-020-01386-4, 2020.
Zhao, Q., Yao, Y., Yao, W., and Zhang, S.: GNSS-derived PWV and comparison with radiosonde and ECMWF ERA-Interim data over mainland China, J. Atmos. Sol.-Terr. Phy., 182, 85–92, https://doi.org/10.1016/j.jastp.2018.11.004, 2019.
Zhao, Q. Z., Su, J., Li, Z. F., Yang, P. F., and Yao, Y. B.: Adaptive aerosol optical depth forecasting model using GNSS observation, IEEE T. Geosci. Remote, 60, 2454–2462, https://doi.org/10.1109/TGRS.2021.3129159, 2022.
Zhao, Q., Liu, K., Sun, T., Yao, Y., and Li, Z.: A novel regional drought monitoring method using GNSS-derived ZTD and precipitation, Remote Sens. Environ., 297, 113778, https://doi.org/10.1016/j.rse.2023.113778, 2023a.
Zhao, Q., Su, J., Xu, C., Yao, Y., Zhang, J., and Wu, J.: High-precision ZTD model of altitude-related correction, IEEE J. Sel. Top. Appl., 16, 609–621, https://doi.org/10.1109/JSTARS.2022.3228917, 2023b.
Zhou, C. C., Peng, B. B., Li, W., Zhong S. M., Ou, J. K., Chen, R. J., and Zhao, X. L: Establishment of a Site-Specific Tropospheric Model Based on Ground Meteorological Parameters over the China Region, Sensors, 17, 1722, https://doi.org/10.3390/s17081722, 2017.
Zhou, Y. Z., Lou, Y. D., Zhang, Z. Y., Zhang, W. X., and Bai, J. N.: An improved tropospheric mapping function modeling method for space geodetic techniques, J. Geodesy, 95, 98, https://doi.org/10.1007/s00190-021-01556-y, 2021.
Zhu G., Huang, L. L., Yang, Y. Z., Li, J. Y., Zhou, L., and Liu, L. L.: Refining the ERA5-based global model for vertical adjustment of zenith tropospheric delay, Satellite Navigation, 3, 27, https://doi.org/10.1186/s43020-022-00088-w, 2022.
- Abstract
- Introduction
- Data and methods
- Characteristic analysis
- Accuracy verification
- Global piecewise ZTD empirical grid model with different sliding window sizes
- Conclusion
- Code and data availability
- Author contributions
- Competing interests
- Disclaimer
- Acknowledgements
- Financial support
- Review statement
- References