the Creative Commons Attribution 4.0 License.
the Creative Commons Attribution 4.0 License.
 | 12 Dec 2023
The statistical emulators of GGCMI phase 2: responses of year-to-year variation of crop yield to CO2, temperature, water, and nitrogen perturbations
Weihang Liu
Christoph Müller
Jonas Jägermeyr
James A. Franke
Haynes Stephens
Shuo Chen
Understanding the impact of climate change on year-to-year variation of crop yield is critical to global food stability and security. While crop model emulators are believed to be lightweight tools to replace the models, few emulators have been developed to capture such interannual variation of crop yield in response to climate variability. In this study, we developed a statistical emulator with a machine learning algorithm to reproduce the response of year-to-year variation of four crop yields to CO2 (C), temperature (T), water (W), and nitrogen (N) perturbations defined in the Global Gridded Crop Model Intercomparison Project (GGCMI) phase 2. The emulators were able to explain more than 52 % of the variance of simulated yield and performed well in capturing the year-to-year variation of global average and gridded crop yield over current croplands in the baseline. With the changes in CO2–temperature–water–nitrogen (CTWN) perturbations, the emulators could reproduce the year-to-year variation of crop yield well over most current cropland. The variation of R and the mean absolute error was small under the single CTWN perturbations and dual-factor perturbations. These emulators thus provide statistical response surfaces of yield, including both its mean and interannual variability, to climate factors. They could facilitate spatiotemporal downscaling of crop model simulation, projecting the changes in crop yield variability in the future and serving as a lightweight tool for multi-model ensemble simulation. The emulators enhanced the flexibility of crop yield estimates and expanded the application of large-ensemble simulations of crop yield under climate change.
- Article
(8830 KB) - Full-text XML
-
Supplement
(1182 KB) - BibTeX
- EndNote


The impact of climate change on crop yield is an increasing concern related to global food security (Kinnunen et al., 2020). Two distinct approaches have been used to evaluate the impact of climate change on crop yield, process-based crop models and statistical models. Process-based crop models are reliable tools to project crop yields under future climate change but are computationally expensive (Jones et al., 2017). In contrast, statistical models are lightweight tools that can fit yield response to historical climate change (Li et al., 2019b), but the relationship between climate factors and crop yield is based on the historical climate conditions and their effects on crop yields, which can hardly be used for future projection with new, unprecedented climate conditions. Therefore, it is promising to develop tools that can reduce the expense of computation and increase capacity for flexible future projections (Franke et al., 2020a).
Earlier studies have developed statistical emulators of process-based crop model results to balance the advantages and disadvantages of process-based crop models and statistical models. Those statistical emulators were initially developed with “entire scenario” (simultaneous changes in climate factors) simulation during historical or future periods. Emulators have been developed for process-based crop models, like APSIM (Shahhosseini et al., 2019), GEPIC (Folberth et al., 2019), GWG (Xu et al., 2021), GAZE (Raimondo et al., 2021), and WOFOST (Tartarini et al., 2021), and used to estimate historical crop yield. As an emulator trained by historical simulations cannot project the crop yield in the future, multiple crop model ensemble simulations in future climate scenarios have been used to calibrate emulators (Blanc, 2017, 2020; Blanc and Sultan, 2015; Mistry et al., 2017; Ostberg et al., 2018). However, scenario-based future crop yield projection is not a systematic perturbation of climate factors (Franke et al., 2020a). For instance, scenario-based yield projection can only provide the simulated crop yield driven by simultaneous changes in climate factors. The dependency of temperature and precipitation will be kept in scenarios such that the impact of temperature and precipitation cannot be clearly separated.
An alternative emulation based on a training dataset of “perturbed factors” was introduced, which offers advantages compared to separate effects of crop yield drivers. Perturbed factor emulation was first conducted with site-based crop model simulations, which could estimate the yield across a broad range of CO2, temperature, and water (Fronzek et al., 2018; Makowski et al., 2015; Pirttioja et al., 2015), but these emulators were limited to the site level. To break the constraints of site-based simulation, the Global Gridded Crop Model Intercomparison (GGCMI) phase 2 provided a simulation dataset across structured CO2–temperature–water–nitrogen (CTWN) perturbation cubes. This dataset offered two major advantages: it allows for separating the effects of different climatic factors and of nitrogen levels on crop yields, and it allows distinguishing the climatological mean and year-to-year variation of yields (Franke et al., 2020b). The phase 2 dataset was published to support the derivation of crop yield climate change “response surfaces”. Based on the CTWN cubes, a statistical emulator has been developed, providing near-global-coverage multi-model emulators of climatological mean yield projections from the GGCMI phase 2 ensemble by using a regression model with a third-order polynomial basis function (Franke et al., 2020a). Due to the focus on climatological mean yield, the aspect of year-to-year variation of yield under CTWN perturbations has not been fully analyzed or exploited in emulator design.
For climate change risk assessment, interannual yield variability (or the year-to-year variation of yield) is an important metric of yield risk (Liu et al., 2021b) and food supply stability (Liu et al., 2021a) but has been insufficiently addressed in previous studies (Campbell et al., 2016). Large year-to-year variation of crop yield can influence livelihoods of producers, food prices (Hasegawa et al., 2021), and hunger (Janssens et al., 2020) and even lead to political instabilities (Sternberg, 2011). Recently, year-to-year variation has been introduced as a metric for climate change risk to global crop production (Jägermeyr et al., 2021). Developing statistical emulators that can reproduce the year-to-year variation of yield from the CTWN cubes could therefore provide a powerful tool for studies focusing on the risk of climate change impact on yield. In this study, we exclusively aimed to develop statistical emulators to reproduce year-to-year yield variation with GGCMI phase 2 data.
Table 1GGCMs included in emulation. Each model offers the same set of CTWN simulations across four crops.
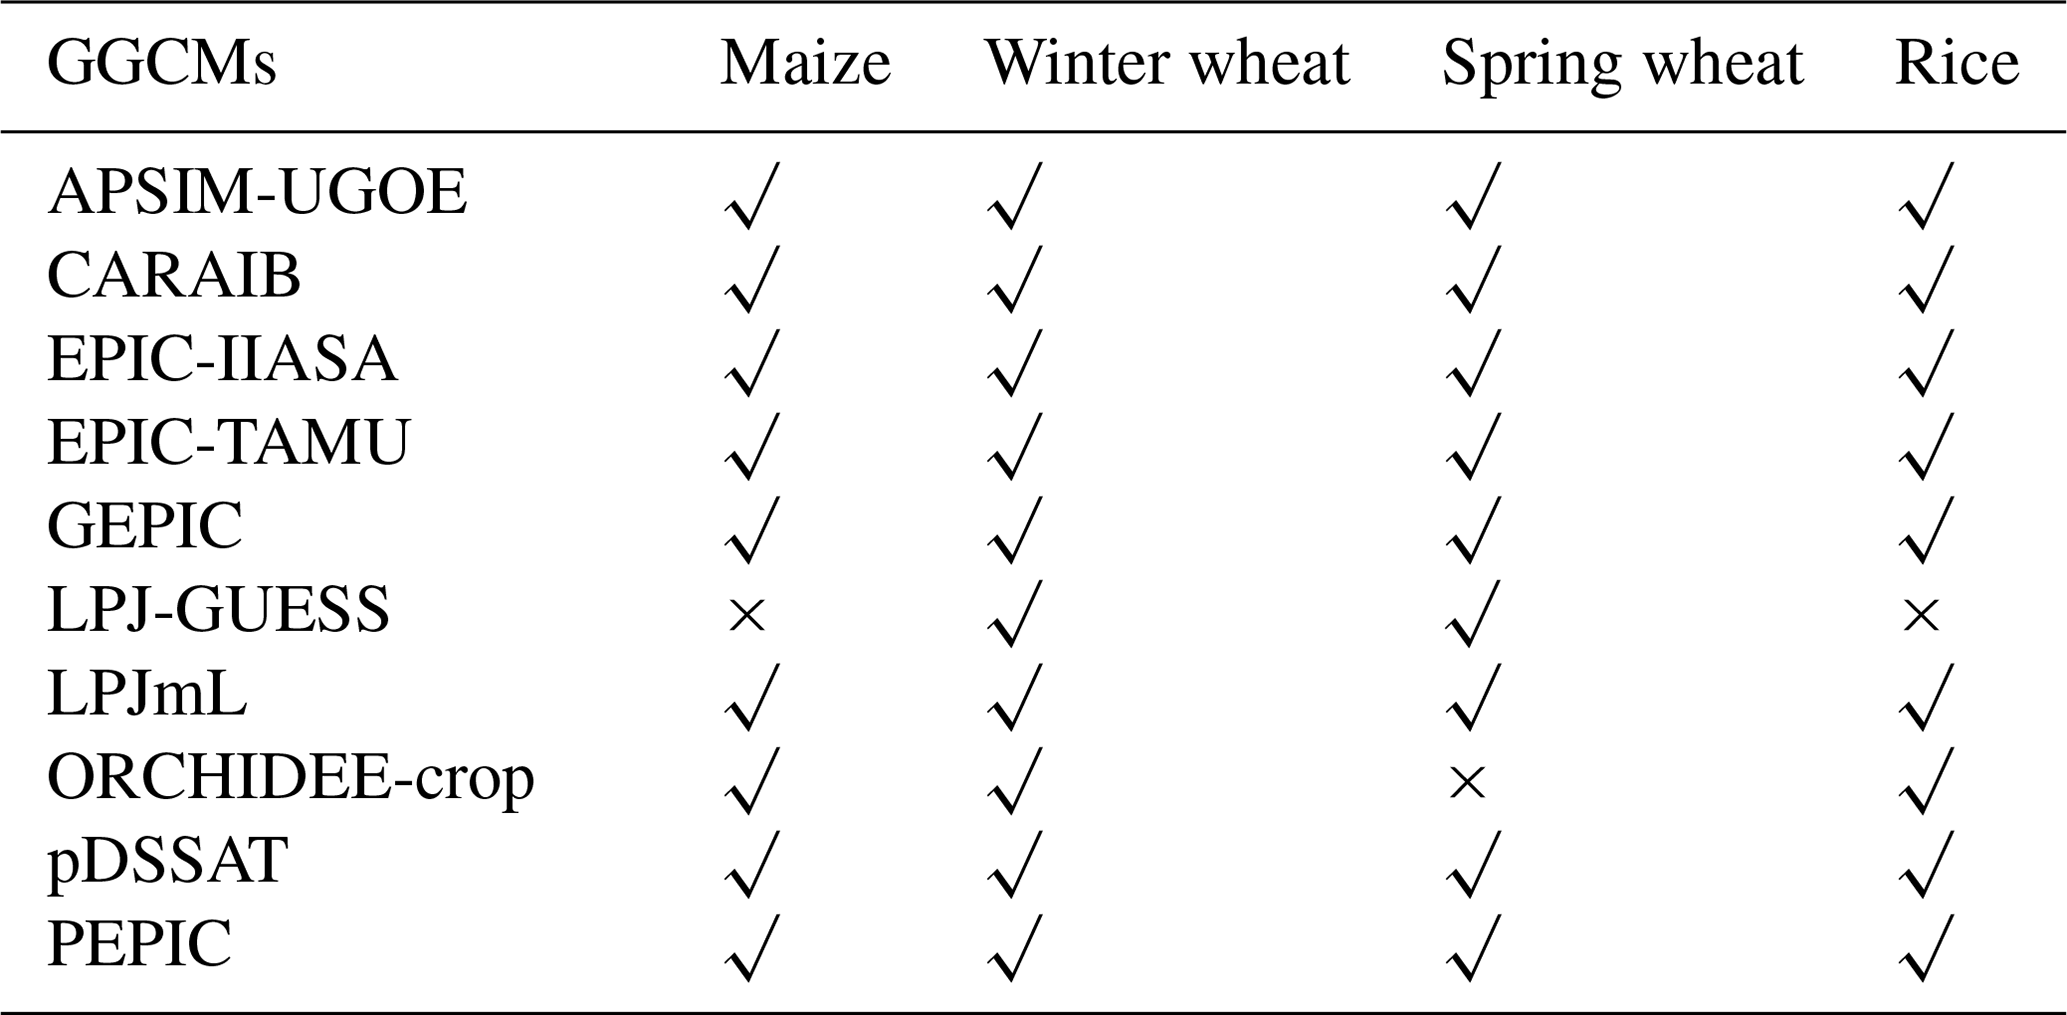
∗ LPJ-GUESS omits maize and rice, and ORCHIDEE-crop omits spring wheat (denoted by ×).
2.1 Data
The input and output data for the simulation of global gridded crop yield were obtained from the GGCMI phase 2 dataset, which includes gridded crop yield projections at 0.5∘ longitudinal–latitudinal resolution for maize, spring wheat, winter wheat, and rice (Franke et al., 2020b). The input data for the process-based simulations in GGCMI phase 2 included data for climate, soil, atmospheric CO2 concentration, and nitrogen fertilizer application rates. Baseline (1980–2010) climate inputs were used from the AgMIP Modern-Era Retrospective Analysis for Research and Applications (AgMERRA) forcing dataset, including daily maximum and minimum temperatures, precipitation, and solar radiation (Ruane et al., 2015). Systematic perturbations were conducted in each grid cell with seven temperature levels (from −1 to +6 K in 1 K intervals, with +5 K skipped), nine precipitation levels (from −50 % to +30 % in 10 % intervals, with −40 % skipped; the Winf precipitation level presents simulations under fully irrigated conditions), four CO2 concentration levels (360, 510, 660, and 810 ppm), and three nitrogen levels (10, 60, and 200 kg ha−1). Simulations were repeated for two adaptation strategies, i.e., no adaptation in cultivars (A0) and adaptation by maintaining growing season length (A1). A total of 12 global gridded crop models (GGCMs) were then forced with each of these perturbations of the original reanalysis weather data. We selected 10 of 12 crop models in the GGCMI phase 2 experiment for constructing the emulators. These were APSIM-UGOE, CARAIB, EPIC-IIASA, EPIC-TAMU, GEPIC, LPJ-GUESS, LPJmL, ORCHIDEE-crop, pDSSAT, and PEPIC (Table 1). PROMET and JULES were not included as they used different climate inputs.
The GGCMs used a national and subnational crop calendar based on Sacks et al. (2010), Portmann et al. (2010), and environment-based extrapolations (Elliott et al., 2015). The crop calendar was used to determine the window to calculate the climatic predictors and grid-specific growing season length. The current global harvested area for identifying currently used cropland was obtained from the spatial production allocation model (SPAM), whose spatial resolution was 10 km. The soil type data were obtained from the Harmonized World Soil Database (Nachtergaele et al., 2009).
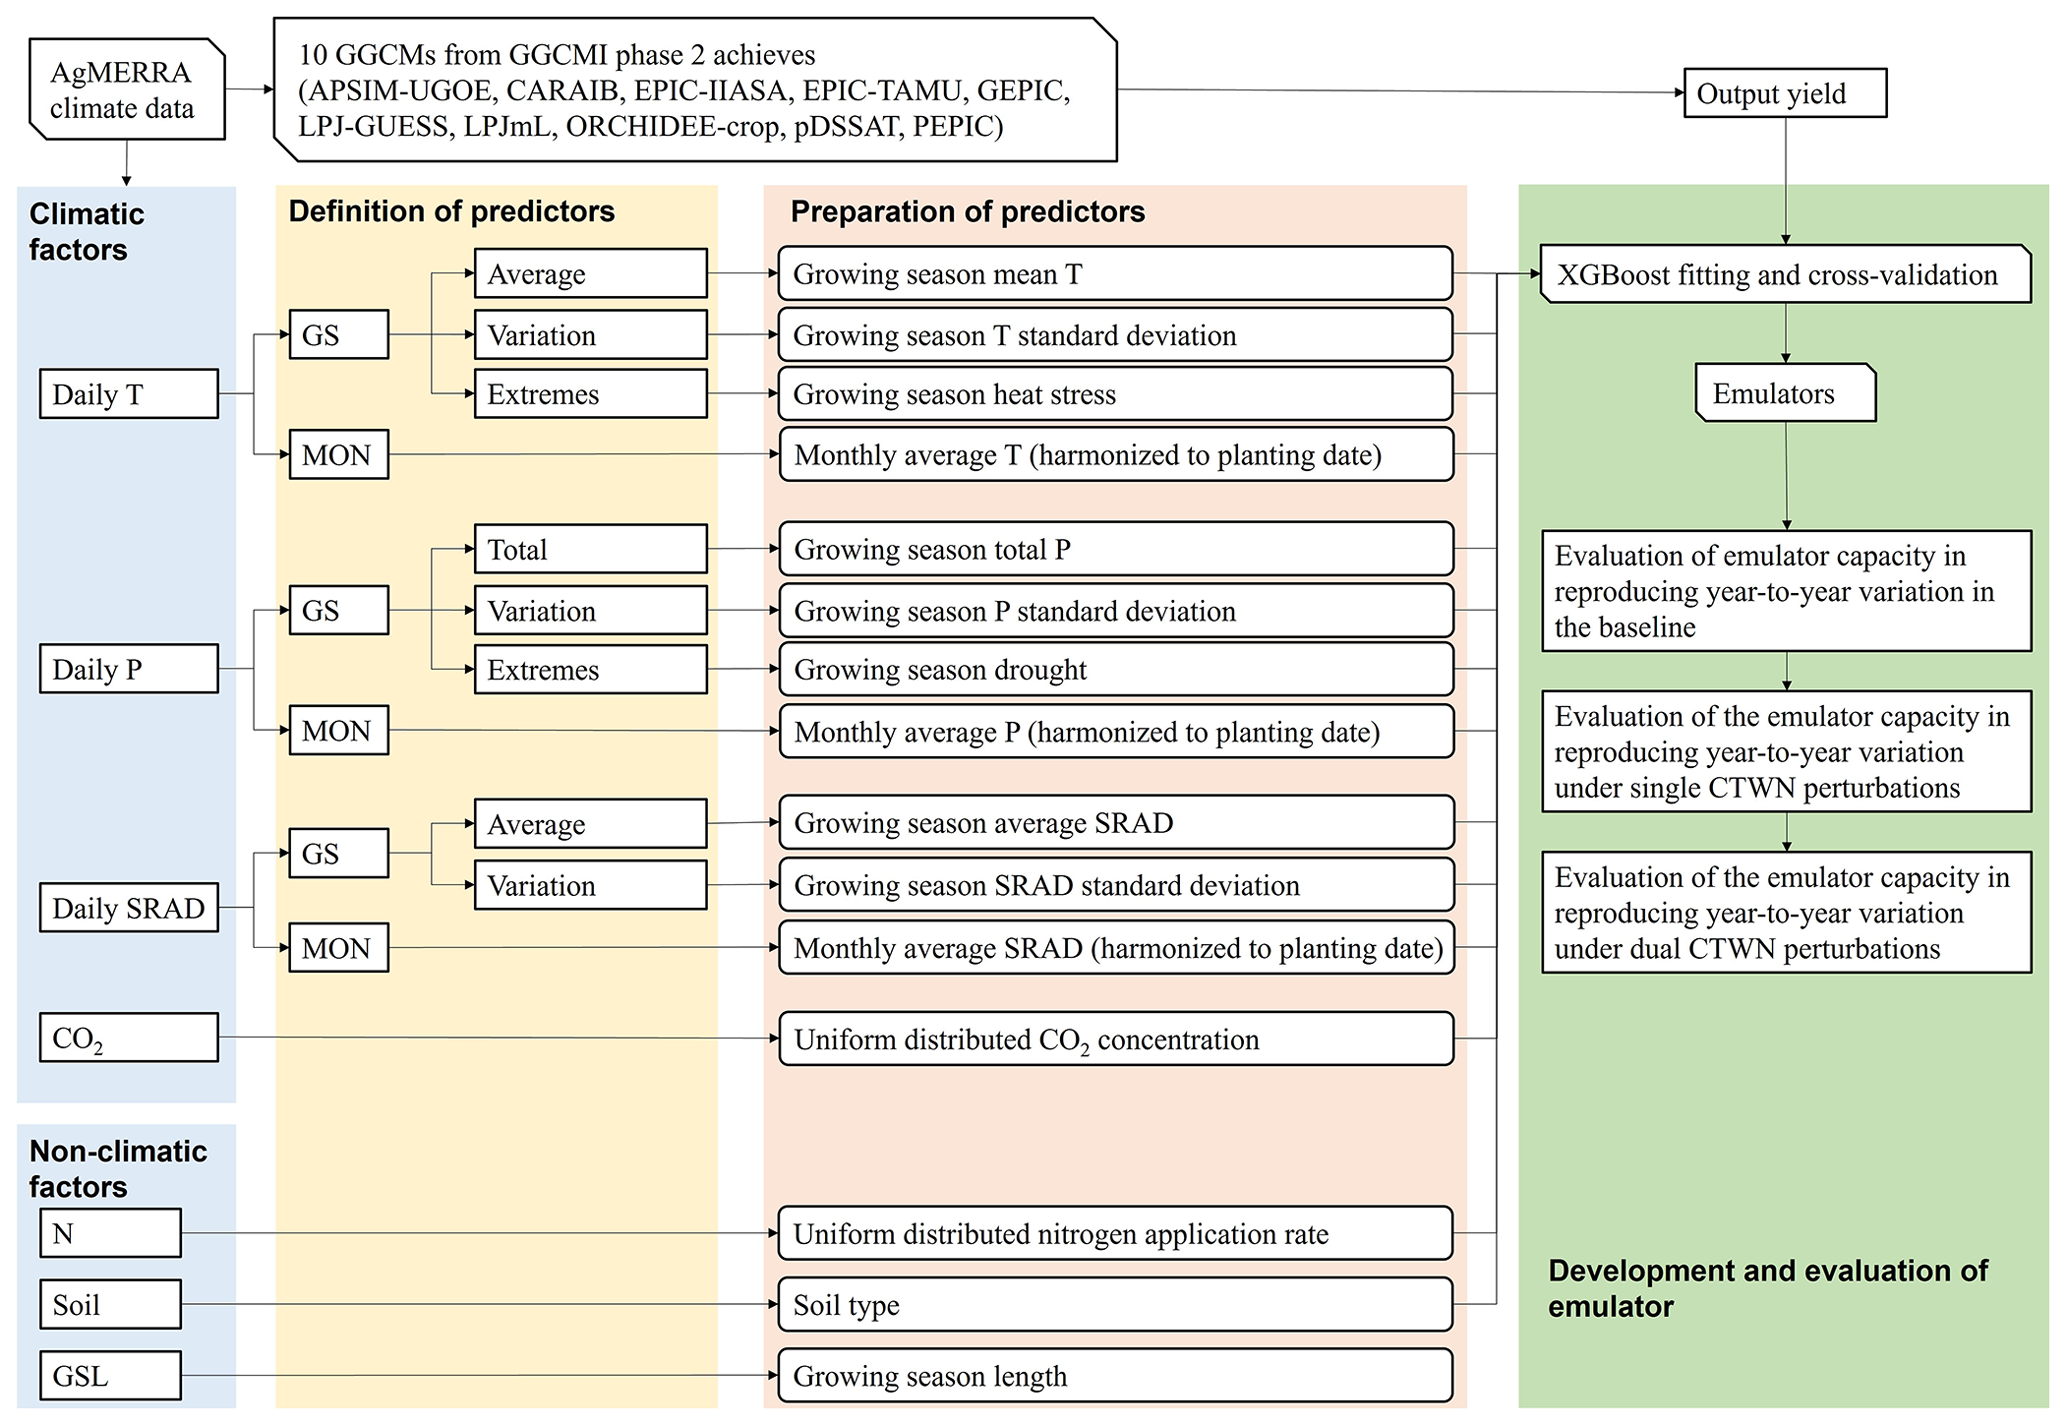
Figure 1Overall framework of emulator development for GGCMs. Each GGCM–crop combination was calibrated as an emulator independently. T: temperature, processed separately for daily maximum and minimum temperatures; P: precipitation; SRAD: solar radiation, N: nitrogen; soil: soil properties. When developing irrigated yield emulator, precipitation-related predictors are excluded.
2.2 Methods
Our study focused on the development and evaluation of emulators, which involves the following steps: (1) defining the predictors used to train the emulators, (2) preparing the predictors with climatic and non-climatic data, (3) training and cross-validating the emulators with a machine learning algorithm, and (4) evaluating the performance of emulators (Fig. 1).
Table 2Predictors of emulation. For rainfed yield emulators, we used all these predictors, but for fully irrigated yield emulators, the precipitation predictors were not included. Full, GS, and MON were three strategies to develop emulators. Full: developing emulators with all the climatic predictors; GS: developing emulators with climatic predictors during the growing season; MON: developing emulators with climatic predictors on a monthly scale.
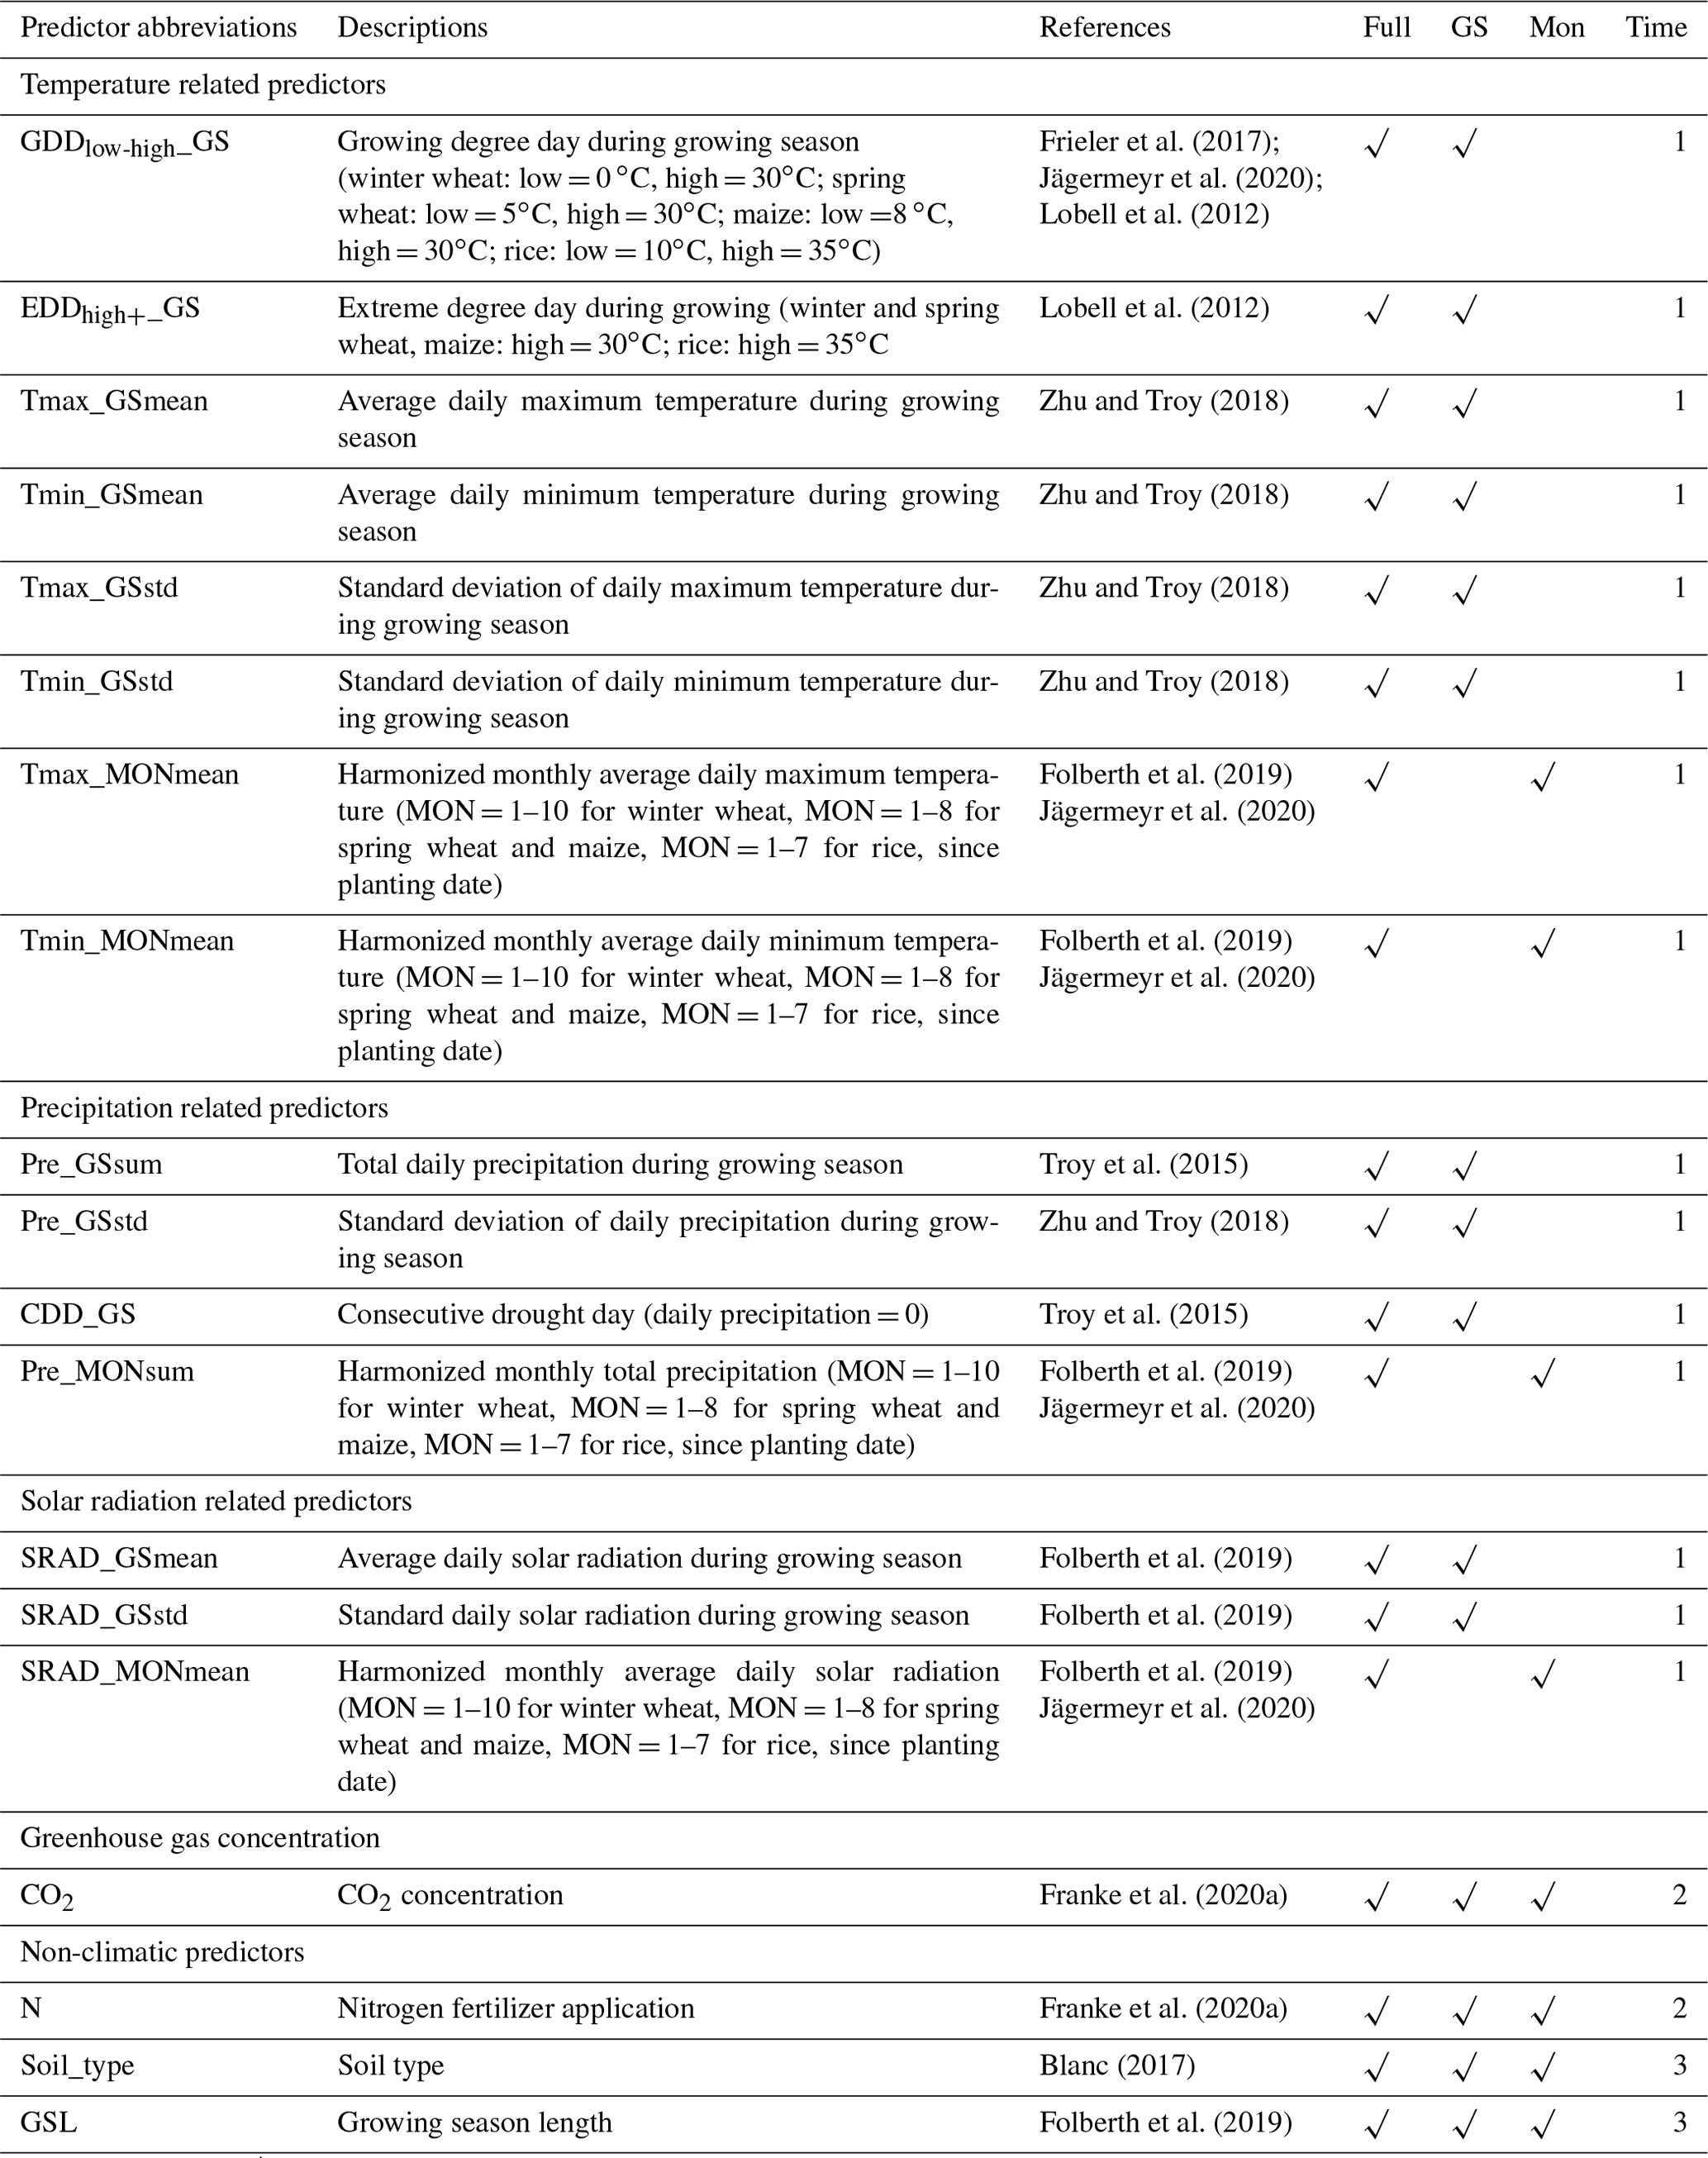
A checkmark in the row (√) indicates that the predictors were included in the emulator. The column “Time” clarifies the spatiotemporal dynamics of predictors. The number 1 represents both time- and space-variant predictors, 2 represents space-invariant predictors, and 3 represents time-invariant predictors.
2.2.1 Definition and preparation of predictors
All the predictors were computed or adapted from the GGCMs' input and output datasets. The climatic predictors were defined at two timescales, growing season (GS) and monthly (MON) (Table 2). The growing season average temperature, total precipitation, and average solar radiation were able to explain the variation of climatological mean yield of GGCMI phase 2 (Franke et al., 2020a). To improve the capacity of emulators to reproduce the year-to-year variation of crop model yield, daily variability and extremes of climate factors during the growing seasons were considered here. The variations of temperature, precipitation, and solar radiation during the growing seasons were calculated with the standard deviation of their daily values in each growing season, which represents the intensity of the daily fluctuation of weather. Additionally, heat and drought were selected to be the extreme climate predictors, which were quantified by extreme degree days (EDDs, cumulative temperature that exceed the high temperature threshold, Lobell et al., 2012) and maximum consecutive dry days (CDDs, maximum length of consecutive days without precipitation, Troy et al., 2015) because the negative effect of these two extremes can be shown by current GGCM (Heinicke et al., 2022). Other climate extremes, like excessive wetness, were not used because the GGCM failed to show the negative effect (Li et al., 2019a; Liu et al., 2022).
The monthly predictors only consisted of monthly average values. The monthly average temperature, total precipitation, and average solar radiation were harmonized according to the specific planting date. The number of months was determined with the crop-specific maximum growing season length over the global cropland defined by GGCMI phase 2. For winter and spring wheat, we prepared the climatic predictors over 10 and 8 months after sowing. For maize and rice, climatic predictors over 8 and 7 months after sowing were used, respectively.
The atmospheric CO2 concentration and the nitrogen application rate were uniformly distributed predictors. All years and grid cells were set at the same CO2 concentration and nitrogen application rate for each perturbation. Soil property is an important temporally constant predictor, whose interaction with climate played an important role in yield simulation and emulator development (Blanc, 2017). As the soil parameter settings of each GGCM varied, we selected the soil type at each grid to represent the spatial variation of soil properties. There were 13 soil types, including heavy clay, silty clay, light clay, silt clay loam, clay loam, silt, silt loam, sandy clay, loam, sandy clay loam, sandy loam, loamy sand, and sand. The most obvious difference across cultivars over global croplands is the growing degree requirement to reach maturity, which was determined by both mean climatology and cultivar traits. To reproduce the number of days from planting date to maturity date given by GGCMI phase 2 crop calendar input, we added a temporally constant growing season length as a predictor, i.e., a temporally constant growing season length.
As the purpose of emulator training is to develop a lightweight tool for crop simulation, there has always been a trade-off between the goodness of fit and the number of predictors. Therefore, we considered three strategies of using our predictors. Strategy A uses all predictors (the Full model), which is expected to derive the best goodness of fit. Strategy B uses only climatic predictors during the growing season (the GS model), together with CO2 concentration, nitrogen application rate, site information, soil class, and growing season length. Strategy C uses only monthly average climatic predictors with other location-invariant predictors (the MON model). In general, Strategy B uses the smallest number of predictors, but those predictors need to be computed from daily climate forcing. Strategy C only relays on monthly climate data and is therefore the least costly strategy for data preparation. A comparison between the three strategies would help us find a good balance between the predictors used and overall goodness of fit of the emulators.
2.2.2 Emulator training and validation
Training the emulator of a specific GGCM is to derive the response relationship between input and output so that the emulator can replicate the complex process of yield simulation within the crop model. Emulation was trained by using machine learning regression on the GGCMI-2 ensemble of crop-specific simulated yield with all CTWN perturbations. Each grid year and perturbation combination was regarded as a sample in the fitting. We developed emulators of irrigated and rainfed yield and in A0 and A1 scenarios separately. Since the outputs of a GGCM outside current croplands were not well examined, we trained the machine-learning-based emulators only on currently used cropland, according to the SPAM data for each crop separately.
The extreme gradient boosting (XGBoost) algorithm, a highly efficient realization of the gradient boosting approach that showed the best performance in recent machine learning challenges (Chen and Guestrin, 2016), was used to train the emulators. Key parameters in XGBoost, including the learning rate (0.1), the number of estimators (4000), and the maximum tree depths (10), were tuned by a grid search along parameter dimensions based on the default parameter as a reference (Folberth et al., 2019). The goodness of fit of XGBoost was validated with the coefficient of determination :
where n is the sample size of the validation set, and k is the number of predictors.
Considering the spatiotemporal autocorrelation of simulated crop yield given by the GGCM, we now used a “held-out years and regions” strategy for leave-one-out cross-validation (Sweet et al., 2023). Specifically, all grid year samples are split into N folds. N is determined by the number of Köppen–Geiger (KG) classes, which have more than 100 grid cells with harvested areas. If there are too few harvested areas in one KG class, it will not be included in the cross-validation process. For each fold of emulator training and validation, we withhold 10 % of years (the last 3 years) and one entire KG class for validation, and the other grid year samples are used for training the emulator. We think selecting continuous years for validation can avoid temporal autocorrelation. If we randomly select 10 % of years, the correlation between adjacent years still exists. Actually, any continuous 3 years are able to solve this problem such that we just use the last years according to Sweet et al. (2023). Emulators were trained in Python3.8 with GPU (https://xgboost.readthedocs.io/en/latest/python/index.html, last access: 15 August 2023).
2.2.3 Evaluation of the emulator
Emulator performance was evaluated by comparing the 30-year emulated yield with the 30-year simulated yield of the GGCM. As we aimed at developing an emulator that could replicate the year-to-year variation of yield, the correlation coefficient (R), mean absolute error (MAE), and mean relative error (MRE) were used to evaluate the performance of emulators in the baseline and varied perturbations.
where n is the sample size of the validation set, YGGCM,i is the annual simulated yield of the GGCMs, YXGB,i is the annual projected yield of the XGB algorithm, and and were the average XGBoost predicted and GGCM-simulated yield, respectively.
Table 3Adjusted R2 of XGBoost derived from 10-fold cross-validation with randomly selected samples.
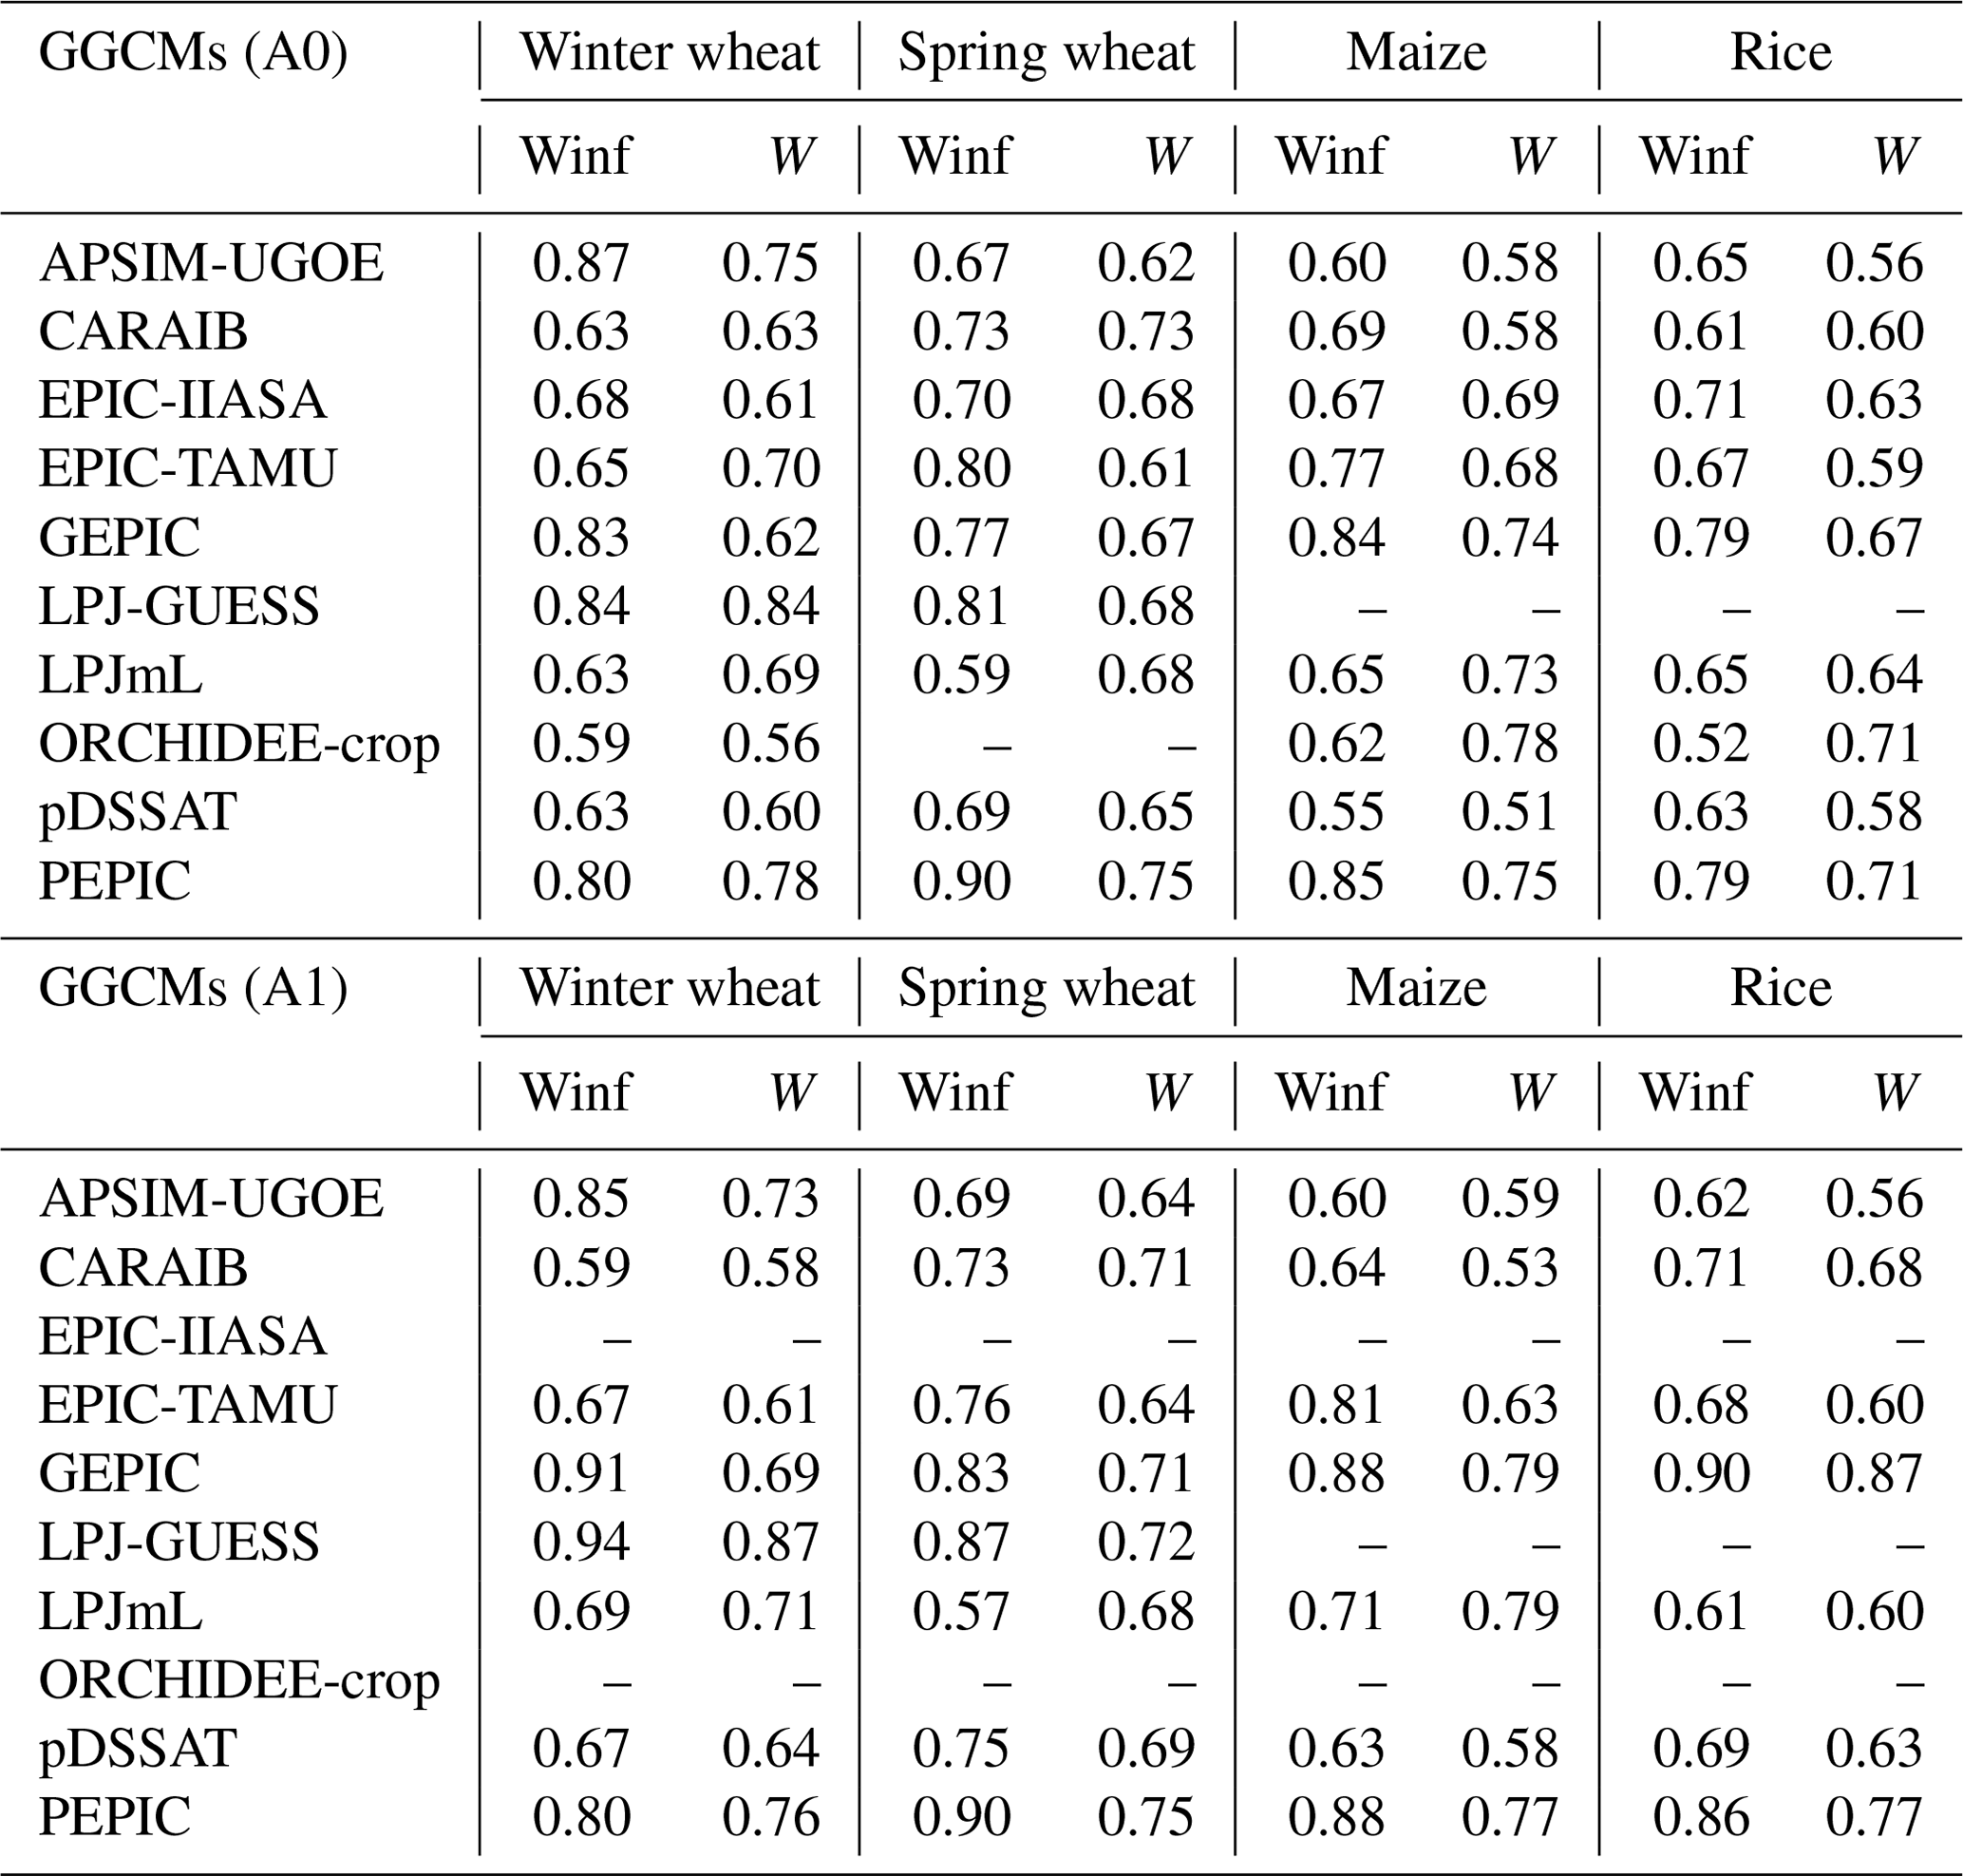
The “–” symbol denotes no GGCM simulation; Winf: irrigated condition; W: rainfed condition. A0 denotes no adaptation, and A1 denotes cultivar adaptation to regain original growing season length under warming scenarios.
3.1 Goodness of fit of the emulator training
Overall, the emulator developed with the XGBoost algorithm reproduced the variance of GGCM yield simulations well, with adjusted R2 greater than 0.52 (Table 3). For most emulators the adjusted R2 under a fully irrigated (Winf) simulation were greater than those under a rainfed simulation (W). Under A0 and A1 scenarios (A0 denotes no adaptation and A1 denotes adaptation of the growing season to regain the original growing season length under warming scenarios that otherwise lead to accelerated phenology and thus shorter growing seasons), the adjusted R2 was comparable. For different crops, the performances of emulators developed for winter and spring wheat were slightly better than those developed for maize and rice. Among the GGCMs, PEPIC's behavior can best be emulated by emulators, with the greatest R2 values for all crops and scenarios. There are also several GGCMs that are bit challenging for the XGB algorithm to capture, i.e., winter wheat and rice simulation from ORCHIDEE-crop, maize of pDSSAT, and spring wheat of LPJmL, with R2 values ranging from 0.52 to 0.63.
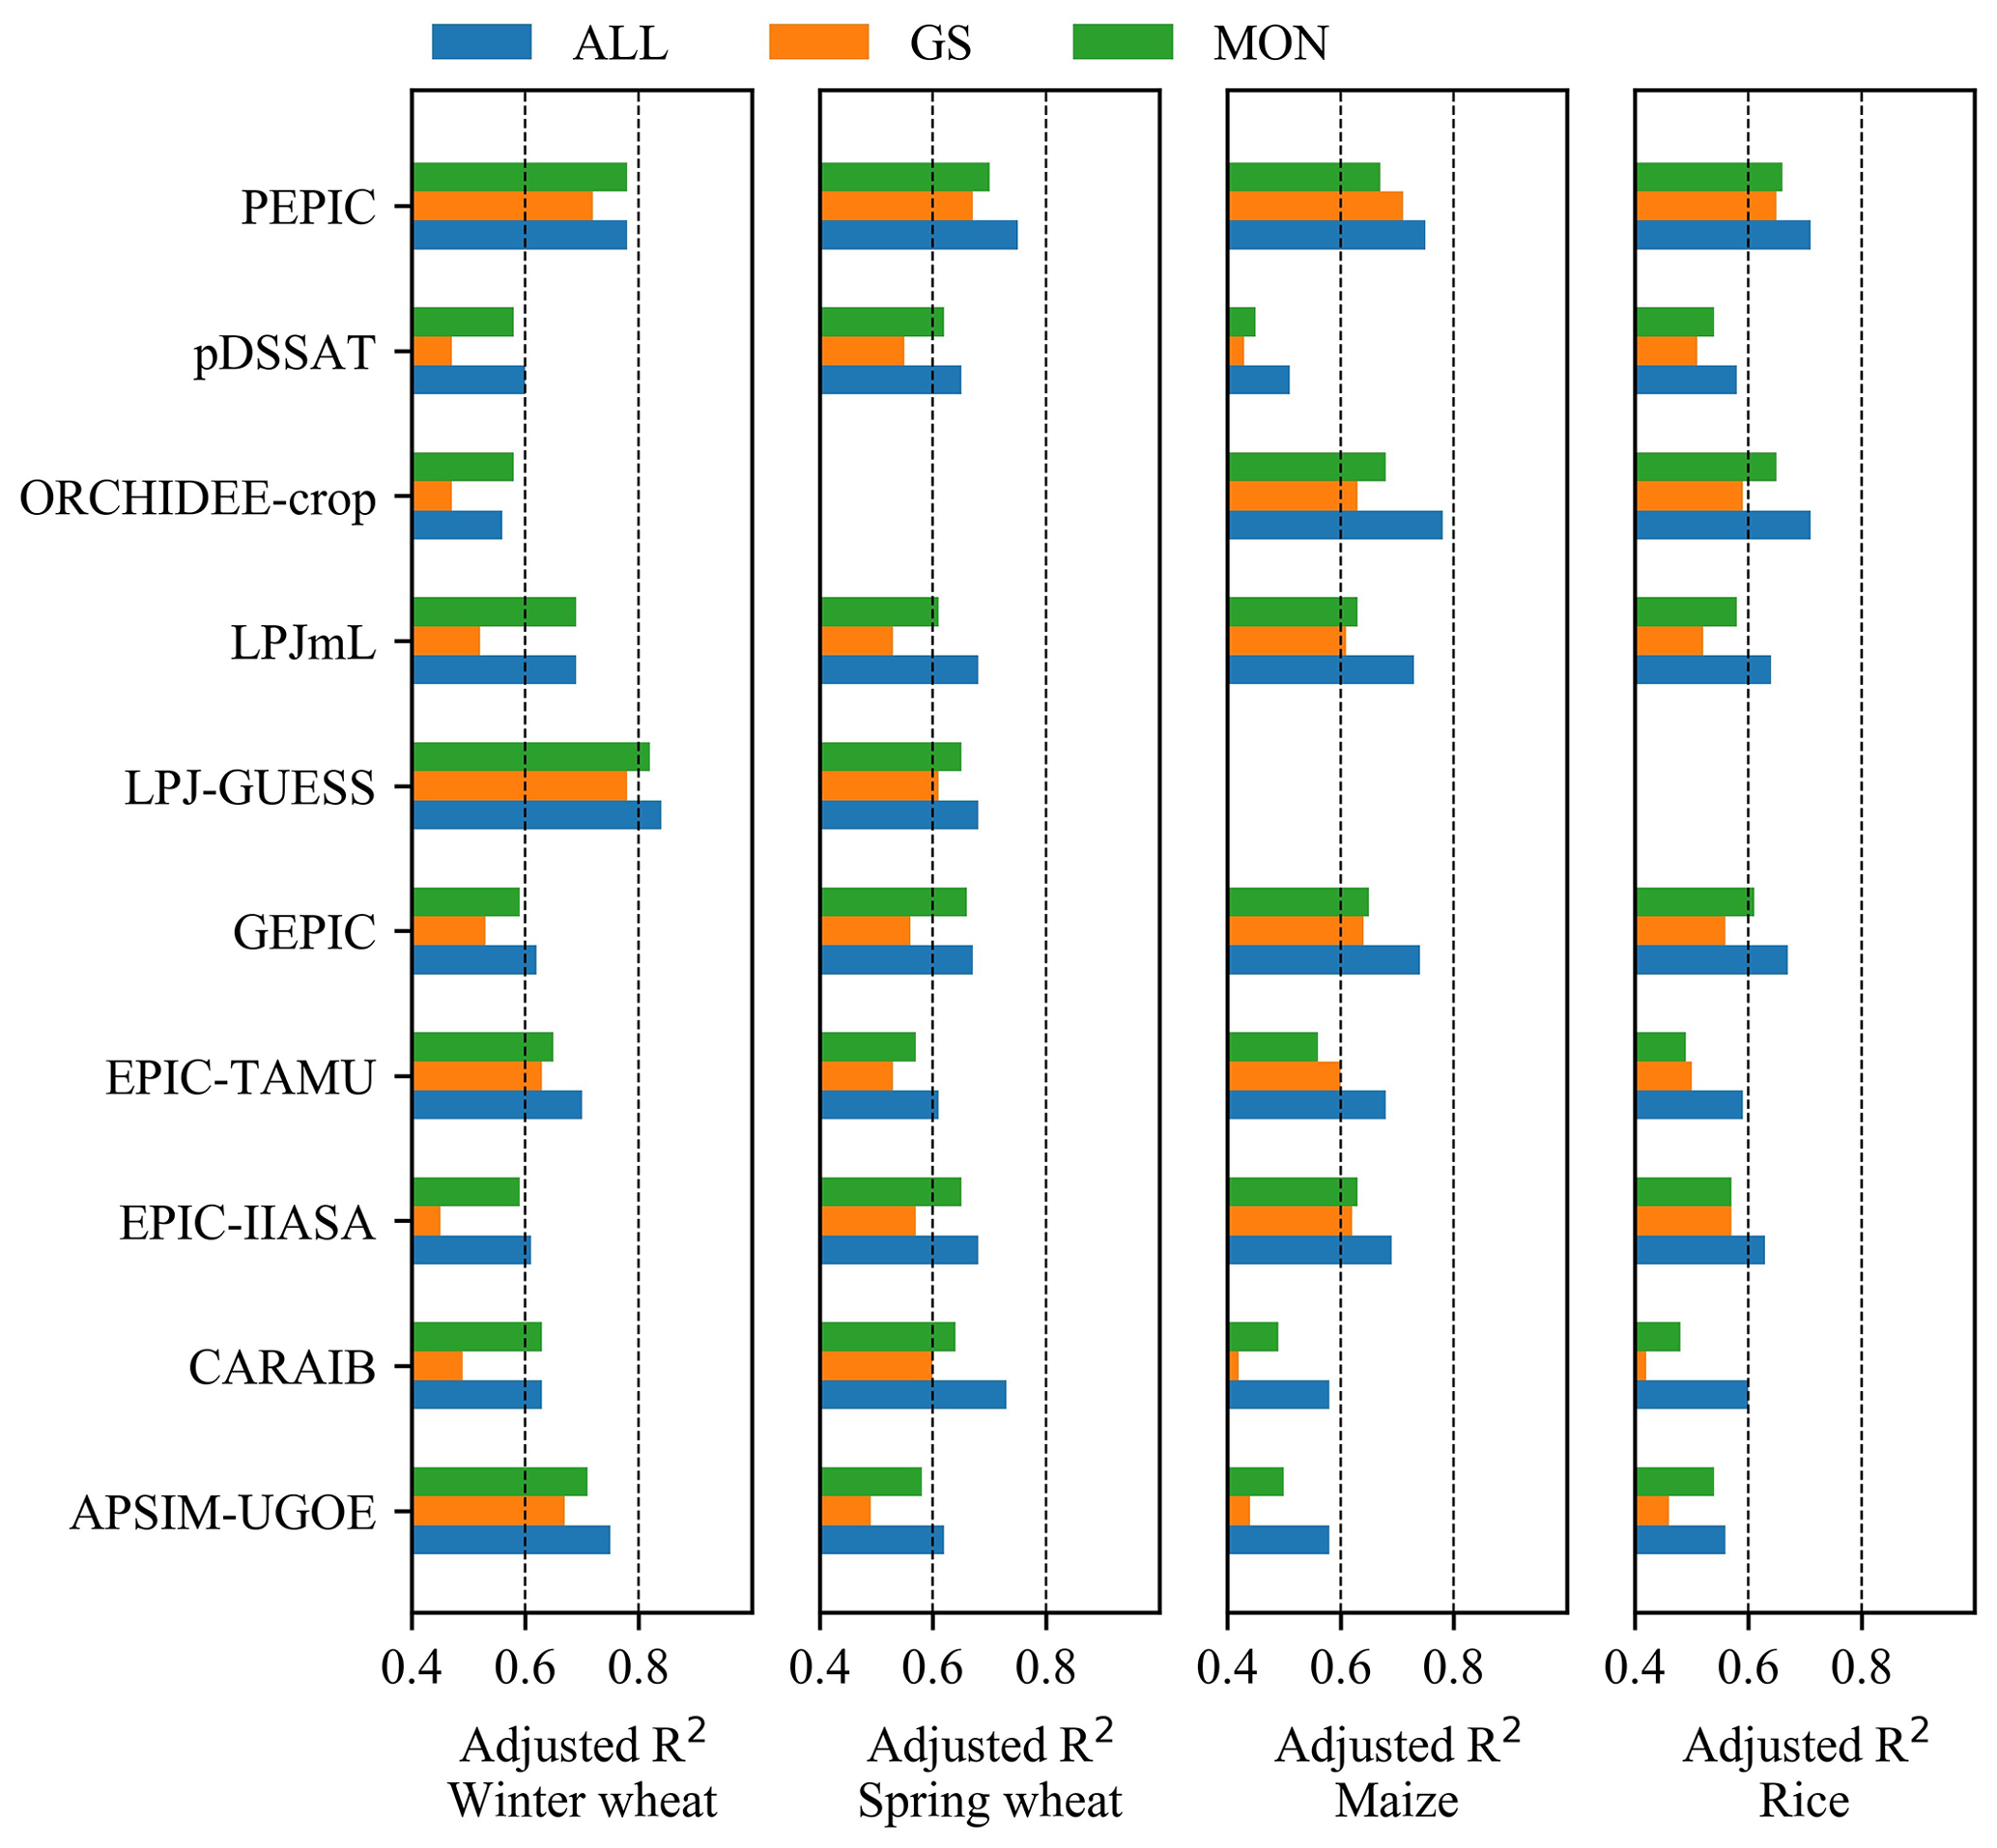
Figure 2Adjusted R2 of emulators (10-fold cross-validation with randomly selected samples) with a different strategy used by the predictors. All: Full model, GS: GS model, MON: MON model. Emulators for ORCHIDEE by spring wheat and LPJ-GUESS by maize and rice were not fitted due to the lack of simulation by raw GGCMs.
The adjusted R2 of emulators developed with all predictors (Full model) was greater than those developed with growing season predictors (GS model) and monthly predictors (MON model) (Fig. 2). GS models suffered from a reduced number of predictors, and their adjusted R2 values were 0.1–0.15 smaller than corresponding MON models. Still, Full models had the largest adjusted R2 at the cost of the largest number of predictors. For later usage of the emulators, a trade-off must be made between the cost of preparing predictors and model goodness of fit, and the MON model could be a balanced choice as it required only monthly average weather conditions.
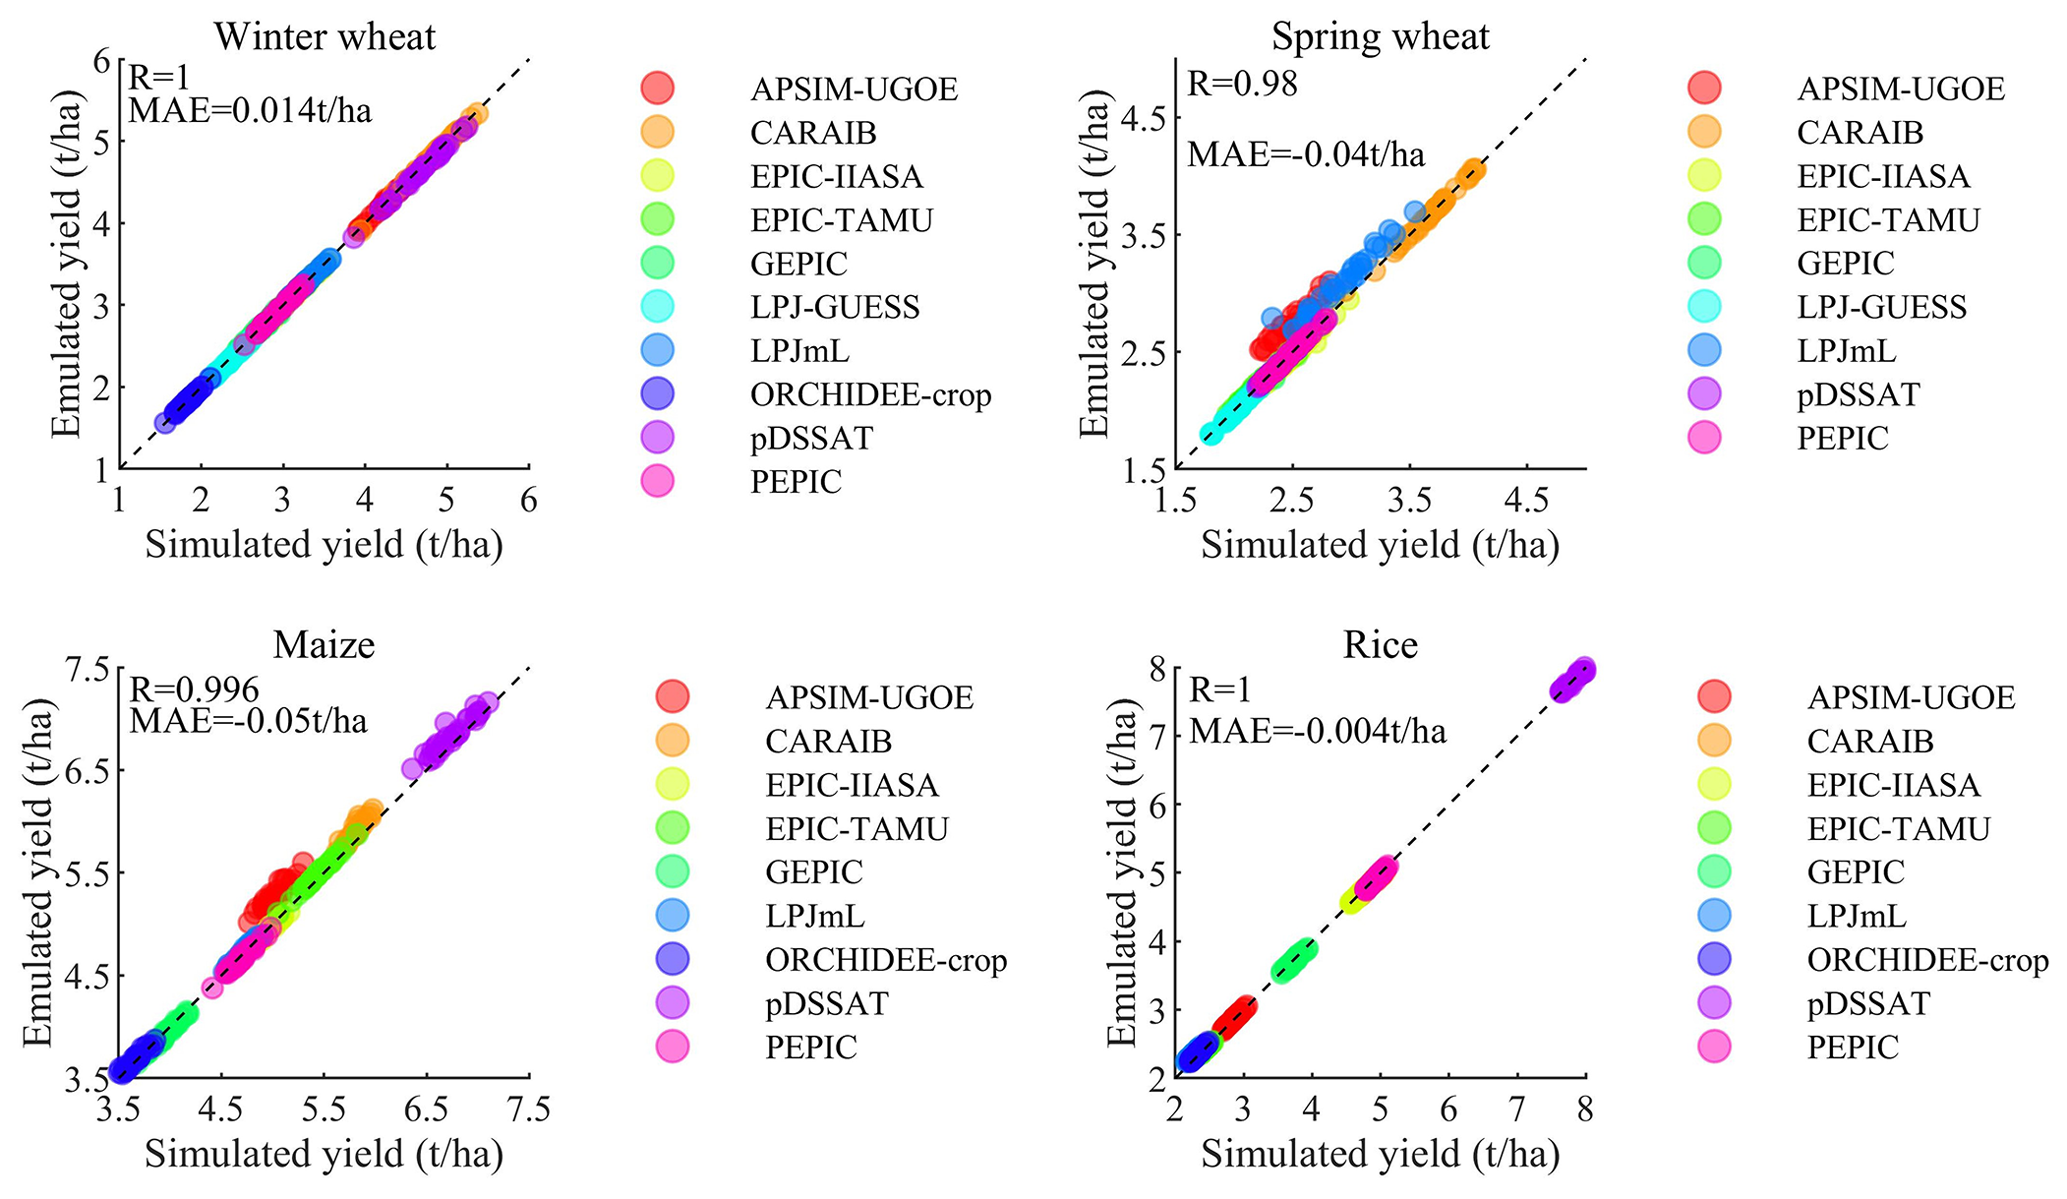
Figure 3Emulator performance in reproducing the year-to-year variation of global average yield (1981–2010) over current cropland. As ORCHIDEE-crop has not simulated yield under C360T0W0N200, we used the C360T0W10N200 as the baseline. Each point with the same color is yield in 30 years. R is the correlation coefficient and MAE is the mean absolute error.
3.2 Performance of emulators to capture the year-to-year variation of GGCM yield in the baseline
3.2.1 Performance of individual emulators at the global scale
Over current global cropland, the emulator of each GGCM could reproduce the year-to-year variation of global average yield well in the baseline period (during 1981–2010) (Fig. 3). All individual emulators captured the corresponding GGCM-simulated yield, with scatter concentrated on the 1:1 line. Different GGCM-simulated yield levels varied from 1.7 to 7.8 t ha−1, but the performance of the emulators has not been influenced.
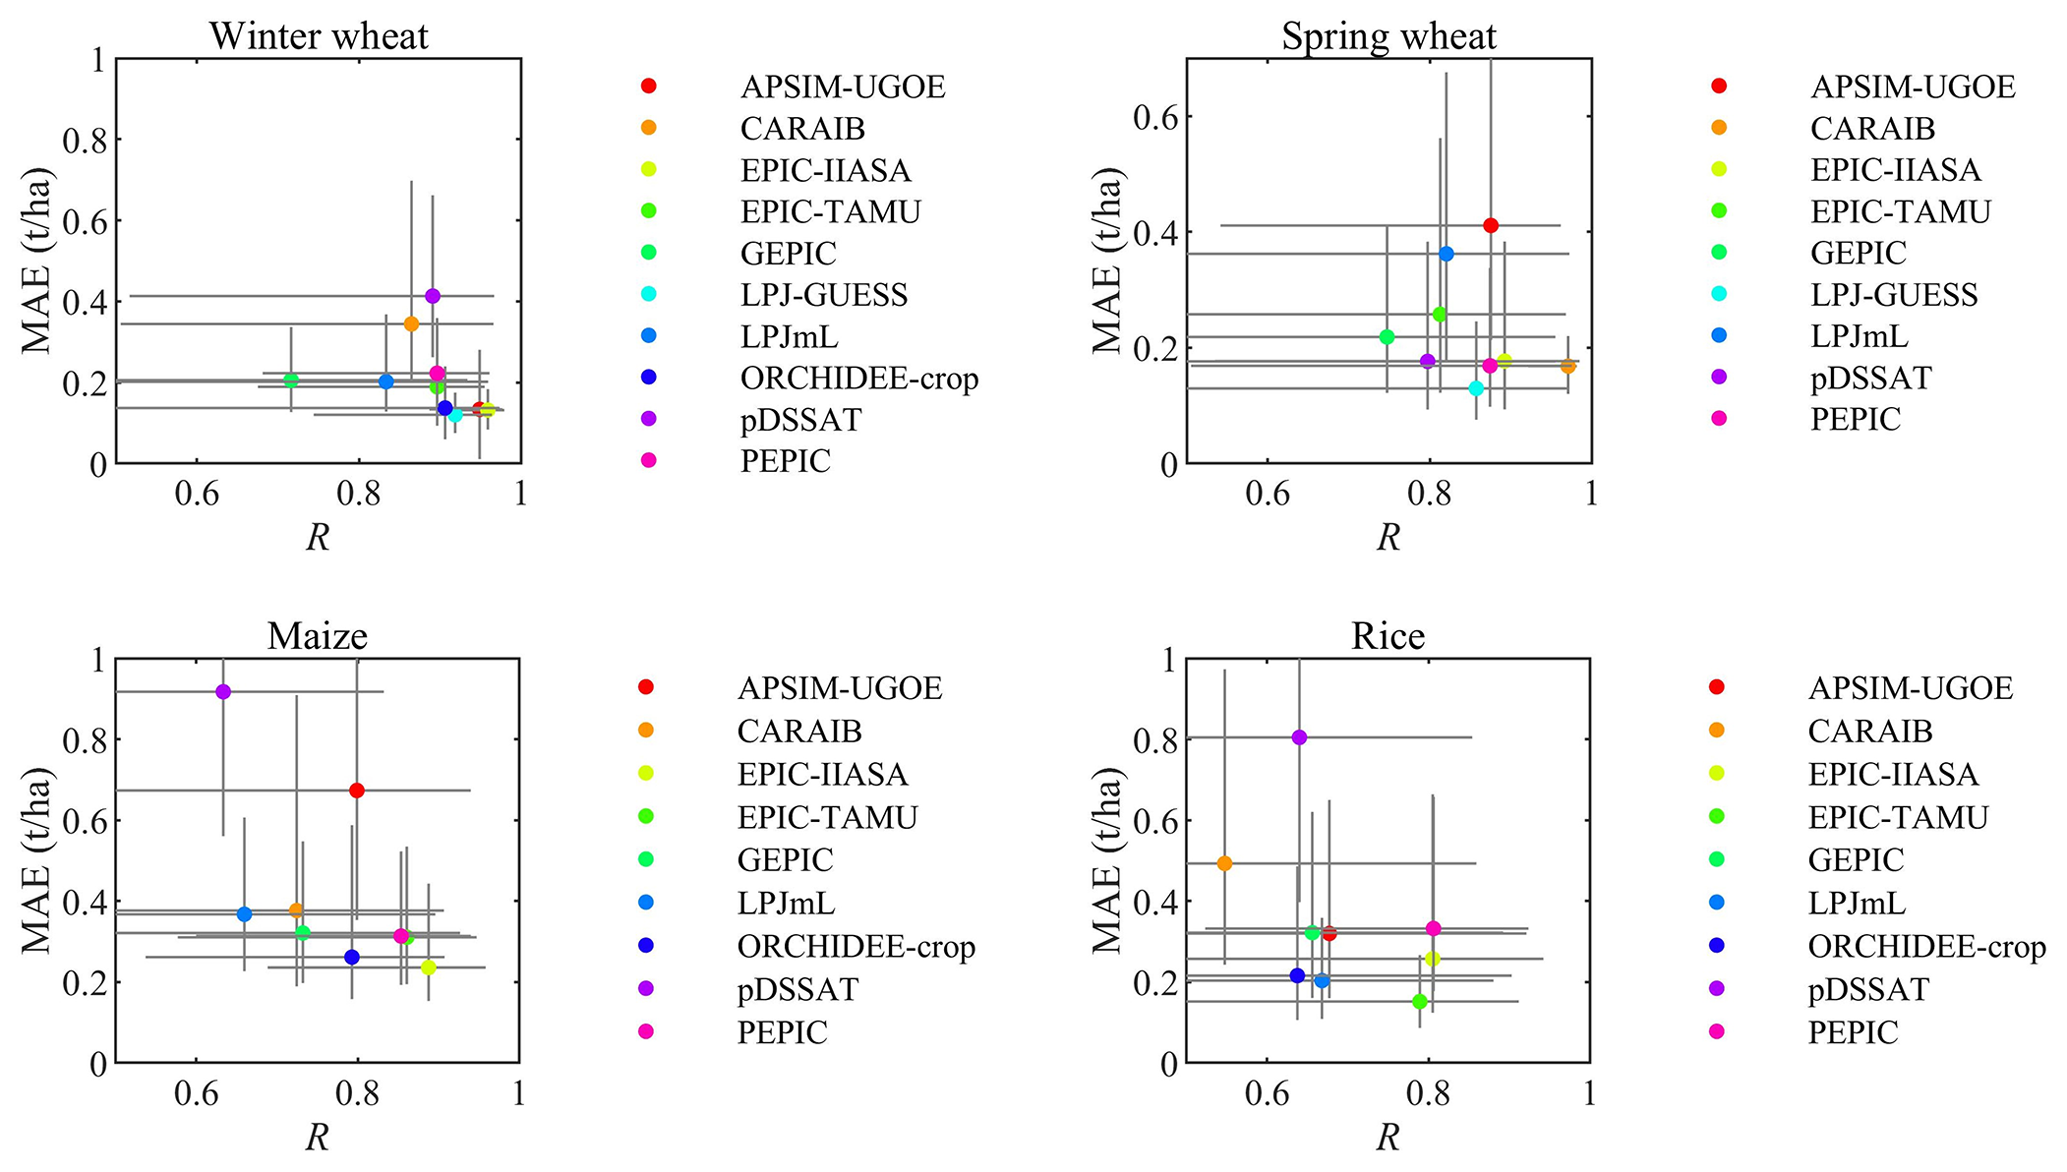
Figure 4Correlation coefficient (R) and mean absolute error (MAE) over current cropland in the baseline (C360T0W0N200). As ORCHIDEE-crop has not simulated yield under C360T0W0N200 perturbation, we used the C360T0W10N200 as the baseline. The dot denotes the median and the error bar denotes the interquartile range from all grid cells in which the crop is grown according to SPAM 2010 data.
3.2.2 Performance of individual emulators at the grid scale
The overall performances of emulators at grid level were good for most crop–GGCM combinations in the baseline. The performances of each emulator over current global cropland grids were plotted by using the scatter of MAE and R (Fig. 4). The capacity of emulators to reproduce the wheat yield simulated by GGCMs was better than that of maize and rice. The median R values over current winter and spring wheat harvested areas were greater than 0.7. The R of the EPIC-TAMU emulator and the LPJ-GUESS emulator were relatively smaller than the other eight emulators developed for winter and spring wheat, respectively. The median MAEs over current winter and spring wheat harvested areas were less than 0.4 and 0.3 t ha−1 for winter and spring wheat emulators, respectively, and the MAEs of the pDSSAT emulator and LPJmL emulator were relatively greater. Over current maize harvested areas, the median R was greater than 0.6 and the median of MAE was less than 0.7 t ha−1, except the pDSSAT emulator. The median R values of emulators developed for rice were greater than 0.5, and the median MAEs were less than 0.4 t ha−1 over current rice harvested areas, whereas the performances of the pDSSAT emulator and CARAIB emulator were relatively worse.
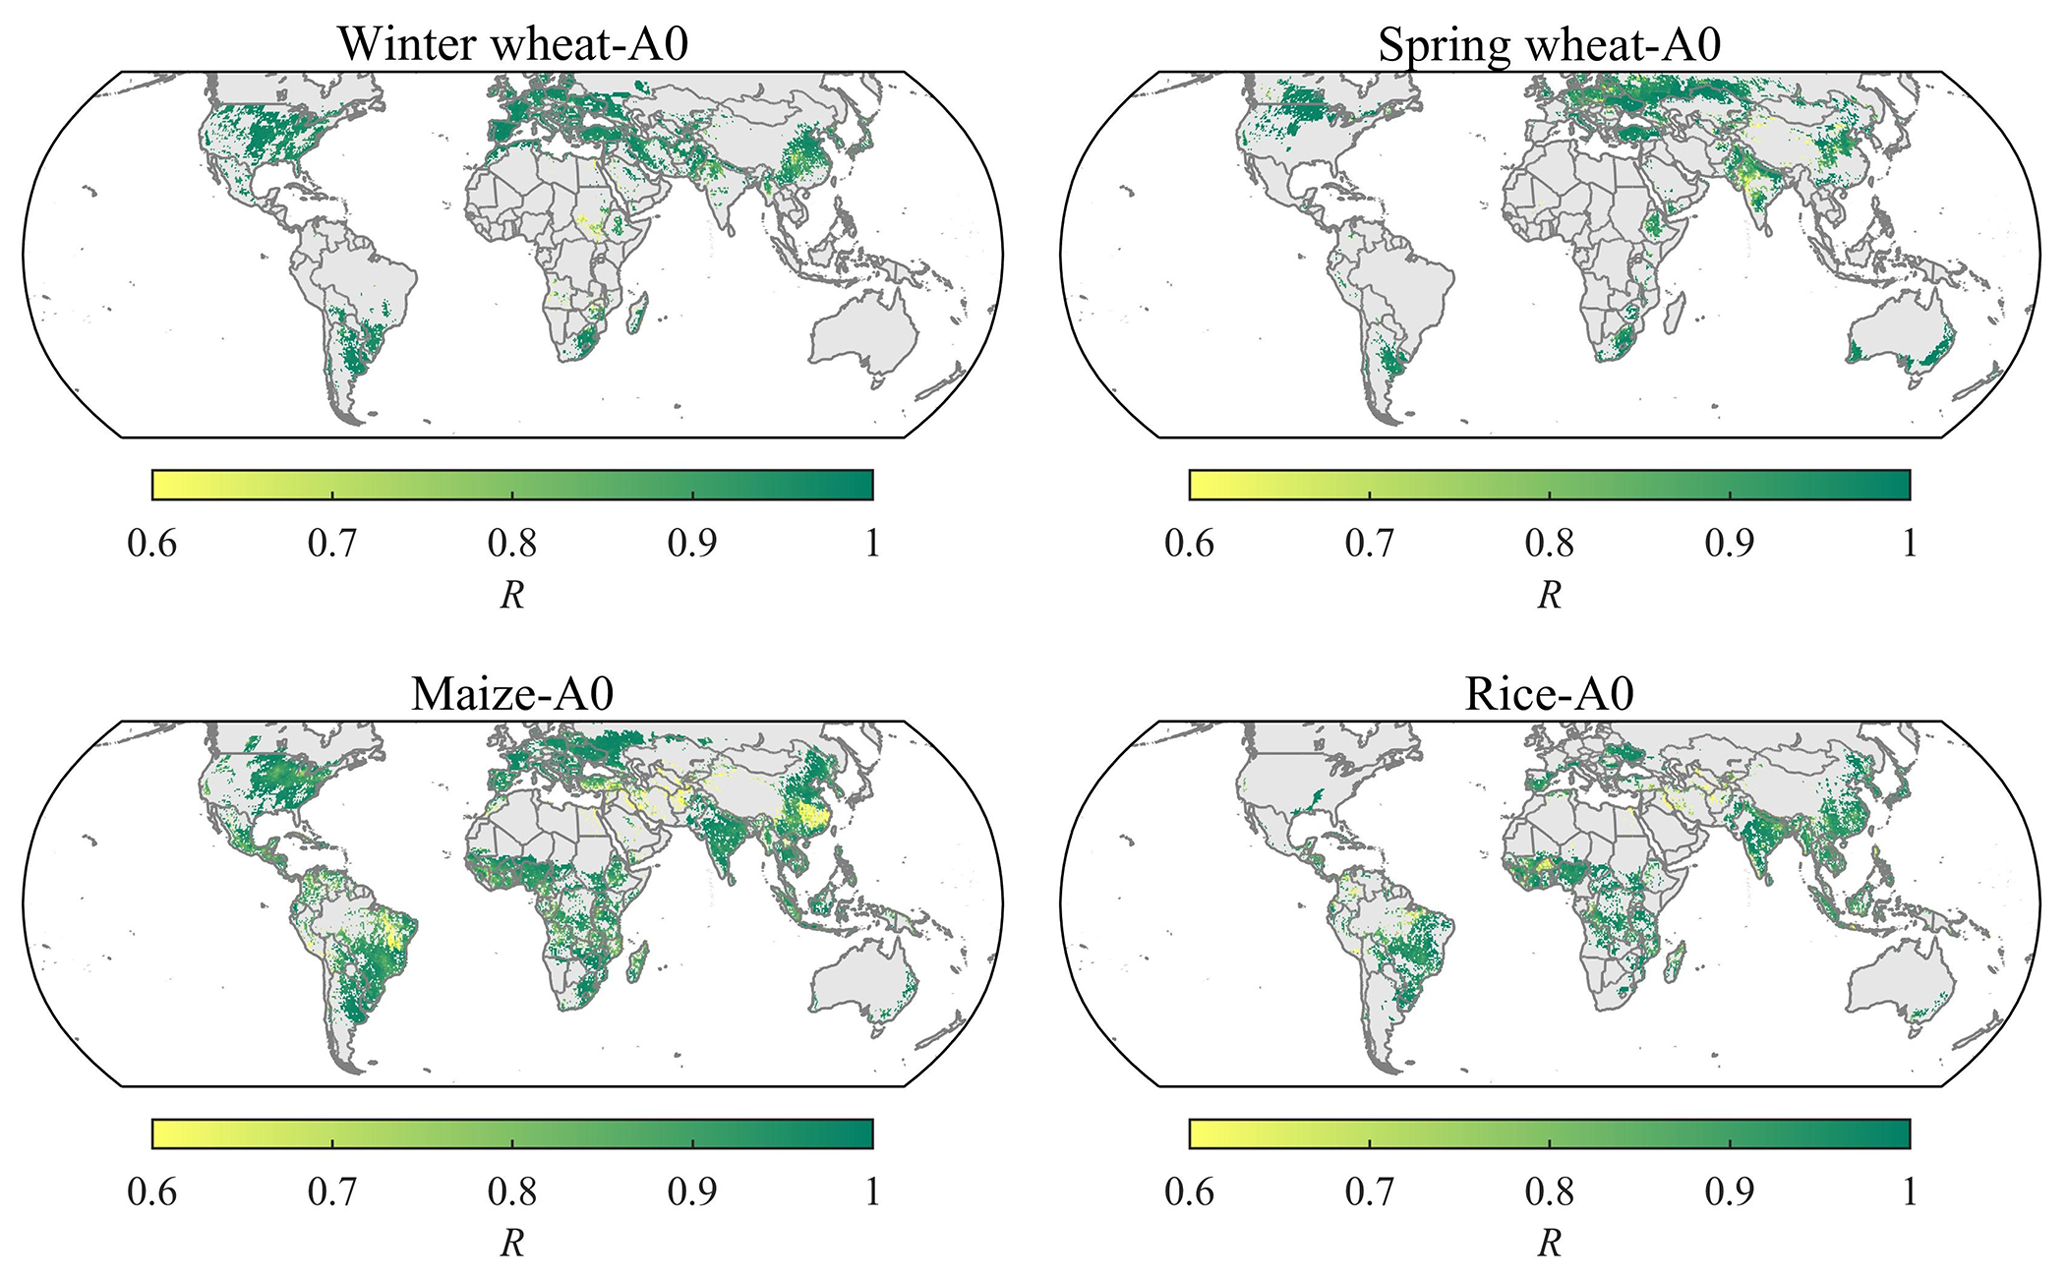
Figure 5Multi-model ensemble median R in the baseline over current cropland. R: correlation coefficient between simulated and emulated yield time series of each GGCM from 1981 to 2010.
3.2.3 Performance of multiple-emulator ensemble at the grid scale
The multi-emulator ensemble median was able to reproduce the year-to-year variation of gridded yield over current cropland in the baseline (C360T0W0N200) from 1981 to 2010. The temporal correlation coefficients R between GGCM-simulated and emulated yield time series over most current harvested areas were greater than 0.7 (multi-model ensemble median) (Fig. 5), and the uncertainty (standard deviation) of R across emulators was smaller than 0.3 (Fig. S1 in the Supplement). The mean absolute error (MAE) and mean relative error (MRE) over most current harvested areas were mostly smaller than 1 t ha−1 and 30 %, respectively (Fig. S2 in the Supplement). The spatial pattern of MRE for four crops all showed a hotspot of large MRE in the Middle East, and for maize the hotspot of large MRE was also found in southern China (Fig. S2).
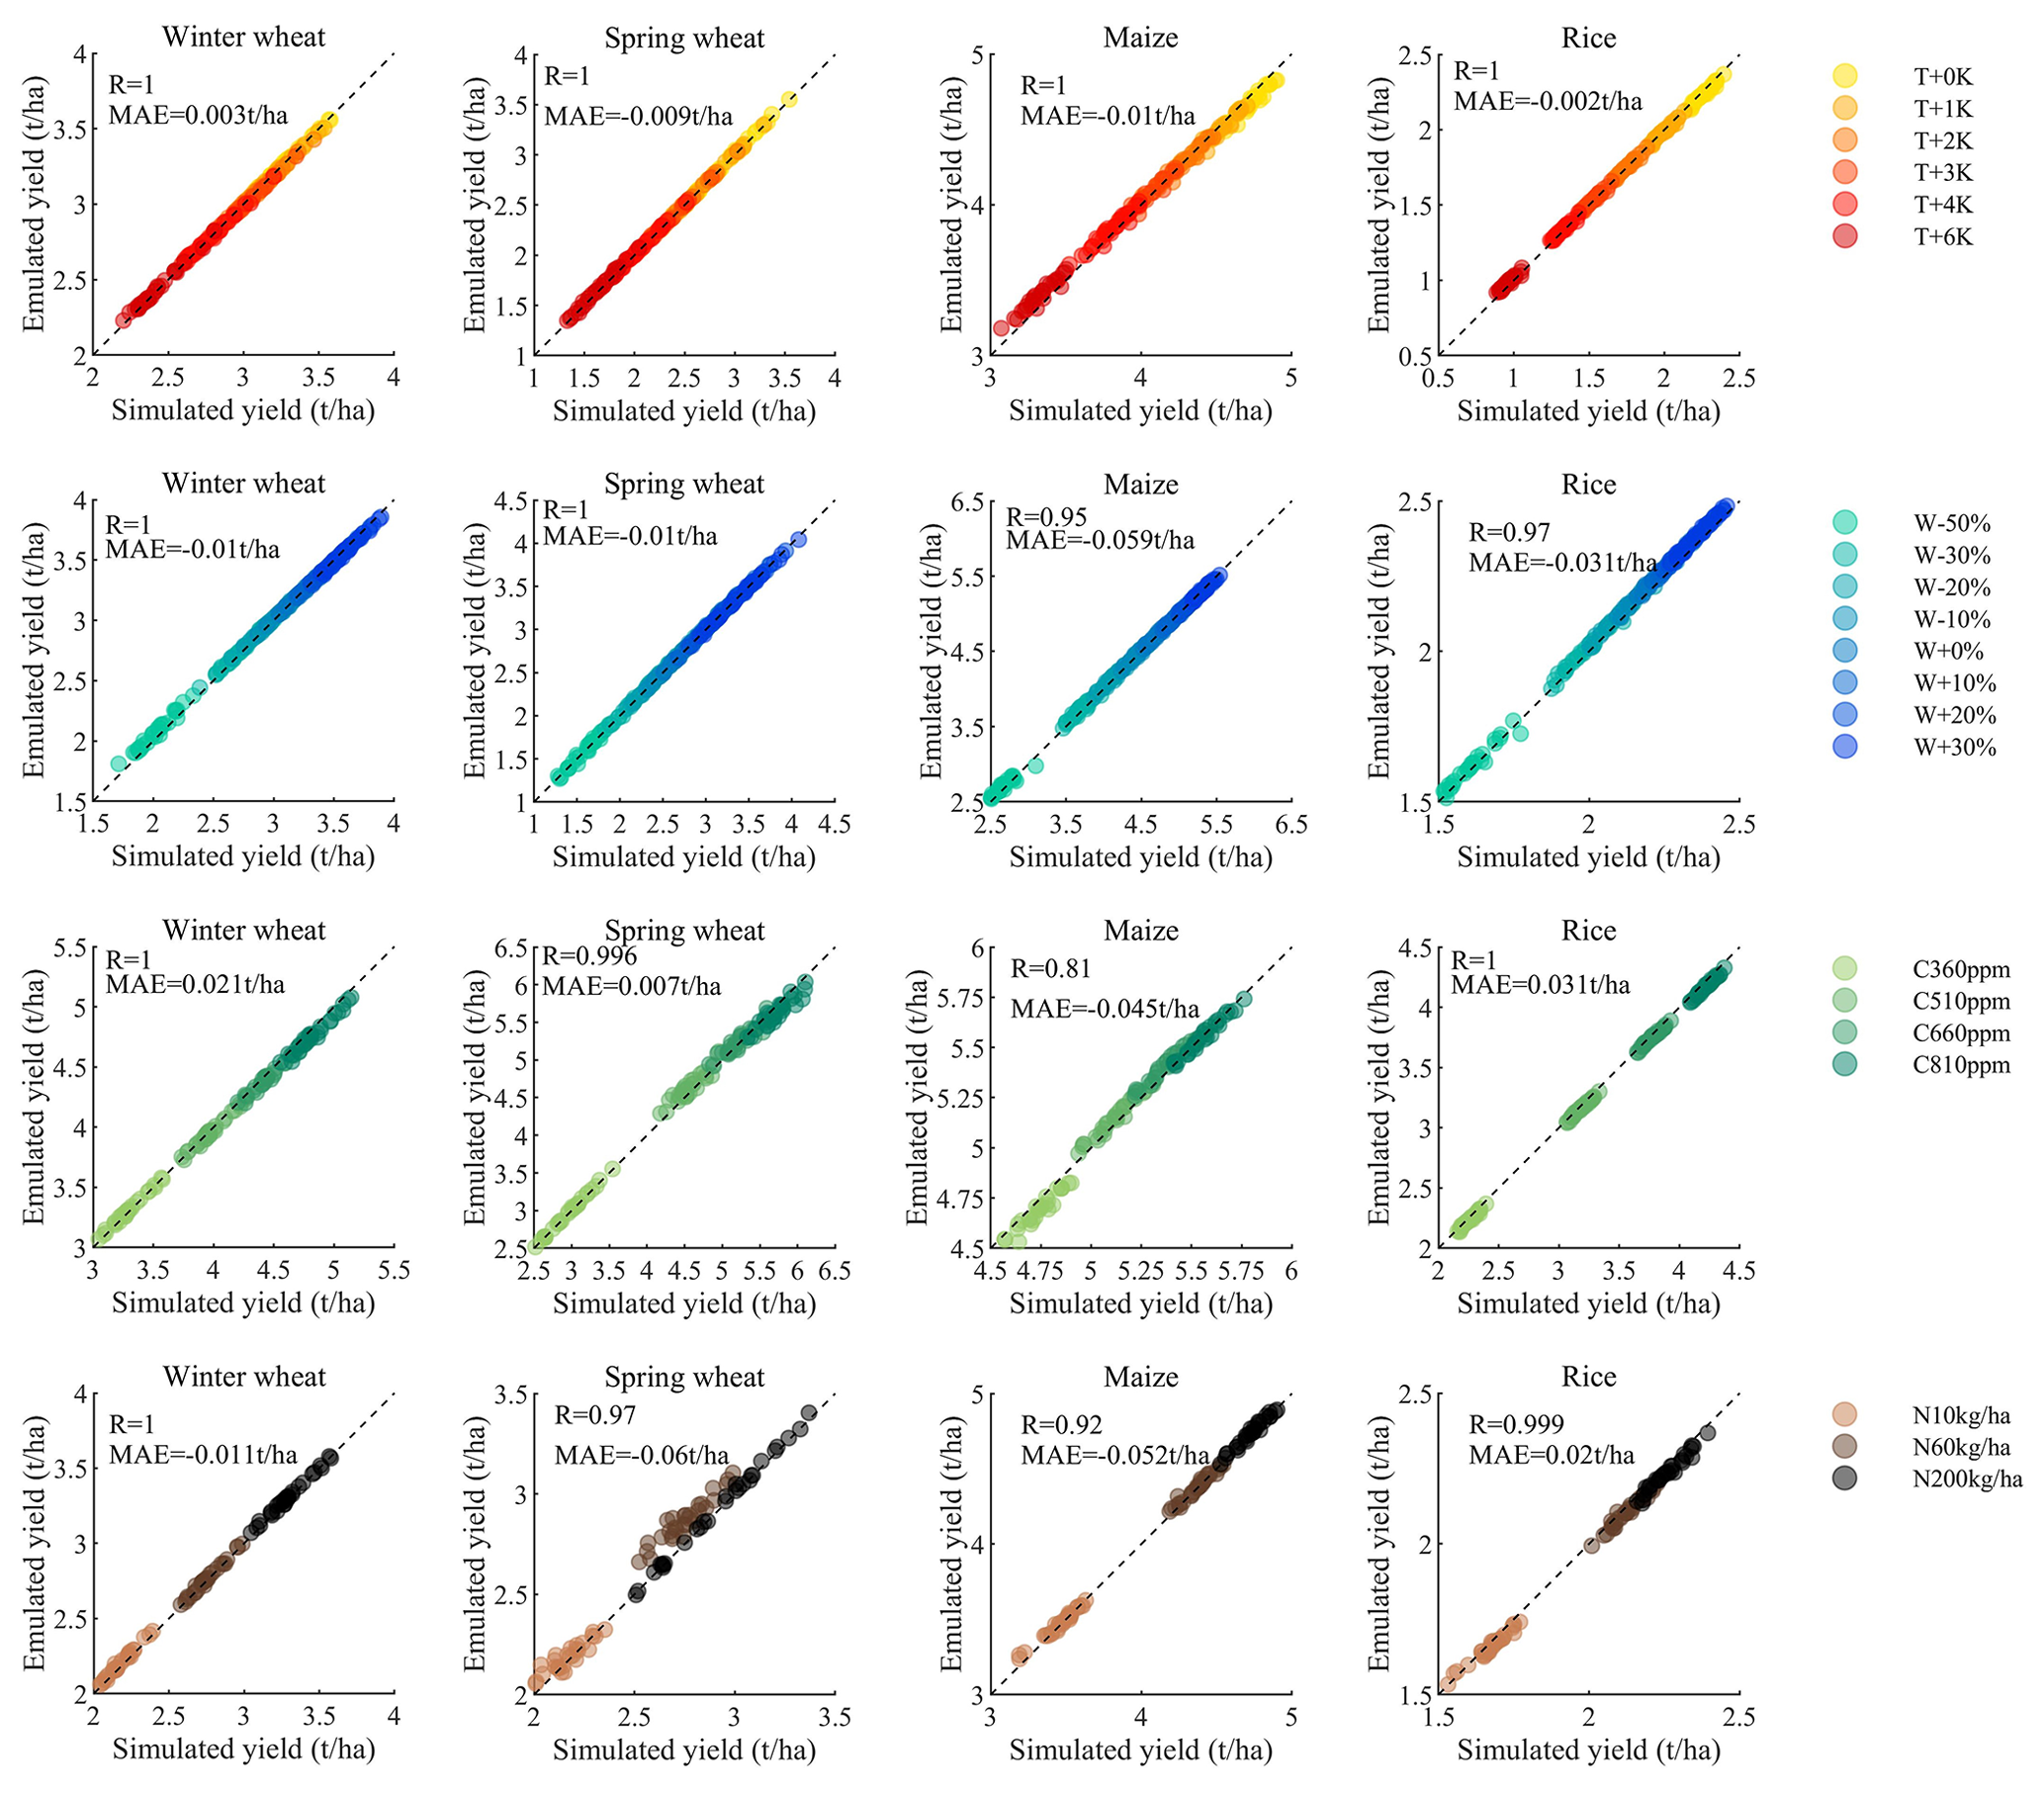
Figure 6Performance of one exemplary emulator (LPJmL-A0) in reproducing the year-to-year variation of global mean yield from 1981 to 2010 under varied individual CTWN perturbations. Each point with the same color is yield in 1 year. The performances of other emulators are similar to LPJmL-A0, which can be seen Tables S1 and S2.
3.3 Performance of emulators to capture the year-to-year variation of GGCM yield in the CTWN cube
3.3.1 Performance of individual emulators at the global scale
The agreement of year-to-year variation of global average yield between simulation and emulation was consistent with changes in CTWN cubes over present cropland (Fig. 6). Under varied CTWN perturbations, the emulator could reproduce the year-to-year variation of global mean yield from 1981 to 2010 well. Even when the temperature perturbation reached +6 K, the emulator was still able to capture the year-to-year variation of global mean yield. Similarly, when the precipitation was less than the baseline by 50 %, the year-to-year variation of emulated global mean yield was well matched with those of GGCM simulations. Additionally, fertilization with elevated CO2 concentrations and nitrogen application have been well reproduced by the emulator. Similar capacity to reproduce the annual global mean yield was also found in other emulators (Tables S1 and S2 in the Supplement). Even under concurrent warm and drought conditions, i.e., T + 6 K and W − 50 %, the year-to-year variation of global mean yield could be well reproduced by the emulator (Fig. S3 in the Supplement).
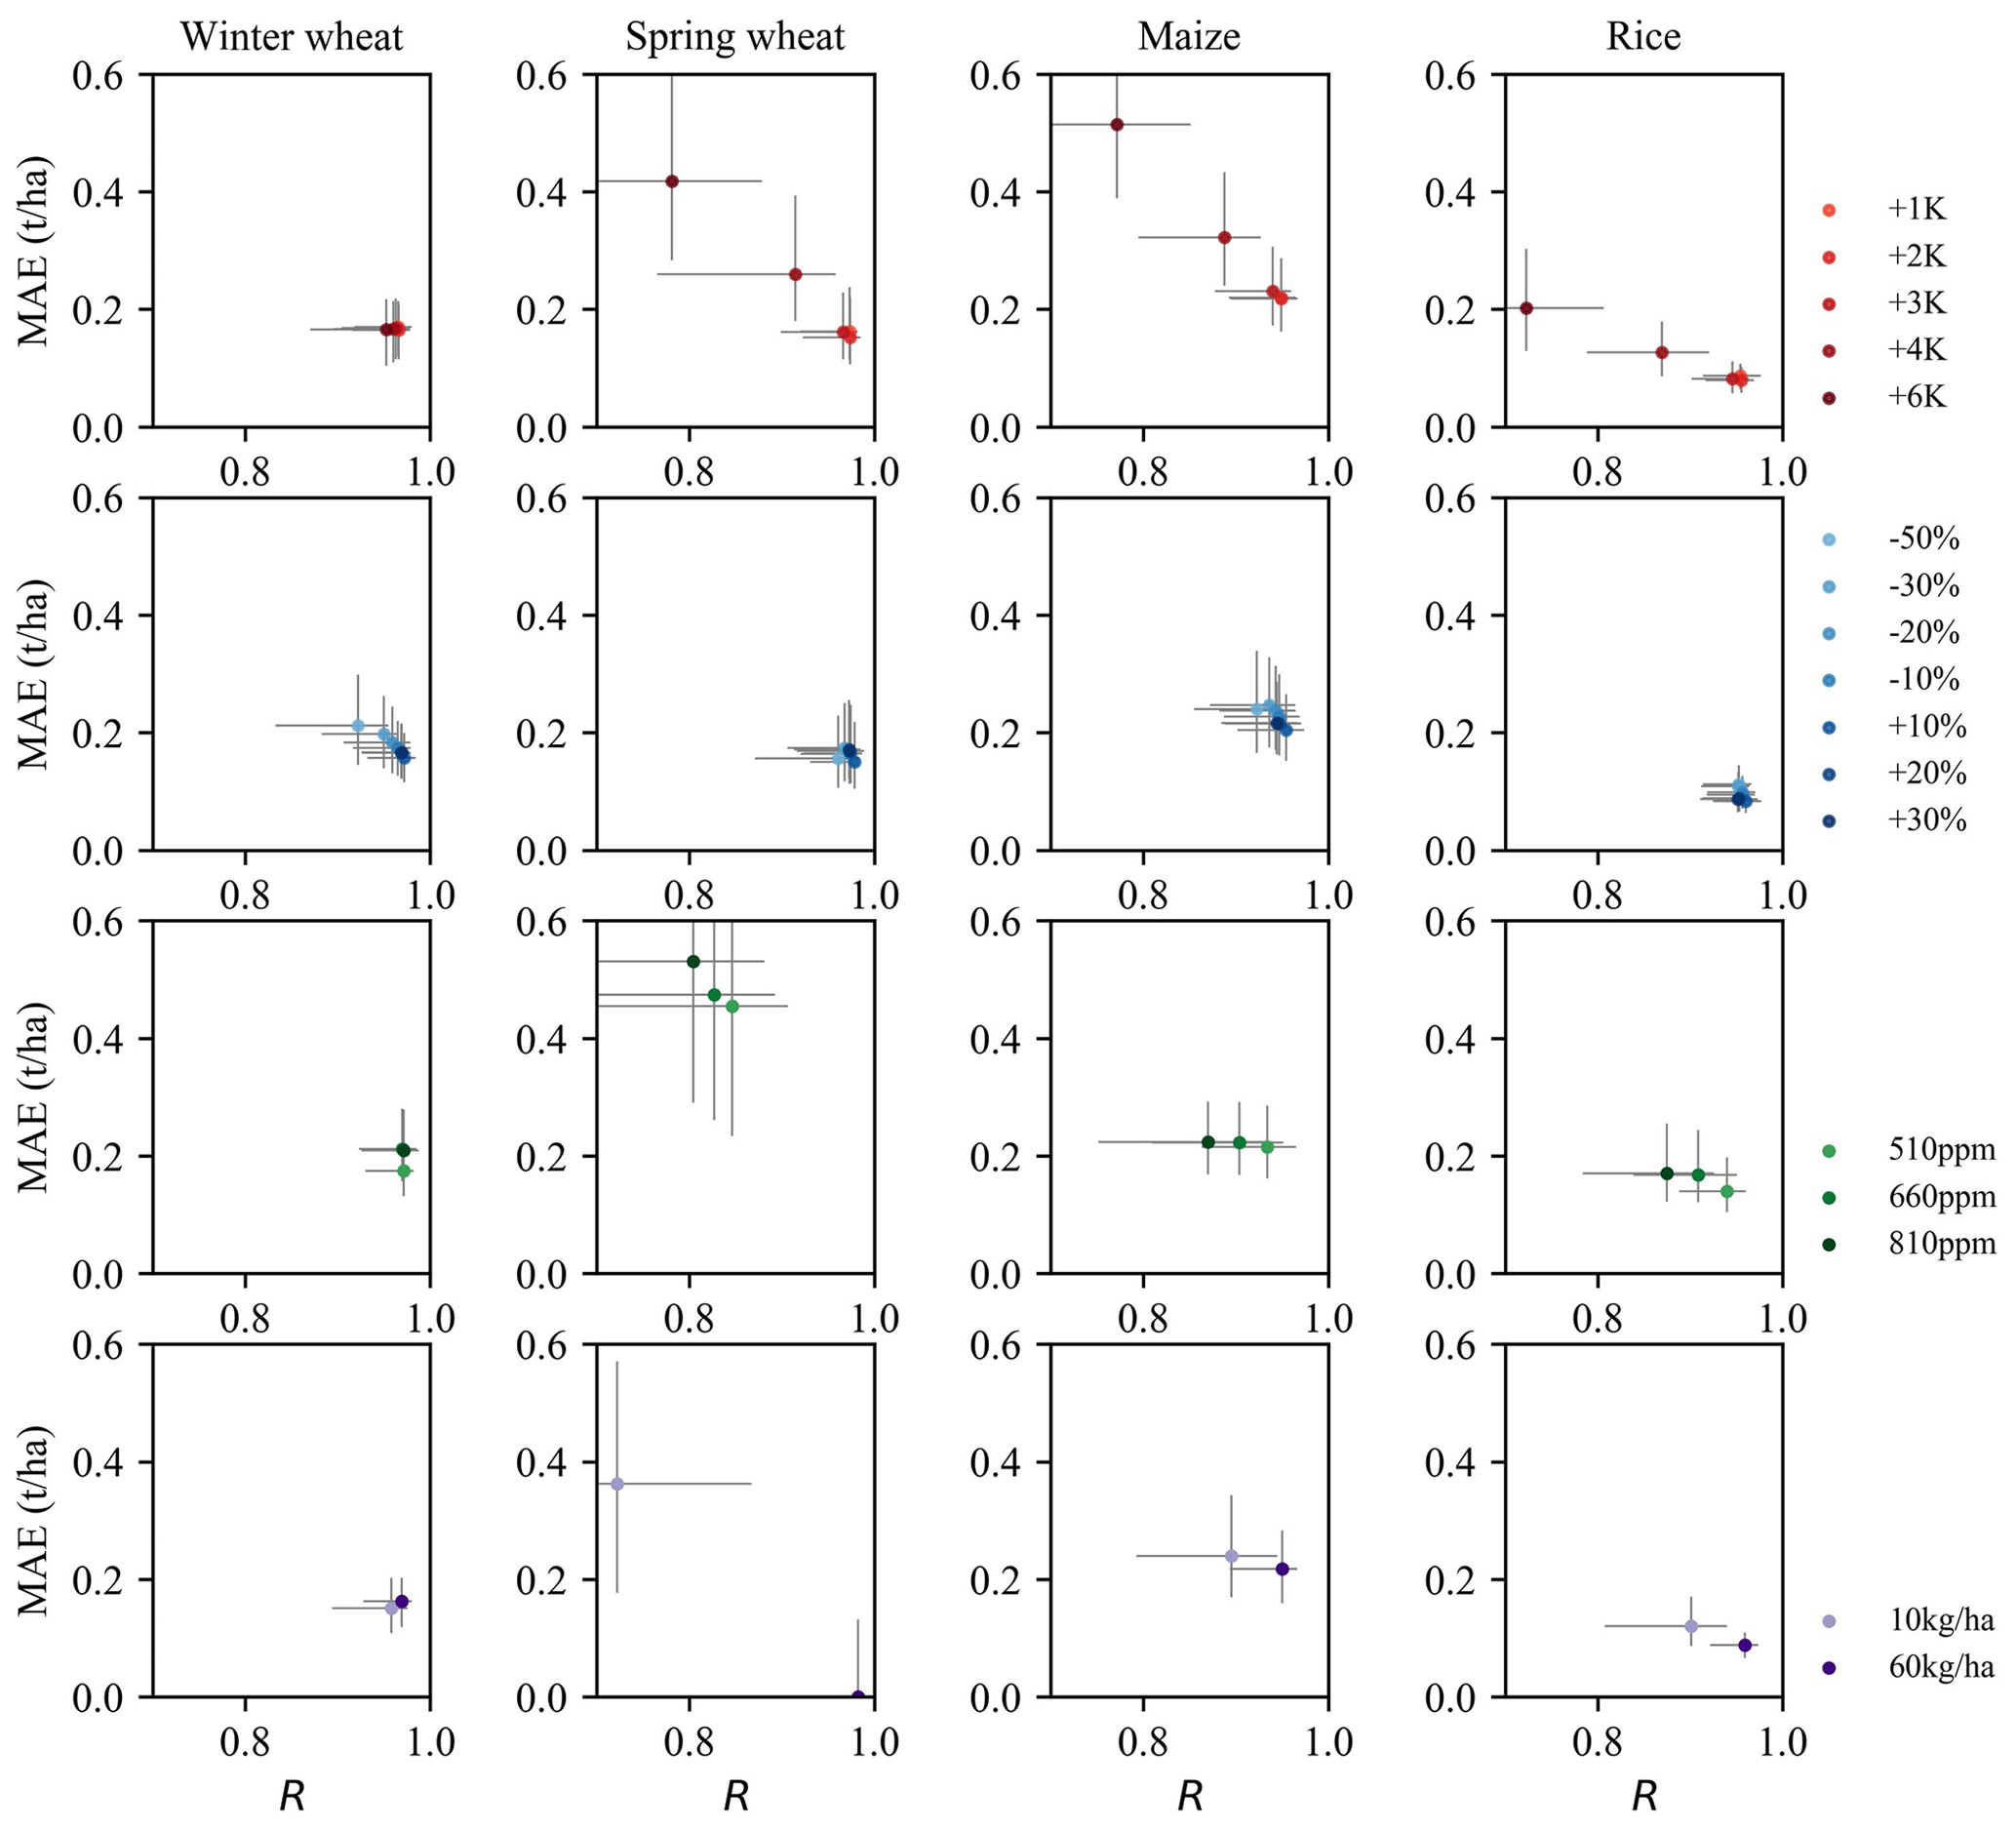
Figure 7R–MAE scatter of the exemplary emulator (LPJmL-A0) under varied single CTWN perturbations. Each dot denotes the median of R or MAE over current cropland, and the error bar denotes the interquartile range. R: correlation coefficient, MAE: mean absolute error. More details of other emulators can be seen in Tables S1 and S2.
3.3.2 Performance of individual emulators at the grid scale under single perturbation
To illustrate the performance of individual emulators in reproducing annual yield variation, we selected the LPJmL-A0 emulator as an example. The R–MAE scatter plots of LPJmL-A0 illustrate the response of gridded accuracy to varied perturbations of CTWN (Fig. 7). The changes in the accuracy of emulators under single CTWN perturbations were small, with the largest differences in spring wheat for modifications in the CO2 (C) and nitrogen (N) dimensions. The overall accuracy could be kept at a high level, with greater R and smaller MAE. Under temperature perturbations, the median R values of emulators for four crops were greater than 0.7, and the range of R values was smaller than 0.2. The median MAEs of emulators for four crops were less than 0.55, and the variation of median MAEs was smaller than 0.2 from +1 to +6 K perturbations. For precipitation perturbations, the median R values of emulators for four crops were greater than 0.85; meanwhile, the difference of median R values across varied precipitation perturbations was smaller than 0.1. The median MAEs of emulators for four crops was smaller than 0.3, and the range of median MAEs variation was as small as 0.06. The median R values and MAEs of emulators for four crops under CO2 concentration perturbations and nitrogen perturbations were comparable to those under temperature and precipitation perturbations, except for spring wheat. Although the performance of the spring wheat emulator under CO2 and nitrogen perturbations was not as good as other crops, the median R values were still greater than 0.75, and the median MAEs were smaller than 0.6. Similar patterns of other emulator performances under single perturbations at the grid scale are shown in Tables S1 and S2.
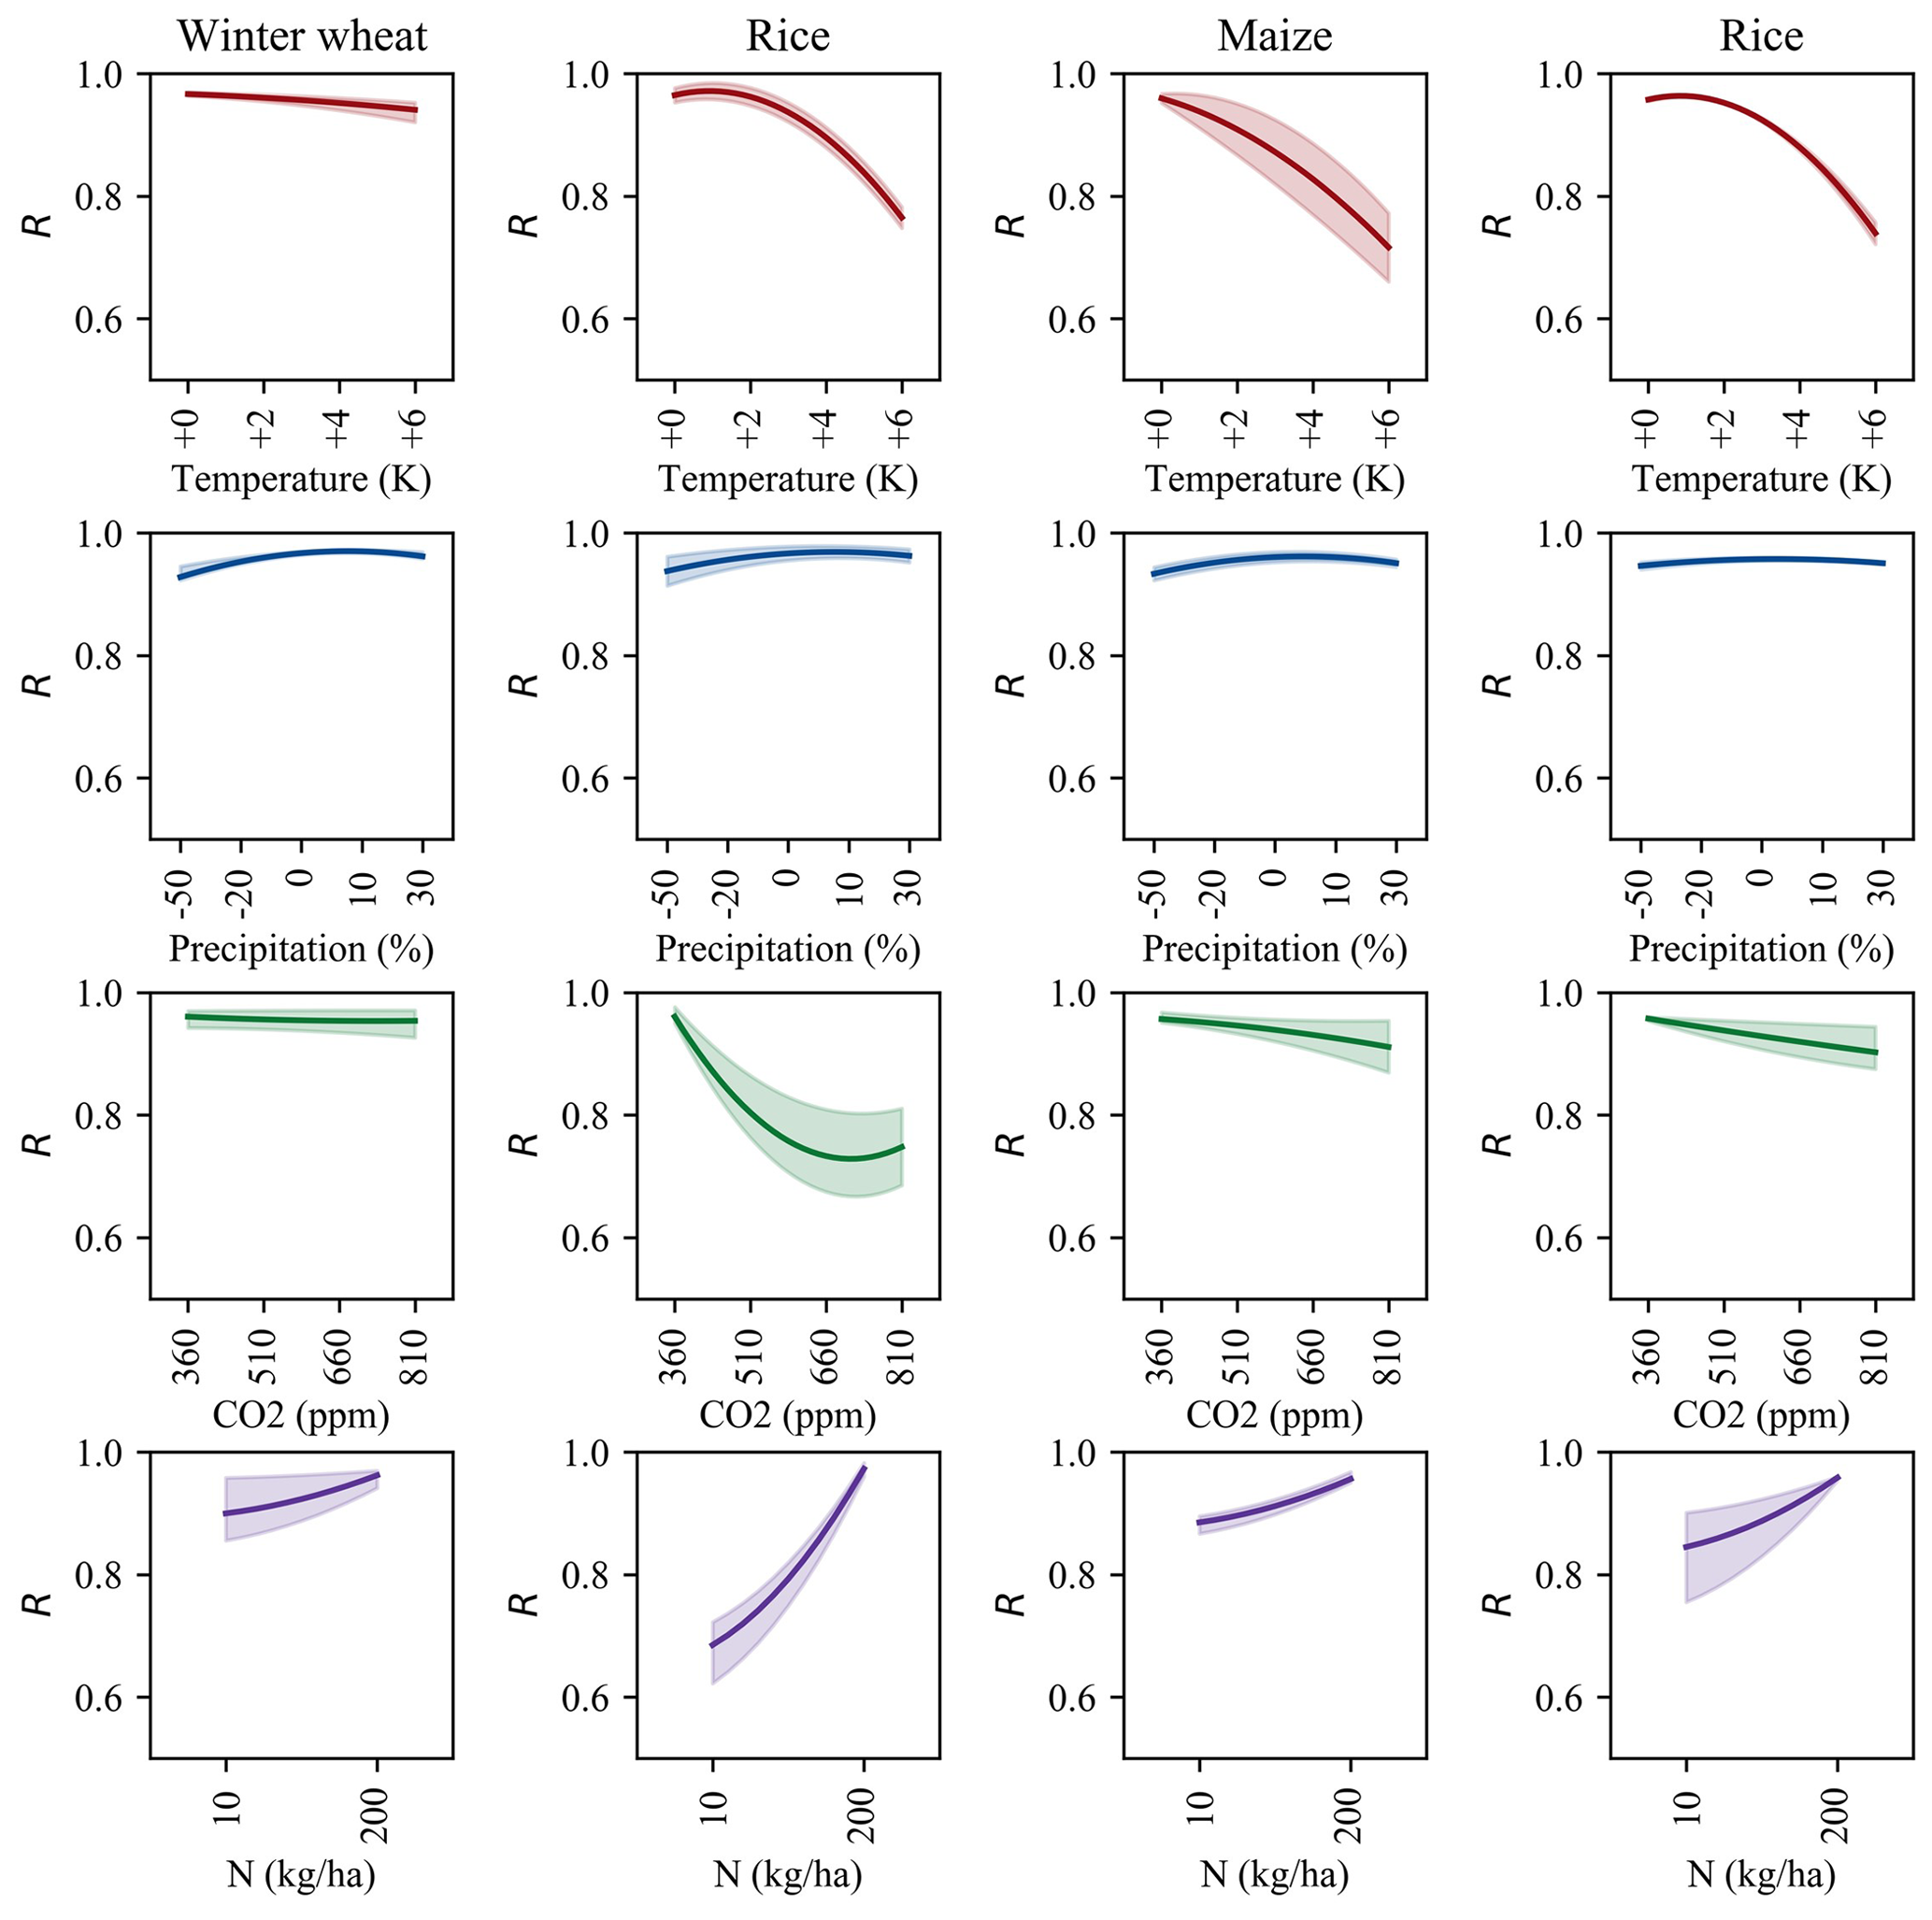
Figure 8Correlation coefficient (R) of the multiple-emulator ensemble under varied TW perturbations. The line denotes the median of R over current cropland, and the shaded area denotes the range of median R over current cropland across emulators.
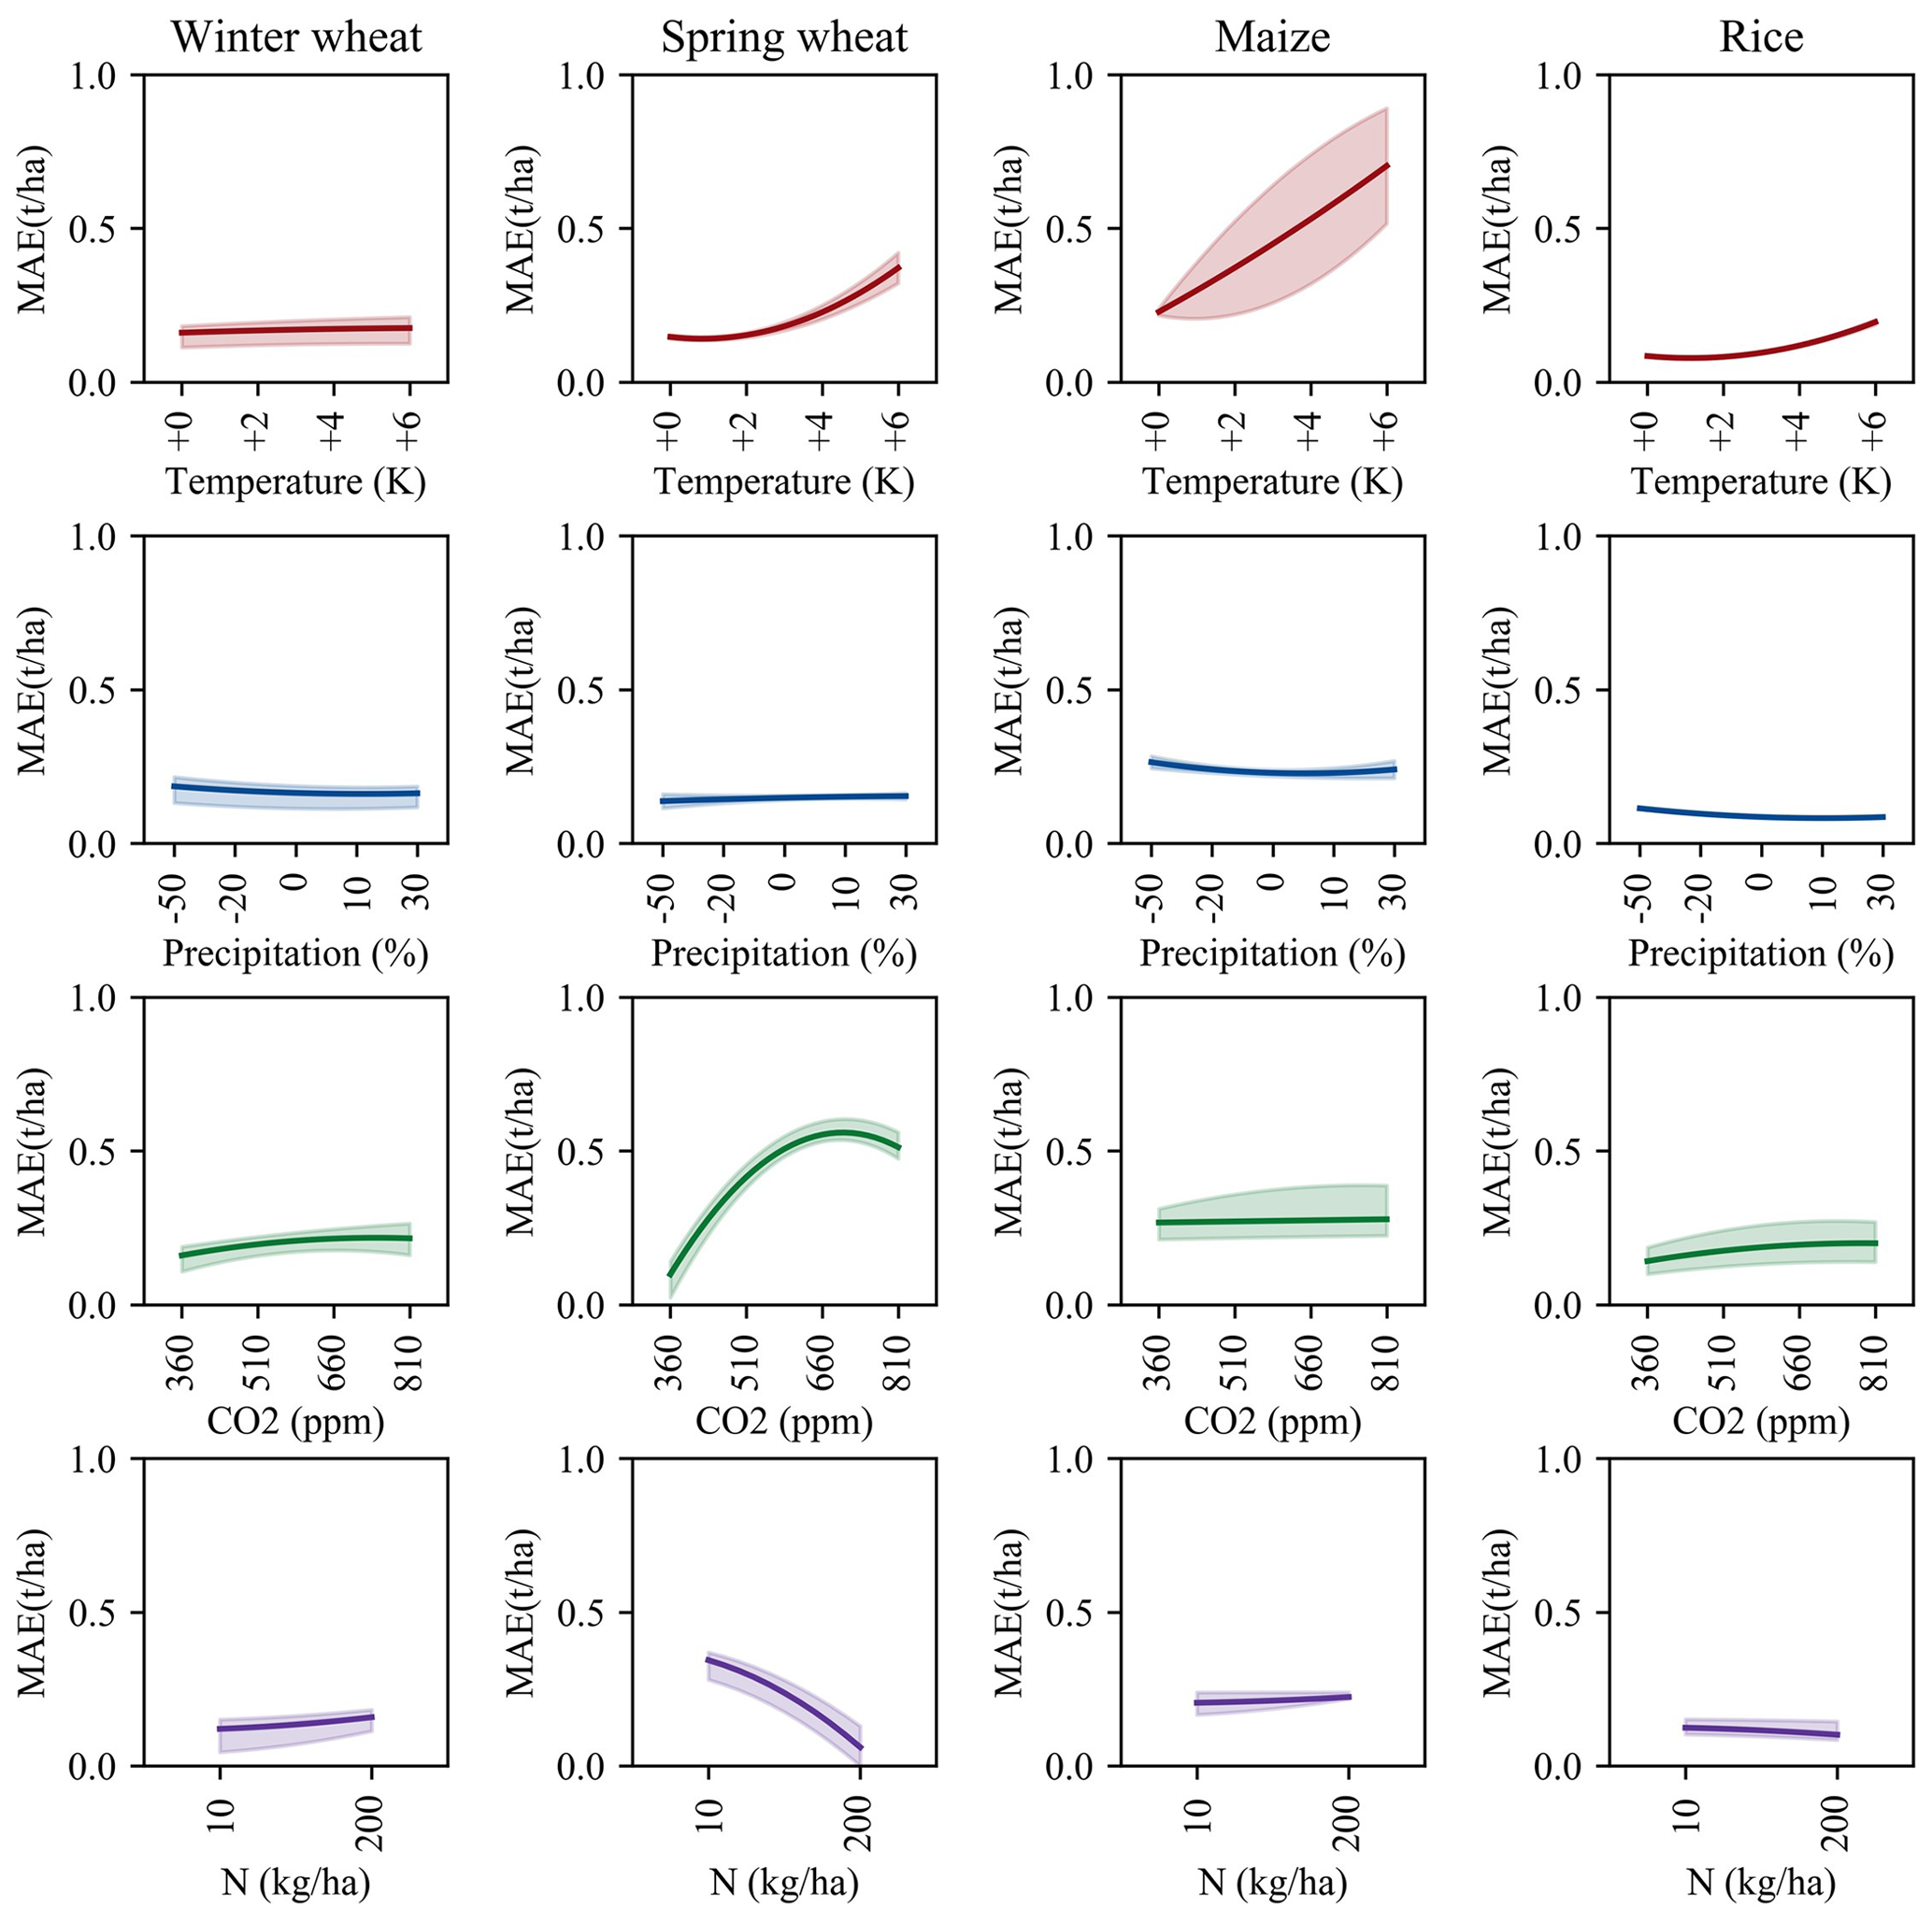
Figure 9Mean absolute error (MAE) of the multiple-emulator ensemble under varied CTWN perturbations. The line denotes the median of R over current cropland, and the shaded area denotes the range of median R over current cropland across emulators.
3.3.3 Performance of multiple-emulator ensemble at the grid scale under single perturbation
When looking at the ensemble of multiple emulators, the Rs and MAEs under CTWN cubes was not divergent obviously (Figs. 8 and 9).
Under temperature perturbations, the range of model ensemble median Rs across multiple emulators was smaller than 0.2, and the range of median MAEs was as small as 0.4 t ha−1. For precipitation perturbation, the difference in median Rs was less than 0.03, and the changes in median MAEs were less than 0.1 t ha−1. Under the perturbation of CO2 concentration, the emulators for winter wheat, maize, and rice showed greater median R values which ranged from 0.89 to 0.98. The variation of median MAEs was smaller than 0.09 t ha−1. The median R values of the emulator for spring wheat, however, tended to substantially decline under 810 ppm perturbation, and the median MAEs tended to increase simultaneously. Similarly, for nitrogen perturbation, the range of median R values was less than 0.27, and the range of median MAEs was smaller than 0.3 t ha−1, except for emulators of spring wheat and rice. The declined R and increased MAE were caused by the reduction of valid sample size from the GGCM output yield under CO2 and nitrogen perturbations (Figs. S4 and S5 in the Supplement).
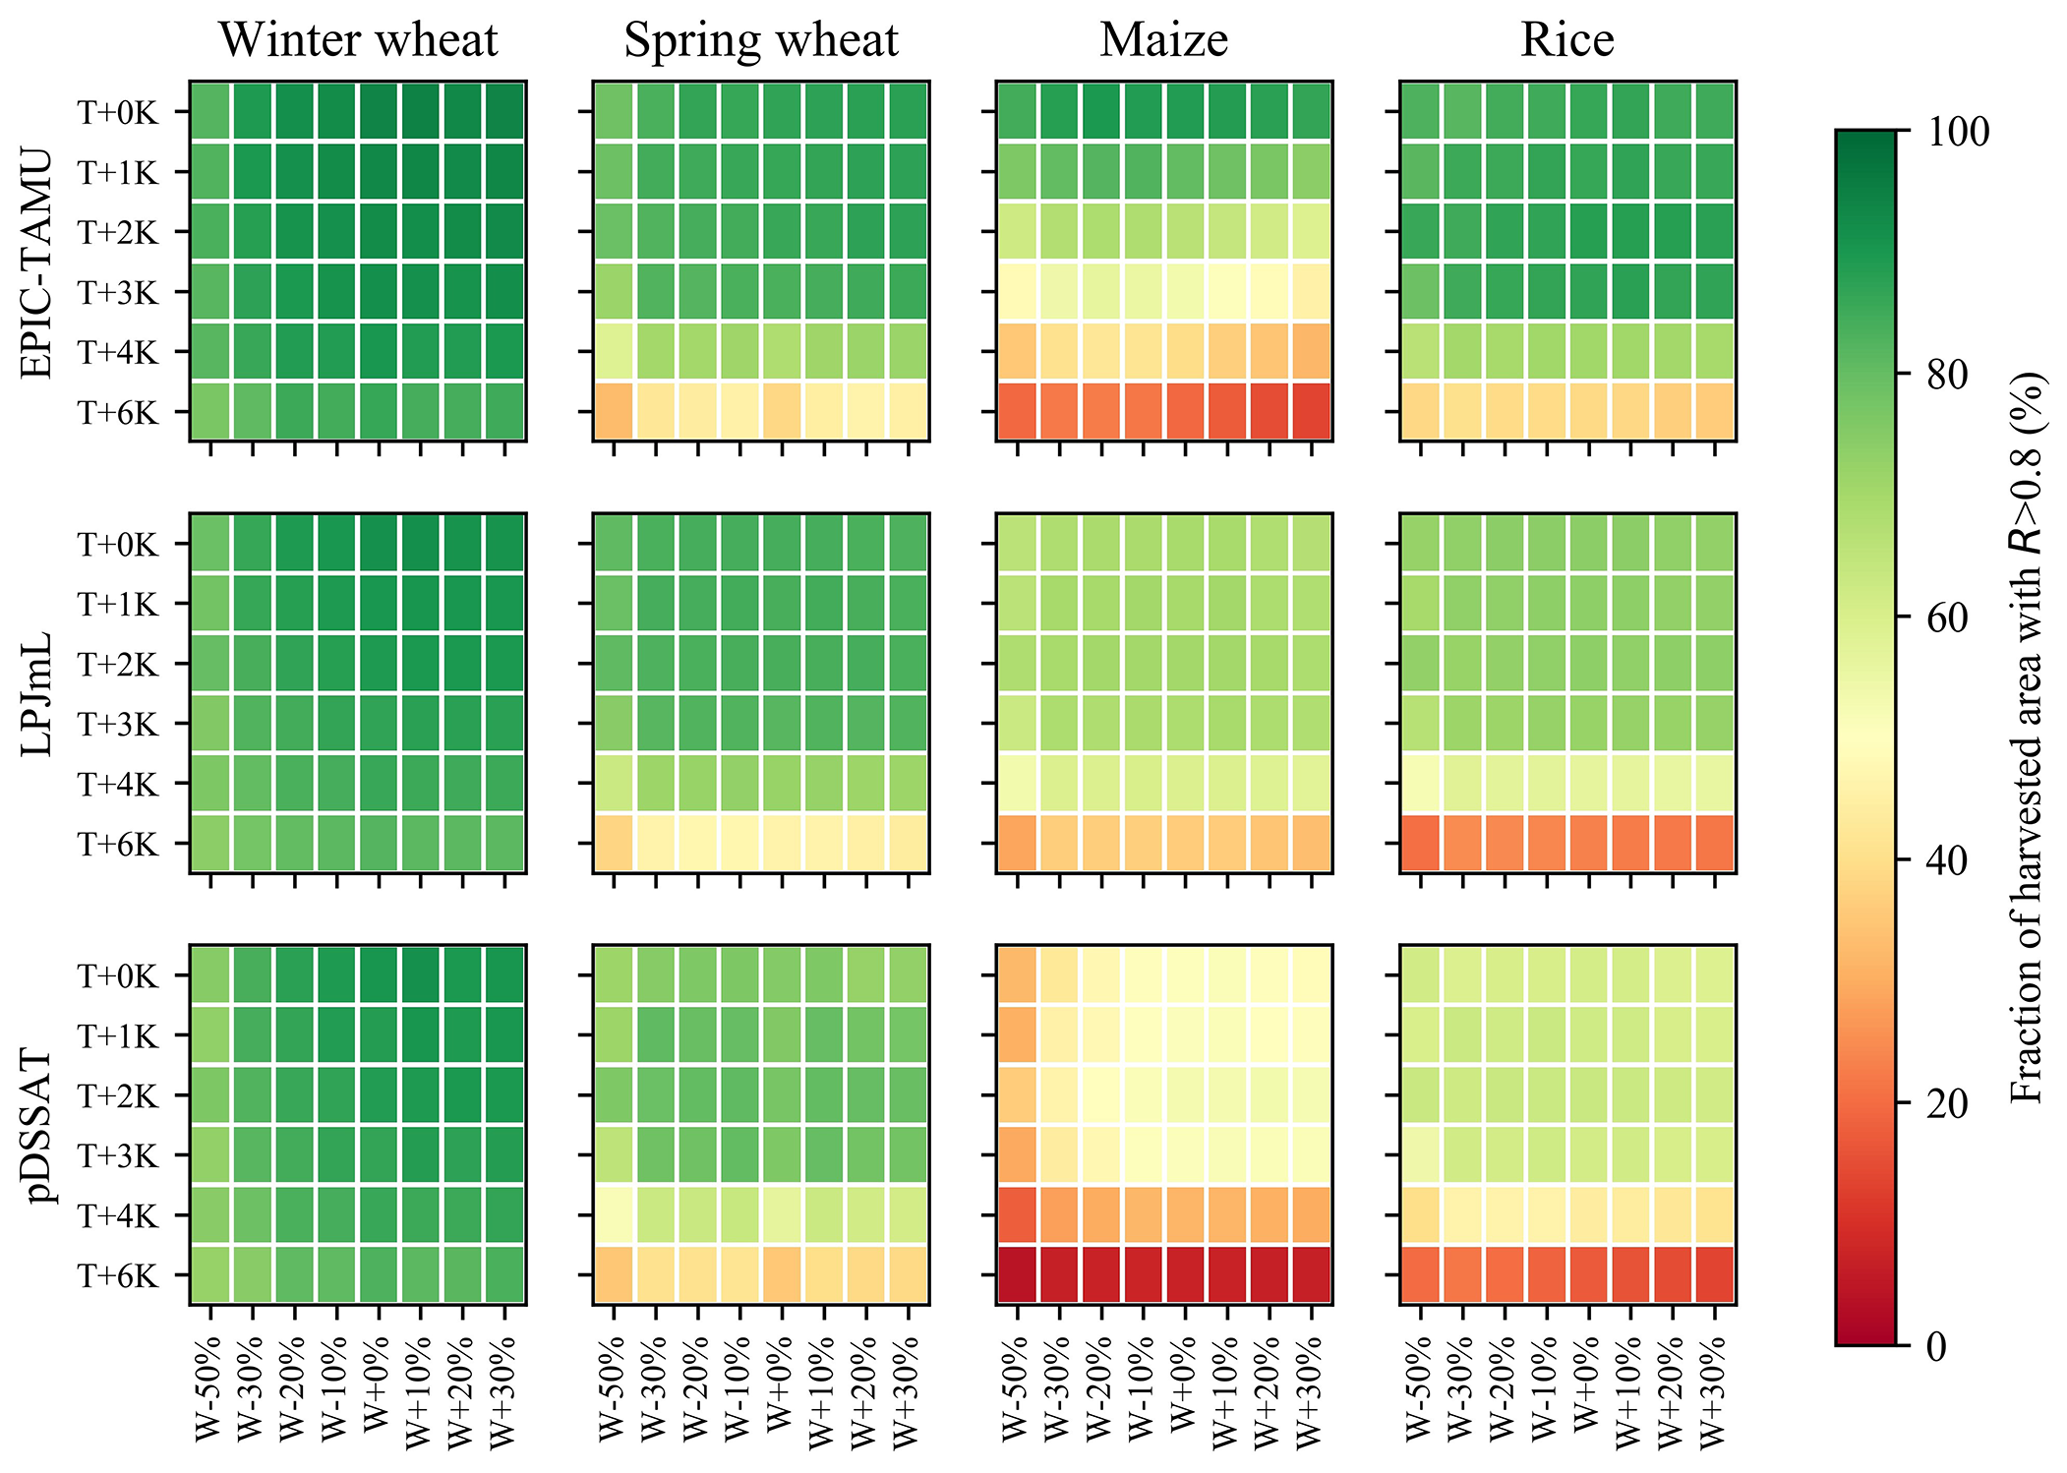
Figure 10Fraction of harvested areas with a high correlation coefficient (R > 0.8) under varied T + W perturbations. Example of EPIC-TAMU-A0, LPJmL-A0, and pDSSAT-A0 emulators because only these three GGCMs contain the full range of CTWN perturbations for all four crops.
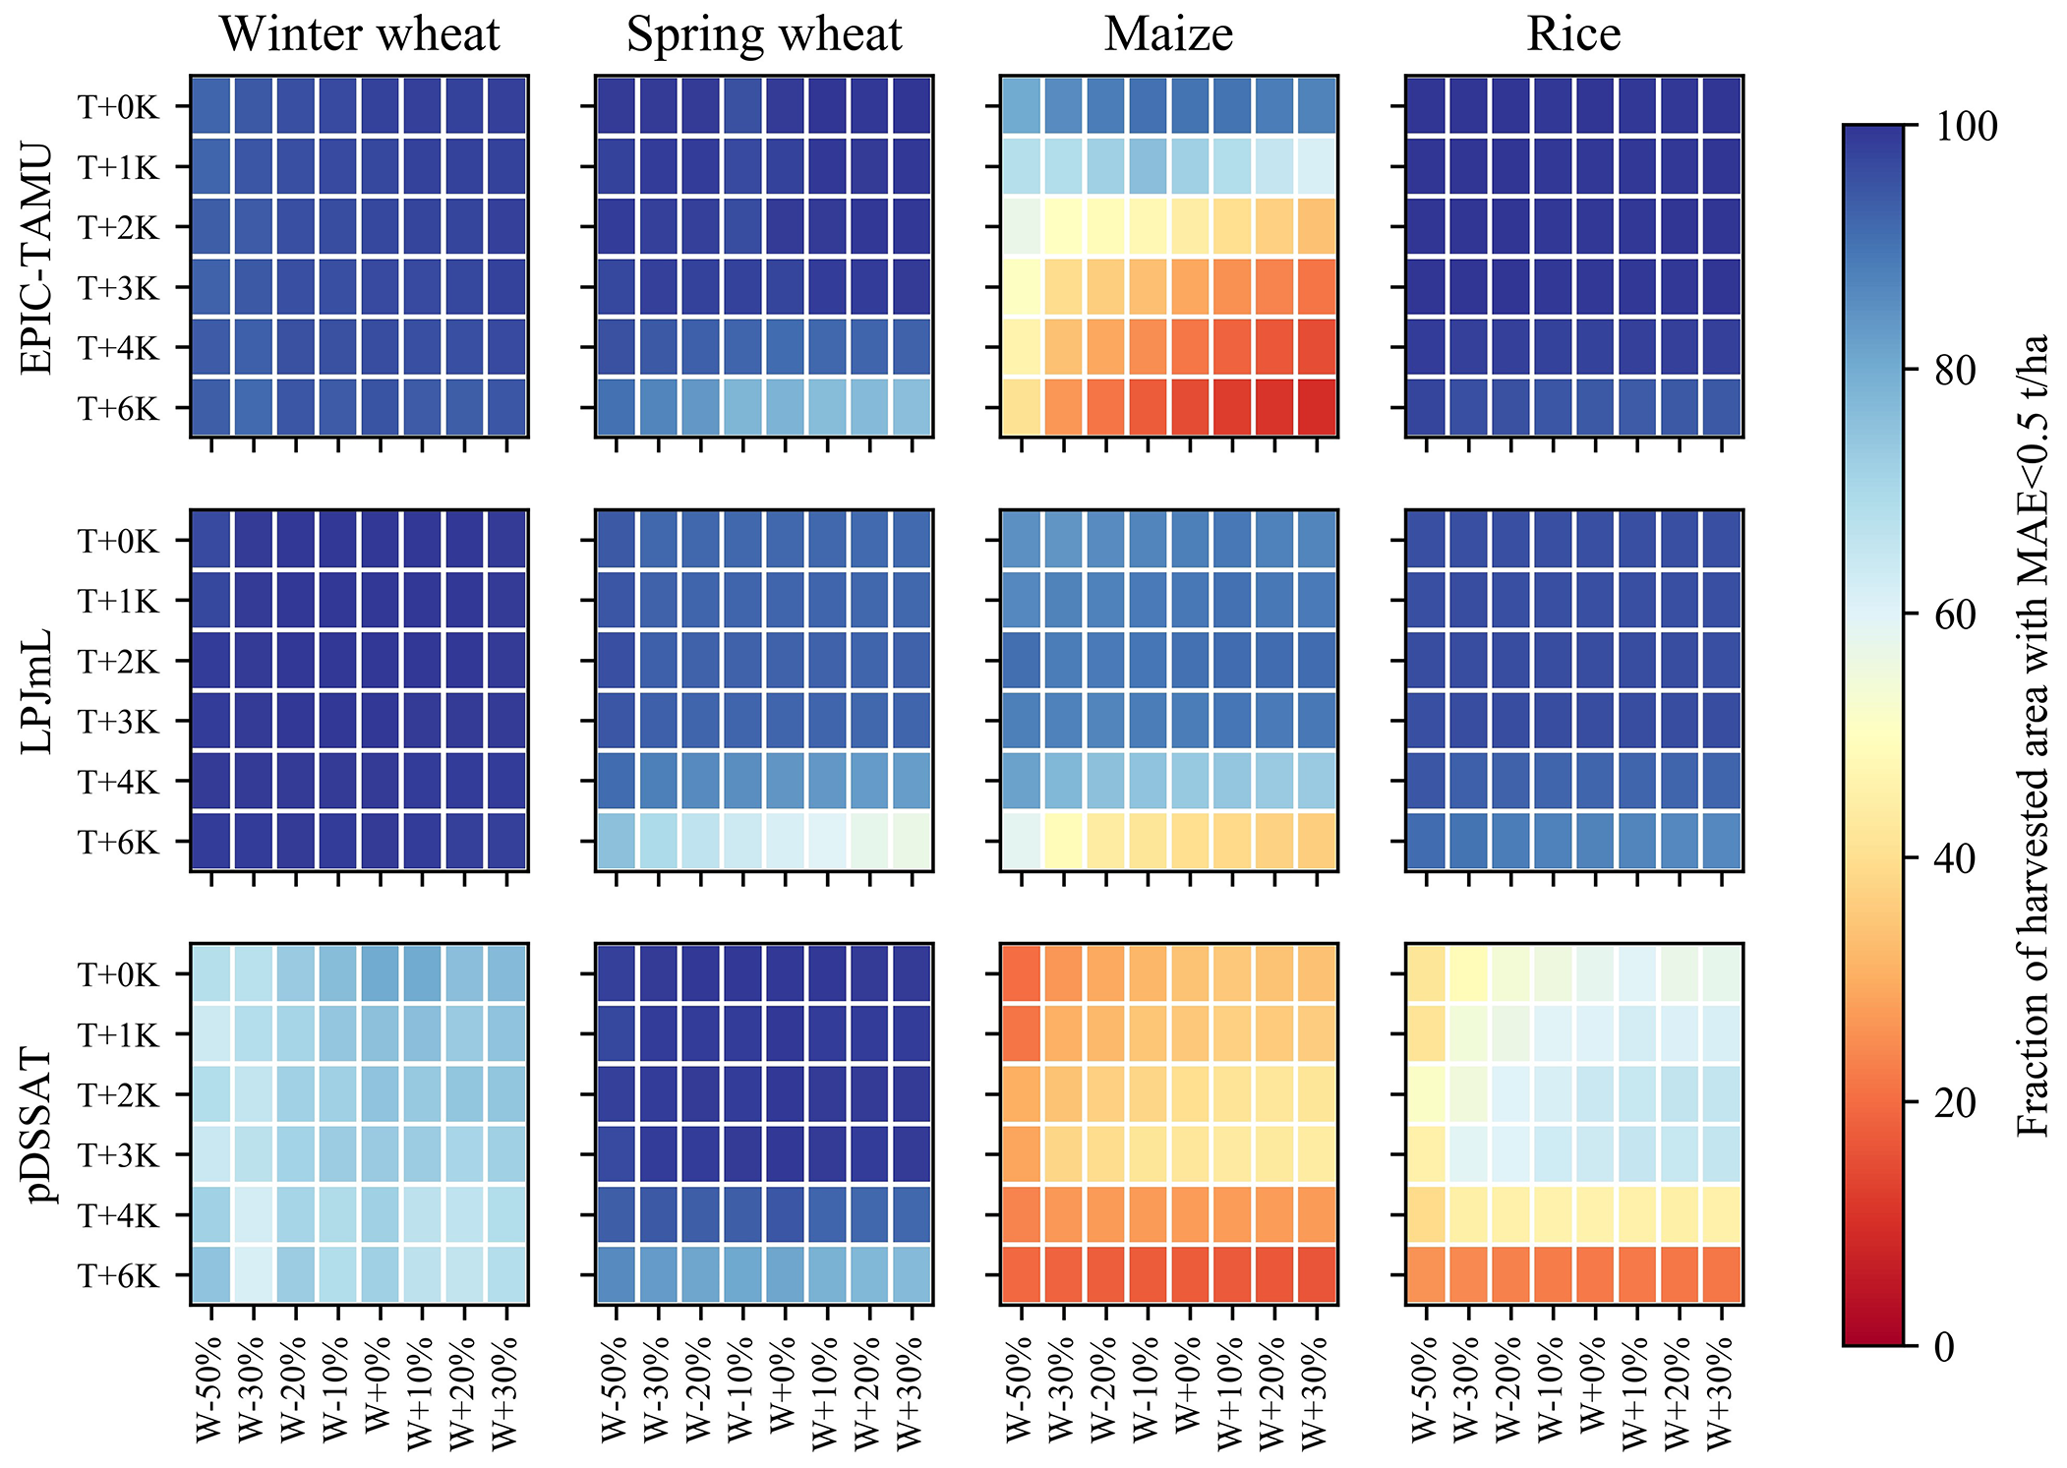
Figure 11Fraction of harvested areas with low mean absolute error (MAE < 0.5 t ha−1) under varied T + W perturbations. Example of EPIC-TAMU-A0, LPJmL-A0, and pDSSAT-A0 emulators because these three GGCMs contain the full range of CTWN perturbations for all four crops.
3.3.4 Performance of multiple emulators at grid the scale under dual perturbations
The performance of emulators was influenced by changes in simultaneous perturbations in two different CTWN dimensions (dual perturbations). The emulators performed well over most current cropland, but at extreme increases in T and reductions in W (Fig. 10), the emulators could represent the GGCMI-simulated year-to-year variation only on substantially smaller shares of the current cropland. The fraction of current areas with R greater than 0.8 was the highest in the baseline but decreases under warmer and drier conditions. The fraction was reduced to less than 40 % under the compound T +6 K and W −50 % perturbation, which illustrates the poor capacity of the emulator under compound hot–dry conditions. However, the fraction of harvested areas with MAE smaller than 0.5 t ha−1 did not vary much across T + W perturbations (Fig. 11). The performances of emulators under dual perturbations for wheat were better than those for maize and rice. The fraction of maize and rice harvested area with R greater than 0.8 was relatively smaller than that of wheat. The maize harvested area with MAE smaller than 0.5 t ha−1 was smaller than other crops. Among the three GGCMs with the full range of CTWN perturbations, the fraction of harvested area with high accuracy for the LPJmL emulator and the pDSSAT emulator was more than EPIC-TAMU emulator.
4.1 Emulator trained to capture year-to-year variation in crop yield
Our emulator was designed to reproduce the year-to-year variation of crop yield. Therefore, the annual yield was the target variable in emulator fitting. To capture the year-to-year crop yield variation well, the climatic predictors were divided into growing season average, daily variation, and climatic extremes to capture the possible drivers of yield variation. Predictor engineering referred to the existing knowledge compiled in crop models that year-to-year variation of crop yield is associated with growing season temperature and precipitation (Ray et al., 2015), extreme heat (Iizumi and Ramankutty, 2016), and drought (Heinicke et al., 2022). Temperature and precipitation have been confirmed to be the dominant drivers of crop yield variability (Schauberger et al., 2016). Moreover, the interaction between soil type and climate was considered in our emulator design. Although CO2 concentration and soil type were not regarded as important contributors to yield variability, their interaction with climate could also influence the yield variability (Kadam et al., 2014). The role of soil type has been revealed by previous emulators fitted by multivariate regression; the average effect of temperature and precipitation differed greatly depending on soil type (Blanc, 2017). Compared with the emulator designed to reproduce the climatological mean yield, our emulator is more suitable to project changes in yield variability (Liu et al., 2021b).
We developed the emulators with one statistical relationship for each crop between GGCM-simulated yield and predictors for all grids over global land. Each grid cell represents a sample in the soil–climate–fertilizer continuum, and the training data have no lateral relationships. However, the response of simulated crop yield to climate change was spatially heterogeneous, which mainly depends on the cultivars. Therefore, one statistical relationship between yield and climatic predictors was not fully appropriate for each grid. In response, we used the length of growing season, a representative predictor of cultivar characteristics, to adjust the global statistical relationship to each grid. Therefore, predictors contained both temporal varied and constant variables. The temporally varied predictors were climatic variables which mainly played a role in reproducing the annual yield variation, and the temporally constant predictors were non-climatic variables, like growing season length, that delineated the spatial distinction of crop yield response to climate. Compared with region-specific emulator development, combining the temporally varied and constant predictors was more concise and could profit from a broader range of data in the training set.
4.2 Potential application of the emulators performing well in related fields
The good performance over most grid cells indicated the potential capacity of emulators in spatiotemporal downscaling, projecting annual yield in the future, and multi-model ensemble simulation.
The emulator could be used to conduct spatiotemporal yield downscaling because of the good performance of individual emulators in reproducing the annual crop yield variation in the baseline. As the emulator in this study was developed with a regression-based machine learning technique by using all the grid year data points, the emulation is not limited to the spatial resolution of the training data. The emulator can be applied to any point with information on the predictors and can produce yield projections as finely resolved as the forcing input. From the aspect of time series of yield, the raw GGCM data include empty values (NaN – not a number) in some year and grid cell data points, which may be caused by the lack of regional data for calibration. The vacancy of yield time series in some grids could be imputed by the emulator (Folberth et al., 2019), similar to studies which generated spatiotemporally continuous gridded crop yield data (Chen et al., 2022; Iizumi et al., 2014).
The emulator was able to project the annual yield in the future climate scenarios, which depends on the individual emulator performing well in reproducing annual yield under CTWN cubes. In contrast to many previous emulators developed with historical crop model simulations (Xu et al., 2021), our emulator could reproduce the CO2 fertilization effect, which is an important forcing for the future. The recently developed emulator based on GGCMI phase 2 simulation under CTWN cubes could only project the climatological mean yield because the target variable in the emulation was the climatological mean yield (Franke et al., 2020a). In contrast, our emulator can project the annual yield variation and is not constrained by the maximum warming considered in the GGCMI phase 2 dataset (T +6 K), but by the maximum temperature within the training dataset (warmest grid cell +6 K), so that the applicability is broader (Müller et al., 2021).
It is more efficient to conduct multi-model ensemble simulations with emulators than GGCMs, as the emulators show good skill in reproducing GGCM results, and the emulators drastically reduce the computational time, memory requirement, and expertise to operate process-based crop models. First, the input of multiple emulators was consistent and compatible, but the inputs of raw GGCMs were divergent and incompatible because the structure of input data and file format of each GGCM were designed independently. Second, the timescale of emulator input was monthly or growing seasonal, which was less complex than daily inputs of GGCMs. Apart from the ensemble simulation, the multiple emulators could also be used to explore and disentangle the uncertainty across models.
4.3 Uncertainties
The weaknesses of machine learning algorithms and raw GGCMs have brought some uncertainties into the emulators. The uncertainties induced by the machine learning algorithm were as follows.
-
When the climate factors went beyond the range of training data, the weakness of machine learning in out-of-sample prediction could bring great uncertainty. The emulator inputs should be capped by the range of training data. The limit of our emulator was the warmest grid under +6 K perturbation. As there is polar amplification, the strongest warming mostly happens in cooler regions. Thus, the projected temperature exceeding the training range would not be widespread over global croplands.
-
Although the emulators could reproduce the GGCM annual yield with high accuracy in most cases, there were cases in which the machine learning algorithm did not show good reproduction skill. As the emulated function was intended to smooth the response of simulated crop yield to climate, samples at the margins of training data tend to show lower emulator skill. Extreme conditions, i.e., +6 K, −50 % water, 810 ppm, 10 kg ha−1, show reduced R and increased MAE. Using the emulators to estimate annual crop yield under extreme perturbation conditions should be done with caution and the additional uncertainty induced by the emulators should be considered in the interpretation of results.
-
Last but not least, as the emulators are intended to be lightweight tools that can replicate raw GGCMs, their capability to simulate crop yields is limited to the capability of the original GGCMs. This raises the issue that emulators are unlikely to show good performance in simulating crop yield responses to climate extremes, exactly like the raw GGCMs, which have shown poor performance in capturing the yield impact of heatwave and drought (Heinicke et al., 2022), and the lack of negative effects of excessive wetness (Li et al., 2019a). Resolving such a problem requires the improvement of raw GGCMs' capability to simulate yield response to climate extremes or statistical promotion of the GGCMs' outputs under extreme weather events.
In this study, we developed machine-learning-based statistical crop yield emulators to reproduce the year-to-year variation of crop yield in response to perturbations in CO2 concentration, temperature, water, and nitrogen application rate from the GGCMI phase 2 archives. To examine the potential value of these emulators, we evaluated the performance of emulators at the global and gridded scale under a baseline with single and dual perturbations.
The results indicated that the performance of emulators was good enough to reproduce the year-to-year variation of global average crop yield in the baseline (R > 0.9), and the difference in accuracy between individual GGCM emulators was not large. Similarly, under single and dual perturbations, the capacity of emulators to reproduce the year-to-year variation of global mean crop yield was not substantially changed. At the gridded level, the performance of emulators over most of the current croplands in the baseline was still good in the sense that R was greater than 0.6 and MAE was smaller than 1 t ha−1. The performance of individual emulators was consistently good under single CTWN perturbations, without substantial changes in R and MAE. Similarly, multiple emulators also performed well in reproducing the annual yield under single CTWN perturbations, and most grid cells across the current cropland showed greater R and smaller MAE under simultaneous perturbations of T and W. The overall good capacity of emulators to reproduce the year-to-year variation of GGCM-simulated crop yield indicated the role of emulators in spatiotemporal downscaling, crop yield projection, and multi-model ensemble simulation. The emulators were able to boost the ability to assess crop yield failure risk under future climate change and help to better understand food stability and climate risk adaptation.
The Python function for crop model emulators is available at https://doi.org/10.5281/zenodo.7796686 (Liu, 2023).
The supplement related to this article is available online at: https://doi.org/10.5194/gmd-16-7203-2023-supplement.
WL and TY designed the research. WL, TY, and CM prepared the paper. All authors contributed to editing the paper.
At least one of the (co-)authors is a member of the editorial board of Geoscientific Model Development. The peer-review process was guided by an independent editor, and the authors also have no other competing interests to declare.
Publisher's note: Copernicus Publications remains neutral with regard to jurisdictional claims made in the text, published maps, institutional affiliations, or any other geographical representation in this paper. While Copernicus Publications makes every effort to include appropriate place names, the final responsibility lies with the authors.
We thank two anonymous reviewers, who provided helpful suggestions that contributed to this work.
This research has been supported by the National Natural Science Foundation of China (grant no. 42171075) and the State Key Laboratory of Earth Surface Processes and Resource Ecology of China (grant no. 2022-ZD-06).
This paper was edited by Tomomichi Kato and reviewed by two anonymous referees.
Blanc, É.: Statistical emulators of maize, rice, soybean and wheat yields from global gridded crop models, Agr. For. Meteorol., 236, 145–161, https://doi.org/10.1016/j.agrformet.2016.12.022, 2017.
Blanc, É.: Statistical emulators of irrigated crop yields and irrigation water requirements, Agr. For. Meteorol., 284, 107828, https://doi.org/10.1016/j.agrformet.2019.107828, 2020.
Blanc, E. and Sultan, B.: Emulating maize yields from global gridded crop models using statistical estimates, Agr. Forest Meteorol., 214–215, 134–147, https://doi.org/10.1016/j.agrformet.2015.08.256, 2015.
Campbell, B. M., Vermeulen, S. J., Girvetz, E., Loboguerrero, A. M., and Ramirez-Villegas, J.: Reducing risks to food security from climate change, Glob. Food Secur.-AGR., 11, 34–43, https://doi.org/10.1016/j.gfs.2016.06.002, 2016.
Chen, S., Liu, W., Feng, P., Ye, T., Ma, Y., and Zhang, Z.: Improving Spatial Disaggregation of Crop Yield by Incorporating Machine Learning with Multisource Data: A Case Study of Chinese Maize Yield, Remote Sens.-Basel, 14, 2340, https://doi.org/10.3390/rs14102340, 2022.
Chen, T. and Guestrin, C.: XGBoost: A Scalable Tree Boosting System, in: Proceedings of the 22nd ACM SIGKDD International Conference on Knowledge Discovery and Data Mining, ACM, New York, NY, USA, 13 August 2016, 785–794, https://doi.org/10.1145/2939672.2939785, 2016.
Elliott, J., Müller, C., Deryng, D., Chryssanthacopoulos, J., Boote, K. J., Büchner, M., Foster, I., Glotter, M., Heinke, J., Iizumi, T., Izaurralde, R. C., Mueller, N. D., Ray, D. K., Rosenzweig, C., Ruane, A. C., and Sheffield, J.: The Global Gridded Crop Model Intercomparison: data and modeling protocols for Phase 1 (v1.0), Geosci. Model Dev., 8, 261–277, https://doi.org/10.5194/gmd-8-261-2015, 2015.
Folberth, C., Baklanov, A., Balkovič, J., Skalský, R., Khabarov, N., and Obersteiner, M.: Spatio-temporal downscaling of gridded crop model yield estimates based on machine learning, Agr. For. Meteorol., 264, 1–15, https://doi.org/10.1016/j.agrformet.2018.09.021, 2019.
Franke, J. A., Müller, C., Elliott, J., Ruane, A. C., Jägermeyr, J., Balkovic, J., Ciais, P., Dury, M., Falloon, P. D., Folberth, C., François, L., Hank, T., Hoffmann, M., Izaurralde, R. C., Jacquemin, I., Jones, C., Khabarov, N., Koch, M., Li, M., Liu, W., Olin, S., Phillips, M., Pugh, T. A. M., Reddy, A., Wang, X., Williams, K., Zabel, F., and Moyer, E. J.: The GGCMI Phase 2 experiment: global gridded crop model simulations under uniform changes in CO2, temperature, water, and nitrogen levels (protocol version 1.0), Geosci. Model Dev., 13, 2315–2336, https://doi.org/10.5194/gmd-13-2315-2020, 2020a.
Franke, J. A., Müller, C., Elliott, J., Ruane, A. C., Jägermeyr, J., Balkovic, J., Ciais, P., Dury, M., Falloon, P. D., Folberth, C., François, L., Hank, T., Hoffmann, M., Izaurralde, R. C., Jacquemin, I., Jones, C., Khabarov, N., Koch, M., Li, M., Liu, W., Olin, S., Phillips, M., Pugh, T. A. M., Reddy, A., Wang, X., Williams, K., Zabel, F., and Moyer, E. J.: The GGCMI Phase 2 experiment: global gridded crop model simulations under uniform changes in CO2, temperature, water, and nitrogen levels (protocol version 1.0), Geosci. Model Dev., 13, 2315–2336, https://doi.org/10.5194/gmd-13-2315-2020, 2020b.
Frieler, K., Schauberger, B., Arneth, A., Balkovič, J., Elliott, J., Folberth, C., Deryng, D., Müller, C., Olin, S., Pugh, T. A. M., Schaphoff, S., Schewe, J., Schmid, E., Warszawski, L., and Levermann, A.: Understanding the weather signal in national crop-yield variability Earth's Future, Earths Futur3, 5, 605–616, https://doi.org/10.1002/2016EF000525, 2017.
Fronzek, S., Pirttioja, N., Carter, T. R., Bindi, M., Hoffmann, H., Palosuo, T., Ruiz-Ramos, M., Tao, F., Trnka, M., Acutis, M., Asseng, S., Baranowski, P., Basso, B., Bodin, P., Buis, S., Cammarano, D., Deligios, P., Destain, M. F., Dumont, B., Ewert, F., Ferrise, R., François, L., Gaiser, T., Hlavinka, P., Jacquemin, I., Kersebaum, K. C., Kollas, C., Krzyszczak, J., Lorite, I. J., Minet, J., Minguez, M. I., Montesino, M., Moriondo, M., Müller, C., Nendel, C., Öztürk, I., Perego, A., Rodríguez, A., Ruane, A. C., Ruget, F., Sanna, M., Semenov, M. A., Slawinski, C., Stratonovitch, P., Supit, I., Waha, K., Wang, E., Wu, L., Zhao, Z., and Rötter, R. P.: Classifying multi-model wheat yield impact response surfaces showing sensitivity to temperature and precipitation change, Agr. Syst., 159, 209–224, https://doi.org/10.1016/j.agsy.2017.08.004, 2018.
Hasegawa, T., Sakurai, G., Fujimori, S., Takahashi, K., Hijioka, Y., and Masui, T.: Extreme climate events increase risk of global food insecurity and adaptation needs, Nat. Food, 2, 587–595, https://doi.org/10.1038/s43016-021-00335-4, 2021.
Heinicke, S., Frieler, K., Jägermeyr, J., and Mengel, M.: Global gridded crop models underestimate yield responses to droughts and heatwaves, Environ. Res. Lett., 17, 044026, https://iopscience.iop.org/article/10.1088/1748-9326/ac592e, last access: 18 March 2022.
Iizumi, T. and Ramankutty, N.: Changes in yield variability of major crops for 1981-2010 explained by climate change, Environ. Res. Lett., 11, 34003, https://doi.org/10.1088/1748-9326/11/3/034003, 2016.
Iizumi, T., Yokozawa, M., Sakurai, G., Travasso, M. I., Romanenkov, V., Oettli, P., and Newby, T.: Historical changes in global yields: major cereal and legume crops from 1982 to 2006, Global Ecol. Biogeogr., 23, 346–357, https://doi.org/10.1111/geb.12120, 2014.
Jägermeyr, J., Robock, A., Elliott, J., Muller, C., Xia, L., Khabarov, N., Folberth, C., Schmid, E., Liu, W., Zabel, F., Rabin, S. S., Puma, M. J., Heslin, A., Franke, J., Foster, I., Asseng, S., Bardeen, C. G., Toon, O. B., and Rosenzweig, C.: A regional nuclear conflict would compromise global food security, P. Natl. Acad. Sci. USA, 117, 7071–7081, https://doi.org/10.1073/pnas.1919049117, 2020.
Jägermeyr, J., Müller, C., Ruane, A., Elliott, J., Balkovic, J., Castillo, O., Faye, B., Foster, I., Folberth, C., Franke, J., Fuchs, K., Guarin, J., Heinke, J., Hoogenboom, G., Iizumi, T., Jain, A. ., Kelly, D., Khabarov, N., Lange, S., Lin, T., Liu, W., Mialyk, O., Minol, S., and Rosenzweig, C.: Climate change signal in global agriculture emerges earlier in new generation of climate and crop models, Nat. Food, in revision, 2021.
Janssens, C., Havlík, P., Krisztin, T., Baker, J., Frank, S., Hasegawa, T., Leclère, D., Ohrel, S., Ragnauth, S., Schmid, E., Valin, H., Van Lipzig, N., and Maertens, M.: Global hunger and climate change adaptation through international trade, Nat. Clim. Change, 10, 829–835, https://doi.org/10.1038/s41558-020-0847-4, 2020.
Jones, J. W., Antle, J. M., Basso, B., Boote, K. J., Conant, R. T., Foster, I., Godfray, H. C. J., Herrero, M., Howitt, R. E., Janssen, S., Keating, B. A., Munoz-Carpena, R., Porter, C. H., Rosenzweig, C., and Wheeler, T. R.: Brief history of agricultural systems modeling, Agr. Syst., 155, 240–254, https://doi.org/10.1016/j.agsy.2016.05.014, 2017.
Kadam, N. N., Xiao, G., Melgar, R. J., Bahuguna, R. N., Quinones, C., Tamilselvan, A., Prasad, P. V. V. and Jagadish, K. S. V.: Chapter Three – Agronomic and Physiological Responses to High Temperature, Drought, and Elevated CO2 Interactions in Cereals, vol. 127, in: Advances in Agronomy, edited by: Sparks, D., Academic Press, 111–156, https://doi.org/10.1016/B978-0-12-800131-8.00003-0, 2014.
Kinnunen, P., Guillaume, J. H. A., Taka, M., D'Odorico, P., Siebert, S., Puma, M. J., Jalava, M., and Kummu, M.: Local food crop production can fulfil demand for less than one-third of the population, Nat. Food, 1, 229–237, https://doi.org/10.1038/s43016-020-0060-7, 2020.
Li, Y., Guan, K., Schnitkey, G. D., DeLucia, E., and Peng, B.: Excessive rainfall leads to maize yield loss of a comparable magnitude to extreme drought in the United States, Glob. Change Biol., 25, 2325–2337, https://doi.org/10.1111/gcb.14628, 2019a.
Li, Y., Guan, K., Yu, A., Peng, B., Zhao, L., Li, B., and Peng, J.: Toward building a transparent statistical model for improving crop yield prediction: Modeling rainfed corn in the U. S., Field Crop. Res., 234, 55–65, https://doi.org/10.1016/j.fcr.2019.02.005, 2019b.
Liu, W.: The machine learning based statistical emulators of GGCMI phase 2, Zenodo [code and data set], https://doi.org/10.5281/zenodo.7796686, 2023.
Liu, W., Ye, T., and Shi, P.: Decreasing wheat yield stability on the North China Plain: Relative contributions from climate change in mean and variability, Int. J. Climatol., 41, E2820–E2833, https://doi.org/10.1002/joc.6882, 2021a.
Liu, W., Ye, T., Jägermeyr, J., Müller, C., Chen, S., Liu, X., and Shi, P.: Future climate change significantly alters interannual wheat yield variability over half of harvested areas, Environ. Res. Lett., 16, 094045, https://doi.org/10.1088/1748-9326/ac1fbb, 2021b.
Liu, W., Li, Z., Li, Y., Ye, T., Chen, S., and Liu, Y.: Heterogeneous impacts of excessive wetness on maize yields in China: Evidence from statistical yields and process-based crop models, Agr. For. Meteorol., 327, 109205, https://doi.org/10.1016/j.agrformet.2022.109205, 2022.
Lobell, D. B., Sibley, A., and Ivan Ortiz-Monasterio, J.: Extreme heat effects on wheat senescence in India, Nat. Clim. Change, 2, 186–189, https://doi.org/10.1038/nclimate1356, 2012.
Makowski, D., Asseng, S., Ewert, F., Bassu, S., Durand, J. L., Li, T., Martre, P., Adam, M., Aggarwal, P. K., Angulo, C., Baron, C., Basso, B., Bertuzzi, P., Biernath, C., Boogaard, H., Boote, K. J., Bouman, B., Bregaglio, S., Brisson, N., Buis, S., Cammarano, D., Challinor, A. J., Confalonieri, R., Conijn, J. G., Corbeels, M., Deryng, D., De Sanctis, G., Doltra, J., Fumoto, T., Gaydon, D., Gayler, S., Goldberg, R., Grant, R. F., Grassini, P., Hatfield, J. L., Hasegawa, T., Heng, L., Hoek, S., Hooker, J., Hunt, L. A., Ingwersen, J., Izaurralde, R. C., Jongschaap, R. E. E., Jones, J. W., Kemanian, R. A., Kersebaum, K. C., Kim, S. H., Lizaso, J., Marcaida, M., Müller, C., Nakagawa, H., Naresh Kumar, S., Nendel, C., O'Leary, G. J., Olesen, J. E., Oriol, P., Osborne, T. M., Palosuo, T., Pravia, M. V., Priesack, E., Ripoche, D., Rosenzweig, C., Ruane, A. C., Ruget, F., Sau, F., Semenov, M. A., Shcherbak, I., Singh, B., Singh, U., Soo, H. K., Steduto, P., Stöckle, C., Stratonovitch, P., Streck, T., Supit, I., Tang, L., Tao, F., Teixeira, E. I., Thorburn, P., Timlin, D., Travasso, M., Rötter, R. P., Waha, K., Wallach, D., White, J. W., Wilkens, P., Williams, J. R., Wolf, J., Yin, X., Yoshida, H., Zhang, Z., and Zhu, Y.: A statistical analysis of three ensembles of crop model responses to temperature and CO2 concentration, Agr. For. Meteorol., 214–215, 483–493, https://doi.org/10.1016/j.agrformet.2015.09.013, 2015.
Mistry, M. N., Sue Wing, I., and De Cian, E.: Simulated vs. empirical weather responsiveness of crop yields: US evidence and implications for the agricultural impacts of climate change, Environ. Res. Lett., 12, 075007, https://doi.org/10.1088/1748-9326/aa788c, 2017.
Müller, C., Franke, J., Jägermeyr, J., Ruane, A. C., Elliott, J., Moyer, E., Heinke, J., Falloon, P., Folberth, C., Francois, L., Hank, T., Izaurralde, R. C., Jacquemin, I., Liu, W., Olin, S., Pugh, T., Williams, K. E., and Zabel, F.: Exploring uncertainties in global crop yield projections in a large ensemble of crop models and CMIP5 and CMIP6 climate scenarios, Environ. Res. Lett., 16, 034040, https://doi.org/10.1088/1748-9326/abd8fc, 2021.
Nachtergaele, F., Velthuizen, H. Van, Verelst, L., Batjes, N., Dijkshoorn, K., Engelen, V. Van, Fischer, G., Jones, A., Montanarella, L., Petri, M., Prieler, S., Teixeira, E., Wiberg, D., and Shi, X.: Harmonized World Soil Database (version 1), Soil Sci., 38, 3123, https://www.fao.org/soils-portal/soil-survey/soil-maps-and-databases/harmonized-world-soil-database-v12/en/ (last access: 15 August 2023), 2009.
Ostberg, S., Schewe, J., Childers, K., and Frieler, K.: Changes in crop yields and their variability at different levels of global warming, Earth Syst. Dynam., 9, 479–496, https://doi.org/10.5194/esd-9-479-2018, 2018.
Pirttioja, N., Carter, T. R., Fronzek, S., Bindi, M., Hoffmann, H., Palosuo, T., Ruiz-Ramos, M., Tao, F., Trnka, M., Acutis, M., Asseng, S., Baranowski, P., Basso, B., Bodin, P., Buis, S., Cammarano, D., Deligios, P., Destain, M. F., Dumont, B., Ewert, F., Ferrise, R., François, L., Gaiser, T., Hlavinka, P., Jacquemin, I., Kersebaum, K. C., Kollas, C., Krzyszczak, J., Lorite, I. J., Minet, J., Minguez, M. I., Montesino, M., Moriondo, M., Müller, C., Nendel, C., Öztürk, I., Perego, A., Rodríguez, A., Ruane, A. C., Ruget, F., Sanna, M., Semenov, M. A., Slawinski, C., Stratonovitch, P., Supit, I., Waha, K., Wang, E., Wu, L., Zhao, Z., and Rötter, R. P.: Temperature and precipitation effects on wheat yield across a European transect: A crop model ensemble analysis using impact response surfaces, Clim. Res., 65, 87–105, https://doi.org/10.3354/cr01322, 2015.
Portmann, F. T., Siebert, S., and Döll, P.: MIRCA2000—Global monthly irrigated and rainfed crop areas around the year 2000: A new high-resolution data set for agricultural and hydrological modeling, Global Biogeochem. Cy., 24, GB1011, https://doi.org/10.1029/2008GB003435, 2010.
Raimondo, M., Nazzaro, C., Marotta, G., and Caracciolo, F.: Land degradation and climate change: Global impact on wheat yields, Land Degrad. Dev., 32, 387–398, https://doi.org/10.1002/ldr.3699, 2021.
Ray, D. K., Gerber, J. S., Macdonald, G. K., and West, P. C.: Climate variation explains a third of global crop yield variability, Nat. Commun., 6, 1–9, https://doi.org/10.1038/ncomms6989, 2015.
Ruane, A. C., Goldberg, R., and Chryssanthacopoulos, J.: Climate forcing datasets for agricultural modeling: Merged products for gap-filling and historical climate series estimation, Agr. For. Meteorol., 200, 233–248, https://doi.org/10.1016/j.agrformet.2014.09.016, 2015.
Sacks, W. J., Deryng, D., Foley, J. A., and Ramankutty, N.: Crop planting dates: an analysis of global patterns, Global. Ecol. Biogeogr., 19, 607–620, https://doi.org/10.1111/j.1466-8238.2010.00551.x, 2010.
Schauberger, B., Rolinski, S., and Müller, C.: A network-based approach for semi-quantitative knowledge mining and its application to yield variability, Environ. Res. Lett., 11, 123001, https://doi.org/10.1088/1748-9326/11/12/123001, 2016.
Shahhosseini, M., Martinez-Feria, R. A., Hu, G., and Archontoulis, S. V.: Maize yield and nitrate loss prediction with machine learning algorithms, Environ. Res. Lett., 14, 124026, https://doi.org/10.1088/1748-9326/ab5268, 2019.
Sternberg, T.: Regional drought has a global impact, Nature, 472, 169–169, https://doi.org/10.1038/472169d, 2011.
Sweet, L., Müller, C., Anand, M., and Zscheischler, J.: Cross-Validation Strategy Impacts the Performance and Interpretation of Machine Learning Models, Artificial Intelligence for the Earth Systems, 2, e230026, https://doi.org/10.1175/AIES-D-23-0026.1, 2023.
Tartarini, S., Vesely, F., Movedi, E., Radegonda, L., Pietrasanta, A., Recchi, G., and Confalonieri, R.: Biophysical models and meta-modelling to reduce the basis risk in index-based insurance: A case study on winter cereals in Italy, Agr. For. Meteorol., 300, 108320, https://doi.org/10.1016/j.agrformet.2021.108320, 2021.
Troy, T. J., Kipgen, C., and Pal, I.: The impact of climate extremes and irrigation on US crop yields, Environ. Res. Lett., 10, 1–10, https://doi.org/10.1088/1748-9326/10/5/054013, 2015.
Xu, H., Zhang, X., Ye, Z., Jiang, L., Qiu, X., Tian, Y., Zhu, Y., and Cao, W.: Machine learning approaches can reduce environmental data requirements for regional yield potential simulation, Eur. J. Agron., 129, 126335, https://doi.org/10.1016/j.eja.2021.126335, 2021.
Zhu, X. and Troy, T. J.: Agriculturally Relevant Climate Extremes and Their Trends in the World's Major Growing Regions, Earths Future, 6, 656–672, https://doi.org/10.1002/2017EF000687, 2018.