the Creative Commons Attribution 4.0 License.
the Creative Commons Attribution 4.0 License.
 | 04 Dec 2023
Simulations of 7Be and 10Be with the GEOS-Chem global model v14.0.2 using state-of-the-art production rates
Minjie Zheng
Hongyu Liu
Florian Adolphi
Raimund Muscheler
Zhengyao Lu
Mousong Wu
The cosmogenic radionuclides 7Be and 10Be are useful tracers for atmospheric transport studies. Combining 7Be and 10Be measurements with an atmospheric transport model can not only improve our understanding of the radionuclide transport and deposition processes but also provide an evaluation of the transport process in the model. To simulate these aerosol tracers, it is critical to evaluate the influence of radionuclide production uncertainties on simulations. Here we use the GEOS-Chem chemical transport model driven by the Modern-Era Retrospective analysis for Research and Applications, Version 2 (MERRA-2) reanalysis to simulate 7Be and 10Be with the state-of-the-art production rate from the CRAC:Be (Cosmic Ray Atmospheric Cascade: Beryllium) model considering realistic spatial geomagnetic cutoff rigidities (denoted as P16spa). We also perform two sensitivity simulations: one with the default production rate in GEOS-Chem based on an empirical approach (denoted as LP67) and the other with the production rate from the CRAC:Be but considering only geomagnetic cutoff rigidities for a geocentric axial dipole (denoted as P16). The model results are comprehensively evaluated with a large number of measurements including surface air concentrations and deposition fluxes. The simulation with the P16spa production can reproduce the absolute values and temporal variability of 7Be and 10Be surface concentrations and deposition fluxes on annual and sub-annual scales, as well as the vertical profiles of air concentrations. The simulation with the LP67 production tends to overestimate the absolute values of 7Be and 10Be concentrations. The P16 simulation suggests less than 10 % differences compared to P16spa but a significant positive bias (∼18 %) in the 7Be deposition fluxes over East Asia. We find that the deposition fluxes are more sensitive to the production in the troposphere and downward transport from the stratosphere. Independent of the production models, surface air concentrations and deposition fluxes from all simulations show similar seasonal variations, suggesting a dominant meteorological influence. The model can also reasonably simulate the stratosphere–troposphere exchange process of 7Be and 10Be by producing stratospheric contribution and ratio values that agree with measurements. Finally, we illustrate the importance of including the time-varying solar modulations in the production calculation, which significantly improve the agreement between model results and measurements, especially at mid-latitudes and high latitudes. Reduced uncertainties in the production rates, as demonstrated in this study, improve the utility of 7Be and 10Be as aerosol tracers for evaluating and testing transport and scavenging processes in global models. For future GEOS-Chem simulations of 7Be and 10Be, we recommend using the P16spa (versus default LP67) production rate.
- Article
(9114 KB) - Full-text XML
-
Supplement
(3455 KB) - BibTeX
- EndNote


The naturally occurring cosmogenic radionuclide 7Be (half-life of 53.2 d) is monitored worldwide and has been recognized as a useful tracer in atmospheric dynamic studies (Aldahan et al., 2001; Hernández-Ceballos et al., 2016; Terzi et al., 2019; Liu et al., 2016). In particular, ratios of radionuclides concentrations with very different half-lives, such as the ratio, have become powerful tools (e.g., Liu et al., 2022b; Raisbeck et al., 1981) to disentangle the influence of transport and deposition since both 7Be and 10Be in the troposphere are mainly removed by wet deposition. In this paper, we aim to improve the utility of 7Be and 10Be as tracers for atmospheric transport using state-of-the-art production rates in a global 3-D chemical transport model.
7Be and 10Be are produced through interactions between atmospheric atoms (mostly oxygen and nitrogen) and incoming cosmic rays in the atmosphere (Lal and Peters, 1967, referred to as LP67 hereafter; Poluianov et al., 2016, referred to as P16 hereafter). Due to the atmospheric depth profile of fluxes of primary cosmic rays, the formed secondary particles, and their energy, 7Be and 10Be production rates reach their maxima in the lower stratosphere (Poluianov et al., 2016). About two-thirds of 7Be and 10Be are produced in the stratosphere, while the rest is produced in the troposphere (Poluianov et al., 2016; Heikkilä and Smith, 2013; Golubenko et al., 2022). Once produced, 7Be and 10Be rapidly attach to aerosol particles and get transported and deposited with their carrier aerosols by wet and dry deposition (Delaygue et al., 2015; Heikkilä et al., 2013). 10Be has a half-life of 1.39×10⁶ years (Chmeleff et al., 2010), and its decay is thus negligible compared to its average atmospheric residence time (about 1–2 years) (Heikkilä et al., 2008b). During transport away from the regions of their production, the ratio increases because 7Be decays. The ratio therefore could indicate the path-integrated age of the air mass. Due to different aerosol residence times in the stratosphere (more than 1 year) and troposphere (∼ weeks), the ratio is higher in the stratosphere than in the troposphere. Hence, the ratio can be used to detect the stratosphere–troposphere exchange.
Many studies have focused on understanding the signals in surface 7Be measurements from worldwide monitoring stations (e.g., Hernandez-Ceballos et al., 2015; Rodriguez-Perulero et al., 2019; Uhlar et al., 2020; Ajtić et al., 2022; Burakowska et al., 2021). Due to the cosmogenic origin of 7Be, surface air 7Be concentrations are found to be connected to the 11-year cycle of solar modulation (Leppänen et al., 2010; Zheng et al., 2021b). In addition, 7Be concentrations in the surface air are affected by different meteorological processes depending on locations, such as stratospheric intrusions (Jordan et al., 2003; Pacini et al., 2015; Yamagata et al., 2019), scavenging by precipitation (Chae and Kim, 2019; Kusmierczyk-Michulec et al., 2015), vertical transport in the troposphere (Aldahan et al., 2001; Ajtić et al., 2018; Zheng et al., 2021b), and large-scale atmospheric circulations (Hernández-Ceballos et al., 2022; Terzi and Kalinowski, 2017).
The ability of general circulation models (GCMs; e.g., GISS ModelE, ECHAM5-HAM, and EMAC) and chemical transport models (CTMs; e.g., GEOS-Chem and GMI) to capture the main characteristics in 7Be and 10Be transport and deposition has been demonstrated in previous studies (e.g., Heikkilä et al., 2008b; Koch and Rind, 1998; Field et al., 2006; Usoskin et al., 2009; Brattich et al., 2021; Spiegl et al., 2022; Liu et al., 2016; Sukhodolov et al., 2017). For example, Usoskin et al. (2009) found that the influence of the solar proton-induced 7Be production peak at the surface in early 2005 is small through the comparison of GISS ModelE simulations and surface air measurements. Heikkilä et al. (2009) showed that stratospheric 10Be contribution is dominant in the global 10Be deposition by tracing tropospheric and stratospheric 10Be separately in the aerosol–climate model ECHAM5-HAM. Spiegl et al. (2022) used the EMAC climate model to investigate the transport and deposition process of 10Be produced by the extreme solar proton event in 774–775 CE. They suggested that the downward transport of 10Be from the stratosphere is mainly controlled by the Brewer–Dobson circulation in the stratosphere and cross-tropopause transport. By comparing the measurements with GEOS-Chem simulations over January–March 2003, Brattich et al. (2021) found that increased 7Be values in surface air samples in northern Europe in early 2003 were associated with the instability of the Arctic polar vortex. They also showed that, while the model generally simulates the month-to-month variation in surface 7Be concentrations well, it tends to underestimate the observations (see their Table 2), partly due to the use of the default LP67 production rate for a solar maximum year (1958) in the GEOS-Chem model (Liu et al., 2001). Using the GMI CTM driven with four different meteorological datasets, Liu et al. (2016) showed that the observational constraints for 7Be and observed 7Be total deposition fluxes can be used to provide a first-order assessment of cross-tropopause transport in global models. In comparison to GCMs with or without nudged winds (e.g., Golubenko et al., 2021; Heikkilä et al., 2008b; Spiegl et al., 2022) which involve simulating the entire global circulation and climate, the “offline” CTMs are driven by archived meteorological datasets, either from output of GCMs or from atmospheric data assimilation systems. For example, GEOS-Chem can be driven by the GEOS assimilated meteorology (e.g., MERRA-2 reanalysis data; Gelaro et al., 2017a) or output from the GISS GCM (e.g., Murray et al., 2021).
In comparison with the LP67 production rate using an empirical approach (Lal and Peters, 1967; Liu et al., 2001; Brattich et al., 2021), the recent production models apply full Monte Carlo simulations of the cosmic-ray-induced atmospheric nucleonic cascade (e.g., Poluianov et al., 2016; Masarik and Beer, 1999). LP67 shows the highest 7Be and 10Be production rates compared to other production models (Elsässer, 2013). P16 suggests that LP67 overestimates the 7Be production rate by 30 %–50 % compared to their production model (Poluianov et al., 2016). Furthermore, the LP67 production rate implemented in GEOS-Chem is only validated for the year 1958, a year with a high solar modulation function (i.e., high solar activity) of 1200 MeV (Herbst et al., 2017). This highlights the problem of quantitatively comparing these uncorrected model outputs with measurements from other periods. Some studies (e.g., Koch et al., 1996; Liu et al., 2016) have applied a scale factor to account for this solar modulation influence on LP67 production rate. However, this correction is not ideal as the influence of varying solar modulation is latitudinally and vertically dependent. In earlier studies, the 10Be production rate in GEOS-Chem was simply scaled to the 7Be production rate based on the ratio estimated from the surface measurements (Koch and Rind, 1998). In addition, 10Be as simulated by GEOS-Chem has not been evaluated so far. It is hence necessary to update the 7Be and 10Be production rates in GEOS-Chem and assess the corresponding impacts on model simulation results.
In this study, we incorporate global 7Be and 10Be production rates from the recently published CRAC:Be (Cosmic Ray Atmospheric Cascade: Beryllium) model (Poluianov et al., 2016) into the GEOS-Chem model. We simulate 7Be and 10Be using GEOS-Chem with the following three production scenarios:
-
Scenario I, a production rate derived from the CRAC:Be model considering realistic geomagnetic cutoff rigidity (P16spa production rate);
-
Scenario II, a production rate derived from the CRAC:Be model considering an approximation of geomagnetic cutoff rigidities using a geocentric axial dipole (P16 production rate);
-
Scenario III, a default production rate in GEOS-Chem using an empirical approximation (LP67 production rate).
Scenario I is treated as the standard simulation, while the other two are sensitivity tests that also enable comparison to earlier studies. This paper is organized as follows. Section 2 introduces the GEOS-Chem model and three different 7Be and 10Be production rates, discusses the methodology and experiment design, and describes the observational data for model evaluations. In Sect. 3, we first investigate the differences between three different production scenarios (Sect. 3.1). Then, we evaluate model simulations of 7Be and 10Be with several published datasets of 7Be and 10Be measurements, in terms of absolute values (Sect. 3.2–3.3), vertical profiles (Sect. 3.4), and seasonal variations (Sect. 3.6). The budgets and residence times of 7Be and 10Be are given in Sect. 3.5. We also examine the ratio in the model to assess its ability in capturing the stratosphere–troposphere exchange (Sect. 3.7). Finally, we investigate the influence of including solar-induced production rate variability on 7Be simulations (Sect. 3.8). A summary and conclusions are given in Sect. 4.
2.1 GEOS-Chem model
GEOS-Chem is a global 3-D chemical transport model (http://www.geos-chem.org, last access: 23 November 2023) that simulates gases and aerosols in both the troposphere and stratosphere (Eastham et al., 2014; Bey et al., 2001). It is driven by archived meteorological data. We use version 14.0.2 (https://wiki.seas.harvard.edu/geos-chem/index.php/GEOS-Chem_14.0.2, last access: 23 November 2023) to simulate the transport and deposition of atmospheric 7Be and 10Be. We drive the model with the Modern-Era Retrospective analysis for Research and Applications, Version 2 (MERRA-2) meteorological reanalysis (http://gmao.gsfc.nasa.gov/reanalysis/MERRA-2/, last access: 23 November 2023; Gelaro et al., 2017b). MERRA-2 has a native resolution of 0.5∘ latitude by 0.667∘ longitude, with 72 vertical levels up to 0.01 hPa (80 km). Here the MERRA-2 data are re-gridded to 4∘ latitude by 5∘ longitude for input to GEOS-Chem for computational efficiency.
GEOS-Chem includes a radionuclide simulation option (222Rn–210Pb–7Be–10Be), which simulates transport (advection, convection, boundary-layer mixing), deposition, and decay of the radionuclide tracers (e.g., Liu et al., 2001, 2004; B. Zhang et al., 2021; Yu et al., 2018). The model uses the TPCORE algorithm of Lin and Rood (1996) for advection, archived convective mass fluxes to calculate convective transport (Wu et al., 2007), and the non-local scheme implemented by Lin and McElroy (2010) for boundary-layer mixing. As mentioned in the Introduction, the standard GEOS-Chem model uses the LP67 7Be and 10Be production rates. After production, 7Be and 10Be attach to ambient submicron aerosols ubiquitously, and their behavior becomes that of aerosols until they are removed by wet-deposition (precipitation scavenging) and dry-deposition processes. Note that neither is the process of attachment explicitly represented, nor is the aerosol size distribution considered in the model. In addition, the decay process is included for the short-lived 7Be with a half-life of 53.2 d. The decay is minor for the long-living 10Be, which has a half-life of 1.39×10⁶ years (e.g., Chmeleff et al., 2010).
Wet deposition includes rainout (in-cloud scavenging) due to stratiform and anvil precipitation (Liu et al., 2001), scavenging in convective updrafts (Mari et al., 2000), and washout (below-cloud scavenging) by precipitation (Wang et al., 2011). Scavenged aerosols from vertical layers above are allowed to be released into the atmosphere during the re-evaporation of precipitation below the cloud. In the case of partial re-evaporation, we assume that half of the corresponding fraction of the scavenged aerosol mass is released at that level because some of the re-evaporation of precipitation are due to partial shrinking of the raindrops, which does not release aerosol (Liu et al., 2001). MERRA-2 fields of precipitation formation and evaporation are used directly by the model wet deposition scheme. Dry deposition is based on the resistance-in-series scheme of Wesely (1989). The process of sedimentation is not included in the model.
To quantify the stratospheric contribution to 7Be and 10Be in the troposphere, we separately transport 7Be and 10Be produced in the model layers above the MERRA-2 thermal tropopause (i.e., stratospheric 7Be and 10Be tracers). This approach was previously used to study cross-tropopause transport of 7Be in GEOS-Chem (Liu et al., 2001; Brattich et al., 2021) and Global Modeling Initiative chemical transport models (Liu et al., 2016; Brattich et al., 2017). The stratospheric fractions of 7Be and 10Be are defined as the ratio of the stratospheric 7Be and 10Be concentrations to the 7Be and 10Be concentrations.
2.2 7Be and 10Be production models
The GEOS-Chem currently uses the LP67 production rates of 7Be and 10Be (Lal and Peters, 1967). These production rates are calculated using an analytically estimated rate of nuclear disintegration (stars) in the atmosphere (stars per gram of air per second), multiplied by the mean production yield of 0.045 atoms per star for 7Be and 0.025 atoms per star for 10Be (Lal and Peters, 1967). These rates are represented as a function of latitude and altitude for the year 1958 and are not time-varying.
Here we update the atmospheric 7Be and 10Be production rates in GEOS-Chem with the latest production model: the CRAC:Be model by P16 (Poluianov et al., 2016) using the solar modulation function record by Herbst et al. (2017). The solar modulation function record is based on the local interstellar spectrum by Herbst et al. (2017), which was also used in the production model. Given spatially and temporally resolved geomagnetic cutoff rigidities, the P16 model allows the calculation of 3-dimensional, temporally variable 7Be and 10Be production rates, which are necessary for input to atmospheric transport models. The P16 production model is regarded as the latest and one of the most accurate production models for 7Be and 10Be and was used in recent general circulation model simulations (e.g., Golubenko et al., 2021; Sukhodolov et al., 2017).
The production rates of 7Be and 10Be are calculated as Eq. (1) by an integral of the yield functions of 7Be and 10Be (Yi, atoms g−1 cm2 sr) and the energy spectrum of cosmic rays (Ji, (sr s cm2)−1) above the cutoff energy Ec:
where i refers to different types of primary cosmic ray particles (e.g., proton, alpha, and heavier particles). For modeling the contribution of alpha and heavier particles to the total production, their nucleonic ratio in the local interstellar spectrum was set to 0.353 (Koldobskiy et al., 2019). The yield function Yi is a function of height (h) and kinetic energy per incoming primary nucleon (E) and is directly taken from P16. The energy spectrum of cosmic rays Ji is a function of the kinetic energy (E) and depends on the solar modulation function (Φ) (Herbst et al., 2017). Ec is calculated as Eq. (2) as a function of the local geomagnetic rigidity cutoff (Pc):
where Zi and Ai are the charge and mass numbers of particles, respectively. Er is the rest mass of a proton (0.938 GeV).
The geomagnetic rigidity cutoff Pc is a quantitative estimation of the Earth's geomagnetic field shielding effect (Smart and Shea, 2005). Cosmic ray particles with rigidity (momentum per unit charge of the particle) higher than the geomagnetic cutoff rigidity value can enter the Earth's atmosphere. In several model simulations of 7Be and 10Be (e.g., Field et al., 2006; Koch et al., 1996; Liu et al., 2001), the production is calculated with a Pc simplified as a function of the geomagnetic latitude and geomagnetic dipole moment, called the vertical Störmer cutoff rigidity equation (see Eqs. 5.8.2–2 in Beer et al., 2012). However, this is different from the real geomagnetic cutoff rigidity inferred from the trajectories of particles with different energies using real geomagnetic field measurements (e.g., Copeland, 2018), which also includes non-dipole moments of the field (Beer et al., 2012) (Fig. S1 in the Supplement). Earlier studies suggested that using the simple centered dipole models (e.g., Störmer cutoff rigidity) for cutoff rigidity approximation is limited as they can significantly distort the cutoff rigidity for some regions (e.g., low-latitude regions) (Pilchowski et al., 2010; Nevalainen et al., 2013).
Here we take the geomagnetic cutoff rigidity from Copeland (2018) that provides the cutoff rigidity at a fine interval (1∘) in both latitude and longitude. This production rate is denoted as P16spa. To investigate the effect of this more realistic representation of cutoff rigidity on 7Be and 10Be simulations, we also perform simulations where the cutoff rigidities are approximated by the Störmer equation (denoted as P16). The influence of the geomagnetic field intensity variations can be considered negligible on annual and decadal timescales and are ignored here (e.g., Muscheler et al., 2007; Zheng et al., 2020). It should be mentioned that the LP67 production is based on an ideal axial dipole cutoff rigidity similar to the P16 production model.
2.3 GEOS-Chem model experiments and evaluations
An overview of the performed simulations is shown in Table S1 in the Supplement. The simulation with the P16spa production rate is considered the standard simulation, while the simulations with the P16 and LP67 production rates are sensitivity tests. The simulation with the P16 production rate is conducted to evaluate the influence of a simplified approximation of cutoff rigidities resulting from a geocentric dipole. In earlier studies, the LP67 production rate was used for global model simulations of 7Be (e.g., Liu et al., 2016; Brattich et al., 2017; Liu et al., 2001; Koch et al., 1996). The purpose of performing the simulation with the LP67 production rate is to evaluate to what extent model simulations are biased when applying the default LP67 production. Since the LP67 production rate applies only for the year 1958 (with a solar modulation function of about 1200 MeV) and does not consider the influences of the solar variations (e.g., 11-year solar cycle), it underestimates the production rate for the period of 2008–2018 that has an average solar modulation function of 500 MeV. To correct for this solar modulation influence, we follow the previous studies (e.g., Liu et al., 2016; Koch et al., 1996) by multiplying the model results by a scale factor of 1.39. It should be noted that this correction is not ideal as the effects of a varying solar modulation on cosmogenic radionuclide production rates depend on altitude and latitude. All simulations are performed from 2002 to 2018, with the first 6 years for spin-up to make sure the 10Be nearly reaches equilibrium in the atmosphere and the 2008–2018 period (11 years) for analysis. The simulations are conducted using a 4∘ latitude × 5∘ longitude resolution for computational efficiency (e.g., Liu et al., 2016, 2004).
To evaluate the model's ability to reproduce the variabilities in the observations, we use the statistical parameters: Spearman correlation coefficients and root mean square error (RMSE) (Chang and Hanna, 2004). Spearman's rank correlation (R) (Myers et al., 2013) is used as it does not make any assumptions about the variables being normally distributed. It is less sensitive to outliers in the data compared to the commonly used Pearson correlation. The fraction of modeled concentrations within a factor of 2 of observations (FA2) is calculated, i.e., for which . Usually, if the scatter plot of the model and measurements is within a factor of 2 of observations, the model is considered to have a reasonably good performance (e.g., Heikkilä et al., 2008b; Brattich et al., 2021). For model comparison with surface air concentrations, the model value from the bottom grid box closest to the corresponding measurement site is selected.
2.4 7Be and 10Be observational data for model validation
The annual mean 7Be surface air concentration and deposition measurements are taken from a compilation by F. Zhang et al. (2021). The compilation includes a total of 494 annual mean values for surface air 7Be concentrations and 304 for 7Be deposition fluxes. For the deposition measurements, most of them include both wet and dry deposition, while a few are collected only during rainfall events and thus include only wet deposition. It includes the data from the following:
-
the Environmental Measurements Laboratory (EML; https://www.wipp.energy.gov/namp/emllegacy/index.htm, last access: 23 November 2023) Surface Air Sampling Program (SASP), which began in the 1980s;
-
the ongoing international monitor program Radioactivity Environmental Monitoring (REM) network (e.g., Hernandez-Ceballos et al., 2015; Sangiorgi et al., 2019);
-
the International Monitoring System (IMS) organized by the Comprehensive Nuclear-Test-Ban Treaty Organization (CTBTO) (e.g., Terzi and Kalinowski, 2017);
-
some additional datasets in publications not included in the above programs.
We only include the data covering more than 1 year to reduce the influence of inherent seasonal variations. We further include several recently published data for 7Be surface air concentrations and deposition fluxes records that cover more than 1 year (Burakowska et al., 2021; Liu et al., 2022b; Kong et al., 2022).
The data used for investigating the seasonality of 7Be surface air concentrations are mainly taken from a multiyear compilation dataset of IMS from Terzi and Kalinowski (2017). The seasonal 7Be deposition data are taken from Courtier et al. (2017), Du et al. (2015), Dueñas et al. (2017), Hu et al. (2020), Lee et al. (2015), and Sangiorgi et al. (2019). The vertical profile of 7Be concentrations is taken from the Environmental Measurements Laboratory (EML) High Altitude Sampling Program (HASP), spanning the years of 1962–1983. It should be noted that, different from surface air measurements, the vertical air samples were usually collected during single-day flight campaigns.
There are fewer 10Be measurements compared to 7Be. Here we compiled two datasets of published 10Be surface air measurements (Table S2) (Aldahan et al., 2008; Liu et al., 2022a; Yamagata et al., 2019; Padilla et al., 2019; Rodriguez-Perulero et al., 2019; Huang et al., 2010; Méndez-García et al., 2022; Elsässer et al., 2011; Dibb et al., 1994) and deposition fluxes (Table S3) covering more than 1 year, to validate the model performance. The air samples are continuously collected by filters using a high-flow aerosol sampler. The sampling volume is approximately 700 m3 of air for daily samples (e.g., Liu et al., 2022a) and between 3000 and 5000 m3 for weekly samples (e.g., Yamagata et al., 2019). The deposition data include the precipitation samples (wet deposition) (Graham et al., 2003; Monaghan et al., 1986; Somayajulu et al., 1984; Heikkilä et al., 2008a; Raisbeck et al., 1979; Maejima et al., 2005) and ice core samples (wet and dry deposition) that cover the recent period (Heikkilä et al., 2008a; Zheng et al., 2021a; Pedro et al., 2012; Baroni et al., 2011; Aldahan et al., 1998; Berggren et al., 2009; Auer et al., 2009; Zheng et al., 2023a). The 10Be vertical profile measurements are mainly taken from Dibb et al. (1992, 1994) and Jordan et al. (2003).
3.1 7Be and 10Be production rates
Figure S2 shows the comparison between 7BeP16 and 7BeLP67 production rates for the year 1958. Generally, the 7BeP16 production rate shows a similar production distribution to the 7BeLP67 production rate, with a maximum 7Be production over the polar stratosphere (∼100 hPa). The 7BeLP67 production rate shows, on average, about a 72 % higher production rate compared to 7BeP16 in the stratosphere and about 38 % in the troposphere (Fig. S2c; Table S4). On a global average, the 7BeLP67 production rate is about 60 % higher than that of 7BeP16, as shown in previous studies (Poluianov et al., 2016). The stratospheric production contributes about 67 % to the total production for the 7BeLP67 production rate, while it is about 62 % for the 7BeP16 production rate for the year 1958.
The 10BeLP67 production rate in the GEOS-Chem model uses the identical source distribution as 7Be with a scaling factor based on the estimates from surface air measurements (Koch and Rind, 1998). This leads to a constant production ratio (0.55) throughout the entire atmosphere. However, as shown in many 7Be and 10Be production models (e.g., Poluianov et al., 2016; Masarik and Beer, 2009), 7Be and 10Be have different altitudinal production distributions. The P16 production shows an increasing production ratio from higher altitudes (0.35) to lower altitudes (0.6) (Fig. S3). Using a constant production ratio may thus result in large errors in the modeled 10Be concentrations as well as ratios. The stratospheric production contributes about 67 % of the total production with 10BeLP67, while it is about 58 % with the 10BeP16 production for the year 1958 (Table S4).
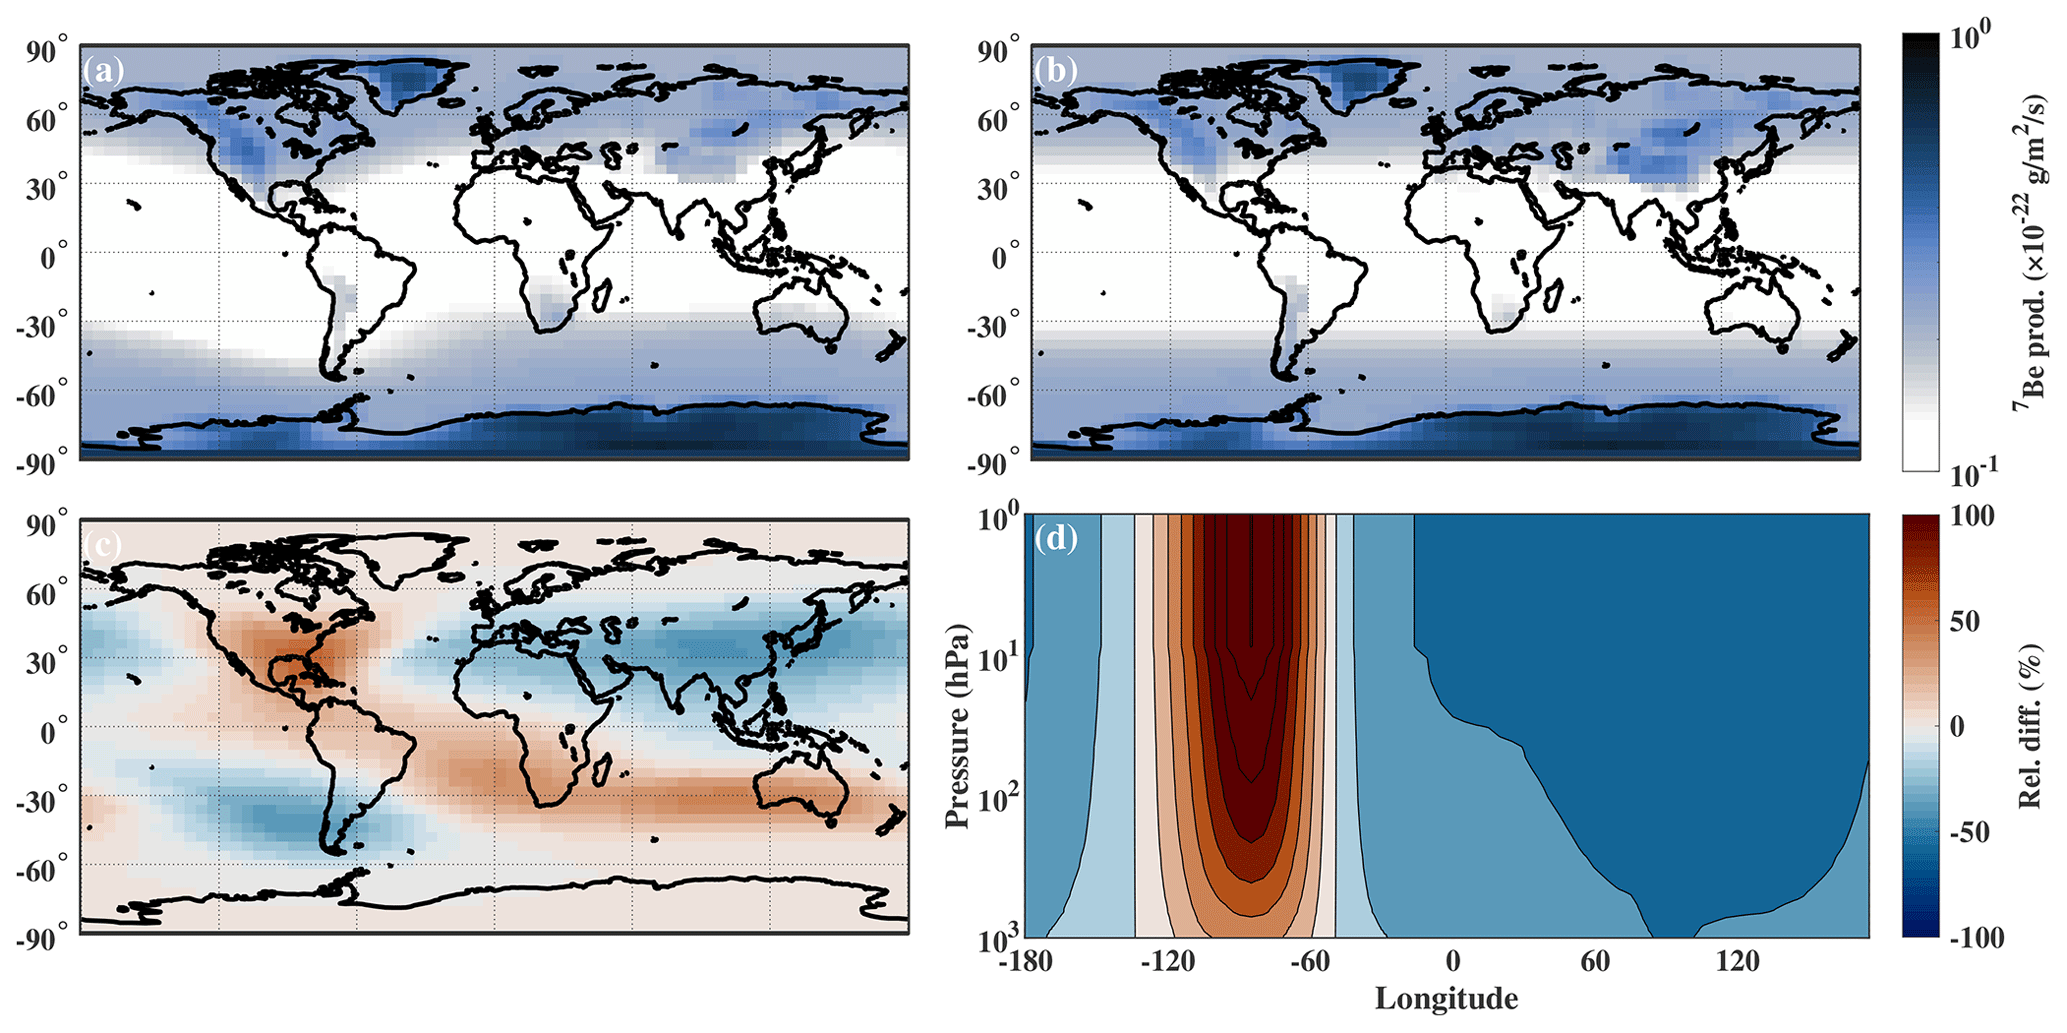
Figure 1Spatial distribution of (a) 7BeP16spa and (b) 7BeP16 production rates at 825 hPa over the period 2008–2018. (c) Relative differences (%), i.e., (7BeP16spa-7BeBeP16×100 %, between production rates with and without considering the detailed spatial cutoff rigidity. (d) Relative differences (%) of the zonal mean production rates between P16spa and P16 at 30∘ N.
Figure 1 shows the comparison between 7BeP16 and 7BeP16spa production rates for the period 2008–2018. The global production is similar for P16spa and P16 (Table S4). However, considering non-dipole moment influence on geomagnetic cutoff rigidity, 7BeP16spa and 10BeP16spa production rates in the Southern Hemisphere show production rates that are ∼11 % higher compared to the Northern Hemisphere (Table S4). This difference is not present when an axial dipole is assumed. Compared to the P16 production rate, the 7BeP16spa production rate is 30 %–40 % lower over eastern Asia and southeastern Pacific but 40 %–50 % higher over North America and from subtropical South Atlantic to Australia (Fig. 1). 10BeP16spa shows similar results to 7BeP16spa. These differences are not constant throughout the atmospheric column but generally increase with altitude (Fig. 1d).
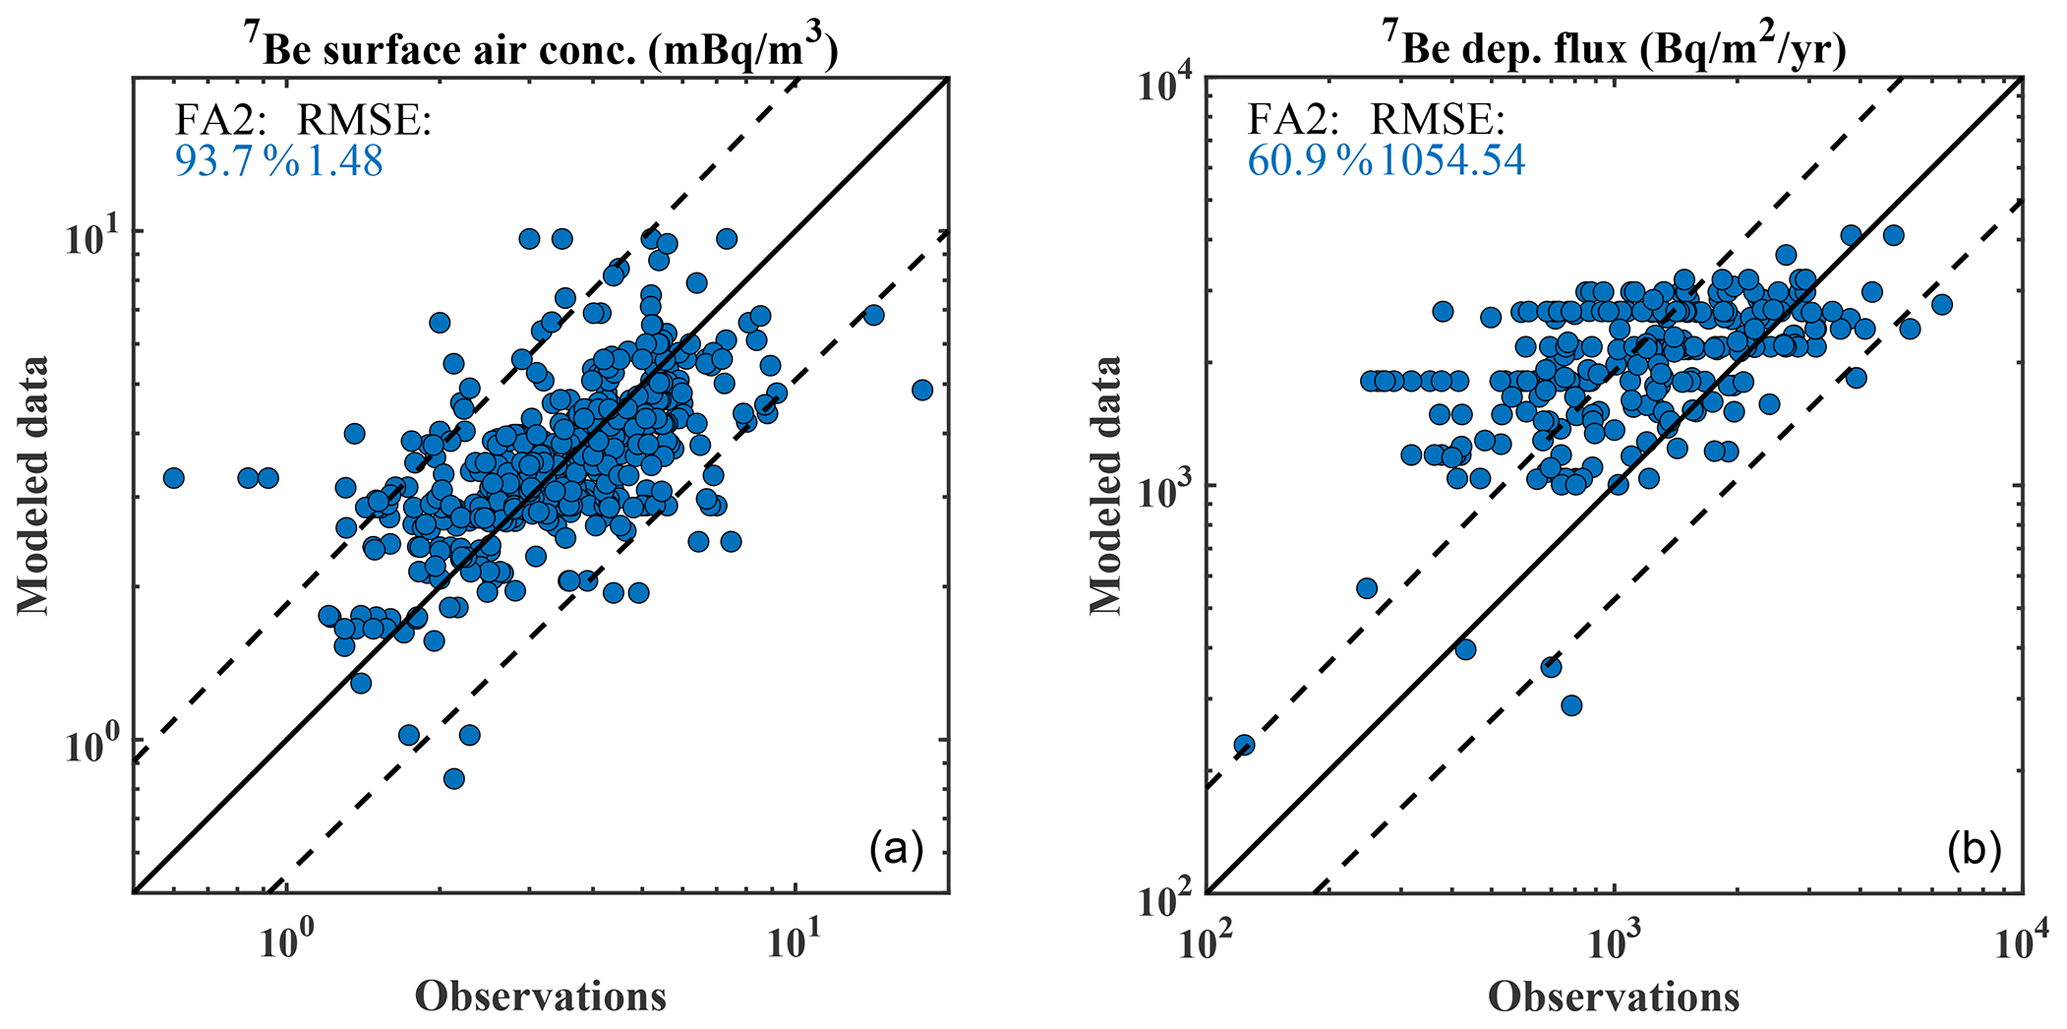
Figure 2Scatter plot of modeled 7BeP16spa versus observed 7Be surface air concentrations (a) and deposition fluxes (b). The model values are averaged over the years of 2008–2018. The dashed lines are the factor of 2 of 1:1 line (straight lines). The “FA2” label indicates the fraction of modeled concentrations within a factor of 2 of observations, while “RMSE” indicates the root mean square error.
3.2 7Be surface air concentrations and deposition fluxes
Figure 2 compares the simulated 7BeP16spa averaged over 2008–2018 with the measurements. Due to the data availability, the measurements do not necessarily cover the same period as model simulations. The model deposition fluxes here include both dry and wet deposition. About 93.7 % of modeled air 7BeP16spa concentrations agree within a factor of 2 with the observed values. The model also shows reasonable agreement with the measured deposition fluxes (60.9 % within a factor of 2), although the discrepancy between the modeled and observed deposition fluxes is larger than that for surface air concentrations. The deposition fluxes are usually less well monitored compared to the air 7Be samples and cover only shorter periods (e.g., 1 or 2 years). Further, the limited model resolution applied here may not be able to capture meteorological conditions on local scales (e.g., precipitation, convection, and tropopause folding) in some sites (e.g., Yu et al., 2018; Spiegl et al., 2022), especially for coastal regions when the sub-grid-scale orographic precipitation is important.
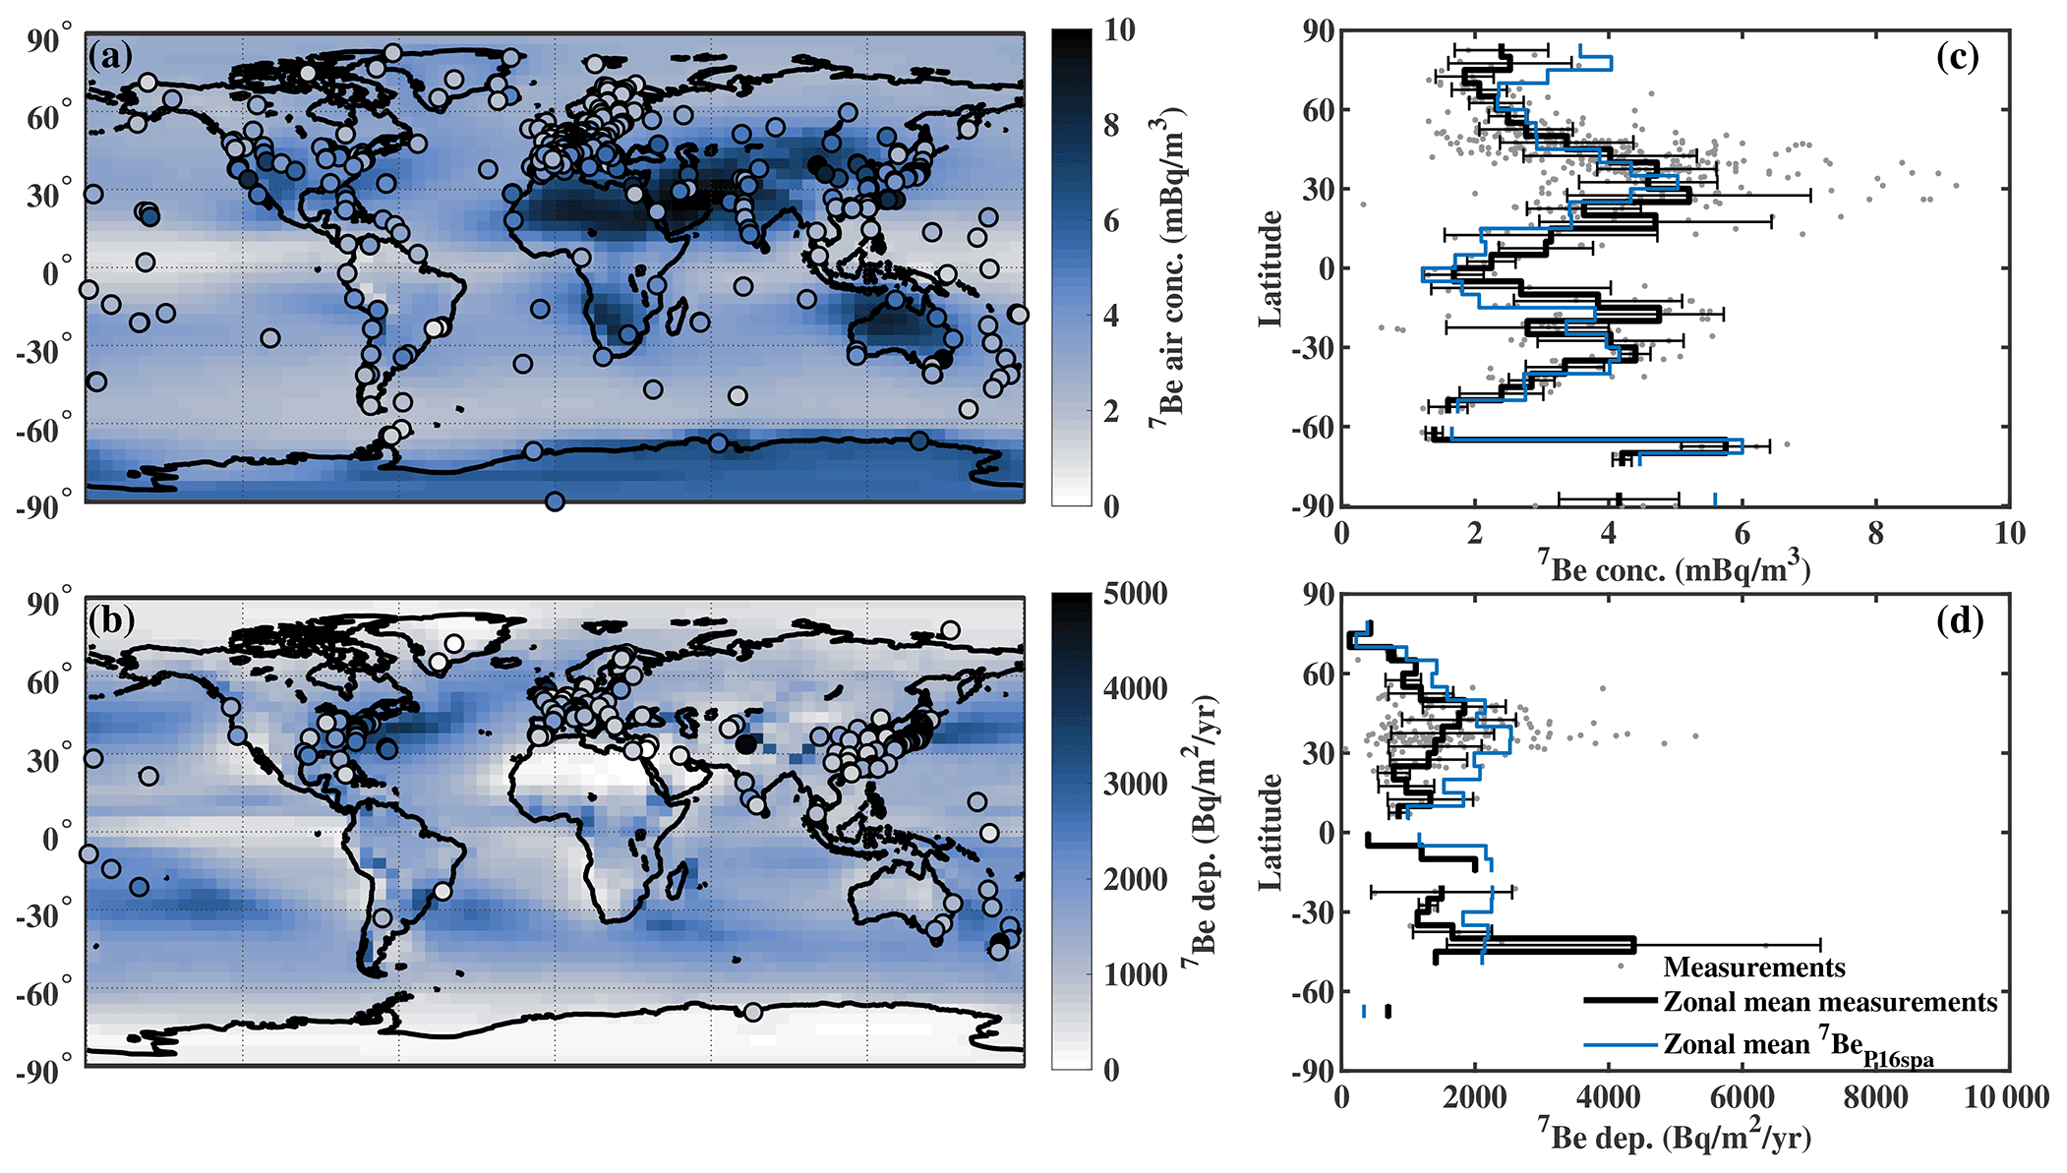
Figure 3(a) Modeled 7BeP16spa surface air concentrations (mBq m−3) and (b) deposition fluxes (Bq m−2 yr−1) averaged over the period 2008–2018. Color-coded dots denote 7Be measurements. Zonal mean of (c) observed 7Be surface air concentrations and (d) deposition fluxes (black lines, for each 5∘ latitude bin) compared with the model simulation using the P16spa production rate (blue lines). Dots are individual measurements. The error bars indicate 1 standard deviation. The outliers, defined as more than 3 scaled median absolute deviations (MADs) away from the median, are excluded from the calculation. The observations are averaged over the years available.
Figure 3 shows the spatial distribution and zonal mean of measurements in comparison with the model-simulated 7BeP16spa surface air concentrations and deposition fluxes. Generally, the model captures the spatial distribution of 7Be air concentrations and deposition fluxes. The “latitudinal pattern” of surface air 7Be concentrations differs from that of the 7Be production rate, reflecting the effects of atmospheric transport and deposition processes. The model suggests high 7Be air concentrations, mainly over the dry regions (Fig. 3a), due to low wet deposition rates (e.g., desert regions over northern Africa, Arabian Peninsula, central Australia, and central Antarctica), and over high-altitude regions (e.g., Tibetan Plateau). The model captures the observed latitudinal peaks in surface air concentrations over the subtropics and mid-latitudes (Fig. 3c around 30–40∘ N and 30–40∘ S). These peaks are consistent with the high stratospheric contribution (25 %–30 %) at mid-latitudes (Fig. S4). The model overestimates 7Be air concentrations over the Arctic (70–90∘ N; Fig. 3c) by about 30 %–40 %. By contrast, high 7Be deposition fluxes are observed at mid-latitudes due to the influence of the high precipitation (wet deposition) and strong stratosphere–troposphere exchange (Fig. 3d). In the Northern Hemisphere, the model-simulated deposition fluxes peak at a lower latitude (∼30∘ N) relative to the observations (∼45∘ N). These modeled spatial distributions of the air concentrations and deposition rates of 7Be also agree generally well with previous model simulations (e.g., Heikkilä and Smith, 2012).
The modeled 7BeP16spa air concentrations show better agreements (smaller RMSE and higher FA2 values) with the measurements in comparison to 7BeLP67 (Fig. S5). 7BeLP67 tends to overestimate the absolute values of 7Be concentrations. This is caused by (i) the overestimation of the 7Be production rate by LP67 for a given solar modulation function and (ii) the use of a simple scale factor to account for the solar modulation influence on the LP67 7Be production rate.
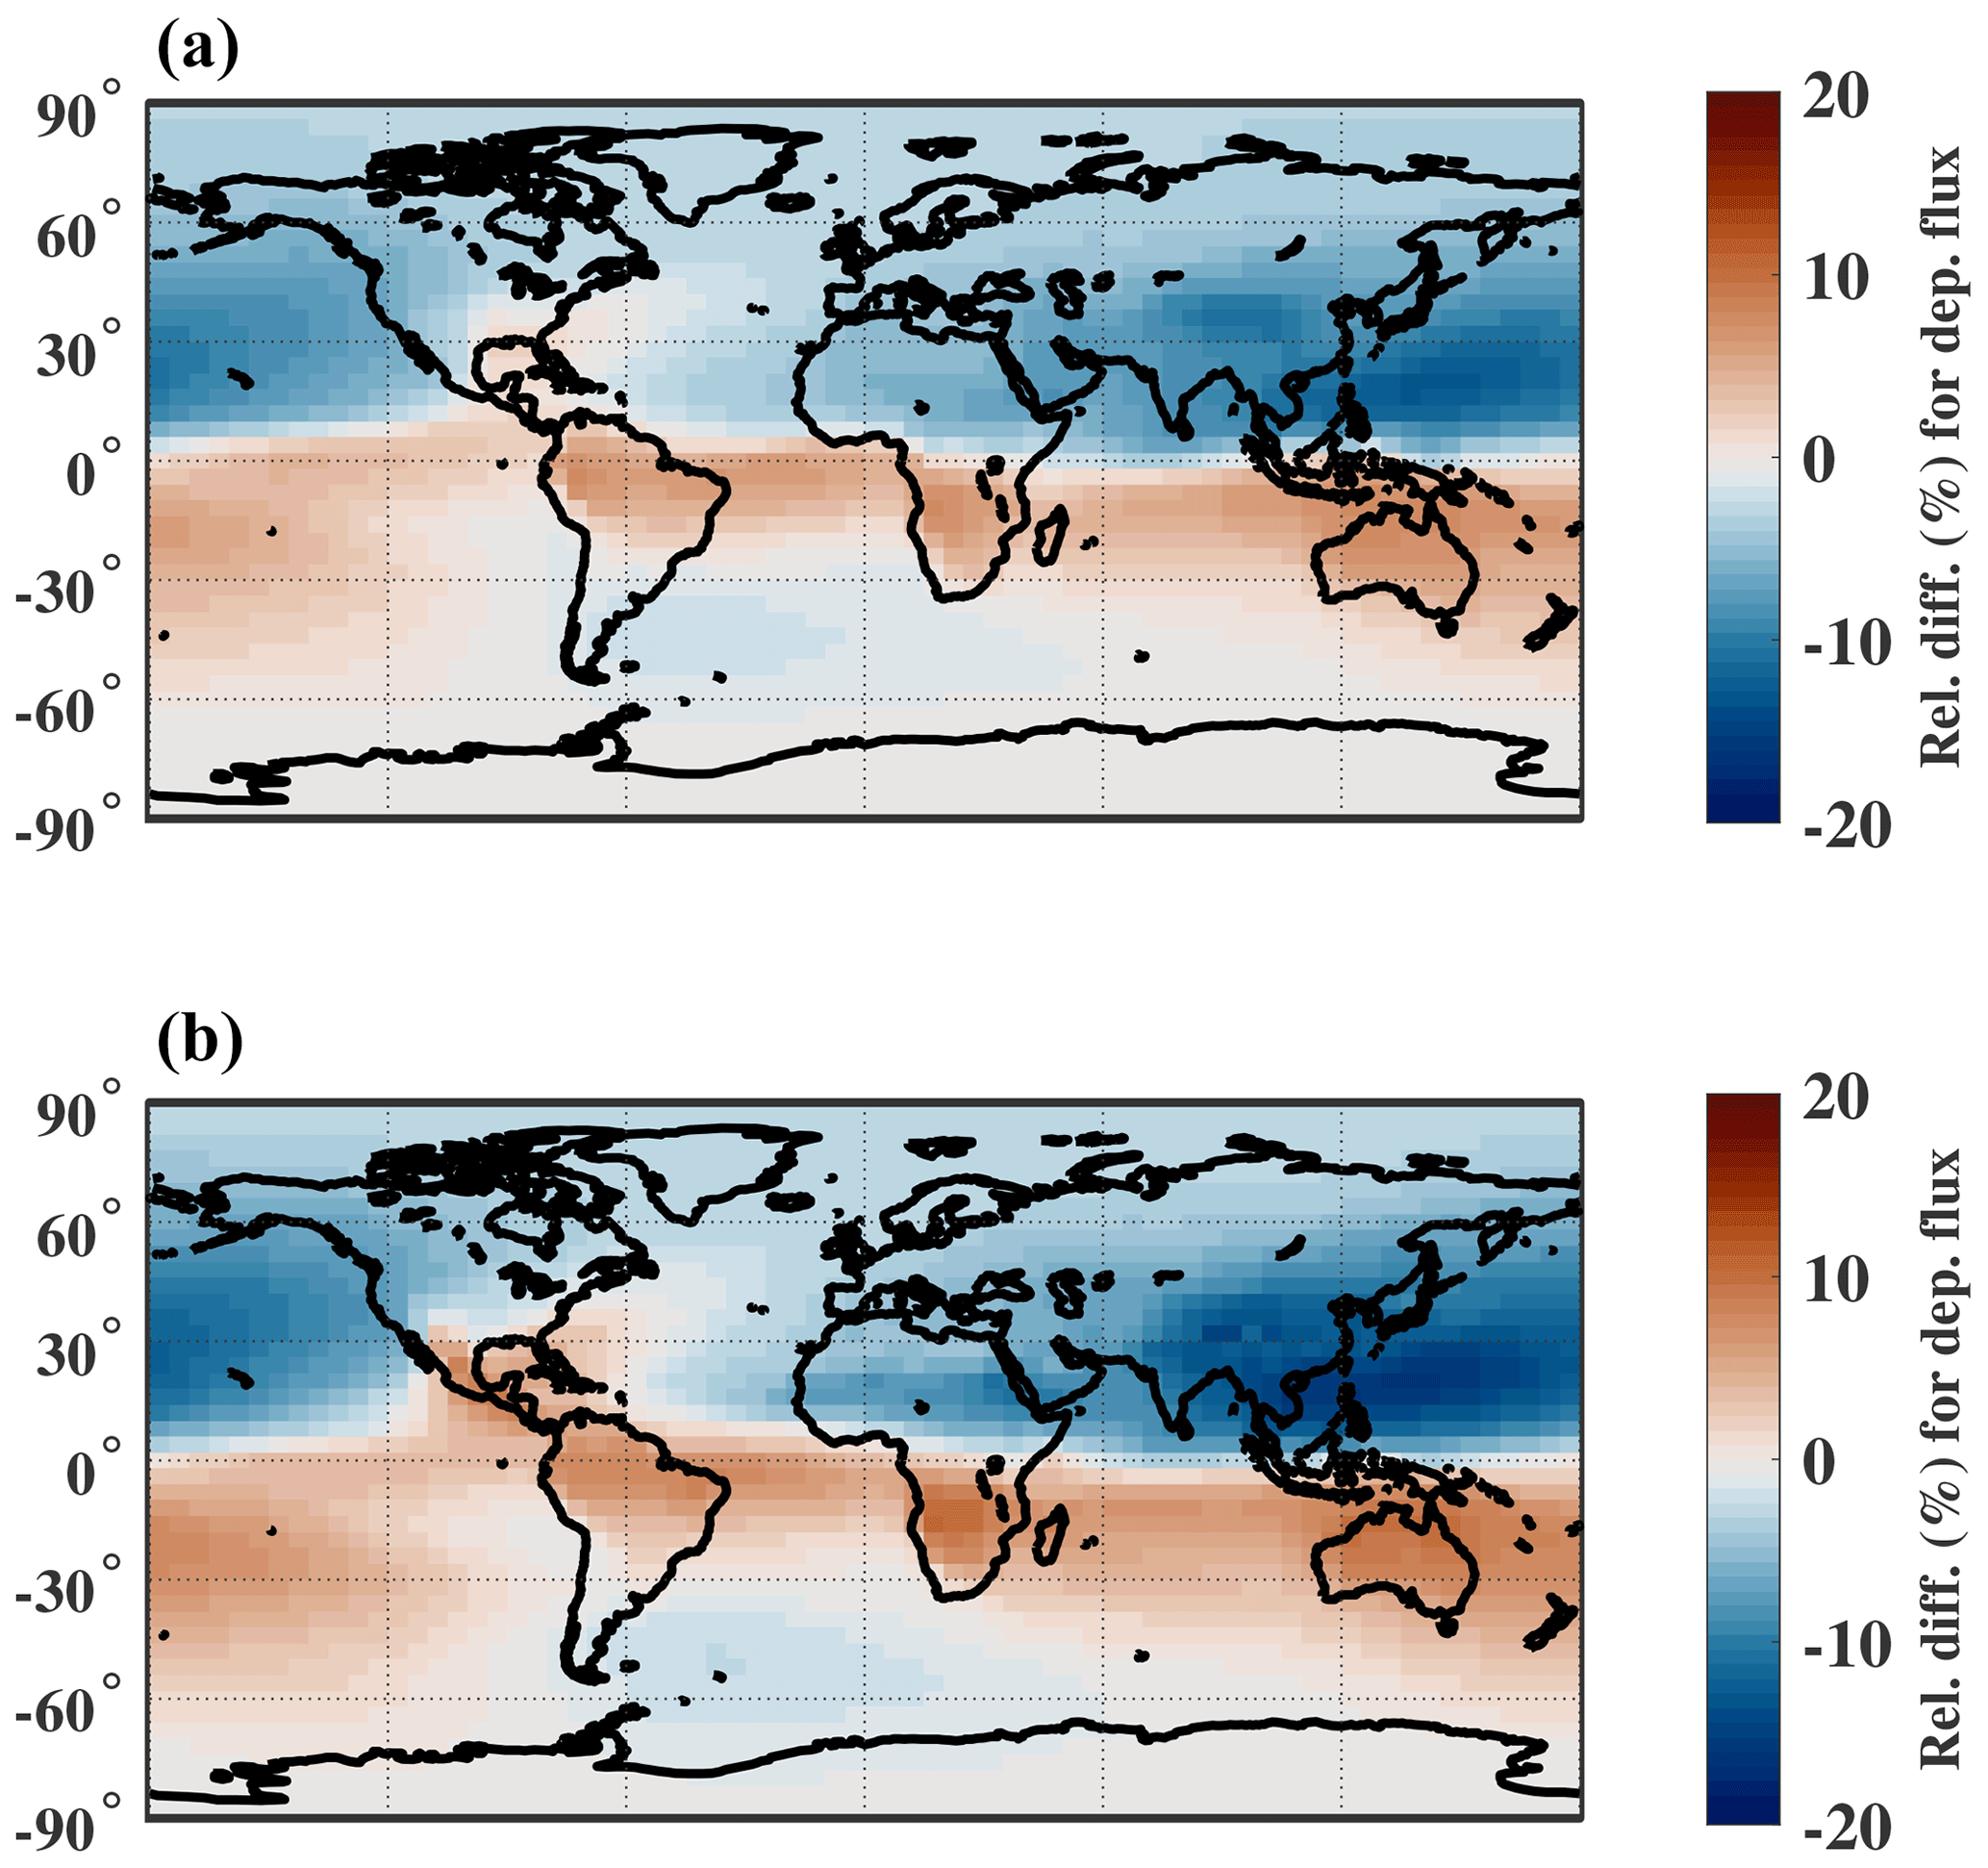
Figure 4Relative differences (percentage) of surface air concentrations (a) and deposition fluxes (b) between 7BeP16spa and 7BeP16 for the period 2008–2018, i.e., (7BeP16spa-7BeBeP16×100 %.
We also examine whether using the dipole approximation of the cutoff rigidity or real cutoff rigidity (P16 and P16spa, respectively) in the production model leads to significantly different results (Fig. 4). Although large regional differences (up to 40 %–50 %, Fig. 1) in the production model are observed between P16spa and P16 production rates, such differences are reduced in surface air concentrations and deposition fluxes due to transport and deposition processes, as expected. The 7BeP16sap air concentrations show higher values (∼7 %) over 10–40∘ S and lower values (∼12 %) over the East Asian region (Fig. 4a) compared to 7BeP16. These differences are higher for the deposition fluxes, up to 10 % higher over the 10–40∘ S and up to 18 % lower over the east Asian region (Fig. 4b). Since the total deposition flux reflects precipitation scavenging through the tropospheric column, it tends to be more sensitive to 7Be air concentrations at higher altitudes and downward transport of 7Be from the stratosphere. Indeed, model results suggest that deposition fluxes have a higher stratospheric fraction compared to surface air concentrations (Fig. S4), as previously shown by Liu et al. (2016). The 7BeP16spa deposition fluxes show better agreement with measurements than those of 7BeP16 (Fig. S5). The comparison for 10Be shows similar results to 7Be except with less than 10 % difference. For 10Be deposition fluxes in Antarctica and Greenland, this influence is less than 3 %. This is because the dominant contribution of 10Be is from the stratosphere where the hemispheric production differences are diminished by the long stratospheric residence time of 10Be. However, it does not suggest that the cutoff rigidity including the non-dipole influence could be ignored for 10Be deposition in polar regions, as the spatial pattern of cutoff rigidities was very different in the past, e.g., during the Laschamps geomagnetic field minimum around 41 000 years before the present (Gao et al., 2022). Further studies are warranted to investigate this spatial cutoff rigidity influence on 10Be in more detail.
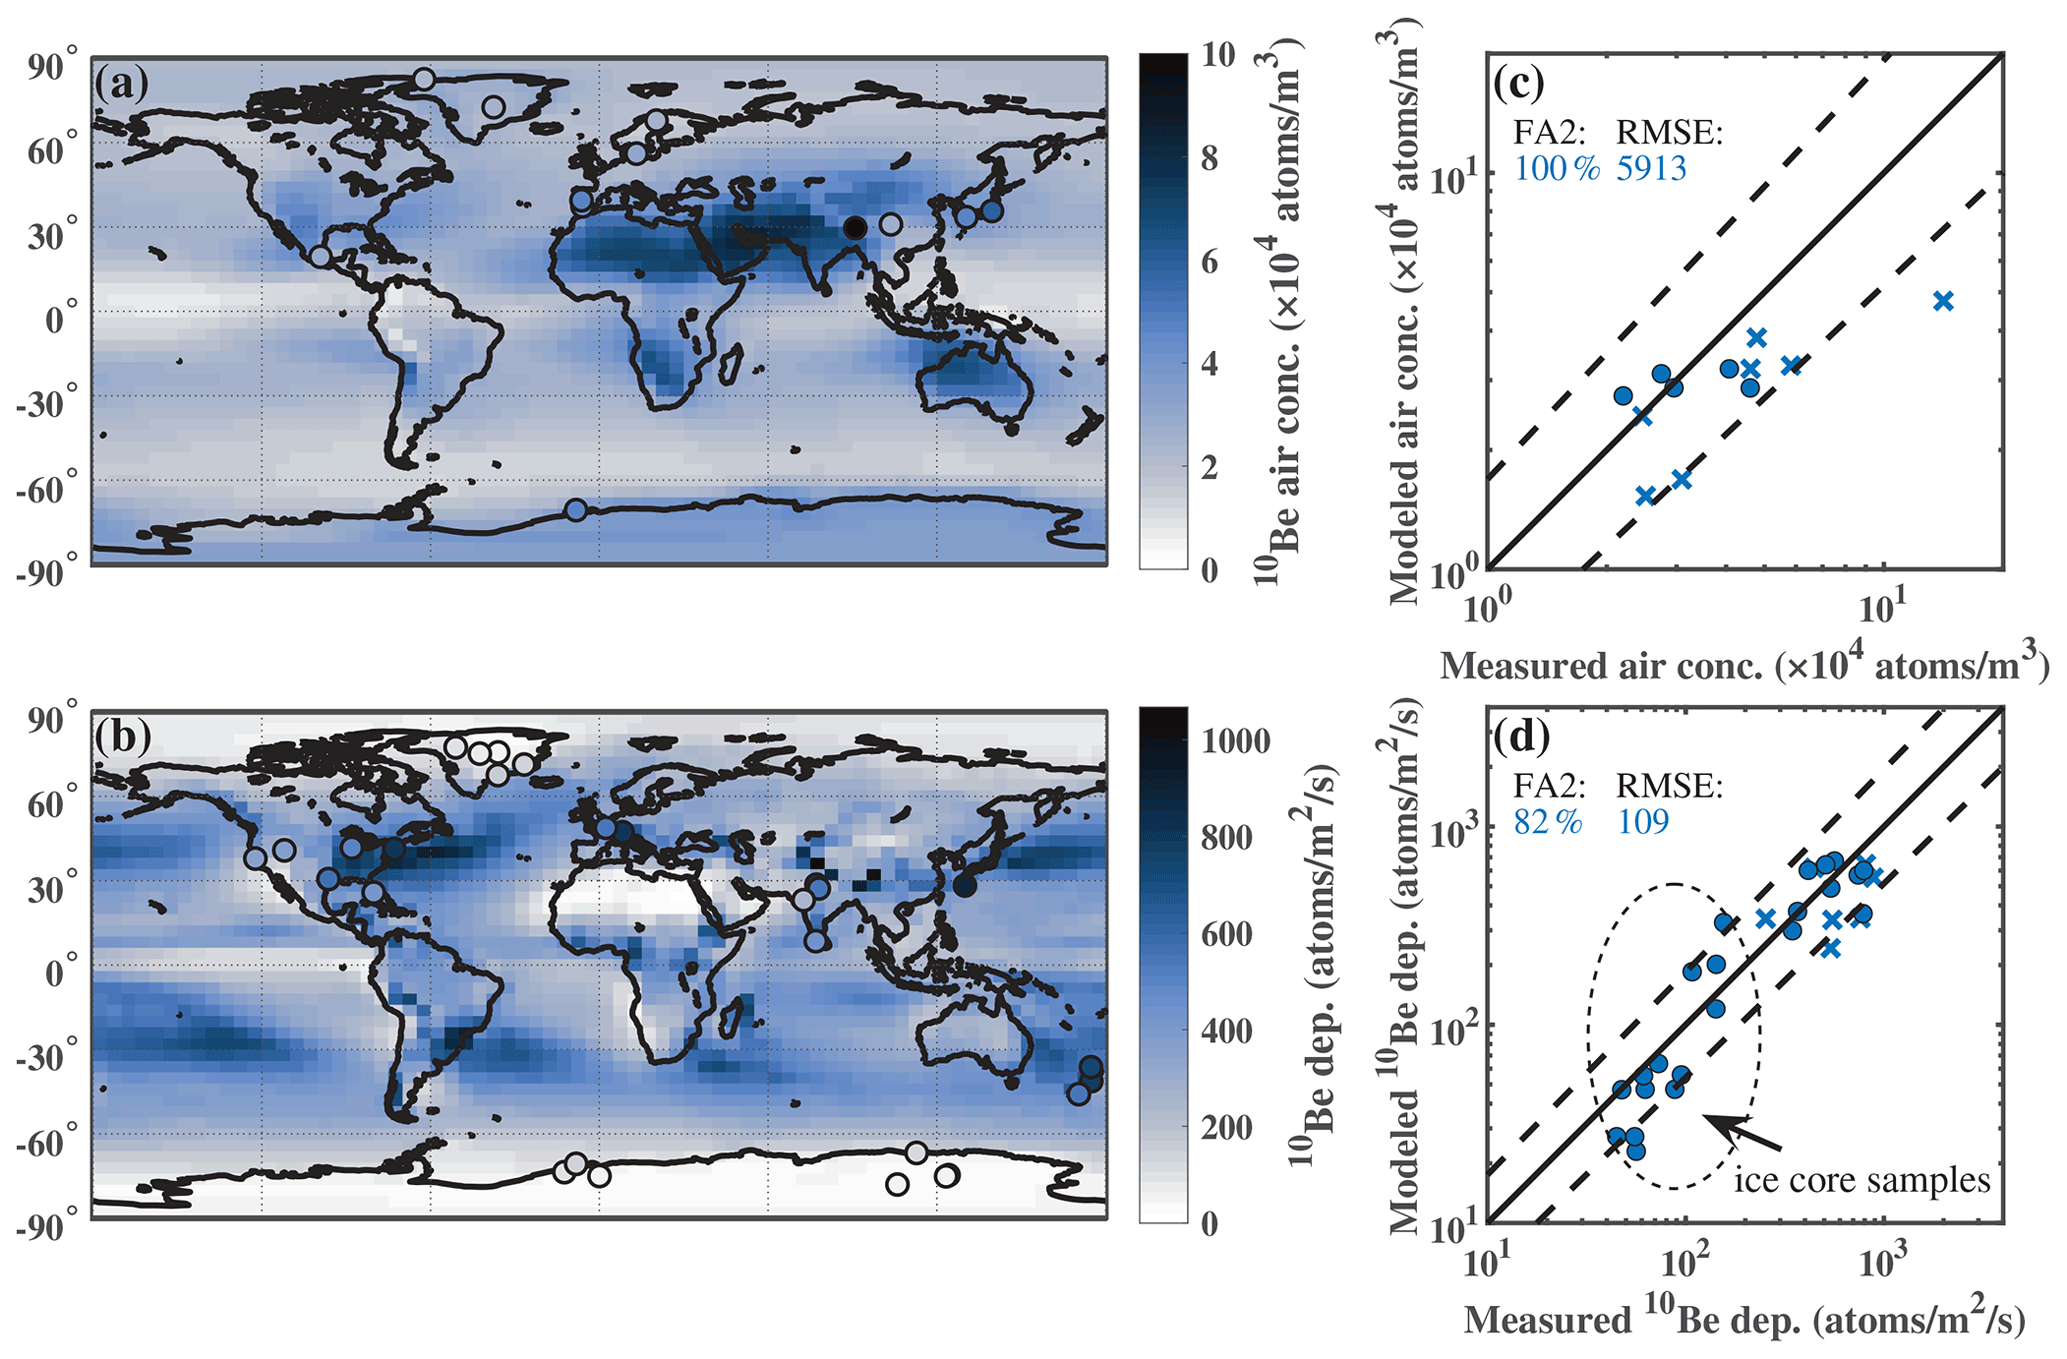
Figure 5Modeled annual mean 10BeP16spa (a) surface air concentrations and (b) deposition fluxes averaged over 2008–2018 overplotted with measurements (color-coded dots). (c–d) Scatter plot between model results and measurements for (c) surface air concentrations and (d) deposition fluxes. The dots in (c–d) indicate measurements with careful examination of dust 10Be contributions or from the polar regions which are not influenced by dust 10Be. The crosses indicate the samples without examining dust contributions. The FA2 and RMSE are calculated only using the dust-free samples (dots). Blue and orange colors indicate the results using P16spa and LP67 production rates, respectively.
3.3 10Be surface air concentrations and deposition fluxes
Figure 5 shows the comparison between modeled annual mean 10BeP16spa surface air concentrations (or deposition fluxes) averaged over 2008–2018 and measurements. The 10BeP16spa shows similar spatial distributions as 7BeP16spa because both radionuclides share the same transport and deposition processes. The model underestimates the measured 10Be surface air concentrations and deposition fluxes at some sites (Fig. 5b, d). This may be attributed to the influence of resuspended dust with 10Be attached, which could typically contribute 10 %–35 % to the air 10Be concentrations (Monaghan et al., 1986). It should be mentioned that 7Be decays in the dust because of its short half-life and therefore does not contribute to the surface air 7Be concentrations. Indeed, data for which a careful examination of the recycled dust 10Be in samples was conducted (e.g., Monaghan et al., 1986) or from locations that are less influenced by recycled dust 10Be (e.g., polar regions; dots in Fig. 5b–d) show better agreement with the model simulations. This suggests the importance of considering the dust contribution when measuring the air 10Be samples. The model also shows relatively good agreement with most 10Be deposition data from polar ice cores (marked as dots in Fig. 5d) within a factor of 2.
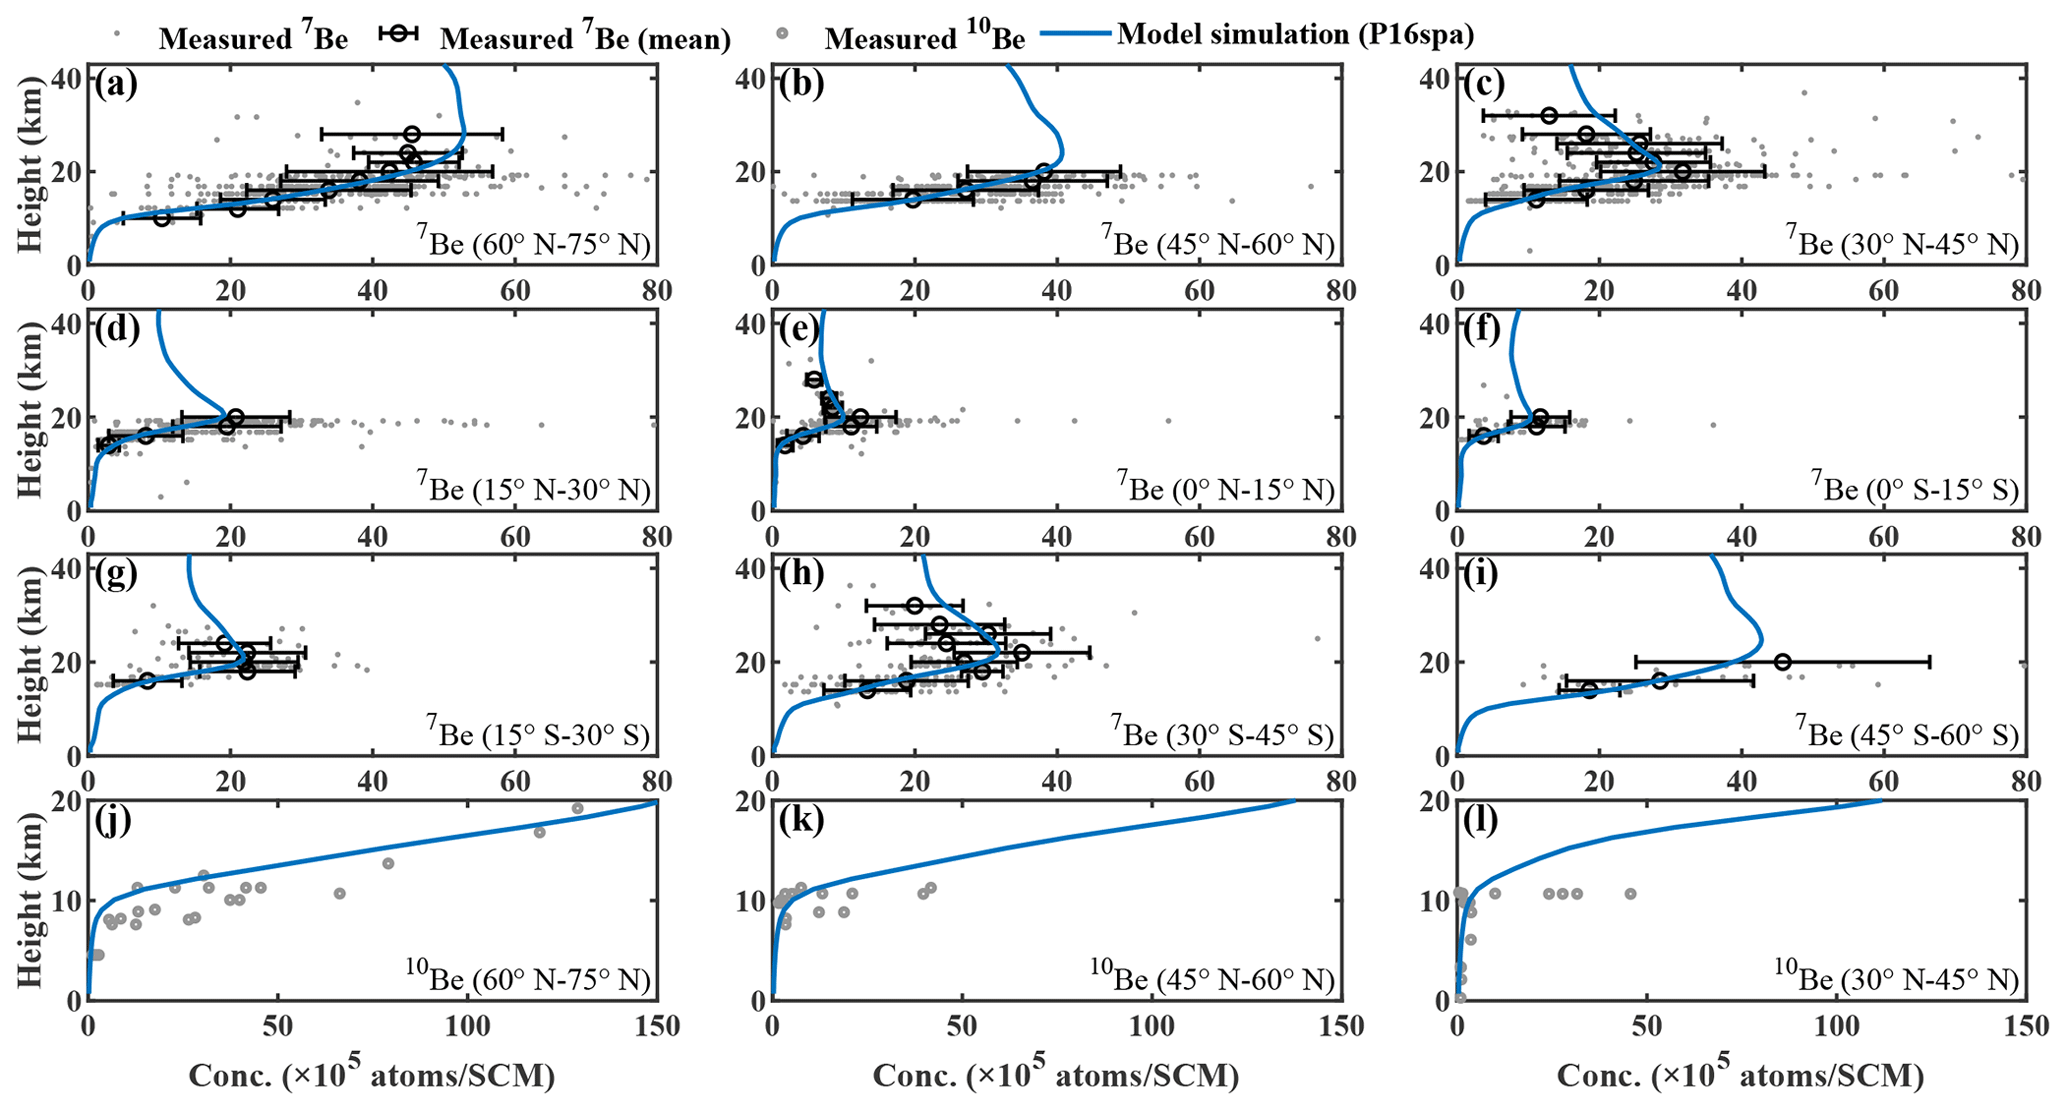
Figure 6Comparison of the vertical profile between measurements (circles) and model zonal mean 7BeP16spa and 10BeP16spa concentrations for each latitudinal band (15∘) over the period 2008–2018. The 7Be (circle with error bar) observations (from the EML/HASP) are averaged for the altitude band of every 2 km where more than five samples are available. We exclude the outlier from the calculation, which is defined as more than 3 scaled median absolute deviations (MADs) away from the median. The 10Be profile measurements are mainly taken from Dibb et al. (1992, 1994) and Jordan et al. (2003).
3.4 Vertical profiles of 7Be and 10Be
Figure 6 shows the simulated annual zonal mean vertical profiles of 7BeP16spa and 10BeP16spa concentrations compared with those from aircraft measurements in the troposphere and stratosphere from the EML/HASP. The measurements cover different regions and specific meteorological conditions; hence they should only provide a range in which the model results should lie. Following previous modeling studies (Heikkilä et al., 2008b; Koch et al., 1996), we compare model zonal mean values in each 15∘ latitude band with the corresponding observations.
The simulated 7BeP16spa profiles agree well with the measurements, especially capturing the peaks at ∼20–22 km at mid-latitudes and low latitudes (e.g., Fig. 6c, e, h). The feature that 7Be increases with altitude without a peak at 22 km at northern high latitudes (60–75∘ N) is also captured by the model (Fig. 6a). The 7BeP16spa shows high concentrations in the polar stratosphere and low values over the equatorial stratosphere (Fig. S6), mainly reflecting the latitudinal distribution of the production. This “latitudinal structure” is modulated for 10BeP16spa in the stratosphere as 10Be is better mixed than 7Be due to its slow decay, together with a relatively long residence time in the stratosphere (Waugh and Hall, 2002). Both 7Be and 10Be show very low concentrations in the tropical upper troposphere, reflecting the frequent injection of air from the lower troposphere in wet convective updrafts, where aerosols are efficiently scavenged (Fig. S6).
The model also reasonably simulated 10Be vertical profiles compared with observations, with a tendency to underestimate observations in the stratosphere (Fig. 6j–l). A previous general circulation model study by Heikkilä et al. (2008b) also showed model stratospheric 10Be that is too low compared to measurements. They attributed this underestimation to too short a stratospheric air residence time in the model, which prevents 10Be concentrations from sufficiently accumulating in the stratosphere. However, this may not be the case in our study, as the stratospheric air residence time in the MERRA-2 reanalysis agrees reasonably with the observations (Chabrillat et al., 2018). Another explanation is that the 10Be production rate may be underestimated in the stratosphere. 7Be is less affected by this process than 10Be because of its short half-life compared to its stratospheric residence time (Delaygue et al., 2015).
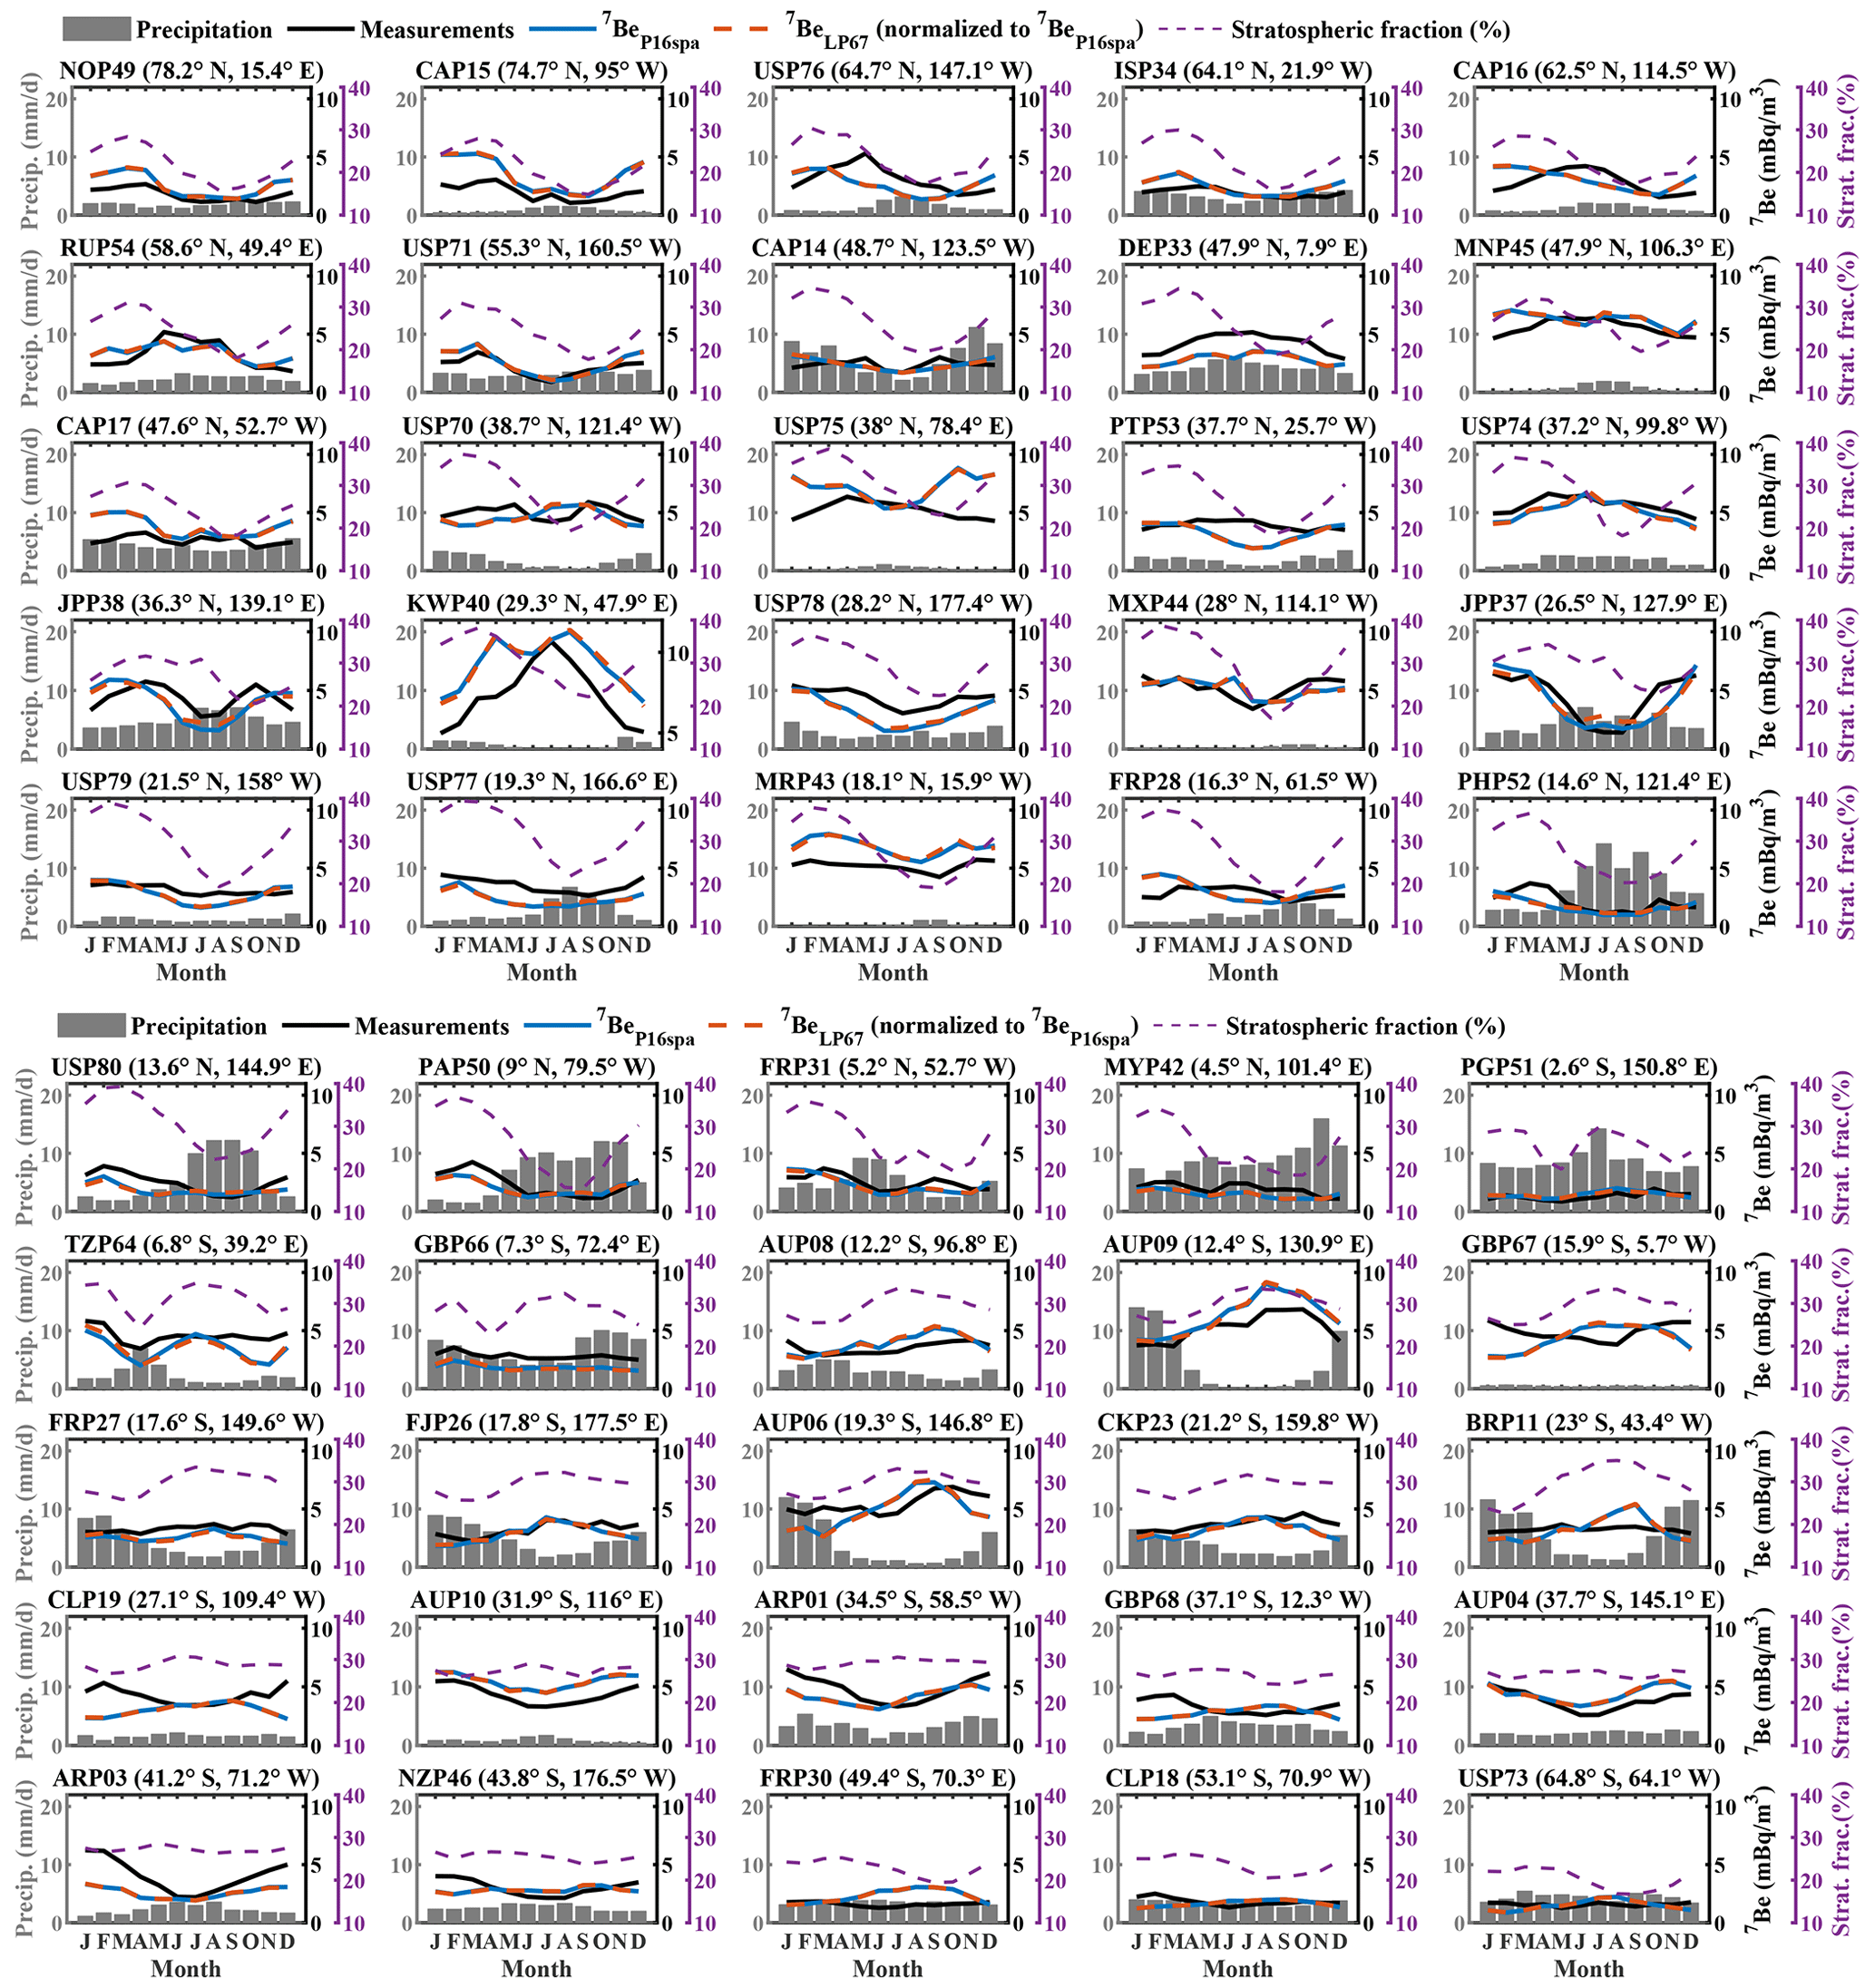
Figure 7Seasonal cycle of simulated and measured surface air 7Be concentrations, MERRA-2 total precipitation (4∘ × 5∘, bar graph), and modeled stratospheric contributions to surface air. The plots are arranged based on the site latitudes. The model results using the LP67 production rate are normalized to the ones using the P16spa production rate.
3.5 Global budgets and residence time
Table 1 shows the global budgets for 7BeP16spa and 10BeP16spa over the period of 2008–2018. About 22.1 % of tropospheric 7BeP16spa is lost by radioactive decay, 75.8 % by convective and large-scale precipitation, and 2.1 % by dry deposition. The wet deposition contributes to about 97 % of total deposition for 7BeP16spa and 10BeP16spa (Table 1; Fig. S7), which is slightly higher than the ∼93 % contribution in previous model studies (Heikkilä et al., 2008b; Koch et al., 1996; Spiegl et al., 2022). The global mean tropospheric residence time of 7BeP16spa is about 21 d, which is comparable to that reported by previous model studies: 18 d by Heikkilä et al. (2008b) and 21 d by Koch et al. (1996) and Liu et al. (2001). This also agrees with the residence time of about 22–35 d estimated from the observed deposition fluxes and air concentrations at 30–75∘ N (Bleichrodt, 1978). The averaged tropospheric residence time of 10BeP16spa is about 24 d, which is consistent with the 20 d suggested by Heikkilä et al. (2008b).
Table 1Global budgets of 7Be and 10Be averaged from 2008 to 2018 in GEOS-Chem using P16spa.
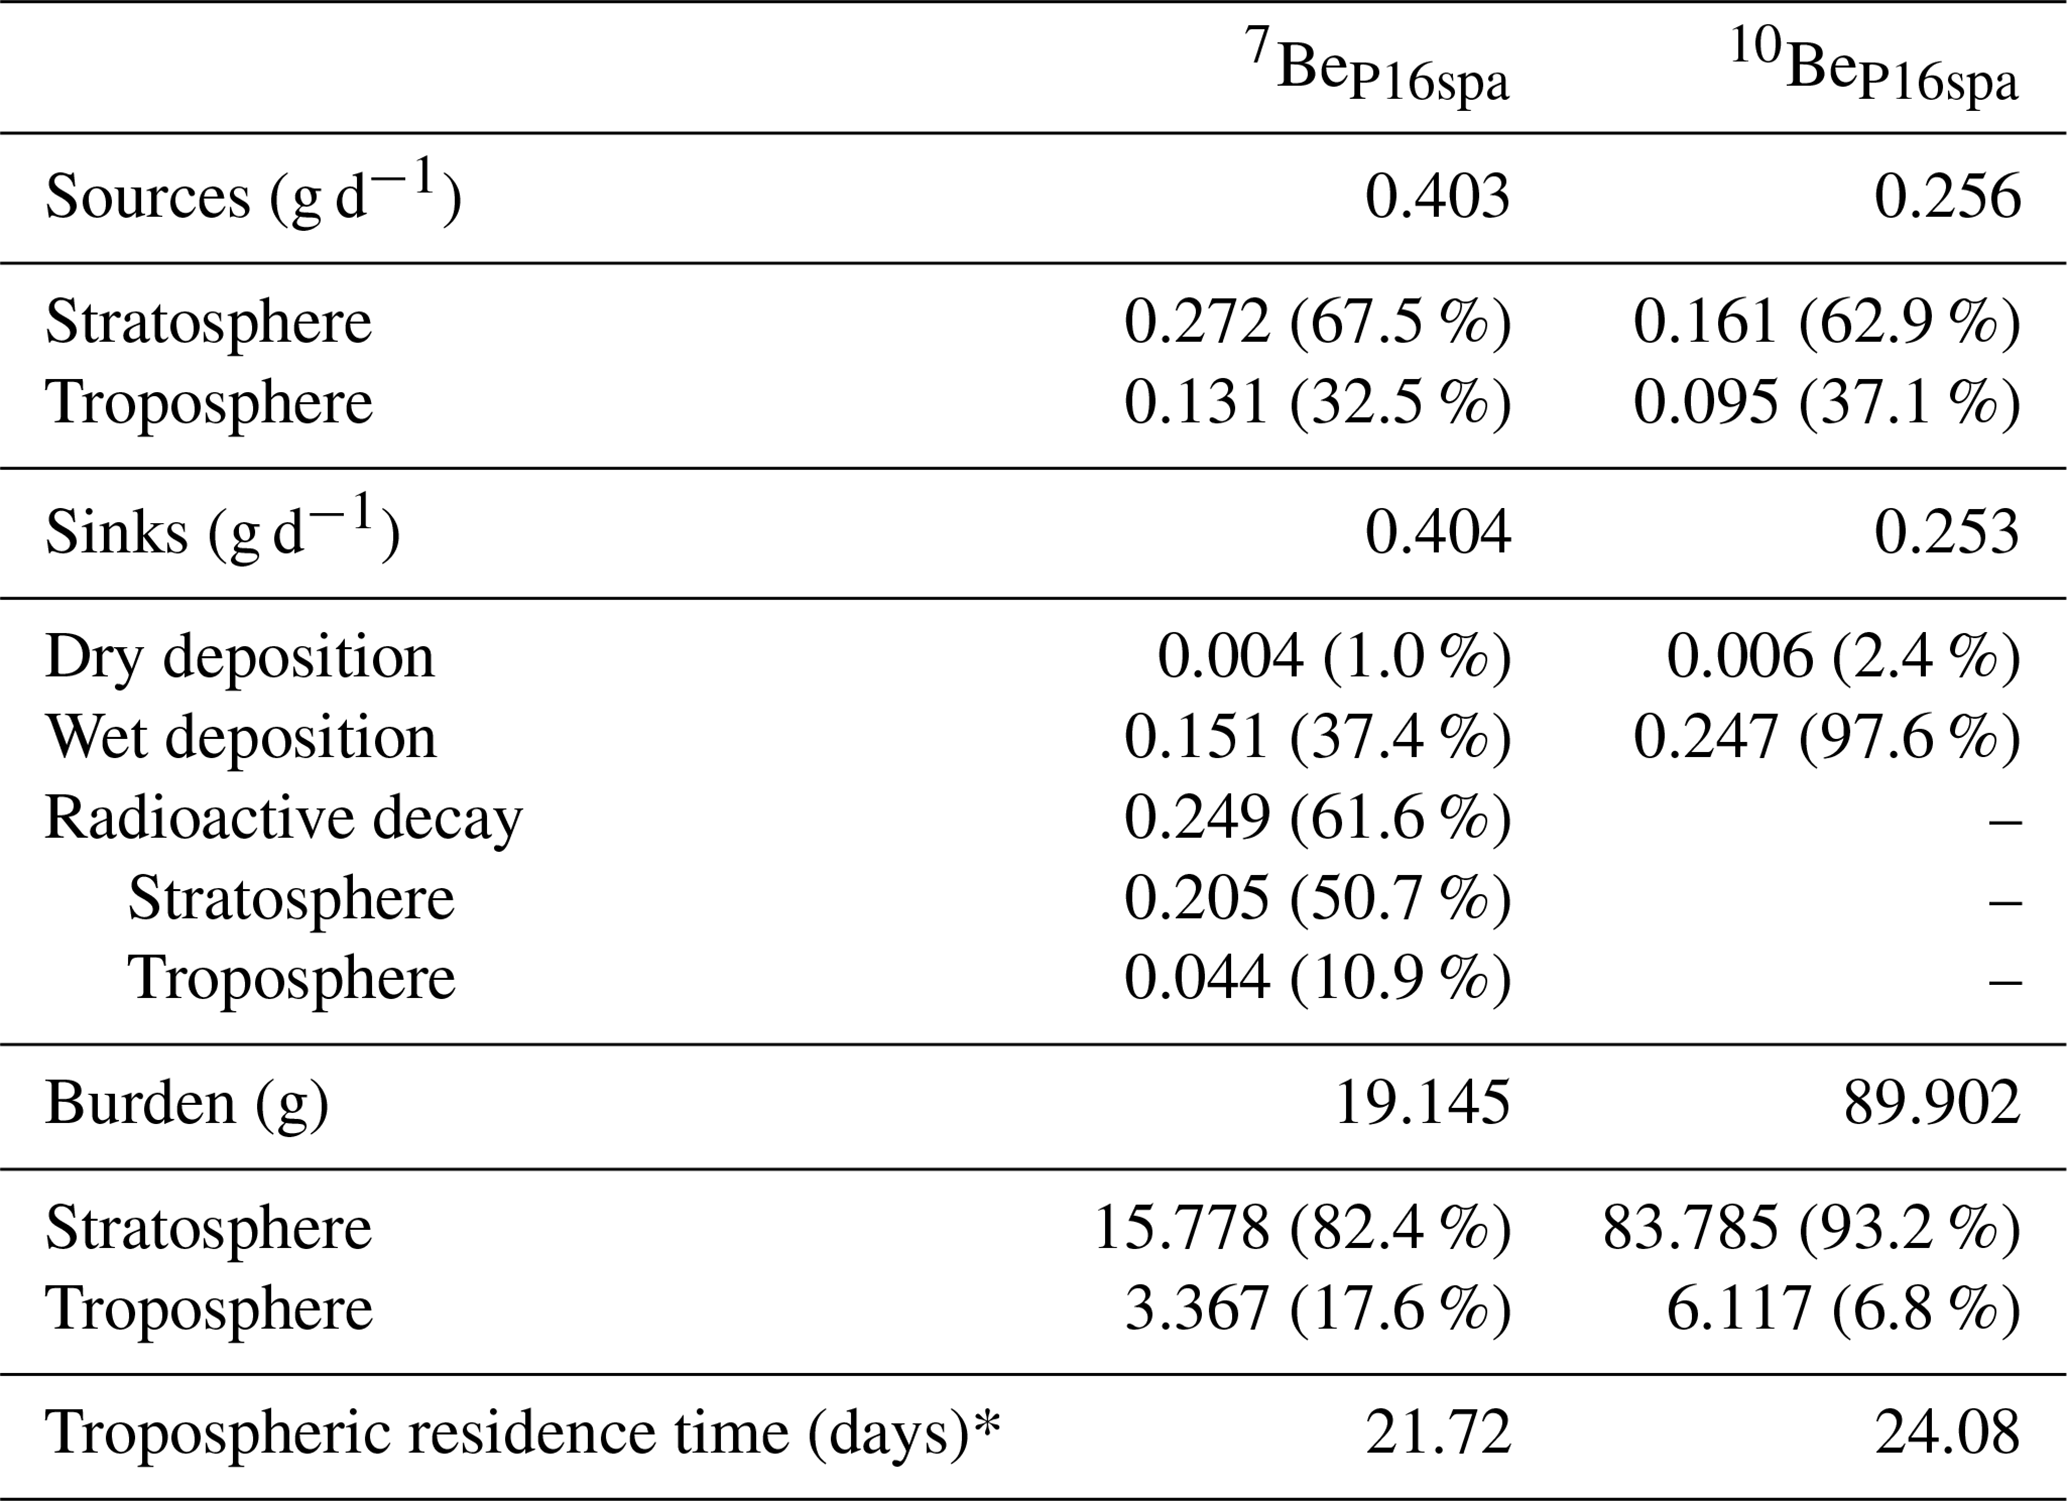
* Against deposition only.
3.6 Seasonality in 7Be and 10Be
The seasonality of 7Be is influenced by (a) the amount of precipitation, (b) the stratosphere–troposphere exchange processes, and (c) the vertical transport of 7Be in the troposphere. The roles of these factors may vary depending on location. We compare the seasonal variations of modeled 7BeP16spa and 7BeLP67 concentrations with measurements from a dataset compiled by Terzi and Kalinowski (2017), with the data covering more than 6 years (Fig. 7). It should be noted that the model 7Be results and MERRA-2 precipitation rates are averaged over the years of 2008–2018, while the measurements are based on the data availability over the period 2001–2015.
In the Southern Hemisphere from 25–40∘ S, the 7Be concentration peak is observed in austral summer (December–February), resulting from the combined influence of stratospheric intrusions and strong vertical transport during this season (Villarreal et al., 2022; Zheng et al., 2021b; Koch et al., 1996). The summer peak is also observed at northern mid-latitudes. This “summer peak” feature is well simulated by the model at some sites (e.g., KWP40 (29.3∘ N, 47.9∘ E), AUP04 (37.7∘ S, 145.1∘ E) and AUP10 (31.9∘ S, 116∘ E) shown in Fig. 7) but not at others (e.g., GBP68 (37.1∘ S, 12.3∘ W) and PTP53 (37.7∘ N, 25.7∘ W) in Fig. 7). This may not be related to stratospheric intrusion in the model as the simulated stratospheric contributions (Fig. S4) agree fairly well with estimates inferred from measurements, i.e., ∼25 % on annual average at northern mid-latitude surface (Dutkiewicz and Husain, 1985; Liu et al., 2016). Hence this could be due to the errors in vertical transport (e.g., convection) during the summer season.
The sites at northern high latitudes (>50∘ N) show spring peaks that are well simulated by the model (e.g., ISP3 (64.1∘ N, 21.9∘ W)). This spring peak coincides with high stratospheric contributions, reflecting the influence of stratospheric intrusions. The influence of precipitation changes is also seen at several sites, especially in locations with high precipitation rates (e.g., monsoon regions). For example, two sites from Japan (JPP38 (36.3∘ N, 139.1∘ E) and JPP37 (26.5∘ N, 127.9∘ E) in Fig. 7) show summer minima coinciding with the high precipitation, even with relatively high stratospheric contributions in the same month.
The seasonal variation of stratospheric contribution is quite similar for the sites located in the Northern Hemisphere, with a high contribution in spring and a low contribution in fall. This is consistent with the estimates based on air samples that indicate stratospheric contributions varying from ∼40 % in spring to ∼15 % in fall at latitudes 38–51∘ N (Dutkiewicz and Husain, 1985).
Generally, the model simulates the annual cycle of surface air 7Be concentrations well for most sites in terms of amplitude and seasonality (Fig. 7). For a few sites (e.g., DEP33 (47.9∘ N, 7.9∘ E)), the model captures the observed seasonality but not the correct absolute values. This could be partly due to the coarse resolution of the model. The 7BeLP67 is normalized to 7BeP16spa as we focus on the comparison of seasonal variability between these simulations. The very similar features (differences within 1 %) between all simulations using different production rates indicate a dominant influence of the meteorological conditions on the seasonal variations of the air 7Be concentrations.
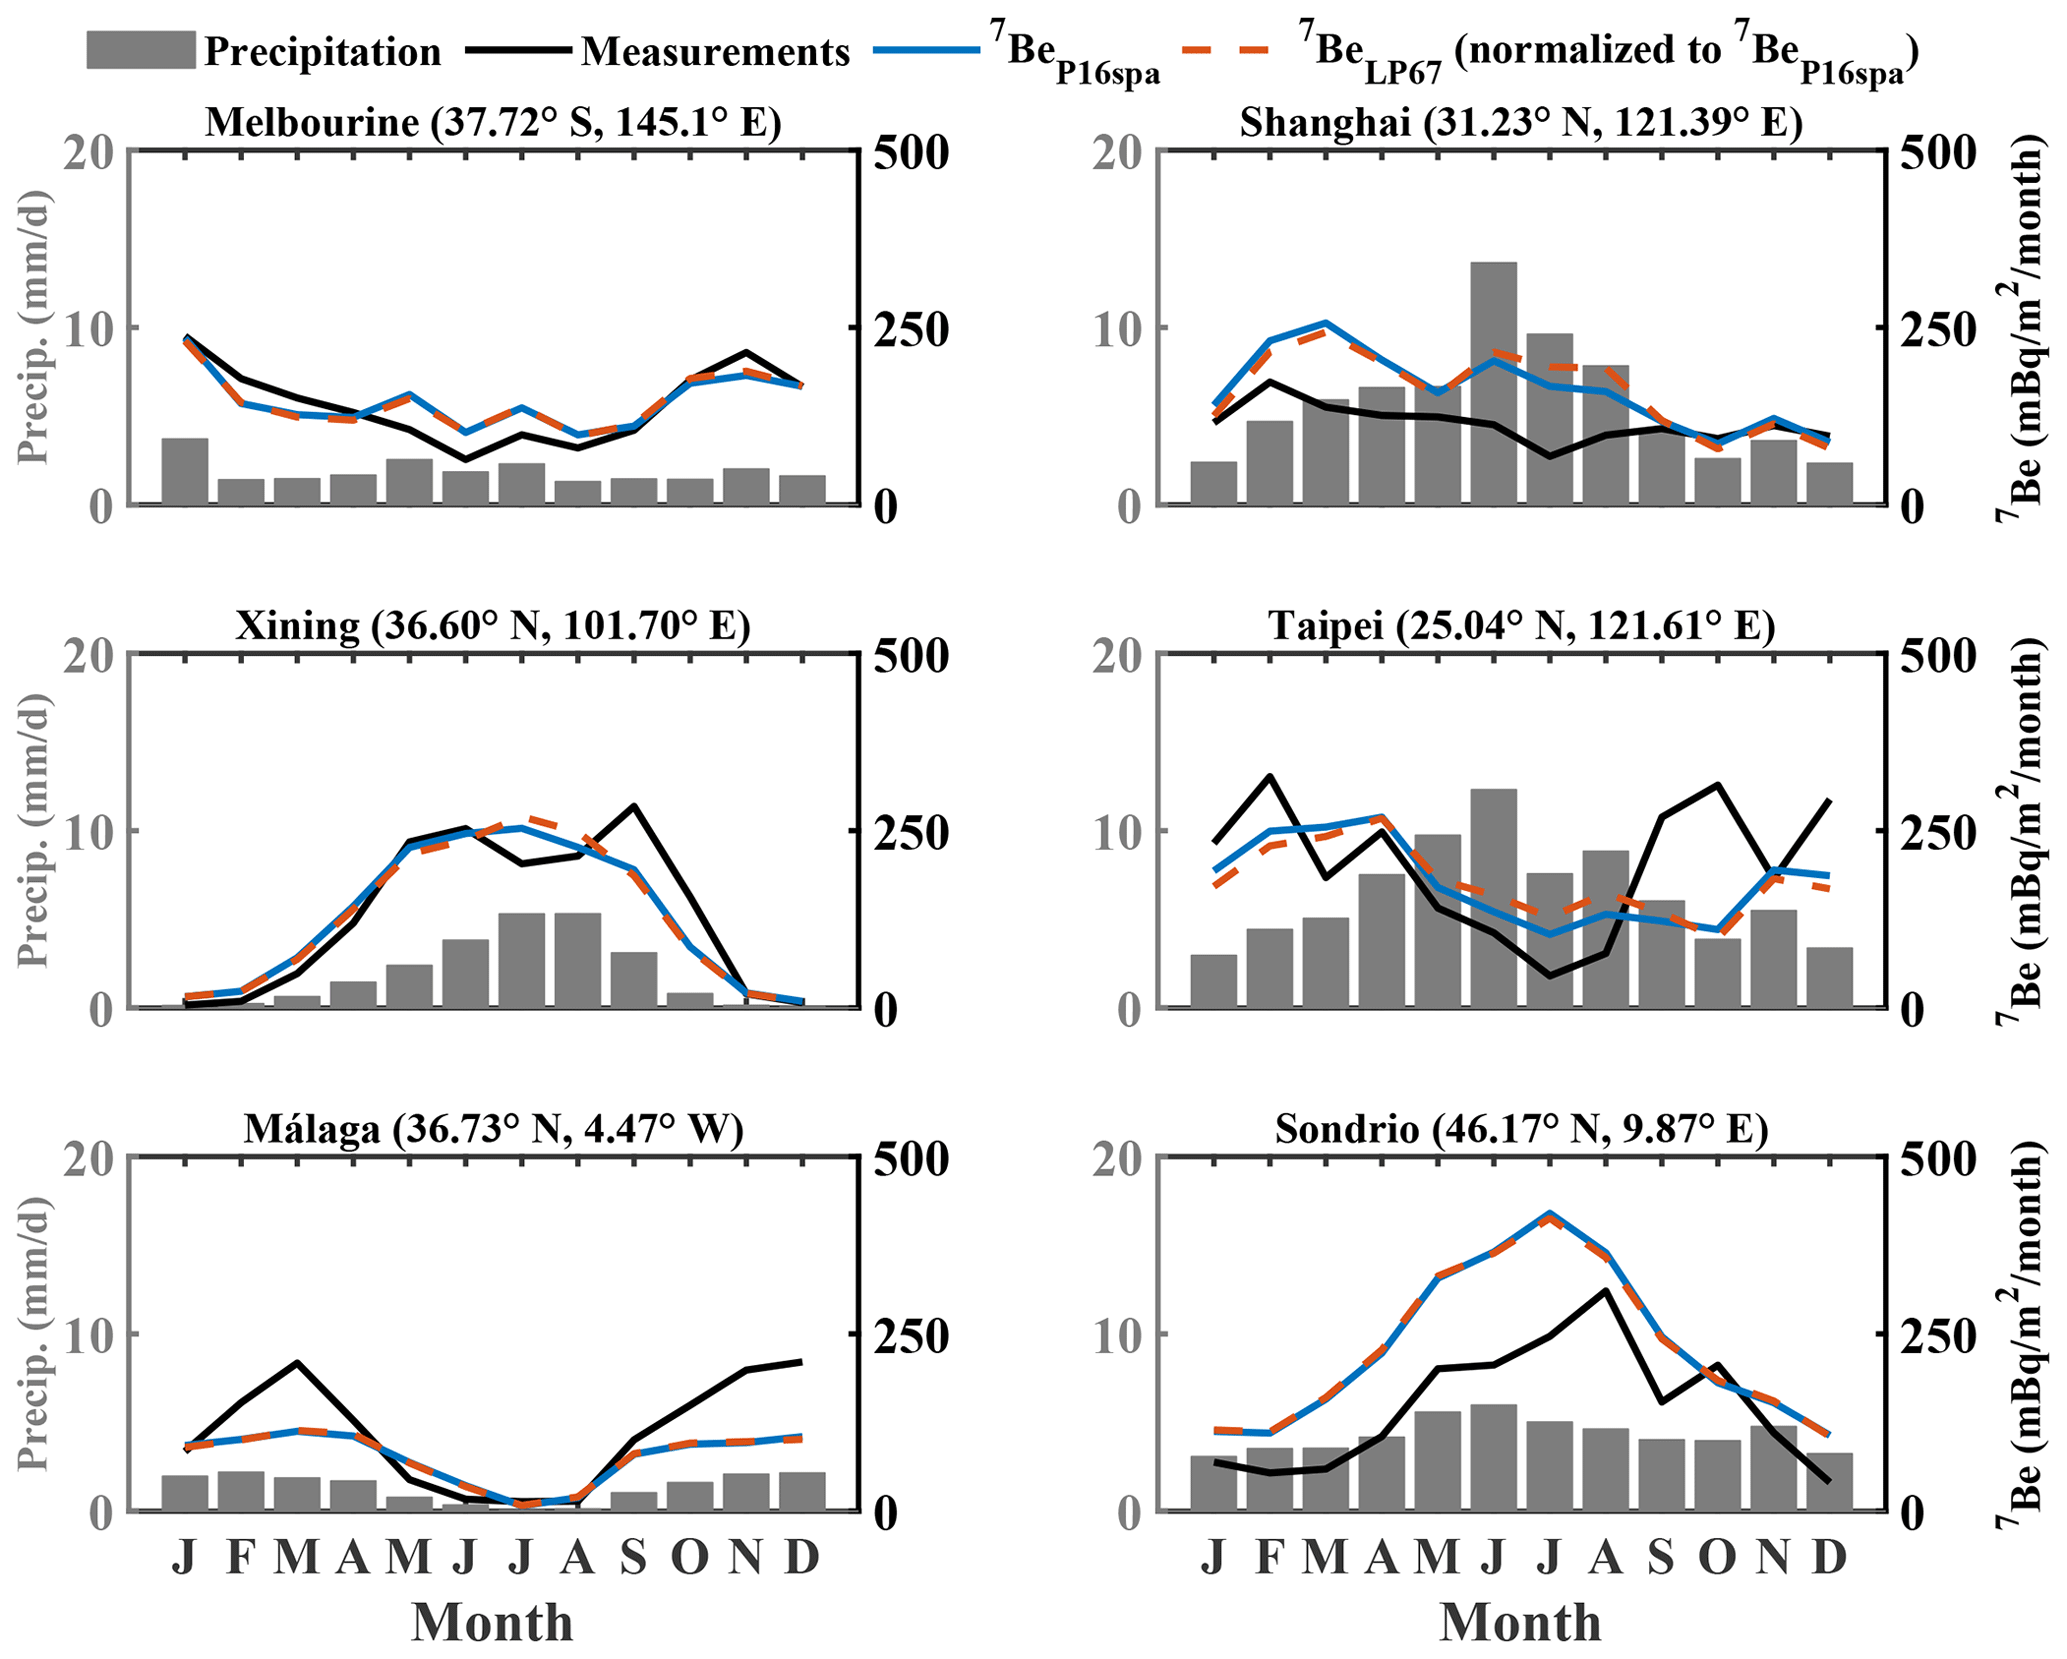
Figure 8Seasonal cycle of simulated (color lines) and measured (black line) 7Be deposition fluxes together with MERRA-2 total precipitation (4∘ × 5∘, bar graph). The model results using the LP67 production rate are normalized to the ones using the P16spa production rate.
Figure 8 compares model results with the seasonal 7Be deposition flux observations over the overlapping periods. Usually, high precipitation leads to high 7Be deposition fluxes (e.g., Du et al., 2015). Interestingly, low deposition fluxes are observed during the summer season in Taipei (Lee et al., 2015; Huh et al., 2006) coinciding with high precipitation. This feature is well captured in the model. Taipei has a typhoon season in summer when strong precipitation can occur in a very short period. The atmospheric 7Be could be removed quickly at the early stage of the precipitation event, while at the later stage there is little 7Be left in the air that can be removed (Ioannidou and Papastefanou, 2006).
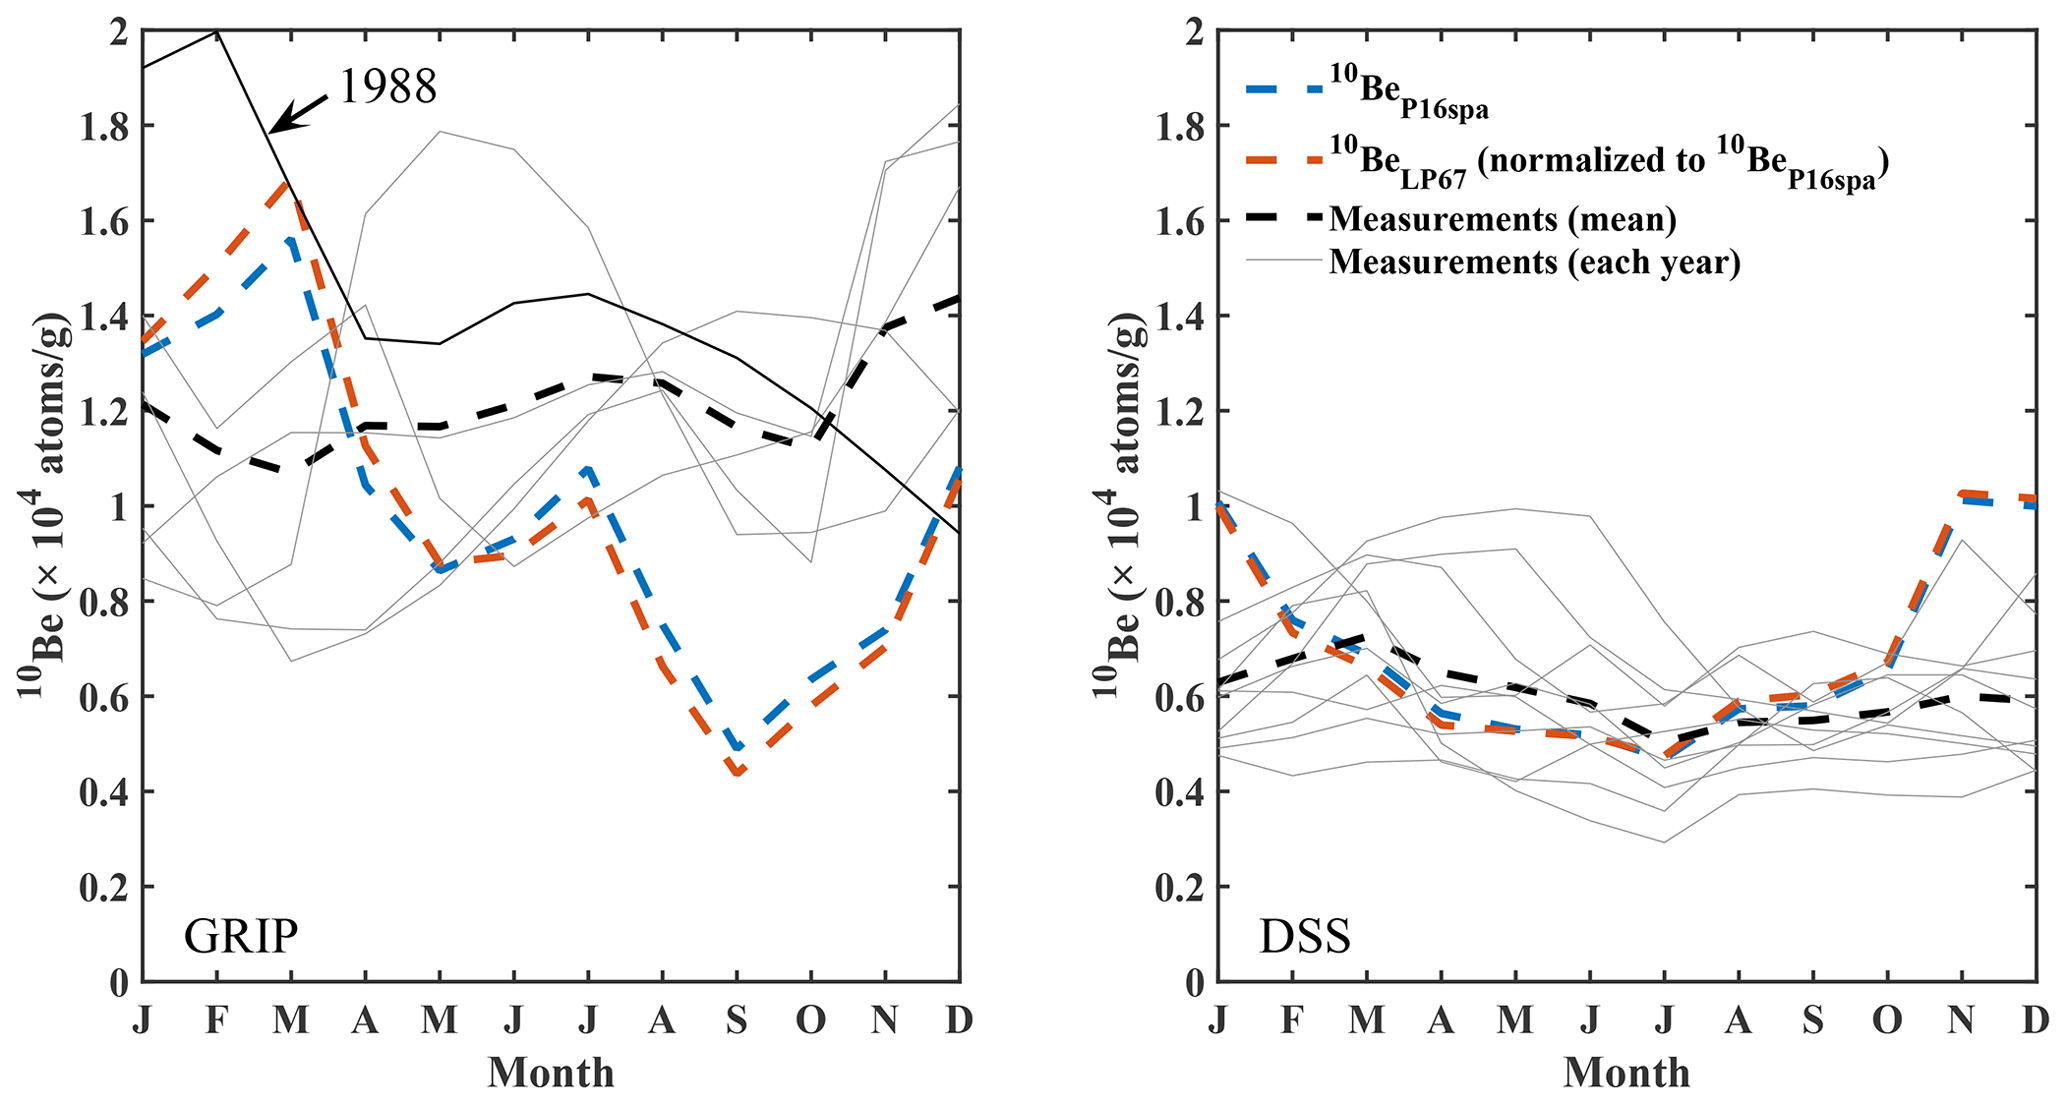
Figure 9Seasonal cycle of simulated 10Be deposition fluxes (2008–2018) and measured 10Be deposition fluxes in GRIP (1986–1990) and DSS (2000–2009) ice cores. The solid lines (grey) refer to seasonal variations of the measurements for each year. The solid black line indicates seasonal data of measurements in the year 1988. The dashed lines indicate the averaged seasonal variations of measured 10Be (black), 10BeP16spa (blue), and 10BeLP67 (red) concentrations.
To examine the ability of model to simulate 10Be in polar regions, we compare model results with two sub-annual ice core records (Fig. 9): the GRIP record from Greenland (1986–1990) (Heikkilä et al., 2008c) and the DSS record from Antarctica (2000–2009) (Pedro et al., 2011b). It should be noted that the direct measurements from ice cores are concentrations in the ice (atoms g−1). To calculate deposition fluxes, the ice concentrations are multiplied by ice accumulation rates. However, for sub-annual accumulations, this bears large uncertainties. Therefore, we calculate the modeled 10Be concentrations for the selected sites using the model deposition fluxes at the selected sites, timed by ice density and then divided by the corresponding model precipitation rates.
Firstly, there is no consistent seasonal cycle in the GRIP 10Be measurement, indicating a strong role of local meteorology. The model does not reproduce the mean seasonal cycle, partly because the model was not run for the exact same period. However, we note that the measurements for the year 1988 show an annual cycle similar to that in the model, suggesting that the model 10Be seasonality falls within the range of the observations. For the DSS site, the model simulates the austral winter minima but not the austral fall maxima (February–April). These model biases could be due to the limited model resolution and local effects (e.g., ice redistribution due to wind blow) that are not resolved by the model. Such discrepancies were also reported by previous model studies using the ECHAM5-HAM general circulation model (2.8∘ × 2.8∘) over the overlap period (Heikkilä et al., 2008c; Pedro et al., 2011a). Global model simulations at higher resolutions or using a regional model could help improve the agreements between model results and measurements in Greenland and Antarctica. However, it should be kept in mind that local surface processes can cause a high degree of spatial variability in the impurity concentrations in ice cores, even for short distances (Gfeller et al., 2014), which cannot be resolved in climate models.
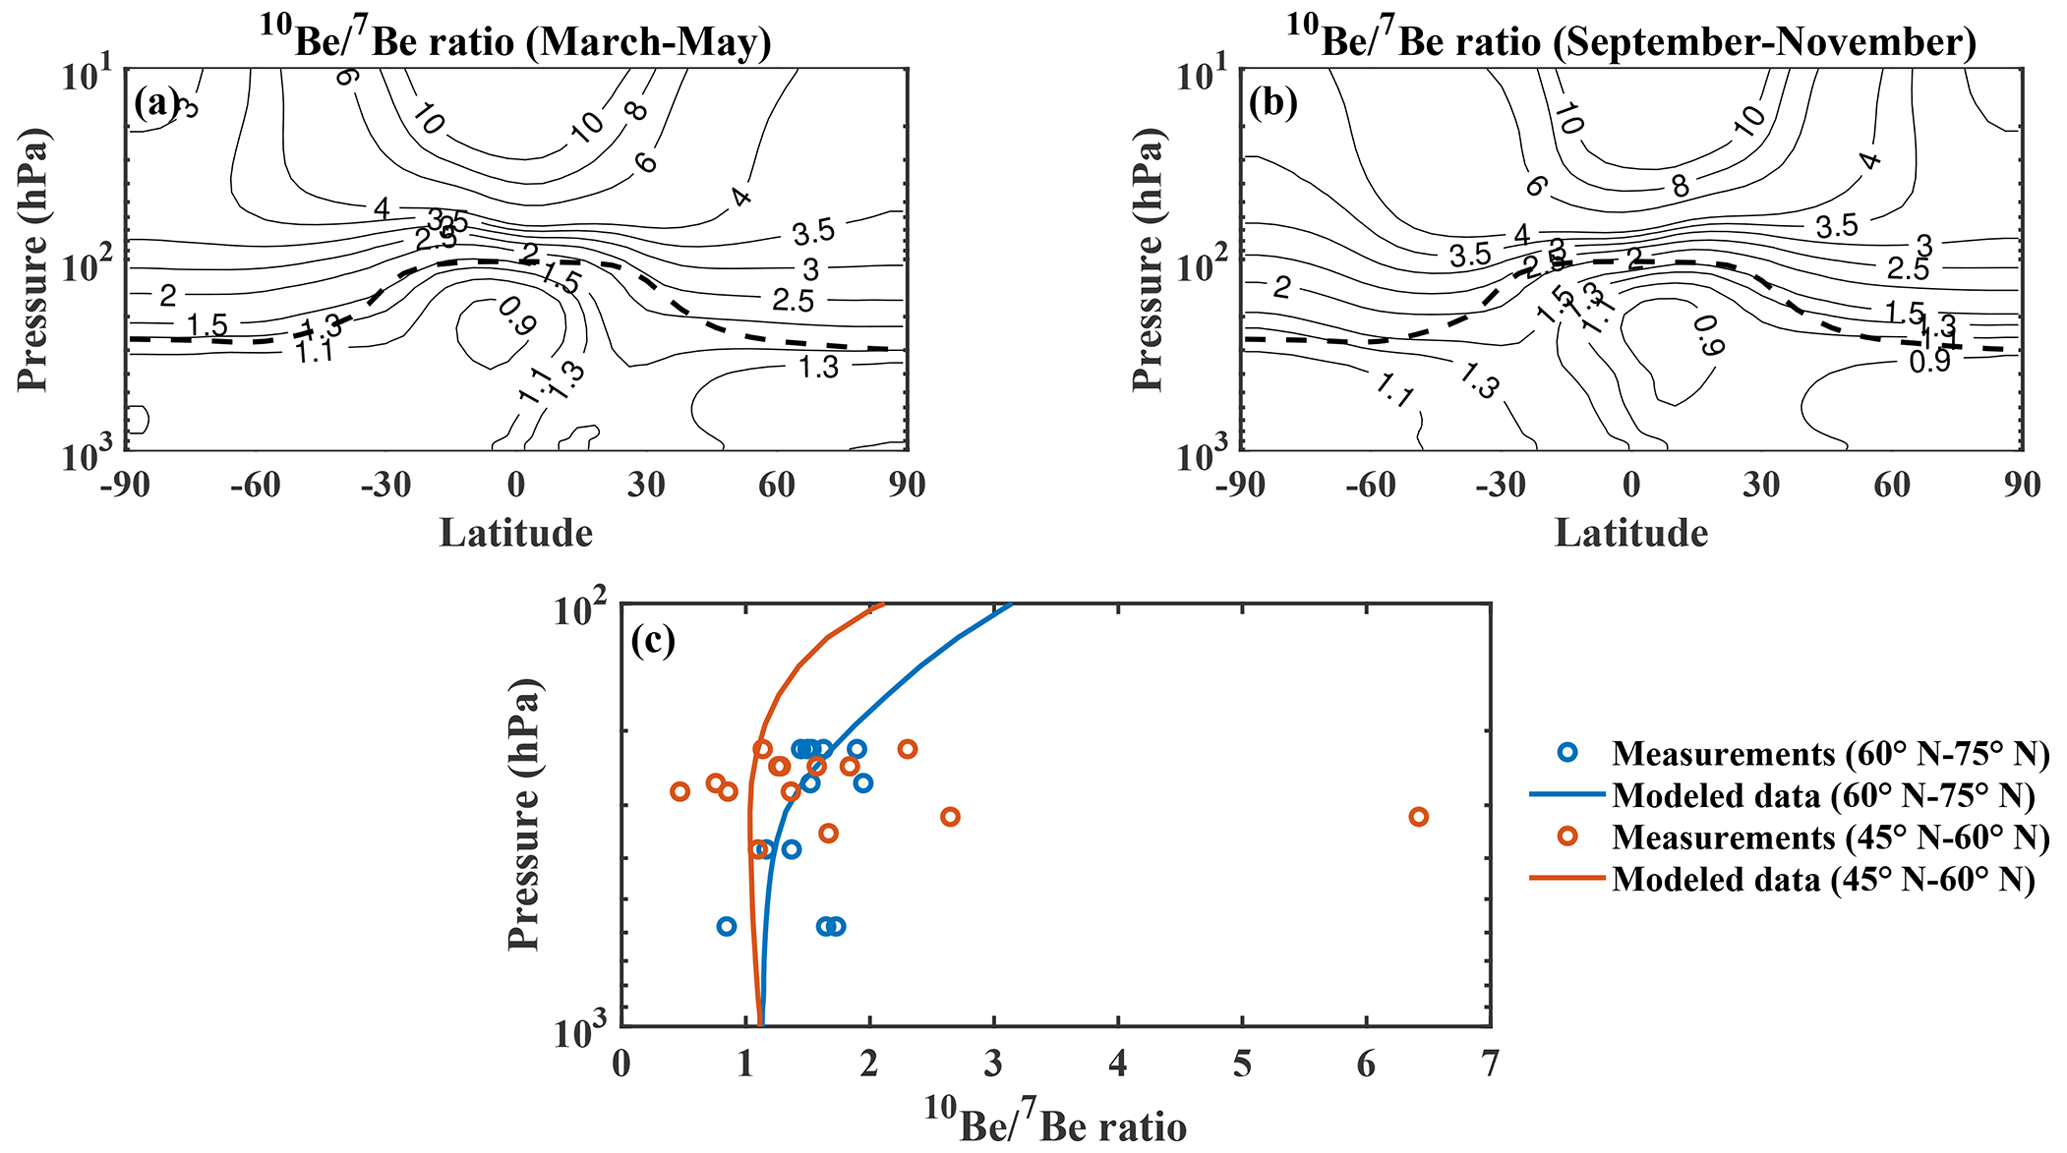
Figure 10(a, b) Simulated 10BeBeP16spa ratio in spring (March–May) (a) and autumn (September–November) (b), averaged over the years 2008–2018. (c) Comparison between the annual averaged model 10BeBeP16spa ratios (lines) and those from measurements (circles; Jordan et al., 2003). The comparison is shown for the latitude bands of 60–75∘ N and 45–60∘ N, respectively.
3.7 ratio
Figure 10 shows the modeled zonal mean ratios during boreal spring (March–May) and austral spring (September–November), respectively, when the stratosphere–troposphere exchange is strong in either of the two hemispheres. Also shown is the comparison of the altitudinal profile of the ratio with measurements from three aircraft missions (Jordan et al., 2003). The model ratio generally lies within the ranges of measurements (Fig. 10c). Due to the decay of 7Be and long residence time in the stratosphere, the ratio is higher (>1.5) in the stratosphere and increases with altitude, with a maximum (>10) in the tropical stratosphere. During the period without strong stratospheric intrusion (e.g., the autumn season in Northern Hemisphere, Fig. 10b), the monthly ratio near the surface is around 0.9–1. This surface ratio could be up to 1.4 when the strong stratosphere–troposphere exchange happens (e.g., the spring season in Northern Hemisphere; Fig. 10a).
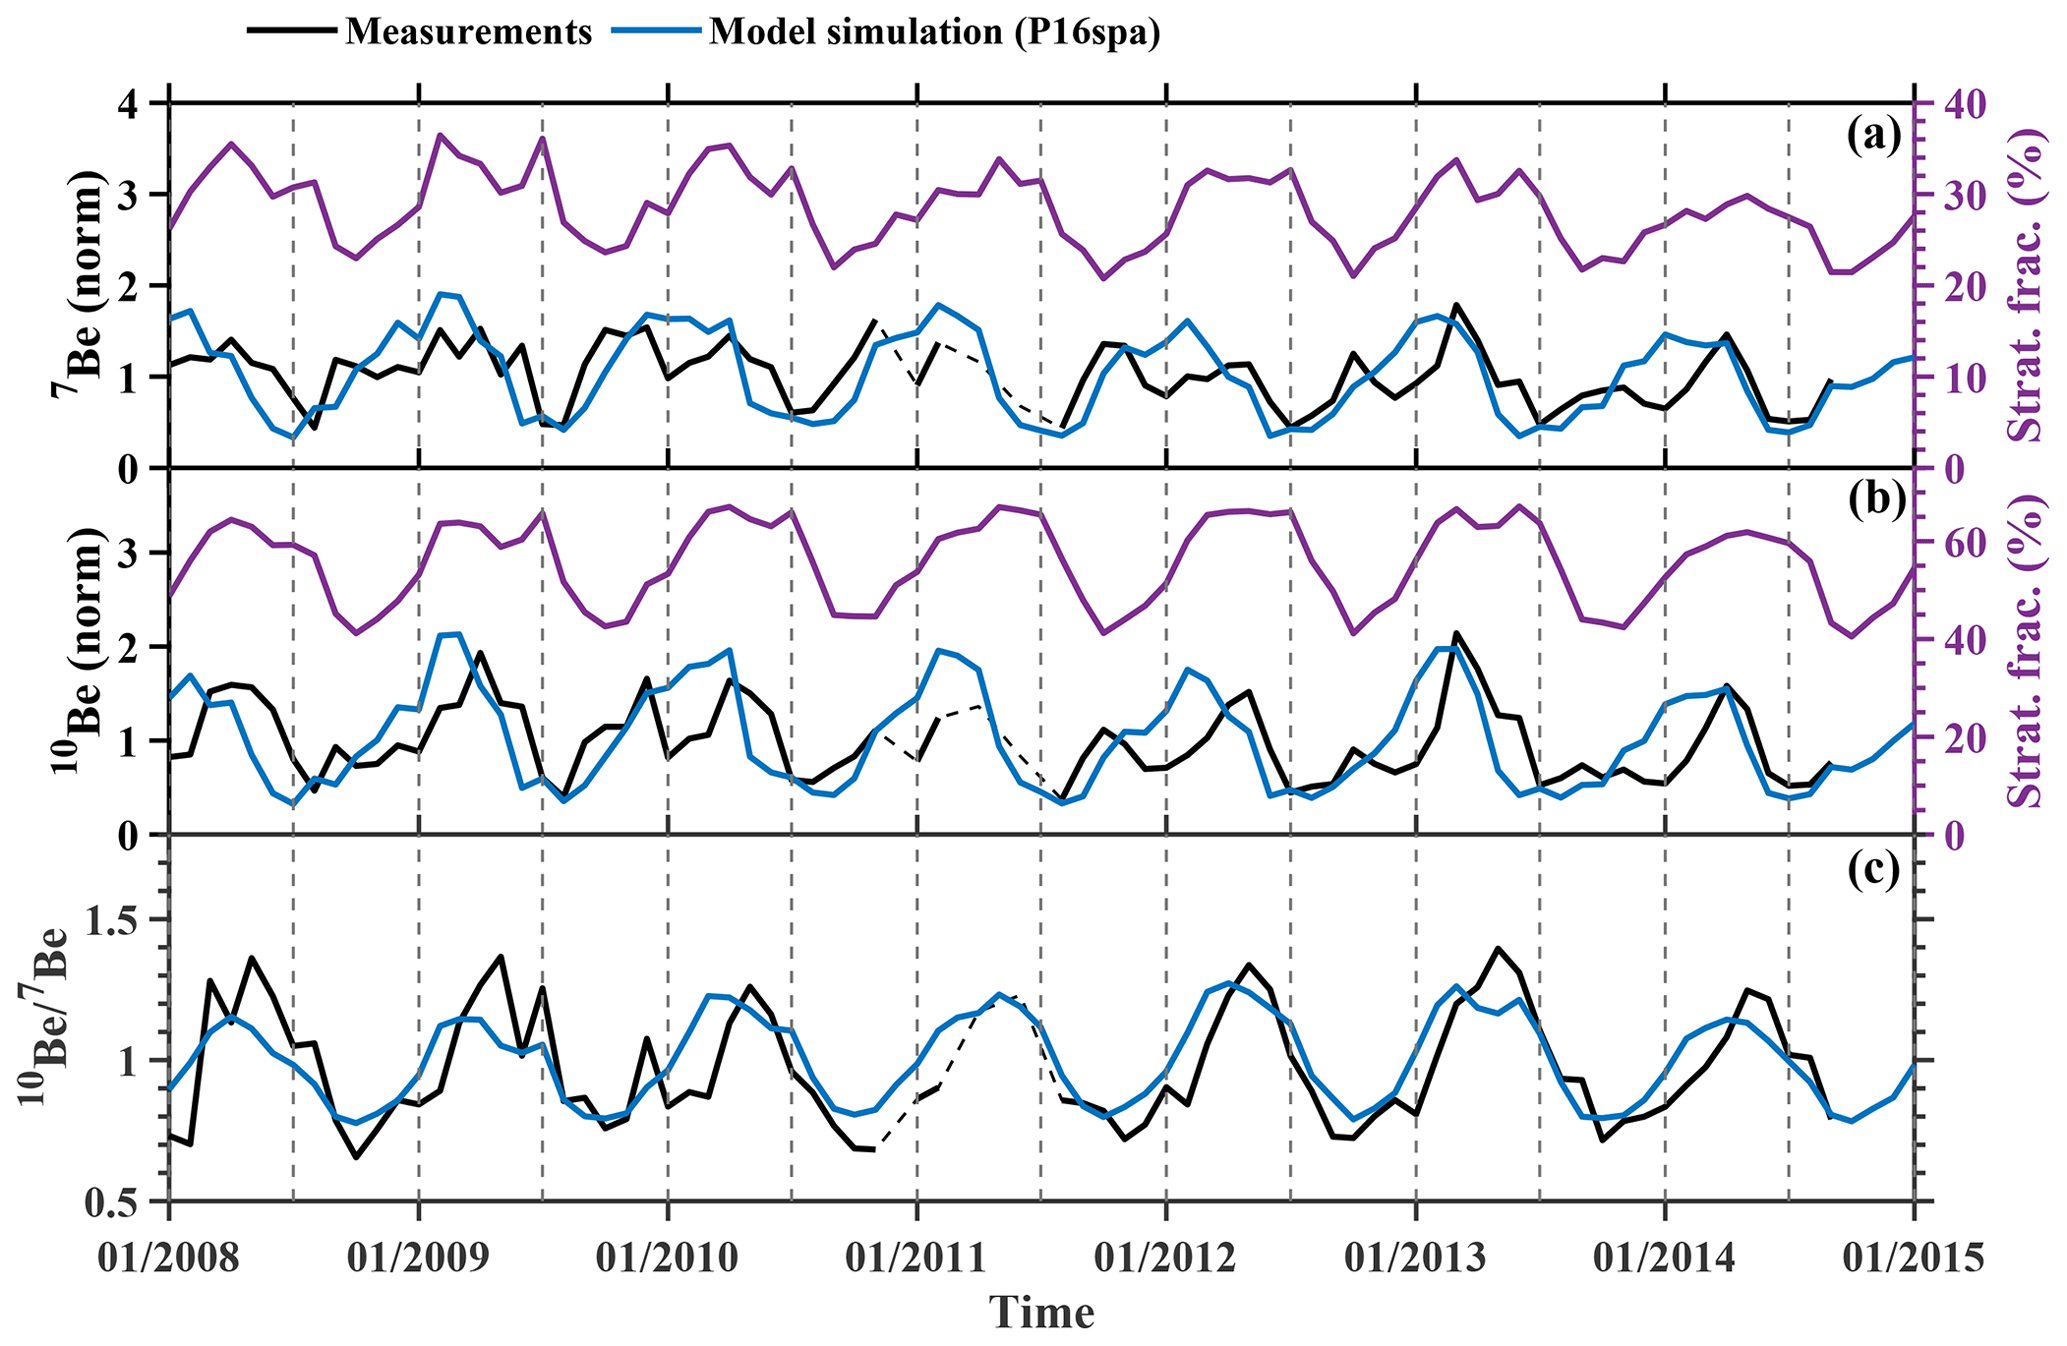
Figure 11Comparison of monthly mean 7Be (a) and 10Be (b) concentrations and the ratio (c) between model results with P16spa production and measurements for the Tokyo station over the period 2008–2014. Note that all 7Be and 10Be values are normalized to focus on variability. The dashed black line bridges the gap in measurements.
Figure 11 compares model surface air 7BeP16spa and 10BeP16spa concentrations and ratios with monthly mean observations in Tokyo (Yamagata et al., 2019) during the period of 2008–2014. Here we mainly focus on the relative variations, and 7Be and 10Be data are normalized. The model captures the observed variability in Tokyo well. 7Be and 10Be show a peak in early spring (March–May), while the ratio shows a wider peak over March–July. The summer minima of 7Be and 10Be are due to strong scavenging associated with the monsoon/typhoon season precipitation. While the ratio is independent of precipitation scavenging, the peaks of coincide well with the enhancements of stratospheric contribution in the model. This indicates that the ratio is a better indicator of the vertical transport and stratospheric intrusion influences than either tracer alone.
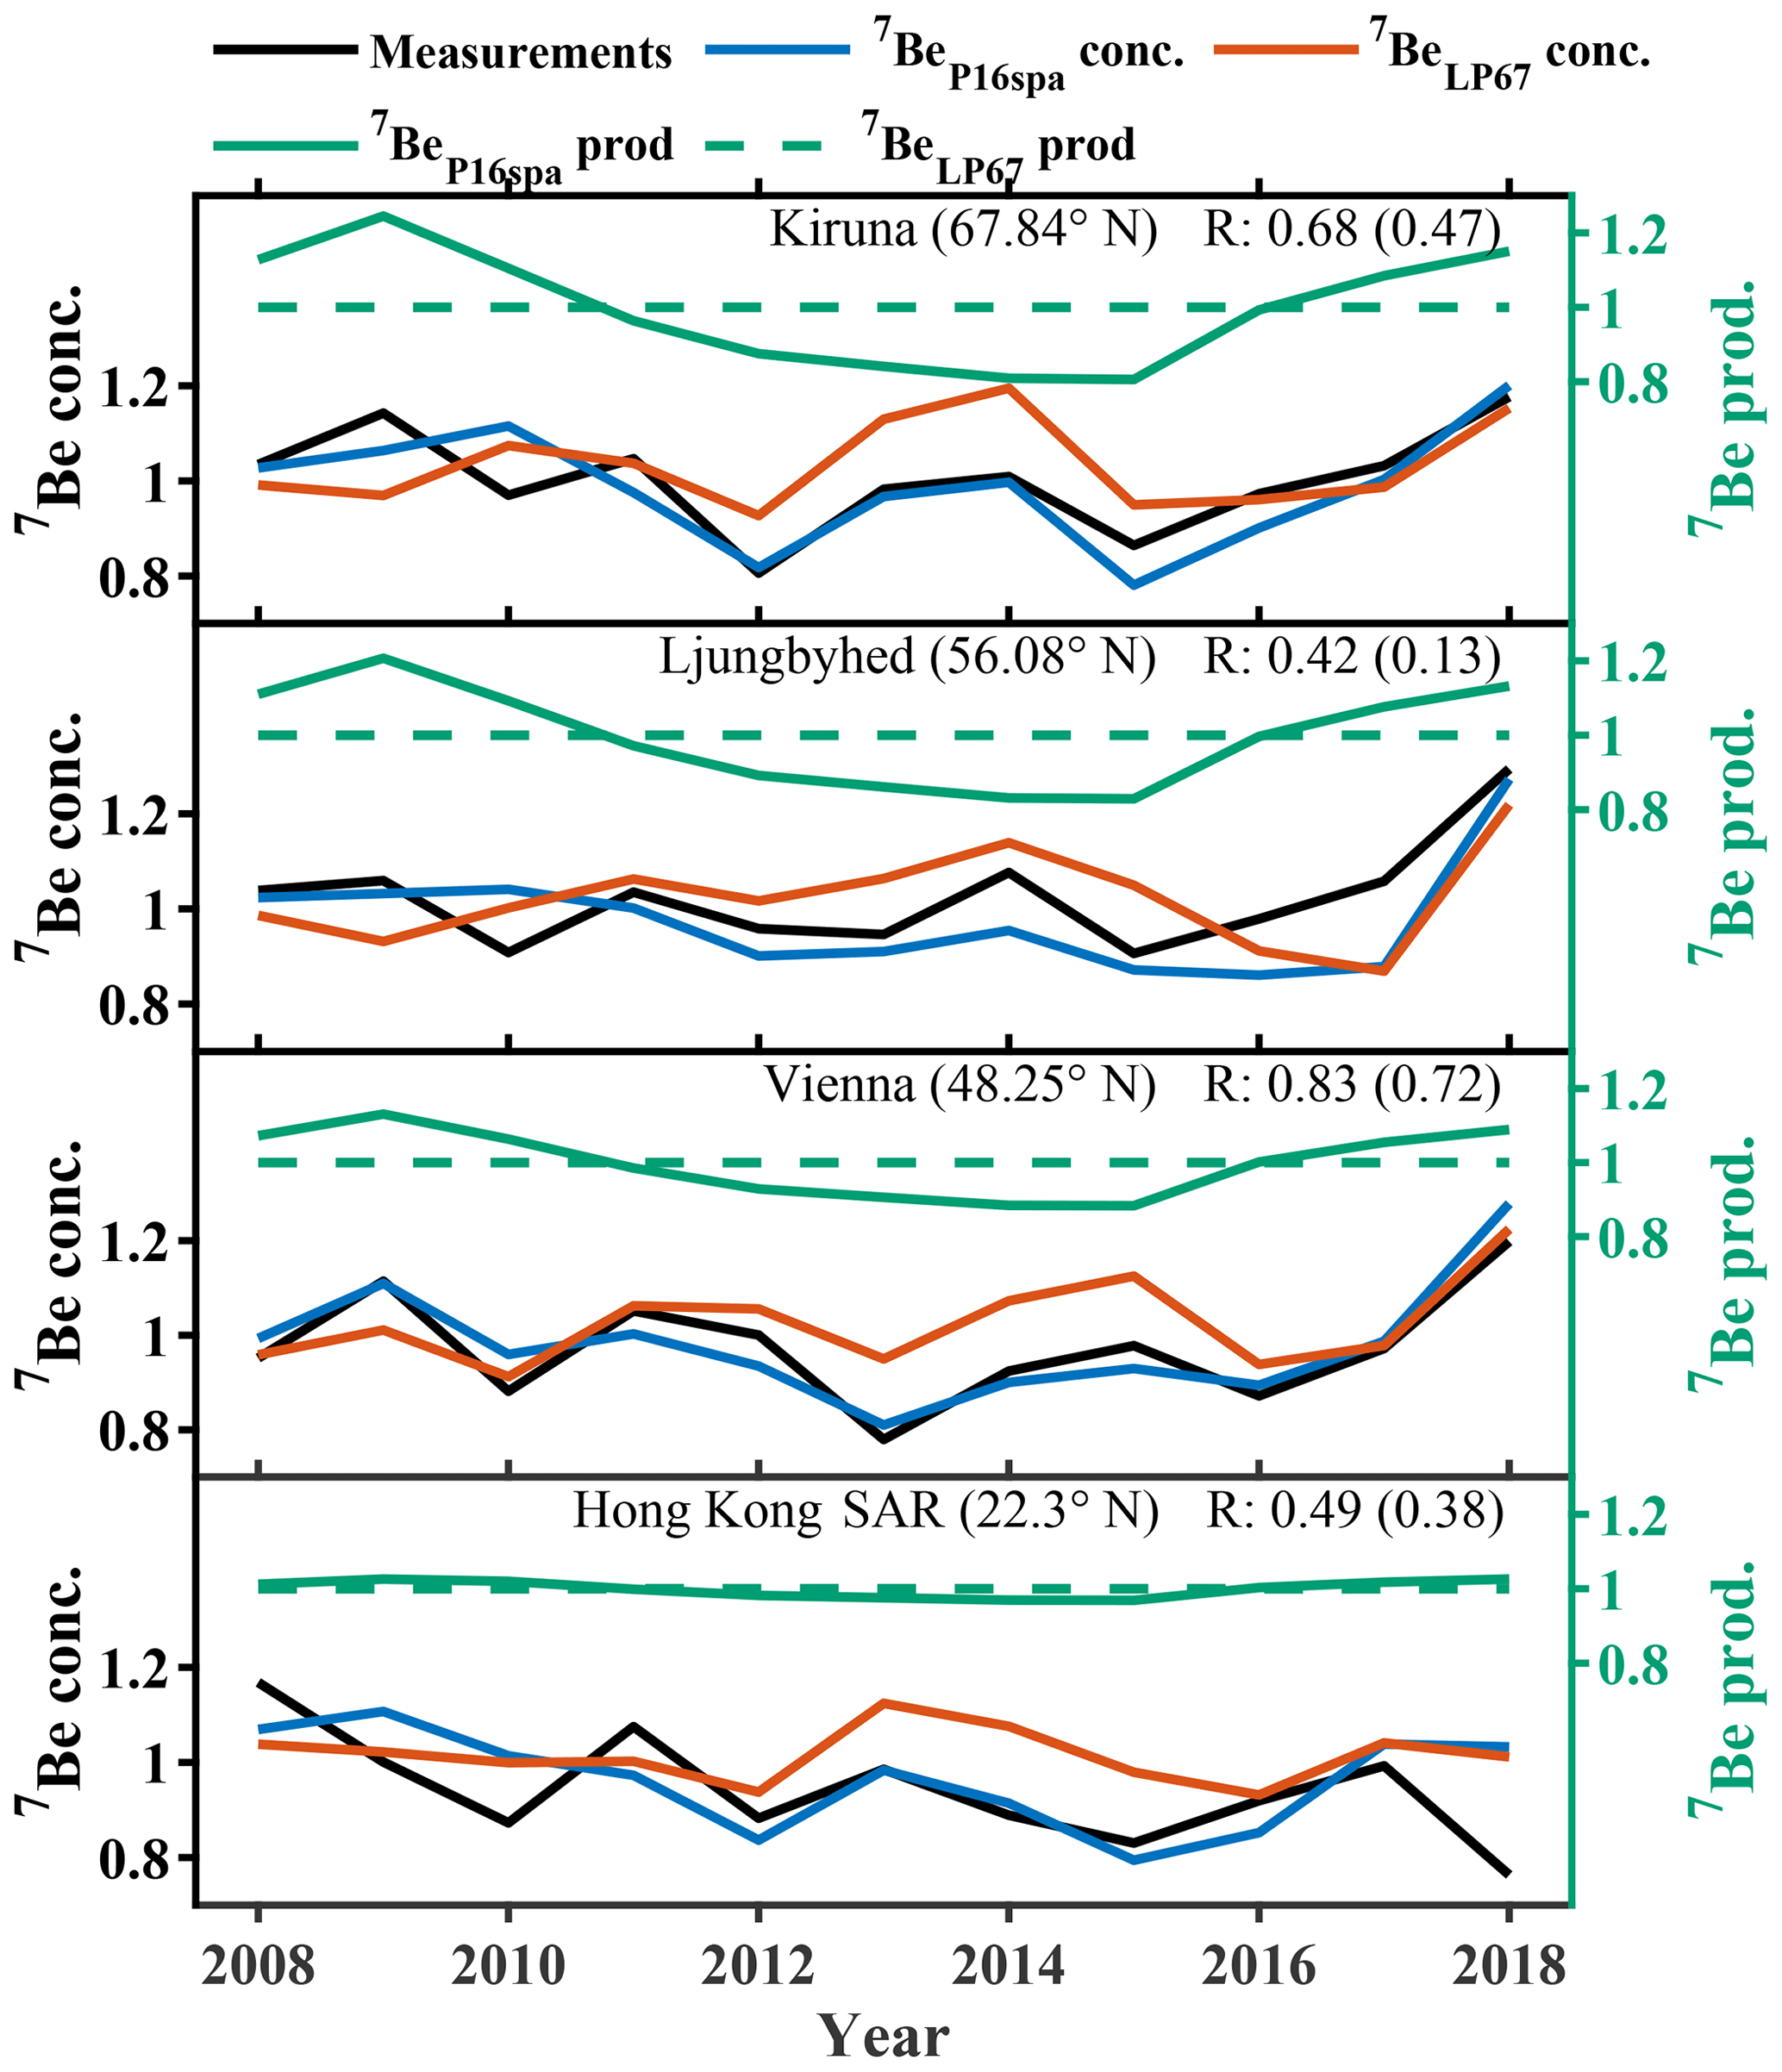
Figure 12Comparison of annual mean model surface air 7Be concentrations with measurements from 2008–2018. Also shown is the model tropospheric 7Be production (green lines) at each station. All data are normalized by being divided by the mean over the first 5 years. The linear Spearman correlation coefficient R value is between 7BeP16spa and measurements, while the values in brackets are between 7BeLP67 and measurements.
3.8 Solar modulation influences
Here we examine the ability of the model to simulate the inter-annual variability of 7Be surface air concentrations, especially whether the model can simulate the solar modulation influence using the updated production model. Figure 12 shows the comparison of model-simulated annual mean surface air 7Be concentrations with measurements during 2008–2018 from four sites: Kiruna, Ljungbyhed, Vienna, and Hong Kong SAR (Kong et al., 2022; Zheng et al., 2021b). The tropospheric 7Be production rate from each site is also plotted for comparison as measured annual mean surface air 7Be concentrations are predominantly influenced by the local tropospheric 7Be production signal (Zheng et al., 2021b).
The model 7BeP16spa surface air concentrations show a better agreement with annual 7Be measurements (higher R value) compared to 7BeLP67 concentrations at all surface sites (Fig. 12). The variability in the measurements (Kiruna, Ljungbyhed, and Vienna) agrees well with the trend in production, suggesting a dominant influence of solar modulations during this period. This is further supported by strong deviations between 7BeP16spa and 7BeLP67 as no solar influence is considered in 7BeLP67. This also emphasizes the importance of including solar modulation of the 7Be and 10Be production in modeling studies, especially for high-latitude regions. The mismatch of measurements and production at Kiruna from 2012 to 2015, together with the similar year-to-year variability between 7BeP16spa and 7BeLP67, suggests the meteorological influence is dominant at Kiruna for this period. This also suggests that meteorological influences can suppress the solar signal in the 7Be and 10Be observations.
We have incorporated the 7Be and 10Be production rates derived from the CRAC:Be model, considering realistic spatial geomagnetic cutoff rigidities (P16spa), into the GEOS-Chem global chemical transport model, enabling the model output to be quantitatively comparable with the measurements. In addition to the standard simulation using the P16spa production rate, we further conducted two sensitivity simulations: one with the default production rate in GEOS-Chem based on an empirical approach (LP67) and one with the production rate from the CRAC:Be but considering only geomagnetic cutoff rigidities for a geocentric axial dipole (P16). On a global average, the LP67 production rate is 60 % higher compared to that of P16 and P16spa. The P16 production rate shows some regional differences (up to 50 %) compared to the P16spa production rate.
In comparison with a large number of air and deposition flux measurements, the model 7BeP16spa shows good agreements with respect to surface air concentrations (93.7 % of data within a factor of 2) and reasonably good agreements regarding deposition fluxes (60.9 % of data within a factor of 2). The model simulates the surface air concentration peaks well in the subtropics, associated with strong downward transport from the stratosphere. This agreement is better than that using the default 7BeLP16 production and the 7BeP16 production with simplified axis symmetric dipole cutoff rigidity. The 7BeLP67 simulation overestimates the absolute value of 7Be. The 7BeP16 simulation tends to produce a positive bias (∼18 %) for the 7Be deposition fluxes in the East Asia region; nevertheless, no large bias is found for 7Be surface air concentrations. The surface deposition fluxes are more sensitive to the production in the mid-troposphere and upper troposphere and downward transport of 7Be from the stratosphere, due to the effect of precipitation scavenging throughout the troposphere.
For the first time, the ability of GEOS-Chem to simulate 10Be is assessed with measurements. The 10BeP16spa model results agree well with 10Be observational data that were evaluated for dust influences or from the regions less influenced by dust (e.g., polar regions), while underestimating most samples that were not corrected for dust influences. This highlights the importance of examining the dust contribution to 10Be measurements when using these data to evaluate models.
Independent of the production models, surface 7Be and 10Be concentrations from all three simulations show similar seasonal variations, suggesting a dominant meteorological influence. The model generally simulates the annual cycle of 7Be surface air concentrations and deposition fluxes well at most sites in terms of amplitude and seasonality. The model fails to capture the “summer peak” in a few sites likely due to errors in convective transport during summer.
The model ratios also lie within the measurements, suggesting the stratosphere–troposphere exchange process is reasonably represented in the model. The mismatch of the peaks between 7Be(10Be) and ratios at the Tokyo site suggests that the ratio is a better indicator of the vertical transport and stratospheric influences than either tracer alone as the ratio is independent of precipitation scavenging.
Finally, we demonstrate the value and importance of including time-varying solar modulation in 7Be and 10Be production rates for model simulations of both tracers. It significantly improves the agreement of interannual variations between the model and measurements, especially at surface sites from mid-latitudes and high latitudes. The mismatch of trends in the modeled 7Be production rate and observed air concentrations at Kiruna from 2012–2015 also suggests that the solar signal can be suppressed by meteorological influences.
In summary, we have shown that with the state-of-the-art P16spa production rate, the ability of GEOS-Chem to reproduce the 7Be and 10Be measurements (including interannual variability of 7Be) is significantly improved. While uncertainties in transport and deposition processes play a major role in the model performance, reduced uncertainties in the production rates, as demonstrated in this study, allow us to use 7Be and 10Be tracers as better tools for evaluating and testing transport and scavenging in global models. We recommend using the P16spa (versus default LP67) production rate for GEOS-Chem simulations of 7Be and 10Be in the future.
Observational data for model validation are available through the references described in Sect. 2.3. The two compiled 10Be observation datasets are available in the Supplement. The GEOS-Chem v14.0.2 model code, GEOS-Chem model output, and 7Be and 10Be production rates are available in a Zenodo repository (https://doi.org/10.5281/zenodo.8372652; Zheng et al., 2023b).
The supplement related to this article is available online at: https://doi.org/10.5194/gmd-16-7037-2023-supplement.
MZ initiated the study. MZ performed the analysis and interpretation with contributions from HL and FA. MZ conducted the GEOS-Chem model simulations with the help of MW and ZL. All authors discussed the results and edited the manuscript.
The contact author has declared that none of the authors has any competing interests.
Publisher's note: Copernicus Publications remains neutral with regard to jurisdictional claims made in the text, published maps, institutional affiliations, or any other geographical representation in this paper. While Copernicus Publications makes every effort to include appropriate place names, the final responsibility lies with the authors.
This project is supported by the Swedish Research Council (grant no. 2021-06649) and the Swedish-government-funded Strategic Research Area: ModElling the Regional and Global Earth system, MERGE. Hongyu Liu acknowledges funding support from the NASA Modeling, Analysis and Prediction (MAP) program and Atmospheric Composition Campaign Data Analysis and Modeling program. Florian Adolphi acknowledges support from the Helmholtz Association (grant no. VH-NG 1501). Raimund Muscheler acknowledges support from the Swedish Research Council (grant nos. DNR2013-8421 and DNR2018-05469). Zhengyao Lu acknowledges the Swedish Research Council, Vetenskapsrådet (grant no. 2022-03617). Mousong Wu acknowledges the National Natural Science Foundation of China (grant nos. 42111530184 and 41901266) and the Research Funds for the Frontiers Science Center for Critical Earth Material Cycling, Nanjing University (grant no. 090414380031). Nønne L. Prisle acknowledges the funding from the Academy of Finland (grant nos. 308238, 314175, and 335649). This project has received funding from the European Research Council (ERC) under the European Union's Horizon 2020 Research and Innovation program, project SURFACE (grant no. 717022). The GEOS-Chem model is managed by the Atmospheric Chemistry Modeling Group at Harvard University. The GEOS-Chem support team at Harvard University and Washington University in St. Louis (WashU) is acknowledged for their effort. GEOS-Chem input files were obtained from the GEOS-Chem Data Portal enabled by WashU.
This research has been supported by the Vetenskapsrådet (grant no. 2021-06649); the European Research Council, H2020 European Research Council (grant no. 717022); the Academy of Finland (grant nos. 308238, 314175, and 335649); and the NASA (grant nos. 80NSSC17K0221, NNX14AR07G, and 80NSSC21K1455).
This paper was edited by Patrick Jöckel and reviewed by Tobias Spiegl and one anonymous referee.
Ajtić, J., Brattich, E., Sarvan, D., Djurdjevic, V., and Hernandez-Ceballos, M. A.: Factors affecting the 7Be surface concentration and its extremely high occurrences over the Scandinavian Peninsula during autumn and winter, Chemosphere, 199, 278–285, https://doi.org/10.1016/j.chemosphere.2018.02.052, 2018.
Ajtić, J., Zorko, B., Nečemer, M., Sarvan, D., Rajačić, M., Krneta Nikolić, J., Todorović, D., Djurdjevic, V., Vodenik, B., Glavič Cindro, D., and Kožar Logar, J.: Characteristics of radioactivity in the surface air along the 45°N zonal belt in South-Eastern Europe, Int. J. Environ. Sci. Technol., 19, 9719–9730, https://doi.org/10.1007/s13762-021-03814-0, 2022.
Aldahan, A., Possnert, G., Johnsen, S. J., Clausen, H. B., Isaksson, E., Karlen, W., and Hansson, M.: Sixty year 10Be record from Greenland and Antarctica, Earth Planet. Sci., 107, 139–147, https://doi.org/10.1007/BF02840464, 1998.
Aldahan, A., Possnert, G., and Vintersved, I.: Atmospheric interactions at northern high latitudes from weekly Be-isotopes in surface air, Appl. Radiat. Isot., 54, 345–353, https://doi.org/10.1016/S0969-8043(00)00163-9, 2001.
Aldahan, A., Hedfors, J., Possnert, G., Kulan, A., Berggren, A. M., and Söderström, C.: Atmospheric impact on beryllium isotopes as solar activity proxy, Geophys. Res. Lett., 35, L21812, https://doi.org/10.1029/2008gl035189, 2008.
Auer, M., Wagenbach, D., Wild, E. M., Wallner, A., Priller, A., Miller, H., Schlosser, C., and Kutschera, W.: Cosmogenic 26Al in the atmosphere and the prospect of a 26Al/10Be chronometer to date old ice, Earth Planet. Sc. Lett., 287, 453–462, https://doi.org/10.1016/j.epsl.2009.08.030, 2009.
Baroni, M., Bard, E., Petit, J.-R., Magand, O., and Bourlès, D.: Volcanic and solar activity, and atmospheric circulation influences on cosmogenic 10Be fallout at Vostok and Concordia (Antarctica) over the last 60 years, Geochim. Cosmochim. Ac., 75, 7132–7145, https://doi.org/10.1016/j.gca.2011.09.002, 2011.
Beer, J., McCracken, K., and Von Steiger, R.: Cosmogenic Radionuclides: Theory and Applications in the Terrestrial and Space Environments, Springer Berlin, Heidelberg, 428 pp., https://doi.org/10.1007/978-3-642-14651-0, 2012.
Berggren, A. M., Beer, J., Possnert, G., Aldahan, A., Kubik, P., Christl, M., Johnsen, S. J., Abreu, J., and Vinther, B. M.: A 600-year annual 10Be record from the NGRIP ice core, Greenland, Geophys. Res. Lett., 36, L11801, https://doi.org/10.1029/2009gl038004, 2009.
Bey, I., Jacob, D. J., Yantosca, R. M., Logan, J. A., Field, B. D., Fiore, A. M., Li, Q., Liu, H. Y., Mickley, L. J., and Schultz, M. G.: Global modeling of tropospheric chemistry with assimilated meteorology: Model description and evaluation, J. Geophys. Res.-Atmos., 106, 23073–23095, https://doi.org/10.1029/2001JD000807, 2001.
Bleichrodt, J. F.: Mean tropospheric residence time of cosmic-ray-produced beryllium 7 at north temperate latitudes, J. Geophys. Res.-Oceans, 83, 3058–3062, https://doi.org/10.1029/JC083iC06p03058, 1978.
Brattich, E., Liu, H., Tositti, L., Considine, D. B., and Crawford, J. H.: Processes controlling the seasonal variations in 210Pb and 7Be at the Mt. Cimone WMO-GAW global station, Italy: a model analysis, Atmos. Chem. Phys., 17, 1061–1080, https://doi.org/10.5194/acp-17-1061-2017, 2017.
Brattich, E., Liu, H., Zhang, B., Hernández-Ceballos, M. Á., Paatero, J., Sarvan, D., Djurdjevic, V., Tositti, L., and Ajtić, J.: Observation and modeling of high-7Be concentration events at the surface in northern Europe associated with the instability of the Arctic polar vortex in early 2003, Atmos. Chem. Phys., 21, 17927–17951, https://doi.org/10.5194/acp-21-17927-2021, 2021.
Burakowska, A., Kubicki, M., Myslek-Laurikainen, B., Piotrowski, M., Trzaskowska, H., and Sosnowiec, R.: Concentration of 7Be, 210Pb, 40K, 137Cs, 134Cs radionuclides in the ground layer of the atmosphere in the polar (Hornsund, Spitsbergen) and mid-latitudes (Otwock-Swider, Poland) regions, J. Environ. Radioact., 240, 106739, https://doi.org/10.1016/j.jenvrad.2021.106739, 2021.
Chabrillat, S., Vigouroux, C., Christophe, Y., Engel, A., Errera, Q., Minganti, D., Monge-Sanz, B. M., Segers, A., and Mahieu, E.: Comparison of mean age of air in five reanalyses using the BASCOE transport model, Atmos. Chem. Phys., 18, 14715–14735, https://doi.org/10.5194/acp-18-14715-2018, 2018.
Chae, J.-S. and Kim, G.: Large seasonal variations in fine aerosol precipitation rates revealed using cosmogenic 7Be as a tracer, Sci. Total Environ., 673, 1–6, https://doi.org/10.1016/j.scitotenv.2019.03.482, 2019.
Chang, J. C. and Hanna, S. R.: Air quality model performance evaluation, Meteorol. Atmos. Phys., 87, 167–196, https://doi.org/10.1007/s00703-003-0070-7, 2004.
Chmeleff, J., von Blanckenburg, F., Kossert, K., and Jakob, D.: Determination of the 10Be half-life by multicollector ICP-MS and liquid scintillation counting, Nuclear Instruments and Methods in Physics Research Section B, 268, 192–199, https://doi.org/10.1016/j.nimb.2009.09.012, 2010.
Copeland, K.: CARI-7 Documentation: Geomagnetic Cutoff Rigidity Calculations and Tables for 1965–2010, United States, Department of Transportation, Federal Aviation Administration, https://rosap.ntl.bts.gov/view/dot/57079 (last access: 1 December 2023), 2018.
Courtier, J., Sdraulig, S., and Hirth, G.: 7Be and 210Pb wet/dry deposition in Melbourne, Australia and the development of deployable units for radiological emergency monitoring, J. Environ. Radioact., 178–179, 419–425, https://doi.org/10.1016/j.jenvrad.2017.07.004, 2017.
Delaygue, G., Bekki, S., and Bard, E.: Modelling the stratospheric budget of beryllium isotopes, Tellus B, 67, 28582, https://doi.org/10.3402/tellusb.v67.28582, 2015.
Dibb, J. E., Talbot, R. W., and Gregory, G. L.: Beryllium 7 and Lead 210 in the western hemisphere Arctic atmosphere: Observations from three recent aircraft-based sampling programs, J. Geophys. Res.-Atmos., 97, 16709–16715, https://doi.org/10.1029/91JD01807, 1992.
Dibb, J. E., Meeker, L. D., Finkel, R. C., Southon, J. R., Caffee, M. W., and Barrie, L. A.: Estimation of stratospheric input to the Arctic troposphere: 7Be and 10Be in aerosols at Alert, Canada, 99, 12855–12864, https://doi.org/10.1029/94jd00742, 1994.
Du, J., Du, J., Baskaran, M., Bi, Q., Huang, D., and Jiang, Y.: Temporal variations of atmospheric depositional fluxes of 7Be and 210Pb over 8 years (2006–2013) at Shanghai, China, and synthesis of global fallout data, J. Geophys. Res.-Atmos., 120, 4323–4339, https://doi.org/10.1002/2014jd022807, 2015.
Dueñas, C., Gordo, E., Liger, E., Cabello, M., Cañete, S., Pérez, M., and Torre-Luque, P. D. L.: 7Be, 210Pb and 40K depositions over 11 years in Málaga, J. Environ. Radioact., 178–179, 325–334, https://doi.org/10.1016/j.jenvrad.2017.09.010, 2017.
Dutkiewicz, V. A. and Husain, L.: Stratospheric and tropospheric components of 7Be in surface air, J. Geophys. Res.-Atmos., 90, 5783–5788, https://doi.org/10.1029/JD090iD03p05783, 1985.
Eastham, S. D., Weisenstein, D. K., and Barrett, S. R. H.: Development and evaluation of the unified tropospheric–stratospheric chemistry extension (UCX) for the global chemistry-transport model GEOS-Chem, Atmos. Environ., 89, 52–63, https://doi.org/10.1016/j.atmosenv.2014.02.001, 2014.
Elsässer, C.: Exploration of 10Be ice core records using a climatological model approach: Cosmogenic production versus climate variability, heiDOK, https://doi.org/10.11588/heidok.00016349, 2013.
Elsässer, C., Wagenbach, D., Weller, R., Auer, M., Wallner, A., and Christl, M.: Continuous 25-yr aerosol records at coastal Antarctica, Tellus B, 63, 920–934, https://doi.org/10.1111/j.1600-0889.2011.00543.x, 2011.
Field, C. V., Schmidt, G. A., Koch, D., and Salyk, C.: Modeling production and climate-related impacts on 10Be concentration in ice cores, J. Geophys. Res., 111, D15107, https://doi.org/10.1029/2005jd006410, 2006.
Gao, J., Korte, M., Panovska, S., Rong, Z., and Wei, Y.: Effects of the Laschamps Excursion on Geomagnetic Cutoff Rigidities, Geochem. Geophys. Geosyst., 23, e2021GC010261, https://doi.org/10.1029/2021GC010261, 2022.
Gelaro, R., McCarty, W., Suarez, M. J., Todling, R., Molod, A., Takacs, L., Randles, C., Darmenov, A., Bosilovich, M. G., Reichle, R., Wargan, K., Coy, L., Cullather, R., Draper, C., Akella, S., Buchard, V., Conaty, A., da Silva, A., Gu, W., Kim, G. K., Koster, R., Lucchesi, R., Merkova, D., Nielsen, J. E., Partyka, G., Pawson, S., Putman, W., Rienecker, M., Schubert, S. D., Sienkiewicz, M., and Zhao, B.: The Modern-Era Retrospective Analysis for Research and Applications, Version 2 (MERRA-2), J. Climate, 30, 5419–5454, https://doi.org/10.1175/JCLI-D-16-0758.1, 2017a.
Gelaro, R., McCarty, W., Suárez, M. J., Todling, R., Molod, A., Takacs, L., Randles, C. A., Darmenov, A., Bosilovich, M. G., Reichle, R., Wargan, K., Coy, L., Cullather, R., Draper, C., Akella, S., Buchard, V., Conaty, A., da Silva, A. M., Gu, W., Kim, G.-K., Koster, R., Lucchesi, R., Merkova, D., Nielsen, J. E., Partyka, G., Pawson, S., Putman, W., Rienecker, M., Schubert, S. D., Sienkiewicz, M., and Zhao, B.: The Modern-Era Retrospective Analysis for Research and Applications, Version 2 (MERRA-2), J. Climate, 30, 5419–5454, https://doi.org/10.1175/JCLI-D-16-0758.1, 2017b.
Gfeller, G., Fischer, H., Bigler, M., Schüpbach, S., Leuenberger, D., and Mini, O.: Representativeness and seasonality of major ion records derived from NEEM firn cores, The Cryosphere, 8, 1855–1870, https://doi.org/10.5194/tc-8-1855-2014, 2014.
Golubenko, K., Rozanov, E., Kovaltsov, G., and Usoskin, I.: Zonal Mean Distribution of Cosmogenic Isotope (7Be, 10Be, 14C, and 36Cl) Production in Stratosphere and Troposphere, J. Geophys. Res.-Atmos., 127, e2022JD036726, https://doi.org/10.1029/2022JD036726, 2022.
Golubenko, K., Rozanov, E., Kovaltsov, G., Leppänen, A.-P., Sukhodolov, T., and Usoskin, I.: Application of CCM SOCOL-AERv2-BE to cosmogenic beryllium isotopes: description and validation for polar regions, Geosci. Model Dev., 14, 7605–7620, https://doi.org/10.5194/gmd-14-7605-2021, 2021.
Graham, I., Ditchburn, R., and Barry, B.: Atmospheric deposition of 7Be and 10Be in New Zealand rain (1996–98), Geochim. Cosmochim. Ac., 67, 361–373, https://doi.org/10.1016/S0016-7037(02)01092-X, 2003.
Heikkilä, U. and Smith, A. M.: Influence of model resolution on the atmospheric transport of 10Be, Atmos. Chem. Phys., 12, 10601–10612, https://doi.org/10.5194/acp-12-10601-2012, 2012.
Heikkilä, U. and Smith, A. M.: Production rate and climate influences on the variability of 10Be deposition simulated by ECHAM5-HAM: Globally, in Greenland, and in Antarctica, J. Geophys. Res.-Atmos., 118, 2506–2520, https://doi.org/10.1002/jgrd.50217, 2013.
Heikkilä, U., Beer, J., and Alfimov, V.: Beryllium-10 and beryllium-7 in precipitation in Dübendorf (440 m) and at Jungfraujoch (3580 m), Switzerland (1998–2005), J. Geophys. Res., 113, D11104, https://doi.org/10.1029/2007jd009160, 2008a.
Heikkilä, U., Beer, J., and Feichter, J.: Modeling cosmogenic radionuclides 10Be and 7Be during the Maunder Minimum using the ECHAM5-HAM General Circulation Model, Atmos. Chem. Phys., 8, 2797–2809, https://doi.org/10.5194/acp-8-2797-2008, 2008b.
Heikkilä, U., Beer, J., Jouzel, J., Feichter, J., and Kubik, P.: 10Be measured in a GRIP snow pit and modeled using the ECHAM5-HAM general circulation model, Geophys. Res. Lett., 35, L05817, https://doi.org/10.1029/2007gl033067, 2008c.
Heikkilä, U., Beer, J., and Feichter, J.: Meridional transport and deposition of atmospheric 10Be, Atmos. Chem. Phys., 9, 515–527, https://doi.org/10.5194/acp-9-515-2009, 2009.
Heikkilä, U., Beer, J., Abreu, J. A., and Steinhilber, F.: On the Atmospheric Transport and Deposition of the Cosmogenic Radionuclides (10Be): A Review, Space Sci. Rev., 176, 321–332, https://doi.org/10.1007/s11214-011-9838-0, 2013.
Herbst, K., Muscheler, R., and Heber, B.: The new local interstellar spectra and their influence on the production rates of the cosmogenic radionuclides 10Be and 14C, J. Geophys. Res.-Space Phys., 122, 23–34, https://doi.org/10.1002/2016ja023207, 2017.
Hernandez-Ceballos, M. A., Cinelli, G., Ferrer, M. M., Tollefsen, T., De Felice, L., Nweke, E., Tognoli, P. V., Vanzo, S., and De Cort, M.: A climatology of 7Be in surface air in European Union, J. Environ. Radioact., 141, 62–70, https://doi.org/10.1016/j.jenvrad.2014.12.003, 2015.
Hernández-Ceballos, M. A., Brattich, E., Cinelli, G., Ajtić, J., and Djurdjevic, V.: Seasonality of 7Be concentrations in Europe and influence of tropopause height, Tellus B, 68, 29534, https://doi.org/10.3402/tellusb.v68.29534, 2016.
Hernández-Ceballos, M. A., Brattich, E., and Ajtić, J.: Airflow and teleconnection patterns driving the spatial and temporal variability of high 7Be air concentrations in Europe, Chemosphere, 303, 135194, https://doi.org/10.1016/j.chemosphere.2022.135194, 2022.
Hu, J., Sha, Z., Wang, J., Du, J., and Ma, Y.: Atmospheric deposition of 7Be, 210Pb in Xining, a typical city on the Qinghai-Tibet Plateau, China, J. Radioanal. Nucl. Ch., 324, 1141–1150, https://doi.org/10.1007/s10967-020-07127-3, 2020.
Huang, J., Kang, S., Shen, C., Cong, Z., Liu, K., Wang, W., and Liu, L.: Concentration and seasonal variation of 10Be in surface aerosols of Lhasa, Tibet, Chinese Sci. Bull., 55, 2572–2578, https://doi.org/10.1007/s11434-010-3233-1, 2010.
Huh, C.-A., Su, C.-C., and Shiau, L.-J.: Factors controlling temporal and spatial variations of atmospheric deposition of 7Be and 210Pb in northern Taiwan, J. Geophys. Res., 111, D16304, https://doi.org/10.1029/2006jd007180, 2006.
Ioannidou, A. and Papastefanou, C.: Precipitation scavenging of 7Be and 137Cs radionuclides in air, J. Environ. Radioact., 85, 121–136, https://doi.org/10.1016/j.jenvrad.2005.06.005, 2006.
Jordan, C. E., Dibb, J. E., and Finkel, R. C.: tracer of atmospheric transport and stratosphere-troposphere exchange, J. Geophys. Res.-Atmos., 108, 4234, https://doi.org/10.1029/2002JD002395, 2003.
Koch, D. and Rind, D.: Beryllium 10/beryllium 7 as a tracer of stratospheric transport, J. Geophys. Res.-Atmos., 103, 3907–3917, https://doi.org/10.1029/97JD03117, 1998.
Koch, D. M., Jacob, D. J., and Graustein, W. C.: Vertical transport of tropospheric aerosols as indicated by 7Be and 210Pb in a chemical tracer model, J. Geophys. Res.-Atmos., 101, 18651–18666, https://doi.org/10.1029/96JD01176, 1996.
Koldobskiy, S. A., Bindi, V., Corti, C., Kovaltsov, G. A., and Usoskin, I. G.: Validation of the Neutron Monitor Yield Function Using Data From AMS-02 Experiment, 2011–2017, J. Geophys. Res.-Space Phys., 124, 2367–2379, https://doi.org/10.1029/2018ja026340, 2019.
Kong, Y. C., Lee, O. S. M., and Yung, C. H.: Study of the naturally occurring radionuclide Beryllium-7 (Be-7) in Hong Kong, J. Environ. Radioact., 246, 106850, https://doi.org/10.1016/j.jenvrad.2022.106850, 2022.
Kusmierczyk-Michulec, J., Gheddou, A., and Nikkinen, M.: Influence of precipitation on 7Be concentrations in air as measured by CTBTO global monitoring system, J. Environ. Radioact., 144, 140–151, https://doi.org/10.1016/j.jenvrad.2015.03.014, 2015.
Lal, D. and Peters, B.: Cosmic Ray Produced Radioactivity on the Earth, in: Kosmische Strahlung II / Cosmic Rays II, edited by: Sitte, K., Springer Berlin Heidelberg, Berlin, Heidelberg, 551–612, https://doi.org/10.1007/978-3-642-46079-1_7, 1967.
Lee, H. I., Huh, C. A., Lee, T., and Huang, N. E.: Time series study of a 17-year record of 7Be and 210Pb fluxes in northern Taiwan using ensemble empirical mode decomposition, J. Environ. Radioact., 147, 14–21, https://doi.org/10.1016/j.jenvrad.2015.04.017, 2015.
Leppänen, A. P., Pacini, A. A., Usoskin, I. G., Aldahan, A., Echer, E., Evangelista, H., Klemola, S., Kovaltsov, G. A., Mursula, K., and Possnert, G.: Cosmogenic 7Be in air: A complex mixture of production and transport, J. Atmos. Solar-Terr. Phy., 72, 1036–1043, https://doi.org/10.1016/j.jastp.2010.06.006, 2010.
Lin, J.-T. and McElroy, M. B.: Impacts of boundary layer mixing on pollutant vertical profiles in the lower troposphere: Implications to satellite remote sensing, Atmos. Environ., 44, 1726–1739, https://doi.org/10.1016/j.atmosenv.2010.02.009, 2010.
Lin, S.-J. and Rood, R. B.: Multidimensional Flux-Form Semi-Lagrangian Transport Schemes, Mon. Weather Rev., 124, 2046–2070, https://doi.org/10.1175/1520-0493(1996)124<2046:MFFSLT>2.0.CO;2, 1996.
Liu, H., Jacob, D. J., Bey, I., and Yantosca, R. M.: Constraints from 210Pb and 7Be on wet deposition and transport in a global three-dimensional chemical tracer model driven by assimilated meteorological fields, J. Geophys. Res.-Atmos., 106, 12109–12128, https://doi.org/10.1029/2000jd900839, 2001.
Liu, H., Jacob, D. J., Dibb, J. E., Fiore, A. M., and Yantosca, R. M.: Constraints on the sources of tropospheric ozone from 210Pb-7Be-O3 correlations, J. Geophys. Res.-Atmos., 109, D07306, https://doi.org/10.1029/2003JD003988, 2004.
Liu, H., Considine, D. B., Horowitz, L. W., Crawford, J. H., Rodriguez, J. M., Strahan, S. E., Damon, M. R., Steenrod, S. D., Xu, X., Kouatchou, J., Carouge, C., and Yantosca, R. M.: Using beryllium-7 to assess cross-tropopause transport in global models, Atmos. Chem. Phys., 16, 4641–4659, https://doi.org/10.5194/acp-16-4641-2016, 2016.
Liu, X., Fu, Y., Bi, Y., Zhang, L., Zhao, G., Xian, F., and Zhou, W.: Monitoring Surface Directly Reveals Stratospheric Air Intrusion in Sichuan Basin, China, J. Geophys. Res.-Atmos., 127, e2022JD036543, https://doi.org/10.1029/2022JD036543, 2022a.
Liu, X., Fu, Y., Wang, Q., Bi, Y., Zhang, L., Zhao, G., Xian, F., Cheng, P., Zhang, L., Zhou, J., and Zhou, W.: Unraveling the process of aerosols secondary formation and removal based on cosmogenic beryllium-7 and beryllium-10, Sci. Total Environ., 821, 153293, https://doi.org/10.1016/j.scitotenv.2022.153293, 2022b.
Maejima, Y., Matsuzaki, H., and Higashi, T.: Application of cosmogenic 10Be to dating soils on the raised coral reef terraces of Kikai Island, southwest Japan, Geoderma, 126, 389–399, https://doi.org/10.1016/j.geoderma.2004.10.004, 2005.
Mari, C., Jacob, D. J., and Bechtold, P.: Transport and scavenging of soluble gases in a deep convective cloud, J. Geophys. Res.-Atmos., 105, 22255–22267, https://doi.org/10.1029/2000JD900211, 2000.
Masarik, J. and Beer, J.: Simulation of particle fluxes and cosmogenic nuclide production in the Earth's atmosphere, J. Geophys. Res.-Atmos., 104, 12099–12111, https://doi.org/10.1029/1998jd200091, 1999.
Masarik, J. and Beer, J.: An updated simulation of particle fluxes and cosmogenic nuclide production in the Earth's atmosphere, J. Geophys. Res., 114, D11103, https://doi.org/10.1029/2008jd010557, 2009.
Méndez-García, C. G., Rojas-López, G., Padilla, S., Solís, C., Chávez, E., Acosta, L., and Huerta, A.: The impact of stable 27Al in 26Al/10Be meteoric ratio in PM2.5 from an urban area, J. Environ. Radioact., 246, 106832, https://doi.org/10.1016/j.jenvrad.2022.106832, 2022.
Monaghan, M. C., Krishnaswami, S., and Turekian, K. K.: The global-average production rate of 10Be, Earth Planet. Sc. Lett., 76, 279–287, https://doi.org/10.1016/0012-821X(86)90079-8, 1986.
Murray, L. T., Leibensperger, E. M., Orbe, C., Mickley, L. J., and Sulprizio, M.: GCAP 2.0: a global 3-D chemical-transport model framework for past, present, and future climate scenarios, Geosci. Model Dev., 14, 5789–5823, https://doi.org/10.5194/gmd-14-5789-2021, 2021.
Muscheler, R., Joos, F., Beer, J., Müller, S. A., Vonmoos, M., and Snowball, I.: Solar activity during the last 1000yr inferred from radionuclide records, Quaternary Sci. Rev., 26, 82–97, https://doi.org/10.1016/j.quascirev.2006.07.012, 2007.
Myers, J. L., Well, A. D., and Lorch Jr, R. F., Riegert, D. (Ed.): Research Design and Statistical Analysis, 3rd Edition, Routledge, https://doi.org/10.4324/9780203726631, 2013.
Nevalainen, J., Usoskin, I. G., and Mishev, A.: Eccentric dipole approximation of the geomagnetic field: Application to cosmic ray computations, Adv. Space Res., 52, 22–29, https://doi.org/10.1016/j.asr.2013.02.020, 2013.
Pacini, A. A., Usoskin, I. G., Mursula, K., Echer, E., and Evangelista, H.: Signature of a sudden stratospheric warming in the near-ground 7Be flux, Atmos. Environ., 113, 27–31, https://doi.org/10.1016/j.atmosenv.2015.04.065, 2015.
Padilla, S., Lopez-Gutierrez, J. M., Manjon, G., Garcia-Tenorio, R., Galvan, J. A., and Garcia-Leon, M.: Meteoric 10Be in aerosol filters in the city of Seville, J. Environ. Radioact., 196, 15–21, https://doi.org/10.1016/j.jenvrad.2018.10.009, 2019.
Pedro, J. B., Heikkilä, U. E., Klekociuk, A., Smith, A. M., van Ommen, T. D., and Curran, M. A. J.: Beryllium-10 transport to Antarctica: Results from seasonally resolved observations and modeling, J. Geophys. Res.-Atmos., 116, D23120, https://doi.org/10.1029/2011jd016530, 2011a.
Pedro, J. B., Smith, A. M., Simon, K. J., van Ommen, T. D., and Curran, M. A. J.: High-resolution records of the beryllium-10 solar activity proxy in ice from Law Dome, East Antarctica: measurement, reproducibility and principal trends, Clim. Past, 7, 707–721, https://doi.org/10.5194/cp-7-707-2011, 2011b.
Pedro, J. B., McConnell, J. R., van Ommen, T. D., Fink, D., Curran, M. A. J., Smith, A. M., Simon, K. J., Moy, A. D., and Das, S. B.: Solar and climate influences on ice core 10Be records from Antarctica and Greenland during the neutron monitor era, Earth Planet. Sc. Lett., 355–356, 174–186, https://doi.org/10.1016/j.epsl.2012.08.038, 2012.
Pilchowski, J., Kopp, A., Herbst, K., and Heber, B.: On the definition and calculation of a generalised McIlwain parameter, Astrophys. Space Sci. Trans., 6, 9–17, https://doi.org/10.5194/astra-6-9-2010, 2010.
Poluianov, S. V., Kovaltsov, G. A., Mishev, A. L., and Usoskin, I. G.: Production of cosmogenic isotopes 7Be, 10Be,14C, 22Na, and 36Cl in the atmosphere: Altitudinal profiles of yield functions, J. Geophys. Res.-Atmos., 121, 8125–8136, https://doi.org/10.1002/2016jd025034, 2016.
Raisbeck, G. M., Yiou, F., Fruneau, M., Loiseaux, J. M., Lieuvin, M., and Ravel, J. C.: Deposition rate and seasonal variations in precipitation of cosmogenic 10Be, Nature, 282, 279–280, https://doi.org/10.1038/282279a0, 1979.
Raisbeck, G. M., Yiou, F., Fruneau, M., Loiseaux, J. M., Lieuvin, M., and Ravel, J. C.: Cosmogenic as a probe of atmospheric transport processes, Geophys. Res. Lett., 8, 1015–1018, https://doi.org/10.1029/GL008i009p01015, 1981.
Rodriguez-Perulero, A., Baeza, A., and Guillen, J.: Seasonal evolution of 7,10Be and 22Na in the near surface atmosphere of Caceres (Spain), J. Environ. Radioact., 197, 55–61, https://doi.org/10.1016/j.jenvrad.2018.11.015, 2019.
Sangiorgi, M., Hernández Ceballos, M. A., Iurlaro, G., Cinelli, G., and de Cort, M.: 30 years of European Commission Radioactivity Environmental Monitoring data bank (REMdb) – an open door to boost environmental radioactivity research, Earth Syst. Sci. Data, 11, 589–601, https://doi.org/10.5194/essd-11-589-2019, 2019.
Smart, D. F. and Shea, M. A.: A review of geomagnetic cutoff rigidities for earth-orbiting spacecraft, Adv. Space Res., 36, 2012–2020, https://doi.org/10.1016/j.asr.2004.09.015, 2005.
Somayajulu, B. L. K., Sharma, P., Beer, J., Bonani, G., Hofmann, H. J., Morenzoni, E., Nessi, M., Suter, M., and Wölfli, W.: 10Be annual fallout in rains in India, Nuclear Instruments and Methods in Physics Research Section B, 5, 398–403, https://doi.org/10.1016/0168-583X(84)90549-4, 1984.
Spiegl, T. C., Yoden, S., Langematz, U., Sato, T., Chhin, R., Noda, S., Miyake, F., Kusano, K., Schaar, K., and Kunze, M.: Modeling the Transport and Deposition of 10Be Produced by the Strongest Solar Proton Event During the Holocene, J. Geophys. Res.-Atmos., 127, e2021JD035658, https://doi.org/10.1029/2021JD035658, 2022.
Sukhodolov, T., Usoskin, I., Rozanov, E., Asvestari, E., Ball, W. T., Curran, M. A., Fischer, H., Kovaltsov, G., Miyake, F., Peter, T., Plummer, C., Schmutz, W., Severi, M., and Traversi, R.: Atmospheric impacts of the strongest known solar particle storm of 775 AD, Sci. Rep., 7, 45257, https://doi.org/10.1038/srep45257, 2017.
Terzi, L. and Kalinowski, M.: World-wide seasonal variation of 7Be related to large-scale atmospheric circulation dynamics, J. Environ. Radioact., 178–179, 1–15, https://doi.org/10.1016/j.jenvrad.2017.06.031, 2017.
Terzi, L., Kalinowski, M., Schoeppner, M., and Wotawa, G.: How to predict seasonal weather and monsoons with radionuclide monitoring, Sci. Rep., 9, 2729, https://doi.org/10.1038/s41598-019-39664-7, 2019.
Uhlar, R., Harokova, P., Alexa, P., and Kacmarik, M.: 7Be atmospheric activity concentration and meteorological data: Statistical analysis and two-layer atmospheric model, J. Environ. Radioact., 219, 106278, https://doi.org/10.1016/j.jenvrad.2020.106278, 2020.
Usoskin, I. G., Field, C. V., Schmidt, G. A., Leppänen, A.-P., Aldahan, A., Kovaltsov, G. A., Possnert, G., and Ungar, R. K.: Short-term production and synoptic influences on atmospheric 7Be concentrations, J. Geophys. Res., 114, D06108, https://doi.org/10.1029/2008jd011333, 2009.
Villarreal, R. E., Arazi, A., and Fernandez Niello, J. O.: Correlation between the latitudinal profile of the 7Be air concentration and the Hadley cell extent in the Southern Hemisphere, J. Environ. Radioact., 244–245, 106760, https://doi.org/10.1016/j.jenvrad.2021.106760, 2022.
Wang, Q., Jacob, D. J., Fisher, J. A., Mao, J., Leibensperger, E. M., Carouge, C. C., Le Sager, P., Kondo, Y., Jimenez, J. L., Cubison, M. J., and Doherty, S. J.: Sources of carbonaceous aerosols and deposited black carbon in the Arctic in winter-spring: implications for radiative forcing, Atmos. Chem. Phys., 11, 12453–12473, https://doi.org/10.5194/acp-11-12453-2011, 2011.
Waugh, D. and Hall, T.: Age of Stratospheric Air: Theory, Observations, and Models, Rev. Geophys., 40, 1-1–1-26, https://doi.org/10.1029/2000rg000101, 2002.
Wesely, M. L.: Parameterization of surface resistances to gaseous dry deposition in regional-scale numerical models, Atmos. Environ., 23, 1293–1304, https://doi.org/10.1016/0004-6981(89)90153-4, 1989.
Wu, S., Mickley, L. J., Jacob, D. J., Logan, J. A., Yantosca, R. M., and Rind, D.: Why are there large differences between models in global budgets of tropospheric ozone?, J. Geophys. Res.-Atmos., 112, D05302, https://doi.org/10.1029/2006JD007801, 2007.
Yamagata, T., Nagai, H., Matsuzaki, H., and Narasaki, Y.: Decadal variations of atmospheric 7Be and 10Be concentrations between 1998 and 2014 in Japan, Nuclear Instruments and Methods in Physics Research Section B, 455, 265–270, https://doi.org/10.1016/j.nimb.2018.12.029, 2019.
Yu, K., Keller, C. A., Jacob, D. J., Molod, A. M., Eastham, S. D., and Long, M. S.: Errors and improvements in the use of archived meteorological data for chemical transport modeling: an analysis using GEOS-Chem v11-01 driven by GEOS-5 meteorology, Geosci. Model Dev., 11, 305–319, https://doi.org/10.5194/gmd-11-305-2018, 2018.
Zhang, B., Liu, H., Crawford, J. H., Chen, G., Fairlie, T. D., Chambers, S., Kang, C.-H., Williams, A. G., Zhang, K., Considine, D. B., Sulprizio, M. P., and Yantosca, R. M.: Simulation of radon-222 with the GEOS-Chem global model: emissions, seasonality, and convective transport, Atmos. Chem. Phys., 21, 1861–1887, https://doi.org/10.5194/acp-21-1861-2021, 2021.
Zhang, F., Wang, J., Baskaran, M., Zhong, Q., Wang, Y., Paatero, J., and Du, J.: A global dataset of atmospheric 7Be and 210Pb measurements: annual air concentration and depositional flux, Earth Syst. Sci. Data, 13, 2963–2994, https://doi.org/10.5194/essd-13-2963-2021, 2021.
Zheng, M., Adolphi, F., Sjolte, J., Aldahan, A., Possnert, G., Wu, M., Chen, P., and Muscheler, R.: Solar and climate signals revealed by seasonal 10Be data from the NEEM ice core project for the neutron monitor period, Earth Planet. Sc. Lett., 541, 116273, https://doi.org/10.1016/j.epsl.2020.116273, 2020.
Zheng, M., Adolphi, F., Sjolte, J., Aldahan, A., Possnert, G., Wu, M., Chen, P., and Muscheler, R.: Solar Activity of the Past 100 Years Inferred From 10Be in Ice Cores – Implications for Long-Term Solar Activity Reconstructions, Geophys. Res. Lett., 48, e2020GL090896, https://doi.org/10.1029/2020GL090896, 2021a.
Zheng, M., Sjolte, J., Adolphi, F., Aldahan, A., Possnert, G., Wu, M., and Muscheler, R.: Solar and meteorological influences on seasonal atmospheric 7Be in Europe for 1975 to 2018, Chemosphere, 263, 128318, https://doi.org/10.1016/j.chemosphere.2020.128318, 2021b.
Zheng, M., Adolphi, F., Paleari, C., Tao, Q., Erhardt, T., Christl, M., Wu, M., Lu, Z., Hörhold, M., Chen, P., and Muscheler, R.: Solar, Atmospheric, and Volcanic Impacts on 10Be Depositions in Greenland and Antarctica During the Last 100 Years, J. Geophys. Res.-Atmos., 128, e2022JD038392, https://doi.org/10.1029/2022JD038392, 2023a.
Zheng, M., Liu, H., Adolphi, F., Muscheler, R., Lu, Z., Wu, M., and Prisle, N. L.: Simulations of 7Be and 10Be with the GEOS-Chem global model v14.0.2 using state-of-the-art production rates, Zenodo [code and data set], https://doi.org/10.5281/zenodo.8372652, 2023b.