the Creative Commons Attribution 4.0 License.
the Creative Commons Attribution 4.0 License.
 | 08 Nov 2023
Rapid O3 assimilations – Part 1: Background and local contributions to tropospheric O3 changes in China in 2015–2020
Rui Zhu
Zhaojun Tang
Xiaokang Chen
Xiong Liu
A single ozone (O3) tracer mode was developed in this work to build the capability of the Goddard Earth Observing System model with Chemistry (GEOS-Chem) for rapid O3 simulation. The single O3 tracer simulation demonstrates consistency with the GEOS-Chem full chemistry simulation, with dramatic reductions in computational costs of approximately 91 %–94 %. The single O3 tracer simulation was combined with surface and Ozone Monitoring Instrument (OMI) O3 observations to investigate the changes in tropospheric O3 over eastern China in 2015–2020. The assimilated O3 concentrations demonstrate good agreement with O3 observations because surface O3 concentrations are 43.2, 41.8, and 42.1 ppb and tropospheric O3 columns are 37.1, 37.9, and 38.0 DU in the simulations, assimilations, and observations, respectively. The assimilations indicate rapid rises in surface O3 concentrations by 1.60 (spring), 1.16 (summer), 1.47 (autumn), and 0.80 ppb yr−1 (winter) over eastern China in 2015–2020, and the increasing trends are underestimated by the a priori simulations. More attention is suggested to the rapid increases in the O3 pollution in spring and autumn. We find stronger rises in tropospheric O3 columns over highly polluted areas due to larger local contributions, for example, 0.12 DU yr−1 (North China Plain) in contrast to −0.29 (Sichuan Basin) and −0.25 DU yr−1 (southern China). Furthermore, our analysis demonstrated noticeable contributions of the interannual variability in background O3 to the trends in surface O3 (particularly in the summer) and tropospheric O3 columns over eastern China in 2015–2020. This work highlights the importance of rapid simulations and assimilations to extend and interpret atmospheric O3 observations.
- Article
(13745 KB) - Full-text XML
- Companion paper
-
Supplement
(1572 KB) - BibTeX
- EndNote


Tropospheric ozone (O3) is produced when volatile organic compounds (VOCs) and carbon monoxide (CO) are photochemically oxidized in the presence of nitrogen oxides (NOx). Tropospheric O3 has important influences on the climate (Mickley, 2004; Iglesias-Suarez et al., 2018), atmospheric oxidation capacity (Thompson, 1992; Prinn, 2003), human health, and crop growth (Zhang et al., 2021; Li et al., 2022). The important role of O3 in the atmosphere has led to many efforts focusing on O3 observations that have improved our understanding of atmospheric O3 (Logan et al., 2012; Oetjen et al., 2016; Parrish et al., 2021). The limited spatial coverage of O3 observations promotes the efforts of spatial extensions of O3 observations (Chang et al., 2015; Peng et al., 2016). Recent advances in machine learning techniques further provide a new method to extend O3 observations by fusing satellite and surface observations (Li et al., 2020; Liu et al., 2022; Wei et al., 2022).
Chemical transport models (CTMs), as powerful tools, have been widely used to simulate and interpret observed O3 variabilities (Parrington et al., 2012; Jiang et al., 2016; K. Li et al., 2019). Despite the advances in CTMs, an accurate simulation of observed O3 is still challenging because of uncertainties in physical and chemical processes (Peng et al., 2021; Chen et al., 2022), emission inventories (Elguindi et al., 2020; Jiang et al., 2022), and coarse model resolutions (Schaap et al., 2015; Benavides et al., 2021). Furthermore, the high computational cost is a bottleneck for rapid simulations, which poses a possible barrier to better understanding tropospheric O3. Alternatively, researchers may consider simulations of atmospheric O3 with the archived O3 product and loss rates. For example, the tagged-Ox mode of the Goddard Earth Observing System model with Chemistry (GEOS-Chem) has been used to analyze the sources and transport of tropospheric O3 (Zhang et al., 2008; Zhu et al., 2017; Han et al., 2018). However, it may not be an ideal choice to perform O3 simulations based on the tagged-Ox mode because Ox is the combination of multiple species (O) and thus cannot be accurately compared with O3 observations.
In this study, we developed the single O3 tracer mode (tagged-O3) of the GEOS-Chem model, driven by archived O3 product and loss rates provided by GEOS-Chem full-chemistry simulations, to build the capability of the GEOS-Chem model for rapid simulations of tropospheric O3 (rather than Ox). Data assimilations, by combining modeled and observed O3 concentrations, can take advantage of both simulations and observations to produce more accurate O3 concentrations (Parrington et al., 2008; Ma et al., 2019; Huijnen et al., 2020). The single O3 tracer simulations were thus further combined with the Ozone Monitoring Instrument (OMI) and China Ministry of Ecology and Environment (MEE) monitoring network O3 observations (in this paper) and United States (U.S.) Air Quality System (AQS) and European AirBase network O3 observations (in the companion paper, Part 2; see Zhu et al., 2023) via a sequential Kalman filter (KF) assimilation system (Tang et al., 2022; Han et al., 2022) to perform a comparative analysis to investigate the changes in tropospheric O3 in eastern China in 2015–2020 (in this paper) and the USA and Europe in 2005–2020 (Zhu et al., 2023).
Satellite instruments provide globally covered O3 observations that are sensitive to O3 concentrations in the free troposphere. The OMI-based assimilations can thus reflect the optimized adjustments in both global background and local O3 concentrations. On the other hand, surface observations are sensitive to local O3 concentrations. Surface-observation-based assimilations can reflect the optimized adjustments in local contributions, and the information of local contributions can be transported into the free troposphere via vertical convection in the assimilation processes, which is different from the fusion of satellite and surface observations (Li et al., 2020; Liu et al., 2022; Wei et al., 2022). Consequently, a comparative analysis by assimilating satellite and surface O3 observations is useful for better characterization of O3 changes in the surface and free troposphere. Furthermore, the low computational costs of the single O3 tracer simulations allow us to design and perform different experiments much more efficiently. Multiple simulation and assimilation experiments (see details in Table 1) were thus conducted in this work to analyze the impacts of background O3 (particularly, the interannual and seasonal variabilities in the background O3 and optimization in the background O3) and local O3 formation on the changes in surface and free-tropospheric O3 over eastern China.
Table 1Single O3 tracer simulation and assimilation experiments (Exp.) conducted in this work. Exp. no. 1: the main a priori simulation; Exp. no. 2: the O3 boundary conditions and stratospheric O3 concentrations are fixed in 2015; Exp. no. 3: the O3 boundary conditions and stratospheric O3 concentrations are fixed in the spring; Exp. no. 4: the O3 formation rates within the North China Plain (NCP) planetary boundary layer (PBL) are set to zero; Exp. no. 5: the main assimilation by assimilating MEE surface O3 observations with γ=0.8; Exp. no. 6: only the surface O3 concentrations are adjusted (γ=0); Exp. no. 7: the full mixing of O3 biases within the PBL (γ=1.0); Exp. no. 8: the main assimilation by assimilating OMI O3 observations; Exp. no. 9: the O3 boundary conditions are not optimized; Exp. no. 10: assimilating OMI O3 observations at across-track positions 4–27.
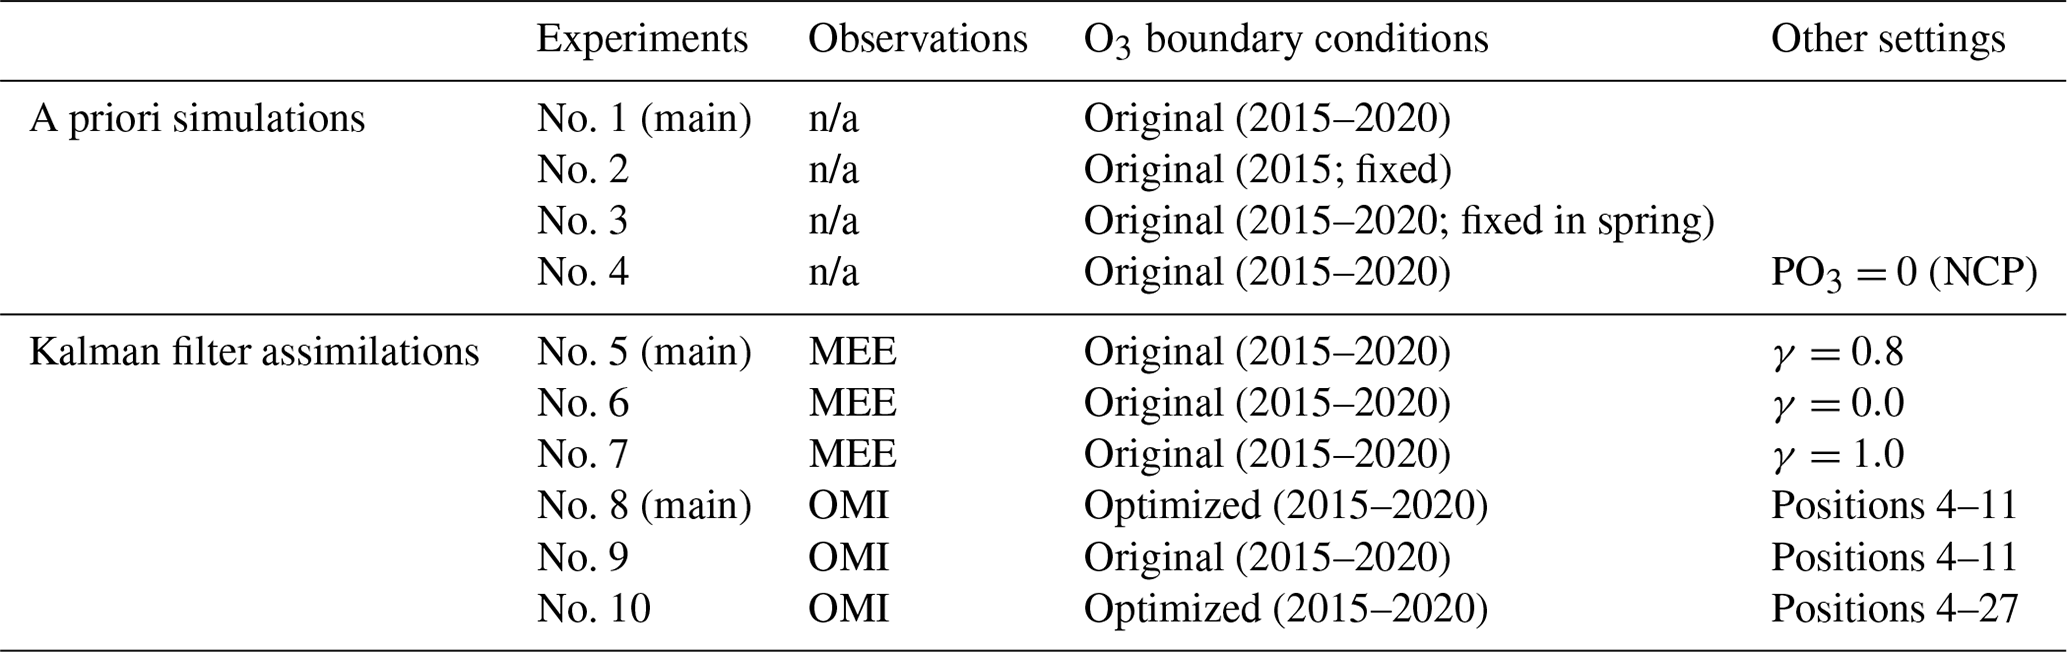
n/a is for not applicable.
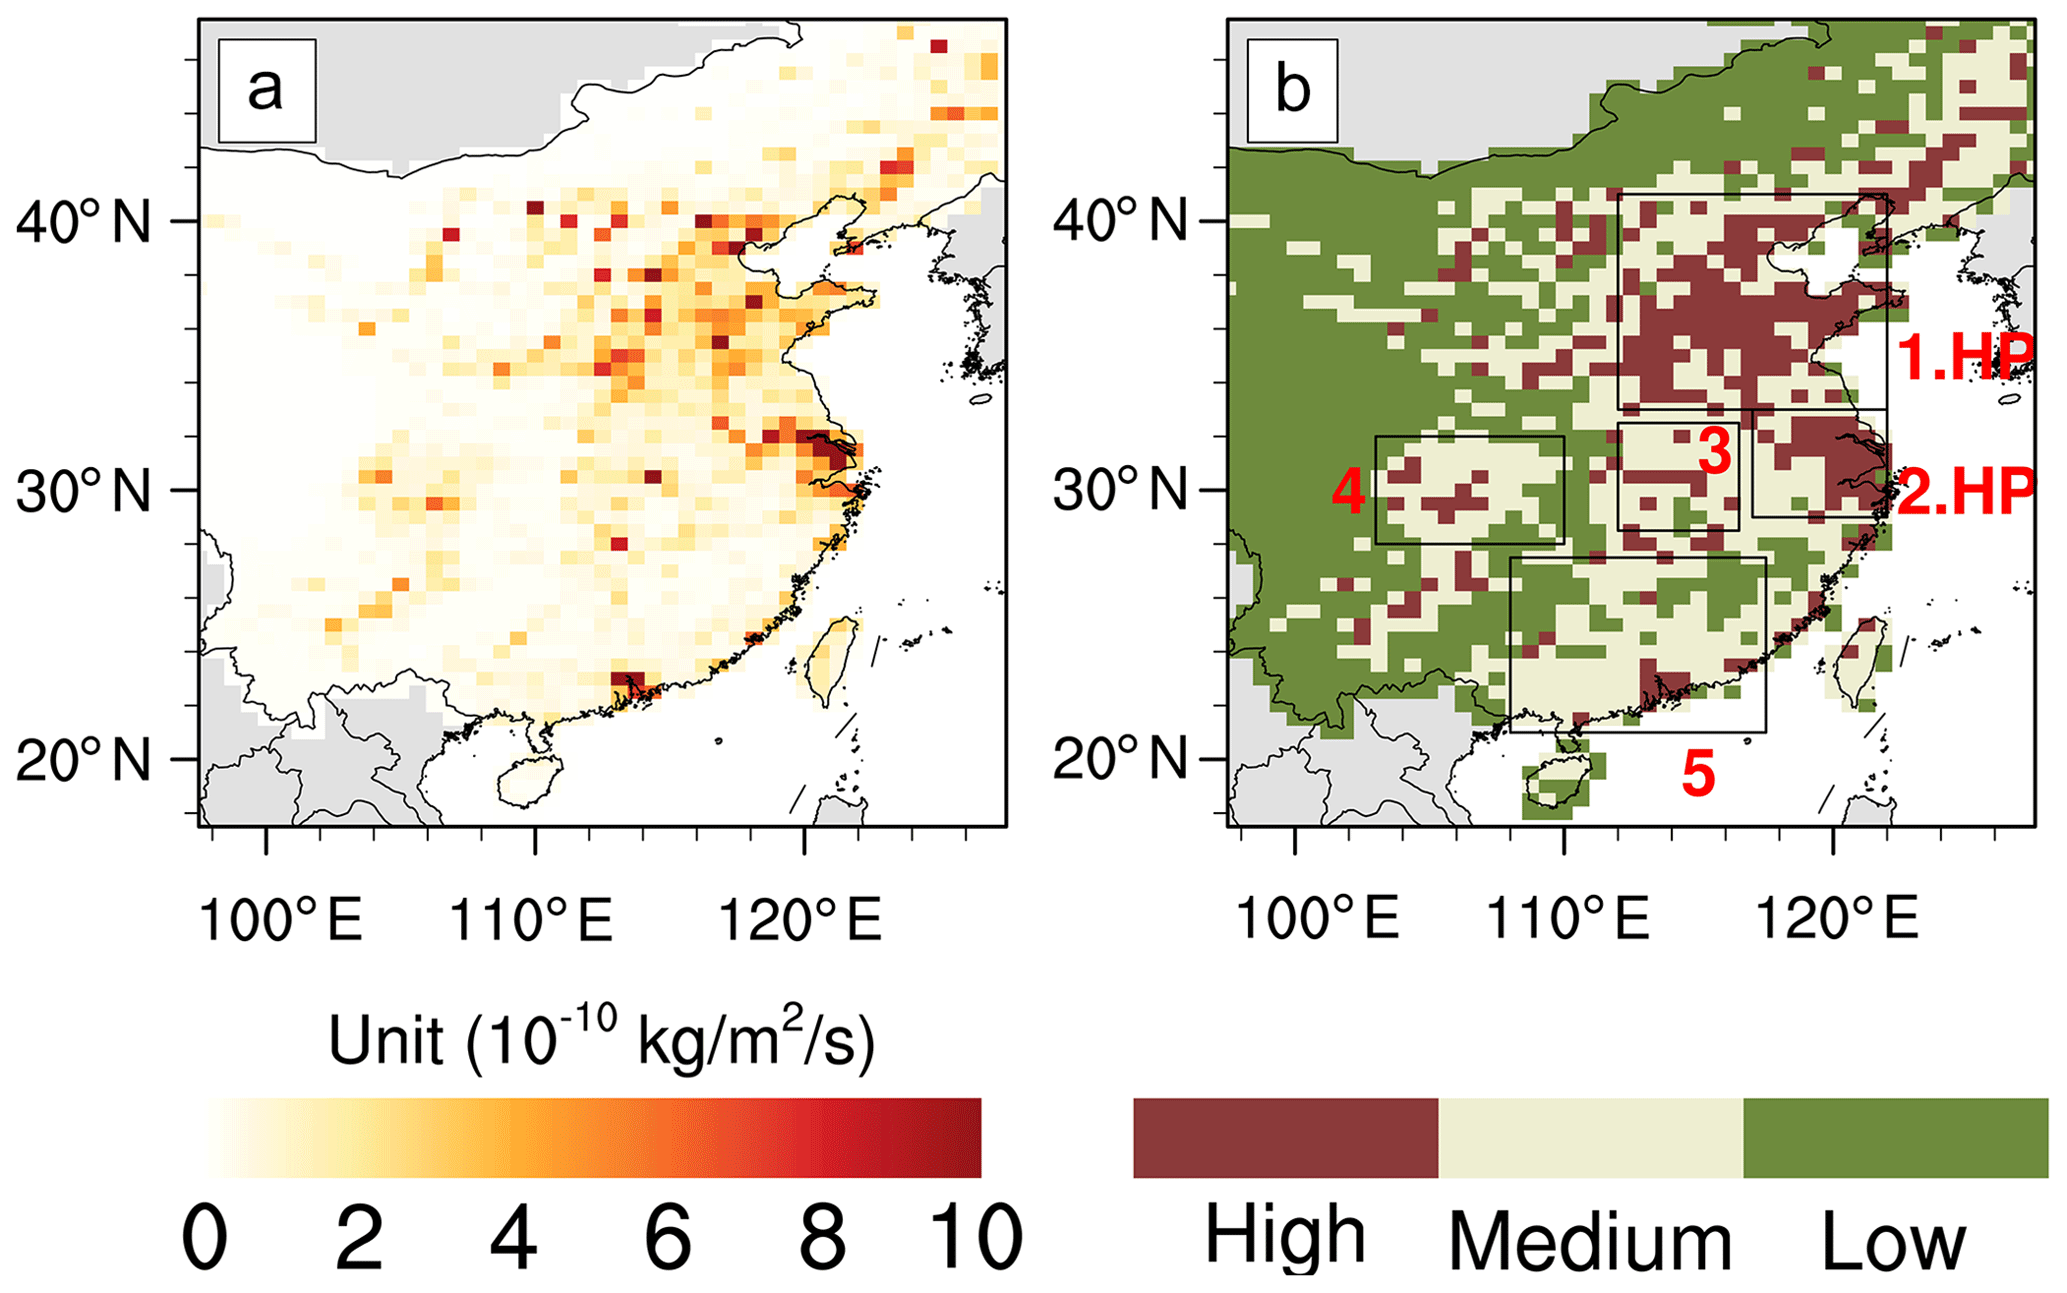
Figure 1(a) Anthropogenic NOx emissions over eastern China in 2015. (b) Region definitions for the North China Plain (no. 1), Yangtze River Delta (no. 2), central China (no. 3), the Sichuan Basin (no. 4), and southern China (no. 5). The different colors (red, gray, and green) represent grids with high (highest 15 %), medium (15 %–50 %), and low (lowest 50 %) anthropogenic NOx emissions. Regions no. 1 and no. 2 are defined as highly polluted (HP) regions, by excluding grids with low and medium anthropogenic NOx emissions.
This paper is organized as follows: in Sect. 2, we provide descriptions of the MEE and OMI O3 observations, the GEOS-Chem model, and the single O3 tracer simulation and assimilation system used in this work. Tropospheric O3 changes in eastern China in 2015–2020 are then demonstrated in Sect. 3 by assimilating MEE and OMI O3 observations. As shown in Fig. 1, five regions (i.e., North China Plain (no. 1), Yangtze River Delta (no. 2), central China (no. 3), the Sichuan Basin (no. 4) and southern China (no. 5)) are defined within the eastern China domain. Regions no. 1 and no. 2 are defined as highly polluted (HP) regions by excluding grids with low and medium anthropogenic NOx emissions. Tropospheric O3 changes over these regions are discussed to investigate the possible regional discrepancies in surface and free-tropospheric O3 associated with different local pollution levels. Our conclusions follow in Sect. 4.
2.1 Surface O3 measurements
We use MEE surface in situ O3 concentration data (https://quotsoft.net/air/, last access: 2 November 2023) for the period 2015–2020. These real-time monitoring stations report hourly concentrations of criteria pollutants from 1691 sites in 2020. All stations (1441 urban sites and 250 urban background sites) are assimilated in our analysis. Concentrations were reported by the MEE (in µg m−3) under standard temperature (273 K) until 31 August 2018. This reference state was changed on 1 September 2018 to 298 K. We converted the O3 concentrations to parts per billion (ppb) and rescaled the post-August 2018 concentrations to the standard temperature (273 K) to maintain consistency in the trend analysis. It should be noted that the assimilation of O3 observations from urban and urban background sites may result in possible overestimation of surface O3 concentrations over rural areas.
2.2 OMI PROFOZ product
The OMI instrument was launched in July 2004 on the Aura spacecraft, with a spatial resolution of 13×24 km (nadir view). It provides globally covered measurements with backscattered sunlight in the ultraviolet visible range from 270 to 500 nm (UV1 270–310 nm; UV2 310–365 nm; visible 350–500 nm). In this study, we use the OMI O3 profile retrieval product (PROFOZ v0.9.3, level 2; Liu et al., 2010; Huang et al., 2017) from the Smithsonian Astrophysical Observatory (SAO). The retrieval uses the vector-linearized discrete ordinate radiative transfer model (VLIDORT; Spurr, 2006) and Bayesian optimal estimation. Profiles of partial O3 columns (units in DU) are retrieved in the spectral region of 270–330 nm, with 24 vertical layers and approximately 2.5 km for each layer from the surface to approximately 60 km. The following filters are applied in our analysis, following Huang et al. (2017): (1) nearly clear-sky scenes, with effective cloud fraction <0.3; (2) solar zenith angles (SZAs)<75∘; and (3) fitting root mean square (rms; ratio of fitting residuals to assumed measurement error) <2.0.
Starting in 2009, anomalies were found in the OMI data and diagnosed as attenuated measured radiances in certain cross-track positions. This instrument degradation has been referred to as the “row anomaly”. To enhance the quality and stability of the data, only across-track positions between 4–11 (within 30 positions in the UV1 channels) are assimilated in our main assimilation experiment (Exp. no. 8). This treatment is similar to the production of row-isolated data by using across-track positions between 3–18 (within 60 positions in the UV2 channels) in the OMI/Microwave Limb Sounder (MLS) O3 data (Ziemke et al., 2019; X. Wang et al., 2022). The effects of the usage of row-isolated data will be evaluated by comparing the main assimilation experiment with the sensitivity assimilation experiment (Exp. no. 10) by assimilating OMI O3 observations at across-track positions 4–27.
The modeled tropospheric O3 profiles in the assimilation processes and subsequent analyses are convolved by using the OMI retrieval averaging kernels and a priori O3 profile, based on the following equation (Liu et al., 2010; Huang et al., 2017):
where is the modeled O3 profile convolved by the retrieval averaging kernels, xa is the OMI a priori O3 profile, x is the modeled O3 profile, and A is the OMI averaging kernel matrix. Here , representing the sensitivity of the retrieved partial O3 column (DU) at layer j to the change in O3 (DU) at layer i. The unit for averaging kernels in this OMI product is DU/DU (where DU represents Dobson unit) because the conversion from Dobson units to parts per billion varies with altitude.
2.3 GEOS-Chem model configuration
The GEOS-Chem chemical transport model (http://www.geos-chem.org, last access: 2 November 2023, version 12-8-1) is driven by assimilated meteorological data from the Modern-Era Retrospective analysis for Research and Applications, version 2 (MERRA-2). The GEOS-Chem full chemistry simulation includes fully coupled O3–NOx–VOC–halogen–aerosol chemistry. Our analysis is conducted at a horizontal resolution of nested 0.5∘ × 0.625∘ over eastern China, with chemical boundary conditions archived every 3 h from global simulations with 4∘ × 5∘ resolution. Emissions are computed by the Harmonized Emissions Component (HEMCO). Global default anthropogenic emissions are from the CEDS (Community Emissions Data System; Hoesly et al., 2018). Regional emissions are replaced by MEIC (Multi-resolution Emission Inventory for China) in China and MIX in other regions of Asia (Li et al., 2017). The reference year for the CEDS inventory is 2010, with annual scaling factors in 2005–2014, and the reference year for the MEIC/MIX inventory is 2010, with annual scaling factors in 2008–2010 in the GEOS-Chem model. Open fire emissions are from the Global Fire Emissions Database (GFED4; van der Werf et al., 2010).
Following Jiang et al. (2022), the total anthropogenic NOx and VOC emissions in the GEOS-Chem model are scaled, based on Zheng et al. (2018) and M. Li et al. (2019), so that the modeled surface nitrogen dioxide (NO2) and O3 concentrations in the a priori simulations are identical to Jiang et al. (2022) in 2005–2018. The total anthropogenic NOx and VOC emissions in 2019–2020 are further scaled, based on linear projections. The total anthropogenic NOx emissions in the a priori simulations declined by 19 % in China in 2015–2020. The total anthropogenic VOC emissions in the a priori simulations increased by 1 % in China in 2015–2020. We refer the reader to Jiang et al. (2022) for the details of the model configuration and performance, particularly the modeled trends of surface and tropospheric column NO2 in 2005–2018.
2.4 Single O3 tracer simulation
A new chemical mechanism was developed in this work to allow the running of the single O3 tracer mode (tagged-O3). As shown in Fig. S1 (see the Supplement), the package of the Kinetic PreProcessor (KPP) module was modified to define the production (PO3) and loss (LO3) of O3. The GEOS-Chem full chemistry simulations with the updated KPP module were then performed to produce PO3 (unit kg cm−3 s−1) and relative LO3 (i.e., LO3 [O3], with units in cm−3 s−1) every 20 min. Here, the 20 min are selected to be the same as the chemical time step in the GEOS-Chem full chemistry mode to ensure consistency between the single O3 tracer and full chemistry simulations. The single O3 tracer simulation (tagged_o3_mod.F90) was then performed by reading the archived PO3 and relative LO3. Because we are interested in tropospheric chemistry, we archived O3 concentrations instead of O3 production and loss rates in the stratosphere in the full chemistry simulations. The archived stratospheric O3 concentrations were read in the single O3 tracer simulation process as being boundary conditions to ensure a reasonable stratospheric–tropospheric O3 exchange.
The major advantage of the single O3 tracer simulation is dramatic reductions in computational costs by approximately 91 %–94 %; for example, the computational costs (hours of wall time for 1-year simulation) are 57.5 and 5.2 h at the global scale (4∘ × 5∘) and 80.2 and 4.5 h within the nested China domain (0.5∘ × 0.625∘) by full chemistry and single O3 tracer simulations, respectively. Consequently, once PO3 and LO3 are produced, the computational costs of performing additional single O3 tracer simulations are almost negligible. The low computational costs of the single O3 tracer simulation allow us to design and perform different simulation and assimilation experiments much more efficiently. As shown in Table 1, there are 10 different simulation and assimilation experiments performed in this work, which requires 4812 h (wall time) with the full chemistry simulation but only 270 h (wall time) with the single O3 tracer simulation.
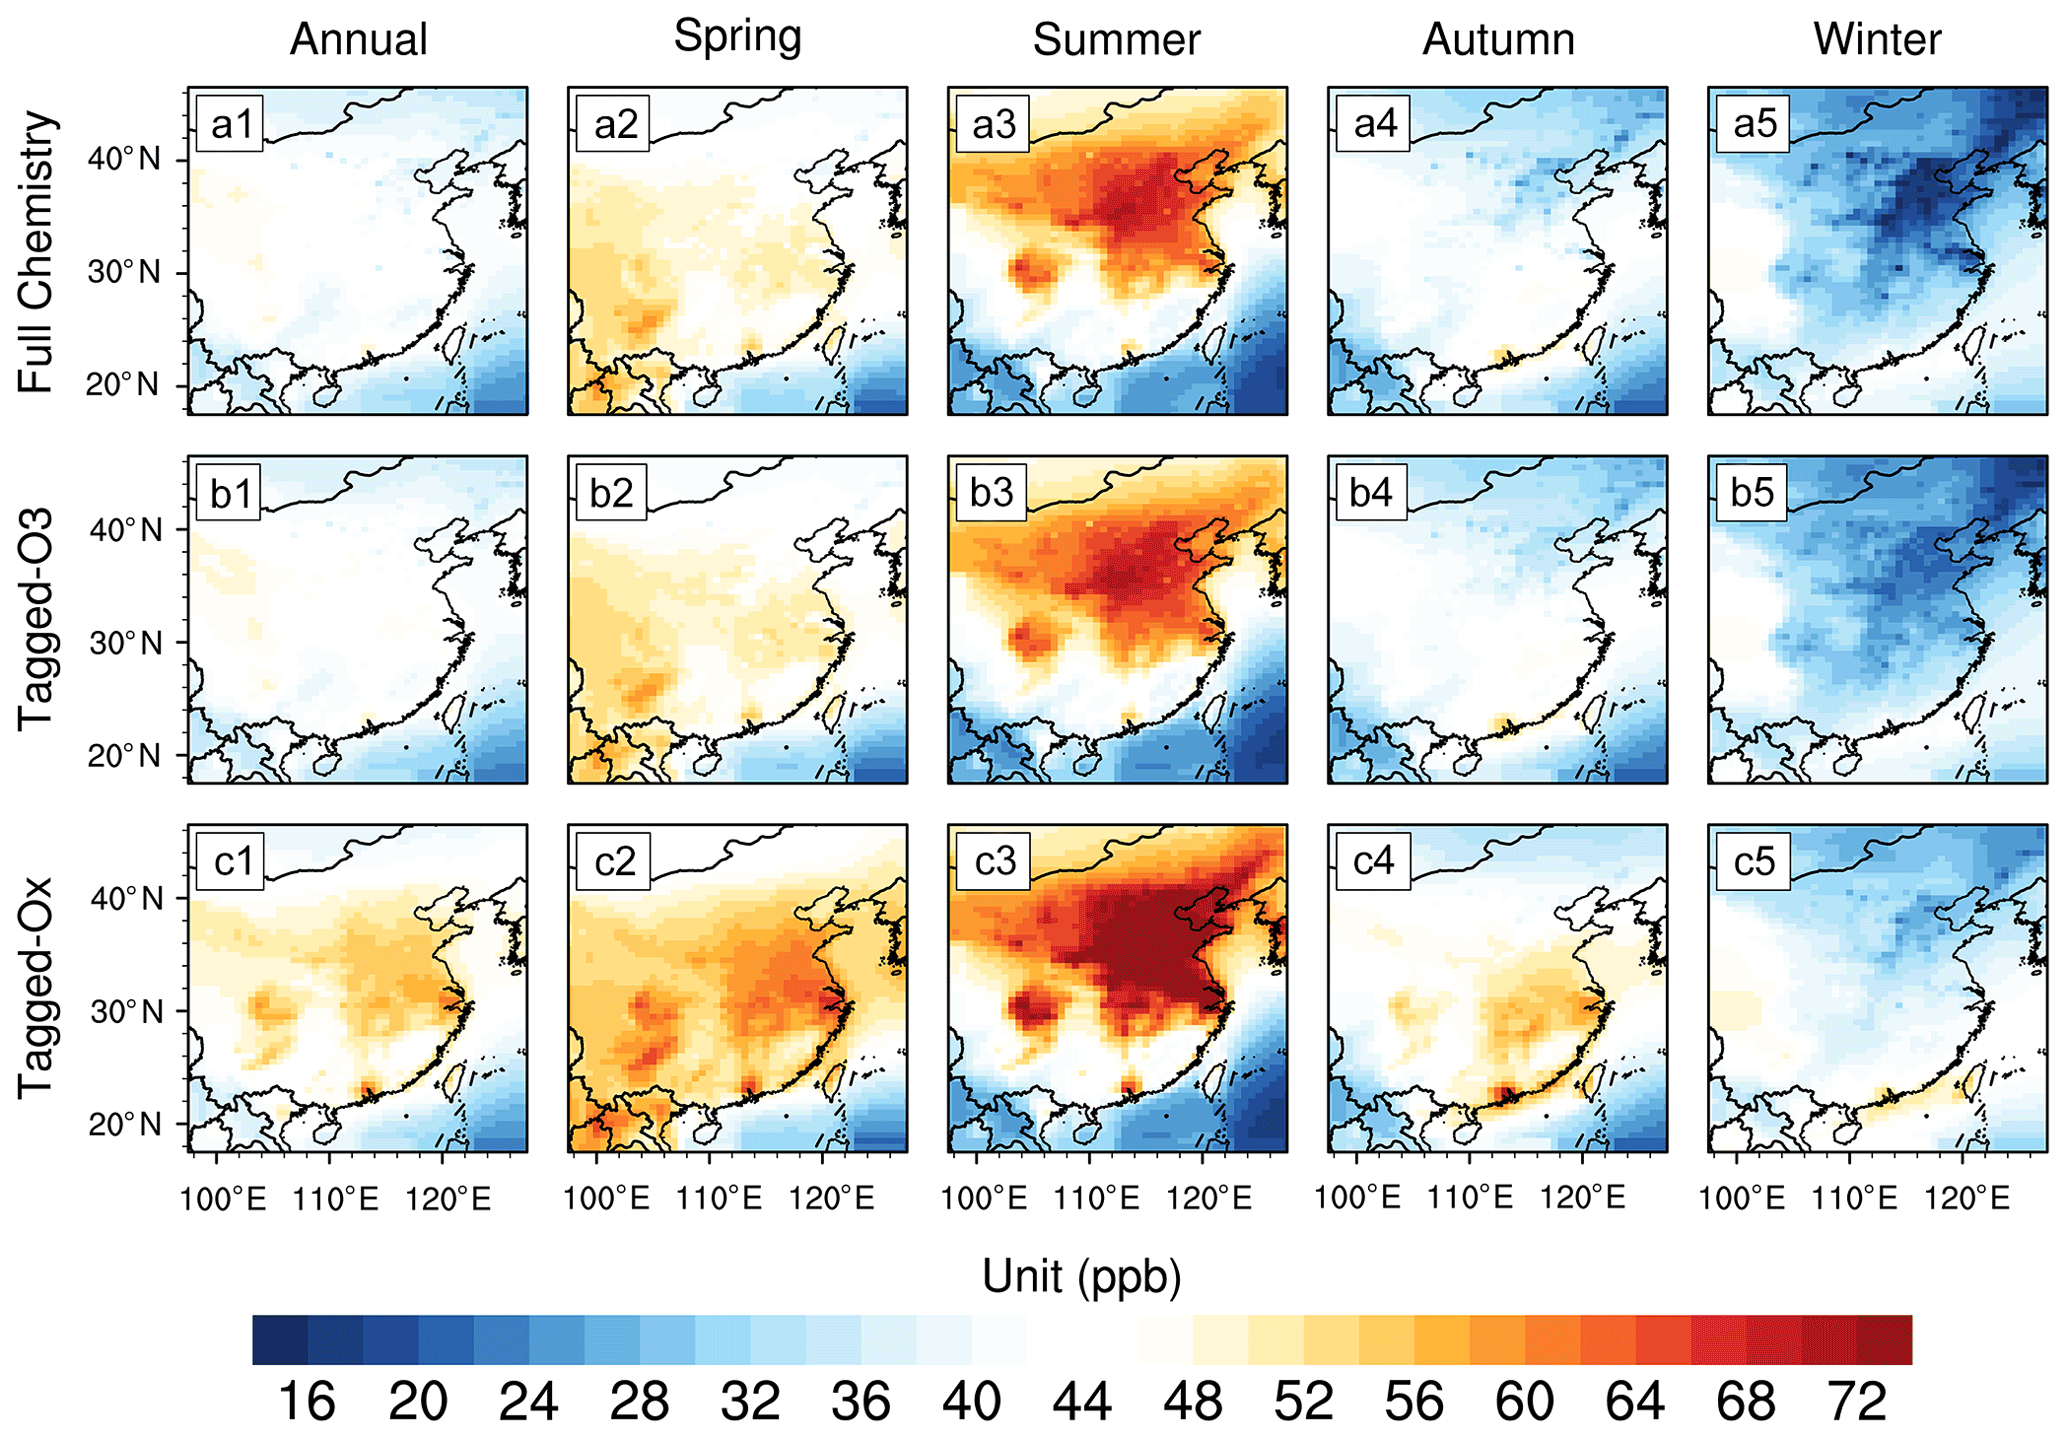
Figure 2Surface MDA8 O3 in 2015–2020 (annual and seasonal averages) simulated by GEOS-Chem model with (a1–a5) full chemistry mode. (b1–b5) Single O3 tracer (tagged-O3) mode and (c1–c5) tagged-Ox mode. The 8 h range of surface Ox is selected according to the time range of MDA8 O3.
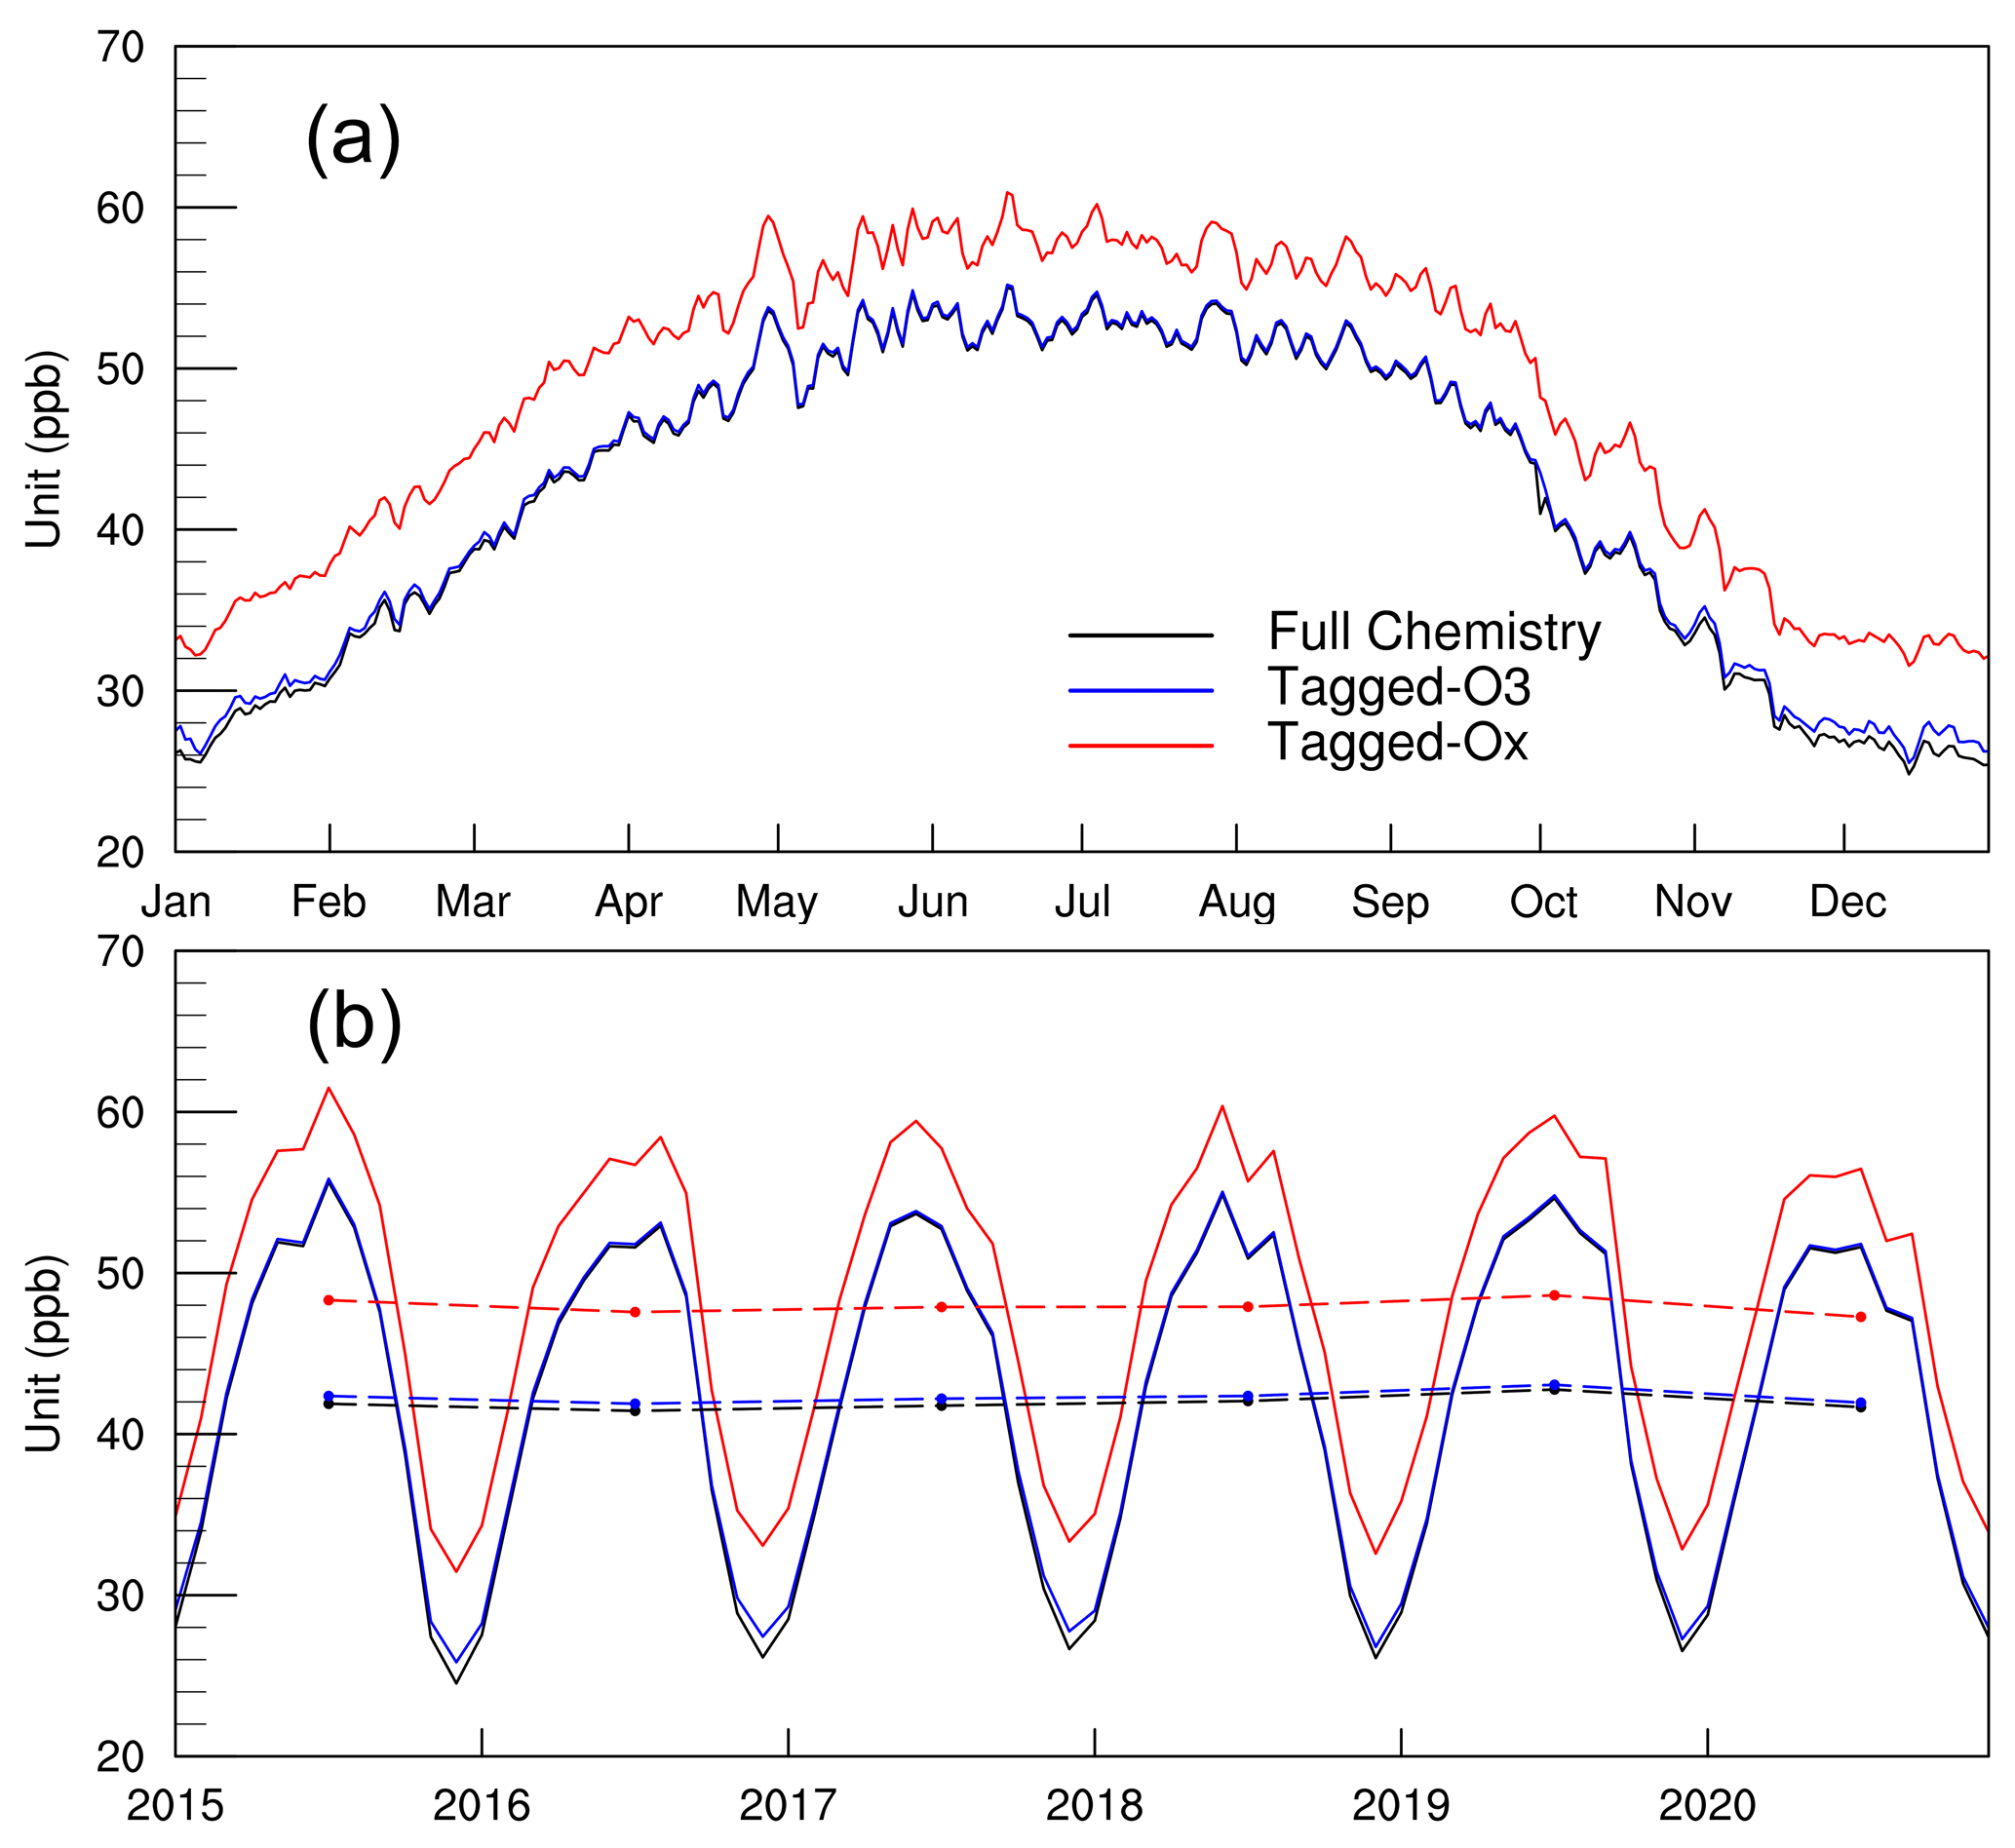
Figure 3(a) Daily averages of surface MDA8 O3 over eastern China in 2015–2020 from GEOS-Chem full chemistry (black), single O3 tracer (tagged-O3; blue) and tagged-Ox (red) simulations. (b) Monthly averages of MDA8 O3. The dashed lines in panel (b) are annual averages.
Here we evaluate the consistency in modeled O3 concentrations between single O3 tracer and full chemistry simulations. Figure 2a1–a5 show the annual and seasonal averages of the surface maximum daily 8 h average (MDA8) O3 over eastern China in 2015–2020 from the full chemistry simulation. The modeled surface MDA8 O3 concentrations are as high as 60–70 ppb in the summer and as low as 10–20 ppb in the winter over northern China. The simulation with the single O3 tracer mode (Fig. 2b1–b5) demonstrates spatial consistency with the full chemistry simulation (Fig. 2a1–a5) and temporal consistency at both the daily (Fig. 3a) and monthly (Fig. 3b) scales in 2015–2020. In contrast, the tagged-Ox mode of the GEOS-Chem model is driven by the archived production and loss of Ox, which is the combination of multiple species, including O3. There are large discrepancies between full chemistry (Fig. 2a1–a5) and tagged-Ox (Fig. 2c1–c5) simulations. As shown in Fig. 3, the Ox concentrations are higher than the O3 concentrations by approximately 6 ppb, and the relative difference can reach 40 % in the winter. Our analysis thus indicates the reliability of the single O3 tracer simulations developed in this work.
2.5 Data assimilation method
We employ the sequential KF to assimilate O3 observations, which has been used in recent studies to optimize tropospheric CO concentrations (Tang et al., 2022; Han et al., 2022). As a brief description of the assimilation algorithm, the forward model (M) predicts the O3 concentration (xat) at time t:
The optimized O3 concentrations can be expressed as
where yt is the observation and Kt represents the operation operator that projects O3 concentrations from the model space to the observation space. Gt is the KF gain matrix, which can be described as
where Sat and Sϵ are the model and observation covariances, respectively. The optimized O3 concentrations provided by Eq. (3) are then forwarded (hourly) to Eq. (2). The model errors are assumed to be 50 % because the objective of our assimilations is to provide dynamic extensions of atmospheric O3 observations. The a posteriori O3 concentrations with the assumption of 50 % model errors are expected to match better with atmospheric O3 observations. The measurement errors are calculated as ε0= ermax , where “ermax” is the base error (1.5 µg m−3), and Π0 represents the observed O3 concentrations (µg m−3). The representation errors are calculated as , where γ is a scaling factor (0.5), Δl is the model resolution (∼56 km in this study), and L represents the range that the observation can reflect, which depends on the station type (2 km for urban; 4 km for suburban). The total observation error is then defined as . Furthermore, the “super-observation” method was applied in this work to further reduce the influence of representative error as follows (Miyazaki et al., 2017; Tang et al., 2022):
where yj is O3 observation of the jth station, ωj represents the weighting factor of the jth station, and ys and εs are the grid-based O3 observations and errors (super-observation), respectively.
3.1 Surface O3 by assimilating MEE O3 observations
We first investigate the effects of surface O3 observations on single O3 tracer assimilations. O3 at the surface level is formed by precursors mixed in the planetary boundary layer (PBL). Thus, it may not be accurate to assume that the differences between simulated and observed surface O3 concentrations are completely caused by biased O3 production and loss at the surface level. Here we adjust O3 concentrations above the surface level within the PBL when assimilating surface O3 observations:
where is the adjustment at the surface level calculated with Eq. (3). is the adjustment at model level n, which is based on , but decays exponentially with the increase in the model level. The decay speed is adjusted by the γ parameter. As shown in Table 1, the following three assimilation experiments (Exp. no. 5–no. 7) were conducted to evaluate the effects of the decay speed: (1) γ=0, by assuming that the biased surface O3 concentrations are completely caused by biased O3 production and loss at the surface level; (2) γ=1, by assuming full mixing of O3 biases within the PBL; and (3) γ=0.8, by assuming partial mixing of O3 biases within the PBL. That is, the adjustment at the 4th model level is approximately 50 % of , and the adjustment at the 10th model level (close to the top of the PBL) is approximately 10 % of .
As shown in Fig. S2a, the assimilated surface MDA8 O3 concentrations show good agreement by using different γ parameters, namely 42.3, 41.8, and 42.0 ppb (γ=0, 0.8, and 1.0) in 2015–2020. There are noticeable discrepancies in the trends of assimilated surface O3 concentrations, namely 0.80, 1.24, and 1.50 ppb yr−1 (γ=0, 0.8, and 1.0) in 2015–2020 (Fig. S2b), and the trends obtained by considering the mixing of O3 biases (γ=0.8 and 1.0) match better with MEE O3 observations (1.77 ppb yr−1). Figure S3 further demonstrates tropospheric O3 columns by assimilating MEE O3 observations in 2015–2020. We find good agreement in the assimilated tropospheric O3 columns by using different γ parameters; i.e., the mean tropospheric O3 columns are 38.1, 37.9, and 37.9 DU, and the trends of tropospheric O3 columns are 0.11, 0.17, and 0.21 ppb yr−1 (γ=0, 0.8, and 1.0). Considering the better agreement in the trends of assimilated surface O3 concentrations (γ=0.8 and 1.0) with observations, we finally decide to set γ=0.8 as our main assimilation setting, by assuming partial mixing of O3 biases within the PBL.

Figure 4Surface MDA8 O3 in 2015–2020 (annual and seasonal averages) from (a1–a5) MEE stations. (b1–b5) GEOS-Chem a priori simulation (Exp. no. 1). (c1–c5) GEOS-Chem a posteriori simulation, by assimilating MEE O3 observations (Exp. no. 5). (d1–d5) Bias in the a priori simulations (Exp. no. 1 minus no. 5). (e1–e5) Effects of seasonal variabilities in background O3 (Exp. no. 3 minus no. 1). (f1–f5) Effects of O3 formation within the North China Plain PBL (Exp. no. 1 minus no. 4).
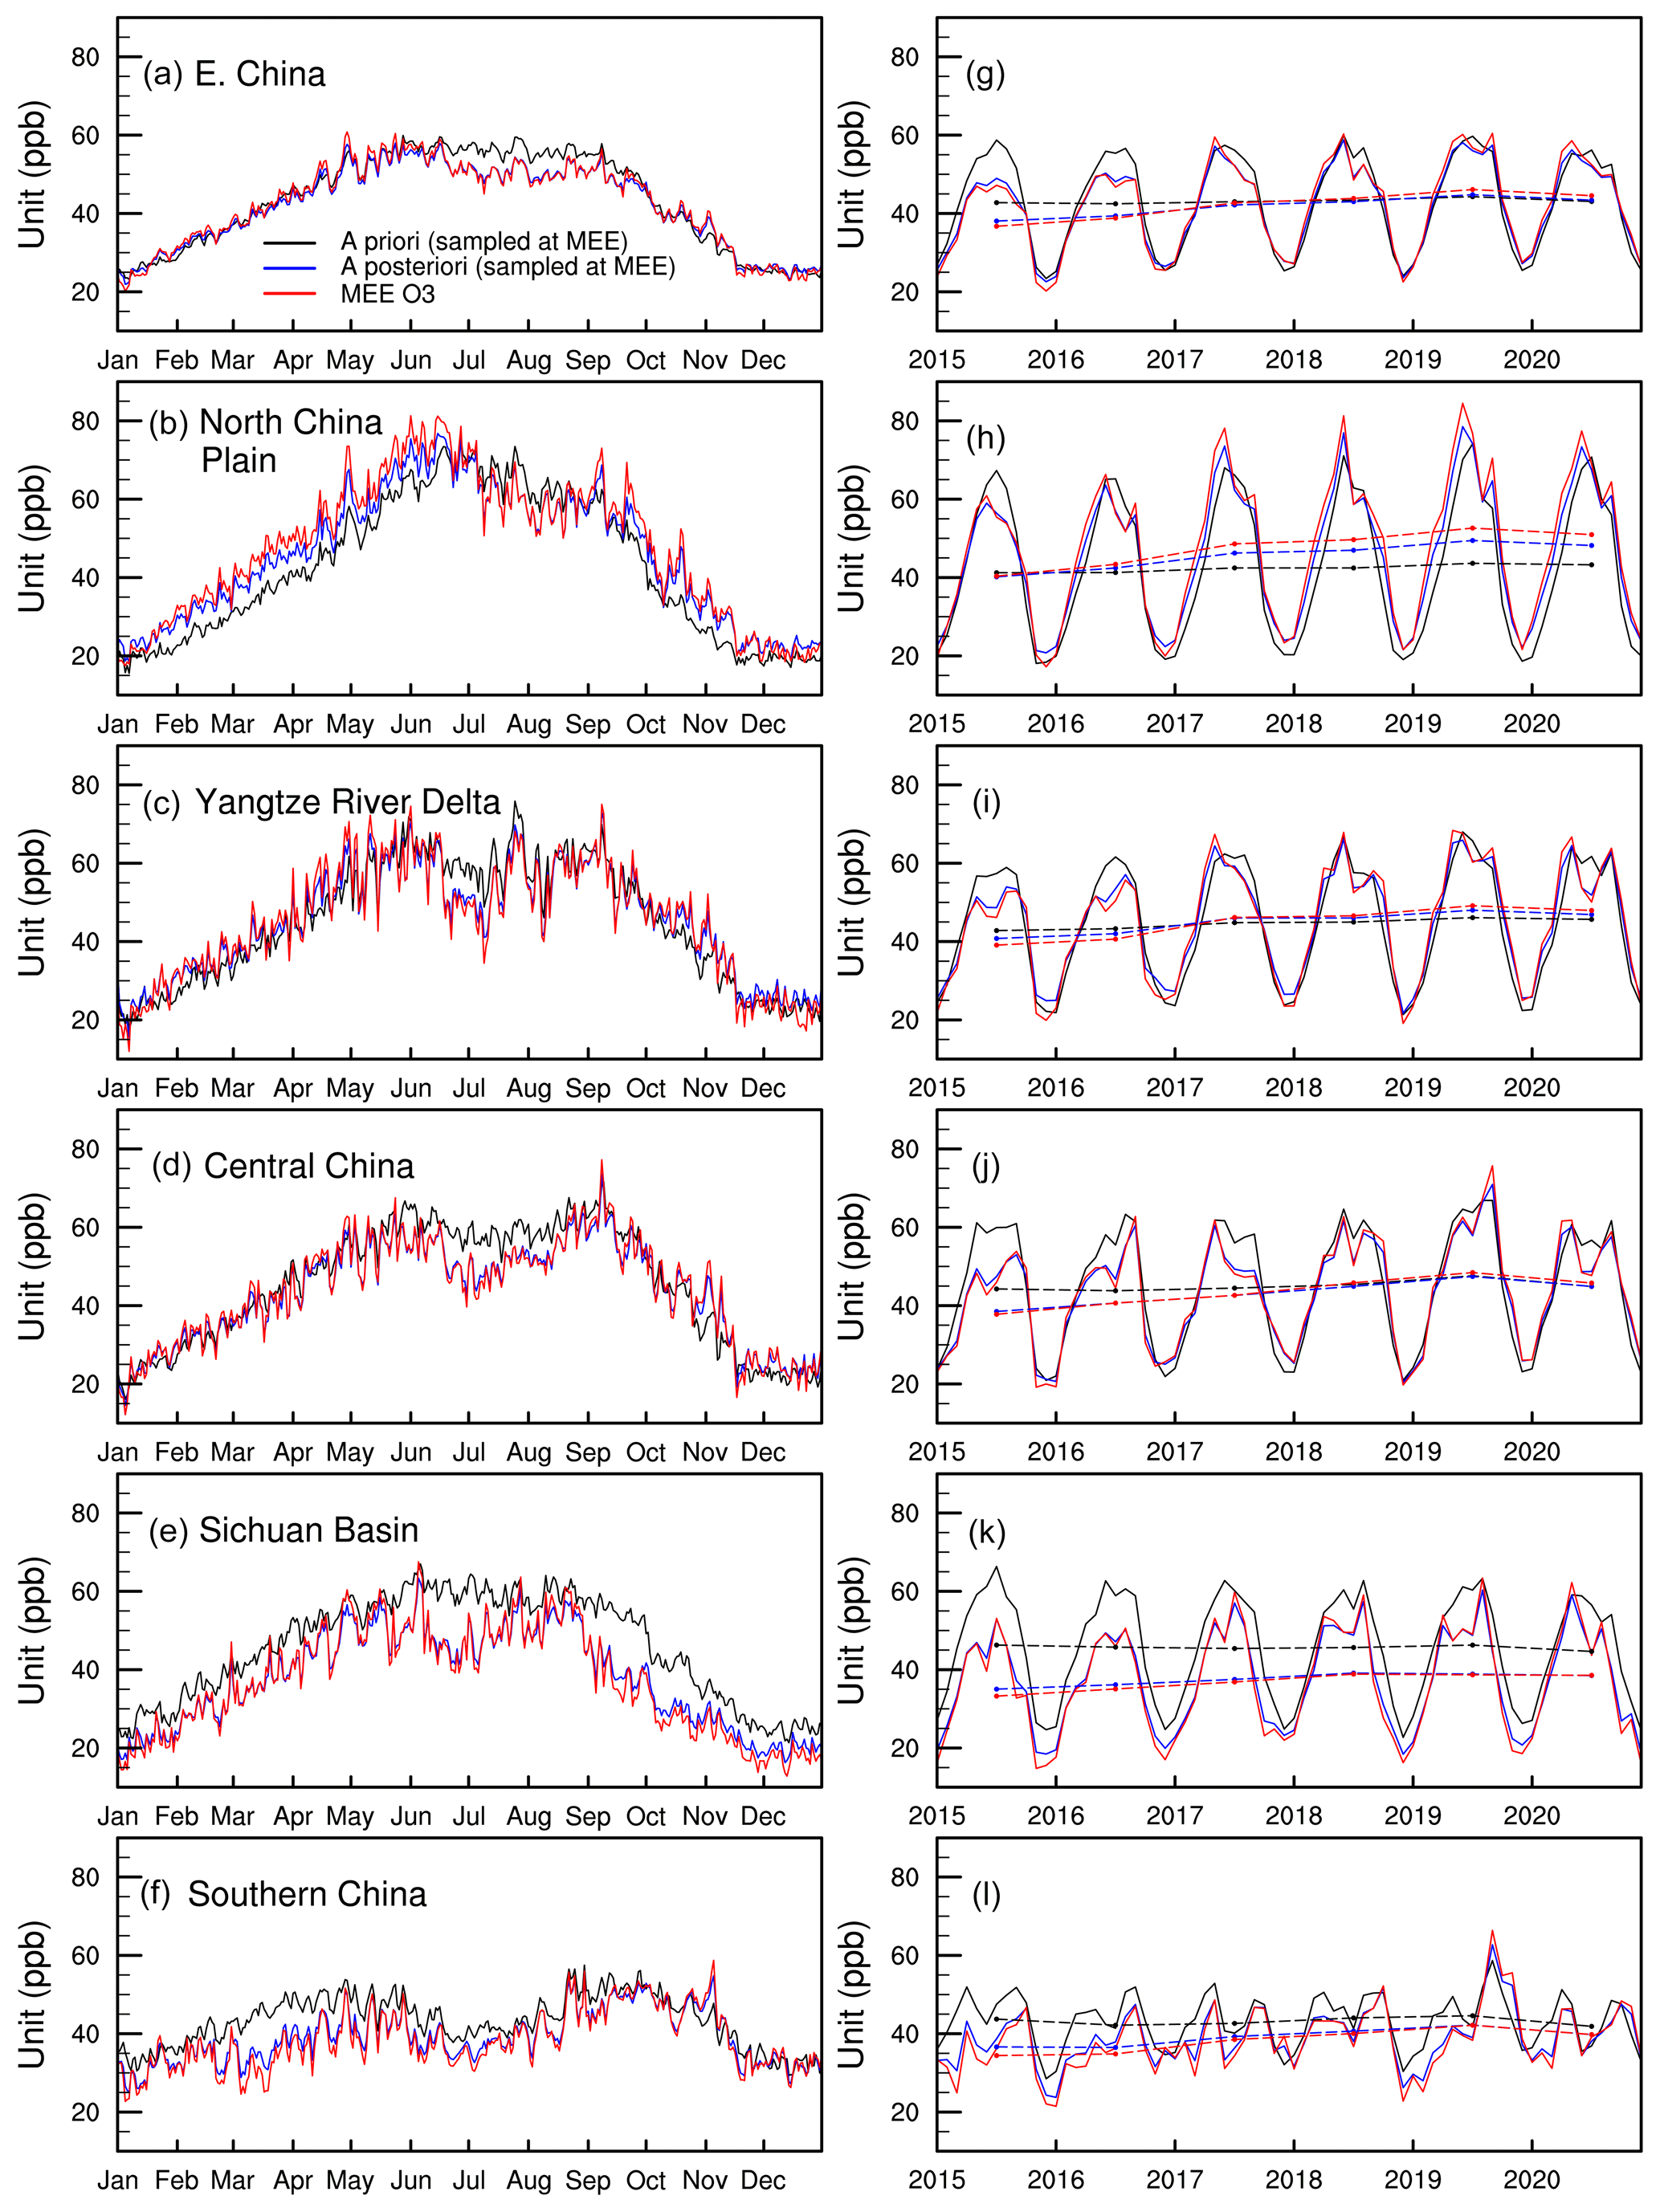
Figure 5(a–f) Daily averages of surface MDA8 O3 in 2015–2020 from MEE stations (red) and GEOS-Chem a priori (black; Exp. no. 1) and a posteriori (blue; Exp. no. 5) simulations by assimilating MEE O3 observations. (g–l) Monthly averages of MDA8 O3. The dashed lines in panels (g)–(l) are annual averages. The domain definition of eastern China is shown in Fig. 1a.
Figure 4a1–a5 show the annual and seasonal averages of surface MDA8 O3 observations from MEE stations in 2015–2020. Figure 4c1–c5 show the annual and seasonal averages of the a posteriori O3 concentrations by assimilating the MEE O3 observations. As shown in Fig. 5, the assimilated O3 concentrations (blue lines) show good agreement with MEE O3 observations (red lines). The mean surface MDA8 O3 values in 2015–2020 are 43.2, 41.8, and 42.1 ppb (eastern China); 42.4, 45.6, and 47.6 ppb (North China Plain); 44.6, 45.0, and 44.9 ppb (Yangtze River Delta); 45.1, 43.1, and 43.5 ppb (central China); 45.7, 37.5, and 36.9 ppb (Sichuan Basin); and 43.2, 39.2, and 38.3 ppb (southern China) in the a priori simulations, a posteriori simulations, and MEE observations, respectively. It should be noted that Fig. 5a exhibits broadly good agreement between the a priori and a posteriori O3 concentrations over eastern China, except for a larger difference in the summer. However, as shown in Fig. 4d1–d5, the good agreement between the a priori and a posteriori O3 concentrations are caused by the counterbalance of positive biases (i.e., overestimated surface O3 in the a priori simulations over southern China) and negative biases (i.e., underestimated surface O3 in the a priori simulations over northern China). The good agreement in Fig. 5a thus cannot represent good performance in the simulations of surface O3 concentrations.
The assimilations exhibit noticeable declines in surface O3 concentrations over region nos. 2–5 in June–July, and the declines are underestimated by the a priori simulations (Fig. 5c–f). The inaccurate simulation in June–July thus results in overestimated surface O3 concentrations in the summer. There is dramatic seasonality in surface O3 concentrations (Fig. 5), namely maximum in June in the North China Plain; May and August in the Yangtze River Delta, central China, and the Sichuan Basin; and September–October in southern China. Figure 4e1–e5 exhibit the effects of seasonal variabilities in background O3 (Exp. no. 3) by fixing background O3 in the spring in the simulations. The fixed background O3 has limited influences on surface O3 concentrations, and consequently, the seasonality in surface O3 concentrations is dominated by local contributions. As expected, MDA8 O3 concentrations are higher over areas with higher anthropogenic NOx emissions, for example, 45.6 and 45.0 ppb in the North China Plain and Yangtze River Delta, respectively, which is in contrast to 43.1, 37.5, and 39.2 ppb in central China, the Sichuan Basin, and southern China. The influences of regional transport on surface O3 concentrations are limited; for example, O3 values generated within the North China Plain PBL by setting O3 formation rates within the North China Plain PBL to zero (Exp. no. 4) are mainly contained within the North China Plain (Fig. 4f1–f5).
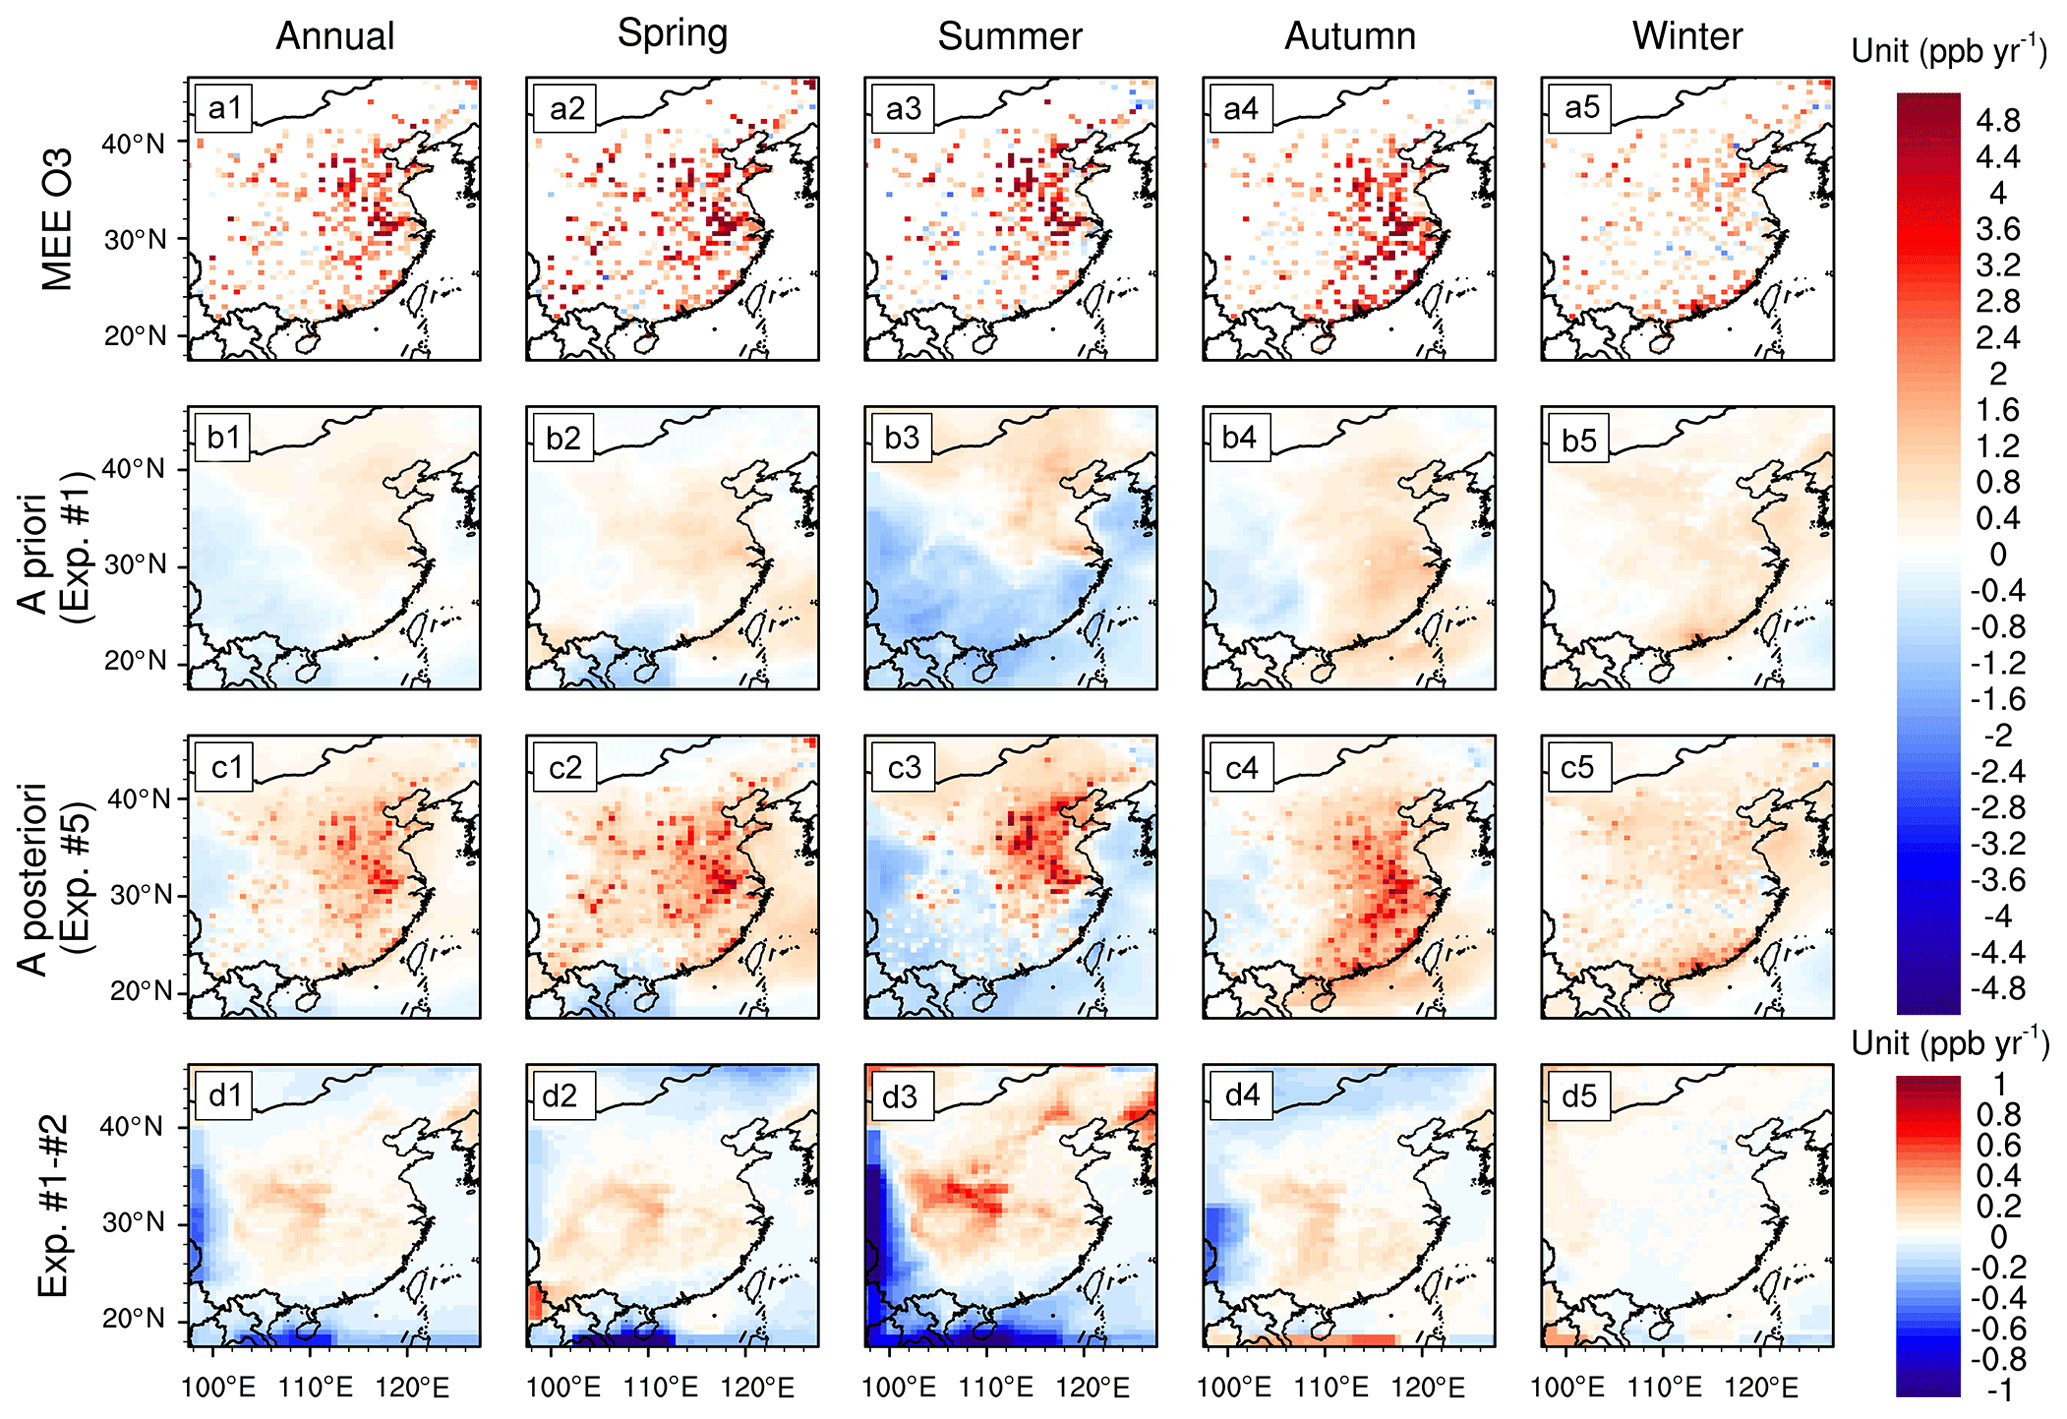
Figure 6Trends of surface MDA8 O3 in 2015–2020 (annual and seasonal averages) from (a1–a5) MEE stations. (b1–b5) GEOS-Chem a priori simulation (Exp. no. 1). (c1–c5) GEOS-Chem a posteriori simulation by assimilating MEE O3 observations (Exp. no. 5). (d1–d5) Effects of interannual variabilities in background O3 (Exp. no. 1 minus no. 2).
3.2 Rapid increasing trends in surface O3 concentrations
Here we investigate the changes in surface O3 concentrations from observations and assimilations. As shown in Fig. 6b1–b5, the a priori simulation suggests slightly increasing trends of MDA8 O3 in 2015–2020, with 0.31 (spring), −0.12 (summer), 0.45 (autumn), and 0.40 ppb yr−1 (winter), and the relative increasing trends are 0.7 (spring), −0.2 (summer), 1.1 (autumn), and 1.4 % yr−1 (winter). The a priori simulation suggests increasing trends of surface O3 concentrations in the summer over areas with higher local pollution levels (for example, 0.68 and 0.63 ppb yr−1 over the North China Plain and Yangtze River Delta, respectively) and decreasing trends of surface O3 concentrations in the summer over areas with lower local pollution levels (for example, −0.83 and −1.01 ppb yr−1 over the Sichuan Basin and southern China, respectively). The decreasing trends over areas with lower local pollution levels in the simulations are not surprising, given the decreases in anthropogenic NOx emissions (Zheng et al., 2018; Jiang et al., 2022) and the reported NOx-limited O3 nonlinear chemical regimes in model simulations (Chen et al., 2021; Liu et al., 2021). Furthermore, as shown in Fig. 6d1–d5, the interannual variabilities in background O3 (Exp. no. 2) are suggested to result in increases in surface O3 concentrations in the a priori simulations in 2015–2020 by 0.02 (spring), 0.05 (summer), 0.02 (autumn), and 0.00 ppb yr−1 (winter), and the relative contribution is particularly pronounced in the summer.
Table 2Averages (with units in ppb or DU) and trends (with units ppb yr−1 or DU yr−1) of surface and tropospheric column O3 concentrations in 2015–2020 over eastern China from observations (MEE and OMI) and a priori (Exp. no. 1) and a posteriori (KF) simulations (Exp. no. 5 and no. 8). The domain definition of eastern China is shown by Fig. 1a. T2.1: the modeled surface O3 is sampled at the locations and times of MEE surface O3 observations; T2.2: the modeled surface O3 is averaged over eastern China (land only); T2.3: the output O3 profiles from the a priori and a posteriori simulations are convolved with OMI O3 averaging kernels; T2.4: the output O3 profiles are not convolved with OMI O3 averaging kernels. The uncertainties in the averages are calculated using the bootstrapping method. The trends and uncertainties in the trends are calculated using the linear fitting of averages by using the least squares method (see details in the Supplement).
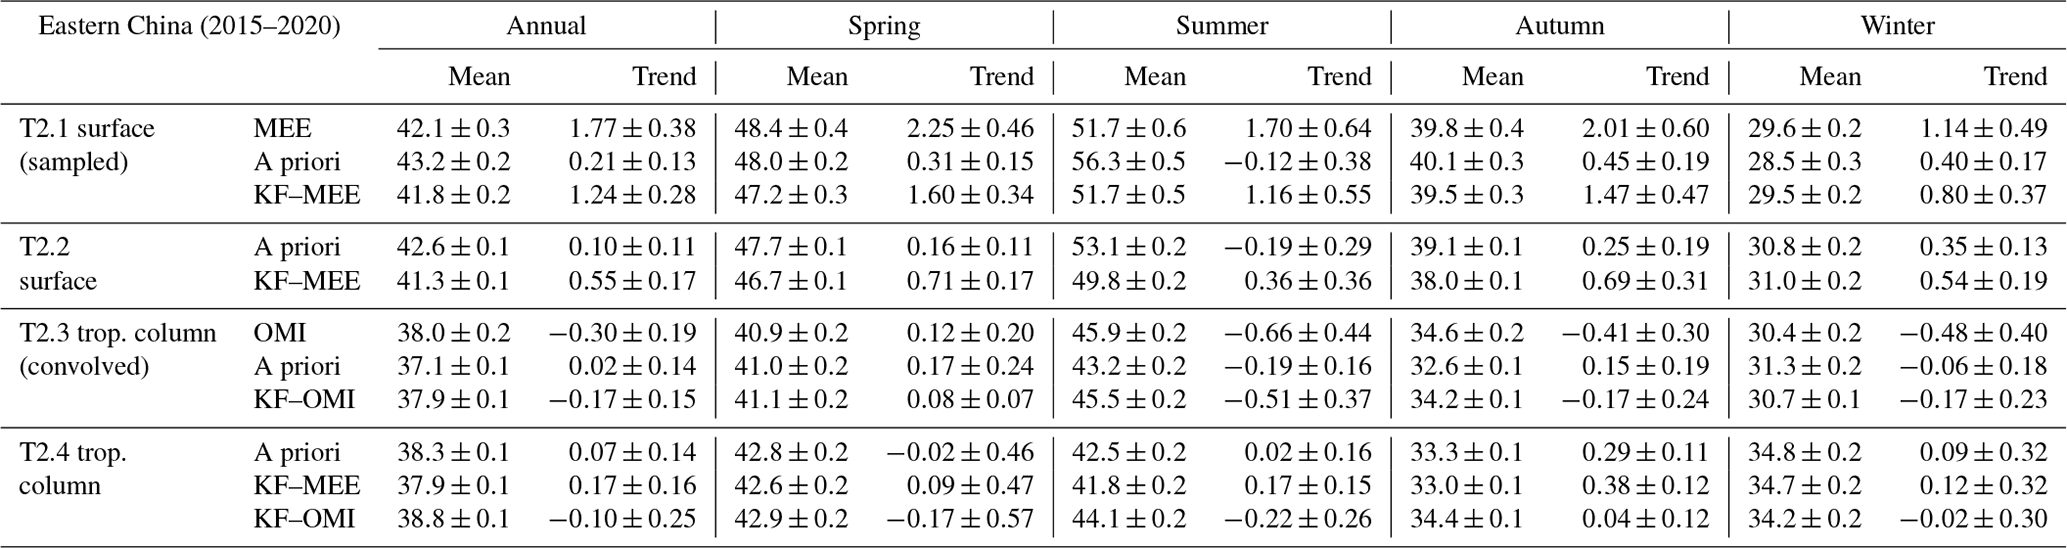
In contrast, the increasing trends in surface O3 are much stronger in the assimilations. As shown in Table 2, our assimilation suggests 1.60 (spring), 1.16 (summer), 1.47 (autumn), and 0.80 ppb yr−1 (winter) increases in surface O3 over eastern China in 2015–2020, and the relative increasing trends are 3.4 (spring), 2.2 (summer), 3.7 (autumn), and 2.7 % yr−1 (winter). The annual increasing trend (1.24 ppb yr−1) in the assimilated surface O3 concentrations is more consistent with the MEE O3 observations (1.77 ppb yr−1), which are comparable with the reported recent trends in surface O3 concentrations in China of 1.25–2.0 ppb yr−1 (Mousavinezhad et al., 2021; Wei et al., 2022; W. Wang et al., 2022). The increasing trends are weaker when the modeled surface O3 concentrations are averaged over eastern China (Table 2) instead of sampling at the locations and times of MEE observations, with 0.71 (spring), 0.36 (summer), 0.69 (autumn), and 0.54 ppb yr−1 (winter), because most MEE stations are urban sites. Our analysis thus indicates a noticeable underestimation in the increasing trends of surface O3 concentrations in China in the a priori simulations, particularly in the summer, despite the anthropogenic NOx and VOC emissions having been scaled in the simulations, following Jiang et al. (2022).
The changes in surface O3 concentrations have significant regional and seasonal discrepancies. As shown in Tables S1–S5 in the Supplement, our assimilations demonstrate strong increasing trends in surface O3 concentrations in 2015–2020 in spring (1.94 ppb yr−1 or 3.8 % yr−1) and summer (2.52 ppb yr−1 or 4.0 % yr−1) over the North China Plain; in spring (2.21 ppb yr−1 or 4.4 % yr−1) and autumn (1.84 ppb yr−1 or 4.1 % yr−1) over the Yangtze River Delta; in spring (2.07 ppb yr−1 or 4.3 % yr−1) and autumn (2.09 ppb yr−1 or 4.7 % yr−1) over central China; in spring (1.69 ppb yr−1 or 3.8 % yr−1) over the Sichuan Basin; and in autumn (2.21 ppb yr−1 or 4.9 % yr−1) over southern China. While surface O3 concentrations are higher over areas with higher anthropogenic NOx emissions, the increasing trends in surface O3 concentrations over central China and southern China are comparable with those in the North China Plain and Yangtze River Delta. Our analysis advises more attention to O3 pollution in spring and autumn over areas with lower anthropogenic NOx emissions because of the rapid increases in surface O3 concentrations.
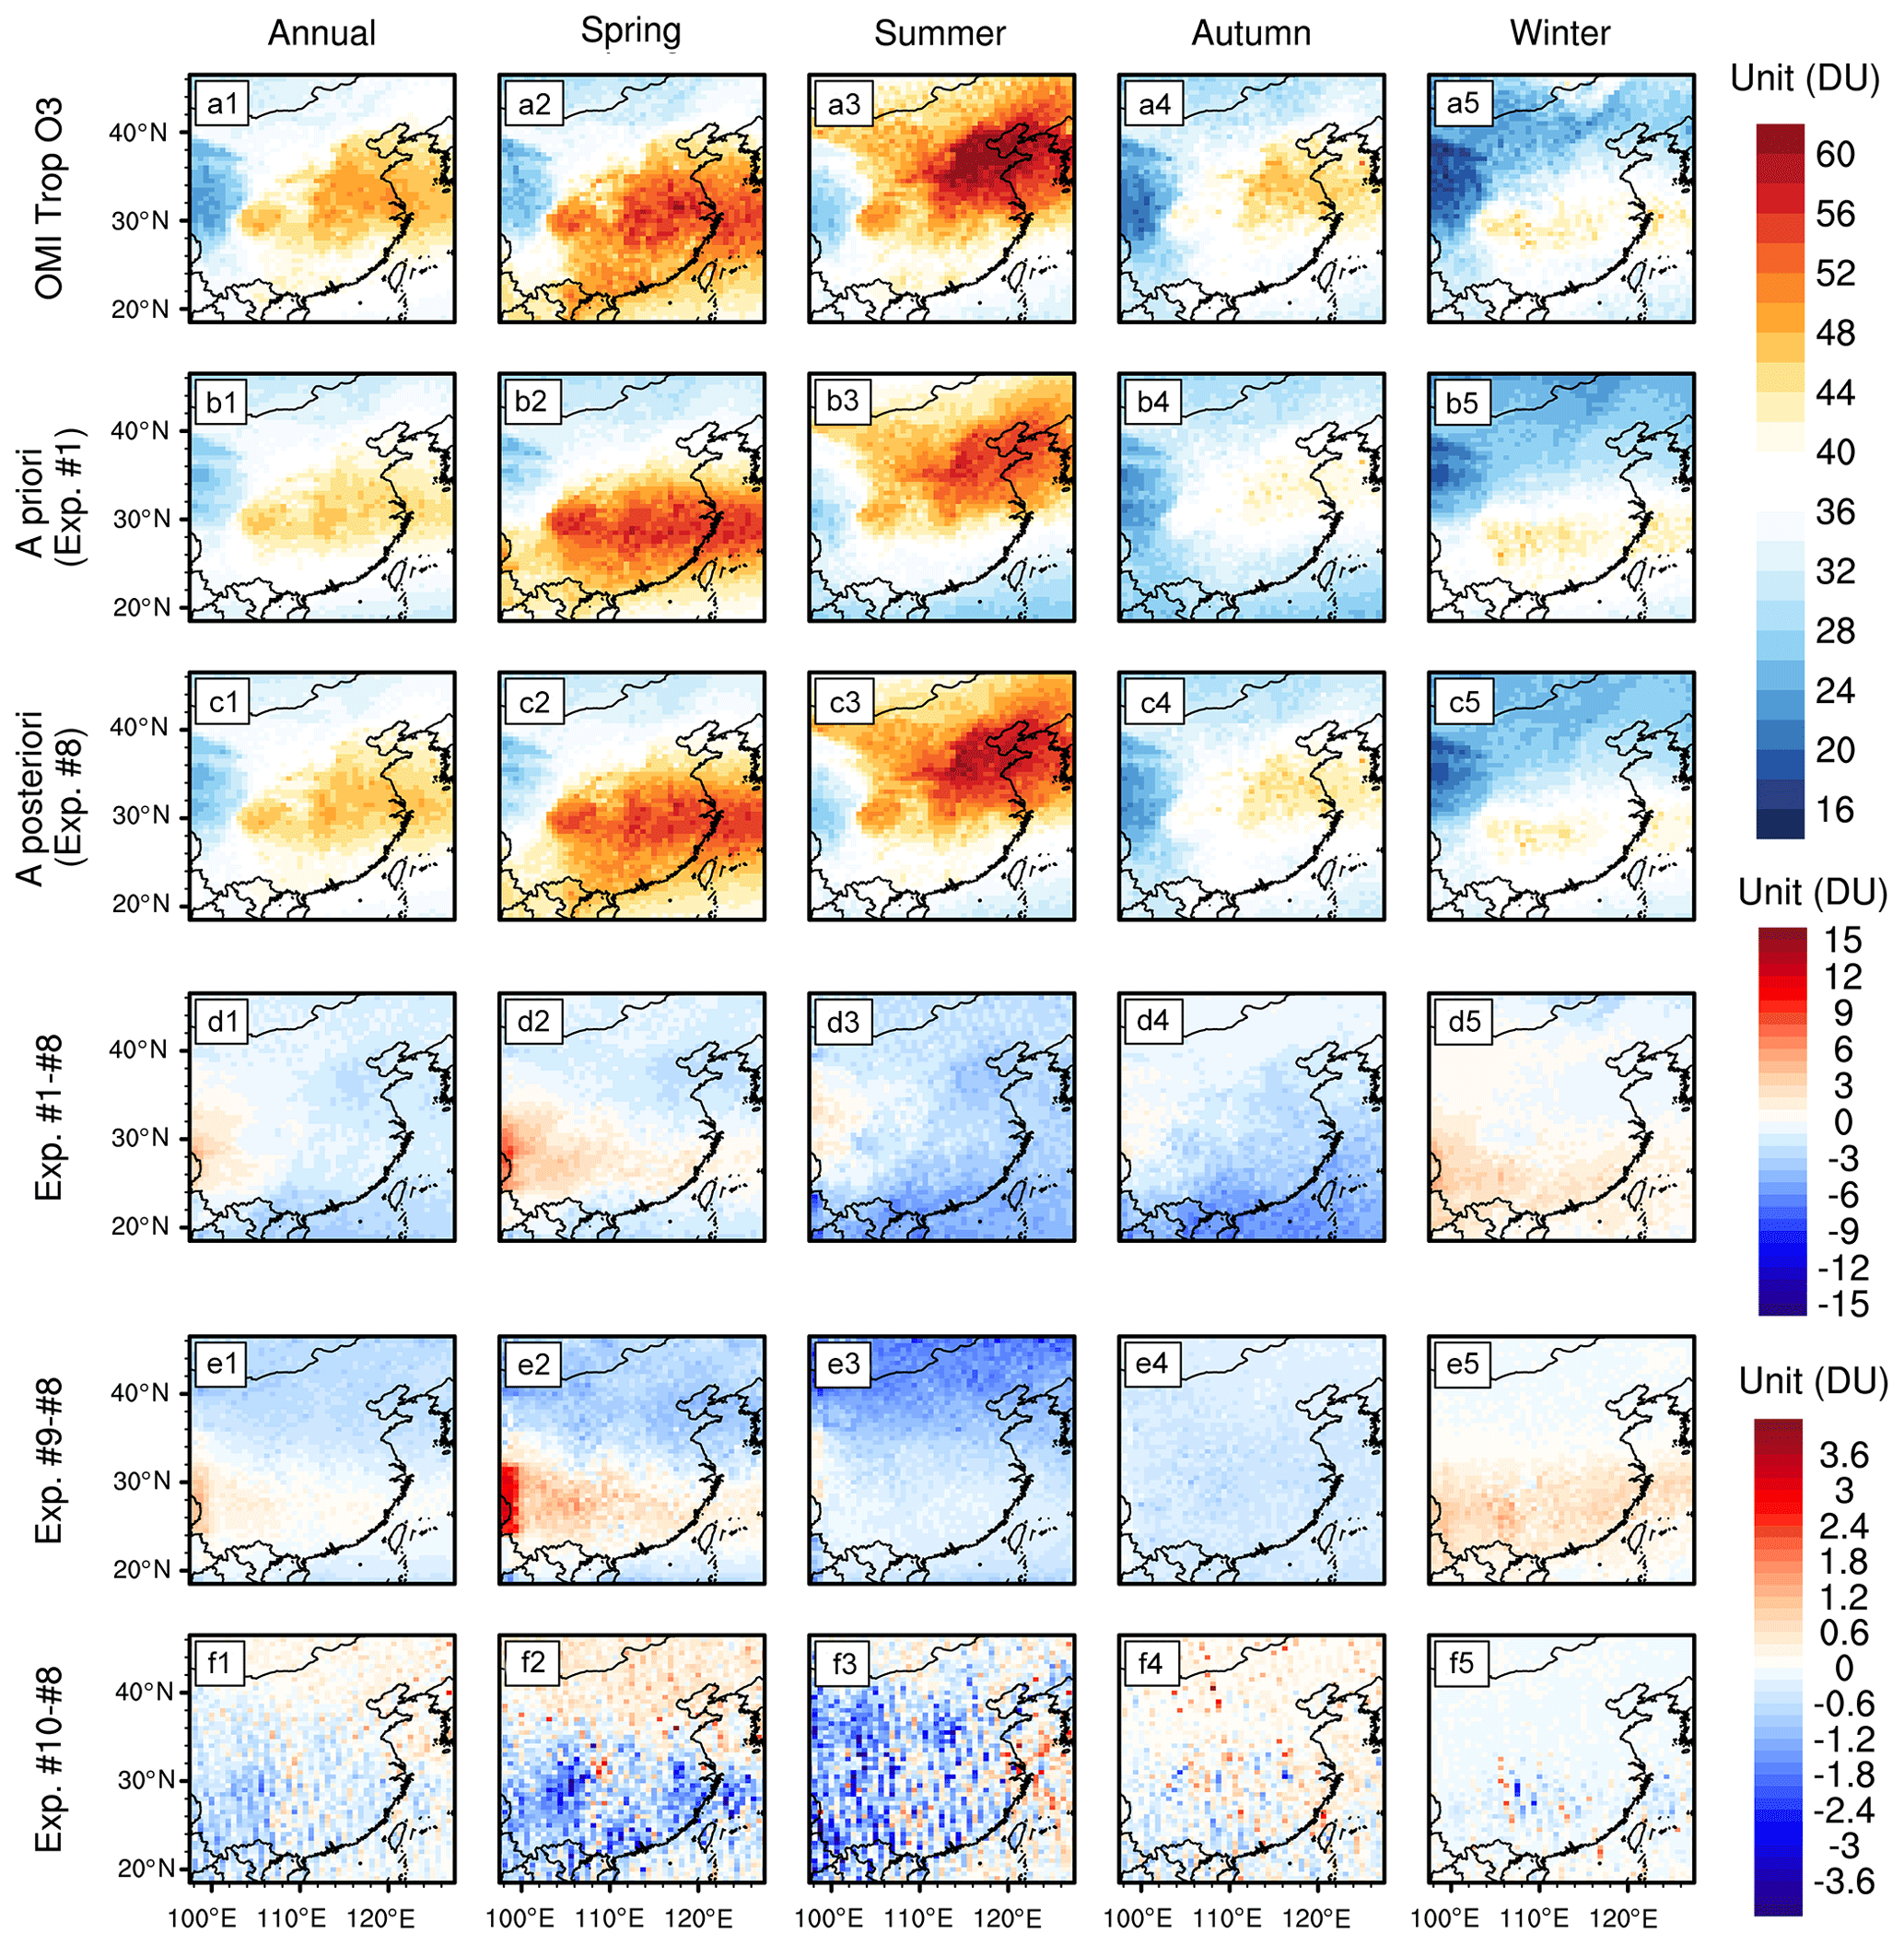
Figure 7Tropospheric O3 columns in 2015–2020 (annual and seasonal averages) from (a1–a5) OMI observations. (b1–b5) GEOS-Chem a priori simulation (Exp. no. 1). (c1–c5) GEOS-Chem a posteriori simulation by assimilating OMI O3 observations (Exp. no. 8). (d1–d5) Bias in the a priori simulations (Exp. no. 1 minus no. 8). (e1–e5) Effects of optimization on regional O3 background conditions (Exp. no. 9 minus no. 8); (f1–f5) Effects of the usage of row-isolated data (Exp. no. 10 minus no. 8). The output O3 profiles are convolved with OMI averaging kernels.
3.3 Tropospheric O3 columns by assimilating OMI O3 observations
Figure 7a1–a5 show the annual and seasonal averages of tropospheric OMI O3 columns in 2015–2020. OMI is sensitive to O3 at different vertical levels (Huang et al., 2017; Fu et al., 2018), and thus, the standard KF algorithm (Eq. 3) was employed to adjust tropospheric O3 vertical profiles with the application of OMI O3 averaging kernels. Figure 7c1–c5 show the annual and seasonal averages of the a posteriori tropospheric O3 columns by assimilating OMI O3 observations. The assimilated tropospheric O3 columns show good agreement with OMI O3 observations because the mean tropospheric O3 columns in 2015–2020 (Table 2) are 37.1 DU in the a priori simulations and 37.9 and 38.0 DU in the a posteriori simulation and OMI observations, respectively. The discrepancies between the a priori and a posteriori simulations in tropospheric O3 columns (Fig. 7) are smaller than those in surface O3 concentrations (Fig. 4). A better simulation capability in tropospheric column O3 is expected because model simulation with 0.5∘ × 0.625∘ horizontal resolution may not be enough to accurately resolve O3 nonlinear chemical regimes over urban surface stations.
The above assimilated tropospheric O3 columns (Exp. no. 8) are driven by optimized O3 background conditions provided by global assimilations of OMI O3 and row-isolated OMI data by using across-track positions between 4–11. Figure 7e1–e5 exhibit the effects of optimization on regional O3 background conditions. The mean assimilated tropospheric O3 column driven by the original O3 background conditions is 37.6 DU (Exp. no. 9), which is slightly lower than the 37.9 DU in the main assimilation (Exp. no. 8). The usage of original O3 background conditions can result in overestimations over southern China in the spring and winter and underestimations over northern China in the spring and summer (Fig. 7e1–e5). Figure 7f1–f5 further exhibits the effects of the usage of row-isolated data. The mean assimilated tropospheric O3 column by assimilating OMI O3 observations at across-track positions 4–27 is 37.7 DU (Exp. no. 10), which is slightly lower than the 37.9 DU in the main assimilation (Exp. no. 8). The underestimations in the assimilated tropospheric O3 columns are particularly significant in the spring and summer (Fig. 7f2–f3).
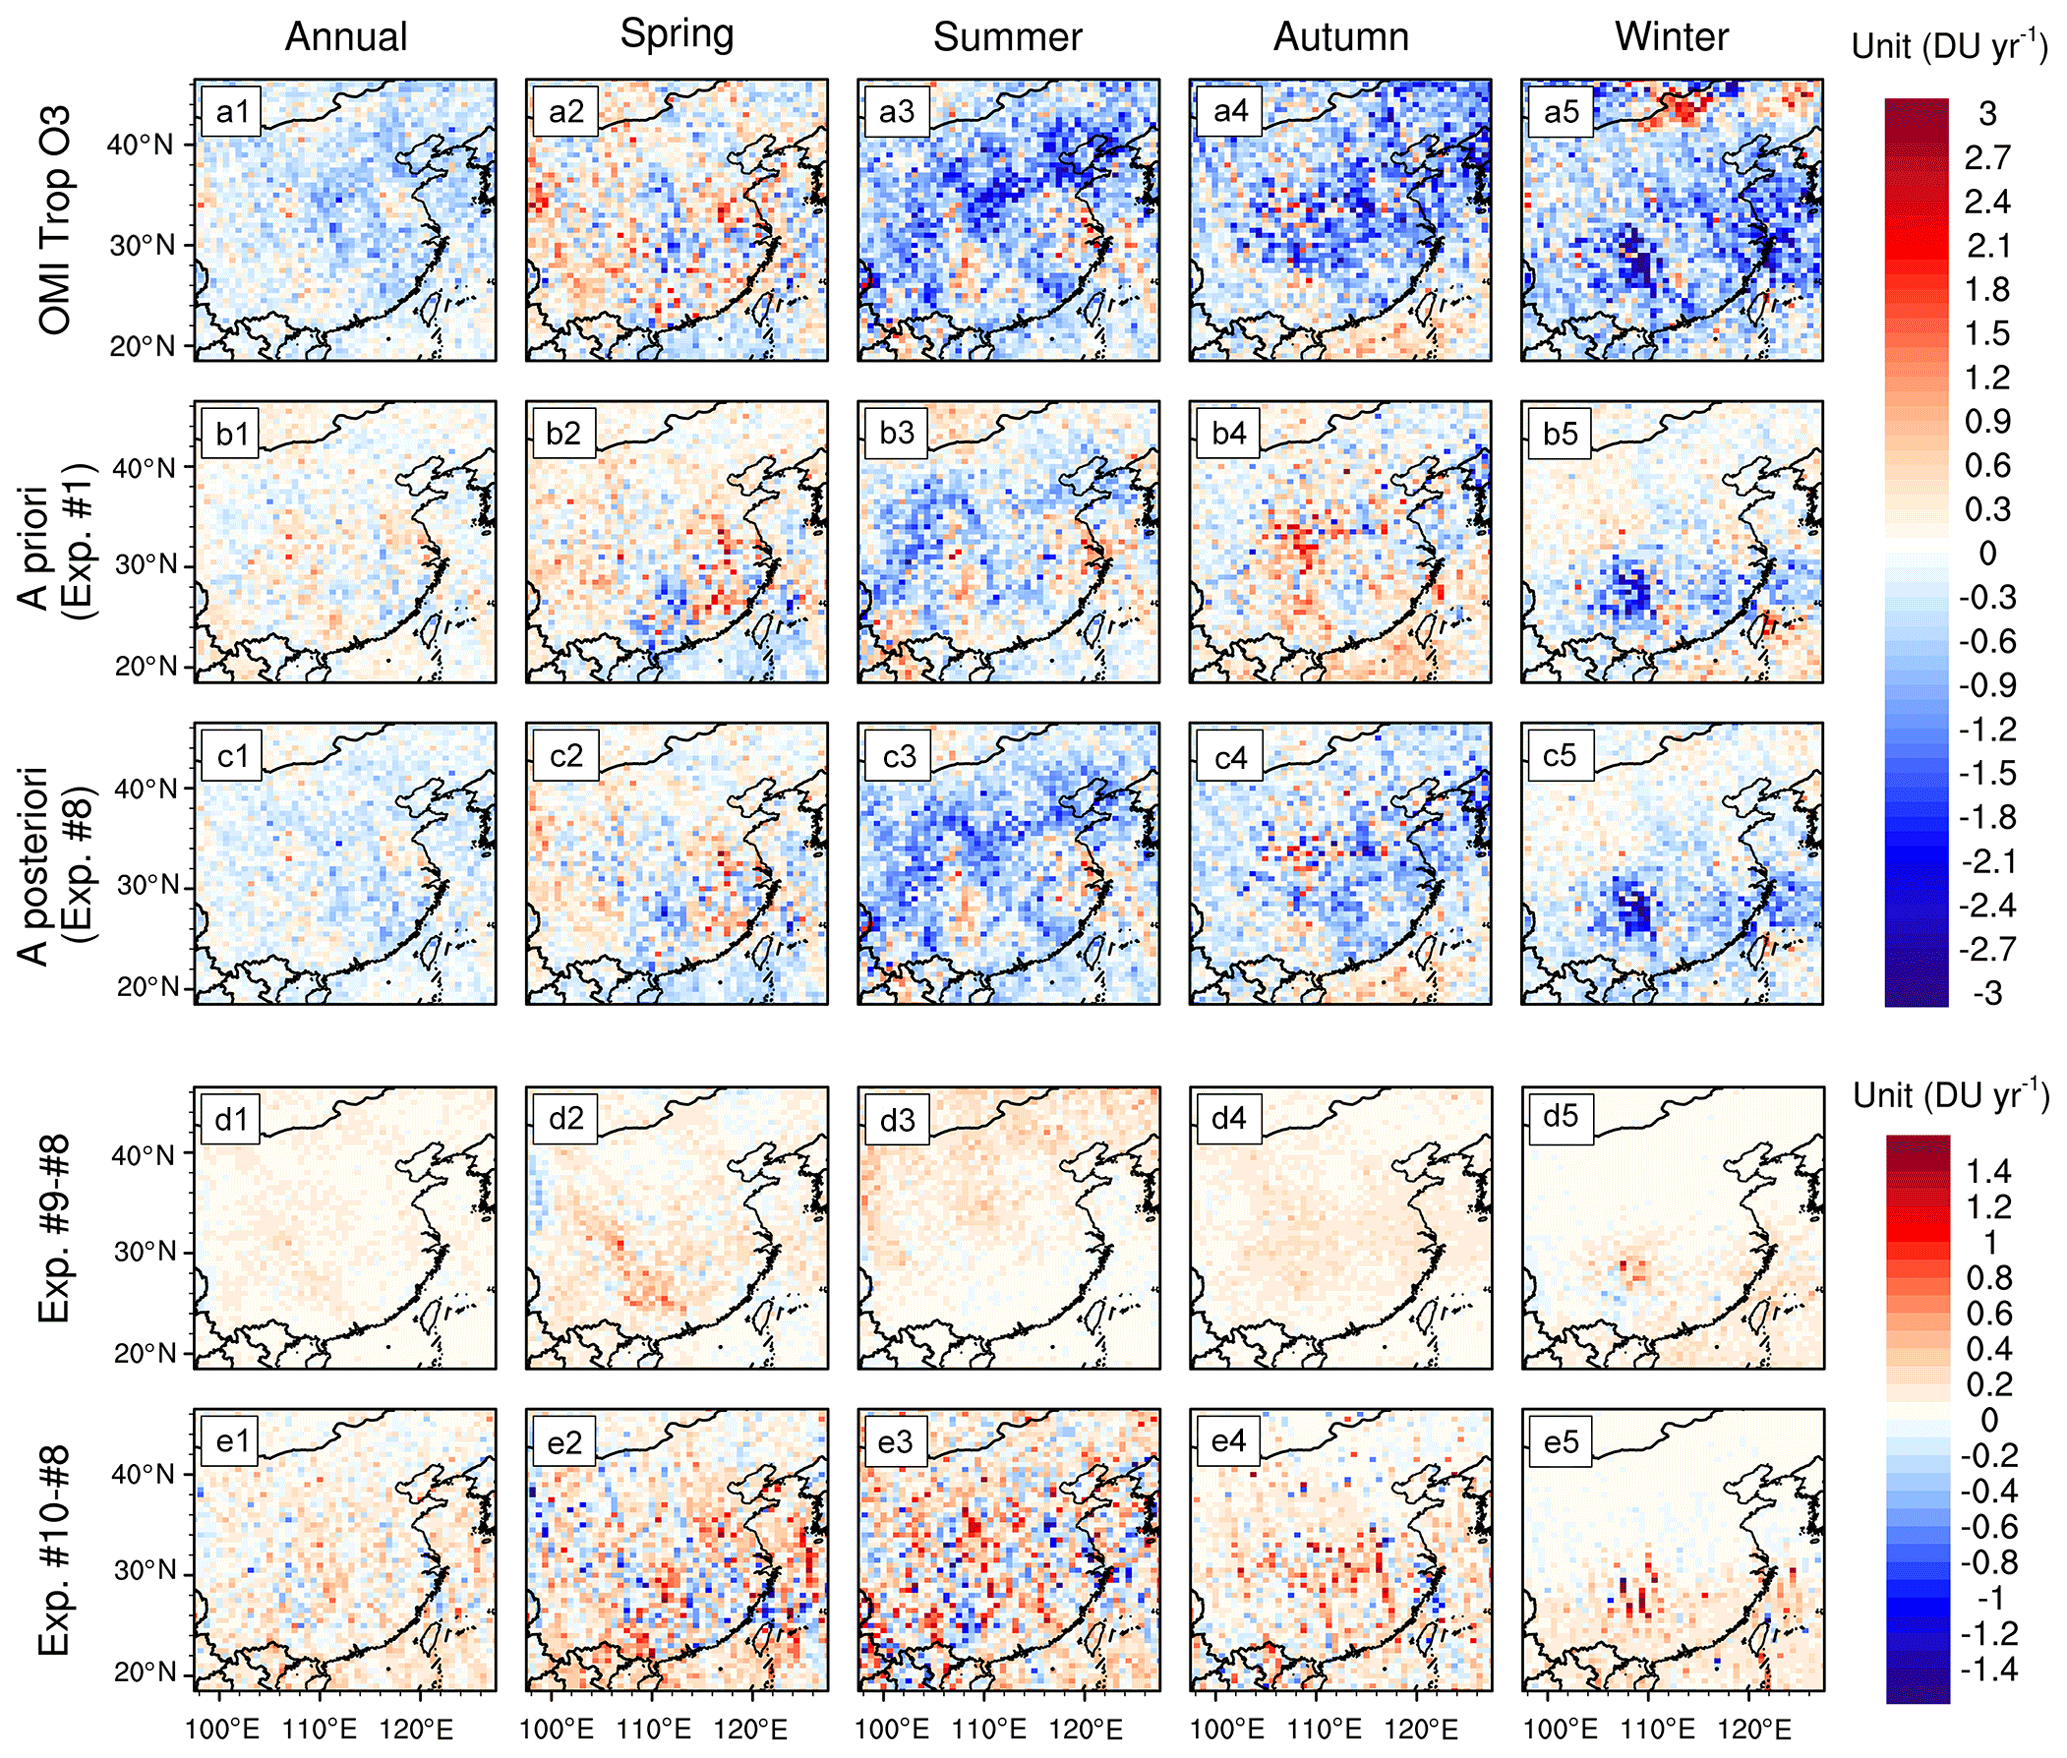
Figure 8Trends of tropospheric O3 columns in 2015–2020 (annual and seasonal averages) from (a1–a5) OMI observations. (b1–b5) GEOS-Chem a priori simulation (Exp. no. 1). (c1–c5) GEOS-Chem a posteriori simulation by assimilating OMI O3 observations (Exp. no. 8). (d1–d5) Effects of optimization on regional O3 background conditions (Exp. no. 9 minus no. 8). (e1–e5) Effects of the usage of row-isolated data (Exp. no. 10 minus no. 8). The output O3 profiles are convolved with OMI averaging kernels.
As shown in Fig. 8, the trends of tropospheric O3 columns in 2015–2020 (Table 2) are 0.02 DU yr−1 in the a priori simulations and −0.17 and −0.30 DU yr−1 in the a posteriori simulation and OMI observations, respectively. In contrast to the wide distributions of increasing trends of O3 at the surface level (Fig. 6), both OMI O3 observations (−0.30 DU yr−1) and the OMI-based assimilations (−0.17 DU yr−1) suggest decreasing trends in tropospheric O3 columns over eastern Asia in 2015–2020 (Fig. 8). The decreasing trends are stronger in the summer and weaker in the spring. Furthermore, the usage of original O3 background conditions can result in overestimated trend by approximately 0.08 DU yr−1 (Fig. 8d1); and the assimilation of OMI O3 observations at across-track positions 4–27 can result in a similar overestimated trend by approximately 0.08 DU yr−1 (Fig. 8e1). These discrepancies demonstrate the importance of optimized usages of regional O3 background conditions and OMI O3 observations in the assimilations.
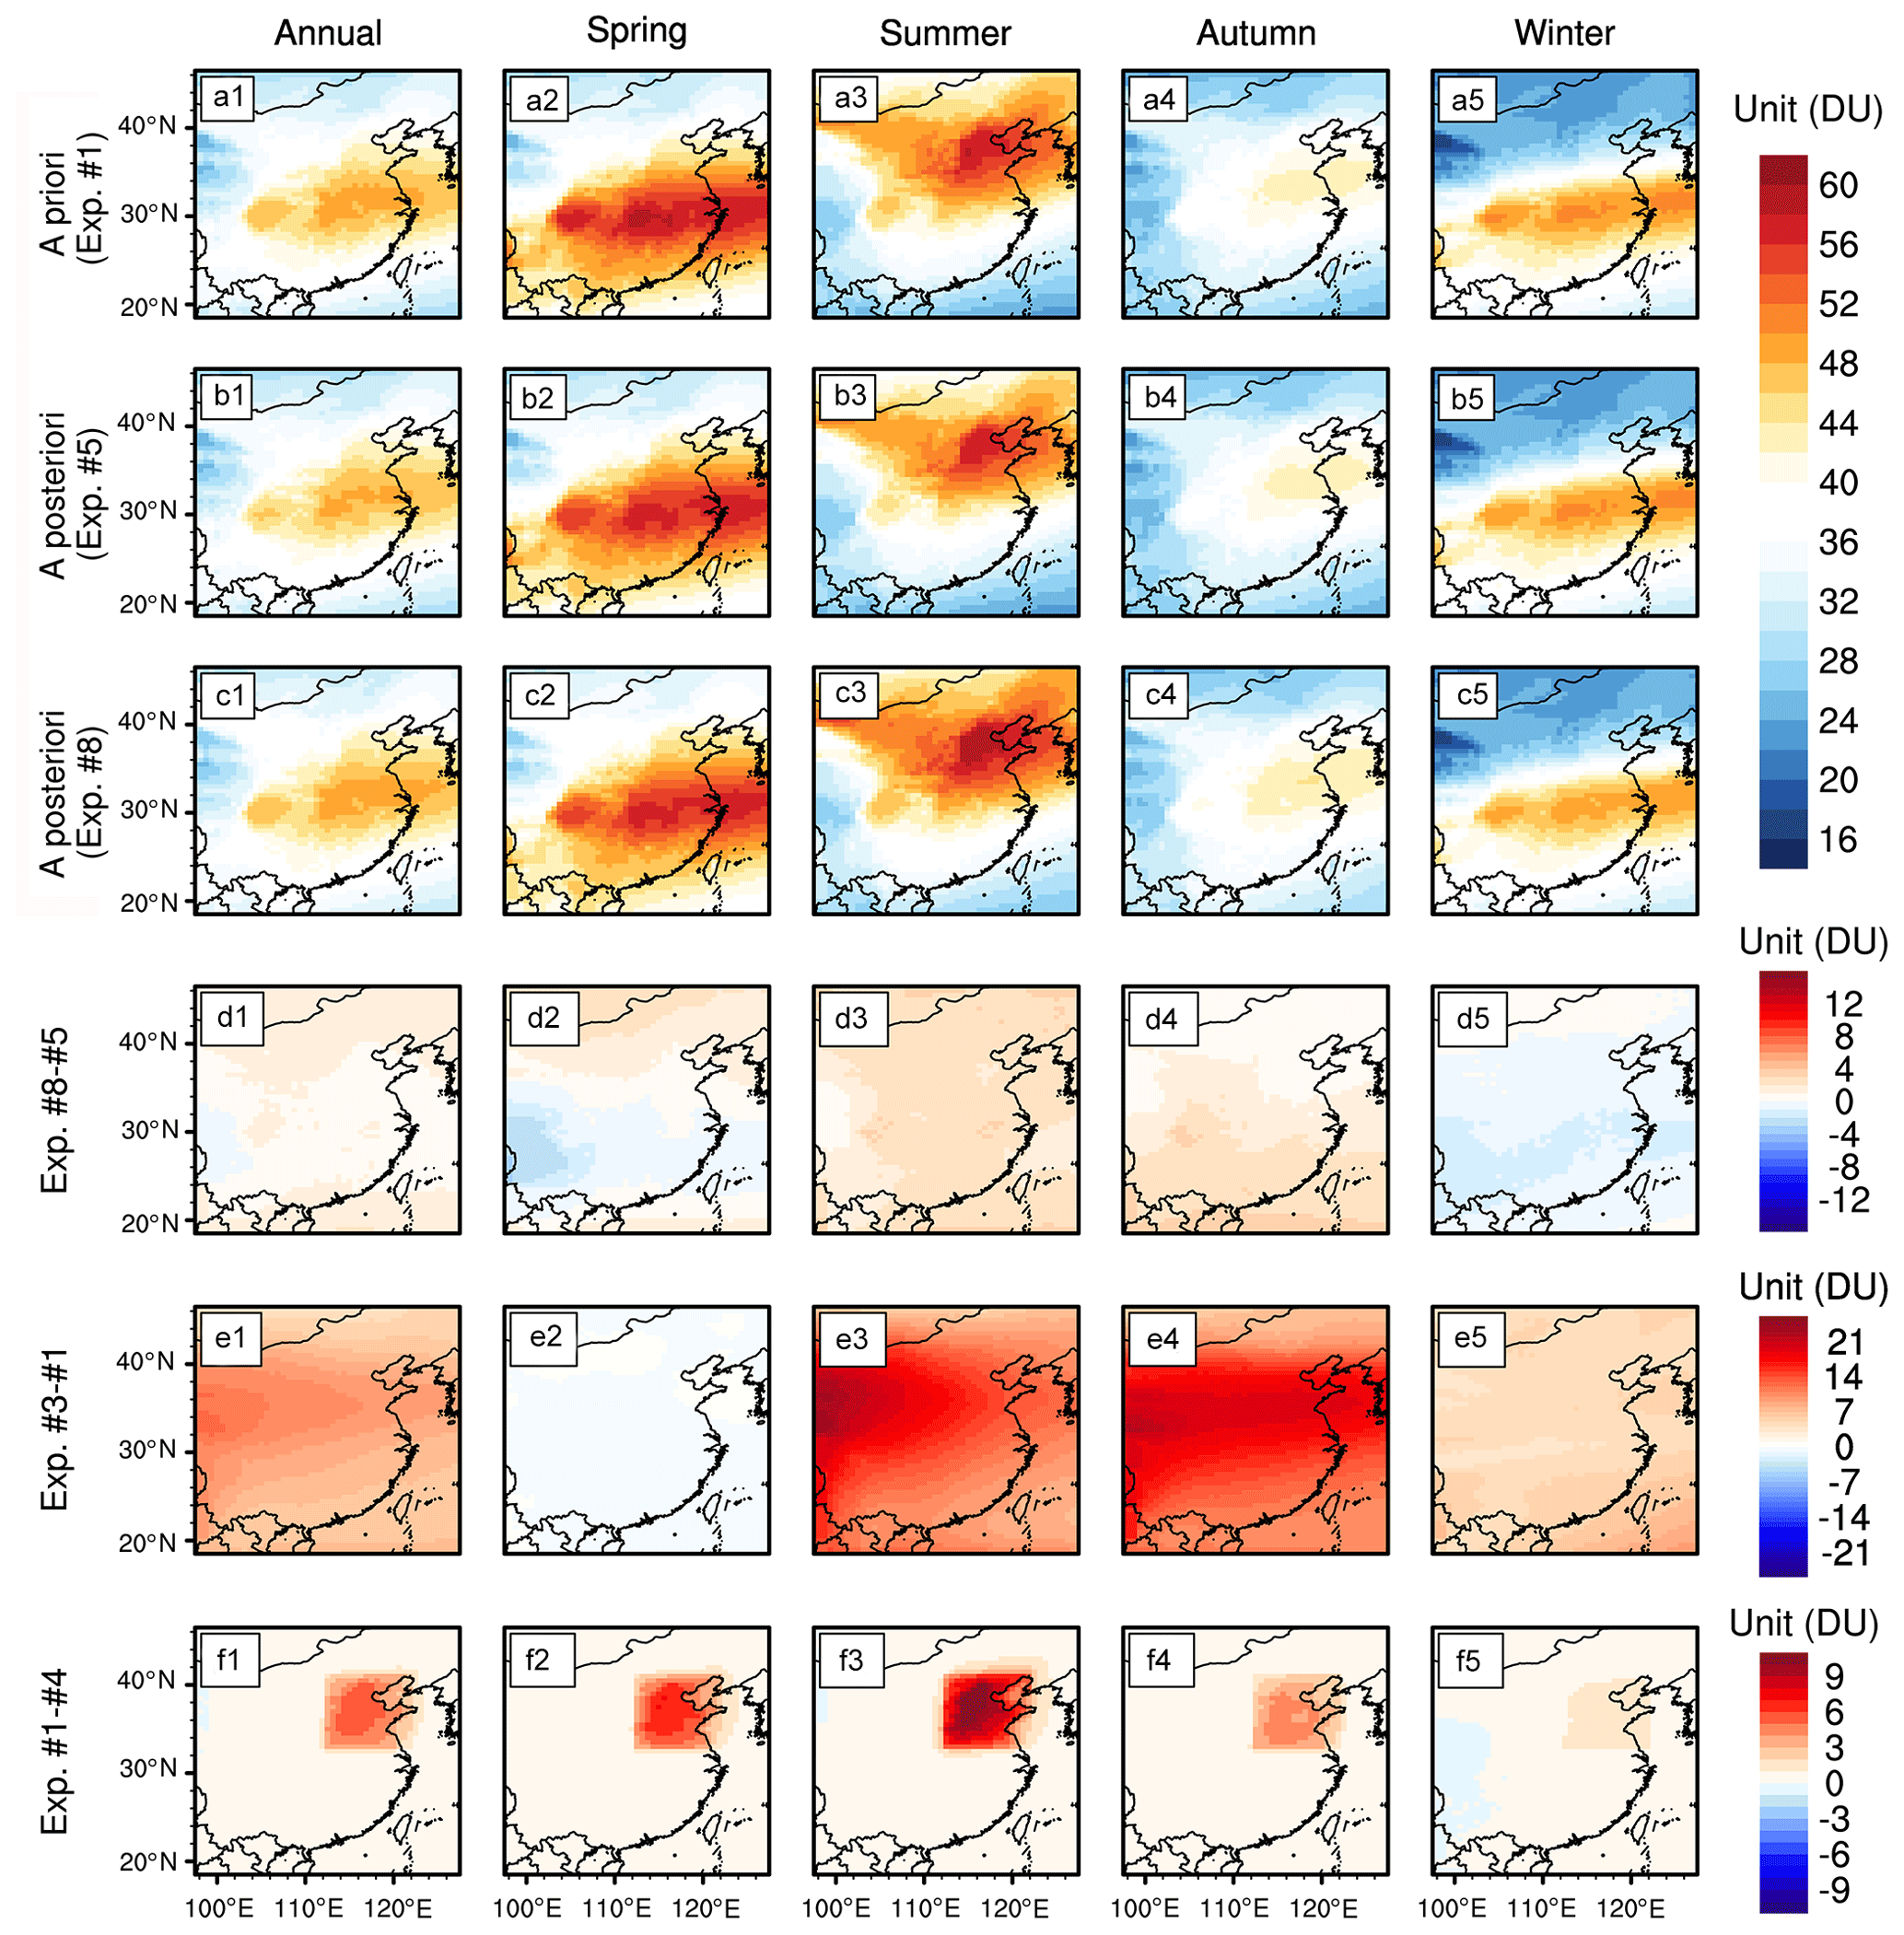
Figure 9Tropospheric O3 columns in 2015–2020 (annual and seasonal averages) from (a1–a5) GEOS-Chem a priori simulation (Exp. no. 1). (b1–b5) Assimilations of MEE surface O3 observations (Exp. no. 5). (c1–c5) Assimilations of OMI O3 observations (Exp. no. 8). (d1–d5) Difference in tropospheric O3 columns calculated by OMI-based assimilations minus MEE-based assimilations (Exp. no. 8 minus no. 5). (e1–e5) Effects of seasonal variabilities in background O3 (Exp. no. 3 minus no. 1). (f1–f5) Effects of O3 formation within the North China Plain PBL (Exp. no. 1 minus no. 4). The output O3 profiles are not convolved with OMI averaging kernels.
3.4 Changes in tropospheric O3 columns
The trends shown in Fig. 8 may not represent the actual tropospheric O3 changes well because the convolution of OMI O3 averaging kernels on the output O3 profiles can affect the weights of the derived tropospheric columns to O3 at different vertical levels. Consequently, Fig. 9 shows the annual and seasonal averages of tropospheric O3 columns in which the output O3 profiles are not convolved with OMI retrieval averaging kernels so that they can better represent the actual atmospheric O3 state. The assimilated tropospheric O3 columns are 37.9 and 38.8 DU (eastern China), 42.9 and 43.7 DU (North China Plain), 47.5 and 48.1 DU (Yangtze River Delta), 47.4 and 48.1 DU (central China), 43.8 and 44.6 DU (Sichuan Basin), and 39.6 and 40.6 DU (southern China) in 2015–2020, by assimilating MEE and OMI O3 observations, respectively.
In contrast to the higher surface MDA8 O3 concentrations over areas with higher anthropogenic NOx emissions, tropospheric O3 columns over central China and the Sichuan Basin are even higher than those over the highly polluted North China Plain. In addition, tropospheric O3 columns obtained by assimilating MEE surface O3 observations are lower than those obtained by assimilating OMI O3 observations, and their difference is larger in the summer and smaller in the winter. As shown in Fig. S4, the impacts of different surface and satellite O3 observations on the assimilated O3 vertical profiles are limited. The assimilation of MEE surface O3 observations leads to decreases in O3 concentrations in the lower troposphere from the surface to 600 hPa levels over the Sichuan Basin and southern China; the assimilation of OMI O3 observations leads to an enhancement in O3 concentrations in the middle and upper troposphere over the highly polluted North China Plain.
The assimilated tropospheric O3 columns are maximum in June–July over the highly polluted North China Plain and March–May over other less polluted regions (Fig. S5). Figure 9e1–e5 exhibit the effects of seasonal variabilities in background O3 (Exp. no. 3). The fixed background O3 in the spring can result in dramatic increases in tropospheric O3 columns by 14.3 (summer), 15.1 (autumn), and 4.8 DU (winter) over eastern China. Figure 9f1–f5 further exhibit the effects of O3 formation within the North China Plain PBL (Exp. no. 4) on tropospheric O3 columns, which are 5.4 (spring), 8.1 (summer), 3.6 (autumn), and 1.3 DU (winter) over the North China Plain. In addition, as shown in Fig. S6, there is a larger enhancement in O3 production rate in the free troposphere (600–300 hPa) over the North China Plain in the summer than in other lower polluted regions. Consequently, the spring maximum in tropospheric O3 columns over lower polluted regions is caused by the enhanced background O3 (Fig. 9e1–e5), and the summer maximum in tropospheric O3 columns over the highly polluted North China Plain is caused by the local contributions from enhanced O3 formation within the North China Plain PBL (Fig. 9f1–f5) and free troposphere (Fig. S6).
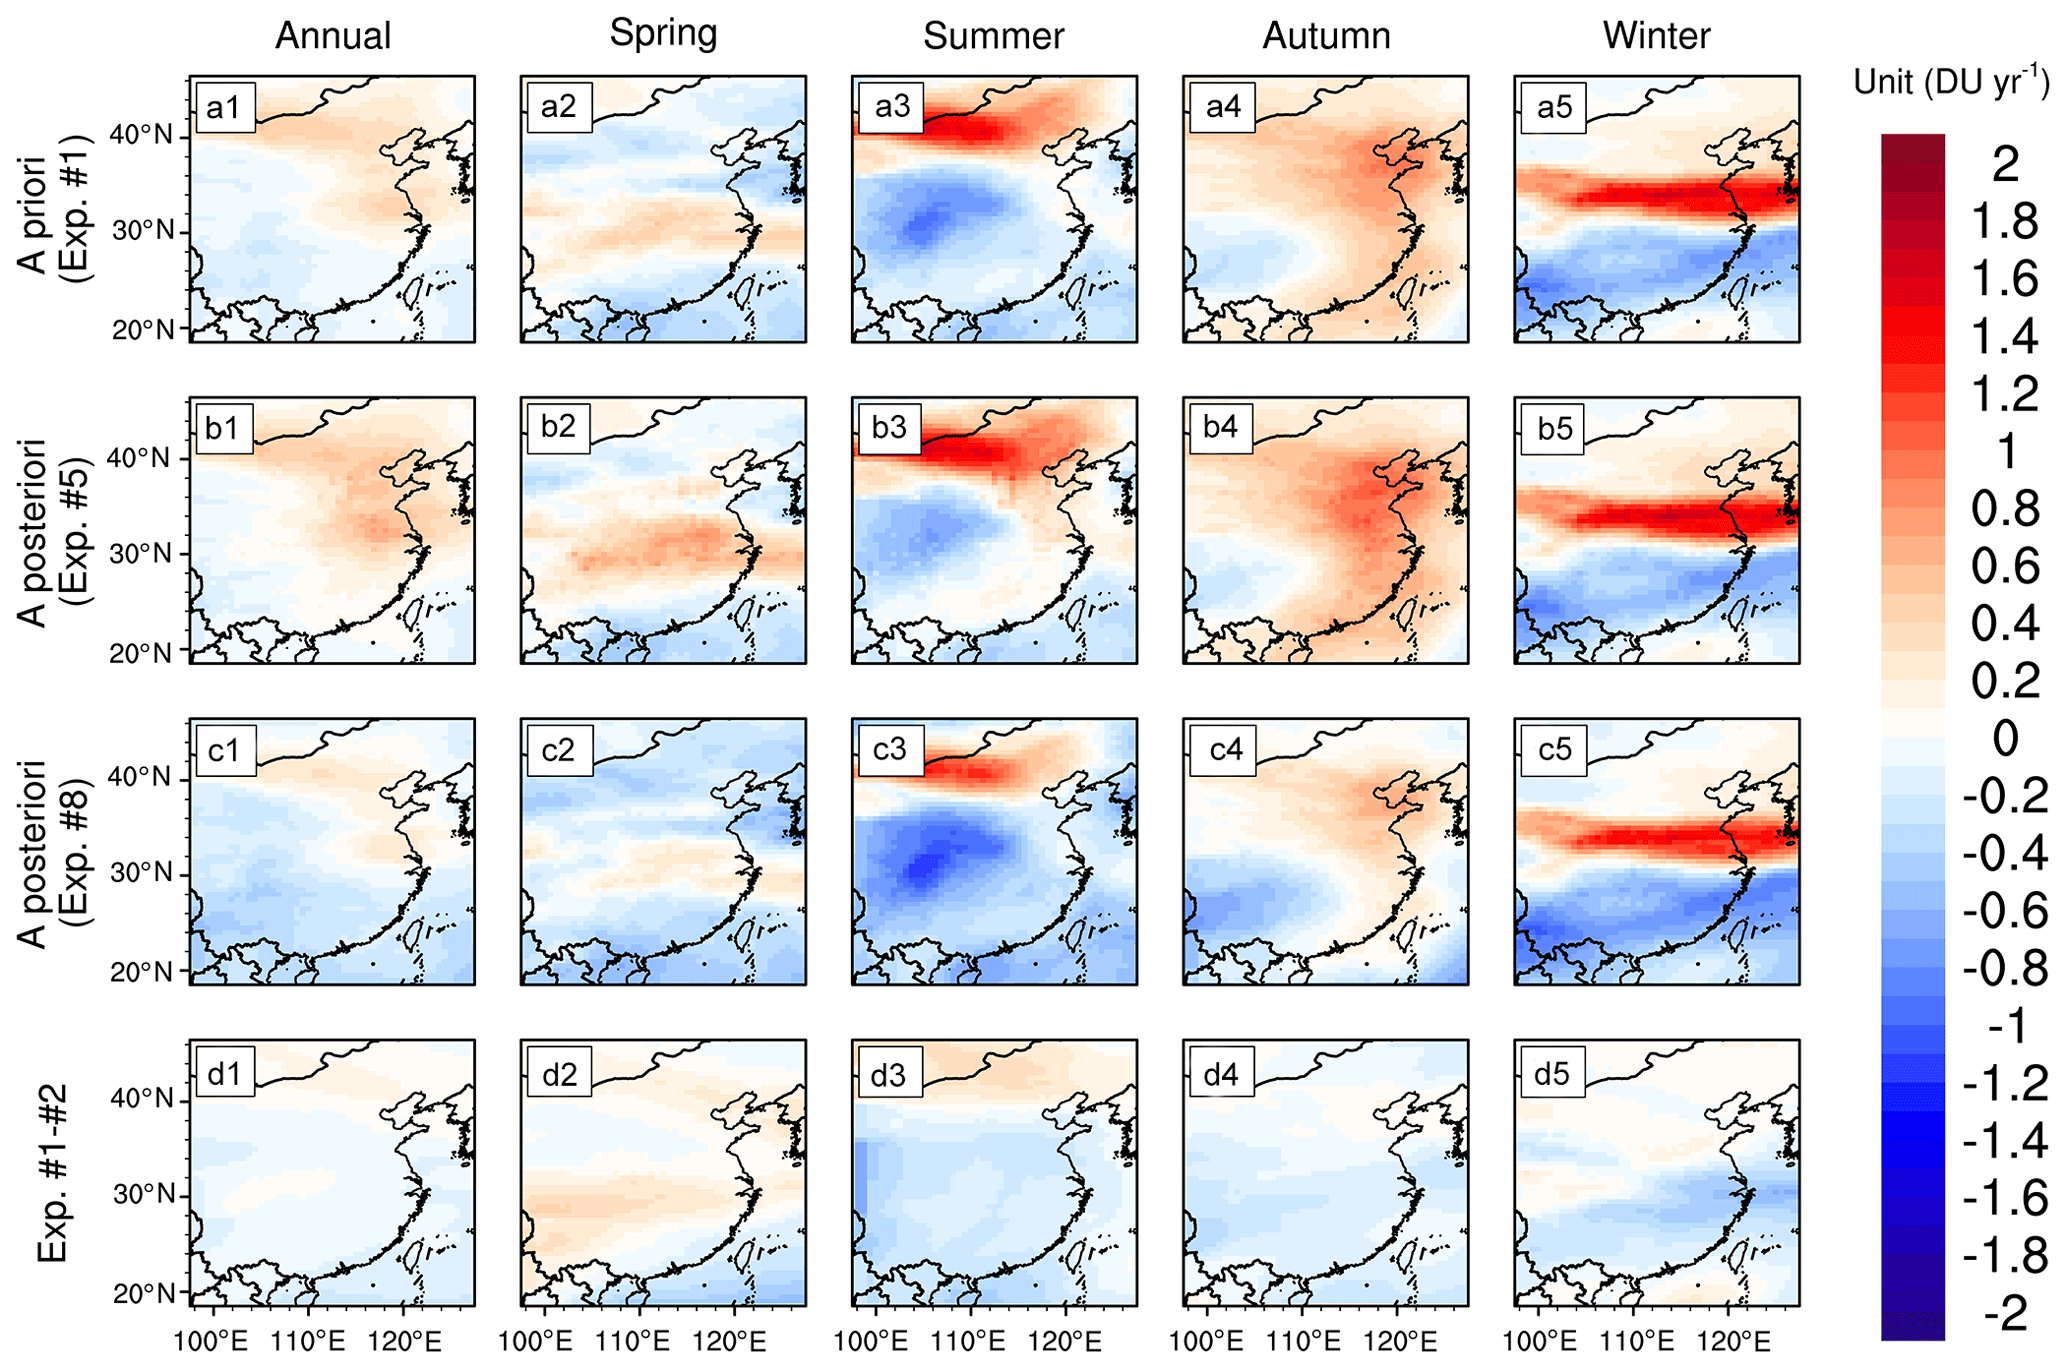
Figure 10Trends of tropospheric O3 columns in 2015–2020 (annual and seasonal averages) from (a1–a5) GEOS-Chem a priori simulation (Exp. no. 1). (b1–b5) Assimilations of MEE surface O3 observations (Exp. no. 5). (c1–c5) Assimilations of OMI O3 observations (Exp. no. 8). (d1–d5) Effects of interannual variabilities in background O3 (Exp. no. 1 minus no. 2). The output O3 profiles are not convolved with OMI averaging kernels.
As shown in Fig. 10a1–a5, the trends of tropospheric O3 columns in the a priori simulations in 2015–2020 are −0.02 (spring), 0.02 (summer), 0.29 (autumn), and 0.09 DU yr−1 (winter) over eastern China. The interannual variability in background O3 (Fig. 10d1–d5; Exp. no. 2) is suggested to have important contributions to the trends of tropospheric O3 columns by 0.09 (spring), −0.11 (summer), −0.10 (autumn), and −0.08 DU yr−1 (winter). The trends of assimilated tropospheric O3 columns are 0.17 and −0.10 DU yr−1 (eastern China), which are comparable with the reported recent trend in free-tropospheric O3 concentrations over China by −0.14 DU yr−1 (Dufour et al., 2021) and are 0.47 and 0.12 DU yr−1 (North China Plain), 0.45 and 0.13 DU yr−1 (Yangtze River Delta), 0.32 and −0.06 DU yr−1 (central China), 0.03 and −0.29 DU yr−1 (Sichuan Basin), and 0.06 and −0.25 DU yr−1 (southern China), by assimilating MEE and OMI O3 observations, respectively.
The stronger increasing trends in tropospheric O3 columns over the highly polluted North China Plain (Fig. 10a1) are suggested to be caused by larger local contributions because of relatively uniform influences from interannual variability in background O3 (Fig. 10d1). Higher positive trends by assimilating MEE observations are expected, given the increasing trends in surface O3 concentrations (1.77 ppb yr−1) and decreasing trends in OMI O3 concentrations (−0.30 DU yr−1) over eastern China. Furthermore, it should be noted that while the Yangtze River Delta is defined as a highly polluted region in our analysis, its area is much smaller than that of the North China Plain (Fig. 1); thus, the impact of local contributions on tropospheric O3 columns over the Yangtze River Delta is not as strong as that over the North China Plain.
A single O3 tracer (tagged-O3) mode was developed in this work to build the capability of the GEOS-Chem model for rapid simulations of tropospheric O3. The single O3 tracer simulation demonstrates consistency with the GEOS-Chem full chemistry simulation. In contrast, the Ox concentrations provided by the tagged-Ox mode are higher than the O3 concentrations by approximately 6 ppb, and the relative difference can reach 40 % in the winter, which is thus not suitable for direct comparison with observed O3. The computational costs of the single O3 tracer mode are reduced by approximately 91 %–94 %, with respect to the full chemistry mode. For example, the computational costs (hours of wall time per simulation year) are 57.5 and 5.2 h at the global scale (4∘ × 5∘) and 80.2 and 4.5 h within the nested China domain (0.5∘ × 0.625∘) by full chemistry and single O3 tracer simulations, respectively. The low computational costs allow us to design and perform different experiments much more efficiently. As shown in Table 1, 10 different simulation and assimilation experiments are performed in this work to analyze the impacts of background and local contributions to surface and free-tropospheric O3 changes over eastern China in 2015–2020, which requires 4812 h (wall time) with the full chemistry simulation but only 270 h (wall time) with the single O3 tracer simulation.
As an application of the single O3 tracer mode, the assimilated surface O3 concentrations demonstrate good agreement with surface O3 observations, with 43.2, 41.8, and 42.1 ppb over eastern China in a priori and a posteriori simulations and observations, respectively. We find noticeable biases in modeled surface O3 concentrations; for example, there is overestimated surface O3 over southern China and underestimated surface O3 over northern China. The assimilations indicate rapidly increasing trends in surface O3 concentrations by 1.60 (spring), 1.16 (summer), 1.47 (autumn), and 0.80 ppb yr−1 (winter) over eastern China in 2015–2020, and the increasing trends are underestimated by the a priori simulations. While surface O3 concentrations are higher over areas with higher anthropogenic NOx emissions, the increasing trends in surface O3 concentrations over central China and southern China are comparable with those in the North China Plain and Yangtze River Delta. Our analysis thus advises more attention to O3 pollution in spring and autumn over areas with lower anthropogenic NOx emissions in China because of the rapid increases in surface O3 concentrations.
Similarly, the assimilated tropospheric O3 columns demonstrate good agreement with OMI observations, with 37.1, 37.9, and 38.0 DU over eastern China in a priori and a posteriori simulations (convolved with OMI retrieval averaging kernels) and OMI observations, respectively. The trends of assimilated tropospheric O3 columns in 2015–2020 over eastern China are 0.09 and −0.17 (spring), 0.17 and −0.22 (summer), 0.38 and 0.04 (autumn), and 0.12 and −0.02 (winter), by assimilating MEE and OMI O3 observations, respectively. We find stronger increasing trends in tropospheric O3 columns over highly polluted areas due to the larger local contributions, for example, 0.47 and 0.12 DU yr−1 (North China Plain) in contrast to 0.03 and −0.29 DU yr−1 (Sichuan Basin) and 0.06 and −0.25 DU yr−1 (southern China), by assimilating MEE and OMI O3 observations, respectively. The large discrepancy by assimilating surface and satellite observations indicates the possible uncertainties in the derived free-tropospheric O3 changes. The usage of optimized O3 background conditions and row-isolated OMI data is important to produce more reliable results; for example, the usage of original O3 background conditions can result in an overestimated trend by approximately 0.08 DU yr−1 in 2015–2020.
Our analysis demonstrates noticeable contributions of the interannual variability in background O3 to the trends in tropospheric O3 over eastern China. The seasonality in surface O3 concentrations is dominated by local contributions; however, the interannual variabilities in background O3 have noticeable contributions to the increasing trends in surface O3, particularly in the summer in the a priori simulations. Moreover, the spring maximum in tropospheric O3 columns over lower polluted regions is caused by the enhanced background O3, and the summer maximum in tropospheric O3 columns over the highly polluted North China Plain is caused by enhanced local O3 formation. The interannual variabilities in background O3 have important contributions to the trends in tropospheric O3 columns; for example, the trends of tropospheric O3 columns in 2015–2020 are −0.02 (spring), 0.02 (summer), 0.29 (autumn), and 0.09 DU yr−1 (winter) over eastern China, and the contributions from interannual variability in background O3 are 0.09 (spring), −0.11 (summer), −0.10 (autumn), and −0.08 DU yr−1 (winter) in the a priori simulations. Our analysis thus suggests more attention to the impact of background O3 to tropospheric O3 changes in China, particularly in the free troposphere.
The capability of rapid O3 simulation developed in this work is a useful tool for interpreting atmospheric O3 observations. Assimilations of surface and satellite observations, as shown in this work, can provide useful information to better describe the changes in surface and free-tropospheric O3. Despite these advantages, it should be noted that the linear chemistry assumption by reading the archived PO3 and LO3 implies that the single O3 tracer mode is good for representing near-current O3 chemical conditions, particularly for scientific issues associated with the sources and transport of tropospheric O3, as well as assimilations in this work and the companion paper (Zhu et al., 2023). More cautious applications are suggested under substantially different O3 chemical conditions, as the linear chemistry assumption could not be satisfied.
The MEE O3 data can be downloaded from https://quotsoft.net/air/ (MEE, 2023). The OMI PROFOZ product can be acquired at https://avdc.gsfc.nasa.gov/pub/data/satellite/Aura/OMI/V03/L2/OMPROFOZ/ (Yang et al., 2023). The GEOS-Chem model (version 12.8.1) can be downloaded from https://doi.org/10.5281/zenodo.3837666 (The International GEOS-Chem User Community, 2020). The KPP module for tagged-O3 simulations can be downloaded from https://doi.org/10.5281/zenodo.7545944 (Jiang, 2023).
The supplement related to this article is available online at: https://doi.org/10.5194/gmd-16-6337-2023-supplement.
ZJ designed the research. RZ developed the model code and performed the research. ZJ and RZ wrote the paper. XL provided instructions for the usage of OMI data. All authors contributed to discussions and editing of the paper.
The contact author has declared that none of the authors has any competing interests.
Publisher's note: Copernicus Publications remains neutral with regard to jurisdictional claims made in the text, published maps, institutional affiliations, or any other geographical representation in this paper. While Copernicus Publications makes every effort to include appropriate place names, the final responsibility lies with the authors.
We thank the China Ministry of Ecology and Environment (MEE), the United States Environmental Protection Agency, and the European Environmental Agency for providing the surface O3 measurements. The numerical calculations in this paper have been done on the supercomputing system at the Supercomputing Center of University of Science and Technology of China.
This research has been supported by the Hundred Talents Program of the Chinese Academy of Sciences and the National Natural Science Foundation of China (grant nos. 42277082 and 41721002).
This paper was edited by Olaf Morgenstern and reviewed by Yuqiang Zhang and one anonymous referee.
Benavides, J., Guevara, M., Snyder, M. G., Rodríguez-Rey, D., Soret, A., Pérez García-Pando, C., and Jorba, O.: On the impact of excess diesel NOx emissions upon NO2 pollution in a compact city, Environ. Res. Lett., 16, 024024, https://doi.org/10.1088/1748-9326/abd5dd, 2021.
Chang, K.-L., Guillas, S., and Fioletov, V. E.: Spatial mapping of ground-based observations of total ozone, Atmos. Meas. Tech., 8, 4487–4505, https://doi.org/10.5194/amt-8-4487-2015, 2015.
Chen, J., Jiang, Z., Li, R., Liao, C., Miyazaki, K., and Jones, D. B. A.: Large discrepancy between observed and modeled wintertime tropospheric NO2 variabilities due to COVID-19 controls in China, Environ. Res. Lett., 17, 035007, https://doi.org/10.1088/1748-9326/ac4ec0, 2022.
Chen, X., Jiang, Z., Shen, Y., Li, R., Fu, Y., Liu, J., Han, H., Liao, H., Cheng, X., Jones, D. B. A., Worden, H., and Abad, G. G.: Chinese Regulations Are Working—Why Is Surface Ozone Over Industrialized Areas Still High? Applying Lessons From Northeast US Air Quality Evolution, Geophys. Res. Lett., 48, e2021GL092816, https://doi.org/10.1029/2021gl092816, 2021.
Dufour, G., Hauglustaine, D., Zhang, Y., Eremenko, M., Cohen, Y., Gaudel, A., Siour, G., Lachatre, M., Bense, A., Bessagnet, B., Cuesta, J., Ziemke, J., Thouret, V., and Zheng, B.: Recent ozone trends in the Chinese free troposphere: role of the local emission reductions and meteorology, Atmos. Chem. Phys., 21, 16001–16025, https://doi.org/10.5194/acp-21-16001-2021, 2021.
Elguindi, N., Granier, C., Stavrakou, T., Darras, S., Bauwens, M., Cao, H., Chen, C., Denier van der Gon, H. A. C., Dubovik, O., Fu, T. M., Henze, D. K., Jiang, Z., Keita, S., Kuenen, J. J. P., Kurokawa, J., Liousse, C., Miyazaki, K., Müller, J. F., Qu, Z., Solmon, F., and Zheng, B.: Intercomparison of Magnitudes and Trends in Anthropogenic Surface Emissions From Bottom-Up Inventories, Top-Down Estimates, and Emission Scenarios, Earth's Future, 8, e2020EF001520, https://doi.org/10.1029/2020ef001520, 2020.
Fu, D., Kulawik, S. S., Miyazaki, K., Bowman, K. W., Worden, J. R., Eldering, A., Livesey, N. J., Teixeira, J., Irion, F. W., Herman, R. L., Osterman, G. B., Liu, X., Levelt, P. F., Thompson, A. M., and Luo, M.: Retrievals of tropospheric ozone profiles from the synergism of AIRS and OMI: methodology and validation, Atmos. Meas. Tech., 11, 5587–5605, https://doi.org/10.5194/amt-11-5587-2018, 2018.
Han, H., Liu, J., Yuan, H., Zhuang, B., Zhu, Y., Wu, Y., Yan, Y., and Ding, A.: Characteristics of intercontinental transport of tropospheric ozone from Africa to Asia, Atmos. Chem. Phys., 18, 4251–4276, https://doi.org/10.5194/acp-18-4251-2018, 2018.
Han, W., He, T.-L., Tang, Z., Wang, M., Jones, D., and Jiang, Z.: A comparative analysis for a deep learning model (hyDL-CO v1.0) and Kalman filter to predict CO concentrations in China, Geosci. Model Dev., 15, 4225–4237, https://doi.org/10.5194/gmd-15-4225-2022, 2022.
Hoesly, R. M., Smith, S. J., Feng, L., Klimont, Z., Janssens-Maenhout, G., Pitkanen, T., Seibert, J. J., Vu, L., Andres, R. J., Bolt, R. M., Bond, T. C., Dawidowski, L., Kholod, N., Kurokawa, J.-I., Li, M., Liu, L., Lu, Z., Moura, M. C. P., O'Rourke, P. R., and Zhang, Q.: Historical (1750–2014) anthropogenic emissions of reactive gases and aerosols from the Community Emissions Data System (CEDS), Geosci. Model Dev., 11, 369–408, https://doi.org/10.5194/gmd-11-369-2018, 2018.
Huang, G., Liu, X., Chance, K., Yang, K., Bhartia, P. K., Cai, Z., Allaart, M., Ancellet, G., Calpini, B., Coetzee, G. J. R., Cuevas-Agulló, E., Cupeiro, M., De Backer, H., Dubey, M. K., Fuelberg, H. E., Fujiwara, M., Godin-Beekmann, S., Hall, T. J., Johnson, B., Joseph, E., Kivi, R., Kois, B., Komala, N., König-Langlo, G., Laneve, G., Leblanc, T., Marchand, M., Minschwaner, K. R., Morris, G., Newchurch, M. J., Ogino, S.-Y., Ohkawara, N., Piters, A. J. M., Posny, F., Querel, R., Scheele, R., Schmidlin, F. J., Schnell, R. C., Schrems, O., Selkirk, H., Shiotani, M., Skrivánková, P., Stübi, R., Taha, G., Tarasick, D. W., Thompson, A. M., Thouret, V., Tully, M. B., Van Malderen, R., Vömel, H., von der Gathen, P., Witte, J. C., and Yela, M.: Validation of 10-year SAO OMI Ozone Profile (PROFOZ) product using ozonesonde observations, Atmos. Meas. Tech., 10, 2455–2475, https://doi.org/10.5194/amt-10-2455-2017, 2017.
Huijnen, V., Miyazaki, K., Flemming, J., Inness, A., Sekiya, T., and Schultz, M. G.: An intercomparison of tropospheric ozone reanalysis products from CAMS, CAMS interim, TCR-1, and TCR-2, Geosci. Model Dev., 13, 1513–1544, https://doi.org/10.5194/gmd-13-1513-2020, 2020.
Iglesias-Suarez, F., Kinnison, D. E., Rap, A., Maycock, A. C., Wild, O., and Young, P. J.: Key drivers of ozone change and its radiative forcing over the 21st century, Atmos. Chem. Phys., 18, 6121–6139, https://doi.org/10.5194/acp-18-6121-2018, 2018.
Jiang, Z.: KPP module for tagged-O3 simulation, Zenodo [code], https://doi.org/10.5281/zenodo.7545944, 2023.
Jiang, Z., Miyazaki, K., Worden, J. R., Liu, J. J., Jones, D. B. A., and Henze, D. K.: Impacts of anthropogenic and natural sources on free tropospheric ozone over the Middle East, Atmos. Chem. Phys., 16, 6537–6546, https://doi.org/10.5194/acp-16-6537-2016, 2016.
Jiang, Z., Zhu, R., Miyazaki, K., McDonald, B. C., Klimont, Z., Zheng, B., Boersma, K. F., Zhang, Q., Worden, H., Worden, J. R., Henze, D. K., Jones, D. B. A., Denier van der Gon, H. A. C., and Eskes, H.: Decadal Variabilities in Tropospheric Nitrogen Oxides Over United States, Europe, and China, J. Geophys. Res.-Atmos., 127, e2021JD035872, https://doi.org/10.1029/2021jd035872, 2022.
Li, D., Shindell, D., Ding, D., Lu, X., Zhang, L., and Zhang, Y.: Surface ozone impacts on major crop production in China from 2010 to 2017, Atmos. Chem. Phys., 22, 2625–2638, https://doi.org/10.5194/acp-22-2625-2022, 2022.
Li, K., Jacob, D. J., Liao, H., Shen, L., Zhang, Q., and Bates, K. H.: Anthropogenic drivers of 2013–2017 trends in summer surface ozone in China, P. Natl. Acad. Sci. USA, 116, 422–427, https://doi.org/10.1073/pnas.1812168116, 2019.
Li, M., Zhang, Q., Kurokawa, J.-I., Woo, J.-H., He, K., Lu, Z., Ohara, T., Song, Y., Streets, D. G., Carmichael, G. R., Cheng, Y., Hong, C., Huo, H., Jiang, X., Kang, S., Liu, F., Su, H., and Zheng, B.: MIX: a mosaic Asian anthropogenic emission inventory under the international collaboration framework of the MICS-Asia and HTAP, Atmos. Chem. Phys., 17, 935–963, https://doi.org/10.5194/acp-17-935-2017, 2017.
Li, M., Zhang, Q., Zheng, B., Tong, D., Lei, Y., Liu, F., Hong, C., Kang, S., Yan, L., Zhang, Y., Bo, Y., Su, H., Cheng, Y., and He, K.: Persistent growth of anthropogenic non-methane volatile organic compound (NMVOC) emissions in China during 1990–2017: drivers, speciation and ozone formation potential, Atmos. Chem. Phys., 19, 8897–8913, https://doi.org/10.5194/acp-19-8897-2019, 2019.
Li, R., Zhao, Y., Zhou, W., Meng, Y., Zhang, Z., and Fu, H.: Developing a novel hybrid model for the estimation of surface 8 h ozone (O3) across the remote Tibetan Plateau during 2005–2018, Atmos. Chem. Phys., 20, 6159–6175, https://doi.org/10.5194/acp-20-6159-2020, 2020.
Liu, X., Bhartia, P. K., Chance, K., Spurr, R. J. D., and Kurosu, T. P.: Ozone profile retrievals from the Ozone Monitoring Instrument, Atmos. Chem. Phys., 10, 2521–2537, https://doi.org/10.5194/acp-10-2521-2010, 2010.
Liu, X., Zhu, Y., Xue, L., Desai, A. R., and Wang, H.: Cluster-Enhanced Ensemble Learning for Mapping Global Monthly Surface Ozone From 2003 to 2019, Geophys. Res. Lett., 49, e2022GL097947, https://doi.org/10.1029/2022gl097947, 2022.
Liu, Z., Doherty, R. M., Wild, O., Hollaway, M., and O’Connor, F. M.: Contrasting chemical environments in summertime for atmospheric ozone across major Chinese industrial regions: the effectiveness of emission control strategies, Atmos. Chem. Phys., 21, 10689–10706, https://doi.org/10.5194/acp-21-10689-2021, 2021.
Logan, J. A., Staehelin, J., Megretskaia, I. A., Cammas, J. P., Thouret, V., Claude, H., De Backer, H., Steinbacher, M., Scheel, H. E., Stübi, R., Fröhlich, M., and Derwent, R.: Changes in ozone over Europe: Analysis of ozone measurements from sondes, regular aircraft (MOZAIC) and alpine surface sites, J. Geophys. Res.-Atmos., 117, D09301, https://doi.org/10.1029/2011jd016952, 2012.
Ma, C., Wang, T., Mizzi, A. P., Anderson, J. L., Zhuang, B., Xie, M., and Wu, R.: Multiconstituent Data Assimilation With WRF-Chem/DART: Potential for Adjusting Anthropogenic Emissions and Improving Air Quality Forecasts Over Eastern China, J. Geophys. Res.-Atmos., 7393–7412, https://doi.org/10.1029/2019jd030421, 2019.
MEE (China Ministry of Ecology and Environment): Surface O3 measurements, China Ministry of Ecology and Environment [data set], https://quotsoft.net/air (last access: 2 November 2023), 2023.
Mickley, L. J.: Climate response to the increase in tropospheric ozone since preindustrial times: A comparison between ozone and equivalent CO2 forcings, J. Geophys. Res., 109, D05106, https://doi.org/10.1029/2003jd003653, 2004.
Miyazaki, K., Eskes, H., Sudo, K., Boersma, K. F., Bowman, K., and Kanaya, Y.: Decadal changes in global surface NOx emissions from multi-constituent satellite data assimilation, Atmos. Chem. Phys., 17, 807–837, https://doi.org/10.5194/acp-17-807-2017, 2017.
Mousavinezhad, S., Choi, Y., Pouyaei, A., Ghahremanloo, M., and Nelson, D. L.: A comprehensive investigation of surface ozone pollution in China, 2015–2019: Separating the contributions from meteorology and precursor emissions, Atmos. Res., 257, 105599, https://doi.org/10.1016/j.atmosres.2021.105599, 2021.
Oetjen, H., Payne, V. H., Neu, J. L., Kulawik, S. S., Edwards, D. P., Eldering, A., Worden, H. M., and Worden, J. R.: A joint data record of tropospheric ozone from Aura-TES and MetOp-IASI, Atmos. Chem. Phys., 16, 10229–10239, https://doi.org/10.5194/acp-16-10229-2016, 2016.
Parrington, M., Jones, D. B. A., Bowman, K. W., Horowitz, L. W., Thompson, A. M., Tarasick, D. W., and Witte, J. C.: Estimating the summertime tropospheric ozone distribution over North America through assimilation of observations from the Tropospheric Emission Spectrometer, J. Geophys. Res., 113, D18307, https://doi.org/10.1029/2007jd009341, 2008.
Parrington, M., Palmer, P. I., Henze, D. K., Tarasick, D. W., Hyer, E. J., Owen, R. C., Helmig, D., Clerbaux, C., Bowman, K. W., Deeter, M. N., Barratt, E. M., Coheur, P.-F., Hurtmans, D., Jiang, Z., George, M., and Worden, J. R.: The influence of boreal biomass burning emissions on the distribution of tropospheric ozone over North America and the North Atlantic during 2010, Atmos. Chem. Phys., 12, 2077–2098, https://doi.org/10.5194/acp-12-2077-2012, 2012.
Parrish, D. D., Derwent, R. G., Turnock, S. T., O'Connor, F. M., Staehelin, J., Bauer, S. E., Deushi, M., Oshima, N., Tsigaridis, K., Wu, T., and Zhang, J.: Investigations on the anthropogenic reversal of the natural ozone gradient between northern and southern midlatitudes, Atmos. Chem. Phys., 21, 9669–9679, https://doi.org/10.5194/acp-21-9669-2021, 2021.
Peng, X., Shen, H., Zhang, L., Zeng, C., Yang, G., and He, Z.: Spatially continuous mapping of daily global ozone distribution (2004–2014) with the Aura OMI sensor, J. Geophys. Res.-Atmos., 121, 12702–12722, https://doi.org/10.1002/2016jd025013, 2016.
Peng, X., Wang, W., Xia, M., Chen, H., Ravishankara, A. R., Li, Q., Saiz-Lopez, A., Liu, P., Zhang, F., Zhang, C., Xue, L., Wang, X., George, C., Wang, J., Mu, Y., Chen, J., and Wang, T.: An unexpected large continental source of reactive bromine and chlorine with significant impact on wintertime air quality, Natl. Sci. Rev., 8, nwaa304, https://doi.org/10.1093/nsr/nwaa304, 2021.
Prinn, R. G.: The Cleansing Capacity of the Atmosphere, Annu. Rev. Environ. Resour., 28, 29–57, https://doi.org/10.1146/annurev.energy.28.011503.163425, 2003.
Schaap, M., Cuvelier, C., Hendriks, C., Bessagnet, B., Baldasano, J. M., Colette, A., Thunis, P., Karam, D., Fagerli, H., Graff, A., Kranenburg, R., Nyiri, A., Pay, M. T., Rouïl, L., Schulz, M., Simpson, D., Stern, R., Terrenoire, E., and Wind, P.: Performance of European chemistry transport models as function of horizontal resolution, Atmos. Environ., 112, 90–105, https://doi.org/10.1016/j.atmosenv.2015.04.003, 2015.
Spurr, R. J. D.: VLIDORT: A linearized pseudo-spherical vector discrete ordinate radiative transfer code for forward model and retrieval studies in multilayer multiple scattering media, J. Quant. Spectrosc. Ra., 102, 316–342, https://doi.org/10.1016/j.jqsrt.2006.05.005, 2006.
Tang, Z., Chen, J., and Jiang, Z.: Discrepancy in assimilated atmospheric CO over East Asia in 2015–2020 by assimilating satellite and surface CO measurements, Atmos. Chem. Phys., 22, 7815–7826, https://doi.org/10.5194/acp-22-7815-2022, 2022.
The International GEOS-Chem User Community: GEOS-Chem, Version 12.8.1, Zenodo [code], https://doi.org/10.5281/zenodo.3837666, 2020.
Thompson, A. M.: The oxidizing capacity of the earth's atmosphere: probable past and future changes, Science, 256, 1157–1165, https://doi.org/10.1126/science.256.5060.1157, 1992.
van der Werf, G. R., Randerson, J. T., Giglio, L., Collatz, G. J., Mu, M., Kasibhatla, P. S., Morton, D. C., DeFries, R. S., Jin, Y., and van Leeuwen, T. T.: Global fire emissions and the contribution of deforestation, savanna, forest, agricultural, and peat fires (1997–2009), Atmos. Chem. Phys., 10, 11707–11735, https://doi.org/10.5194/acp-10-11707-2010, 2010.
Wang, W., Parrish, D. D., Wang, S., Bao, F., Ni, R., Li, X., Yang, S., Wang, H., Cheng, Y., and Su, H.: Long-term trend of ozone pollution in China during 2014–2020: distinct seasonal and spatial characteristics and ozone sensitivity, Atmos. Chem. Phys., 22, 8935–8949, https://doi.org/10.5194/acp-22-8935-2022, 2022.
Wang, X., Fu, T. M., Zhang, L., Lu, X., Liu, X., Amnuaylojaroen, T., Latif, M. T., Ma, Y., Zhang, L., Feng, X., Zhu, L., Shen, H., and Yang, X.: Rapidly Changing Emissions Drove Substantial Surface and Tropospheric Ozone Increases Over Southeast Asia, Geophys. Res. Lett., 49, e2022GL100223, https://doi.org/10.1029/2022gl100223, 2022.
Wei, J., Li, Z., Li, K., Dickerson, R. R., Pinker, R. T., Wang, J., Liu, X., Sun, L., Xue, W., and Cribb, M.: Full-coverage mapping and spatiotemporal variations of ground-level ozone (O3) pollution from 2013 to 2020 across China, Remote Sens. Environ., 270, 112775, https://doi.org/10.1016/j.rse.2021.112775, 2022.
Yang, K., Liu, X., and Bhartia, P.: OMI/Aura Vertical Ozone (O3) Profile (PROFOZ), Aura Validation Data Center (AVDC), NASA GSFC [data set], https://avdc.gsfc.nasa.gov/pub/data/satellite/Aura/OMI/V03/L2/OMPROFOZ/ (last access: 2 November 2023), 2023.
Zhang, L., Jacob, D. J., Boersma, K. F., Jaffe, D. A., Olson, J. R., Bowman, K. W., Worden, J. R., Thompson, A. M., Avery, M. A., Cohen, R. C., Dibb, J. E., Flock, F. M., Fuelberg, H. E., Huey, L. G., McMillan, W. W., Singh, H. B., and Weinheimer, A. J.: Transpacific transport of ozone pollution and the effect of recent Asian emission increases on air quality in North America: an integrated analysis using satellite, aircraft, ozonesonde, and surface observations, Atmos. Chem. Phys., 8, 6117–6136, https://doi.org/10.5194/acp-8-6117-2008, 2008.
Zhang, Y., Shindell, D., Seltzer, K., Shen, L., Lamarque, J.-F., Zhang, Q., Zheng, B., Xing, J., Jiang, Z., and Zhang, L.: Impacts of emission changes in China from 2010 to 2017 on domestic and intercontinental air quality and health effect, Atmos. Chem. Phys., 21, 16051–16065, https://doi.org/10.5194/acp-21-16051-2021, 2021.
Zheng, B., Tong, D., Li, M., Liu, F., Hong, C., Geng, G., Li, H., Li, X., Peng, L., Qi, J., Yan, L., Zhang, Y., Zhao, H., Zheng, Y., He, K., and Zhang, Q.: Trends in China's anthropogenic emissions since 2010 as the consequence of clean air actions, Atmos. Chem. Phys., 18, 14095–14111, https://doi.org/10.5194/acp-18-14095-2018, 2018.
Zhu, R., Tang, Z., Chen, X., Liu, X., and Jiang, Z.: Rapid O3 assimilations – Part 2: Tropospheric O3 changes accompanied by declining NOx emissions in the USA and Europe in 2005–2020, Atmos. Chem. Phys., 23, 9745–9763, https://doi.org/10.5194/acp-23-9745-2023, 2023.
Zhu, Y., Liu, J., Wang, T., Zhuang, B., Han, H., Wang, H., Chang, Y., and Ding, K.: The Impacts of Meteorology on the Seasonal and Interannual Variabilities of Ozone Transport From North America to East Asia, J. Geophys. Res.-Atmos., 122, 10612–10636, https://doi.org/10.1002/2017jd026761, 2017.
Ziemke, J. R., Oman, L. D., Strode, S. A., Douglass, A. R., Olsen, M. A., McPeters, R. D., Bhartia, P. K., Froidevaux, L., Labow, G. J., Witte, J. C., Thompson, A. M., Haffner, D. P., Kramarova, N. A., Frith, S. M., Huang, L.-K., Jaross, G. R., Seftor, C. J., Deland, M. T., and Taylor, S. L.: Trends in global tropospheric ozone inferred from a composite record of TOMS/OMI/MLS/OMPS satellite measurements and the MERRA-2 GMI simulation, Atmos. Chem. Phys., 19, 3257–3269, https://doi.org/10.5194/acp-19-3257-2019, 2019.