the Creative Commons Attribution 4.0 License.
the Creative Commons Attribution 4.0 License.
 | 26 Oct 2023
Overcoming barriers to enable convergence research by integrating ecological and climate sciences: the NCAR–NEON system Version 1
Danica L. Lombardozzi
William R. Wieder
Negin Sobhani
Gordon B. Bonan
David Durden
Dawn Lenz
Michael SanClements
Samantha Weintraub-Leff
Edward Ayres
Christopher R. Florian
Kyla Dahlin
Sanjiv Kumar
Abigail L. S. Swann
Claire M. Zarakas
Charles Vardeman
Valerio Pascucci
Global change research demands a convergence among academic disciplines to understand complex changes in Earth system function. Limitations related to data usability and computing infrastructure, however, present barriers to effective use of the research tools needed for this cross-disciplinary collaboration. To address these barriers, we created a computational platform that pairs meteorological data and site-level ecosystem characterizations from the National Ecological Observatory Network (NEON) with the Community Terrestrial System Model (CTSM) that is developed with university partners at the National Center for Atmospheric Research (NCAR). This NCAR–NEON system features a simplified user interface that facilitates access to and use of NEON observations and NCAR models. We present preliminary results that compare observed NEON fluxes with CTSM simulations and describe how the collaboration between NCAR and NEON that can be used by the global change research community improves both the data and model. Beyond datasets and computing, the NCAR–NEON system includes tutorials and visualization tools that facilitate interaction with observational and model datasets and further enable opportunities for teaching and research. By expanding access to data, models, and computing, cyberinfrastructure tools like the NCAR–NEON system will accelerate integration across ecology and climate science disciplines to advance understanding in Earth system science and global change.
- Article
(6151 KB) - Full-text XML
-
Supplement
(2360 KB) - BibTeX
- EndNote


Earth system science aims to deepen understanding of interactions between natural and social systems and their responses to global change. As such, the collective understanding of changes in Earth system function in response to global change drivers requires a convergence among scientific disciplines, including physical and natural sciences (Kyker-Snowman et al., 2022). This research combines a variety of complex observational data with ever more sophisticated computational models. Notably, Earth system models (ESMs) are essential tools for assessing and predicting our changing environment (Bonan and Doney, 2018), but limitations related to data usability and access to computing infrastructure present barriers to effective use of these research tools (Fer et al., 2021). Addressing these barriers is critical to engage the broad cross-disciplinary communities that are required for Earth system science research, education, and training (National Academies of Sciences, Engineering, and Medicine, 2022). We feel that tractable progress can be made to reduce these data and technical barriers to better understand and project changes in Earth system function under global change.
The availability, discoverability, and usability of observational data are essential to running, calibrating, and validating models. For example, the scientific advancements made in measuring eddy covariance (EC) fluxes have been critical to the development, evaluation, and improvement of the representation of terrestrial ecosystems in ESMs. Initially, model–data comparisons were limited to short, intensive field campaigns extending over a few weeks (Bonan et al., 1997), but this grew to comparison with flux network datasets extending over several years at multiple sites (Stöckli et al., 2008) and comparison with globally gridded flux products (Bonan et al., 2011; Jung et al., 2020). Flux tower datasets continue to provide essential information for land model development and evaluation (Best et al., 2015; Lawrence et al., 2019). Notably, single-point simulations can use EC measurements to facilitate more rapid model development and testing of ecological hypotheses (Bonan et al., 2012; Burns et al., 2018; Collier et al., 2018; Swenson et al., 2019; Wieder et al., 2017). An explosion of EC measurements and strong network coordination make these data easier to find (Beringer et al., 2022; Durden et al., 2020; Pastorello et al., 2020; Novick et al., 2018), but the need to perform additional data processing prior to use presents barriers to integrating ecological observations into land model development and evaluation. These barriers include gap filling associated meteorological data, assessing EC flux data quality, and persistent challenges in discovering and harmonizing complementary data – including information about vegetation and soils at EC tower sites. Our work seeks to provide a framework to address these data challenges to facilitate the integration of local meteorology, EC flux measurements, and ecosystem characterizations in the development and evaluation of land models that are used for Earth system prediction and global change research.
Beyond these data challenges, barriers to accessing and using computing infrastructure also impede broader community engagement with tools that are central to global change research. This limits the participation of scientists from environmental science, ecology, and agroecology, which are fundamental components of the Earth system, in the development and use of ESMs. The Community Earth System Model (CESM; Hurrell et al., 2013; Danabasoglu et al., 2020) has a long history of being freely and openly available to users, yet several barriers related to training, cyberinfrastructure, and data integration have hampered broader adoption and use of this model by a wide range of researchers. Thus, model code may be publicly available, but access to computing resources and the associated technical expertise needed to use them presents barriers to engaging a diverse cross-disciplinary community of model users who can harness these powerful tools for research and teaching. We contend that broader engagement across scientific disciplines is critical to improving the representation of Earth system processes and their likely responses to global change.
This work overcomes some of the barriers to the use of ESMs in ecology by creating an integrated “NCAR–NEON system”. This system combines meteorological data and site-level ecosystem characterizations from the National Ecological Observatory Network (NEON) with the Community Terrestrial System Model (CTSM), an extension of the Community Land Model (CLM5; Lawrence et al., 2019). CTSM is the terrestrial component of CESM, which is developed with university partners at the National Center for Atmospheric Research (NCAR; Fig. 1). The NCAR–NEON system also features a simplified user interface that facilitates access to and use of NEON observations and NCAR models. By developing this NCAR–NEON system, we aim to enable the convergence of climate and ecological sciences by providing accessible cyberinfrastructure, quality-controlled datasets from NEON, and tutorials for analyzing and visualizing observed and simulated data. We describe development of the NCAR–NEON system, present results comparing observed NEON fluxes with simulations from CTSM, and outline opportunities that the system enables for research and education across research networks and scientific disciplines.
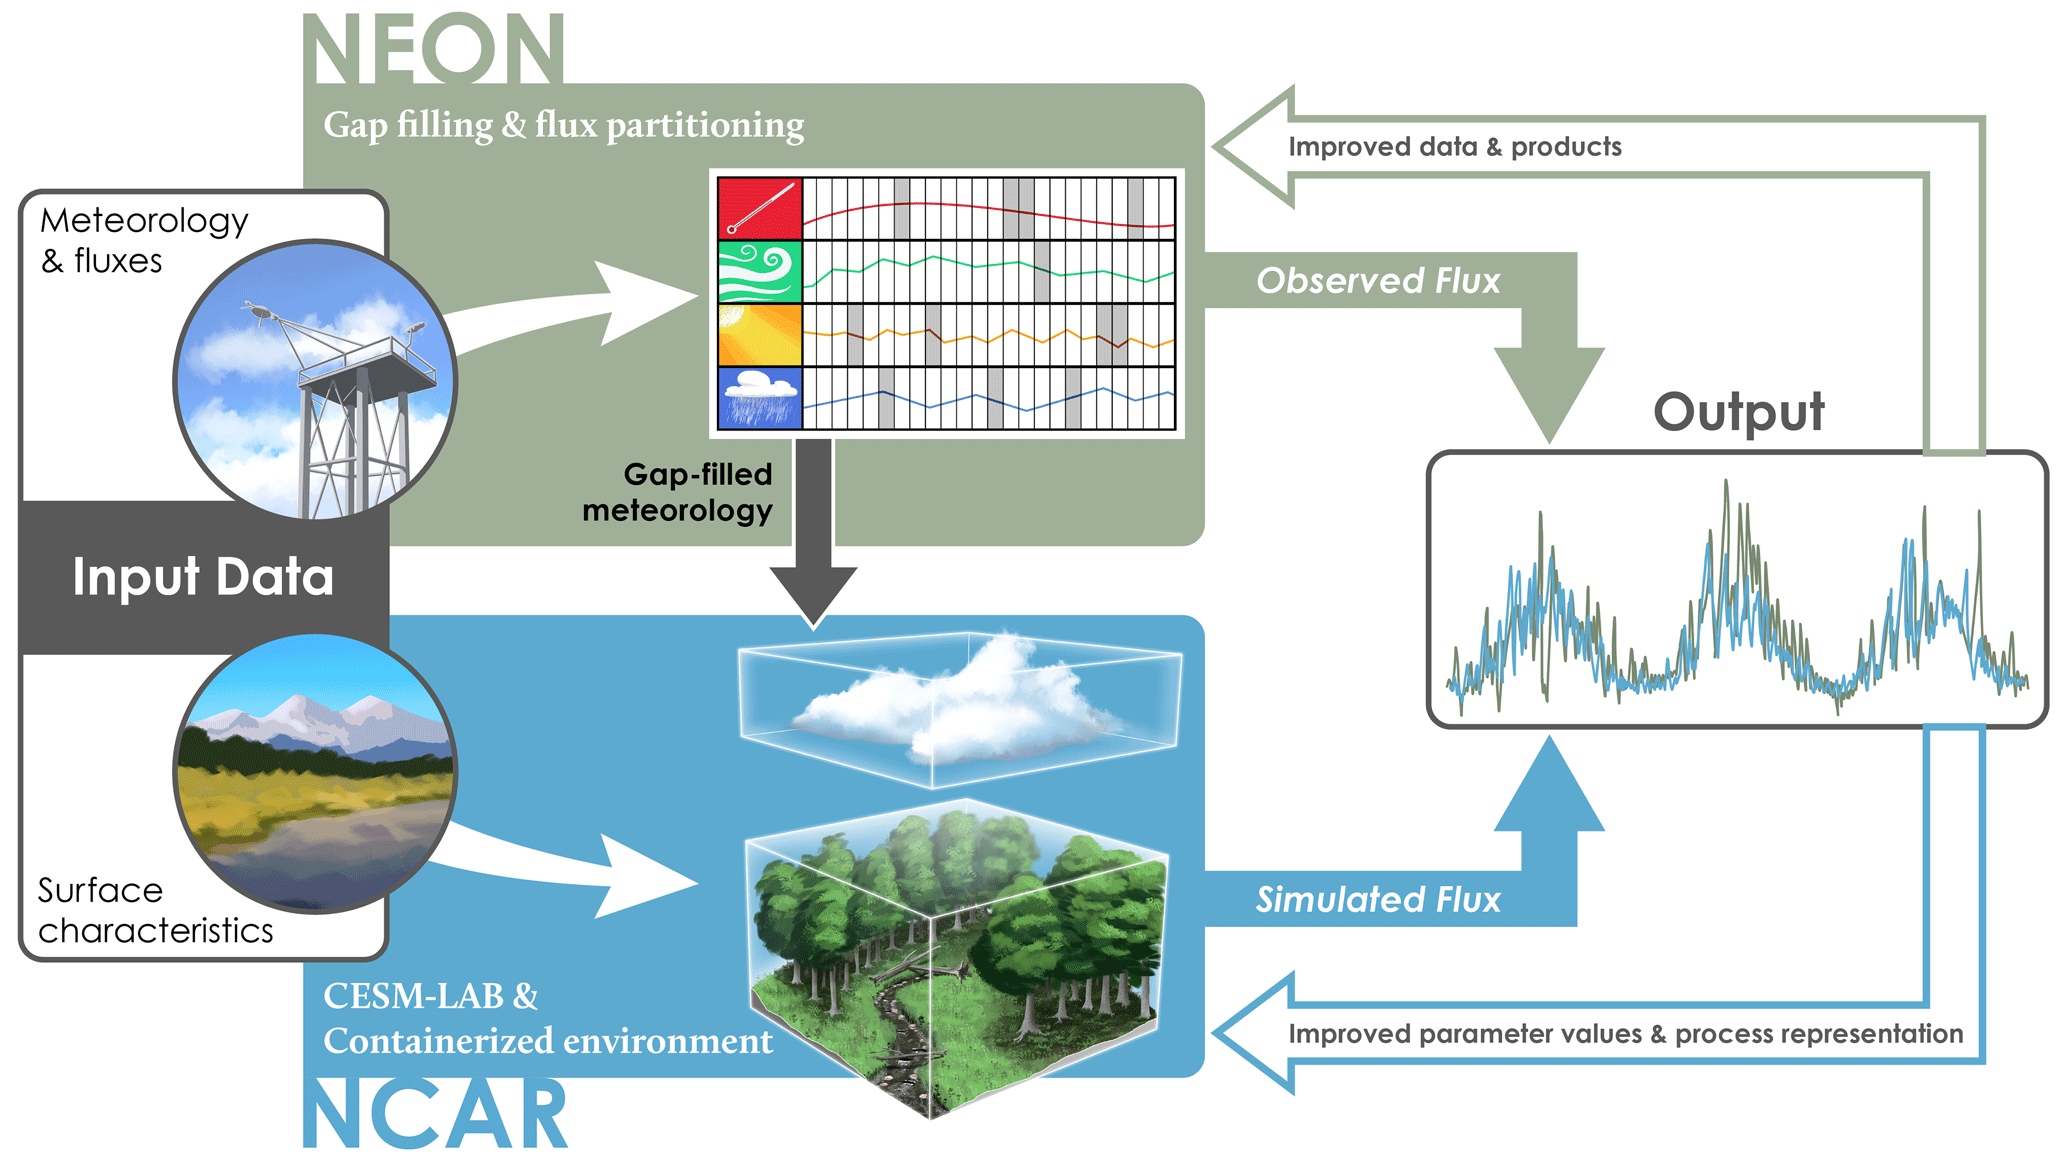
Figure 1A conceptual diagram illustrating the integration of NEON data and NCAR modeling enabled through the NCAR–NEON system. NEON meteorological measurements are gap-filled using redundant streams and used as inputs for single-point simulations with the Community Terrestrial System Model (CTSM). Additional NEON observations are used as input data to the model, including surface characteristics of vegetation (e.g., mapping to simulated plant functional types – PFTs) and the soil properties (soil texture, organic matter content, and depth to bedrock if < 2 m). Simulations with CTSM are conducted in CESM-Lab, a computing environment that runs in a container or with cloud computing resources, which includes model code and analysis tools. Simulated data are compared with observed fluxes using visualization scripts that are provided within CESM-Lab to improve observed data products, model parameterization, and model process representation.
2.1 NEON data
NEON is a research network comprising 81 monitoring sites (47 terrestrial, 34 aquatic) that are collecting standardized, open data across the major ecosystems of the United States (Table S1 in the Supplement). NEON's data products are highly complementary to land models, providing high-quality and standardized data for soil, vegetation, and atmosphere states and fluxes across vast spatiotemporal scales with high-throughput instrumented system data and spatially expansive remote sensing data (Hinckley et al., 2016; Balch et al., 2020; Durden et al., 2020). Each of the 47 NEON terrestrial sites includes an EC tower to determine the surface–atmosphere exchange of momentum, heat, water, and CO2, alongside meteorology (precipitation, wind speed, humidity, temperature), atmospheric composition (water vapor and CO2 concentrations and isotopic ratios), and soil sensor assemblies measuring depth-resolved soil temperature and moisture at several locations in the EC tower footprint (Metzger et al., 2019). In this preliminary effort to bring NEON measurements and NCAR modeling together we use NEON data for (1) meteorological inputs that are gap-filled and provide local atmospheric boundary condition inputs to CTSM, (2) vegetation and soil properties, and (3) eddy covariance fluxes to compare observed and simulated results (Fig. 1, Table 1) with prototype data available through the NEON data portal (NEON, 2023).
Table 1NEON data product name, data product use in CTSM, NEON data product ID, and digital object identifier (DOI). Data products were used for meteorological inputs and surface characterization, which are inputs needed to run CTSM, as well as for model evaluation.
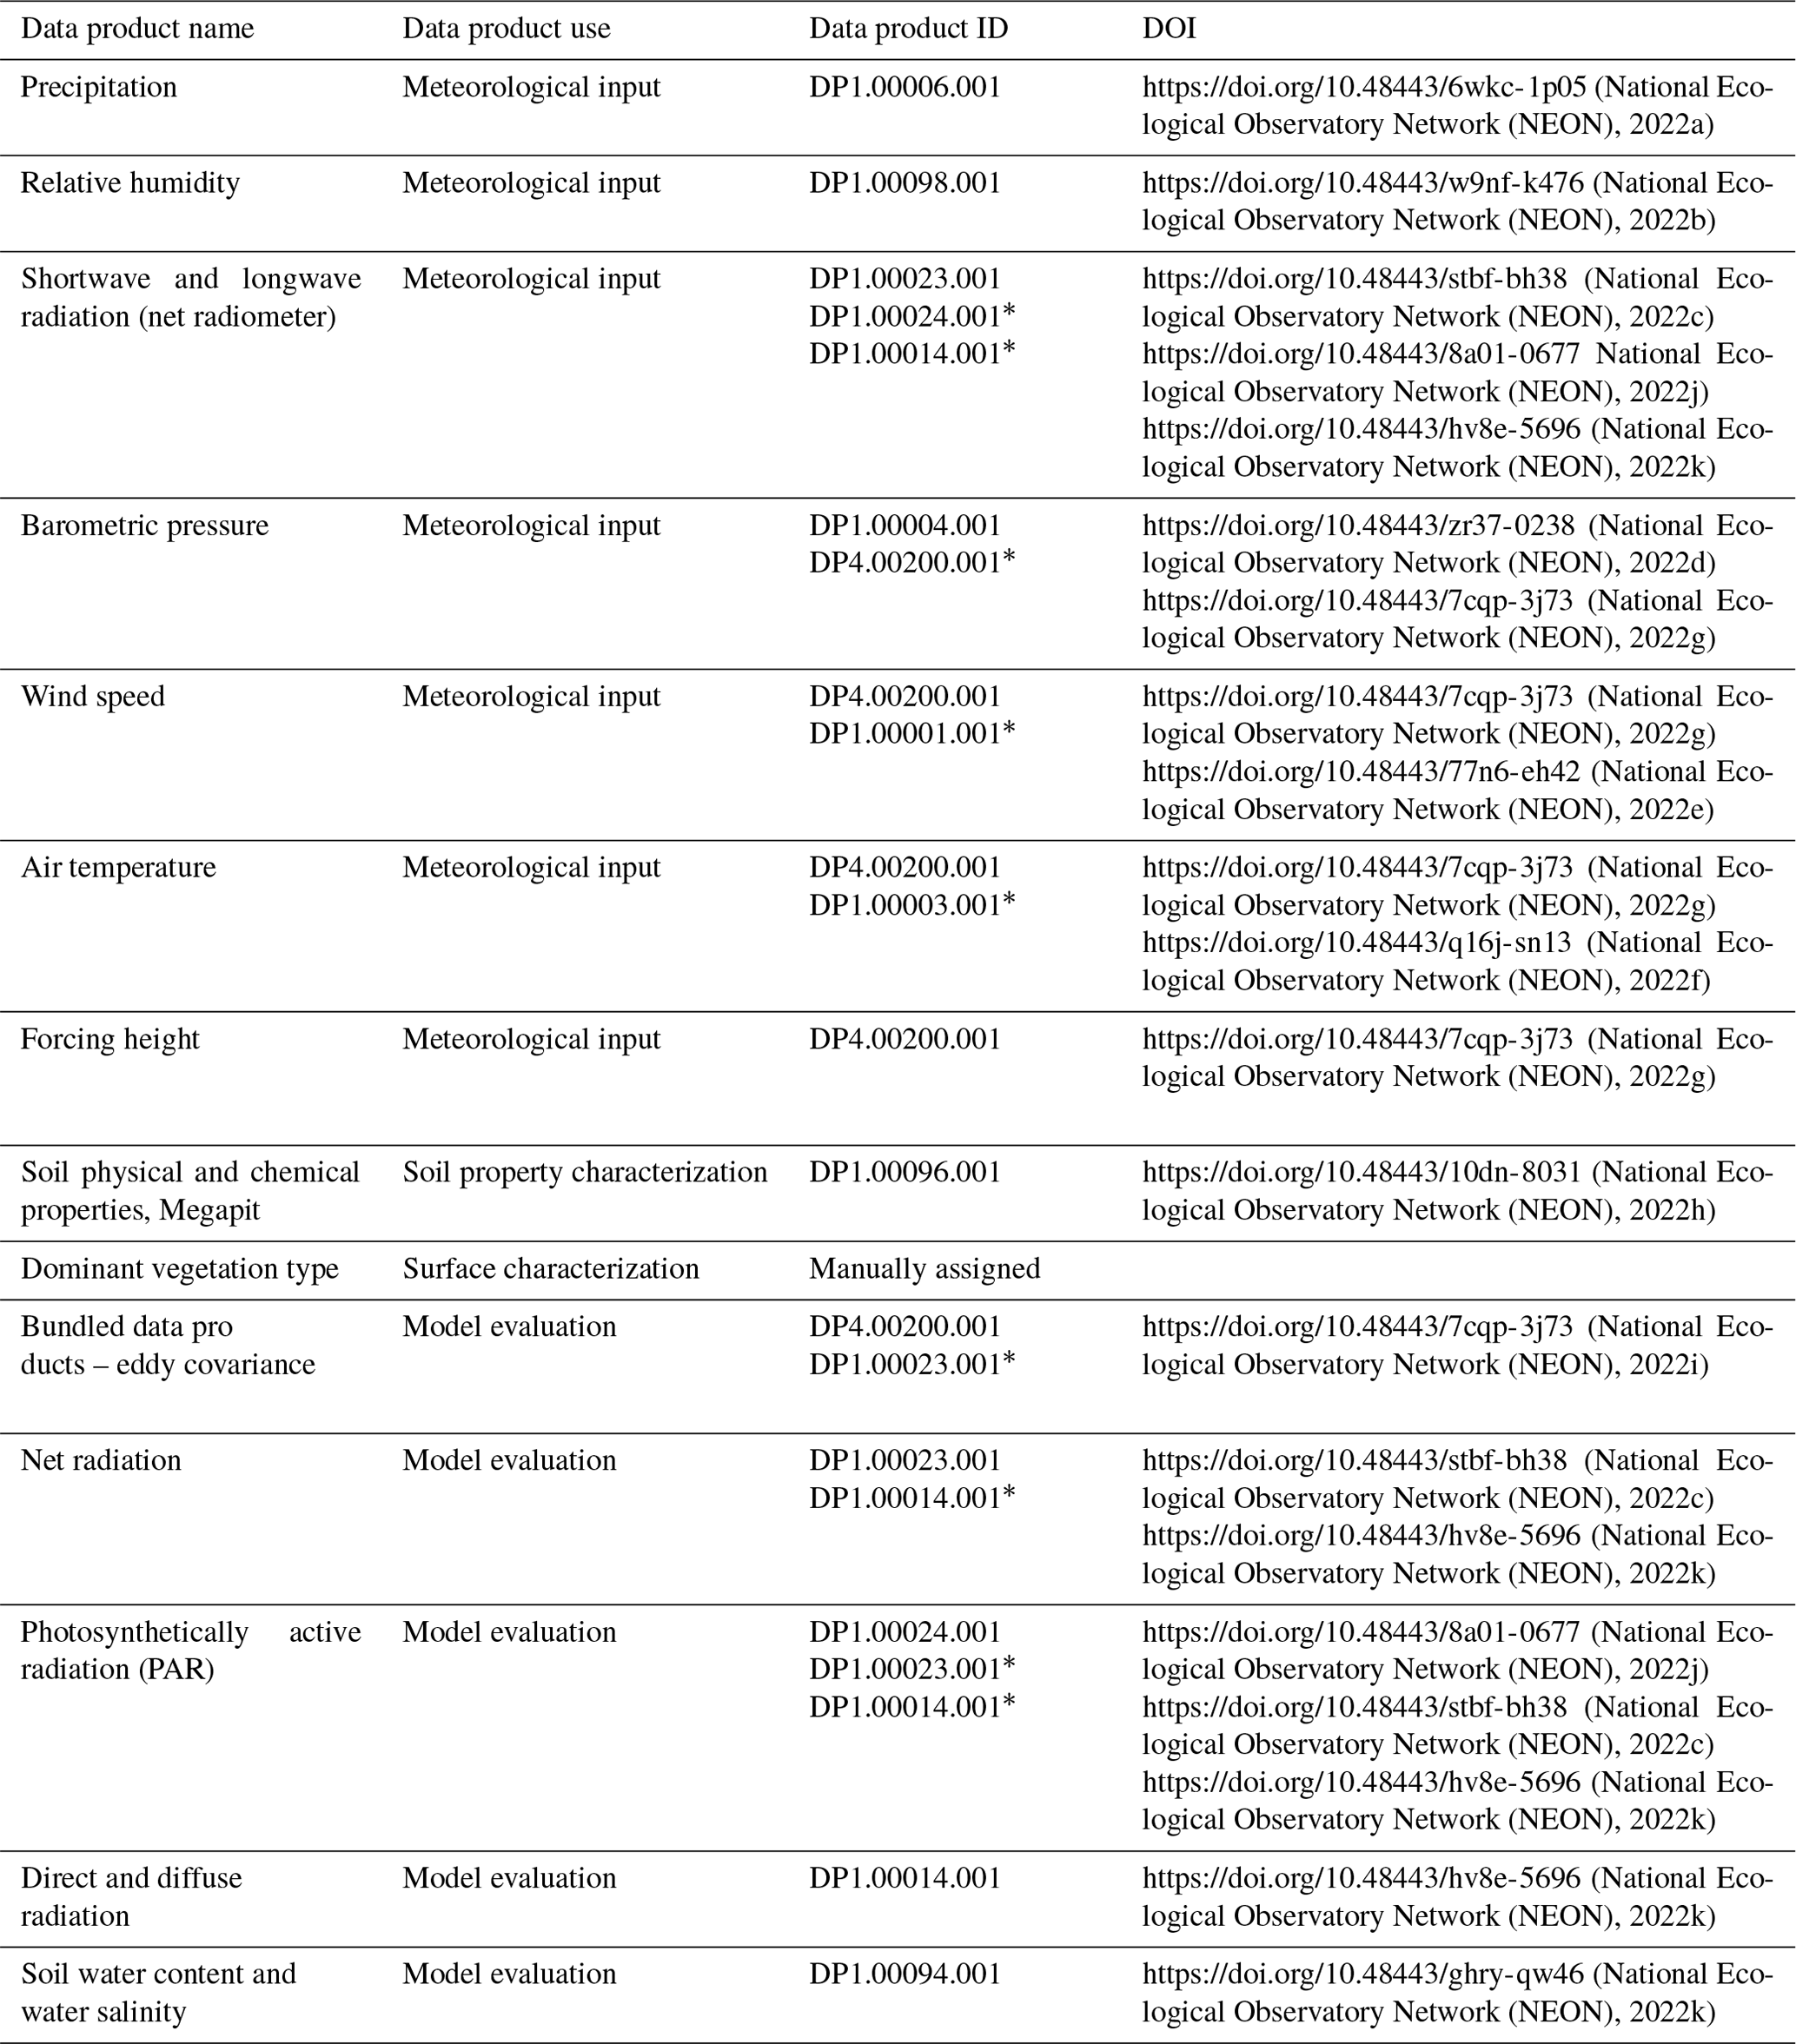
* Indicates that the data product was used in the redundant stream to gap-fill the primary data product.
2.1.1 Meteorological inputs
Generating the gap-filled meteorological data that are required for single-point simulations with land models can be time-consuming and requires expertise in micro-meteorology that land model users and developers may not have. Thus, the modeling community historically relied on external efforts like FLUXNET synthesis databases to provide gap-filled meteorological measurements at eddy flux sites (e.g., La Thuile or FLUXNET2015; Pastorello et al., 2020). Downloading and processing these datasets into a format that is usable by the model is also time-consuming, and often the flux measurements are not paired with information about local vegetation or soil properties that are easy to discover or digest. Collectively, these factors create barriers for use and latencies in updating the EC observational data that are used in single-point simulations. The NCAR–NEON system aims to remove some of these barriers.
NEON meteorological input data used to run CTSM are summarized in Table 1 and gap-filled using publicly available code (Table 2). While NEON is highly standardized, a few differences in instrumentation exist between NEON core (representative of the predominant natural ecosystem of each respective domain) and gradient sites (representing other end-member conditions in each respective domain). For example, core NEON sites measure precipitation with double-fenced intercomparison reference gauges, while gradient sites all have tipping buckets (Metzger et al., 2019). Accounting for these site-specific sensor configurations and variation in their associated data streams is the first step in providing usable meteorological inputs to CTSM. The meteorological inputs to CTSM must be continuous; therefore, additional gap filling of missing data is required. Additionally, the EC system collects data necessary to calculate fluxes of energy, water vapor, and CO2. The NEON site design builds in some redundancy in observations with profiles of incoming radiation, wind, temperature, water vapor, and CO2 concentrations measured at different heights on each NEON tower (Metzger et al., 2019). These data redundancies allow for a robust initial gap filling using linear regressions among the primary and redundant data streams to correct for instrument or location differences. For example, if wind speed or air pressure measurements from the tower top are missing, we gap-fill with the value from the redundant data stream (typically measured at a lower tower height) corrected by the linear relationship with the primary sensor data. If multiple redundant data streams are available, the best-fit regression with data available is used to determine the gap-filled value for each missing data point.
After gap filling using related data stream regression, some range thresholds and proper unit conversions are applied to prepare the meteorological data for processing through the ReddyProc R package following the gap filling workflow outlined in Wutzler et al. (2018). After using related data stream regressions, the meteorological data are checked for additional gaps, and gap filling is performed using one of three additional gap filling methodologies that include a look-up table (Falge et al., 2001), mean diurnal course, and marginal distribution sampling (Moffat et al., 2007; Reichstein et al., 2005). The gap filling method is tracked and provided as a flag with the data to allow users to assess data with various methodology restrictions. The meteorological data streams are then converted to units required by CTSM and output to cloud storage in Network Common Data Form (NetCDF) format with associated metadata to fully describe data provenance and formatting. At most sites data coverage spans 1 January 2018 through 31 December 2021, but as more NEON data are collected these files will also be updated in near-real time, thus removing barriers associated with processing flux tower data and reducing latencies in using new data as they are collected. Tables S1 and S2 in the Supplement provide a list of all the sites where input data have been successfully gap-filled and note any potential data quality issues.
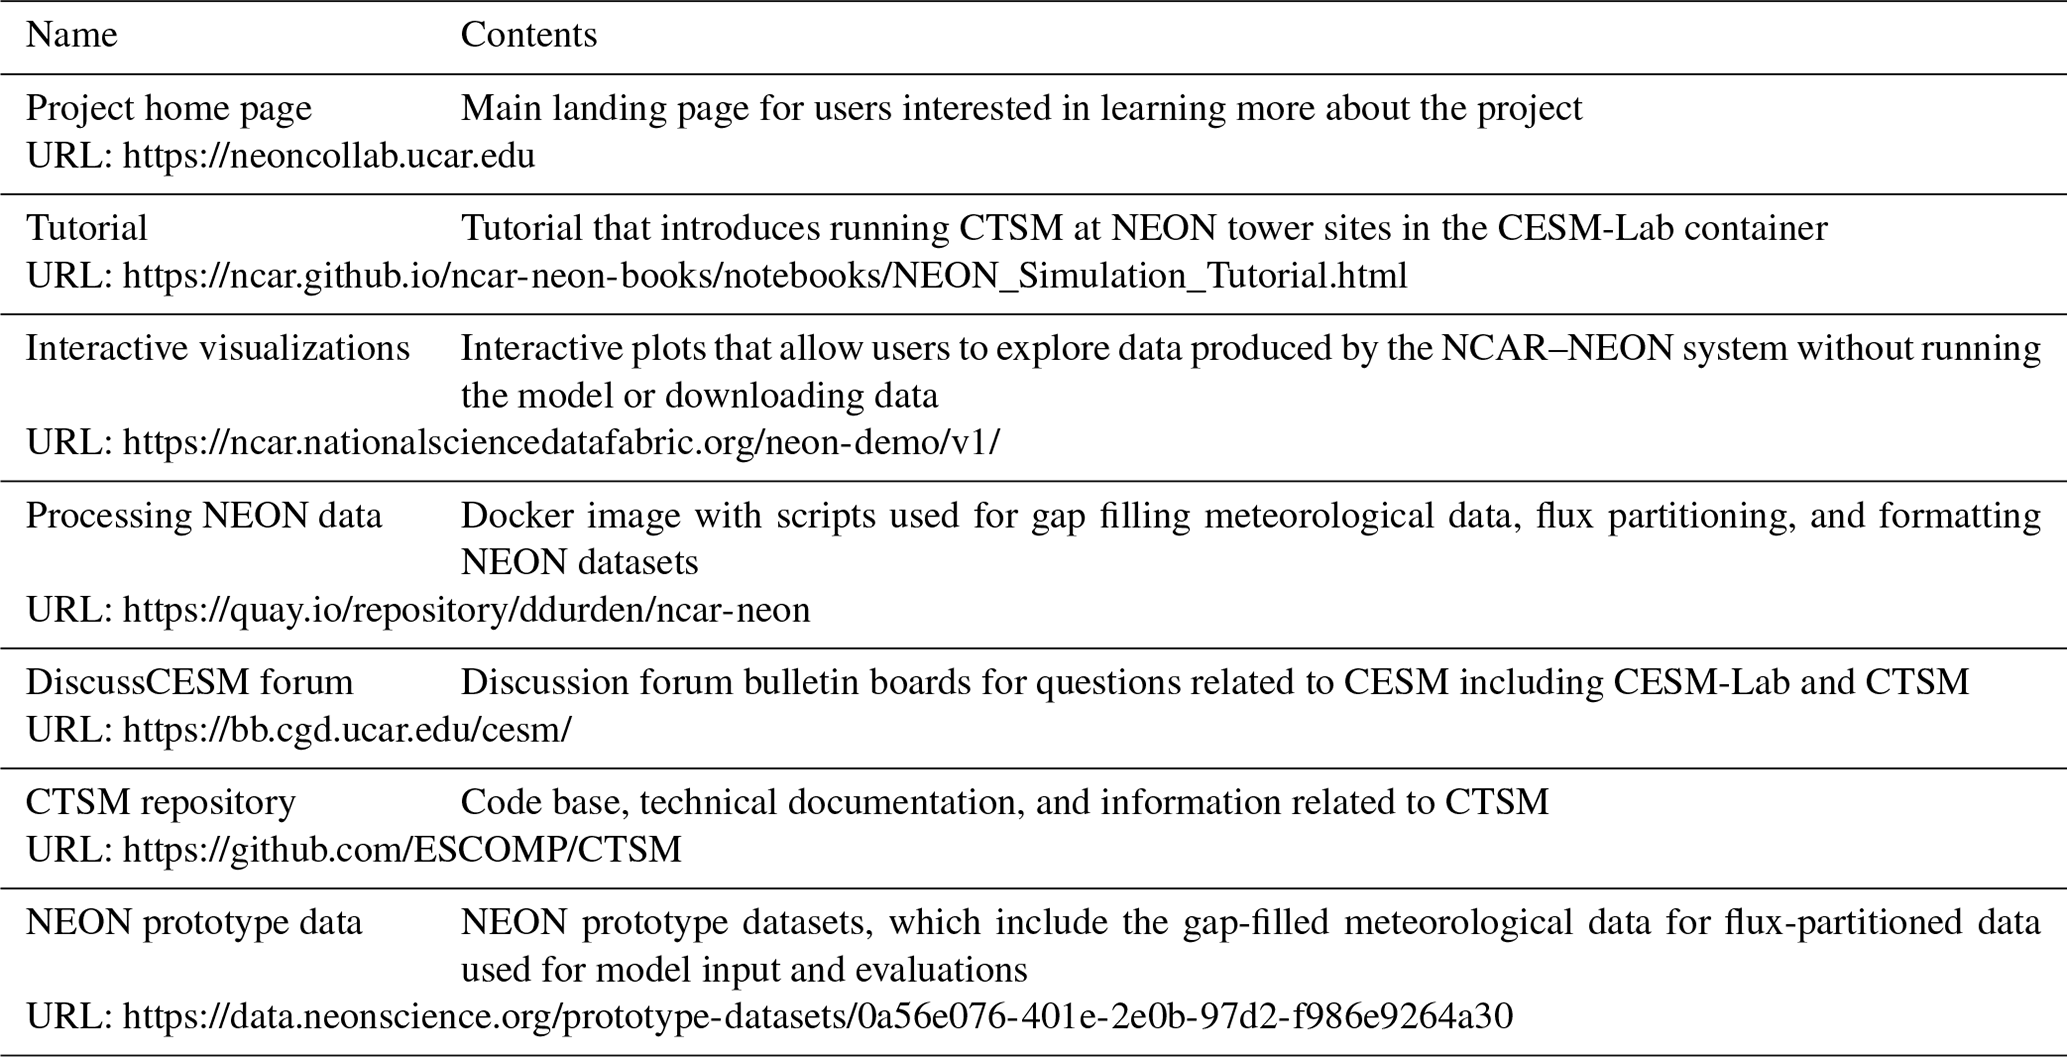
Table 2List of helpful websites created for the NCAR–NEON system, their contents, and a URL address (last access: 8 October 2023) for each.
2.1.2 Soil and vegetation properties
Basic information on edaphic properties is needed in the pedotransfer functions that describe soil thermal and hydraulic properties in CTSM. Although NEON has several soil sampling datasets, we used information from the Megapit characterization of soil physical and chemical properties in CTSM because it contains more details about deep soil horizons (> 1 m depth; Table 1) from a single soil pit at each site. Megapit samples were collected by pedogenic soil horizon down to 2 m or restrictive feature and analyzed for several properties including total soil carbon concentration, calcium carbonate concentration, bulk density, coarse fragments, soil pH, and texture. Soil organic carbon stocks used in CTSM were estimated for each soil horizon by calculating organic carbon concentrations (after subtracting carbonates from total carbon measurements) and multiplying by bulk density.
Currently, the CTSM simulations are run with a single plant functional type (PFT) at each NEON site (Table S1). We acknowledge that this belies the diversity in vegetation that is present at NEON sites, but it provides a tractable starting point for further investigation into developing more sophisticated site- to regional-scale parameterizations and representations of biotic diversity with CTSM. CTSM represents mixed species communities as separate patches occupied by single PFTs. CTSM can represent more than one PFT at each site, and users can update the provided CTSM surface dataset to include more than one PFT. Future efforts may provide datasets with multiple PFTs corresponding to their proportion at NEON sites. The dominant PFT at each NEON site was assigned at the location of each EC tower using expert assessment that was informed by NEON vegetation surveys. Information on soil properties and dominant vegetation types is output as .csv files to public-access cloud storage buckets for use by CTSM (Fig. 1; Sect. 2.3).
2.1.3 Independent model evaluation
The EC flux data (energy, water vapor, and CO2) are time-regularized, and quality assurance and control (QA/QC) are applied. The QA/QC applied includes removing data when quality flags are raised, removing CO2 data when the field calibration algorithm cannot be applied, applying range thresholds, and applying a despiking routine to remove outliers (Brock, 1986; Starkenburg et al., 2016). The data are gap-filled using the ReddyProc methodology outlined in Sect. 2.1.1. The vapor pressure deficit (VPD) is derived from the difference between actual and saturated vapor pressure, while gross primary production (GPP) is calculated from net ecosystem exchange (NEE), the sum of turbulent and storage fluxes, using the nighttime flux partitioning method of Reichstein et al. (2005). The nighttime approach is a community standard and was used at all sites in this work. Future work can explore whether other partitioning approaches may be more appropriate at some sites. The data, quality flags, and metadata are formatted and provided at 30 min intervals as NetCDF files for comparison with modeled fluxes. In future releases of the NCAR–NEON system we aim to use the ONEFlux data pipeline to enable additional methodologies for flux partitioning, which also includes storage fluxes (Pastorello et al., 2020). Finally, NEON continuous soil moisture data were compared with model simulations for two sites. Since the soil moisture sensors were reconfigured with different calibration coefficients during the 2018–2021 validation period, which introduced step changes in NEON's soil moisture data product (Table 1), the raw sensor measurements were back-calculated and consistent soil-specific calibration coefficients were subsequently applied over the entire measurement period (Ayres et al., 2021) prior to comparison with CTSM data. Only values that passed quality tests were used. In future work we aim to provide standardized soil moisture data for more sites across the observatory.
2.2 NCAR modeling
Numerical models of weather and climate have long been recognized as essential research tools to advance atmospheric science. Land surface fluxes of energy, moisture, and momentum, required to solve the equations of atmospheric physics and dynamics, are controlled by heat and water storage in soil, as well as the physiology of plants and their organization into canopies of leaves. Consequently, models of soil–plant–atmosphere processes are required to provide the necessary surface fluxes. Indeed, the first numerical weather prediction model included mathematical equations for soil temperature, soil moisture, and the stomata on leaves, and it envisioned canopies as a film of leaves covering the surface (Richardson, 1922). As science progressed from models of atmospheric general circulation to climate models and now Earth system models, the role of terrestrial ecosystems in climate processes has come to the forefront. The terrestrial components of ESMs, such as CTSM, have improved ecological processes representation and now include biogeochemical cycles, wildfires, and land use and land cover change (Bonan, 2015, 2019; Lawrence et al., 2019). This evolution in the Earth system sciences is evident in 40+ years of scientific research linking weather, climate, and land modeling at NCAR, from pioneering initial model implementations (Deardorff, 1978; Dickinson et al., 1986, 1993; Bonan, 1996) to community-based model development (Oleson et al., 2004, 2010, 2013; Levis et al., 2004; Lawrence et al., 2019) that continues to engage ecological and environmental sciences communities in CTSM development and application. As more ecology and biogeochemistry are added to the models (Fisher and Koven, 2020), the notion of climate prediction is expanding to Earth system prediction, including terrestrial ecosystems and biotic resources (Bonan and Doney, 2018). These models have also become important tools for scientific discovery by identifying the ecological processes that affect climate (e.g., photosynthetic temperature acclimation; Lombardozzi et al., 2015) and advancing theory at the macroscale (e.g., developing a theory of ecoclimatic teleconnections; Swann et al., 2018). With the new NCAR–NEON system tools described here, we aim to expand engagement and accessibility with the ecological and environmental science communities to continue testing, evaluating, and improving terrestrial process representation within CTSM. This will improve our understand of how ecosystems function within the Earth system, including the regulation of carbon, water, and energy fluxes that affect climate.
2.2.1 Containerized version of CESM-Lab
CESM has a long history of being freely and openly available to users (Hurrell et al., 2013; Danabasoglu et al., 2020), yet several barriers related to training, cyberinfrastructure, and data integration have hampered its adoption by a wide range of researchers. Even with open-source software, porting CESM to a new computer also requires the new computing system to be able to compile model source code and to have all the necessary input data and library dependencies. To address these computing challenges, NCAR recently developed CESM-Lab, which is a pre-configured and standardized environment that contains CESM and Jupyter-Lab. CESM-Lab is available via a Docker container and distributed via DockerHub (Table 2). The containerized version of CESM-Lab, and containers in general, gives researchers the capability to package and distribute source code, libraries, dependencies, and system settings as one unit – thereby ensuring reproducibility. Using the containerized system, CESM-Lab can be used on any computing system, even a laptop or a cloud platform, to allow researchers to easily run CESM and its component models. The NCAR–NEON system uses CESM-Lab capabilities to run single-point CTSM simulations at NEON sites.
2.2.2 Single-point CTSM simulations
The workflow for running single-point CTSM simulations requires several steps that can be error-prone and time-consuming, particularly when using EC tower or other site-level data to drive simulations. To facilitate using NEON data in CTSM simulations we made several modifications to simplify this workflow. When users create a new simulation, the system queries NEON public-access cloud storage buckets and downloads available data into a designated directory (Sect. 2.3). For each NEON site, this includes a surface dataset that reflects soil properties and the dominant vegetation (Table 1), meteorological data that provide boundary conditions for the land model, and an initial condition file with equilibrated, or steady-state, carbon, water, energy, and nitrogen states to initialize ecosystem pools simulated by CTSM. Initial conditions at each NEON site were generated by cycling over the meteorological data at each site for 200 years in accelerated decomposition (AD) mode and another 100 years in normal, or post-AD mode, or until biogeochemical states reached steady state (when ecosystem C pools change by < 1 g C m−2 yr−1; this is standard protocol for equilibrating the model state; Lawrence et al., 2019). Colder sites, especially those in Alaska, took longer to reach these steady-state conditions.
The NCAR–NEON system uses a top-level Python code called “run_neon” that simplifies downloading the pre-configured datasets and automatically creates, builds, and runs cases for individual and multiple NEON sites. The Python script, which also resides in the CTSM repository (Table 2), includes several command-line arguments and options for automatically running spin-up and transient simulations. Collectively, these features dramatically improve CTSM site simulation accessibility, facilitate the use of new NEON data, reduce potential errors in configuring the CTSM case at NEON tower sites, and enable users to run simulations at multiple NEON sites. While users of the system can now easily generate their own data, NCAR provides model simulation data at each of the tower sites that are available on the NEON public-access cloud storage bucket (Sect. 2.3). Simulation data are generated at a 30 min time step and are aggregated into daily NetCDF files.
2.2.3 Tutorials, analysis, and visualization
Three interactive tutorials are available to guide users through the new NCAR–NEON system (Table 2). The first tutorial helps system users to access CESM-Lab using Docker, which will ultimately allow users to run CTSM simulations at NEON sites on their local computing system. The first step requires that users download Docker from the company website. This step is potentially challenging, as Docker is an externally controlled application and some recent Docker updates do not work with older computing systems. We provide links to additional resources to help the user navigate these potential problems and offer a resource for asking questions about containers through the CESM discussion forum (Table 2). After downloading and installing Docker, users are guided through downloading, running, and connecting to the CESM-Lab container and accessing the NEON tower simulation and visualization tutorials.
The second tutorial is a Jupyter Notebook that guides users through running CTSM simulations for NEON flux tower sites. The beginning of this tutorial provides a short description of CTSM and its component models, as well as resources for finding additional information. The process of running a simulation at NEON tower sites has been streamlined into the “run_neon” script (see Sect. 2.2.2) that can be called with a single line of code after the user defines a NEON tower site. The simulation itself downloads approximately 2.5 GB of input data and takes several minutes or more to complete, depending on the speed of the internet connection and computing system being used. After the simulation is complete, the user is pointed to where the model data are stored and has the option to generate plots of soil temperature and moisture profiles for 1 year of the simulation.
The third tutorial guides users through analyzing and evaluating model simulations against observed NEON flux tower measurements. This tutorial requires a successfully completed NEON tower simulation from the previous simulation tutorial. The user selects the site and the year of interest and is guided through loading and opening the model data files, as well as downloading EC data for evaluation from the NEON server and loading and opening the files. Next, the tutorial guides users through formatting, processing, and plotting simulation and flux tower data. Users generate plots of mean annual and diel cycles of latent heat flux. Additional plots illustrate how CTSM partitions latent heat flux into ground evaporation, canopy evaporation, and transpiration, as component fluxes are not available from the observed data. Scatter plots are also created using simulated fluxes to illustrate the relationship between component evaporation as well as transpiration fluxes and total latent heat flux on seasonal and annual timescales. The tutorial explains the Python tools used to process and plot the data and asks probing questions about the results that tutorial users are exploring to help guide the user in thinking about patterns in the data and considering how to compare model and flux tower data. Users are encouraged to use the code available in this tutorial to explore other sites, years, and variables.
2.3 Cyberinfrastructure to facilitate data exchange and interactive visualizations
Cyberinfrastructure for scientific data provides data handling and management functionality including data storage, processing, transfer, security, and access. Cyberinfrastructure components developed for the NCAR–NEON system include access-managed cloud storage for project data, standards-based metadata generation enabling dataset search and discovery, and data exploration tools for the user community. Datasets for the NCAR–NEON system are hosted in cloud object storage, providing secure web-enabled access to the data files (Fig. 2). Data files are grouped in the cloud storage system into logical storage containers called buckets. Buckets that are granted public access allow anyone on the internet to download the data stored in them. Buckets protected with authentication mechanisms require users to have either individual account permissions on the bucket or an access key for the bucket and are meant for internal dataset sharing or staging data prior to public release.
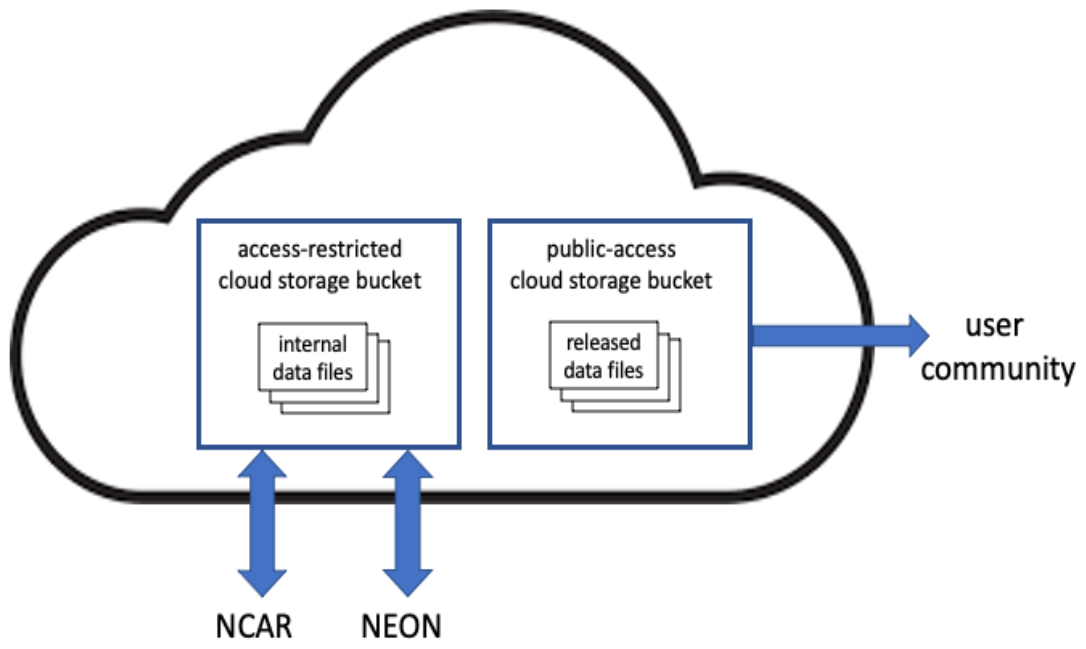
Figure 2A schematic representation of cloud-based data management for the NCAR–NEON system. Internal data may include preliminary results, data shared for review within the project, or data staged for release. Released data files are available for public access to the user community as well as anyone on the internet and include NEON meteorological inputs, NEON surface characterization data, CTSM surface datasets and initial condition files, NEON measurements used for model evaluation, and data from CTSM simulations that are used for interactive visualizations. Access-restricted cloud buckets require authentication to access files stored in them. Public-access cloud storage buckets provide open access to the files stored in them.
Data exchange between NCAR and NEON within this system enables automated generation of datasets as well as collation of NCAR model outputs and NEON data. The initial data collation for NEON data products uses a container that sources all atmospheric forcing and model evaluation data from the NEON API, performs gap filling, and formats the data for model ingestion with standardized metadata (Sect. 2.1). Simulation datasets from NCAR (Sect. 2.2) are automatically synced to NEON object storage in the cloud at scheduled intervals (Fig. 2). To facilitate automated transfer of datasets between NCAR and NEON, a staging bucket is configured that allows file uploads from authenticated users. An automated process moves files from the staging bucket to the publicly available target bucket at scheduled intervals. Metadata describing scientific datasets using standard vocabularies and formatting can be used by internet search engines to facilitate dataset discovery. JavaScript Object Notation for Linked Data (JSON-LD; https://www.w3.org/TR/json-ld, last access: 8 October 2023) is a human- and machine-readable open metadata standard. Schema.org defines a vocabulary of standard HTML tags compatible with JSON-LD markup (Shepherd et al., 2022). A metadata generation component for NCAR–NEON datasets is implemented in Python and uses the Binary Array Linked Data library (binary-array-ld, https://github.com/binary-array-ld/bald, last access: 8 October 2023) to generate JSON-LD metadata for NCAR–NEON NetCDF files with the Schema.org vocabulary.
Beyond these automated data exchanges, we also developed a Python-based interactive visualization dashboard (Table 2) as a graphical user interface (GUI) that enables users to explore and interact with model outputs and observations on the fly. This tool allows users to generate graphs and statistical summaries comparing CTSM simulations and observational data for NEON sites without downloading the observational data or running the model. This dashboard was developed using a scientific Python stack, including Xarray, Bokeh, and Holoviews, which allows a developer to create a user interface with widgets and visualization components inside a Jupyter Notebook. Users access a GUI to select individual NEON sites, variables, and output frequencies to visualize. The tool offers different types of interactive visualizations and statistical summaries based on user selections. This interactive visualization dashboard does not require specialist knowledge to operate; therefore, it can be used for educational outreach activities and in classrooms. Moreover, users can interact with the dashboard using a browser, so it is possible to interact with the plots via a tablet or smartphone.
Data input–output and manipulation, particularly at the 30 min frequency available in the NCAR–NEON system, are typically computationally resource-intensive aspects of data access. Input–output and calculations can both benefit from parallel computing, which can process multiple subsets of a dataset simultaneously and thereby enable efficient dataset access and operations. The back end for the visualization dashboard uses dataset chunking for efficient access to NetCDF file content. The Zarr format and library enable generation of metadata providing chunked access to NetCDF files (Miles et al., 2022). Zarr metadata for daily files are combined into monthly files, reducing the number of files accessed for time intervals spanning multiple days and thereby improving access efficiency. The Python Xarray library, which is used to read the datasets, integrates with the Python Dask library for parallel computing and thus enables loading and processing NetCDF data chunks in parallel as Dask arrays. The Dask components that Xarray uses use a local thread pool by default, and local threads incur minimal task overhead associated with the parallel processing. Operations on the Dask arrays use the Python NumPy library for array operations, and the NumPy implementation takes advantage of thread pool parallelism, enabling efficiency improvements in dataset operations even on small (∼ 100–200 KB) files.
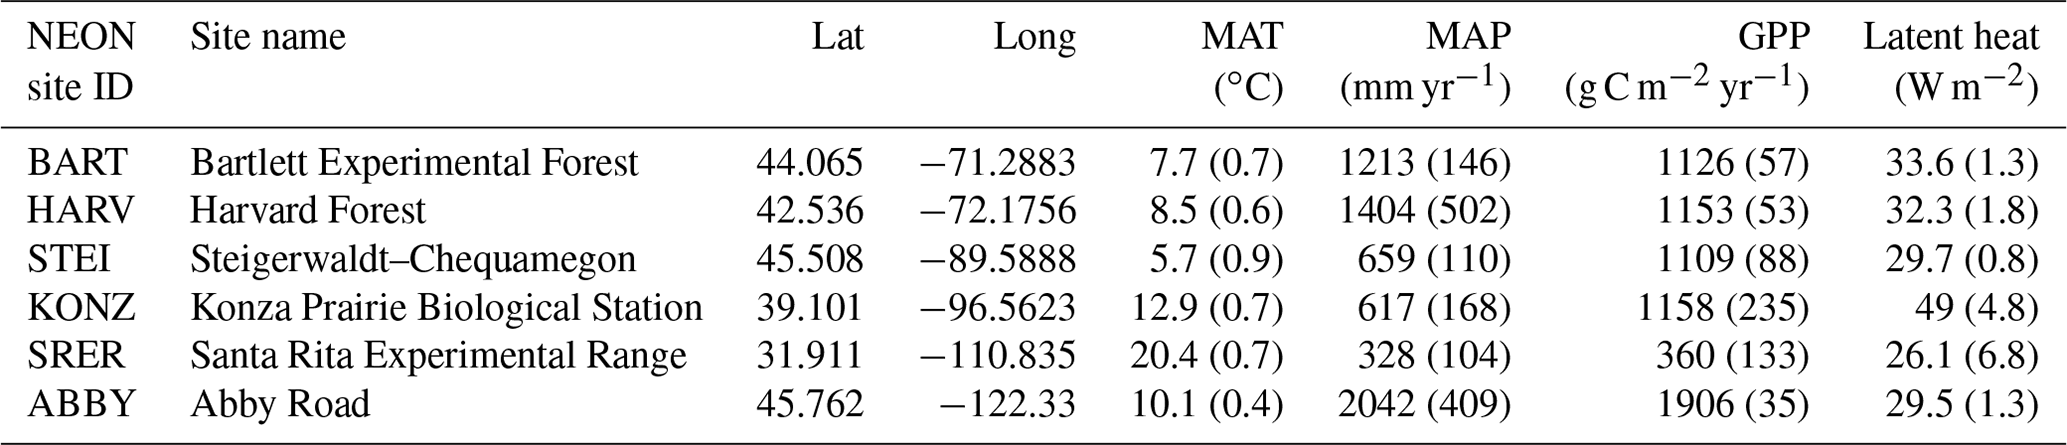
We illustrate features of the NCAR–NEON system with comparisons of observed and simulated fluxes across diverse ecosystems that the observatory spans. A subset of the sites highlighted in our analysis is described in Table 3. The comparisons are intended to summarize the status of the project, illustrate the data produced through this project, and highlight potential insights the data affords. We recognize that there are rich opportunities to expand on these analyses, integrate additional measurements, and improve modeled parameterization and representations of specific sites and processes. Indeed, such contributions are encouraged from the community.
Table 3Summary of site name, location, mean annual temperature (MAT), mean annual precipitation (MAP), gross primary production (GPP), and latent heat flux at a subset of NEON sites. Values show annual means and standard deviations in parentheses. Due to gaps in the NEON observational estimates, mean annual GPP and latent heat fluxes are for the full time series simulated by CTSM at each site. All results are for 2018–2021 unless noted otherwise. The full list of results is shown in Tables S1 and S2.
Annual climatologies of site-level data provide comparisons of measured and simulated fluxes. Site-level simulations with CTSM received inputs of incoming shortwave and longwave radiation measured at NEON EC towers (Table 1), but the model calculates reflected shortwave radiation and outgoing longwave radiation based on albedo and surface temperature. Accordingly, net radiation is a useful metric by which to compare observed and simulated fluxes. Since net radiation is a driver of numerous ecosystem fluxes, identifying biases can help to explain biases in other fluxes. We look at a climatology of daily mean net radiation that is simulated over the NEON record. Results shown here for Bartlett Experimental Forest (BART; Fig. 3a) suggest that the model adequately captures the seasonal cycle of net radiation at this temperate deciduous forest site. (Figure S1 in the Supplement shows a similar climatology for a boreal forest site at Delta Junction (DEJU) in central Alaska.)
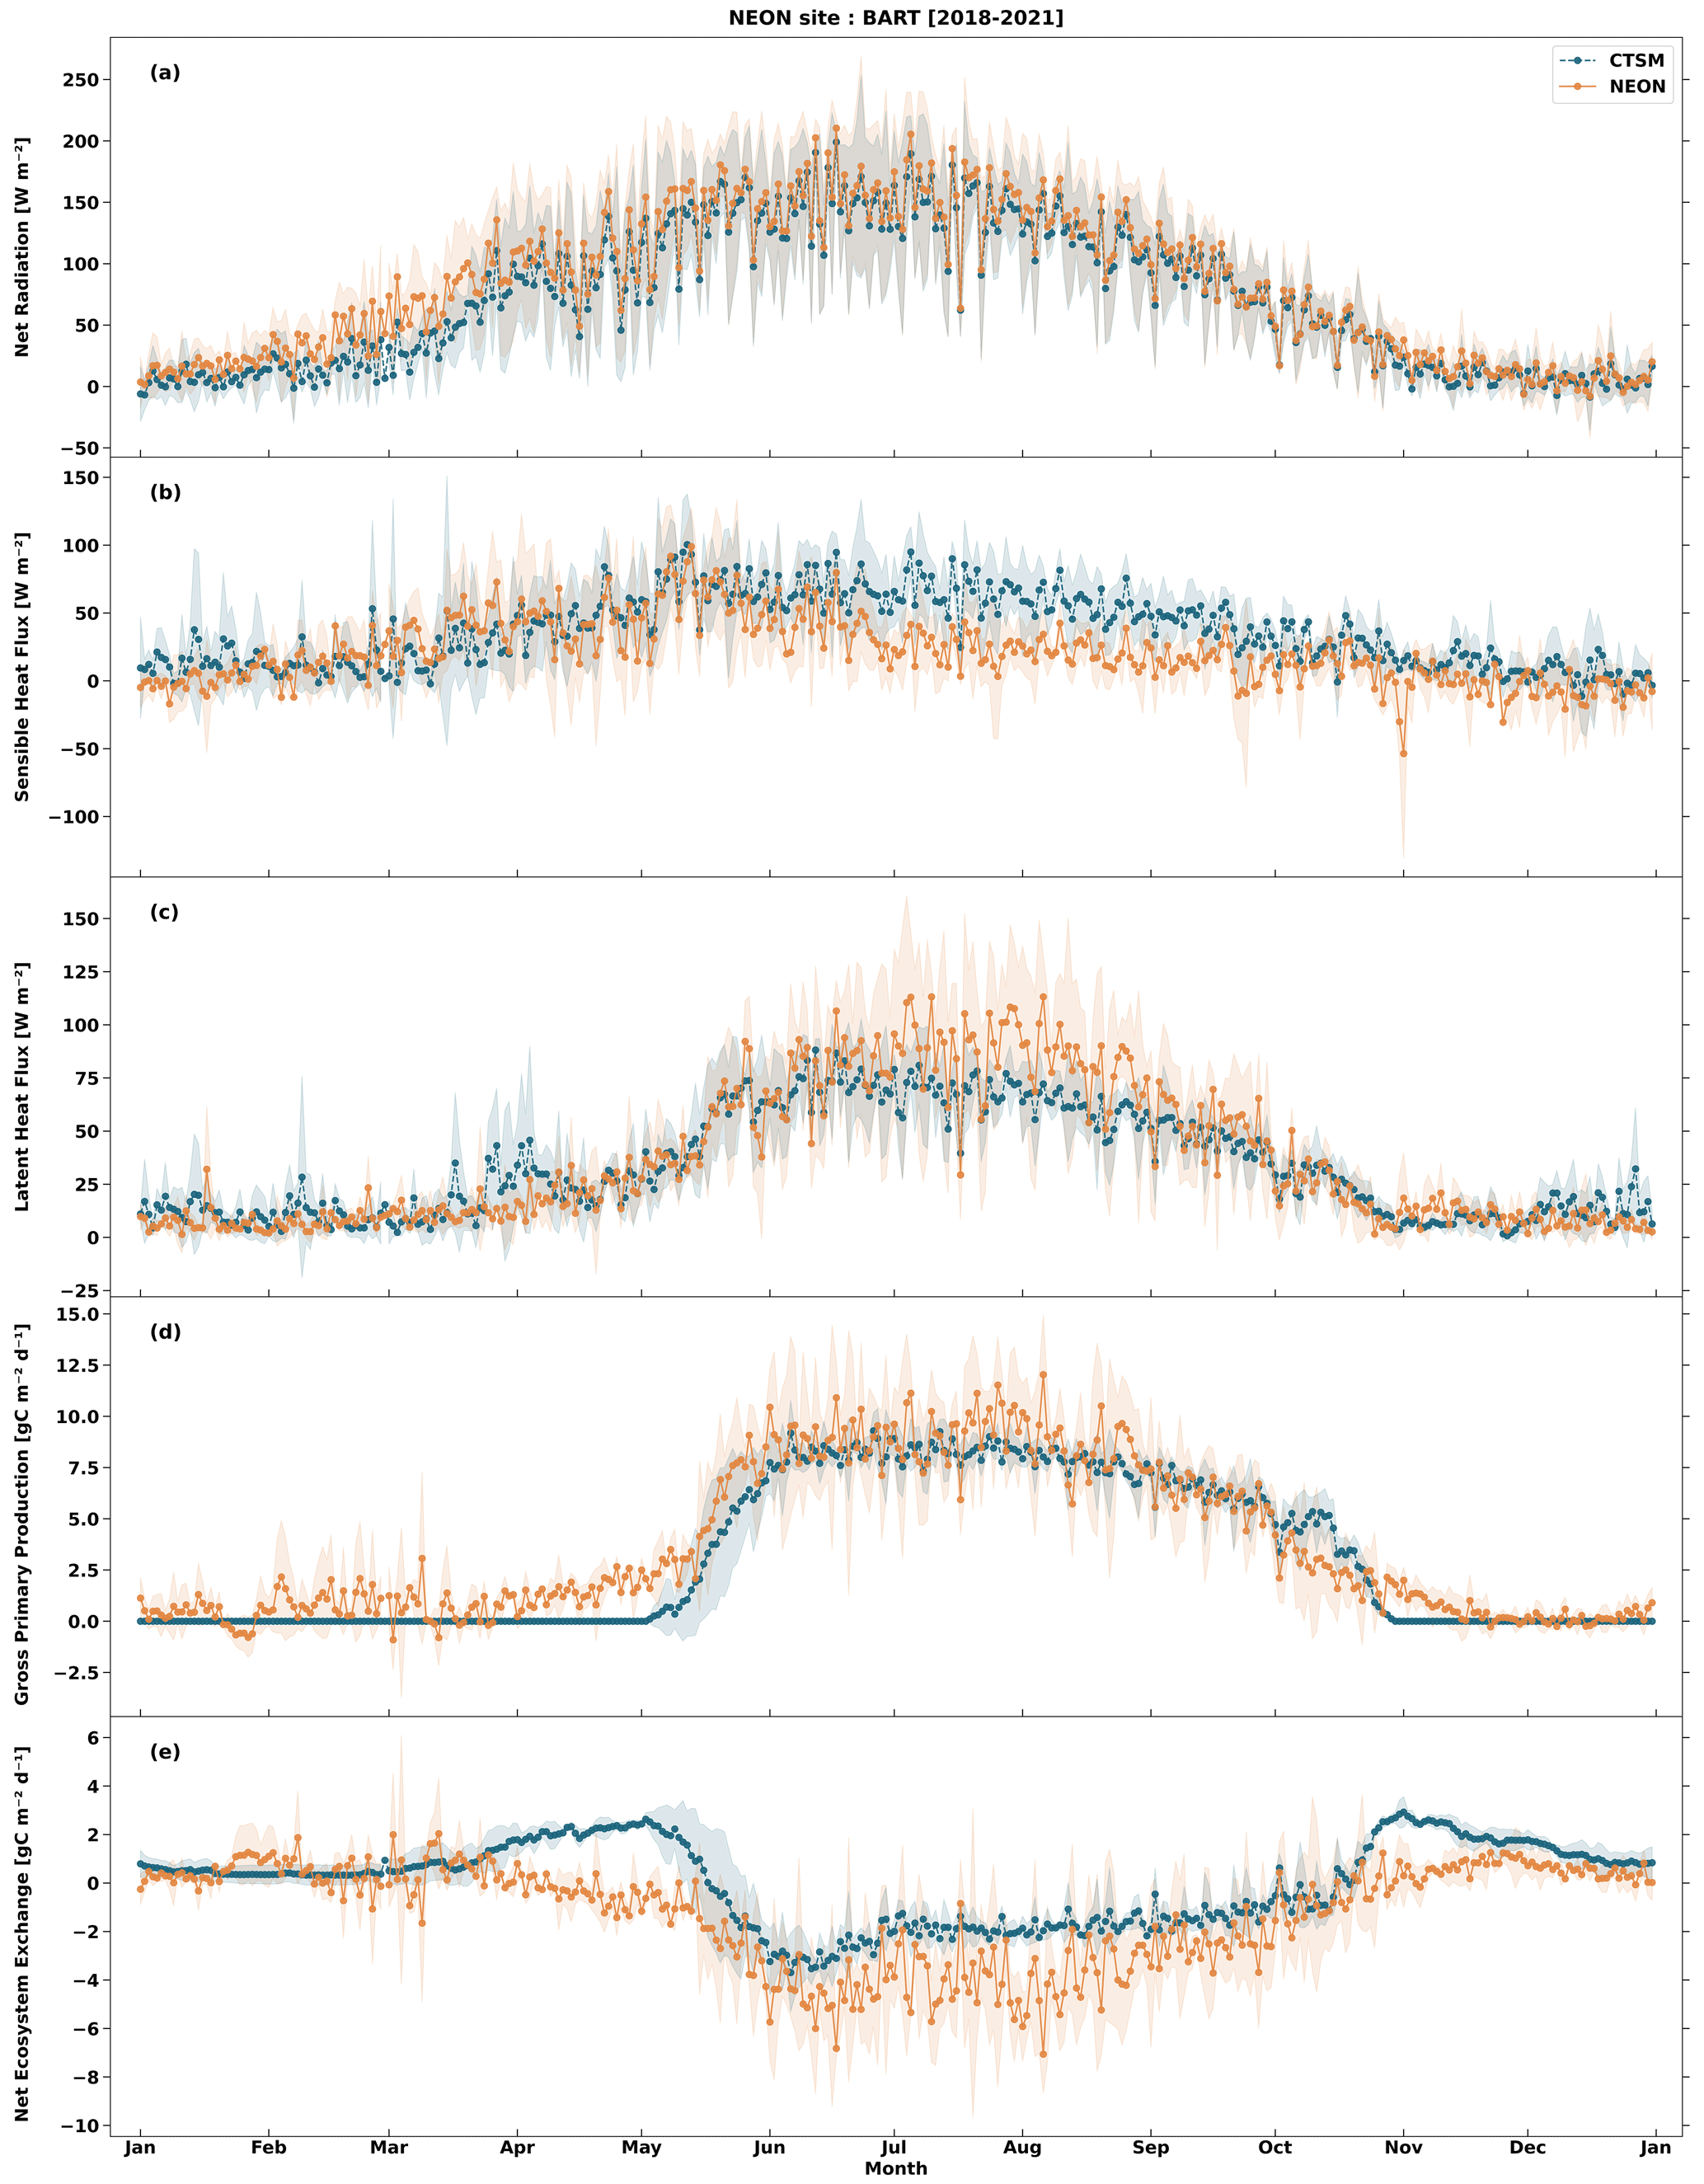
Figure 3Climatology of daily mean NEON measurements (orange) and CTSM simulations (blue) at the Bartlett Experimental Forest in New Hampshire (BART). Points show the daily mean (a) net radiation, (b) sensible heat flux, (c) latent heat flux, (d) gross primary production (GPP), and (e) net ecosystem exchange (NEE). Shading shows the standard deviation of daily average data for 2018–2021.
Users can also compare latent and sensible heat fluxes that are simulated by the model and observed at EC towers. At BART we see that CTSM tends to overestimate sensible heat fluxes, while underestimating latent heat fluxes, especially during the summer months (Fig. 3b–c). Such biases in the evaporative fraction (the ratio of latent heat flux to the sum of latent and sensible heat fluxes) of turbulent fluxes are common in land models, including CTSM (Best et al., 2015; Wieder et al., 2017) and the NCAR–NEON system. The inconsistencies at BART could reflect model biases in stomatal conductance or leaf area index (LAI) and deserve further investigation. Future work can leverage data from PhenoCam (Richardson et al., 2018) and stable isotope measurements at NEON towers (Finkenbiner et al., 2022; Moon et al., 2022) to better understand LAI and stomatal conductance, respectively.
Comparing measured and simulated carbon fluxes provides insights into model parameterizations and can be used to estimate missing observational data. Carbon fluxes from CTSM simulations can be compared to data from NEON EC towers: net ecosystem exchange (NEE) data are measured at the NEON EC towers, while GPP is a modeled product that is derived from statistical relationships, here using the nighttime flux partitioning method of Reichstein et al. (2005). By contrast, models like CTSM first simulate GPP based on leaf-level photosynthetic rates that are scaled to the canopy with simulated LAI. Subsequently, NEE is calculated after subtracting ecosystem respiration fluxes from GPP. Results at BART suggest that CTSM generally captures the timing and magnitude of GPP fluxes at the site (Fig. 3d), although attention to phenology, especially environmental controls and interannual variability of leaf-out and senescence, is likely warranted (Birch et al., 2021; Li et al., 2022). The climatology of NEE fluxes simulated by CTSM shows biases during the spring and autumn when the model simulated a land source of CO2 to the atmosphere (Fig. 3e) due to high ecosystem respiration fluxes. Moreover, the land sink of CO2 in the summer appears to be weaker in CTSM simulations than the NEON observations at the BART tower (Fig. 3e). Since the magnitude of GPP is similar in the model and observations, the underestimated summer NEE is possibly due to high biases in simulated ecosystem respiration fluxes. Diagnosing the source of this model biases is challenging, in part due to the interconnectivity of simulated processes and the limited capacity to measure such processes. Deeper insights may be afforded by taking a closer look at results with higher temporal frequencies.
NEON tower data are simulated in near-real time within the NCAR–NEON system, with data available to simulate most towers starting in 2018 through the most recent full year, here 2021. Figure 4 shows daily mean carbon fluxes (NEE) that are measured and simulated for the Konza Prairie Biological Station (KONZ), where the NEON tower is in an unplowed tallgrass prairie in Kansas, and the Steigerwaldt Land Services (STEI) site, where the NEON tower is located in an early successional aspen stand in Wisconsin. Positive NEE fluxes show net carbon release from land to the atmosphere, while negative fluxes indicate carbon gain into ecosystems. Looking at the full data record shows several notable features of NEON measurements and CTSM simulations. Data gaps in NEON measurements are most common during the early operation of the observatory (August–October of 2018 at STEI) and in the early months of the COVID-19 pandemic, when field crews could not travel to field sites to maintain equipment (April–June of 2020 at STEI). Across the observatory the NEON EC measurements have greater than 70 % data coverage, up from less than 40 % data coverage at the start of observatory operations. The current NEON EC data coverage aligns with that of the FLUXNET2015 dataset (van der Horst, 2019). Second, although EC directly measures NEE, mean daily NEON observations show high variability at both sites. Finally, NEON EC towers measure both storage and turbulent fluxes, but results shown here omit the storage component. Storage fluxes contribute to uncertainty in measured NEE fluxes, which may (or not) be large for individual sites at different times of year.
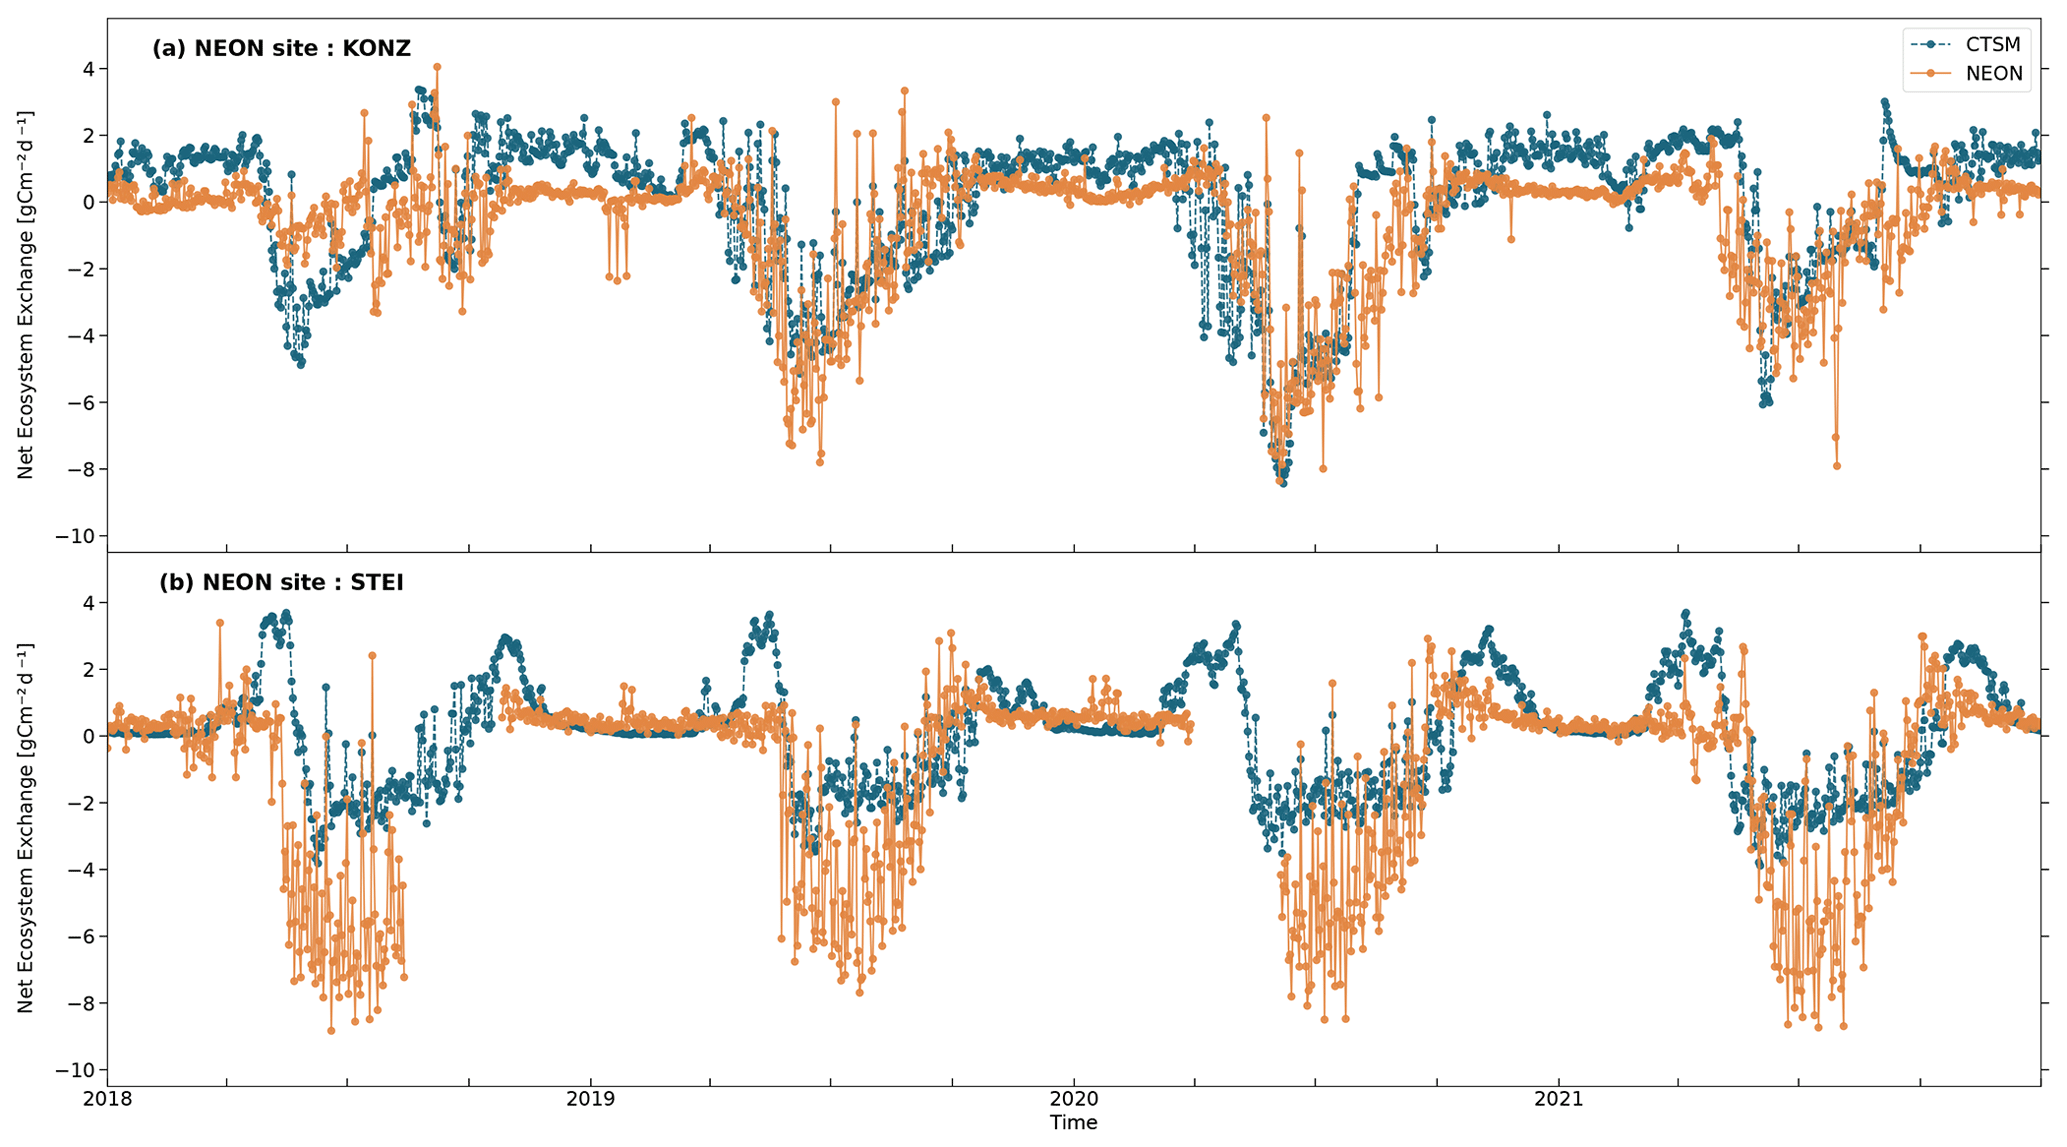
Figure 4Full time series of daily mean net ecosystem exchange (NEE) from NEON measurements (orange) and CTSM simulations (blue) at the (a) Konza Prairie Biological Station in Kansas (KONZ) and (b) Steigerwaldt Land Services site in Wisconsin (STEI). Positive NEE fluxes show net carbon release from land to the atmosphere, while negative fluxes indicate carbon gain into ecosystems.
The NEE fluxes that are simulated by CTSM are calculated as the differences in GPP and ecosystem respiration fluxes, which includes both autotrophic and heterotrophic respiration. These component fluxes are much larger, depend on simulated ecosystem states (LAI, vegetation biomass, and soil organic carbon stocks), and have associated environmental sensitivities (e.g., temperature, precipitation). Thus, biases in these component fluxes can potentially transmit biases to simulated NEE fluxes (Figs. 3–4). For example, CTSM simulations show periods of positive NEE during the spring and fall that are not evident in NEON observations. The seasonal biases in NEE could result from an underestimation of GPP during the shoulder season caused by phenological mismatches in simulated and observed LAI or result from only simulating a single plant functional type in CTSM. Alternatively, NEE biases could result from higher-than-observed soil respiration rates in the model that reflect potential biases in total soil C stocks or the temperature sensitivity of heterotrophic respiration. Finally, the CTSM simulations were equilibrated to steady-state conditions, meaning that annual NEE averaged over the simulation period will be zero. The real ecosystems being measured at NEON sites, however, have historical legacies – KONZ is burned periodically and STEI is an aggrading forest site – and do not necessarily meet these same steady-state assumptions. Collectively, this points to rich opportunities to learn about the ecosystems being measured by NEON observations and the processes that are important to represent in models like CTSM.
We calculated summary statistics of CTSM-simulated bias (Fig. 5) and root mean square error (RMSE; Fig. S2) in ecosystem fluxes compared to NEON observations. Biases in GPP and NEE are relatively low in the Great Plains and Intermountain West but are larger in the eastern US. Specifically, NEE is biased high east of the Mississippi, while GPP biases are largest in the southeastern US. CTSM typically has high biases in sensible heat fluxes and concurrent low biases in latent heat flux. Some sites, particularly grasslands (e.g., CPER, OAES, and SJER), do not follow this general pattern. We therefore probed precipitation data from NEON, which appear to have significant biases at some grassland sites (discussed in Sect. 4.1) and contribute to artificially high biases in CTSM simulations at these sites.
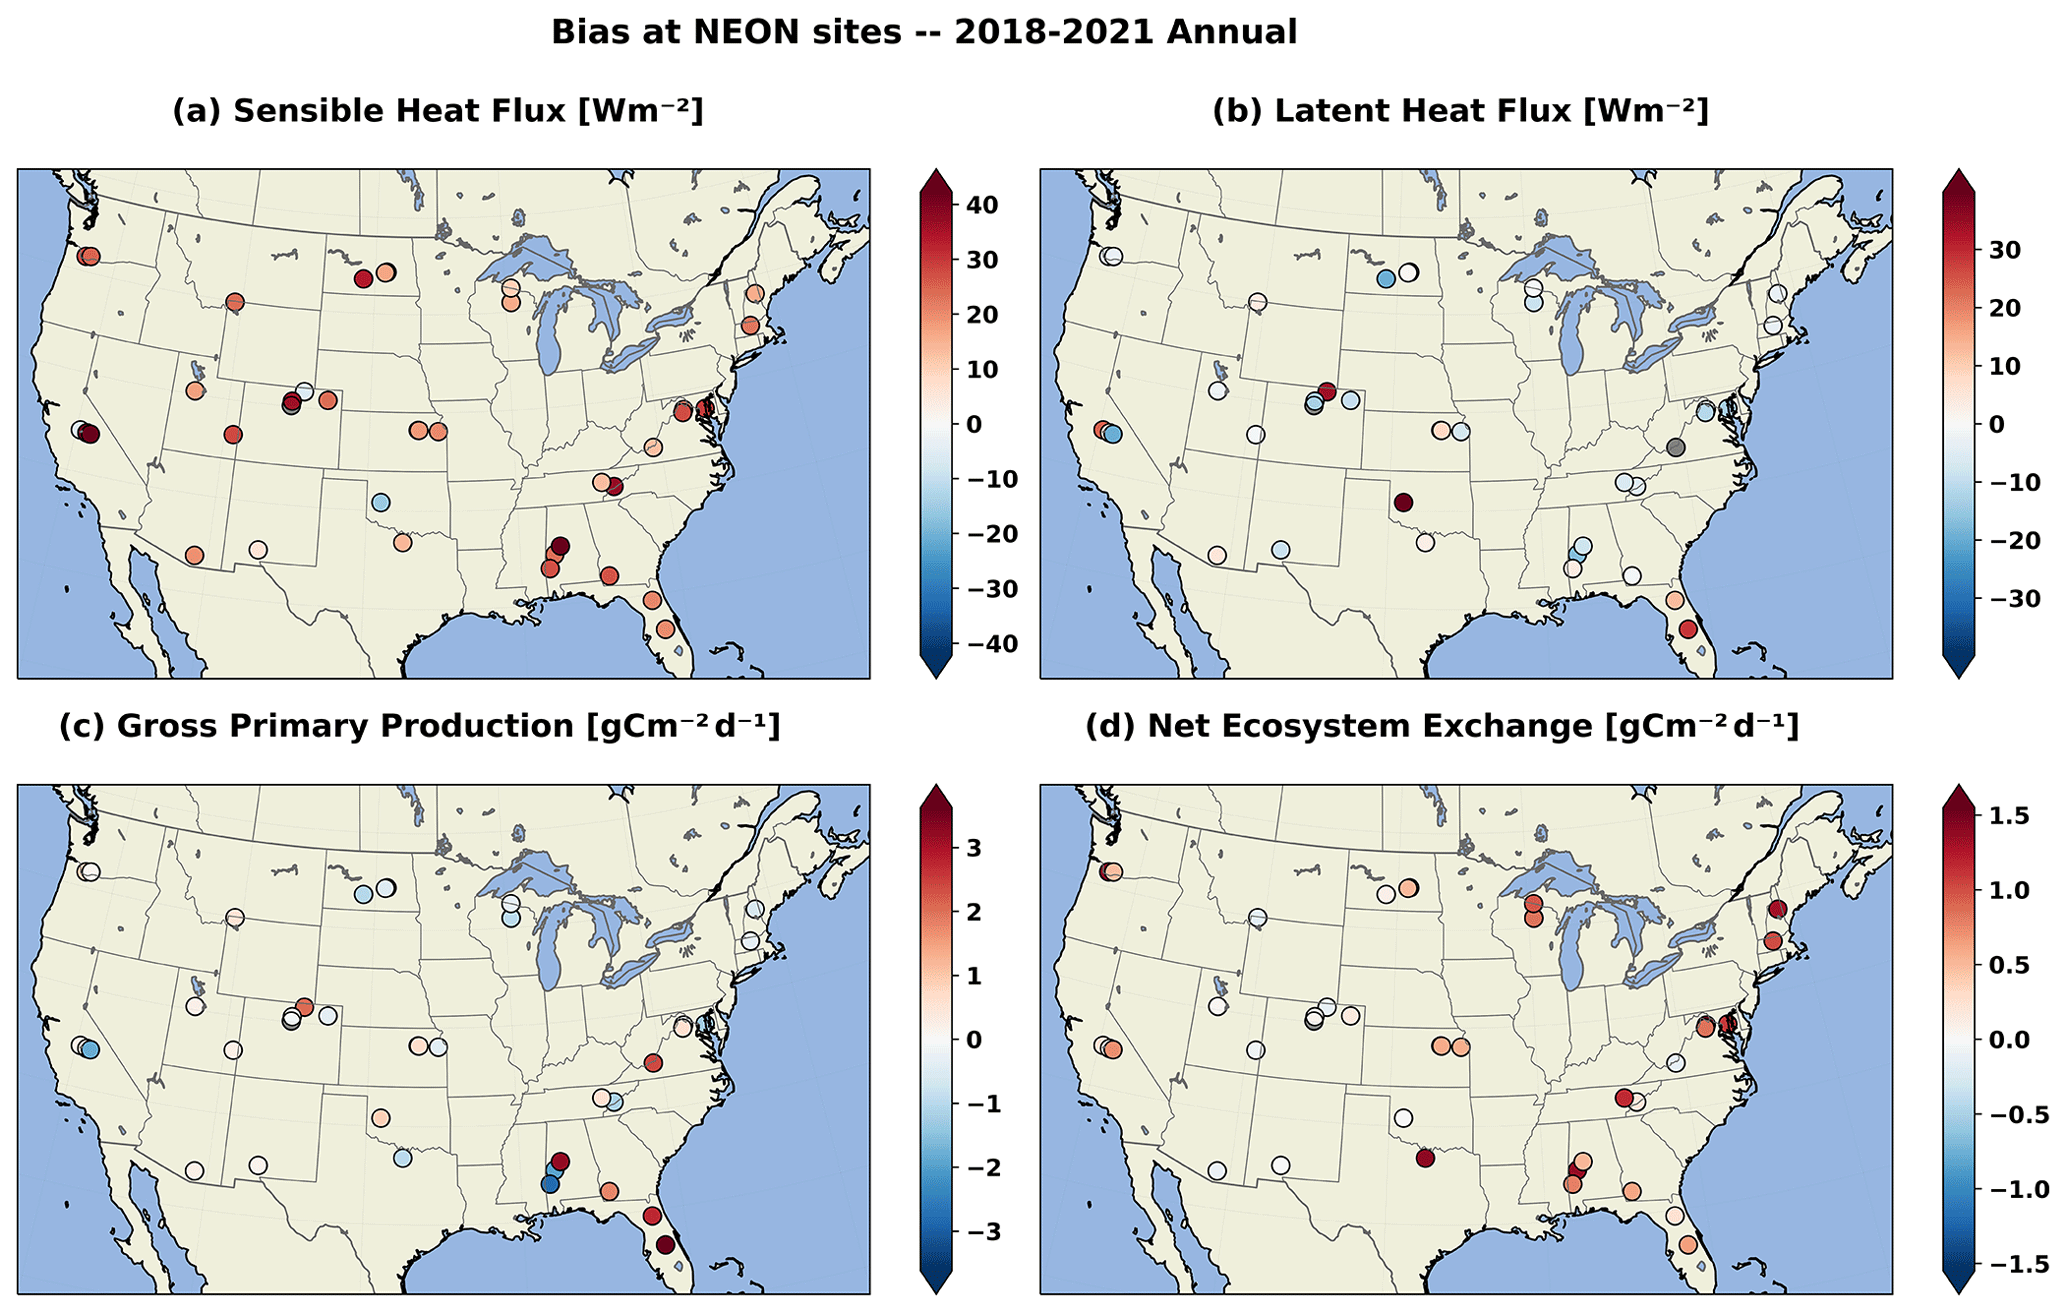
Figure 5Maps showing the location of the NEON site in the conterminous United States and annual biases in fluxes that are simulated by CTSM for (a) sensible heat flux (W m−2), (b) latent heat flux (W m−2), (c) gross primary production (GPP, gC m−2 d−1), and net ecosystem exchange (NEE, gC m−2 d−1) over the observational record (2018–2021), unless otherwise noted in Table S2.
Additional insights into potential sources of biases in data–model comparisons can be provided by looking deeper into component fluxes of latent heat at higher temporal frequencies. The NEON EC towers provide 30 min measurements of total latent heat fluxes, but latent heat fluxes in CTSM can be partitioned into contributions from canopy transpiration, canopy evaporation, and soil evaporation.
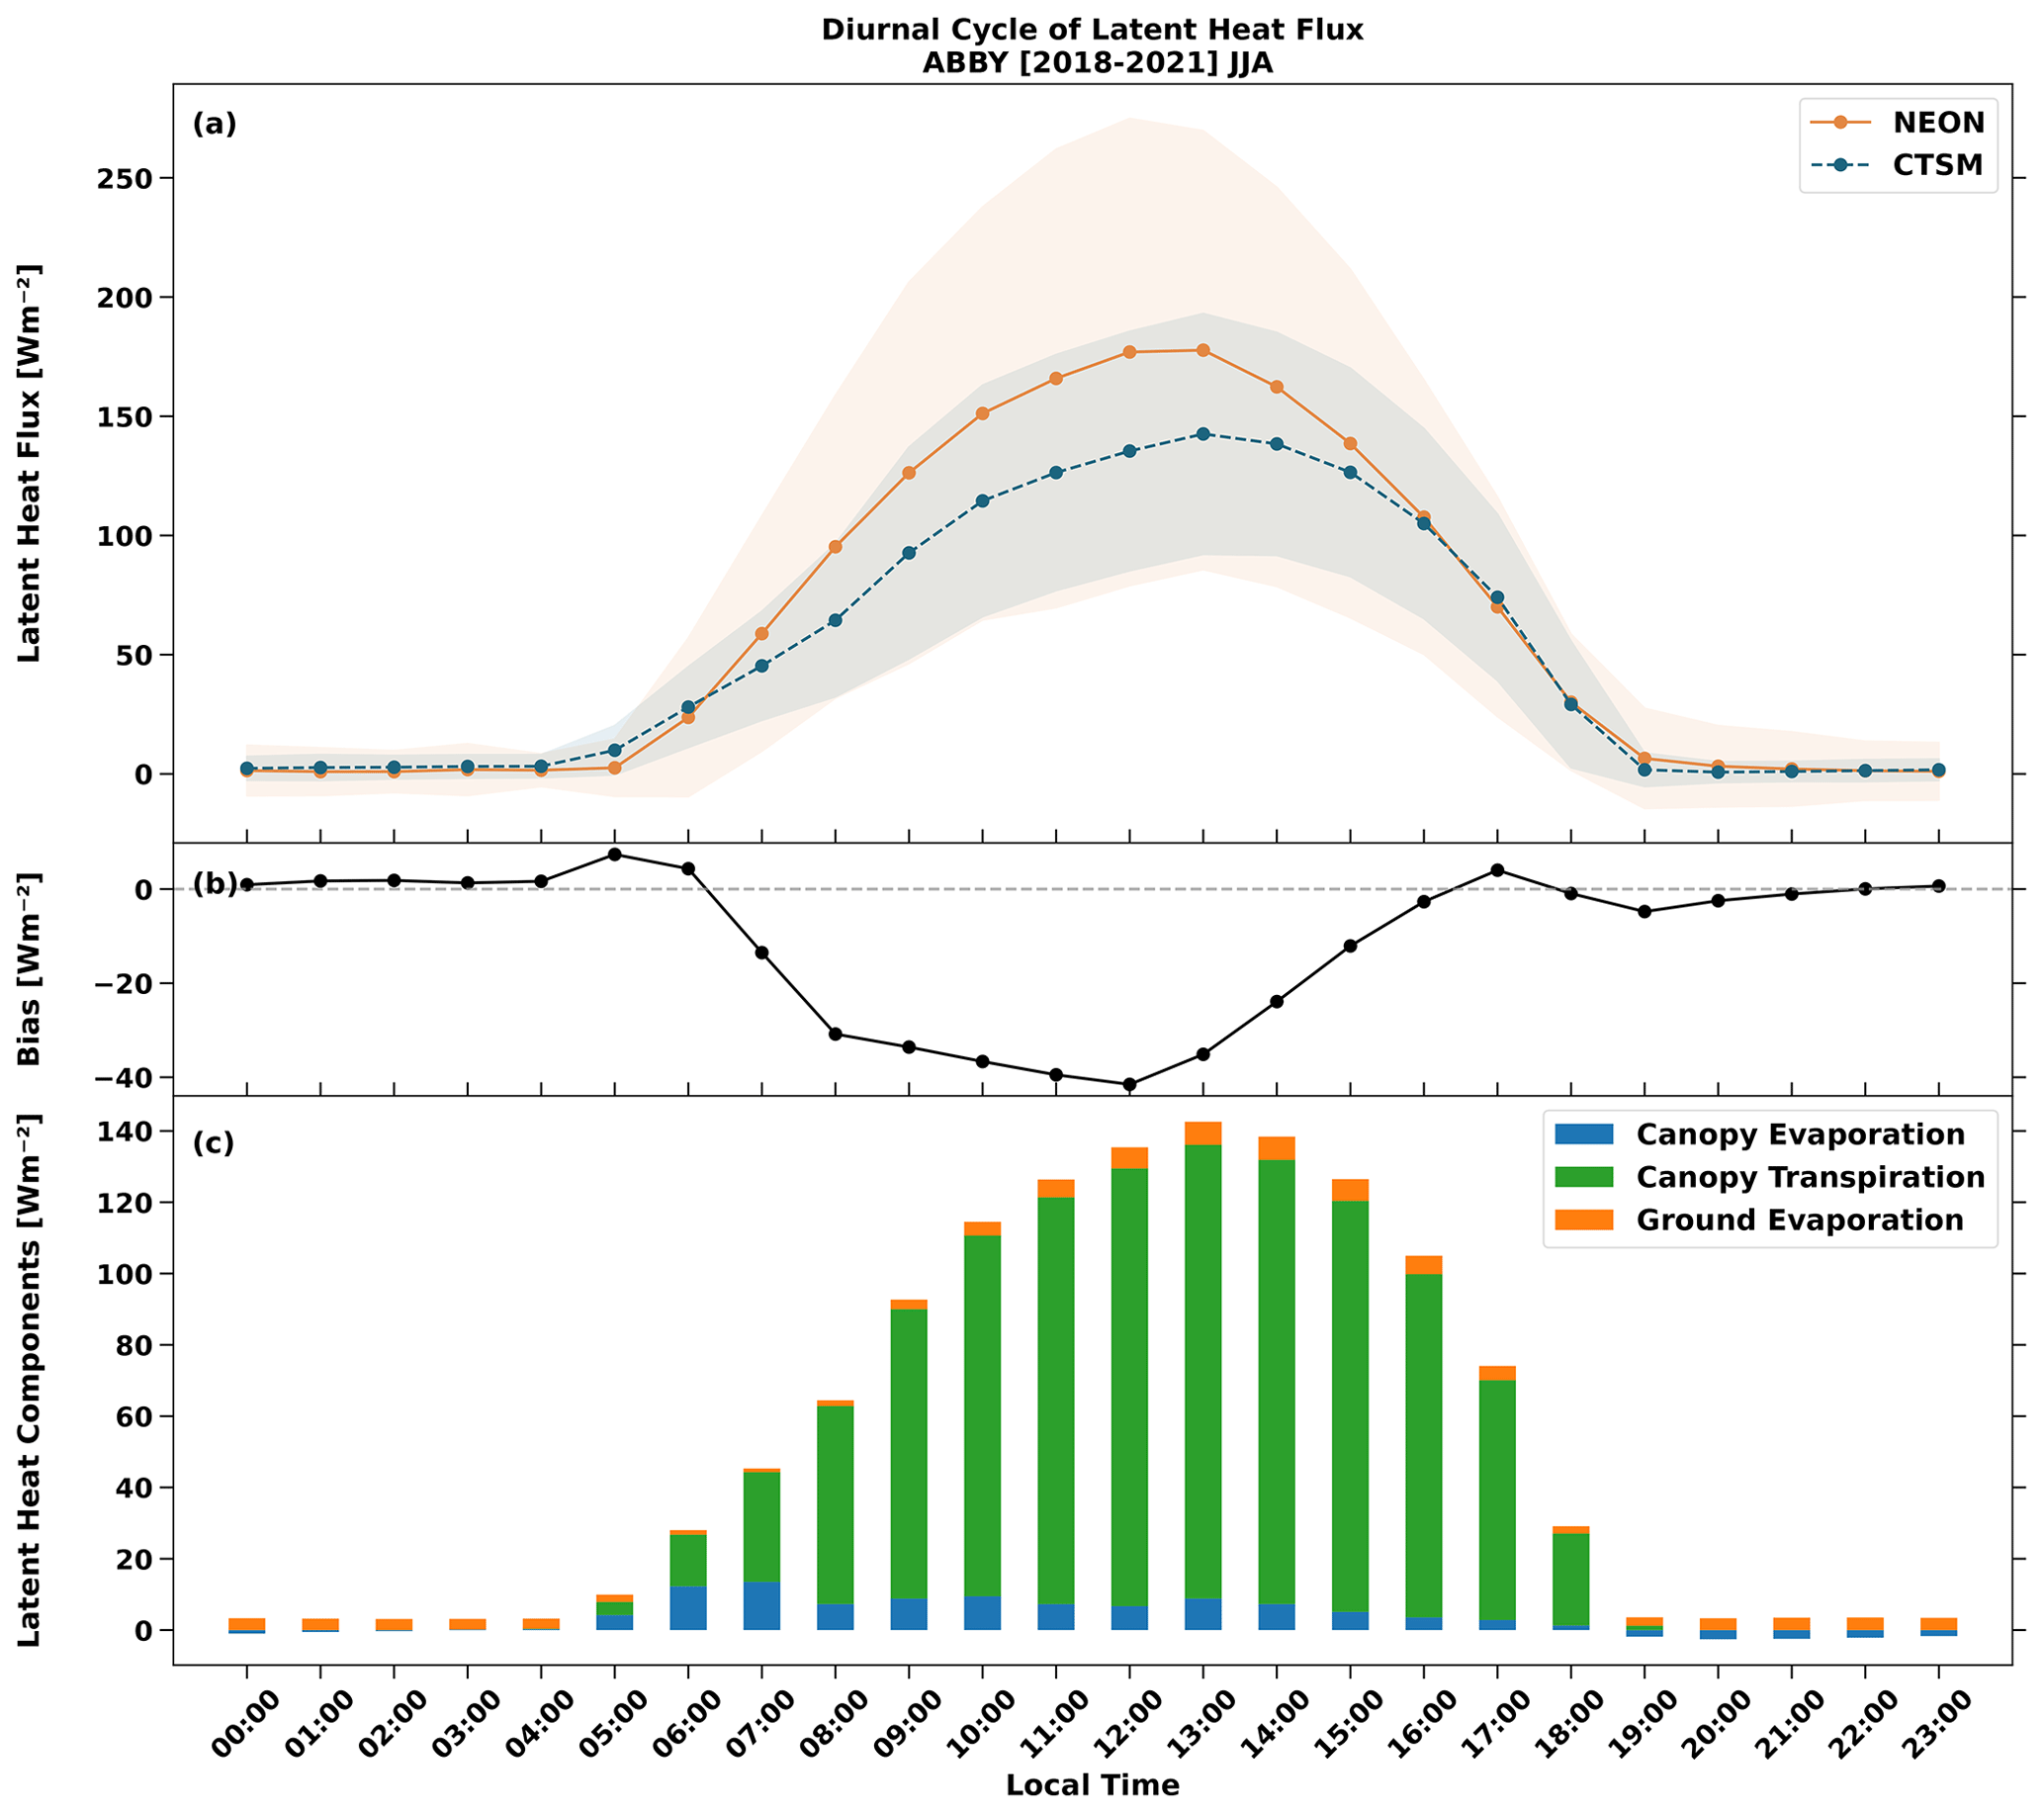
Figure 6Diel cycle of summertime (June, July, and August, or JJA) latent heat flux at the Abby Road site in Washington (ABBY). Panels show (a) mean half-hourly fluxes (2018–2021 mean ±1σ) for NEON measurements and CTSM simulations (orange and blue lines, respectively), (b) CTSM bias relative to the observations (W m−2), and (c) partitioning of latent heat into fluxes that are simulated by CTSM, which includes canopy evaporation, canopy transpiration, and ground evaporation (blue, green, and orange bars, respectively). Additional visualizations showing all sites and seasons are available on the interactive visualization website (Table 2).
For example, the CTSM simulations show temporal biases in both the timing and magnitude of the mean diel cycle of summertime (June, July, and August, or JJA) latent heat fluxes at the NEON Abby Road site (ABBY; Fig. 6). The bulk of daytime latent heat fluxes simulated by the model come from canopy transpiration fluxes, suggesting that the representation of stomatal conductance does not respond correctly to atmospheric conditions or plant water availability. We also note that this site experienced two very strong heatwaves in the summers of 2020 and 2021. Additional measurements of soil moisture, LAI, or sap flux could help test, evaluate, and improve various model parameter values and parameterizations to produce results that are most consistent with observed fluxes.
Light response curves (Fig. 7) illustrate how canopy photosynthesis responds to changes in the radiation environment. At forested sites, CTSM tends to overestimate GPP at low light levels, underestimate GPP under full irradiance, and simulate lower variance in GPP across a range of high incident radiation; this pattern is illustrated in Fig. 7a for Harvard Forest. At the Santa Rita grassland site, GPP is biased high in most irradiance bins, although it is comparable to observed estimates of GPP at full irradiance (Fig. 7b). As GPP is the driver for carbon fluxes and plant-mediated water fluxes in CTSM, inaccurate responses to the light environment affect several processes, including NEE and transpiration, which is a primary driver of midday (Fig. 6c) and summertime latent heat flux.
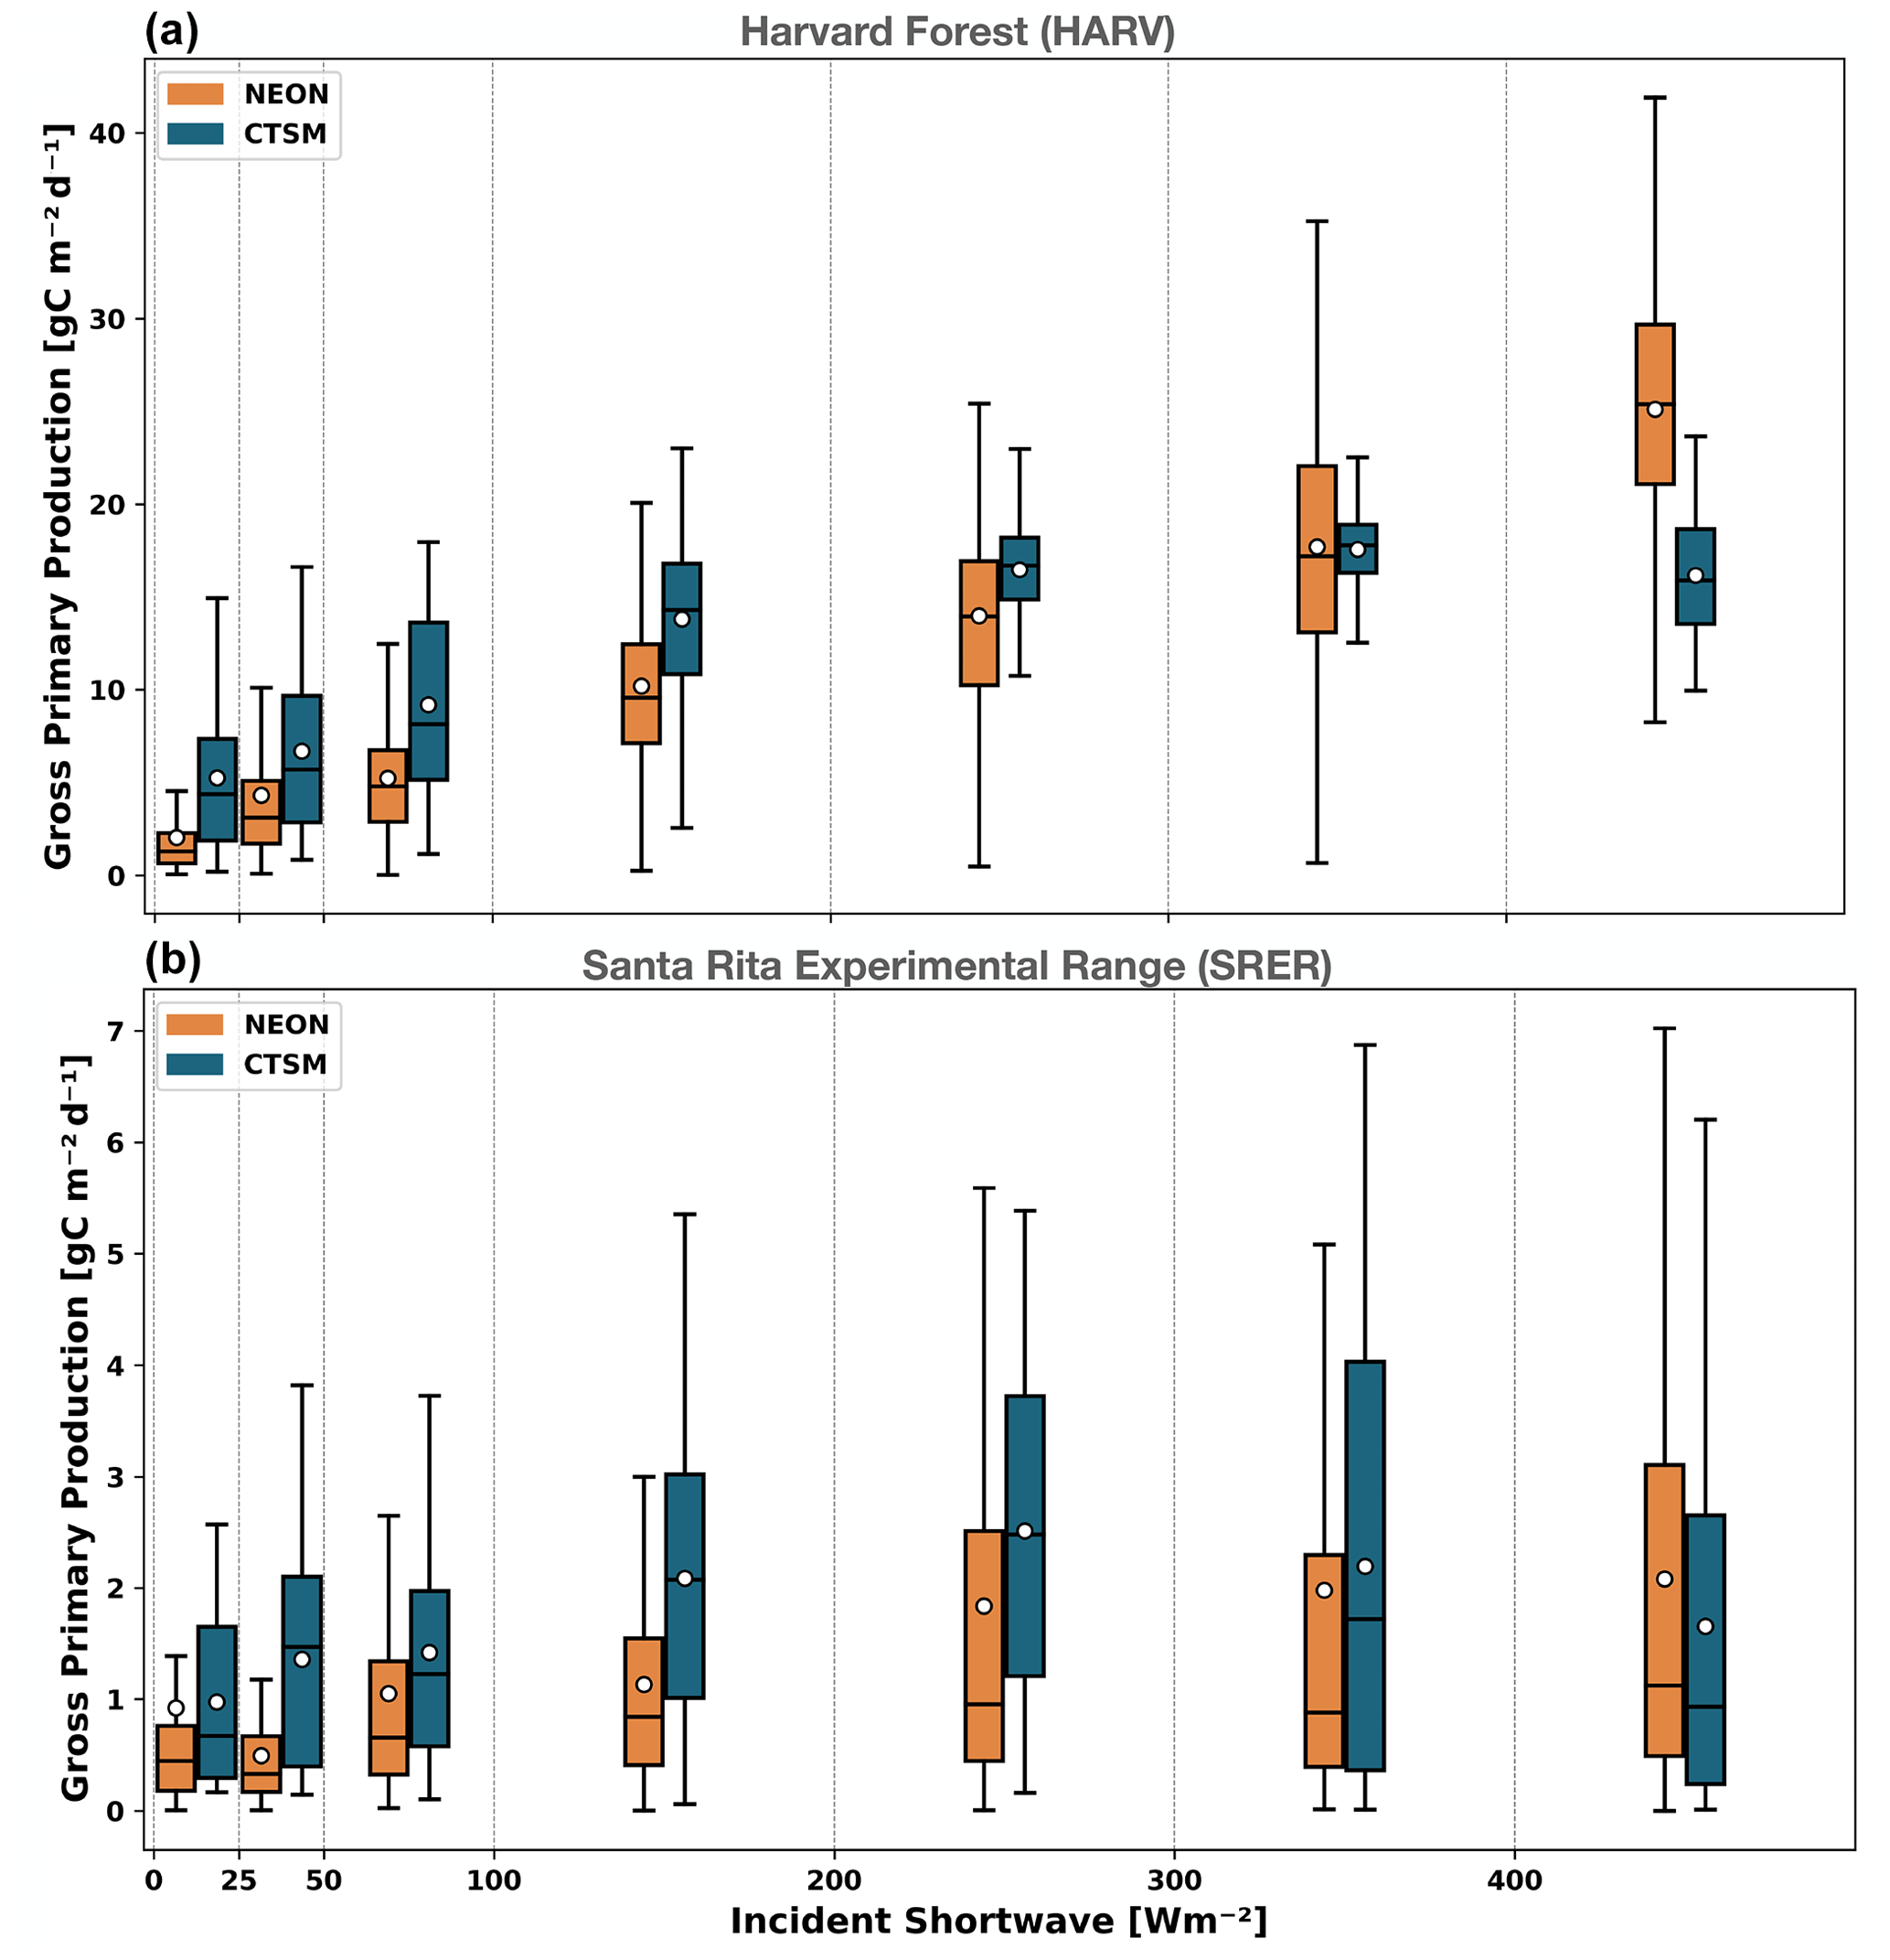
Figure 7Box–whisker plots showing light response curves and the relationship between gross primary production (GPP) and incident shortwave radiation that are derived from NEON measurements and CTSM simulations (orange and blue, respectively) at (a) Harvard Forest (HARV) and the (b) Santa Rita Experimental Range (SRER). Data represent 30 min measurements that are binned by incident shortwave radiation levels observed at NEON sites over the observational record in July (2018–2021). Boxes show the mean (dots), median (line), and interquartile range (boxes). The whiskers extend from the boxes (showing the first and third quartiles) by 1.5 times the interquartile range (Q3–Q1). Note the differences in the scale of the y axis.
Finally, there are opportunities to use data from CTSM simulations to augment NEON measurements. For example, measurements of soil moisture are important for calculating soil CO2 fluxes from NEON sites, but the soil moisture probes currently deployed at NEON sites do not always provide reliable measurements. For example, at the Abby Road site soil moisture observations have phases of erratic measurements, are missing at depth throughout much of 2020 and 2021, and have large offsets when instruments were calibrated (Figs. 8, S3). By contrast, CTSM provides continuous datasets that could be used to gap-fill or augment ongoing NEON soil moisture measurements, although simulated data may need to be bias-corrected. Similarly, soil moisture controls aspects of plant phenology in CLM, meaning that soil moisture measurements could help constrain or explain potential biases in simulated LAI and ecosystem fluxes. At ABBY, both CTSM simulations and NEON observations show similar temporal patterns – a dry-down of soil moisture during the dry summer months followed by wetter fall winter and spring months (Figs. 8; S3), although CTSM simulates wetter soils than observed at the NEON site.
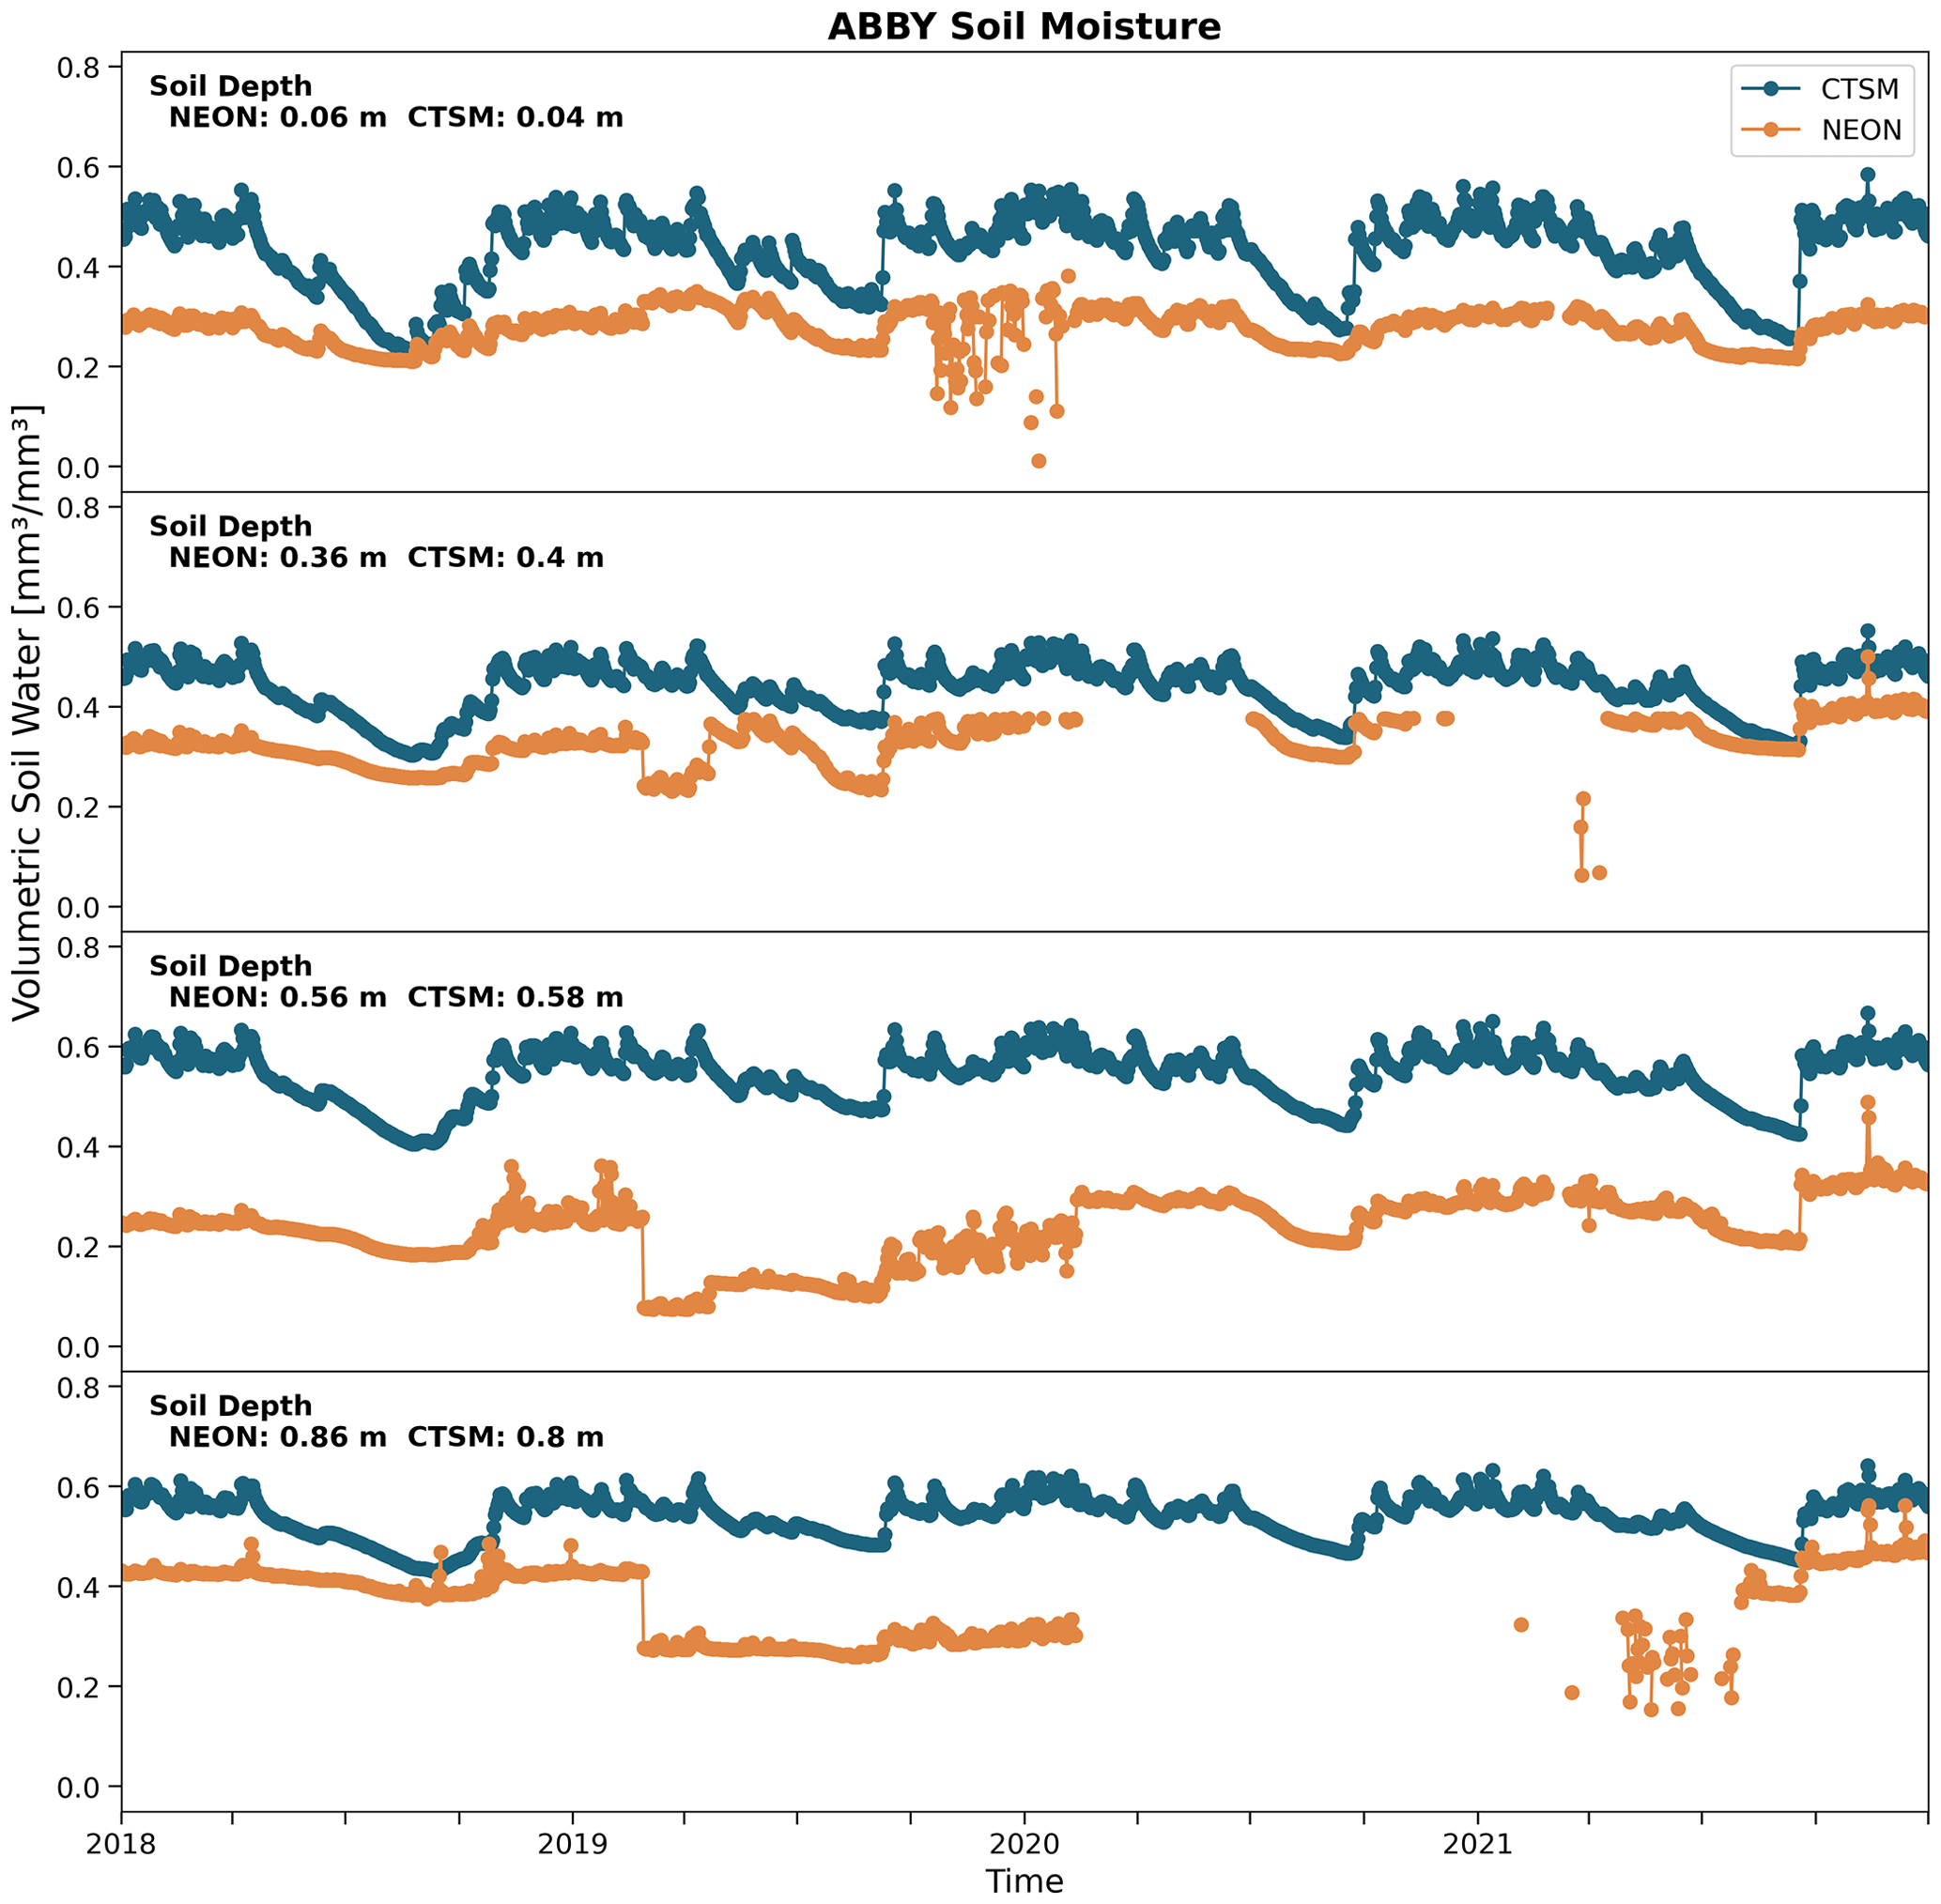
Figure 8Time series of volumetric soil moisture profiles that are simulated by CTSM simulations (blue) and measured by NEON (orange) at different depths in soil plot 3 at the Abby Road site in Washington (ABBY) from 2018–2021.
The NCAR–NEON system links models and measurements to provide a powerful suite of tools to understand ecosystem properties and processes through space and time. In addition to facilitating the integration of measurements and modeling, a major focus of this work is to enable new opportunities for research and education by expanding access to and interaction with NCAR models and NEON data, contributing to a growing body of work that increases the accessibility and usability of large datasets and computing resources for research (e.g., Novick et al., 2018; Beringer et al., 2020; Keetz et al., 2023) and education (e.g., Carey et al., 2020; O'Reilly et al., 2017). The user community can access quality-controlled and gap-filled NEON meteorological and EC flux data as prototype datasets through the public-access cloud storage buckets that support the NCAR–NEON system or the Prototype Data section of the NEON Data Portal (Table 2). Additionally, the NCAR–NEON system streamlines running NCAR's CTSM and simplifies access through the containerized CESM-Lab platform, bypassing the logistical challenges of porting CTSM to different computing systems. It also creates customized model input data that include local site characterizations of soil and vegetation using NEON data products and allows users to add custom input data to simulate other locations. These capabilities allow researchers to focus their time on customizing CTSM and integrating additional NEON datasets to address research questions. Combined with the visualization software provided in the tutorials, the NCAR–NEON system also facilitates opportunities for teaching about land–atmosphere interactions, ecology, and land modeling and can be incorporated into undergraduate and graduate courses alongside similar efforts (e.g., Carey et al., 2015). Below we discuss some of the synergistic enhancements this collaboration makes for NEON measurements and NCAR models as well as opportunities that the NCAR–NEON system enables for research and teaching.
4.1 Synergistic enhancements of NEON measurements and NCAR models
The NCAR–NEON system is a collaborative partnership between observationalists and modelers that enhances both NEON's measurements and NCAR's models. One typically thinks of observations as improving models, but the reverse can also happen in which models inform and augment the collection of measurements. For example, models require continuous meteorological input data, so gap filling the missing meteorological data required to run CTSM was paramount to the success of the project. A new prototype data product provided by the project is a continuous time series of meteorological data at each NEON location. Comparison of modeled and measured EC fluxes identified QA/QC improvements to the meteorological data needed for the model simulations and, similarly, improvements to the processing of the raw EC fluxes to compare with model results.
One issue raised in the simulations is the estimation of precipitation at grassland sites. NEON has experienced issues where small amounts of noise in the raw data cause spurious trace precipitation to be recorded at all primary precipitation sensors. Because secondary and throughfall precipitation buckets are unaffected, there is a redundant data stream at forested sites, but these are unavailable for grassland sites. An updated algorithm was expected to resolve the spurious trace precipitation issue in late 2022 with back-processed data available in the NEON 2024 data release. In the meantime, we manually evaluated the mean annual precipitation recorded at each NEON site against other observational data networks and noted locations where this issue is generating unexpectedly high or low precipitation values (Table S2).
Another example of how NCAR modeling improved NEON data quality comes from unusual soil moisture profiles that were initially generated in preliminary simulations at the ABBY site (data not shown). Upon closer inspection these patterns were found to be caused by an unusual relationship between soil organic carbon content and depth at this site, which did not match related data gathered during sample collection or subsequent analyses. Further investigation confirmed that the labels for the soil carbon analysis subsamples had been switched for two ABBY soil horizons. The NEON soil data have since been corrected and the modeled soil moisture profiles for ABBY now follow a more typical pattern with surface soils drying out during the summer and less variation in soil moisture in deeper soil horizons (Figs. 8, S3). There are also important differences in vertical profiles of simulated and measured soil moisture, with soil moisture simulated by CTSM typically decreasing with depth, while NEON soil moisture observations generally increase with depth. Additional investigation is needed to determine if these discrepancies extend to other sites and indicate issues with CTSM simulations or NEON data products, but it does underscore a synergy in NCAR modeling and NEON measurements that deserves more attention moving forward.
We see clear opportunities for NEON observations to help guide future model improvements, especially related to potential biases in phenology (discussed above), photosynthesis (Fig. 7), and other processes. Some biases in modeled processes are already documented; for example, Wozniak et al. (2020) found that CTSM underestimates maximum rates of simulated GPP compared to EC observations in deciduous forest sites. This suggests that implementation of the photosynthesis scheme in CTSM has parametric or structural issues that prevent high rates of GPP from occurring in the model. Auxiliary data from NEON that are not always available from other EC flux towers, for example foliar chemistry, can be used to update parameter values and to evaluate correlated model variables and processes. The opportunities afforded by NEON's EC and auxiliary data to improve the representation of ecological processes in CTSM will improve modeled carbon fluxes at NEON towers and may also ameliorate biases in global simulations.
Finally, the NCAR–NEON system can also facilitate model-informed prioritization of future data collection efforts. Models can quantify the dominant drivers of uncertainty in model parameters as well as in response to environmental drivers using ensemble-based methods of parameter uncertainty propagation and variance decomposition (LeBauer et al., 2013). Site-level CTSM simulations could therefore help future NEON data collection campaigns to target variables that contribute the most to uncertainty in modeled ecosystem fluxes and ecosystem responses to global change.
4.2 Opportunities enabled for research
The NCAR–NEON system enables research opportunities in the ecology, global change, and Earth system science communities by (1) facilitating access to NCAR models that can be customized to meet researchers' needs, (2) providing a computational platform that leverages NEON observational datasets for site-level model configuration and evaluation across the diverse range of ecosystems captured in the NEON design, (3) facilitating reproducible research workflows, and (4) providing gap-filled meteorological data and partitioned EC flux data products that create synergies with other flux networks and data pipelines (Novick et al., 2018; Beringer et al., 2020; Pastorello et al., 2020).
In building the NCAR–NEON system we improved the software infrastructure and workflows that are required to run single-point simulations with CTSM, while developing derived, prototype datasets with NEON's EC measurements. Although the focus of this work is on connecting CTSM and NEON data, measurements from non-NEON sites can also be used with this system, facilitating the use of data from additional EC towers and the ONEFlux data pipeline in CTSM development and evaluation. Moving forward, NEON is working with AmeriFlux to incorporate the redundant data stream gap filling from NCAR–NEON with ONEFlux standardized data processing as well as providing proper data formats and metadata for modeling framework ingestion.
Through CESM-Lab, the NCAR–NEON system provides access to the full model code and datasets used to run CTSM on any computing system. A strength of this system is the auxiliary data collected by the NEON network used to inform site-specific model inputs and model evaluation. With some effort, users can adapt this system to incorporate and simulate flux towers at other research sites using the “Processing NEON data” tools linked in Table 2 to guide data formatting. Thus, future work could expand this system to include gap-filled flux data from other regional and global networks like AmeriFlux and FLUXNET, allowing for broader spatial coverage. Additionally, researchers do not need access to large-scale computing resources and can use alternative model configurations; the CTSM code can be modified and compiled within the container, so researchers who wish to run simulations with new model parameterizations or with additional model features may now do so from any computer. Most personal laptop computers are more than sufficient for running site-level simulations, even when using more computationally complex versions of the land model that include, for example, ecological dynamics (using the Functionally Assembled Terrestrial Ecosystem Simulator – FATES; Koven et al., 2020) or representative hillslope hydrology (Swenson et al., 2019). Advanced users can run CTSM at any single-point site by making their own input files. Additionally, researchers can quantify the impact of adjusting model parameters and processes on terrestrial ecosystems under historical and future climate scenarios. This flexibility is useful for calibrating the model to improve model performance at a given site, as well as for gaining mechanistic insights into how different processes and uncertainties affect ecosystem functioning. Broadening access to CTSM also allows researchers to rapidly compare model output to their own observational datasets or to existing NEON observational datasets that are not yet integrated into the NCAR–NEON system.
Moving forward, we see additional NEON data products as providing valuable insights to the NCAR–NEON system. These could include NEON measurements that are used as both model inputs (foliar chemistry, phenology and LAI, and historical land use legacies) and model validation datasets (including snow depth, vertical profiles of canopy temperature, leaf water potential, litterfall rates, biomass and vegetation structure, and depth profiles of soil moisture, temperature, carbon, and nitrogen). Although these data have not yet been integrated into the NCAR–NEON system, we are optimistic that existing tools can help facilitate their integration into research opportunities. We see powerful opportunities to expand on this approach to integrate information from NEON's Airborne Observation Platform (AOP) into workflows that extend model capabilities beyond the relatively small footprint of the EC towers. For example, the AOP light detection and ranging (lidar) data could provide information to initialize stand structure that would be helpful for calibrating reduced-complexity configurations of the CTSM-FATES model (Fisher and Koven, 2020).
The NCAR–NEON system also promotes reproducibility of research in alignment with the FAIR (findable, accessible, interoperable, and reusable) data principles (Wilkinson et al., 2016), addressing an ongoing challenge facing both ecology and geosciences (Powers and Hampton, 2019; Culina et al., 2020; Kinkade and Shepherd, 2021). The NCAR–NEON system makes it easy for researchers to share their research workflow as part of their publications, including accompanying code and data. The containerized system also reduces the time required to configure and run other researchers' workflows, thereby facilitating the process of reproducing previous studies and expanding existing workflows to answer new research questions.
In addition to enabling opportunities for research with NCAR models, the NCAR–NEON system also facilitates access to NEON data, which can be used for observationally based research or research using other models. For example, the gap-filled micrometeorological data and partitioned flux data products provided in the NCAR–NEON system could be used in other projects related to ecological forecasting and model evaluation that focus on ecological processes and land model simulations (Best et al., 2015; Collier et al., 2018; Eyring et al., 2019; Lewis et al., 2022). As latencies in publishing NEON data are reduced, we intend to provide updated input and evaluation data to the NCAR–NEON system to enable near-real-time hindcasts of ecosystem states and fluxes. In short, we see the information that is being generated through this activity as a resource to meet data requirements of the broader Earth system science community.
4.3 Opportunities enabled for teaching
The NCAR–NEON system makes it easy to run and visualize site-level simulations that can be integrated into classroom settings, and the NEON Observatory design provides a unique opportunity for students to access data from world-class field research sites and instrumentation in a variety of ecosystems. Here we highlight two capacities in which this tool can be integrated into classroom activities, complementing other learning modules that integrate ecological data with modeling tools, such as those from project EDDIE (e.g., Carey et al., 2020; O'Reilly et al., 2017), to broaden exposure to large datasets, ecological modeling, and system thinking. The first is an interactive web-based visualization tool (Table 2). This tool does not require any software or data downloads, allowing students to access and explore NEON and CTSM data without running any simulations. Students can explore and compare observational and simulated data for numerous fluxes at different temporal scales from 45 terrestrial NEON sites (Table S1 in the Supplement). Classroom modules can be developed to probe various ecological questions, including comparisons across sites, how fluxes change seasonally, and quantification of interannual variability. Instructors can also use this tool to highlight differences between models and observations, helping students to better understand how we measure, simulate, and predict ecosystem processes.
A second opportunity for classroom activities is to run simulations using the NCAR–NEON system within the CESM-Lab container. The flexible cyberinfrastructure, short simulation run times (typically less than 10 min), and simplified coding requirements facilitate running simulations for classroom applications. Technical challenges are minimal and can be reduced by using a computer lab with Docker pre-installed and computers that have sufficient memory and space requirements for data downloads or by using larger-scale computing resources like university clusters or cloud computing resources. Once access to the containerized computing environment is established, students can use the available tutorials to run NEON tower simulations at the site of their choice and evaluate simulated fluxes against observations (Table 2).
The NCAR–NEON system is flexible, allowing instructors to easily make additional customizations for their classes. As an example, this cyberinfrastructure tool was used in a graduate-level land–climate interaction course at Auburn University in the 2021–2022 academic year. First, students performed CTSM simulations for the Talladega National Forest (TALL) site, the NEON site closest to Auburn University, and compared latent heat flux simulated by CTSM with the NEON measurements using system tutorials. Next, students were divided into two project groups focusing on either TALL or Ordway–Swisher Biological Station (OSBS) sites to conduct parameter perturbation experiments using a tutorial developed by the instructor. Students collected the relevant parameter values from the literature, updated model parameter files, and performed 10 CTSM simulations at each site, finding that GPP was more sensitive to the selected parameters than latent heat fluxes. These classroom exercises were paired with a visit to the TALL site to enrich students' experiences and motivate them to design their own investigation and experiments. Exposure to the NCAR–NEON system has motivated graduate students to contribute analyses, tutorials, and additional resources to the broader community. For example, one graduate student compared NEON precipitation measurements with nearby NOAA sites, helping to identify potentially problematic NEON sensors (Sect. 4.1), while another is developing a model to estimate aboveground biomass using ground-based NEON data and remote sensing measurements (Narine et al., 2020). These examples highlight how the NCAR–NEON system is inspiring the next generation of scientists.
Deeper engagement of diverse scientific communities, removing technical barriers, and increasing access to research data and tools are critical to advancing Earth system science, prediction, and understanding of ecosystem responses to global change. By developing cyberinfrastructure tools that facilitate the easy and rapid use of measurements, models, and computing tools, the NCAR–NEON system aims to enable this convergence of climate and ecological sciences and facilitates the development and testing of data-driven and model-enabled scientific hypotheses. The system provides a computationally simplified platform for scientific discovery and for rigorous evaluation and improvement of model simulations and observational data at NEON tower sites. By facilitating community engagement in modeling and observing terrestrial ecosystems, cyberinfrastructure tools like this are a key component for building a more intellectually diverse workforce for global change research and Earth system science.
Datasets created as part of this project are available as a NEON prototype dataset and archived at NCAR's Geoscience Data Exchange (GDEX) at https://doi.org/10.5065/tmmj-sj66 (Wieder et al., 2023). CTSM code is available through the CTSM GitHub page and archived at https://doi.org/10.5281/zenodo.7342803 (CTSM Development Team, 2022). Post-processing scripts that used to make figures in this paper are available at https://github.com/NCAR/neon_scripts (last access: 8 October 2023) and https://doi.org/10.5281/zenodo.7641892 (Sobhani et al., 2023).
The supplement related to this article is available online at: https://doi.org/10.5194/gmd-16-5979-2023-supplement.
All authors contributed to writing and review of the software and paper. GBB and MS contributed to funding acquisition. DLL, WRW, NS, GBB, DD, DL, and MS contributed to conceptualization and data curation. DLL, WRW, NS, and DD contributed to formal analysis, software development, validation, and visualization.
The contact author has declared that none of the authors has any competing interests.
Publisher's note: Copernicus Publications remains neutral with regard to jurisdictional claims in published maps and institutional affiliations.
Significant contributions to this work were made by Jim Edwards, Brian Dobbins, Erik Kluzek, Cove Sturtevant, and Giorgio Scorzelli. We also appreciate the support of the National Science Data Fabric (NSDF) platform. This material is based upon work supported by the National Center for Atmospheric Research, which is a major facility sponsored by the National Science Foundation (NSF) under cooperative agreement no. 1852977 with additional support from NSF award number 2039932. The National Ecological Observatory Network is a program sponsored by the NSF and operated under cooperative agreement by Battelle. William R. Wieder was also supported by NSF award numbers 1926413, 2031238, and 2120804. Sanjiv Kumar's contributions were supported by USDA NIFA grant 2020-67021-32476. Kyla Dahlin's contributions were supported by NSF award numbers 1702379 and 2044818 and the USDA NIFA Hatch project no. 1025001. Valerio Pascucci's contributions were funded in part by NSF OAC award 2138811, NSF OISE award 2330582, NSF CI CoE award 2127548, and the Intel oneAPI Center of Excellence at the University of Utah, using resources from the Chameleon, Cloudlab, CloudBank, Fabric, and ACCESS test beds supported by the National Science Foundation.
This research has been supported by the National Science Foundation (grant nos. 2039932, 1926413, 2031238, 2330582, 2120804, 1702379, 2044818, and 1852977) and the US Department of Agriculture (grant nos. 2020-67021-32476 and 1025001).
This paper was edited by Carlos Sierra and reviewed by Manuel Acosta and one anonymous referee.
Ayres, E., Colliander, A., Cosh, M. H., Roberti, J. A., Simkin, S., and Genazzio, M. A.: Validation of SMAP Soil Moisture at Terrestrial National Ecological Observatory Network (NEON) Sites Show Potential for Soil Moisture Retrieval in Forested Areas, IEEE J. Sel. Top. Appl., 14, 10903–10918, https://doi.org/10.1109/jstars.2021.3121206, 2021.
Balch, J. K., Nagy, R. C., and Halpern, B. S.: NEON is seeding the next revolution in ecology, Front. Ecol. Environ., 18, p. 3, https://doi.org/10.1002/fee.2152, 2020.
Beringer, J., Moore, C. E., Cleverly, J., Campbell, D. I., Cleugh, H., De Kauwe, M. G., Kirschbaum, M. U. F., Griebel, A., Grover, S., Huete, A., Hutley, L. B., Laubach, J., van Niel, T., Arndt, S. K., Bennett, A. C., Cernusak, L. A., Eamus, D., Ewenz, C. M., Goodrich, J. P., and Woodgate, W.: Bridge to the future: Important lessons from 20 years of ecosystem observations made by the OzFlux network, Glob. Change Biol., 28, 3489–3514, https://doi.org/10.1111/gcb.16141, 2022.
Best, M. J., Abramowitz, G., Johnson, H. R., Pitman, A. J., Balsamo, G., Boone, A., Cuntz, M., Decharme, B., Dirmeyer, P. A., Dong, J., Ek, M., Guo, Z., Haverd, V., van den Hurk, B. J. J., Nearing, G. S., Pak, B., Peters-Lidard, C., Santanello, J. A., Stevens, L., and Vuichard, N.: The Plumbing of Land Surface Models Benchmarking Model Performance, J. Hydrometeorol., 16, 1425–1442, 2015.
Birch, L., Schwalm, C. R., Natali, S., Lombardozzi, D., Keppel-Aleks, G., Watts, J., Lin, X., Zona, D., Oechel, W., Sachs, T., Black, T. A., and Rogers, B. M.: Addressing biases in Arctic–boreal carbon cycling in the Community Land Model Version 5, Geosci. Model Dev., 14, 3361–3382, https://doi.org/10.5194/gmd-14-3361-2021, 2021.
Bonan, G.: Ecological climatology: concepts and applications, 3, Cambridge University Press, Cambridge, https://doi.org/10.1017/CBO9781107339200, 2015.
Bonan, G.: Climate change and terrestrial ecosystem modeling, Cambridge University Press, Cambridge, https://doi.org/10.1017/9781107339217, 2019.
Bonan, G. B.: A Land Surface Model (LSM Version 1.0) for Ecological, Hydrological, and Atmospheric Studies: Technical Description and User's Guide (No. NCAR/TN-417+STR), University Corporation for Atmospheric Research, https://doi.org/10.5065/D6DF6P5X, 1996.
Bonan, G. B. and Doney, S. C.: Climate, ecosystems, and planetary futures: The challenge to predict life in Earth system models, Science, 359, eaam8328, https://doi.org/10.1126/science.aam8328, 2018.
Bonan, G. B., Davis, K. J., Baldocchi, D., Fitzjarrald, D., and Neumann, H.: Comparison of the NCAR LSM1 land surface model with BOREAS aspen and jack pine tower fluxes, J. Geophys. Res.-Atmos., 102, 29065–29075, https://doi.org/10.1029/96jd03095, 1997.
Bonan, G. B., Oleson, K. W., Fisher, R. A., Lasslop, G., and Reichstein, M.: Reconciling leaf physiological traits and canopy flux data: Use of the TRY and FLUXNET databases in the Community Land Model version 4, J. Geophys. Res.-Biogeo., 117, G02026, https://doi.org/10.1029/2011jg001913, 2012.
Bonan, G. B., Lawrence, P. J., Oleson, K. W., Levis, S., Jung, M., Reichstein, M., Lawrence, D. M., and Swenson, S. C.: Improving canopy processes in the Community Land Model version 4 (CLM4) using global flux fields empirically inferred from FLUXNET data, J. Geophys. Res., 116, G02014, https://doi.org/10.1029/2010jg001593, 2011.
Brock, F. V.: A Nonlinear Filter to Remove Impulse Noise from Meteorological Data, J. Atmos. Ocean. Tech., 3, 51–58, https://doi.org/10.1175/1520-0426(1986)003<0051:Anftri>2.0.Co;2, 1986.
Burns, S. P., Swenson, S. C., Wieder, W. R., Lawrence, D. M., Bonan, G. B., Knowles, J. F., and Blanken, P. D.: A Comparison of the Diel Cycle of Modeled and Measured Latent Heat Flux During the Warm Season in a Colorado Subalpine Forest, J. Adv. Model. Earth Sy., 10, 617–651, https://doi.org/10.1002/2017ms001248, 2018.
Carey, C. C., Darner Gougis, R., Klug, J. L., O'Reilly, C. M., and Richardson, D. C.: A model for using environmental data-driven inquiry and exploration to teach limnology to undergraduates, Limnol. Oceanogr. Bull., 24, 2–5, https://doi.org/10.1002/lob.10020, 2015.
Carey, C. C., Farrell, K. J., Hounshell, A. G., and O'Connell, K.: Macrosystems EDDIE teaching modules significantly increase ecology students' proficiency and confidence working with ecosystem models and use of systems thinking, Ecol. Evol., 10, 12515–12527, https://doi.org/10.1002/ece3.6757, 2020.
Collier, N., Hoffman, F. M., Lawrence, D. M., Keppel-Aleks, G., Koven, C. D., Riley, W. J., Mu, M. Q., and Randerson, J. T.: The International Land Model Benchmarking (ILAMB) System: Design, Theory, and Implementation, J. Adv. Model. Earth Sy., 10, 2731–2754, https://doi.org/10.1029/2018ms001354, 2018.
CTSM Development Team: ESCOMP/CTSM: NEON release: Some NEON updates fixing AG sites, update MOSART, small fixes (ctsm5.1.dev114), Zenodo [code , https://doi.org/10.5281/zenodo.7342803, 2022.
Culina, A., van den Berg, I., Evans, S., and Sanchez-Tojar, A.: Low availability of code in ecology: A call for urgent action, PLoS Biol., 18, e3000763, https://doi.org/10.1371/journal.pbio.3000763, 2020.
Danabasoglu, G., Lamarque, J.-F., Bacmeister, J., Bailey, D. A., DuVivier, A. K., Edwards, J., Emmons, L. K., Fasullo, J., Garcia, R., Gettelman, A., Hannay, C., Holland, M. M., Large, W. G., Lauritzen, P. H., Lawrence, D. M., Lenaerts, J. T. M., Lindsay, K., Lipscomb, W. H., Mills, M. J., Neale, R., Oleson, K. W., Otto-Bliesner, B., Phillips, A. S., Sacks, W., Tilmes, S., van Kampenhout, L., Vertenstein, M., Bertini, A., Dennis, J., Deser, C., Fischer, C., Fox-Kemper, B., Kay, J. E., Kinnison, D., Kushner, P. J., Larson, V. E., Long, M. C., Mickelson, S., Moore, J. K., Nienhouse, E., Polvani, L., Rasch, P. J., and Strand, W. G.: The Community Earth System Model Version 2 (CESM2), J. Adv. Model. Earth Sy., 12, e2019MS001916, https://doi.org/10.1029/2019ms001916, 2020.
Deardorff, J. W.: Efficient prediction of ground surface temperature and moisture, with inclusion of a layer of vegetation, J. Geophys. Res., 83, 1889–1903, https://doi.org/10.1029/JC083iC04p01889, 1978.
Dickinson, R. E., Henderson-Sellers, A., Kennedy, P. J., and Wilson, M. F.: Biosphere-atmosphere Transfer Scheme (BATS) for the NCAR Community Climate Model (No. NCAR/TN-275-+STR), https://doi.org/10.5065/D6668B58, 1986.
Dickinson, R. E., Henderson-Sellers, A., and Kennedy, P. J.: Biosphere-atmosphere Transfer Scheme (BATS) Version 1e as Coupled to the NCAR Community Climate Model (No. NCAR/TN-387+STR), University Corporation for Atmospheric Research, https://doi.org/10.5065/D67W6959, 1993.
Durden, D. J., Metzger, S., Chu, H., Collier, N., Davis, K. J., Desai, A. R., Kumar, J., Wieder, W. R., Xu, M., and Hoffman, F. M., Nichols, J., Verastegui, B., Maccabe, A. B., Hernandez, O., Parete-Koon, S., and Ahearn, T. (Eds.): Automated Integration of Continental-Scale Observations in Near-Real Time for Simulation and Analysis of Biosphere–Atmosphere Interactions, Springer International Publishing, Cham, 204–225, https://doi.org/10.1007/978-3-030-63393-6_14, 2020.
Eyring, V., Cox, P. M., Flato, G. M., Gleckler, P. J., Abramowitz, G., Caldwell, P., Collins, W. D., Gier, B. K., Hall, A. D., Hoffman, F. M., Hurtt, G. C., Jahn, A., Jones, C. D., Klein, S. A., Krasting, J. P., Kwiatkowski, L., Lorenz, R., Maloney, E., Meehl, G. A., Pendergrass, A. G., Pincus, R., Ruane, A. C., Russell, J. L., Sanderson, B. M., Santer, B. D., Sherwood, S. C., Simpson, I. R., Stouffer, R. J., and Williamson, M. S.: Taking climate model evaluation to the next level, Nat. Clim. Change, 9, 102–110, https://doi.org/10.1038/s41558-018-0355-y, 2019.
Falge, E., Baldocchi, D., Olson, R., Anthoni, P., Aubinet, M., Bernhofer, C., Burba, G., Ceulemans, R., Clement, R., Dolman, H., Granier, A., Gross, P., Grünwald, T., Hollinger, D., Jensen, N.-O., Katul, G., Keronen, P., Kowalski, A., Ta Lai, C., Law, B. E., Meyers, T., Moncrieff, J., Moors, E., William Munger, J., Pilegaard, K., Rannik, Ü., Rebmann, C., Suyker, A., Tenhunen, J., Tu, K., Verma, S., Vesala, T., Wilson, K., and Wofsy, S.: Gap filling strategies for long term energy flux data sets, Agr. Forest Meteorol., 107, 71–77, https://doi.org/10.1016/s0168-1923(00)00235-5, 2001.
Fer, I., Gardella, A. K., Shiklomanov, A. N., Campbell, E. E., Cowdery, E. M., De Kauwe, M. G., Desai, A., Duveneck, M. J., Fisher, J. B., Haynes, K. D., Hoffman, F. M., Johnston, M. R., Kooper, R., LeBauer, D. S., Mantooth, J., Parton, W. J., Poulter, B., Quaife, T., Raiho, A., Schaefer, K., Serbin, S. P., Simkins, J., Wilcox, K. R., Viskari, T., and Dietze, M. C.: Beyond ecosystem modeling: A roadmap to community cyberinfrastructure for ecological data-model integration, Glob. Change Biol., 27, 13–26, https://doi.org/10.1111/gcb.15409, 2021.
Finkenbiner, C. E., Li, B., Spencer, L., Butler, Z., Haagsma, M., Fiorella, R. P., Allen, S. T., Anderegg, W., Still, C. J., Noone, D., Bowen, G. J., and Good, S. P.: The NEON Daily Isotopic Composition of Environmental Exchanges Dataset, Sci. Data, 9, 353, https://doi.org/10.1038/s41597-022-01412-4, 2022.
Fisher, R. A. and Koven, C. D.: Perspectives on the Future of Land Surface Models and the Challenges of Representing Complex Terrestrial Systems, J. Adv. Model. Earth Sy., 12, e2018MS001453, https://doi.org/10.1029/2018ms001453, 2020.
Hinckley, E.-L. S., Anderson, S. P., Baron, J. S., Blanken, P. D., Bonan, G. B., Bowman, W. D., Elmendorf, S. C., Fierer, N., Fox, A. M., Goodman, K. J., Jones, K. D., Lombardozzi, D. L., Lunch, C. K., Neff, J. C., SanClements, M. D., Suding, K. N., and Wieder, W. R.: Optimizing Available Network Resources to Address Questions in Environmental Biogeochemistry, BioScience, 66, 317–326, https://doi.org/10.1093/biosci/biw005, 2016.
Hurrell, J. W., Holland, M. M., Gent, P. R., Ghan, S., Kay, J. E., Kushner, P. J., Lamarque, J. F., Large, W. G., Lawrence, D., Lindsay, K., Lipscomb, W. H., Long, M. C., Mahowald, N., Marsh, D. R., Neale, R. B., Rasch, P., Vavrus, S., Vertenstein, M., Bader, D., Collins, W. D., Hack, J. J., Kiehl, J., and Marshall, S.: The Community Earth System Model: A Framework for Collaborative Research, B. Am. Meteorol. Soc., 94, 1339–1360, https://doi.org/10.1175/bams-d-12-00121.1, 2013.
Jung, M., Schwalm, C., Migliavacca, M., Walther, S., Camps-Valls, G., Koirala, S., Anthoni, P., Besnard, S., Bodesheim, P., Carvalhais, N., Chevallier, F., Gans, F., Goll, D. S., Haverd, V., Köhler, P., Ichii, K., Jain, A. K., Liu, J., Lombardozzi, D., Nabel, J. E. M. S., Nelson, J. A., O'Sullivan, M., Pallandt, M., Papale, D., Peters, W., Pongratz, J., Rödenbeck, C., Sitch, S., Tramontana, G., Walker, A., Weber, U., and Reichstein, M.: Scaling carbon fluxes from eddy covariance sites to globe: synthesis and evaluation of the FLUXCOM approach, Biogeosciences, 17, 1343–1365, https://doi.org/10.5194/bg-17-1343-2020, 2020.
Keetz, L. T., Lieungh, E., Karimi-Asli, K., Geange, S. R., Gelati, E., Tang, H, Yilmaz, Y. A., Aas, K. S., Althuizen, I. H. J., Bryn, A., Falk, S., Fisher, R., Fouilloux, A., Horvath, P., Indrehus, S., Lee, H., Lombardozzi, D., Parmentier, F.-J. W., Pirk, N., Vandvik, V., Vollsnes, A. V., Skarpaaas, O., Stordal, F., and Tallaksen, L. M.: Climate–ecosystem modelling made easy: The Land Sites Platform, Glob. Change Biol., 29, 4440–4452, https://doi.org/10.1111/gcb.16808, 2023.
Kinkade, D. and Shepherd, A.: Geoscience data publication: Practices and perspectives on enabling the FAIR guiding principles, Geosci. Data J., 9, 177–186, https://doi.org/10.1002/gdj3.120, 2021.
Koven, C. D., Knox, R. G., Fisher, R. A., Chambers, J. Q., Christoffersen, B. O., Davies, S. J., Detto, M., Dietze, M. C., Faybishenko, B., Holm, J., Huang, M., Kovenock, M., Kueppers, L. M., Lemieux, G., Massoud, E., McDowell, N. G., Muller-Landau, H. C., Needham, J. F., Norby, R. J., Powell, T., Rogers, A., Serbin, S. P., Shuman, J. K., Swann, A. L. S., Varadharajan, C., Walker, A. P., Wright, S. J., and Xu, C.: Benchmarking and parameter sensitivity of physiological and vegetation dynamics using the Functionally Assembled Terrestrial Ecosystem Simulator (FATES) at Barro Colorado Island, Panama, Biogeosciences, 17, 3017–3044, https://doi.org/10.5194/bg-17-3017-2020, 2020.
Kyker-Snowman, E., Lombardozzi, D. L., Bonan, G. B., Cheng, S. J., Dukes, J. S., Frey, S. D., Jacobs, E. M., McNellis, R., Rady, J. M., Smith, N. G., Thomas, R. Q., Wieder, W. R., and Grandy, A. S.: Increasing the spatial and temporal impact of ecological research: A roadmap for integrating a novel terrestrial process into an Earth system model, Glob. Change Biol., 28, 665–684, https://doi.org/10.1111/gcb.15894, 2022.
Lawrence, D. M., Fisher, R. A., Koven, C. D., Oleson, K. W., Swenson, S. C., Bonan, G., Collier, N., Ghimire, B., Kampenhout, L., Kennedy, D., Kluzek, E., Lawrence, P. J., Li, F., Li, H., Lombardozzi, D., Riley, W. J., Sacks, W. J., Shi, M., Vertenstein, M., Wieder, W. R., Xu, C., Ali, A. A., Badger, A. M., Bisht, G., Broeke, M., Brunke, M. A., Burns, S. P., Buzan, J., Clark, M., Craig, A., Dahlin, K., Drewniak, B., Fisher, J. B., Flanner, M., Fox, A. M., Gentine, P., Hoffman, F., Keppel-Aleks, G., Knox, R., Kumar, S., Lenaerts, J., Leung, L. R., Lipscomb, W. H., Lu, Y., Pandey, A., Pelletier, J. D., Perket, J., Randerson, J. T., Ricciuto, D. M., Sanderson, B. M., Slater, A., Subin, Z. M., Tang, J., Thomas, R. Q., Val Martin, M., and Zeng, X.: The Community Land Model Version 5: Description of New Features, Benchmarking, and Impact of Forcing Uncertainty, J. Adv. Model. Earth Sy., 11, 4245–4287, https://doi.org/10.1029/2018ms001583, 2019.
LeBauer, D. S., Wang, D., Richter, K. T., Davidson, C. C., and Dietze, M. C.: Facilitating feedbacks between field measurements and ecosystem models, Ecol. Monogr., 83, 133–154, https://doi.org/10.1890/12-0137.1, 2013.
Levis, S., Bonan, G. B., Vertenstein, M., and Oleson, K. W.: The Community Land Model's Dynamic Global Vegetation Model (CLM-DGVM): Technical description and user's guide. NCAR Technical Note NCAR/TN-459+IA., National Center for Atmospheric Research, Boulder, CO., https://doi.org/10.5065/D6P26W36, 2004.
Lewis, A. S. L., Rollinson, C. R., Allyn, A. J., Ashander, J., Brodie, S., Brookson, C. B., Collins, E., Dietze, M. C., Gallinat, A. S., Juvigny-Khenafou, N., Koren, G., McGlinn, D. J., Moustahfid, H., Peters, J. A., Record, N. R., Robbins, C. J., Tonkin, J., and Wardle, G. M.: The power of forecasts to advance ecological theory, Meth. Ecol. Evol., 14, 746–756, https://doi.org/10.1111/2041-210x.13955, 2022.
Li, X., Melaas, E., Carrillo, C. M., Ault, T., Richardson, A. D., Lawrence, P., Friedl, M. A., Seyednasrollah, B., Lawrence, D. M., and Young, A. M.: A Comparison of Land Surface Phenology in the Northern Hemisphere Derived from Satellite Remote Sensing and the Community Land Model, J. Hydrometeorol., 23, 859–873, https://doi.org/10.1175/jhm-d-21-0169.1, 2022.
Lombardozzi, D. L., Bonan, G. B., Smith, N. G., Dukes, J. S., and Fisher, R. A.: Temperature acclimation of photosynthesis and respiration: A key uncertainty in the carbon cycle-climate feedback, Geophys. Res. Lett., 42, 8624–8631, https://doi.org/10.1002/2015GL065934, 2015.
Metzger, S., Ayres, E., Durden, D., Florian, C., Lee, R., Lunch, C., Luo, H., Pingintha-Durden, N., Roberti, J. A., SanClements, M., Sturtevant, C., Xu, K., and Zulueta, R. C.: From NEON Field Sites to Data Portal: A Community Resource for Surface–Atmosphere Research Comes Online, B. Am. Meteorol. Soc., 100, 2305–2325, https://doi.org/10.1175/bams-d-17-0307.1, 2019.
Miles, A., jakirkham, Bussonnier, M., Moore, J., Orfanos, D. P., Fulton, A., Bourbeau, J., Lee, G., Patel, Z., Bennett, D., Rocklin, M., Abernathey, R., Andrade, E. S. d., Durant, M., Schut, V., Dussin, R., Kristensen, M. R. B., Chaudhary, S., Barnes, C., Nunez-Iglesias, J., Williams, B., Mohar, B., Noyes, C., Bell, R., hailiangzhang, shikharsg, Jelenak, A., Sansal, A., and Banihirwe, A.: zarr-developers/zarr-python: v2.13.0 Zenodo [code], https://doi.org/10.5281/zenodo.7104413, 2022.
Moffat, A. M., Papale, D., Reichstein, M., Hollinger, D. Y., Richardson, A. D., Barr, A. G., Beckstein, C., Braswell, B. H., Churkina, G., Desai, A. R., Falge, E., Gove, J. H., Heimann, M., Hui, D., Jarvis, A. J., Kattge, J., Noormets, A., and Stauch, V. J.: Comprehensive comparison of gap-filling techniques for eddy covariance net carbon fluxes, Agr. Forest Meteorol., 147, 209–232, https://doi.org/10.1016/j.agrformet.2007.08.011, 2007.
Moon, M., Richardson, A. D., Milliman, T., and Friedl, M. A.: A high spatial resolution land surface phenology dataset for AmeriFlux and NEON sites, Sci. Data, 9, 448, https://doi.org/10.1038/s41597-022-01570-5, 2022.
Narine, L. L., Popescu, S. C., and Malambo, L.: Using ICESat-2 to Estimate and Map Forest Aboveground Biomass: A First Example, Remote Sens., 12, 1824, https://doi.org/10.3390/rs12111824, 2020.
National Ecological Observatory Network (NEON): Precipitation, Data Product Release, NEON [data set], https://doi.org/10.48443/6wkc-1p05, 2022a.
National Ecological Observatory Network (NEON): Relative Humidity, Data Product Release, NEON [data set], https://doi.org/10.48443/w9nf-k476 2022b.
National Ecological Observatory Network (NEON): Shortwave and longwave radiation (net radiometery), Data Product Release, NEON [data set], https://doi.org/10.48443/stbf-bh38 2022c.
National Ecological Observatory Network (NEON): Barometric pressure, Data Product Release, NEON [data set], https://doi.org/10.48443/zr37-0238 2022d.
National Ecological Observatory Network (NEON): 2D wind speed and direction, Data Product Release, NEON [data set], https://doi.org/10.48443/77n6-eh42 2022e.
National Ecological Observatory Network (NEON): Triple aspirated air temperature, Data Product Release, NEON [data set], https://doi.org/10.48443/q16j-sn13 2022f.
National Ecological Observatory Network (NEON): Forcing height, Data Product Release, NEON [data set], https://doi.org/10.48443/7cqp-3j73 2022g.
National Ecological Observatory Network (NEON): Soil physical and chemical properties, Megapit, Data Product Release, NEON [data set], https://doi.org/10.48443/10dn-8031 2022h.
National Ecological Observatory Network (NEON): Bundled data products – eddy covariance, Data Product Release, NEON [data set], https://doi.org/10.48443/7cqp-3j73, 2022i.
National Ecological Observatory Network (NEON): Photosynthetically active radiation (PAR), Data Product Release, NEON [data set], https://doi.org/10.48443/8a01-0677, 2022j.
National Ecological Observatory Network (NEON): Shortwave radiation (direct and diffuse), Data Product Release, NEON [data set], https://doi.org/10.48443/hv8e-5696, 2022k.
National Ecological Observatory Network (NEON): Soil water content and water salinity, Data Product Release, NEON [data set], https://doi.org/10.48443/ghry-qw46, 2022l.
National Academies of Sciences, Engineering, and Medicine: Next Generation Earth Systems Science at the National Science Foundation, The National Academies Press, Washington, DC, 136 pp., https://doi.org/10.17226/26042, 2022.
NEON (National Ecological Observatory Network): NCAR-NEON gap-filled data, v2, NCAR-NEON [data set], https://doi.org/10.48443/8w20-r938, 2023
Novick, K. A., Biederman, J. A., Desai, A. R., Litvak, M. E., Moore, D. J. P., Scott, R. L., and Torn, M. S.: The AmeriFlux network: A coalition of the willing, Agr. Forest Meteorol., 249, 444–456, https://doi.org/10.1016/j.agrformet.2017.10.009, 2018.
Oleson, K., Lawrence, D., Bonan, G., Drewniak, B., Huang, M., Koven, C., Levis, S., Li, F., Riley, W., and Subin, Z.: Technical description of version 4.0 of the Community Land Model (CLM), NCAR Technical Notes (NCAR/TN-478+STR), https://doi.org/10.5065/D6FB50WZ, 2010.
Oleson, K., Dai, Y., Bonan, G. B., Bosilovichm, M., Dickinson, R. E., Dirmeyer, P., Hoffman, F., Houser, P., Levis, S., Niu, G.-Y., Thornton, P., Vertenstein, M., Z.-L., Y., and Zeng, X.: Technical Description of the Community Land Model (CLM) (No. NCAR/TN-461+STR), University Corporation for Atmospheric Research, https://doi.org/10.5065/D6N877R0, 2004.
Oleson, K., Lawrence, D. M., Bonan, G. B., Drewniak, B., Huang, M., Koven, C. D., Levis, S., Li, F., Riley, W. J., Subin, Z. M., Swenson, S., Thornton, P. E., Bozbiyik, A., Fisher, R., Heald, C. L., Kluzek, E., Lamarque, J. F., Lawrence, P. J., Leung, L. R., Lipscomb, W., Muszala, S. P., Ricciuto, D. M., Sacks, W. J., Sun, Y., Tang, J., and Yang, Z. L.: Technical description of version 4.5 of the Community Land Model (CLM), NCAR Technical Note NCAR/TN-503+STR, https://doi.org/10.5065/D6RR1W7M, 2013.
O'Reilly, C. M., Gougis, R. D., Klug, J. L., Carey, C. C., Richardson, D. C., Bader, N. E., Soule, D. C., Castendyk, D., Meixner T., Stromberg, J., Weathers, K. C., and Hunter, W.: Using large data sets for open-ended inquiry in undergraduate science classrooms, Bioscience, 67, 1052–1061, doi.org/10.1093/biosci/bix118, 2017.
Pastorello, G., Trotta, C., Canfora, E., Chu, H., Christianson, D., Cheah, Y.-W., Poindexter, C., Chen, J., Elbashandy, A., Humphrey, M., Isaac, P., Polidori, D., Reichstein, M., Ribeca, A., van Ingen, C., Vuichard, N., Zhang, L., Amiro, B., Ammann, C., Arain, M. A., Ardö, J., Arkebauer, T., Arndt, S. K., Arriga, N., Aubinet, M., Aurela, M., Baldocchi, D., Barr, A., Beamesderfer, E., Marchesini, L. B., Bergeron, O., Beringer, J., Bernhofer, C., Berveiller, D., Billesbach, D., Black, T. A., Blanken, P. D., Bohrer, G., Boike, J., Bolstad, P. V., Bonal, D., Bonnefond, J.-M., Bowling, D. R., Bracho, R., Brodeur, J., Brümmer, C., Buchmann, N., Burban, B., Burns, S. P., Buysse, P., Cale, P., Cavagna, M., Cellier, P., Chen, S., Chini, I., Christensen, T. R., Cleverly, J., Collalti, A., Consalvo, C., Cook, B. D., Cook, D., Coursolle, C., Cremonese, E., Curtis, P. S., D'Andrea, E., da Rocha, H., Dai, X., Davis, K. J., Cinti, B. D., Grandcourt, A. d., Ligne, A. D., De Oliveira, R. C., Delpierre, N., Desai, A. R., Di Bella, C. M., Tommasi, P. d., Dolman, H., Domingo, F., Dong, G., Dore, S., Duce, P., Dufrêne, E., Dunn, A., Dušek, J., Eamus, D., Eichelmann, U., ElKhidir, H. A. M., Eugster, W., Ewenz, C. M., Ewers, B., Famulari, D., Fares, S., Feigenwinter, I., Feitz, A., Fensholt, R., Filippa, G., Fischer, M., Frank, J., Galvagno, M., Gharun, M., Gianelle, D., Gielen, B., Gioli, B., Gitelson, A., Goded, I., Goeckede, M., Goldstein, A. H., Gough, C. M., Goulden, M. L., Graf, A., Griebel, A., Gruening, C., Grünwald, T., Hammerle, A., Han, S., Han, X., Hansen, B. U., Hanson, C., Hatakka, J., He, Y., Hehn, M., Heinesch, B., Hinko-Najera, N., Hörtnagl, L., Hutley, L., Ibrom, A., Ikawa, H., Jackowicz-Korczynski, M., Janouš, D., Jans, W., Jassal, R., Jiang, S., Kato, T., Khomik, M., Klatt, J., Knohl, A., Knox, S., Kobayashi, H., Koerber, G., Kolle, O., Kosugi, Y., Kotani, A., Kowalski, A., Kruijt, B., Kurbatova, J., Kutsch, W. L., Kwon, H., Launiainen, S., Laurila, T., Law, B., Leuning, R., Li, Y., Liddell, M., Limousin, J.-M., Lion, M., Liska, A. J., Lohila, A., López-Ballesteros, A., López-Blanco, E., Loubet, B., Loustau, D., Lucas-Moffat, A., Lüers, J., Ma, S., Macfarlane, C., Magliulo, V., Maier, R., Mammarella, I., Manca, G., Marcolla, B., Margolis, H. A., Marras, S., Massman, W., Mastepanov, M., Matamala, R., Matthes, J. H., Mazzenga, F., McCaughey, H., McHugh, I., McMillan, A. M. S., Merbold, L., Meyer, W., Meyers, T., Miller, S. D., Minerbi, S., Moderow, U., Monson, R. K., Montagnani, L., Moore, C. E., Moors, E., Moreaux, V., Moureaux, C., Munger, J. W., Nakai, T., Neirynck, J., Nesic, Z., Nicolini, G., Noormets, A., Northwood, M., Nosetto, M., Nouvellon, Y., Novick, K., Oechel, W., Olesen, J. E., Ourcival, J.-M., Papuga, S. A., Parmentier, F.-J., Paul-Limoges, E., Pavelka, M., Peichl, M., Pendall, E., Phillips, R. P., Pilegaard, K., Pirk, N., Posse, G., Powell, T., Prasse, H., Prober, S. M., Rambal, S., Rannik, Ü., Raz-Yaseef, N., Rebmann, C., Reed, D., Dios, V. R. d., Restrepo-Coupe, N., Reverter, B. R., Roland, M., Sabbatini, S., Sachs, T., Saleska, S. R., Sánchez-Cañete, E. P., Sanchez-Mejia, Z. M., Schmid, H. P., Schmidt, M., Schneider, K., Schrader, F., Schroder, I., Scott, R. L., Sedlák, P., Serrano-Ortíz, P., Shao, C., Shi, P., Shironya, I., Siebicke, L., Šigut, L., Silberstein, R., Sirca, C., Spano, D., Steinbrecher, R., Stevens, R. M., Sturtevant, C., Suyker, A., Tagesson, T., Takanashi, S., Tang, Y., Tapper, N., Thom, J., Tomassucci, M., Tuovinen, J.-P., Urbanski, S., Valentini, R., van der Molen, M., van Gorsel, E., van Huissteden, K., Varlagin, A., Verfaillie, J., Vesala, T., Vincke, C., Vitale, D., Vygodskaya, N., Walker, J. P., Walter-Shea, E., Wang, H., Weber, R., Westermann, S., Wille, C., Wofsy, S., Wohlfahrt, G., Wolf, S., Woodgate, W., Li, Y., Zampedri, R., Zhang, J., Zhou, G., Zona, D., Agarwal, D., Biraud, S., Torn, M., and Papale, D.: The FLUXNET2015 dataset and the ONEFlux processing pipeline for eddy covariance data, Sci. Data, 7, 225, https://doi.org/10.1038/s41597-020-0534-3, 2020.
Powers, S. M. and Hampton, S. E.: Open science, reproducibility, and transparency in ecology, Ecol. Appl., 29, e01822, https://doi.org/10.1002/eap.1822, 2019.
Reichstein, M., Falge, E., Baldocchi, D., Papale, D., Aubinet, M., Berbigier, P., Bernhofer, C., Buchmann, N., Gilmanov, T., Granier, A., Grunwald, T., Havrankova, K., Ilvesniemi, H., Janous, D., Knohl, A., Laurila, T., Lohila, A., Loustau, D., Matteucci, G., Meyers, T., Miglietta, F., Ourcival, J.-M., Pumpanen, J., Rambal, S., Rotenberg, E., Sanz, M., Tenhunen, J., Seufert, G., Vaccari, F., Vesala, T., Yakir, D., and Valentini, R.: On the separation of net ecosystem exchange into assimilation and ecosystem respiration: review and improved algorithm, Glob. Change Biol., 11, 1424–1439, https://doi.org/10.1111/j.1365-2486.2005.001002.x, 2005.
Richardson, A. D., Hufkens, K., Milliman, T., Aubrecht, D. M., Chen, M., Gray, J. M., Johnston, M. R., Keenan, T. F., Klosterman, S. T., Kosmala, M., Melaas, E. K., Friedl, M. A., and Frolking, S.: Tracking vegetation phenology across diverse North American biomes using PhenoCam imagery, Sci. Data, 5, 180028, https://doi.org/10.1038/sdata.2018.28, 2018.
Richardson, L. F.: Weather prediction by numerical process, Cambridge University Press, Cambridge, https://doi.org/10.1017/CBO9780511618291, 1922.
Shepherd, A., Jones, M. B., Richard, S., Jarboe, N., Vieglais, D., Fils, D., Duerr, R., Verhey, C., Minch, M., Mecum, B., and Bentley, N.: Science-on-Schema.org v1.3.0, Zenodo [data set], https://doi.org/10.5281/zenodo.6502539, 2022.
Sobhani, N., Wieder, W., and King, T.: negin513/neon_scripts: v1.0.1-alpha (v1.0.1-alpha), Zenodo [code], https://doi.org/10.5281/zenodo.7641892, 2023.
Starkenburg, D., Metzger, S., Fochesatto, G. J., Alfieri, J. G., Gens, R., Prakash, A., and Cristóbal, J.: Assessment of Despiking Methods for Turbulence Data in Micrometeorology, J. Atmos. Ocean. Tech., 33, 2001–2013, https://doi.org/10.1175/jtech-d-15-0154.1, 2016.
Stöckli, R., Lawrence, D. M., Niu, G. Y., Oleson, K. W., Thornton, P. E., Yang, Z. L., Bonan, G. B., Denning, A. S., and Running, S. W.: Use of FLUXNET in the Community Land Model development, J. Geophys. Res.-Biogeo., 113, G01025, https://doi.org/10.1029/2007jg000562, 2008.
Swann, A. L. S., Laguë, M. M., Garcia, E. S., Field, J. P., Breshears, D. D., Moore, D. J. P., Saleska, S. R., Stark, S. C., Villegas, J. C., Law, D. J., and Minor, D. M.: Continental-scale consequences of tree die-offs in North America: identifying where forest loss matters most, Environ. Res. Lett., 13, 055014, https://doi.org/10.1088/1748-9326/aaba0f, 2018.
Swenson, S. C., Clark, M., Fan, Y., Lawrence, D. M., and Perket, J.: Representing Intra-Hillslope Lateral Subsurface Flow in the Community Land Model, J. Adv. Model. Earth Sy., 11, 4044–4065, https://doi.org/10.1029/2019ms001833, 2019.
van der Horst, S. V. J., Pitman, A. J., De Kauwe, M. G., Ukkola, A., Abramowitz, G., and Isaac, P.: How representative are FLUXNET measurements of surface fluxes during temperature extremes?, Biogeosciences, 16, 1829–1844, https://doi.org/10.5194/bg-16-1829-2019, 2019.
Wieder, W. R., Knowles, J. F., Blanken, P. D., Swenson, S. C., and Suding, K. N.: Ecosystem function in complex mountain terrain: Combining models and long-term observations to advance process-based understanding, J. Geophys. Res.-Biogeo., 122, 825–845, https://doi.org/10.1002/2016jg003704, 2017.
Wieder, W. R., Lombardozzi, D. L., Sobhani, N., Bonan, G. B., Durden, D., Lenz, D., and SanClements, M.: NCAR-NEON system, Version 2.0, UCAR/NCAR – GDEX [data set], https://doi.org/10.5065/tmmj-sj66, 2023.
Wilkinson, M. D., Dumontier, M., Aalbersberg, I. J., Appleton, G., Axton, M., Baak, A., Blomberg, N., Boiten, J.-W., da Silva Santos, L. B., Bourne, P. E., Bouwman, J., Brookes, A. J., Clark, T., Crosas, M., Dillo, I., Dumon, O., Edmunds, S., Evelo, C. T., Finkers, R., Gonzalez-Beltran, A., Gray, A. J. G., Groth, P., Goble, C., Grethe, J. S., Heringa, J., 't Hoen, P. A. C., Hooft, R., Kuhn, T., Kok, R., Kok, J., Lusher, S. J., Martone, M. E., Mons, A., Packer, A. L., Persson, B., Rocca-Serra, P., Roos, M., van Schaik, R., Sansone, S.-A., Schultes, E., Sengstag, T., Slater, T., Strawn, G., Swertz, M. A., Thompson, M., van der Lei, J., van Mulligen, E., Velterop, J., Waagmeester, A., Wittenburg, P., Wolstencroft, K., Zhao, J., and Mons, B.: The FAIR Guiding Principles for scientific data management and stewardship, Sci. Data, 3, 160018, https://doi.org/10.1038/sdata.2016.18, 2016.
Wozniak, M. C., Bonan, G. B., Keppel-Aleks, G., and Steiner, A. L.: Influence of Vertical Heterogeneities in the Canopy Microenvironment on Interannual Variability of Carbon Uptake in Temperate Deciduous Forests, J. Geophys. Res.-Biogeo., 125, e2020JG005658, https://doi.org/10.1029/2020jg005658, 2020.
Wutzler, T., Lucas-Moffat, A., Migliavacca, M., Knauer, J., Sickel, K., Šigut, L., Menzer, O., and Reichstein, M.: Basic and extensible post-processing of eddy covariance flux data with REddyProc, Biogeosciences, 15, 5015–5030, https://doi.org/10.5194/bg-15-5015-2018, 2018.