the Creative Commons Attribution 4.0 License.
the Creative Commons Attribution 4.0 License.
 | 20 Oct 2023
Evaluation of vertically resolved longwave radiation in SPARTACUS-Urban 0.7.3 and the sensitivity to urban surface temperatures
Megan A. Stretton
William Morrison
Robin J. Hogan
Sue Grimmond
Cities' materials and urban form impact radiative exchanges and surface and air temperatures. Here, the SPARTACUS (Speedy Algorithm for Radiative Transfer through Cloud Sides) multi-layer approach to modelling longwave radiation in urban areas (SPARTACUS-Urban) is evaluated using the explicit DART (Discrete Anisotropic Radiative Transfer) model. SPARTACUS-Urban describes realistic 3D urban geometry statistically rather than assuming an infinite street canyon. Longwave flux profiles are compared across an August day for a 2 km × 2 km domain in central London. Simulations are conducted with multiple temperature configurations, including realistic temperature profiles derived from thermal camera observations. The SPARTACUS-Urban model performs well (cf. DART, 2022) when all facets are prescribed a single temperature, with normalised bias errors (nBEs) <2.5 % for downwelling fluxes, and <0.5 % for top-of-canopy upwelling fluxes. Errors are larger (nBE <8 %) for net longwave fluxes from walls and roofs. Using more realistic surface temperatures, varying depending on surface shading, the nBE in upwelling longwave increases to ∼2 %. Errors in roof and wall net longwave fluxes increase through the day, but nBEs are still 8 %–11 %. This increase in nBE occurs because SPARTACUS-Urban represents vertical but not horizontal surface temperature variation within a domain. Additionally, SPARTACUS-Urban outperforms the Harman single-layer canyon approach, particularly in the longwave interception by roofs. We conclude that SPARTACUS-Urban accurately predicts longwave fluxes, requiring less computational time (cf. DART, 2022) but with larger errors when surface temperatures vary due to shading. SPARTACUS-Urban could enhance multi-layer urban energy balance scheme prediction of within-canopy temperatures and fluxes.
- Article
(4516 KB) - Full-text XML
-
Supplement
(1776 KB) - BibTeX
- EndNote


The differences in energy exchanges between urban and rural areas leads to canopy layer air temperature differences of 3–10 ∘C (Oke, 1987). This phenomenon, known as the canopy layer urban heat island effect (CL-UHI), has been studied and observed worldwide (Oke, 1982; Zhang et al., 2012; Wu et al., 2014; Guo et al., 2016; Dou and Miao, 2017; Gaitani et al., 2017). The CL-UHI is driven by contrasting energy exchanges between urban and rural environments, resulting from the heterogeneous nature of cities (Aida and Gotoh, 1982; Oke, 1982; Kondo et al., 2001; Harman and Belcher, 2006; Ao et al., 2016). With increasing urbanisation, and more people residing in cities than rural areas globally since 2007 (Heaviside et al., 2017), there is greater exposure of vulnerable people to extreme weather, such as heatwaves, with the severity of such events potentially exacerbated by the CL-UHI.
The heterogenous 3D structures of urban areas lead to changes in the surface energy balance and diurnal temperatures (Souch and Grimmond, 2006; Masson et al., 2008) due to the resultant differential shortwave (SW) input and radiative cooling across a city. The crenulated urban morphology and resultant deep canyons cause an uneven exposure to the sky and an increased surface area available for exchange (cf. rural areas), which increases the SW absorption throughout the day. This differential solar irradiance drives temperature variations between facets, including vertical gradients (Oke, 1981; Blankenstein and Kuttler, 2004; Harman and Belcher, 2006; Hénon et al., 2012; Hu and Wendel, 2019).
The spatial variation in facet temperatures is highest during the daytime due to variations in the absorption and reflection of the dynamic solar radiation (Myint et al., 2013; Crum and Jenerette, 2017; Antoniou et al., 2019). However, temperatures remain high overnight from the morphology reducing exposure to the sky and therefore increasing radiative trapping and slowing cooling rates and lowering effective albedo. Facet materials (e.g. concrete, tarmac) can have low albedo, high heat capacities, and high thermal inertia (Bohnenstengel et al., 2011). This results in large daytime heat storage in the urban volume, which is released slowly at night (Meyn and Oke, 2009; Kershaw and Millward, 2012).
These impacts on the radiative and other energy exchanges need to be parameterised within numerical weather prediction (NWP) land surface schemes (Masson, 2006). A common approach to simplifying the 3D structure of cities is to treat the urban form as a single canyon between buildings of equal height (Nunez and Oke, 1977). Initially, in some standalone models, some complexity was considered, e.g. allowing intersections (e.g. Aida, 1982; Arnfield, 1982, 1988), when modelling urban radiative exchanges. But, with NWP computer resource limitations an infinite canyon was assumed, simplifying view factor geometry and computations (e.g. Masson, 2000; Harman et al., 2004); this is an approach which has been adopted for other energy balance fluxes (e.g. Masson, 2000; Kusaka et al., 2001; Lee and Park, 2008). Many of these models calculate the fluxes for individual facets (wall, roof, and ground) (Masson, 2006). However, assuming a constant building height and lack of intersections neglects the variability in urban geometry (e.g. clusters of tall buildings, courtyards) that influence shadowing and trapping of radiation and wind fields (e.g. Hertwig et al., 2019, 2021).
Sub-facet differences (e.g. roof orientation, slopes, high and/or low parts of walls, wall orientation, sunlit/shaded pavement) can create surface temperature variability, which is not captured if represented by a single mean surface temperature in an urban energy balance scheme (Hilland and Voogt, 2020). For example, diurnal variations in wall temperature are linked to their orientation relative to the sun, and additionally to inter-building interactions (e.g. shadows) (Nazarian and Kleissl, 2015; Antoniou et al., 2019). This is important as 12 %–50 % of the urban surface is comprised of walls (Voogt et al., 1997; Grimmond and Oke, 1999; Hénon et al., 2012). Similarly, roofs differ from walls, with high-incident SW radiation (Harman and Belcher, 2006; Morrison et al., 2018), while ground surfaces in deep urban canyons may have dampened diurnal temperature variability (Hu and Wendel, 2019). Inclusion of the vertical variability in the urban form may allow such features to be captured by models, unlike within the infinite homogenous canyon approach.
Some of these features can be addressed by utilising multi-layer radiative transfer models, allowing more nuanced radiative trapping and realistic vertical temperature distributions (e.g. the Seoul National University Canopy Model (Ryu and Baik, 2012; Ryu et al., 2013), building effect parameterisation (BEP; Martilli et al., 2002; Schubert et al., 2012), the Town Energy Balance model (TEB; Hamdi and Masson, 2008), and SPARTACUS-Urban (Hogan, 2019b)). Most assume a canyon geometry, those with varying building heights permitting more realistic inter-building shading (e.g. Schubert et al., 2012). SPARTACUS-Urban assumes buildings are distributed randomly in the horizontal plane, with geometry describable by vertical profiles of building plan area and building edge length, allowing radiative exchange simulations fast enough for NWP accounting for atmospheric absorption, emission, and scattering between buildings. The approach provides a more accurate description of radiation exchange than single-layer street canyon approaches (Hogan, 2019a). The SW simulations for realistic urban domains have good agreement with an explicit radiative transfer model (Stretton et al., 2022b).
In this study, the longwave (LW) capabilities are evaluated for the first time. SPARTACUS-Urban's performance is compared to both the explicit scheme DART (Discrete Anisotropic Radiative Transfer; Gastellu-Etchegorry et al., 2015) and to a common approach used in operational NWP and climate modelling (Harman et al., 2004) (Sect. 2). To examine SPARTACUS-Urban's LW fluxes we simulate an area in central London, with facet temperatures available from thermal camera observations (Morrison et al., 2020, 2021) that can be prescribed with varying levels of complexity for the evaluation (Sect. 3). A comparison of SPARTACUS-Urban with DART (Sect. 4) and with Harman et al. (2004) street canyon radiation (Sect. 5) is made, with the conclusions presented in Sect. 6.
2.1 SPARTACUS-Urban
The SPARTACUS approach, developed to model radiative exchange within cloud fields (Hogan et al., 2016), has been applied to both vegetated (Hogan et al., 2018) and built areas (Hogan, 2019b). Obstacles to radiation are assumed to be randomly distributed within the horizontal plane, allowing simulation of a mean radiation field with height. We use SPARTACUS-Surface open-source software (Hogan, 2021) which includes both SPARTACUS-Urban and SPARTACUS-Vegetation. Given our building focus (i.e. excluding urban vegetation), we refer to this as SPARTACUS-Urban. Previously, we used DART to evaluate SPARTACUS-Urban SW for multiple urban geometry configurations (Stretton et al., 2022b).
A discrete-ordinate method is used to solve coupled ordinary–differential equations for 2N radiation streams (N streams per hemisphere; here N=8). Radiative fluxes are calculated per height interval, z, for layers split into clear-air and building “regions” in the horizontal plane. The incoming and outgoing fluxes (W m−2) and absorption (W m−3) profiles are calculated for three facets (wall, roof, and ground). SPARTACUS-Urban characterises each model grid cell simulated using its morphology, emissivity (ε), and surface temperature (T). For morphology the plan area fraction (λp) and building edge length (L) are required as a vertical profile that varies with height (z). These, like other morphology parameters, can be derived from building footprint data (Martilli, 2009; Kent et al., 2019; Stretton et al., 2022b). SPARTACUS-Urban allows vertical variation in facet temperatures to be prescribed with one facet T per height level.
Although we assume a vacuum, SPARTACUS-Urban can account for atmospheric absorption. For this paper, we assume a wavelength of 10 µm (where atmospheric absorption is weak), so the emission rate in SPARTACUS-Urban (and DART) makes use of the Plank function at 10 µm, with a top-of-canopy downwelling longwave spectral flux at that wavelength (LW↓).
2.2 DART
The DART (Discrete Anisotropic Radiative Transfer) model (Gastellu-Etchegorry et al., 2015) can simulate variability in radiative exchanges across one SPARTACUS-Urban grid cell in detail using a 3D digital surface model (DSM) with vegetation, buildings, and atmosphere. Each voxel (or grid box) size has a user-prescribed resolution. The model domain's elements (e.g. vegetation, buildings) within a voxel can interact with each other. The per-voxel radiative budget products are stored after each numerical iteration. DART scene elements are often represented by flat “triangles” making up building walls and roofs or leaves on trees. Each triangle has an area, orientation, and optical properties. Alternatively, DART can represent vegetation as “turbid media” (or volumes filled with randomly distributed infinitely small facets) characterised by an angular distribution and an area volume density.
To model the urban LW field in DART, both a 3D building model and a 3D field of surface temperatures are required. The latter can be prescribed based on solar irradiance state (e.g. currently sunlit, shaded). Here, each building's triangles are categorised based on facet type (e.g. roof, wall) and orientation (e.g. west, east) to allow realistic spatial values. As a triangle can have only one temperature, if a triangle covers a whole wall (i.e. vertical building facet), there is no vertical variation.
Given DART is an explicit radiative transfer model, it has more detailed radiative interactions than the simpler radiative transfer models (e.g. SPARTACUS, Harman). DART has been evaluated in vegetated areas using thermal infrared observations (Sobrino et al., 2011) and relative to other models in the RAMI (Radiation transfer Model Intercomparison) project (Widlowski et al., 2015). The DART version including buildings (Gastellu-Etchegorry et al., 2015) has not been explicitly evaluated in urban areas but has been used to assess urban SW and LW radiation and albedo (Chrysoulakis et al., 2018; Landier et al., 2018), variations in urban surface temperatures (Morrison et al., 2020, 2021), and mean radiant temperature (Dissegna et al., 2021) and to assess simpler radiative transfer models (e.g. SPARTACUS-Urban; Stretton et al., 2022b).
2.3 Single-layer street canyon approach (Harman)
Harman et al. (2004) use a system of linear equations to compute the exact LW radiative transfer from one temperature per facet (e.g. one for walls). Hogan (2019b), after modifying Harman's horizontal geometry to have an exponential distribution to be consistent with SPARTACUS's assumptions, finds agreement between the two models for the net outward LW flux from the ground and walls when SPARTACUS uses more than four streams. Here, the SPARTACUS-Surface software package (see Sect. 4.2 of Hogan, 2019b) implementation of Harman is used for the simulations.
Harman assumes two parallel buildings of infinite length with constant height (H) separated by a constant street width (W). For this comparison, the real-world domain (Sect. 3.1) total area of the ground, walls, and roofs (i.e. building fraction at the surface (λp(z=0)) and mean building height () are used. is calculated using Hertwig et al. (2020, their Eq. 3):
where the frontal area index (λf) is calculated from the total normalised wall area (λw=λfπ) using the vertical profile of normalised building edge length (L) derived the from vertical profile:
All Harman simulations have only one temperature (i.e. not a profile) per facet (i.e. wall, roof, ground).
3.1 Model domain
The evaluation is undertaken for a 2 km × 2 km area in central London, with residential and commercial buildings of varying horizontal extent and height (Fig. 1a). The DSM and digital elevation model (DEM) are derived from “Virtual London” building footprint dataset (Evans et al., 2006). To simplify buildings so they have both flat roofs and flat walls, for each building the 25th percentile of the DEM and the 75th percentile of the DSM heights are used. For DART, the resulting 3D building roof DSM and ground DEM are used. The Stretton et al. (2022b) 3D building model is improved slightly (e.g. shift in vertical plane, the removal of some internal walls). The DART voxel resolution used is 1 m vertically and 5.206 m horizontally. For SPARTACUS-Urban the same vertical resolution as DART (1 m) is used. To remove internal walls between buildings, the SPARTACUS-Urban vertical profiles of λp and L are derived from a 1 m × 1 m building footprint raster.
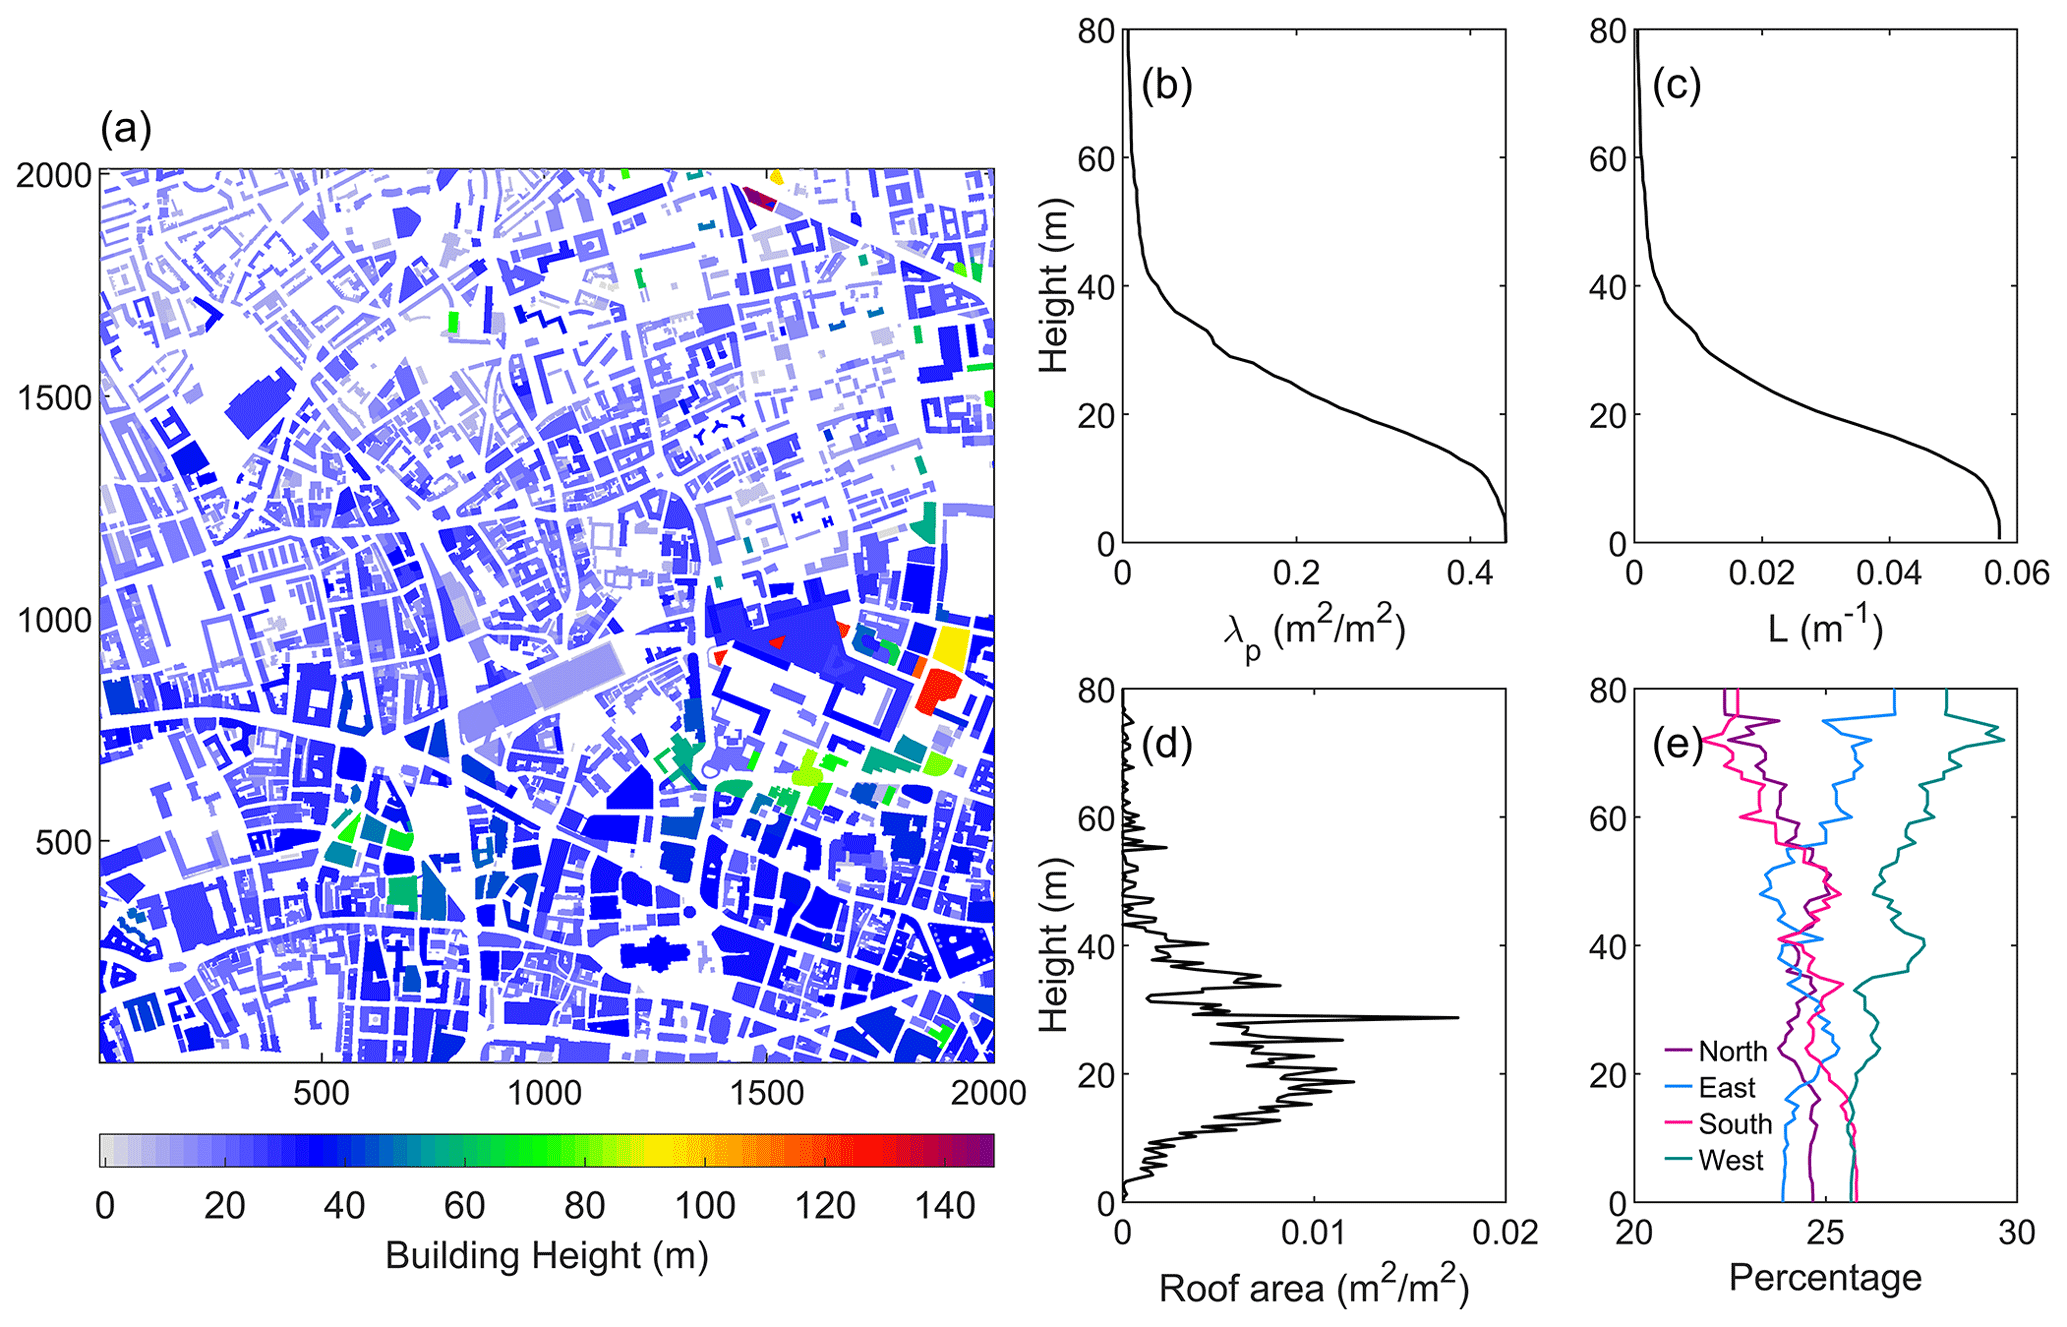
Figure 1Low level of detail (LOD) for the central London domain (i.e. flat roofs): (a) building heights, (b) building plan area fraction (λp) with height, (c) normalised building edge length (L) with height (Eq. 2), (d) roof area with height, and (e) wall orientation distributions calculated from surface-classified DART emission output.
3.2 Observations used for radiative transfer inputs
In the model domain, three observation sites are present (Table 1). We focus on a day (27 August 2017) with detailed surface temperature observations and almost clear skies (<45 min cloud mid-afternoon) (Morrison et al., 2020).
Given computational constraints, DART is run for a single wavelength (10 µm). We choose 10 µm, as it is approximately central to the LW infrared band; hence some additional uncertainty arises in SPARTACUS-Urban results for other wavelengths. So, broadband longwave flux measurements cannot be used. Instead, we rerun the ECMWF atmospheric radiation scheme using pressure, temperature, and humidity profiles for the ERA5 0.25∘ grid cell that the site is located in (Hersbach et al., 2020) for that day (Fig. 2) and extract the bottom-of-atmosphere (BOA) clear-sky downwelling spectral flux at 10 µm. For the SPARTACUS-Urban and Harman et al. (2004) simulations, SPARTACUS-Surface is modified to calculate the single spectral wavelength emission. SPARTACUS-Surface requires TAir, but as we simulate radiative fluxes in a vacuum, it is set to 0 K. Each model requires an emissivity (ε) per surface. We assume a homogenous value of 0.93, based on the mean urban value in the Kotthaus et al. (2014) spectral library.
Facet surface temperatures are prescribed using thermal camera imagery (Optris PI-160 LW infrared cameras) observed for a 420 m × 420 m area within this domain (Morrison et al., 2020, 2021) (Fig. 3). Detailed modelling has categorised these observations by facet type, sunlit/shaded, and orientation (Morrison et al., 2020, 2021). Surface temperatures are split into roof, ground, and cardinal wall orientation (etc.) types. Although we evaluate SPARTACUS-Urban across the whole day, to demonstrate the performance for multiple surface temperature configurations, we select times with distinct temperature profiles (e.g. just after sunrise, with no facet temperature range) and summarise the general model performance. As surface temperature processing constraints (Morrison et al., 2020) give observations from 05:45 (sunrise: 05:04), the models are run for every hour from then to the end of the day. The mid-afternoon cloud period is discarded, as no sunlit/shaded temperature range is observed (Fig. 3).
Table 1Sensors used from within the domain (Fig. 1a). Meteorological time series and further details of observations within this domain can be found in Morrison et al. (2021).
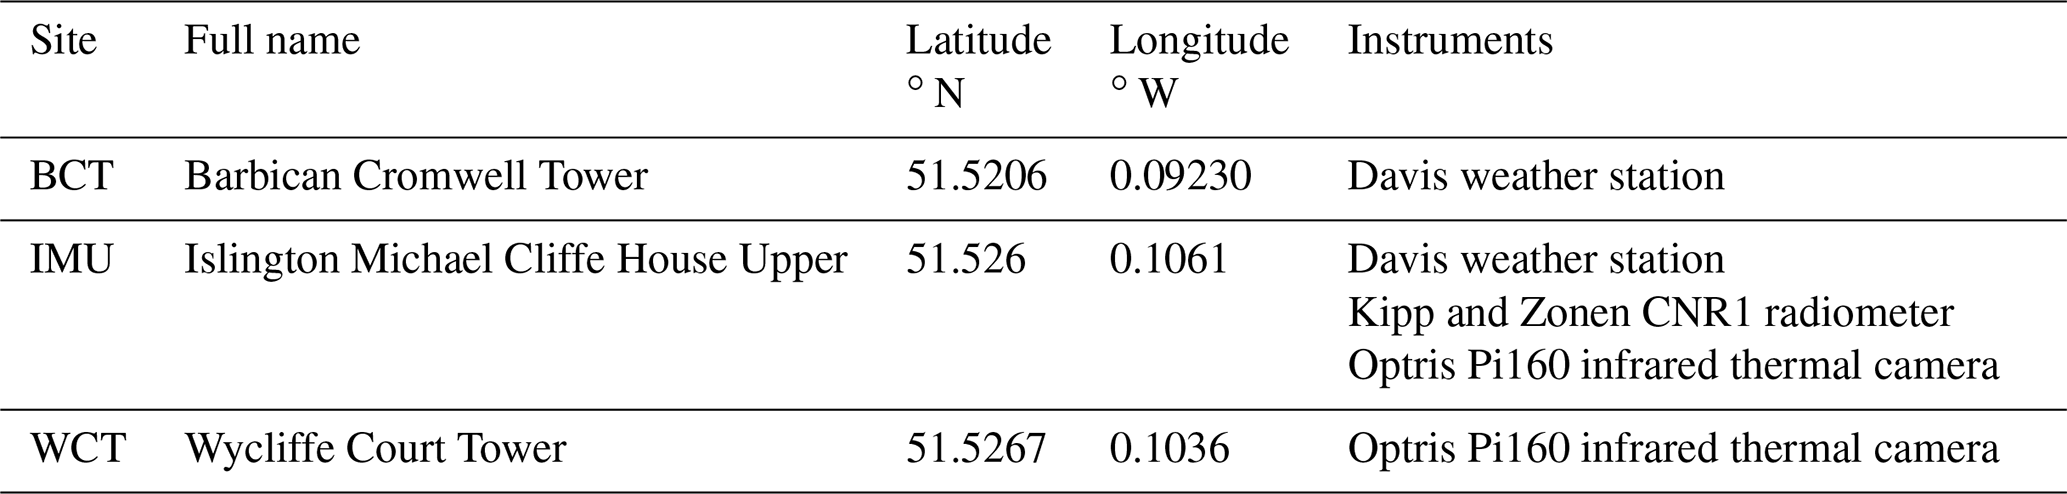
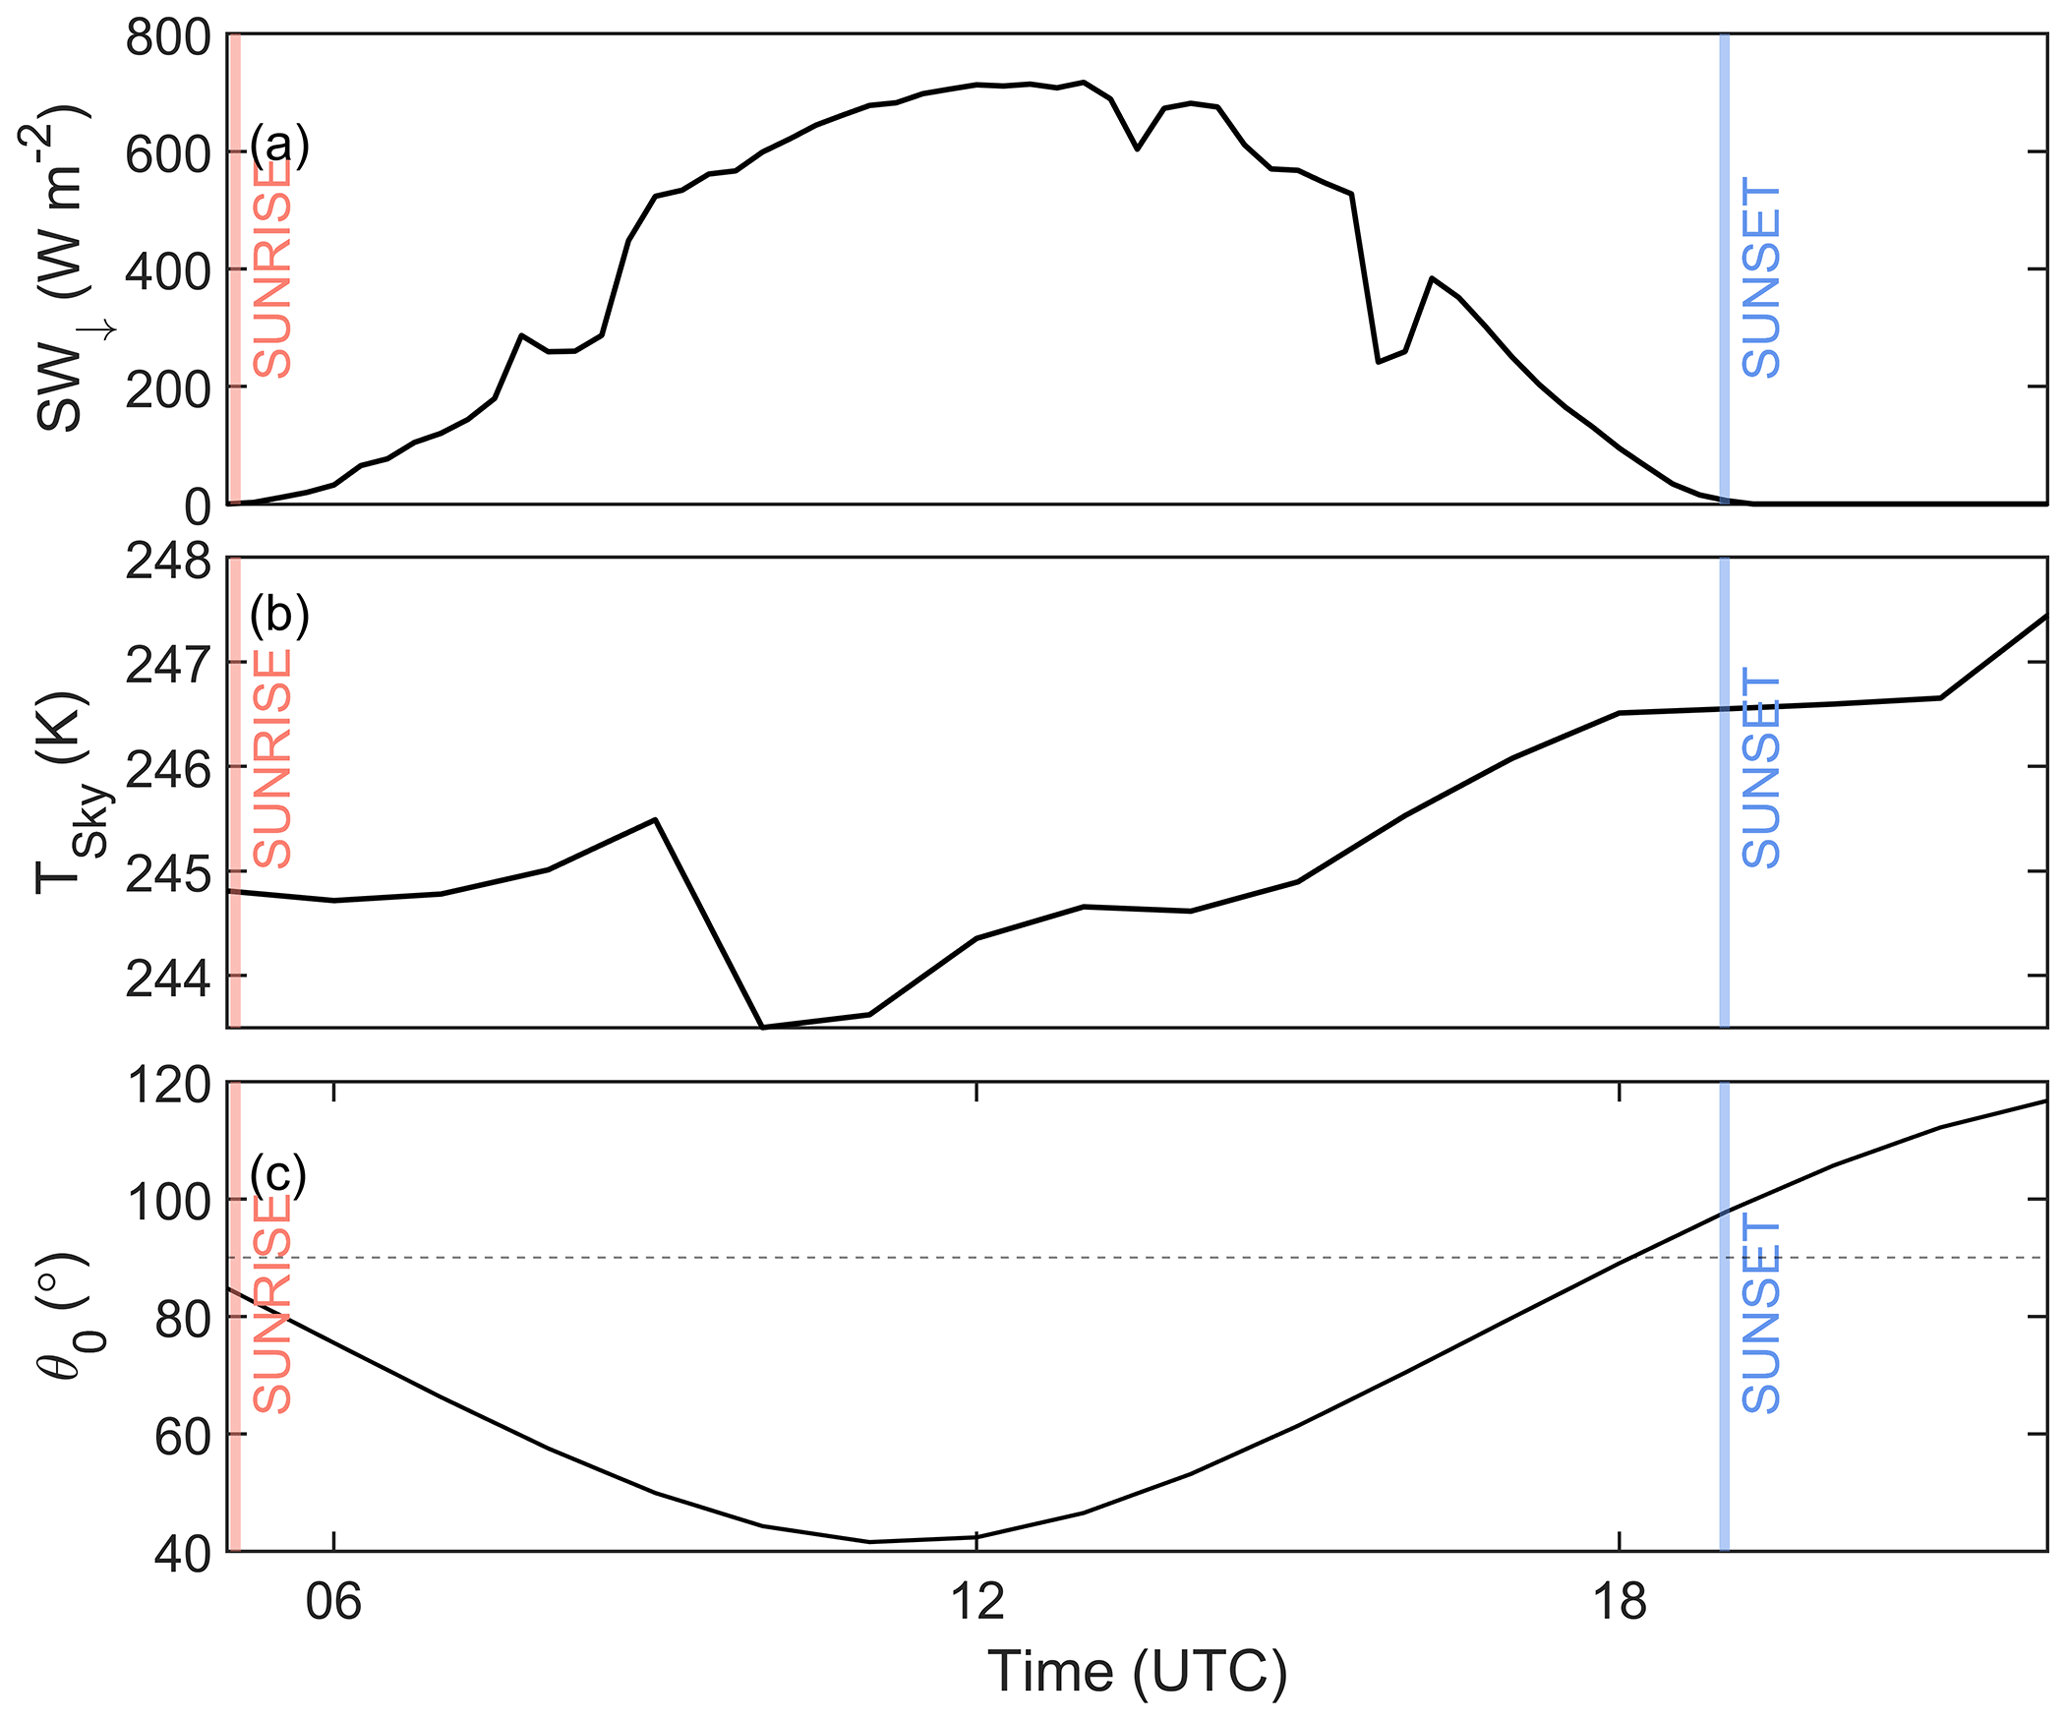
Figure 2Diurnal time series for 27 August 2017 of (a) downwelling shortwave radiation (SW↓) observed using a Kipp and Zonen CNR1 radiometer located at IMU, (b) clear-sky 10 µm brightness temperatures calculated from ERA5, and (c) solar zenith angle (θ0). Additional meteorological observations for the day of interest are shown in Morrison et al. (2021).
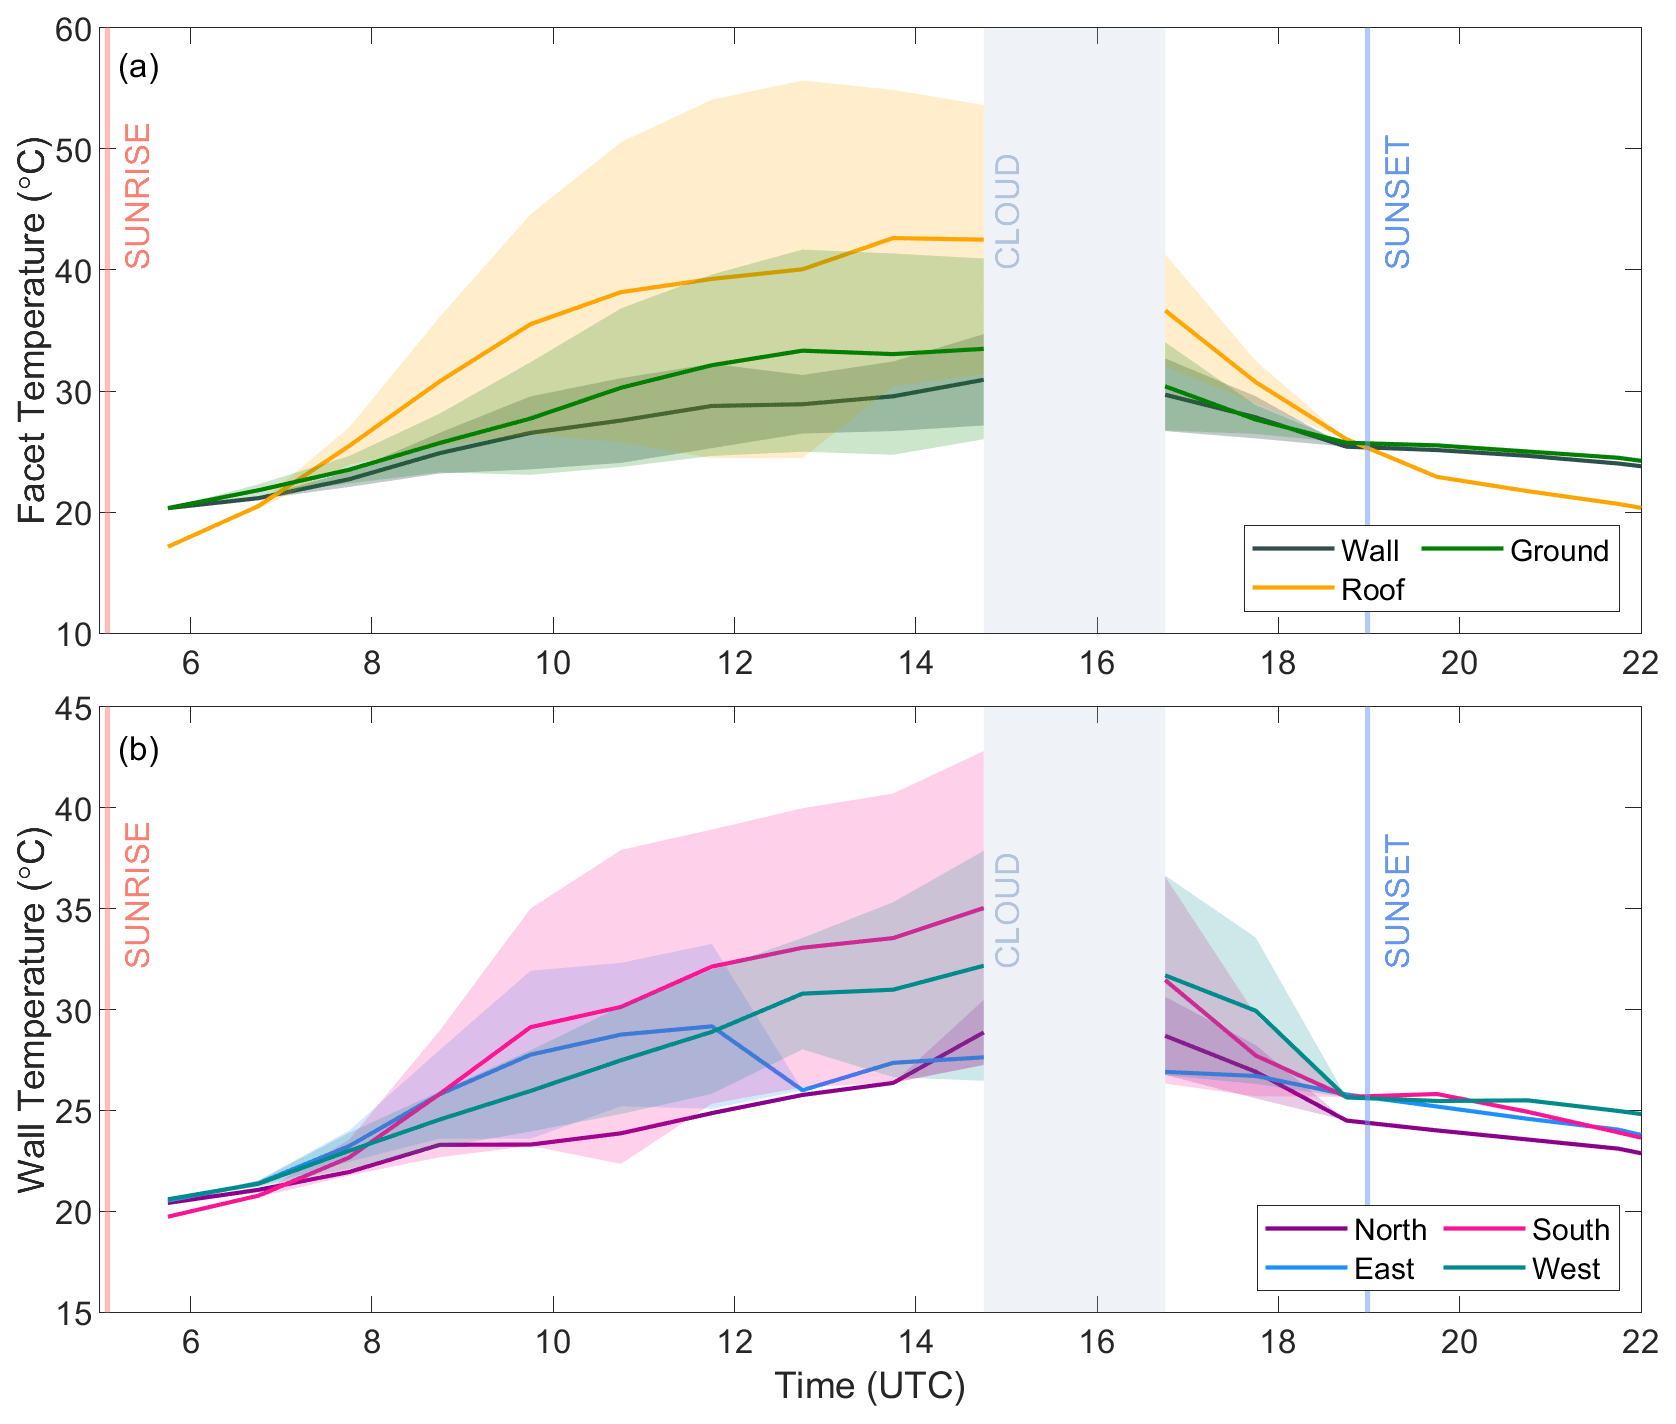
Figure 3Observed mean (line) and range (shading, between sunlit to shaded areas) surface temperature on 27 August 2017 (Morrison et al., 2021) for each (a) facet type (walls – all weighted equally) and (b) wall azimuthal orientation.
3.3 Model surface temperature (T) prescription
The three radiative transfer models (Sect. 2) require different T inputs. To assess the sources of error between SPARTACUS-Urban and DART (i.e. radiation calculation or surface temperature values), two complexities of model runs are undertaken.
First, simulations assume an isothermal temperature within each surface type, with DART surfaces prescribed the single mean T from the camera observations (Fig. 3a, line). To match this, SPARTACUS-Urban roofs and ground are prescribed the mean DART input temperature. For SPARTACUS-Urban TWall, each wall orientation is weighted equally (Fig. S1 in the Supplement), following the SPARTACUS-Urban assumption that walls equally face in all directions, such that
where is one of the four cardinal directions. For Harman, the same temperatures as SPARTACUS-Urban are used.
Non-isothermal surface temperatures varying by sunlit–shaded status allow for horizontal and vertical differences by facet type. These can be represented in multi-layer energy exchange schemes. A temperature range can be prescribed in DART allowing sunlit–shaded variations. However, given the level of detail of the surface model used (Fig. 1), the observed surface temperatures are not directly usable as camera pixels have much higher resolution than the DART triangles. DART SW simulations are used to determine whether each facet triangle is sunlit or shaded and therefore which temperature (maximum/minimum) range (Fig. 3) is assigned by type (e.g. roof, west-facing wall, east-facing wall). As noted, DART triangles may have whole-wall resolution but only one prescribed temperature.
As it is complex to extract the vertical profile of temperature for each surface type from DART, solar-zenith-angle-(θ0)-dependent SW SPARTACUS-Urban simulations are used to estimate the sunlit fraction for the walls () and roofs () by height interval and for the ground (FSun,Ground). The shaded fractions are obtained by difference (. The appropriate DART sunlit (shaded) temperatures are assigned to the SPARTACUS-Urban sunlit (shaded) fraction. Similarly, the sunlit and shaded roof temperatures (TSun,Roof, TSh,Roof) are weighted at each height by the appropriate sunlit and shaded fractions to obtain TRoof,i and at z=0 for the ground (TGround,sun, TGround,sh), thus enabling SPARTACUS-Urban to capture the horizontal surface temperature variations.
As the four wall orientations have different temperatures depending on their shadow history (Morrison et al., 2021), for SPARTACUS-Urban we weight them to obtain one average sunlit and shaded wall temperature (TWall,sun, TWall,sh). Given the SPARTACUS-Urban assumption that walls face equally in all directions, we weight the sunlit and shaded temperatures (as Eq. 3) but use the solar azimuth angle (Ω) to determine the “dominant” sunlit wall orientation. The dominant sunlight-facing surface (e.g. south) temperature (in this example, TSun,South) is double-weighted in Eq. (3) (i.e. replacing TSun,North) assuming the wall's 180∘ away (i.e. north-facing surfaces in example) are shaded. The opposite is done for the TSh,Wall, obtaining (for this example)
The TWall,sh and TWall,sun are weighted using and to determine the TWall,i for each height:
To visualise this at several times, see Fig. S1. Combining and gives a larger weight to warmer sunlit surface temperatures in the simulations, better matching the emission from the DART model scenes.
For the Harman et al. (2004) simulations, area-weighted surface temperatures from the SPARTACUS-Urban profiles are used:
where λWall,i is the exposed wall area at each height, normalised by total wall area (λW). Equation (7) is also applied to roofs. This ensures that warmer surfaces at the top of the canopy with small areas are not overweighted.
3.4 Evaluation metrics
We evaluate SPARTACUS-Urban using DART by comparing the profiles of LW upwelling and downwelling clear-air spectral fluxes (LW↑, LW↓) and the intercepted, outgoing, and net (= incoming − outgoing, relevant for facet temperature evolution) flux into walls, roofs, and ground (i.e. LWIn,Wall, LWOut,Wall, LW*Wall). The LW clear-air fluxes have units of for the entire horizontal scene, while the fluxes from walls and roofs have units of , as we divide the absorption per layer by the layer thickness (1 m) to obtain a resolution-independent flux.
For the comparison between SPARTACUS-Urban and DART, we examine the downwelling longwave radiation at the base of the canopy and the upwelling longwave radiation at the top of the canopy in DART (Hmax) to obtain a normalised bias error. The LW↑ flux profiles are evaluated using the normalised bias error (nBE) at a specified height, expressed as a percentage of the DART flux:
We compare the differences in the wall and roof fluxes between the two models using a nBE in the total interception, emission, and net LW flux, calculated from 1 m to Hmax.
4.1 Prescribed surface temperatures
The and are calculated from SPARTACUS-Urban SW simulations for each time period (Fig. 4). The sunlit fraction in the canopy increases as solar zenith angle (θ0) decreases until about 11:45 (Fig. 2). As more walls become illuminated within the canopy, there is an increase in TWall (Figs. 3, 4). As θ0 increases again (Fig. 2c), the within-canopy surfaces become more shaded than sunlit.
From combining the FSh and FSun profiles with the DART prescribed facet T (Eqs. 4–6), the TWall and TRoof profiles are obtained (Fig. 5). At 05:45, all DART temperatures are the same, so all temperature configurations and SPARTACUS-Urban temperatures are equal. At 07:45, the first vertical variations in temperature occur with sunlit roof facets higher in the canopy causing warmer temperatures above. Both 11:45 and 13:45 share similar TWall profiles and do not have much influence from the warmer south-facing walls despite their greater weighting. The most different TRoof profile, spanning the widest temperature range, occurs at 17:45.
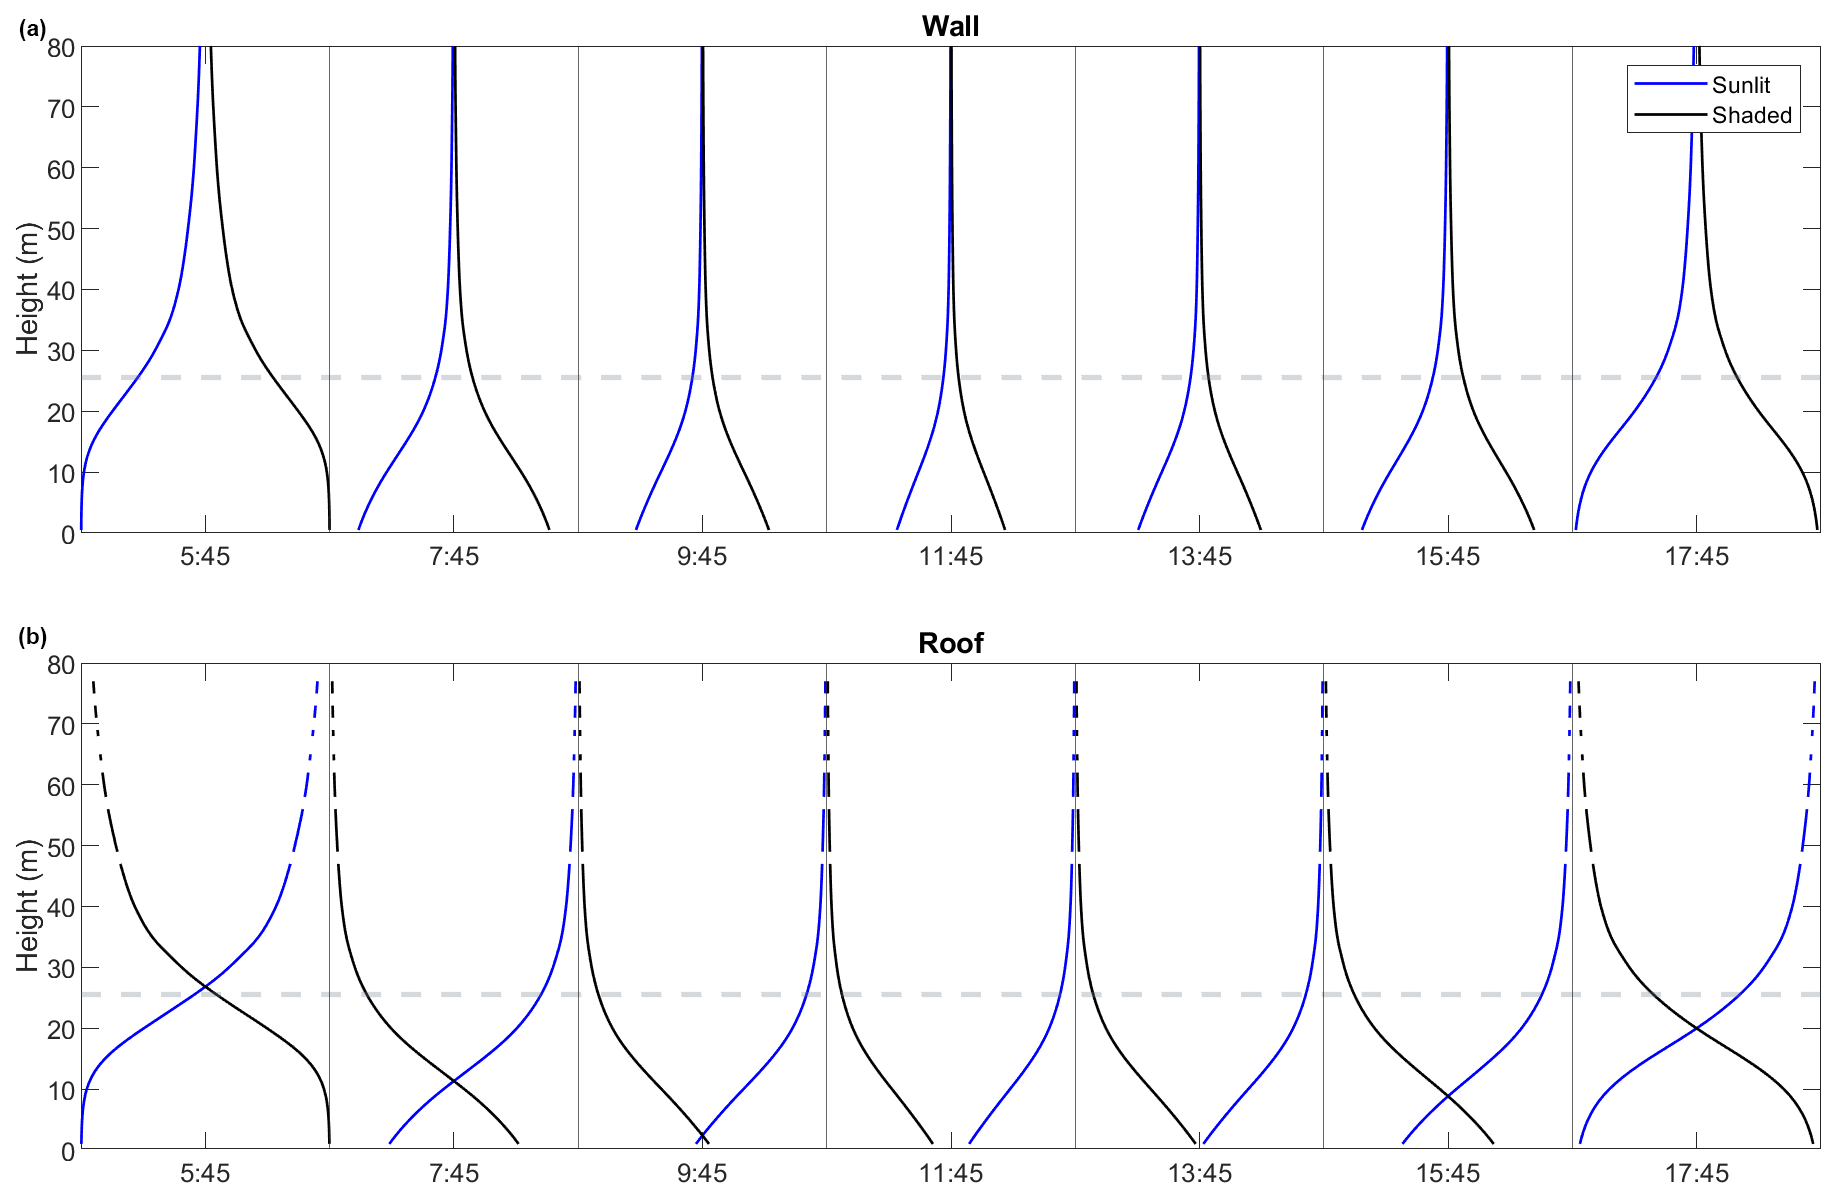
Figure 4Sunlit (blue) and shaded (black) fraction of (a) walls and (b) roofs during the study day from SPARTACUS-Urban shortwave simulations using solar zenith angles (Fig. 2). Lines are shown as dashed when no roofs occur at a height. Mean building height: m (grey dashed line). All times are UTC on 27 August 2017.
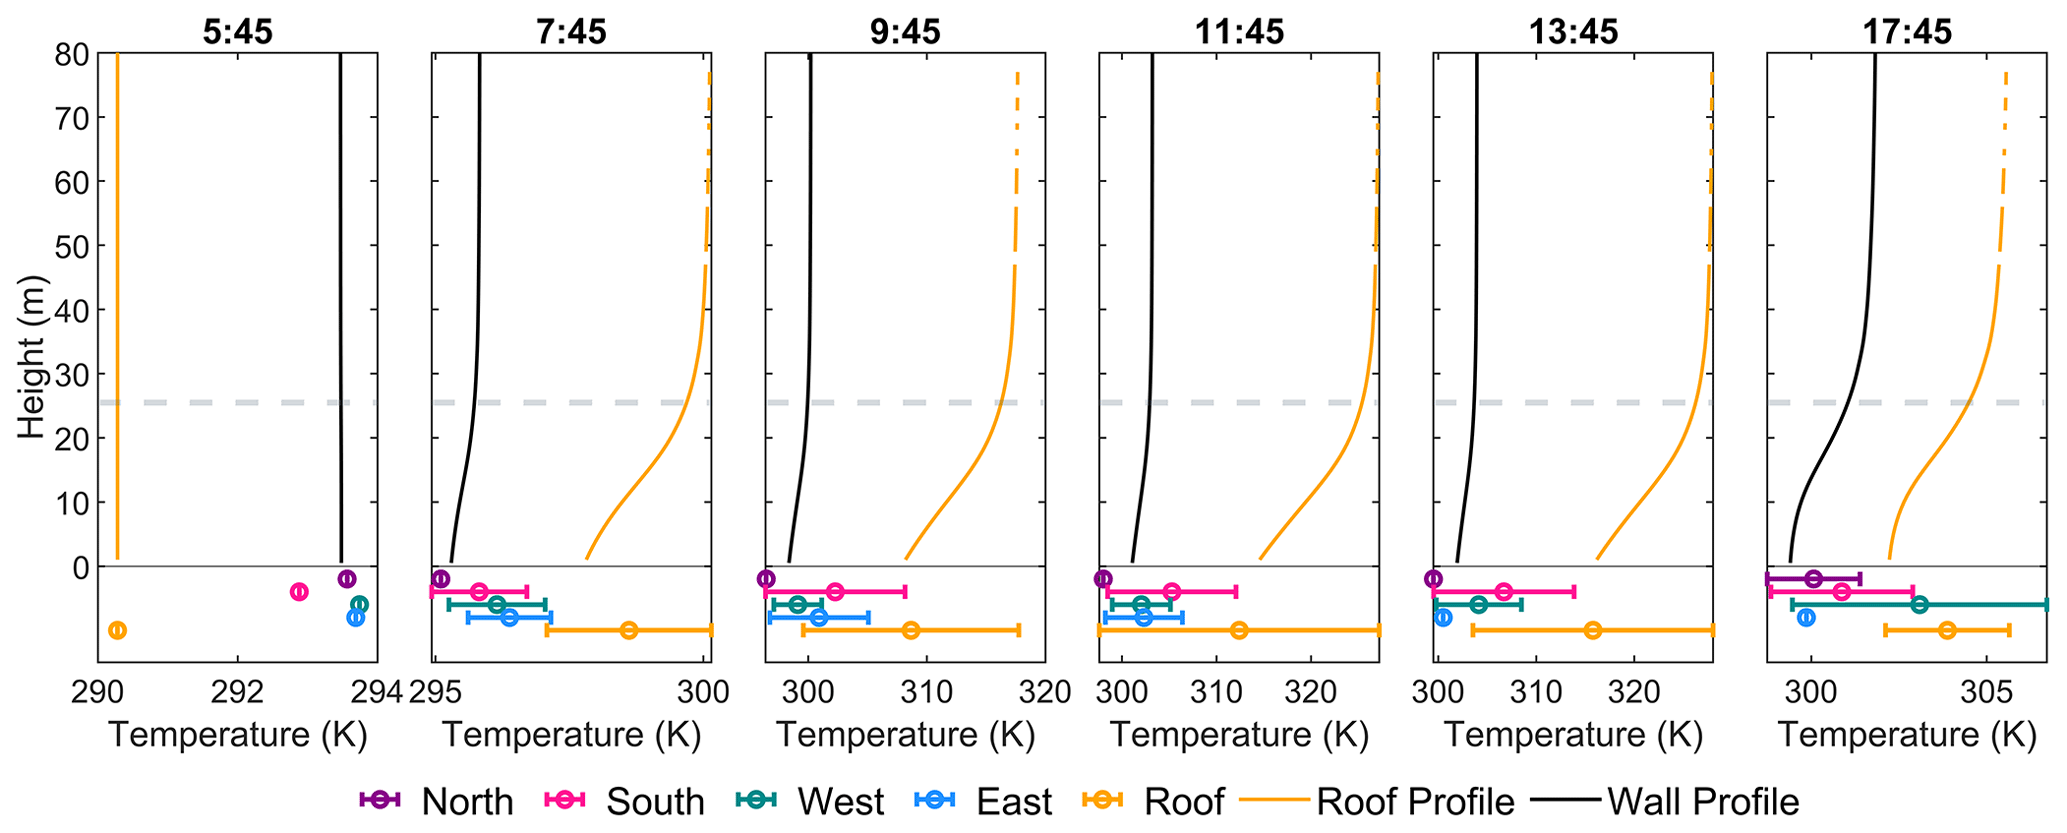
Figure 5Temperature profiles at six times (UTC) used in SPARTACUS-Urban simulations (averaging methods, Sect. 3.3) with temperatures prescribed for DART surface types given in the error bars below each set of temperature profiles, with the mean temperature denoted by open circles and sunlit–shaded range given (Fig. 3). Note x axes differ between panels. All times are UTC on 27 August 2017.
4.2 Comparison of SPARTACUS-Urban and DART: one facet temperature (T)
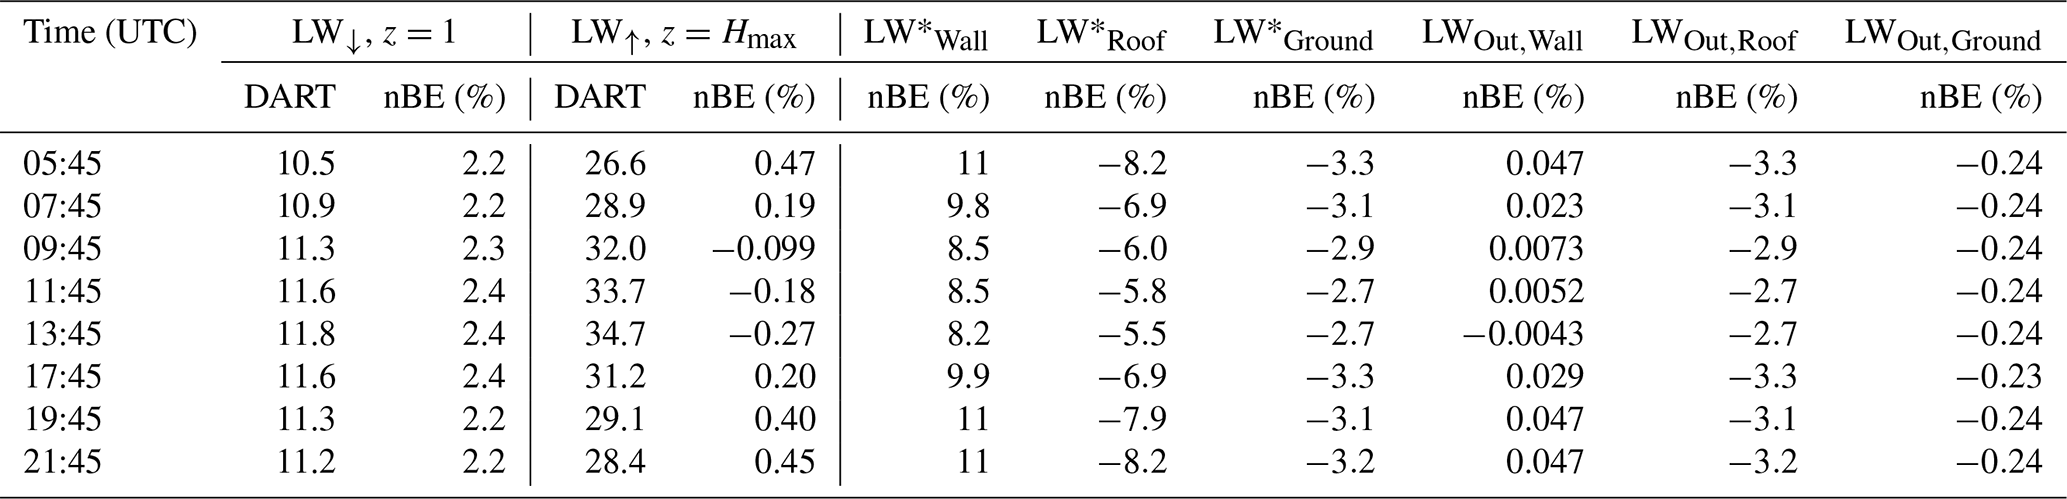
First, when T does not have sunlit–shaded variations, there is good agreement between SPARTACUS-Urban and DART. There is good agreement for both LW↑ at the top of the canopy (nBE <0.5 % across the whole day; Table 2, Figs. 6, S3–S7) and for LW↓ across the day (nBE ∼2 %). The LWOut,Wall nBE is <0.1 %, and the nBE for LW*Wall is 8 %–11 %. The nBE is less when TWall is warmer (i.e. middle of day). The larger error in LW*Wall is caused by a small net flux as LWIn,Wall and LWOut,Wall cancel each other out. Thus, small errors result in the large nBE.
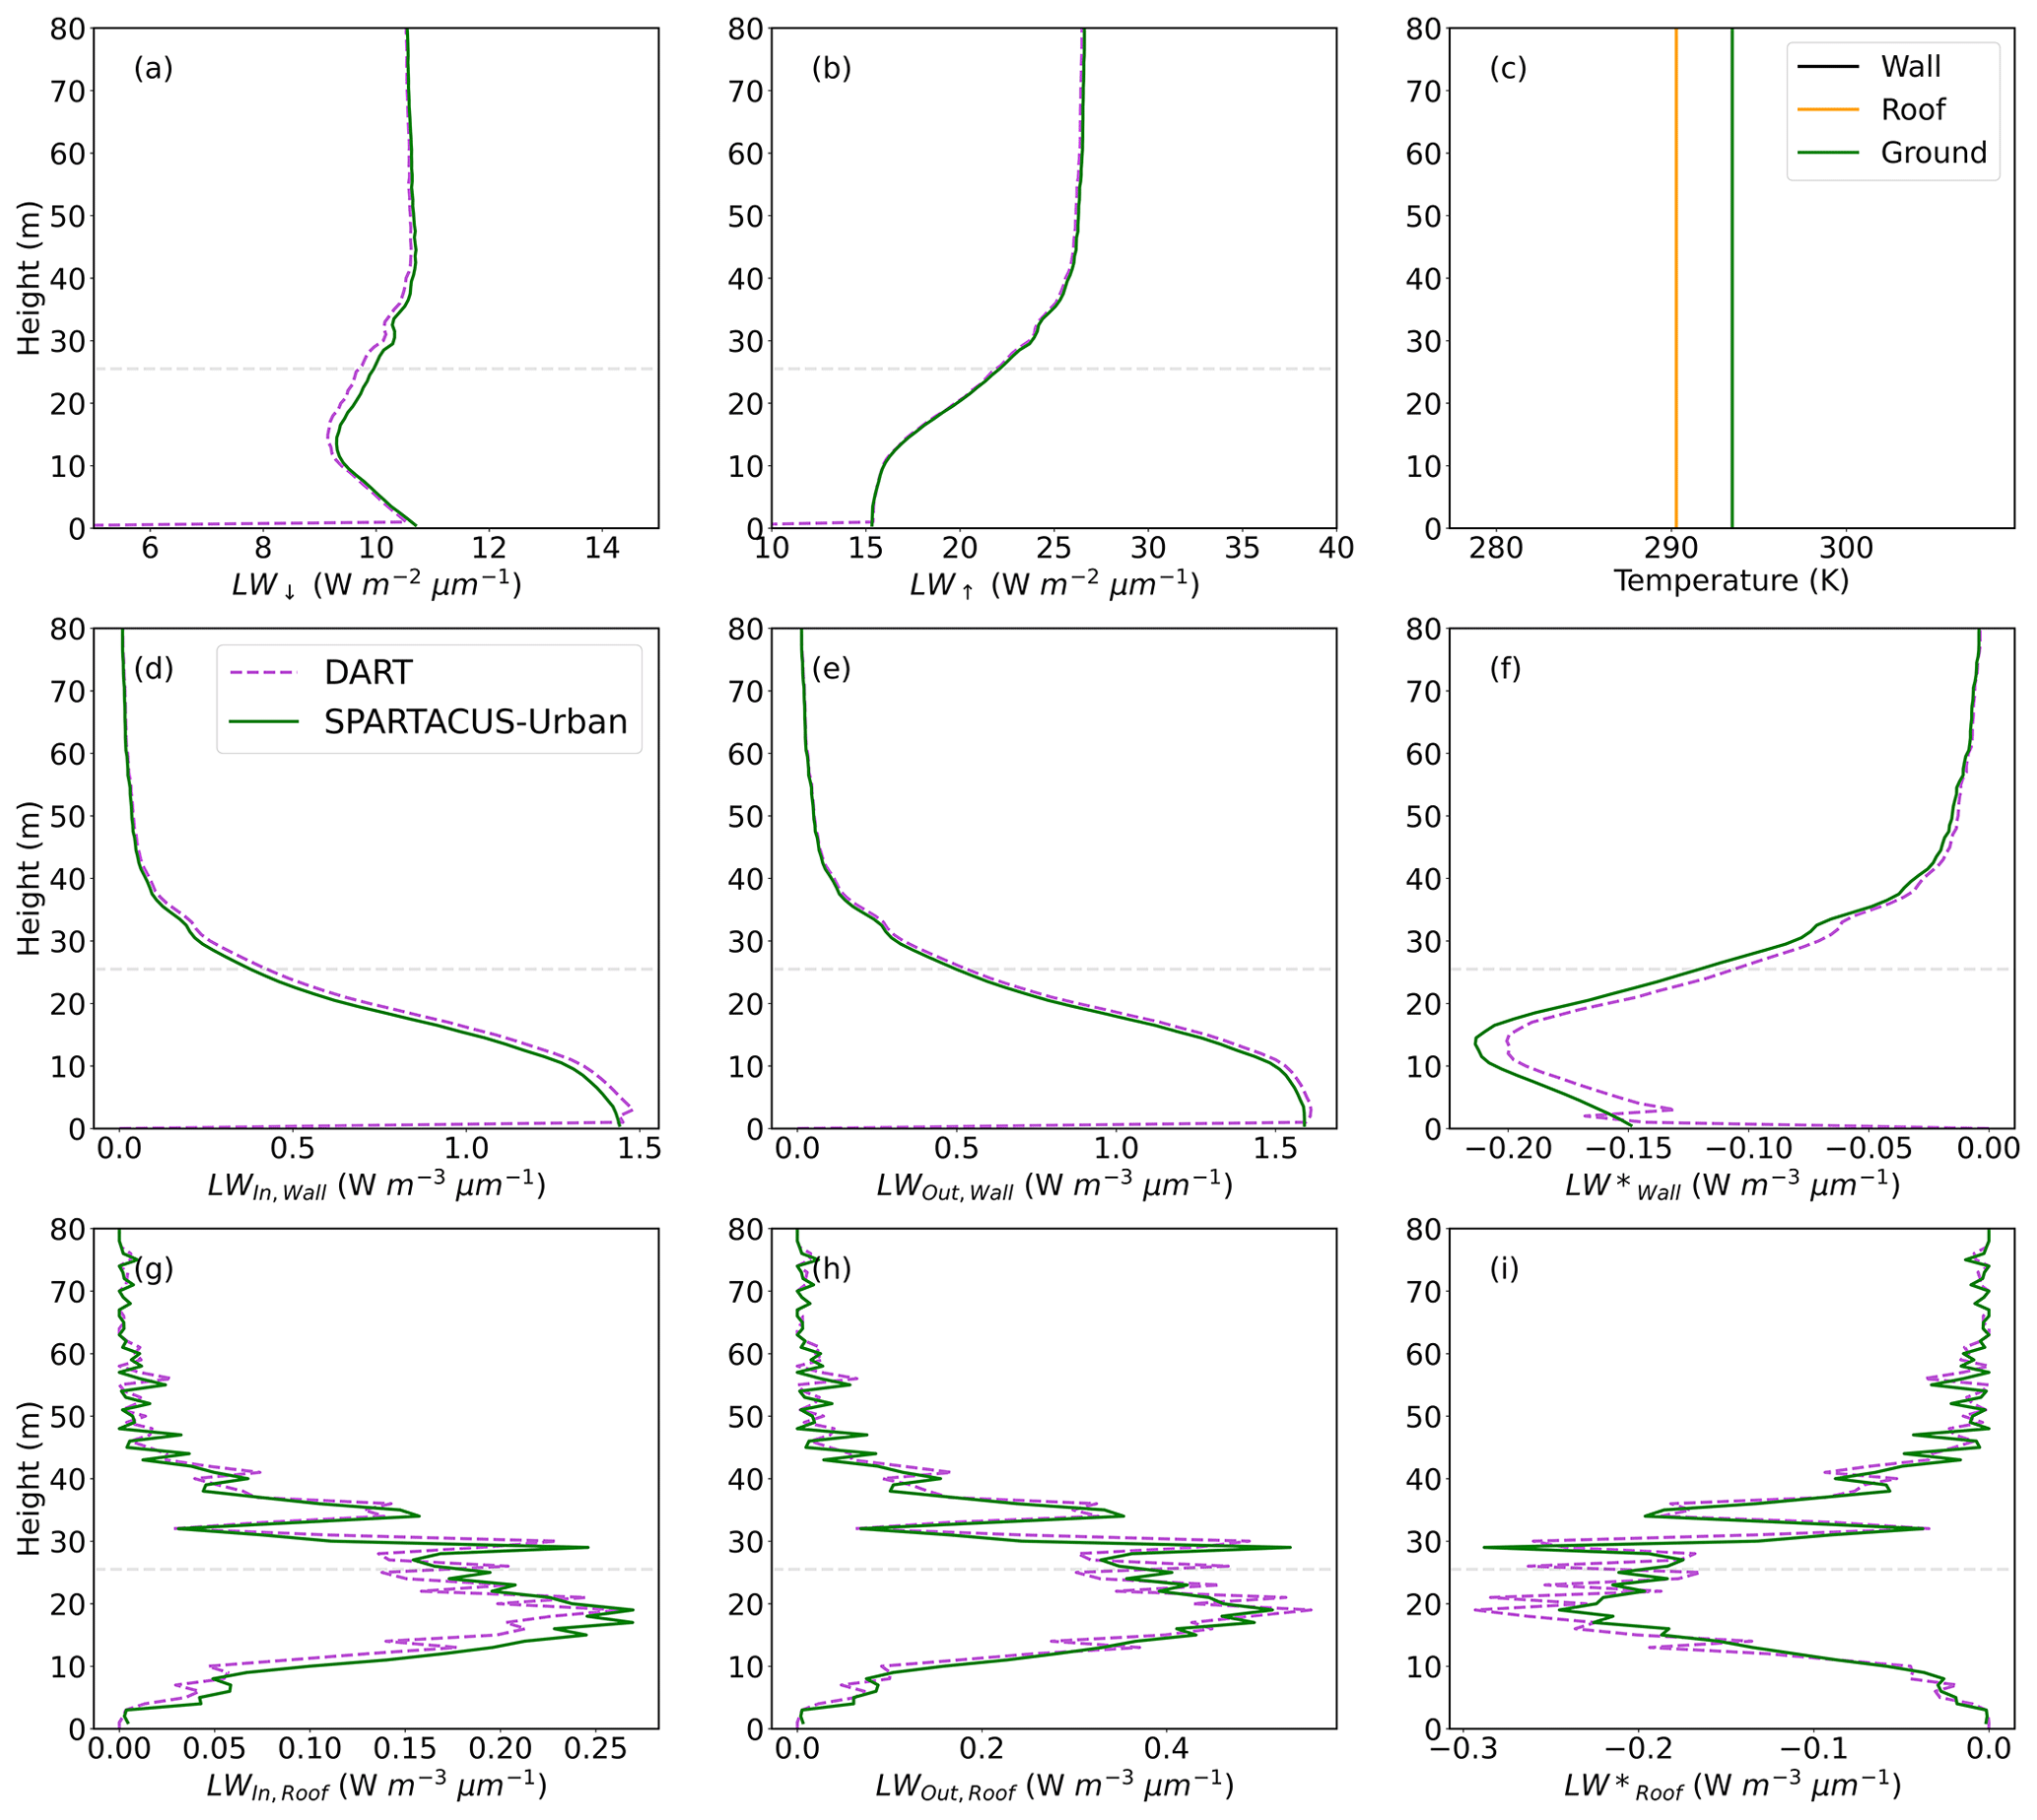
Figure 6Longwave fluxes (LW) for a 2 km × 2 km domain in central London (Fig. 1) simulated with SPARTACUS-Urban (green) and DART (purple) with an emissivity of 0.93 at 05:45 on 27 August 2017 with (c) single facet T: (a) downwelling clear-air flux (LW↓), (b) upwelling clear-air flux (LW↑), (d–f) wall interception and outgoing and net flux (LWIn,Wall, LWOut,Wall, LW*Wall), and (g–i) roof interception and outgoing and net flux (LWIn,Roof, LWOut,Roof, LW*Roof). Prescribed facet temperatures using a single temperature per surface type for DART and (c) single temperatures per facet type for SPARTACUS-Urban.
SPARTACUS-Urban slightly underestimates LWIn,Wall and LWOut,Wall (Fig. 6) at the base of the canopy; therefore LW*Wall is slightly overestimated. SPARTACUS-Urban overestimates LWIn,Roof below . With just one TRoof per time interval, the LWOut,Roof error is small (nBE ∼3 %), causing underestimates of LW*Roof and a larger nBE (5.5 % to 8.5 %).
Across the multiple cases for different facet T and with different differences between facet T (e.g. magnitude of TRoof>TWall), the agreement is consistent between the two models. These differences may have arisen due to the geometry assumptions in SPARTACUS-Urban or the wall temperature averaging, but despite this, their magnitudes remain low.
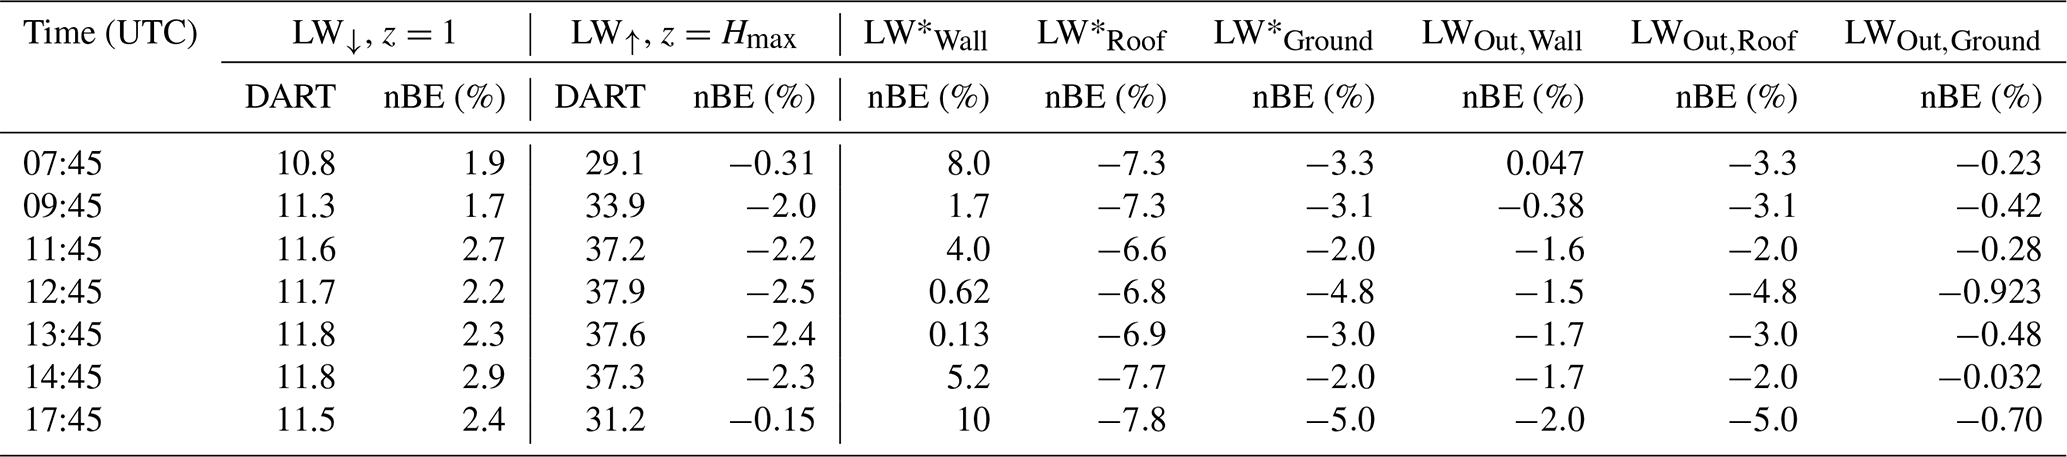
Table 2Evaluation of SPARTACUS-Urban (cf. DART) for a 2 km × 2 km domain in central London on an August day, for facets prescribed a single surface temperature. Upwelling and downwelling clear-air fluxes (LW↓, LW↑) and the total outgoing and net flux into each urban facet (wall, roof, ground, e.g. LWOut,Wall and LW*Wall), assessed using the normalised bias error (nBE, Eq. 8).
4.3 Comparison of SPARTACUS-Urban and DART: varying facet temperature with solar irradiance
Second, we compare the two models when facets are prescribed a T range. Here, SPARTACUS-Urban has good agreement with DART for LW↓ at the base of the canopy (nBE 1.7 %–2.9 %, Table 3) and at the top of the canopy for all times (Table 2, Figs. 7–8, S8–S12). There are some disagreements towards the centre of the canopy (∼10–40 m), at all times, where SPARTACUS-Urban overestimates the LW↓. There is also good agreement in LW↑ up to ∼40 m. SPARTACUS-Urban has good agreement (nBE <0.5 %) at the start and end of the day when there is a small range in facet T (Fig. 5), and so temperature averaging (i.e. wall orientation) has little impact. The nBE in LW↑ is poorest in the middle of the day (11:45–14:45) when the facets have a large range in temperature but is still <2.5 %.
The largest errors occur in the LW roof fluxes. SPARTACUS-Urban overestimates all the LWIn,Roof below the (as in Sect. 4.2). However, LWOut,Roof is similar between SPARTACUS-Urban and DART (nBE ∼3 %), suggesting the TSun,Roof and TSh,Roof averaging method provides a good approximation to DART. Hence, SPARTACUS-Urban underestimates the LW*Roof below the , with nBE 6 %–8 %. These differences may be associated with the 1 m vertical resolution used in SPARTACUS-Urban; cf. DART's roof fluxes being aggregated to each voxel top. Despite this, the vertical profiles of LWRoof fluxes in SPARTACUS-Urban and DART are still close (Fig. 7g–i).
SPARTACUS-Urban LW wall fluxes generally compare well to DART. There are slight differences in the LWIn,Wall close to the surface, which is likely attributable to the removal of the internal building walls (Sect. 3.1). For all surface temperature configurations, the LWOut,Wall nBE is ∼8 % throughout the day. Through the day, the LW*Wall nBE varies from 0 %–10 %. It is smallest when the TWall variation is largest (11:45–14:45, Fig. 3). The good agreement in LWOut,Ground suggests the averaging method for sunlit and shaded temperatures performs well. SPARTACUS-Urban underestimates LW*Ground but with a low nBE (2 %–5 %).
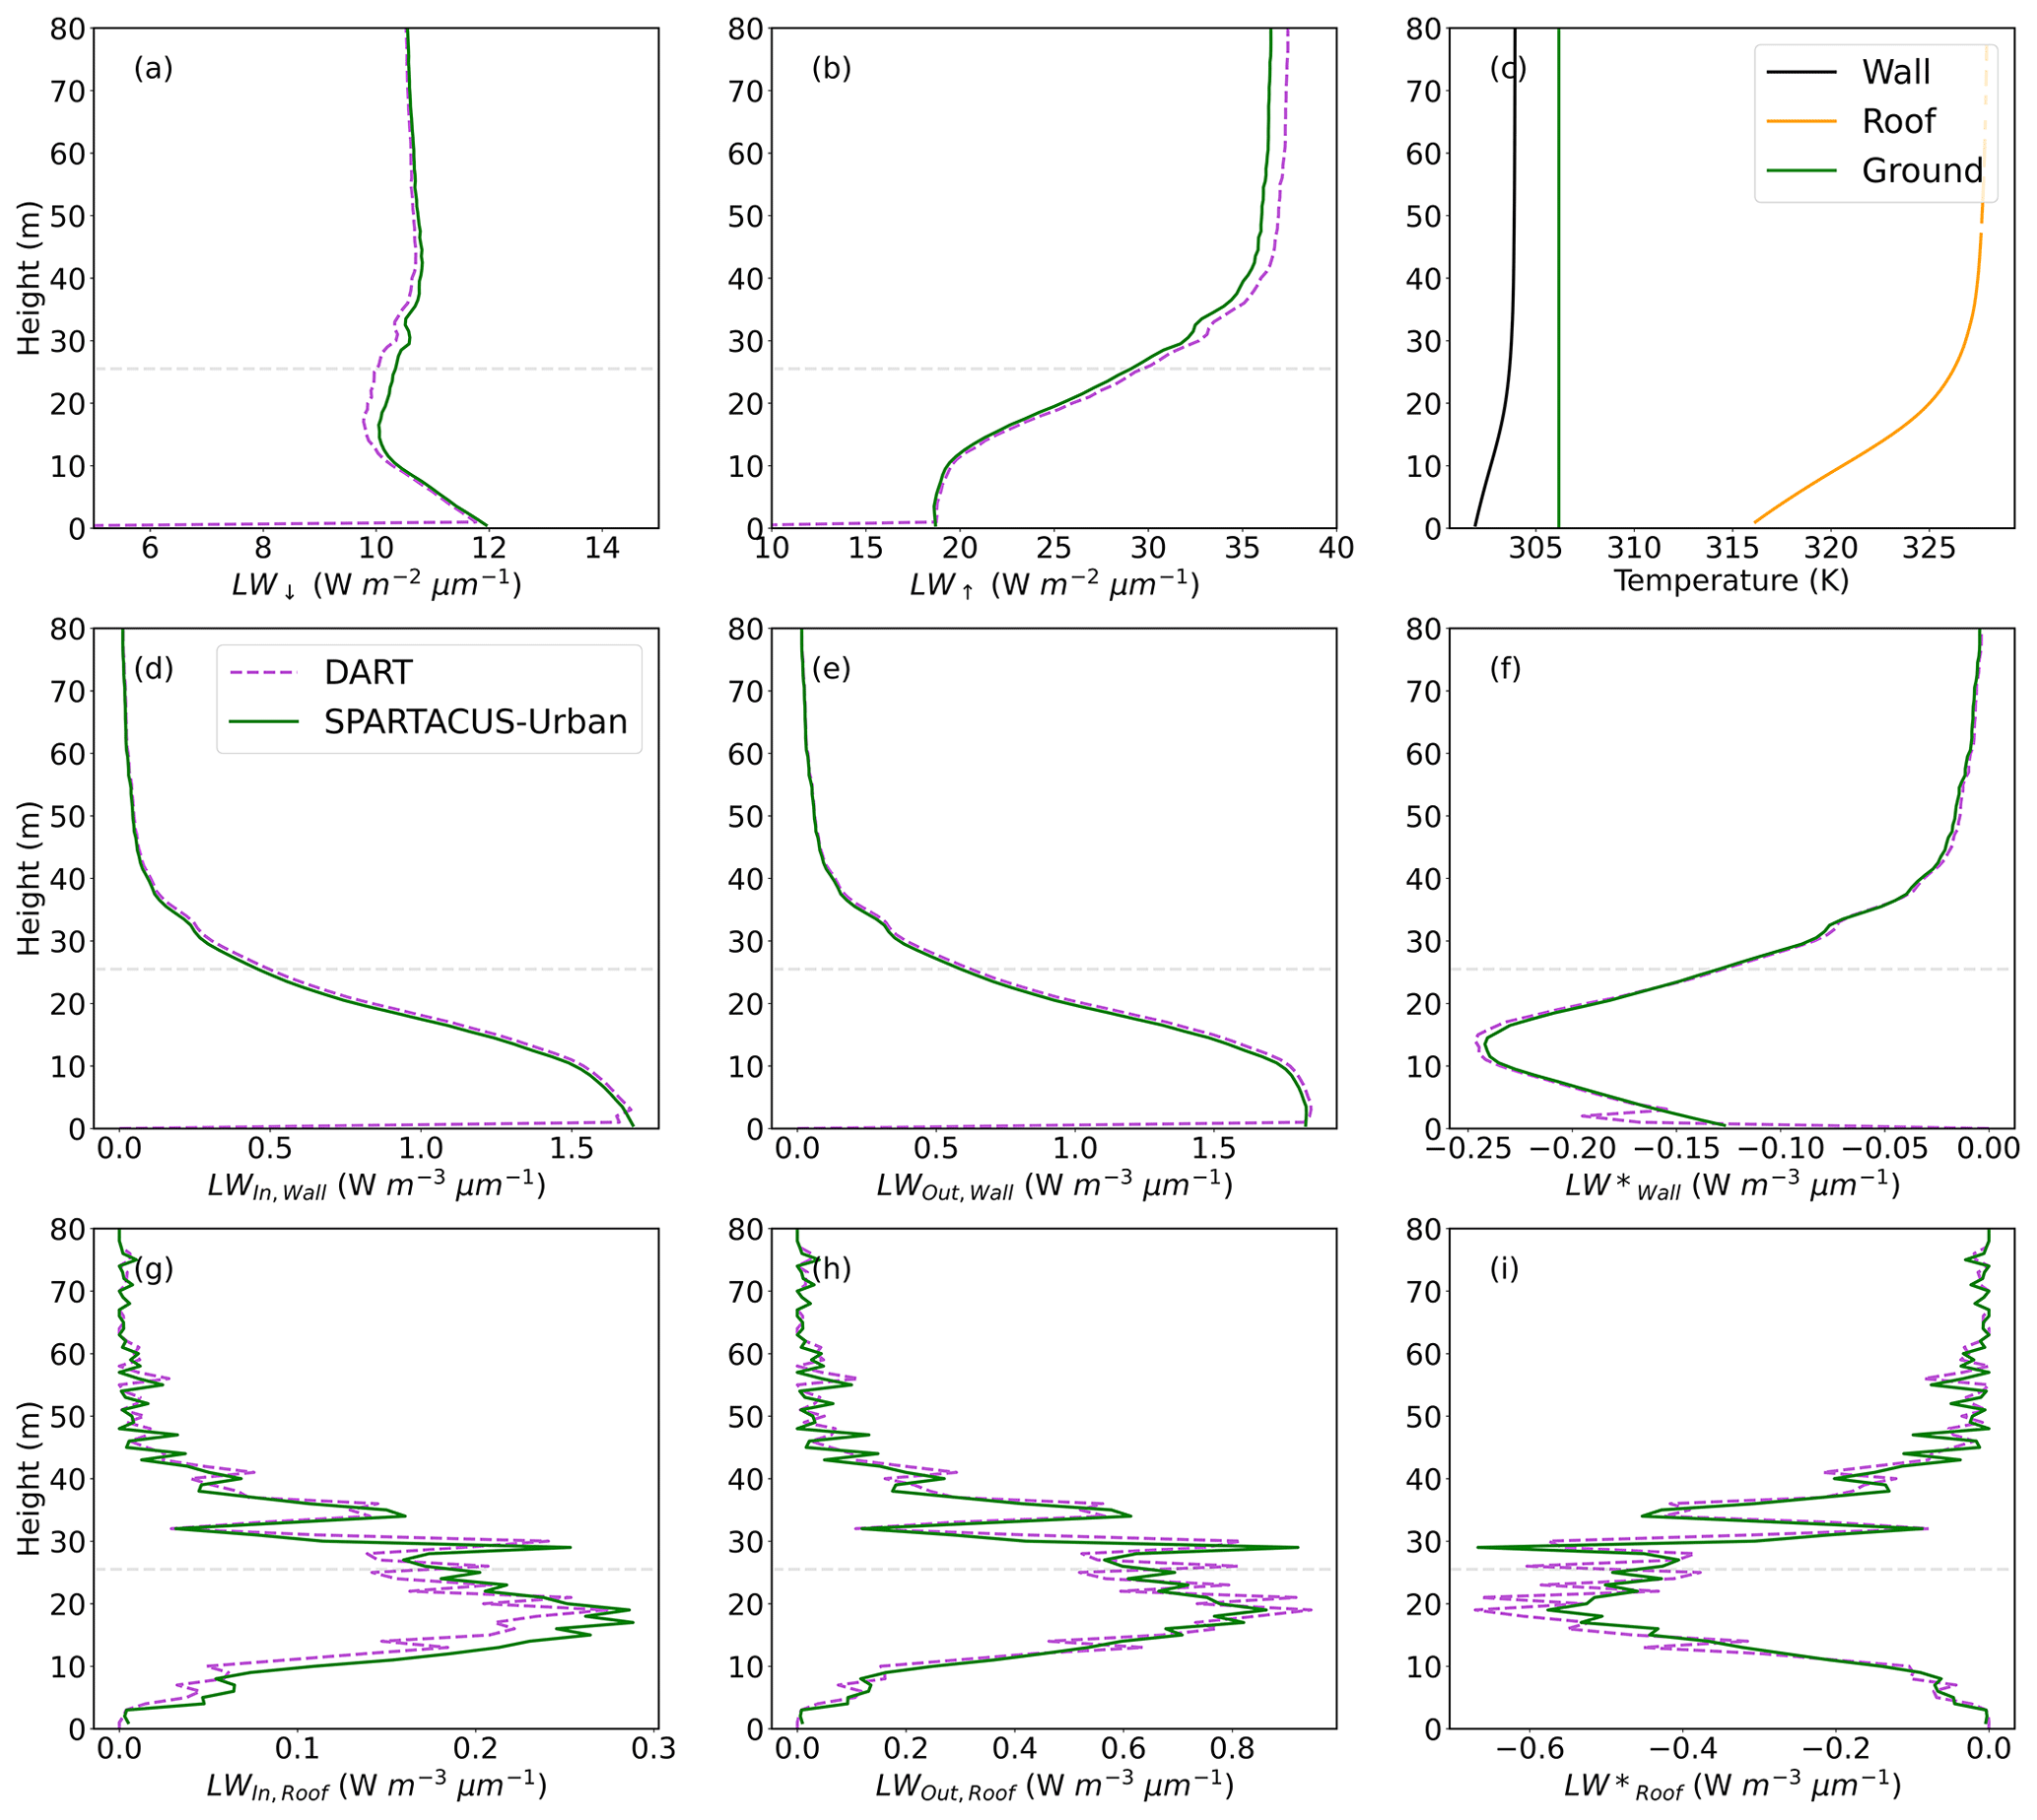
Figure 7Longwave fluxes (LW) for a 2 km × 2 km domain in central London (Fig. 1) simulated with SPARTACUS-Urban (green) and DART (purple) with an emissivity of 0.93 at 13:45 on 27 August 2017: (a) downwelling clear-air flux (LW↓), (b) upwelling clear-air flux (LW↑), (d–f) wall interception and outgoing and net flux (LWIn,Wall, LWOut,Wall, LW*Wall), and (g–i) roof interception and outgoing and net flux (LWIn,Roof, LWOut,Roof, LW*Roof). Prescribed facet temperatures based on SW simulations at 13:45 using a full 3D temperature field for DART and (c) temperature profiles per facet type for SPARTACUS-Urban.
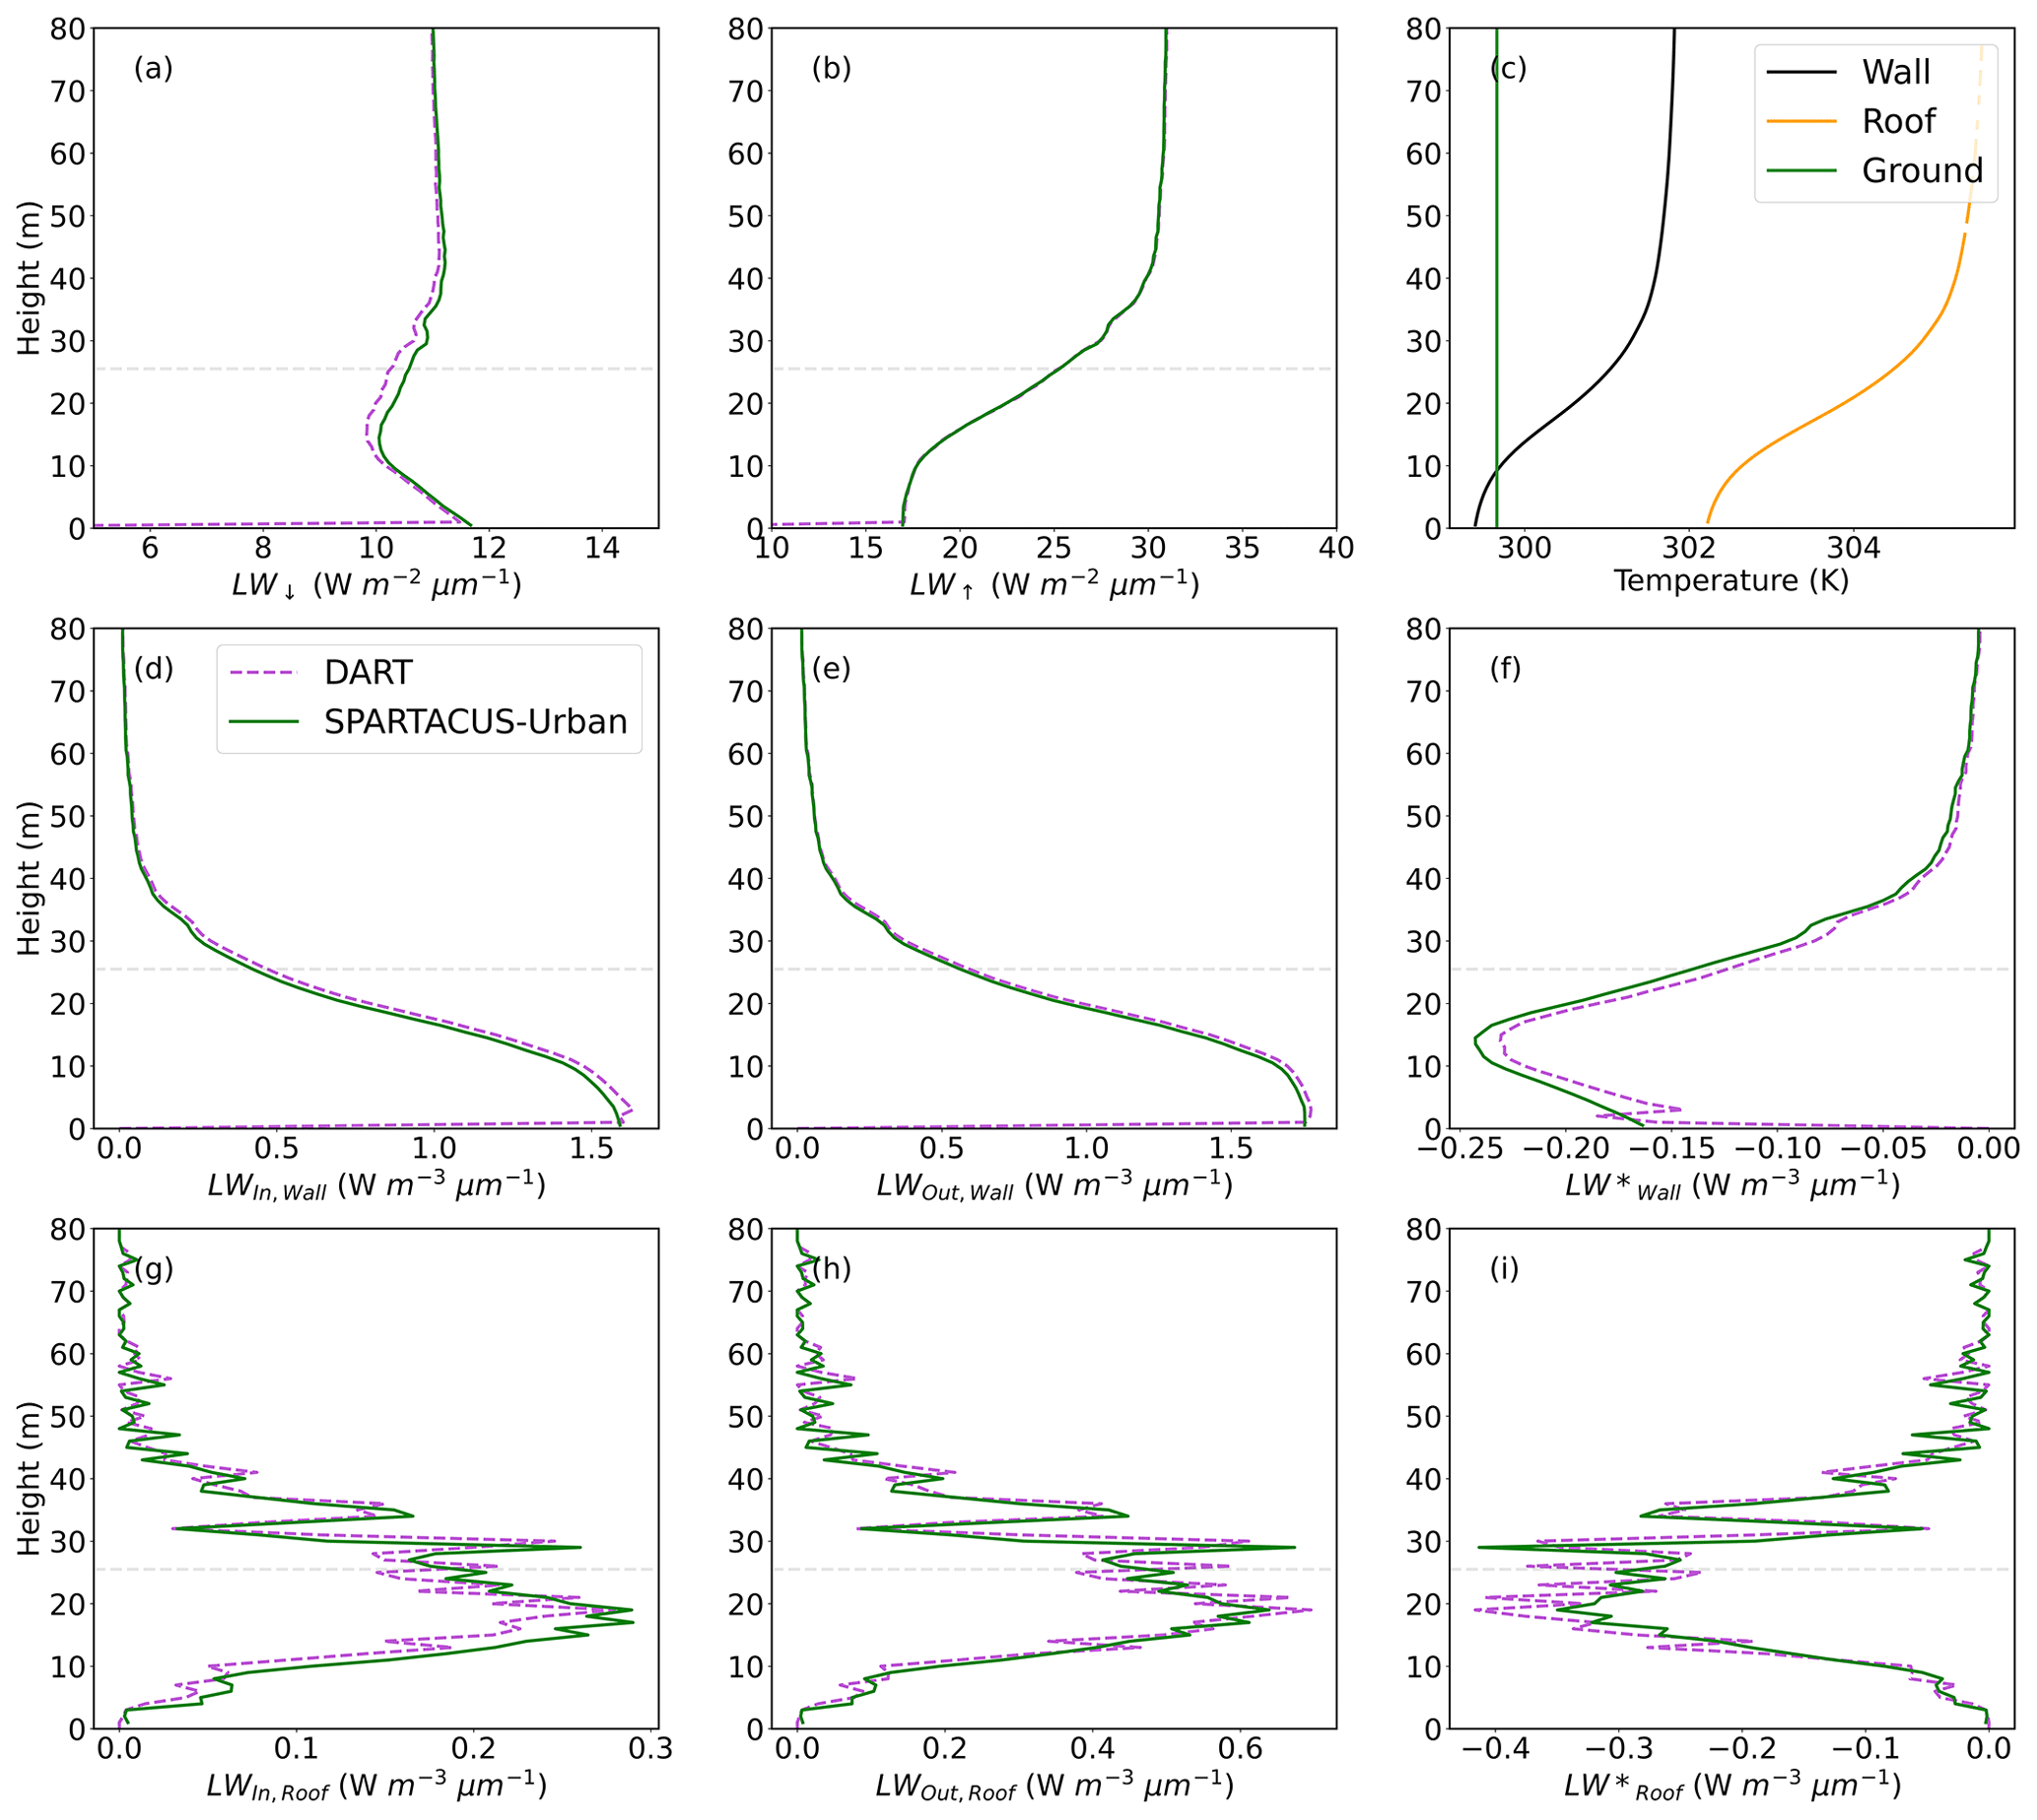
Figure 8Longwave fluxes (LW) for a 2 km × 2 km domain in central London (Fig. 1) simulated with SPARTACUS-Urban (green) and DART (purple) with an emissivity of 0.93 at 17:45 on 27 August 2017: (a) downwelling clear-air flux (LW↓), (b) upwelling clear-air flux (LW↑), (d–f) wall interception and outgoing and net flux (LWIn,Wall, LWOut,Wall, LW*Wall), and (g–i) roof interception and outgoing and net flux (LWIn,Roof, LWOut,Roof, LW*Roof). Facet temperatures used are prescribed based on SW simulations at 17:45, with DART using a full 3D temperature field and (c) SPARTACUS-Urban using temperature profiles for each facet type.
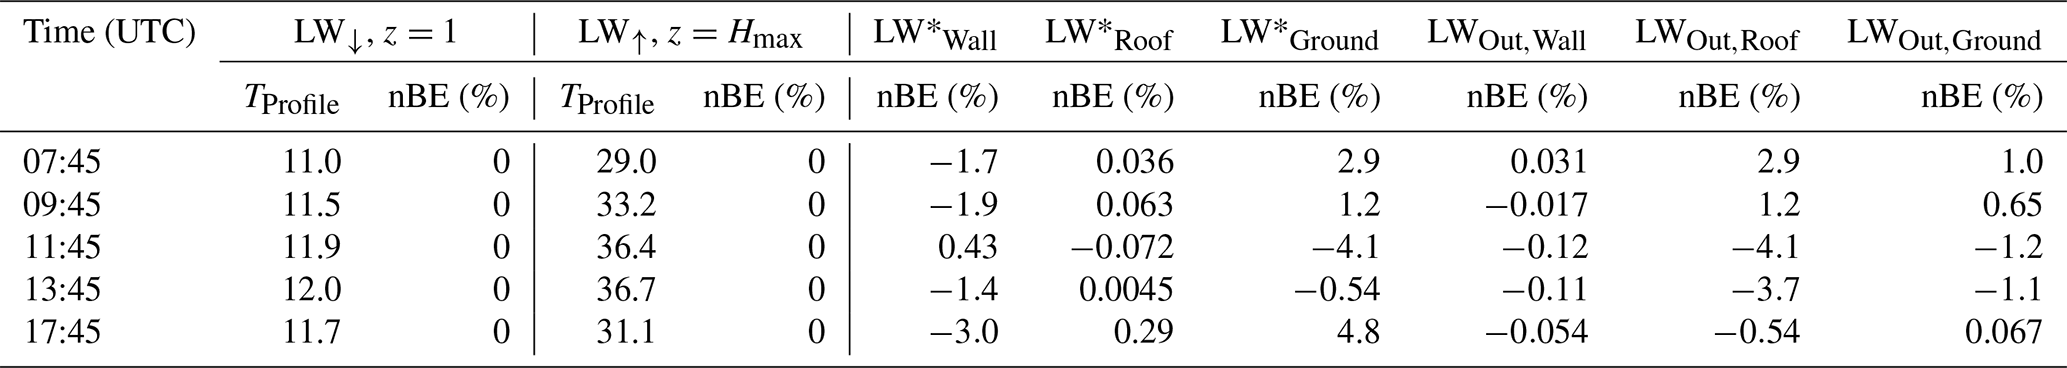
Table 3Evaluation of SPARTACUS-Urban (cf. DART) for a domain in central London on an August day, for SPARTACUS-Urban facets prescribed a surface temperature profile based on SW simulations, and DART using a full temperature field. Upwelling and downwelling clear-air fluxes (LW↓, LW↑) and the total outgoing and net flux into each urban facet (wall, roof, ground, e.g. LWOut,Wall, LW*Wall), assessed using the normalised bias error (nBE, Eq. 8).
4.4 Impact of surface temperature prescribed for SPARTACUS-Urban
As SPARTACUS-Urban performs well (cf. DART) for both temperature scenarios (Sect. 4.2, 4.3), we examine differences between using a single facet temperature (Sect. 4.2) or a profile (TProfile, Sect. 4.3). To ensure the average emission is the same in each, the single-temperature SPARTACUS-Urban simulations use weighted mean vertical profiles of TWall and TRoof (Eq. 7, as for Harman).
There are negligible differences between the LW↑ and LW↓ within the canopy for both simulations (Fig. 9). As the geometry is identical between simulations, LWIn,Roof and LWIn,Wall are also the same. The nBEs in LWOut,Roof and LWOut,Wall are small ( %) but larger for LWOut,Ground (nBE <4 %) (Table 4, Fig. S13). The largest nBEs are for LW*Wall (nBE %) and LW*Ground (nBE <4.8 %). The LWOut,Wall switches from an over- to an underestimate in the single-T simulation at ∼12 m, corresponding to where the single wall temperature over- and then underestimates the T profile. This impacts the LW*Wall profile. These changes in wall and roof temperature profiles mimic the cumulative profiles in the wall and roof fraction (Fig. S2).
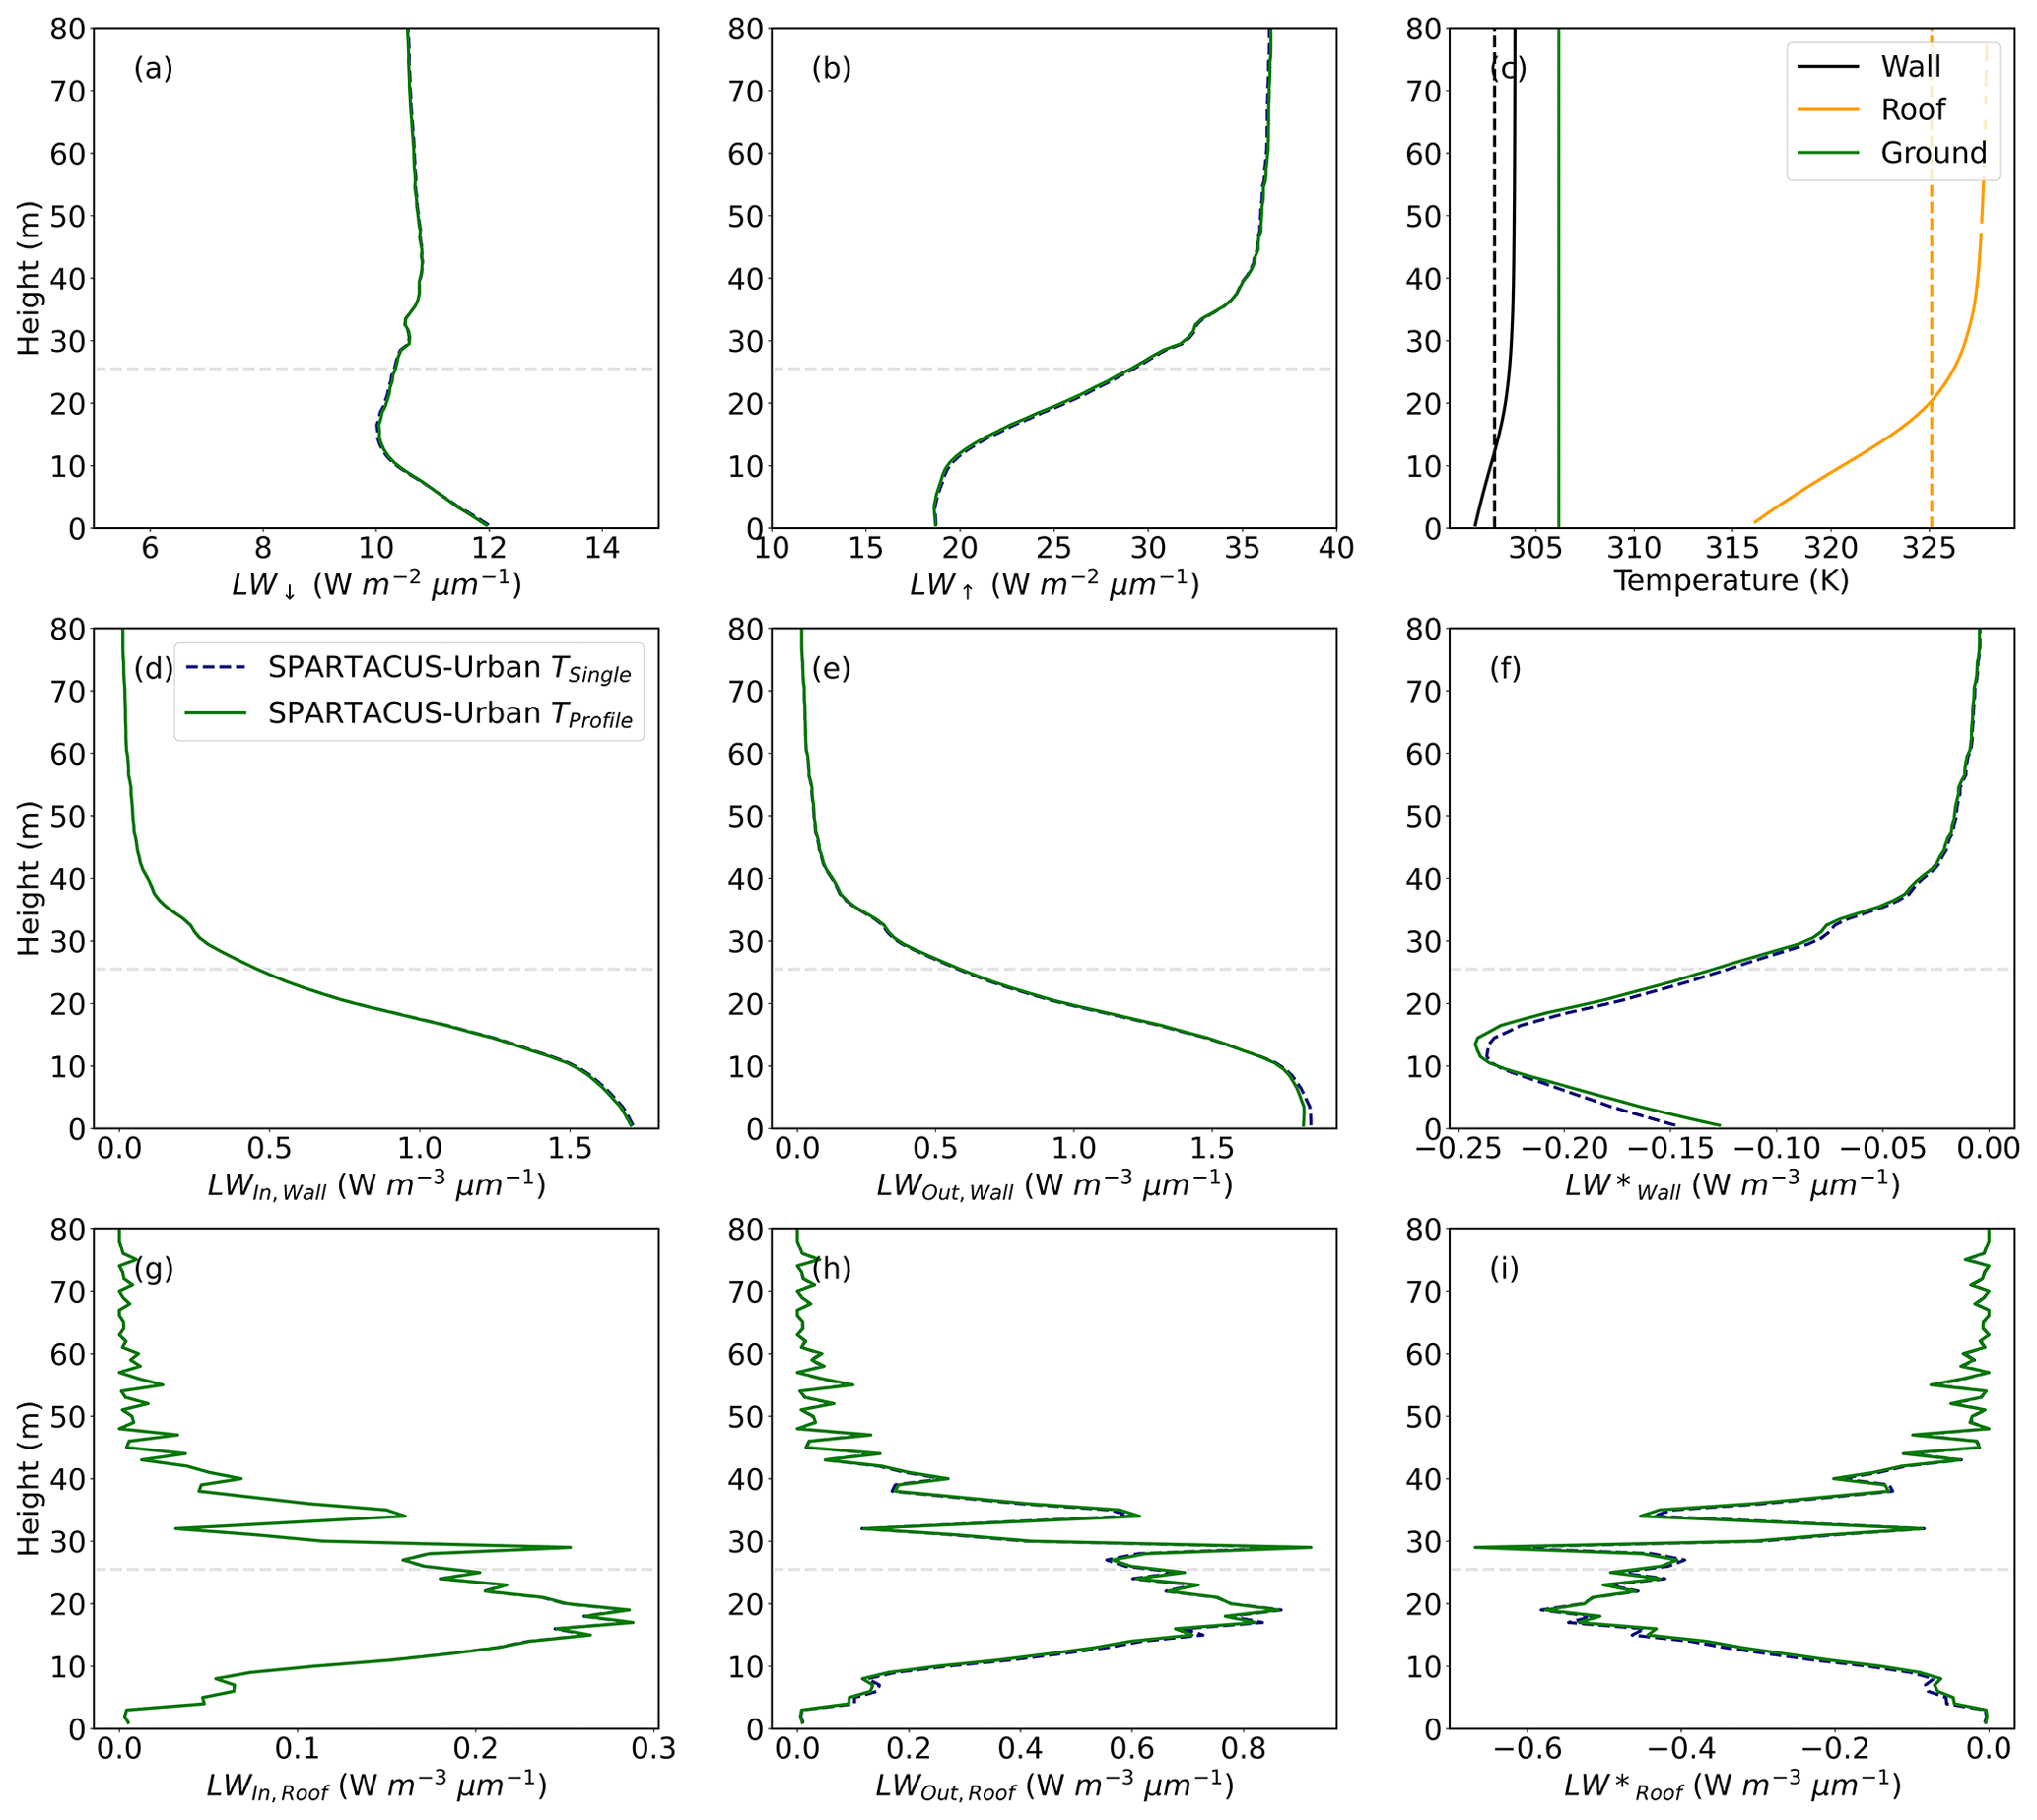
Figure 9Longwave (LW) SPARTACUS-Urban simulations for a 2 km × 2 km domain in central London (Fig. 1) with an emissivity of 0.93 for 13:45 on 27 August 2017: (a) downwelling clear-air flux (LW↓), (b) upwelling clear-air flux (LW↑), (d–f) wall interception and outgoing and net flux (LWIn,Wall, LWOut,Wall, LW), and (g–i) roof interception and outgoing and net flux (LWIn,Roof, LWOut,Roof, LW). Facet temperatures prescribed are (c) a single temperature per facet (TSingle, black dashed lines) and temperature profiles for each facet type (TProfile, green lines).
Table 4Comparison between SPARTACUS-Urban simulations for one central London grid cell (for 27 August) with a surface temperature profile assigned based on SW simulations (TProfile) and single facet temperatures (TSingle), assessed using the normalised bias error (nBE, Eq. 8) for upwelling and downwelling clear-air fluxes (LW↓, LW↑) and the total outgoing and net flux into each urban facet (wall, roof, ground, e.g. LWOut,Wall and LW*Wall).
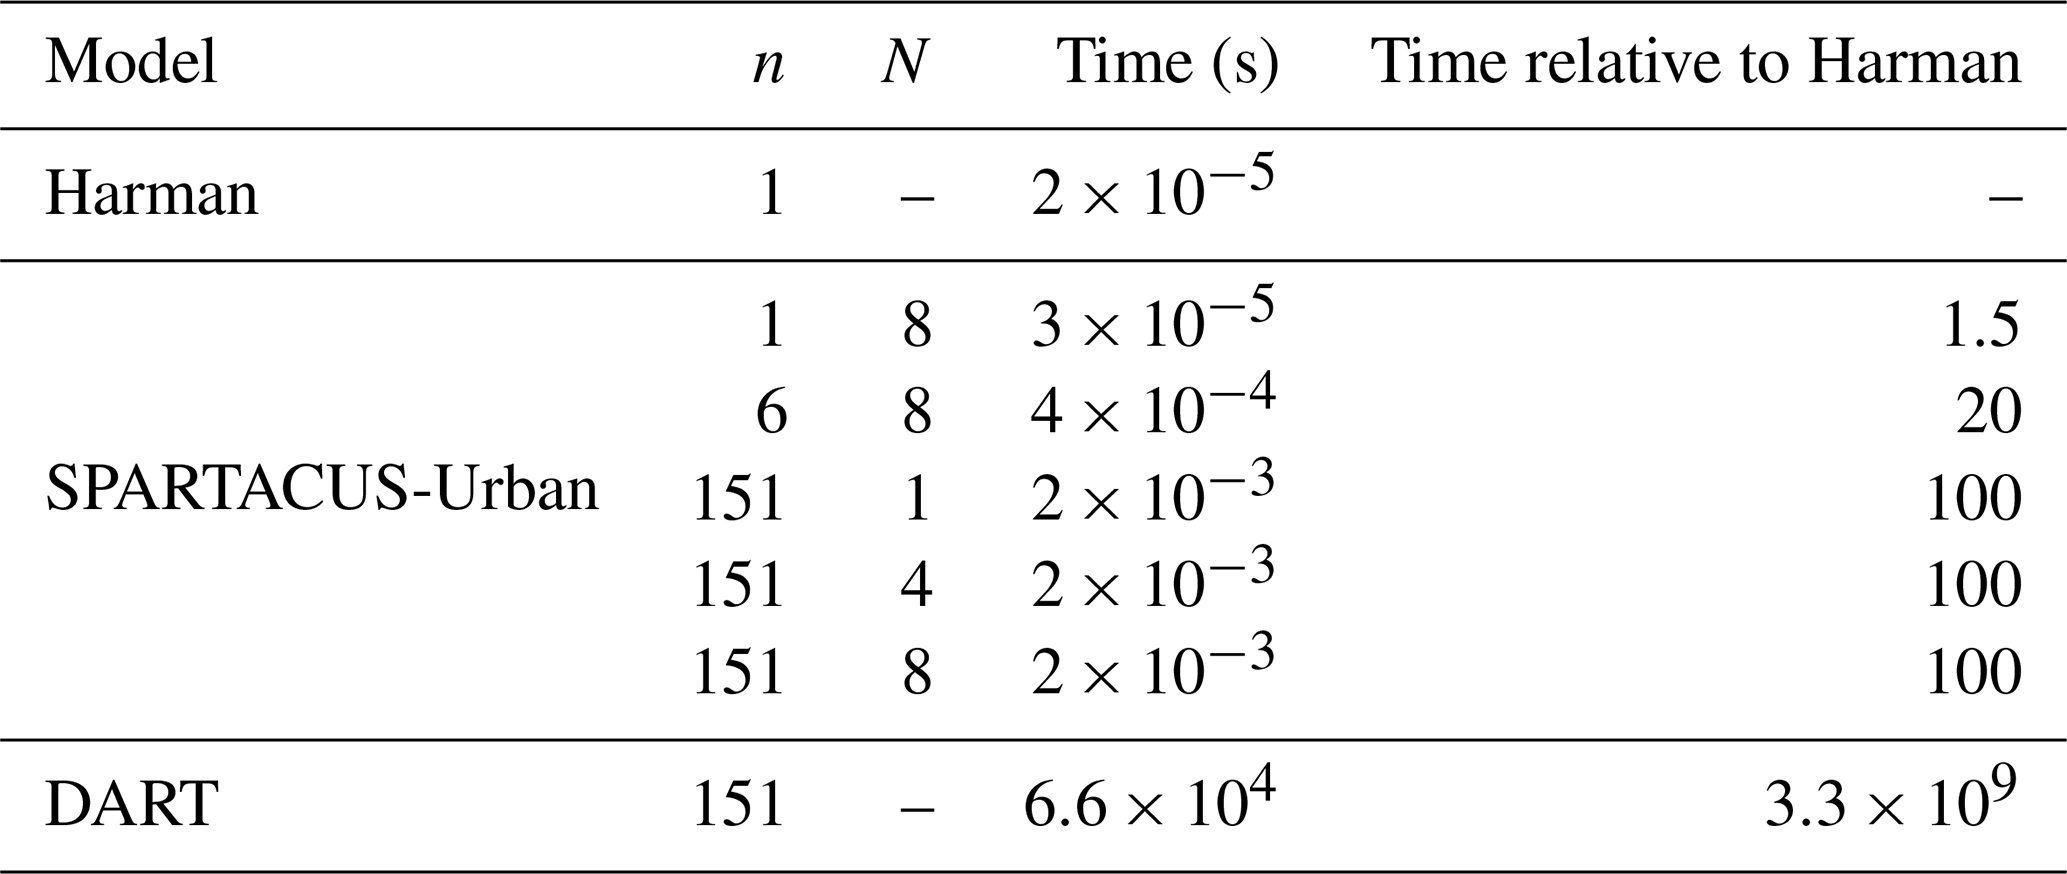
Finally, SPARTACUS-Urban, DART, and Harman et al. (2004) are applied to a case with an infinitely long canyon surrounded by buildings of equal height, with area-weighted SPARTACUS-Urban temperature profiles used in Harman et al. (2004, Eq. 7). For the more realistic temperature configurations, SPARTACUS-Urban single layer and Harman have similar run times (Table 5). This increases by a factor of 102 when realistic geometry is used in SPARTACUS-Urban. The full-temperature DART runs are 107 times slower than the most complex SPARTACUS-Urban simulations.
For single surface temperatures per facet simulations (cf. temperature profile), LW↑ at the top of the canopy (Hmax) in Harman et al. (2004) is more similar to DART, with 05:45 being approximately equal (Fig. 10). The poorest Harman–DART agreement is for LWIn,Roof and LW*Wall, although, at 05:45, the nBE LW*Wall is approximately the same for SPARTACUS-Urban and Harman (Fig. 10). This may be because no walls exist above , so roofs cannot intercept radiation from above, leading to an underestimate in LWIn,Roof. When DART simulations use a T range, the Harman performance is similar to the single facet T simulations (Fig. 11). However, the nBEs are generally higher, except for the LW*Roof and the LWWall fluxes (e.g. 13:45).
Generally, SPARTACUS-Urban agrees more closely with DART than the Harman et al. (2004) method does. In the varied facet T simulations, SPARTACUS-Urban and the Harman approach are similar for LW↑ and LWIn,Roof, with nBE <3 %. The two models are similar for LWOut,Ground and LWOut,Wall throughout the day, with the smallest nBE (Figs. S14–S15). The largest differences are seen for LW*Ground (SPARTACUS nBE 2 %–5 %; cf. Harman nBE >20 %) and LW*Wall (SPARTACUS nBE 0 %–10 %; cf. Harman nBE 8 %–16 %).
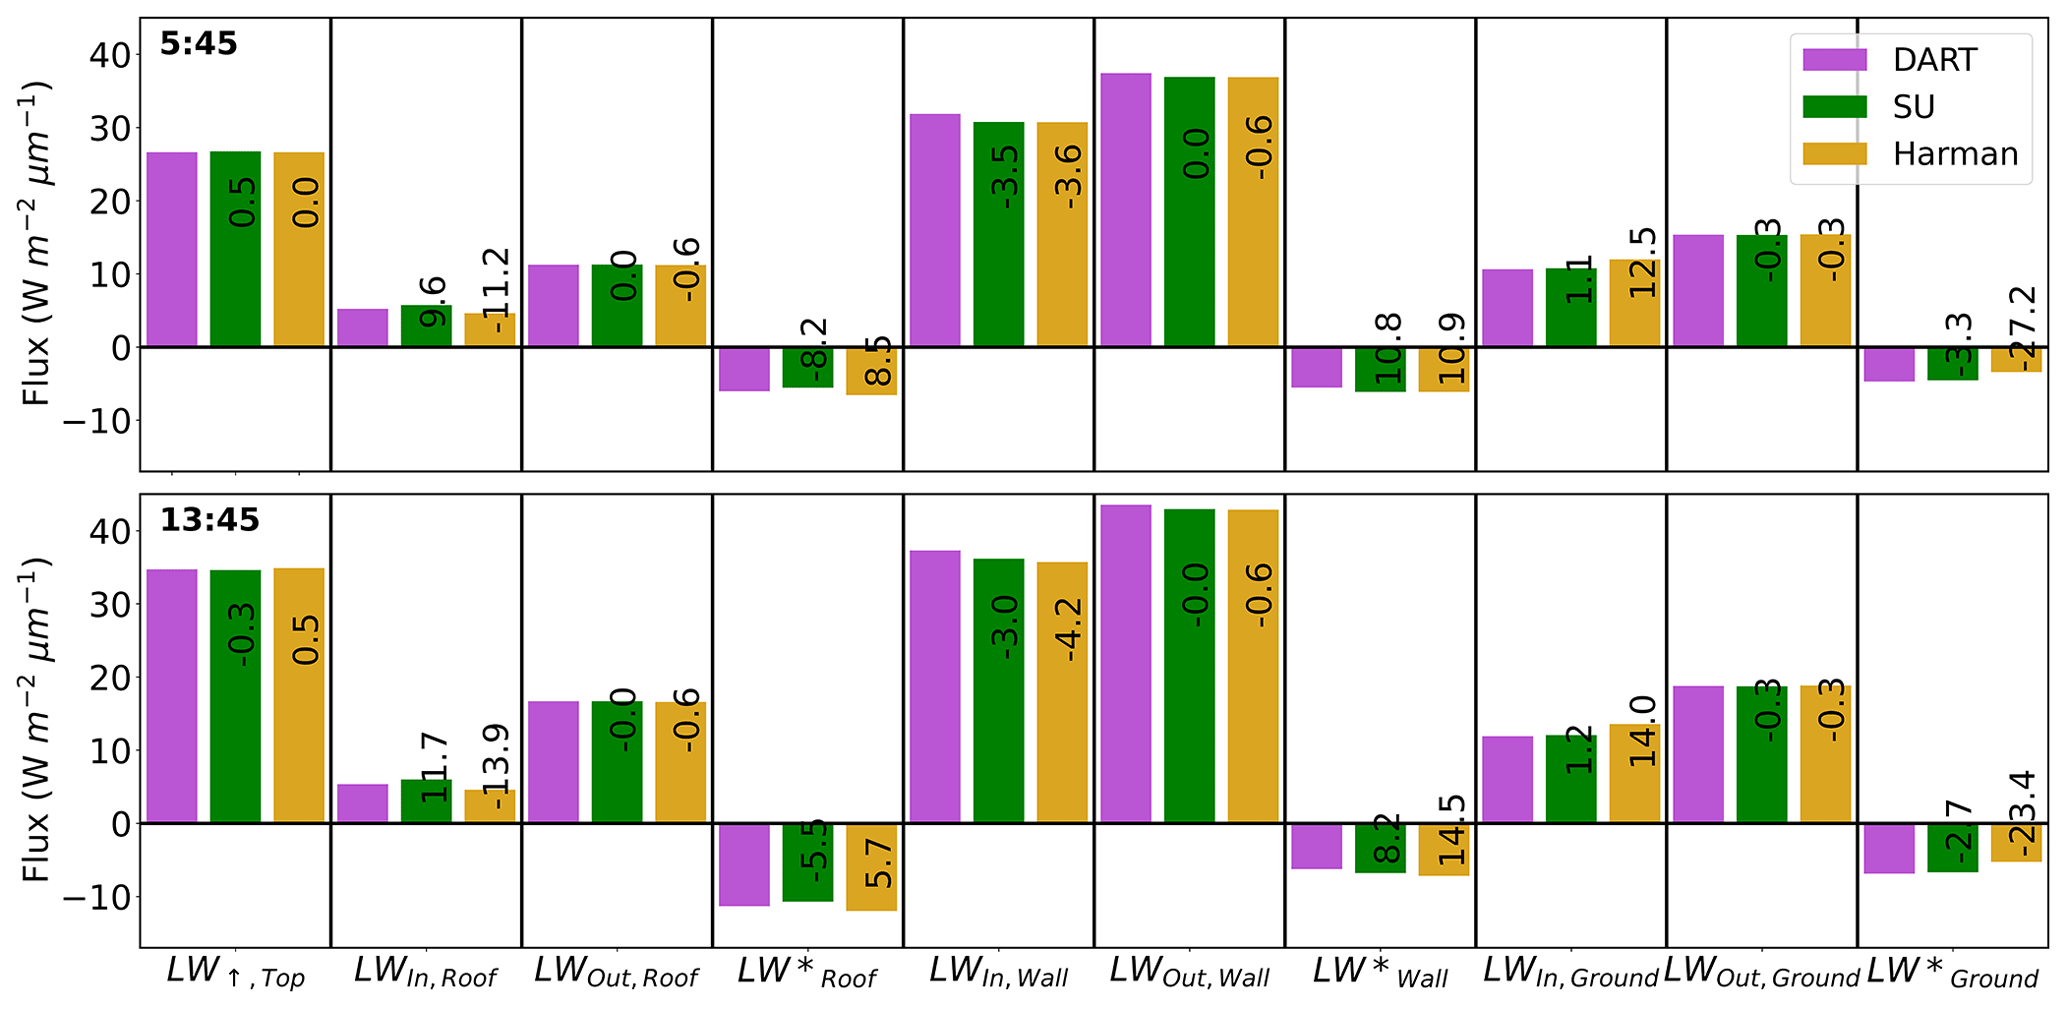
Figure 10Comparison of simulations for one grid cell in central London on 27 August at two times (UTC, rows) using the nBE (values, Eq. 8) relative to realistic-world DART for SPARTACUS-Urban (SU) and Harman et al. (2004) longwave fluxes with isothermal facet temperatures (Sect. 3.3): upwelling clear-air flux at the top of the canopy (LW↑) and the roof, wall, and ground total interception and outgoing and net flux.
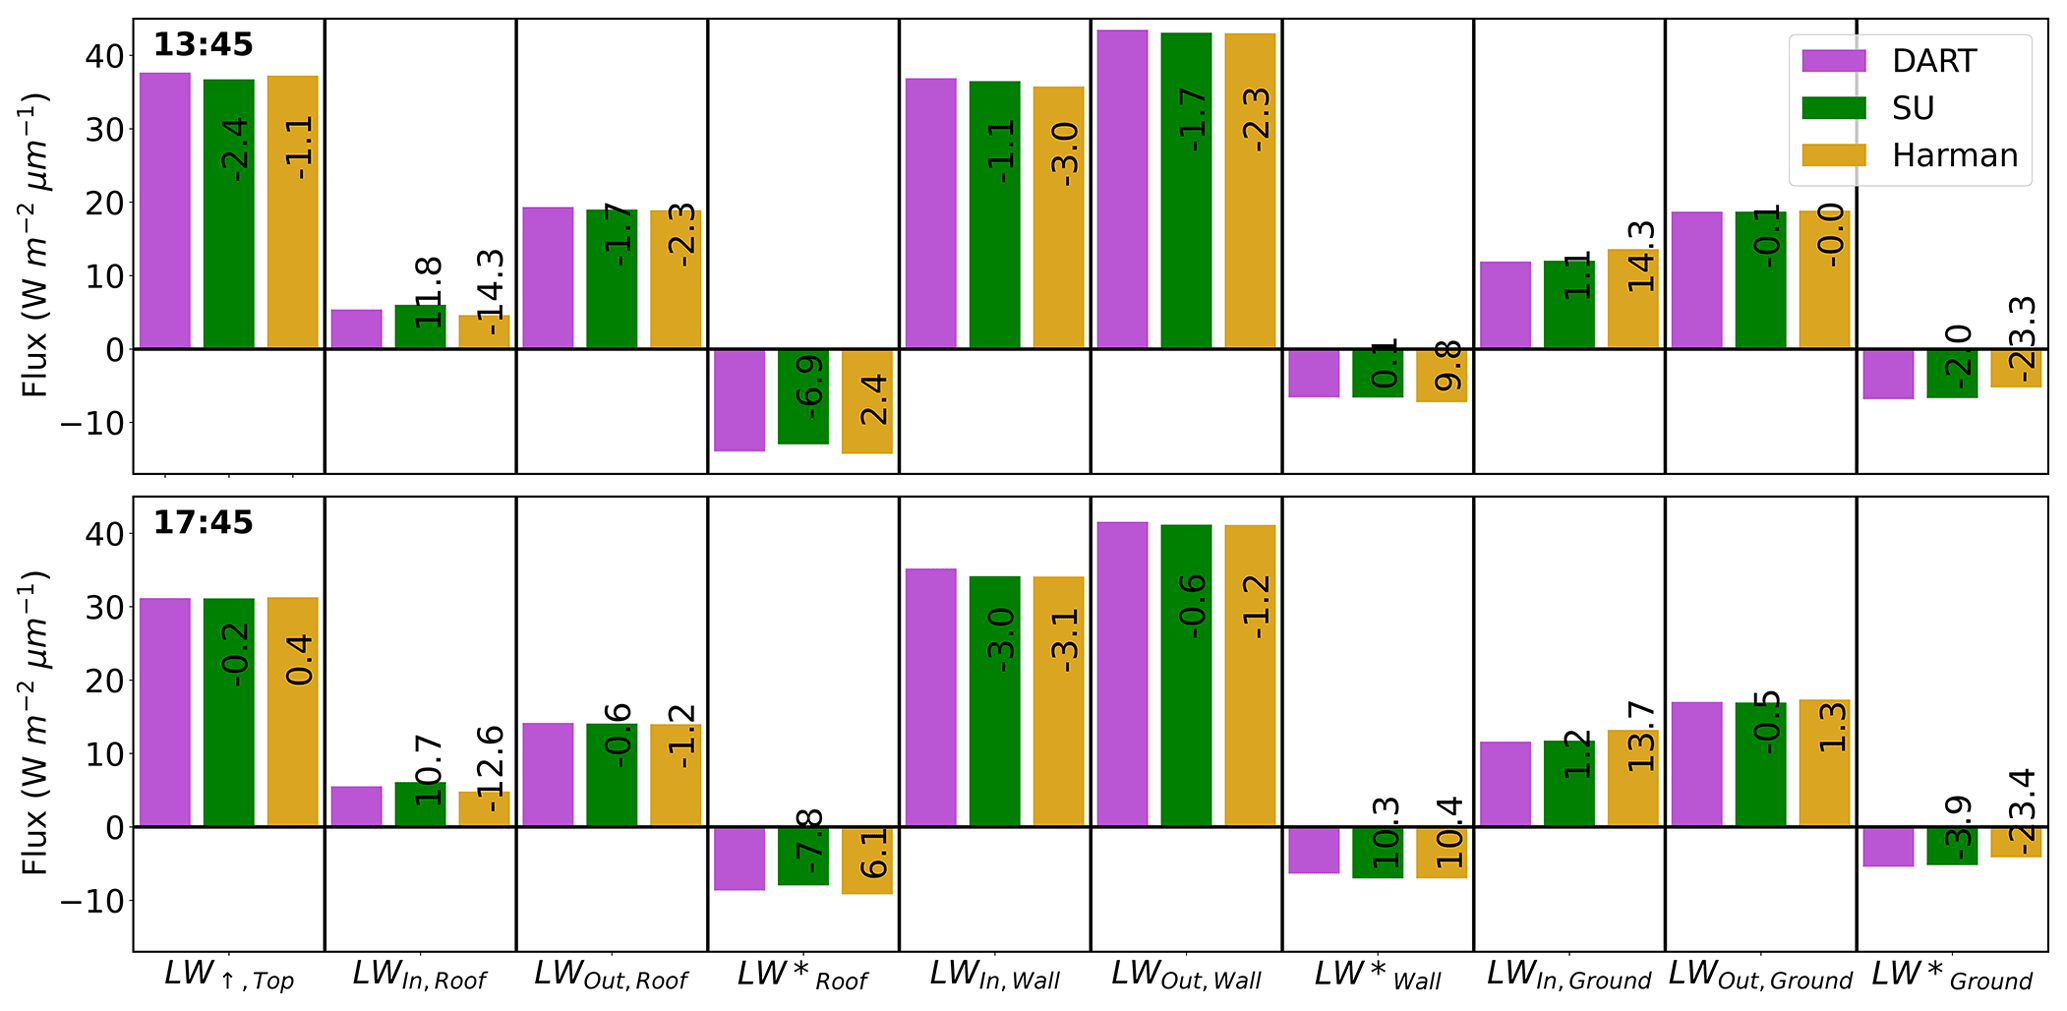
Figure 11Comparison of simulations for one grid cell in central London on 27 August at two times (UTC, rows) using the nBE (values, Eq. 8) relative to realistic-world DART for SPARTACUS-Urban (SU) and Harman et al. (2004) longwave fluxes with facet temperatures prescribed based on SW simulations (Sect. 3.3): upwelling clear-air flux at the top of the canopy (LW↑) and the roof, wall, and ground total interception and outgoing and net flux.
Table 5Absolute run time of Harman (Sect. 2.3), SPARTACUS-Urban (open-source version 0.7.3 compiled with gfortran, O3 optimisation), and DART (version 5.8.0, build number 1211) for simulations with n vertical layers and N diffuse streams per hemisphere. All runs undertaken in a Linux environment on a dual Xeon E5-2667 v3 processor with 256 GB of RAM with a single thread for Harman and SPARTACUS-Urban but parallel threads using 32 CPUs for DART 14.
Here, the longwave capabilities of the multi-layer radiative transfer model SPARTACUS-Urban are assessed using the explicit radiative transfer model, DART. DART resolves radiative interactions between individual facets of buildings, whereas SPARTACUS-Urban models the mean radiation field with height using building fraction and wall area at each height. Real-world geometry is considered using prescribed categorised observed surface temperatures (T) measured in London (Morrison et al., 2020, 2021).
Longwave (LW) fluxes are predicted well when one surface T is prescribed per facet type (or sub-facet, e.g. wall orientation). The clear-air upwelling and downwelling fluxes are predicted well, although there is some disagreement in the mid-canopy. SPARTACUS-Urban underestimates the net LW roof flux (normalised bias errors (nBE) −5.5 % to −8.2 %), suggesting too much emission from surrounding walls. Errors in this configuration could be from the SPARTACUS-Urban geometry assumptions or the wall temperature averaging methods.
Similar agreement is found when facets are prescribed a temperature range based on shortwave simulations. The clear-air fluxes are in good agreement, with nBE <3 % for all times assessed. The net wall LW is overestimated (nBE ≤10 %) at times with low intra-facet temperature variability (e.g. early morning and evening). Roof interception is also overestimated nearer the ground, leading to an underestimation in the net roof LW. However, all nBE <11 %. This suggests that the average T profiles, informed by shortwave geometry, are acceptable approximations of the true T field. However, we note the sub-facet wall T range is small, which may differ in different conditions (e.g. atmospheric, geometry).
SPARTACUS-Urban outperforms the frequently used infinite street canyon approach (Harman et al., 2004) (cf. DART). Both are similar if single-T facets are used, except for the intercepted roof and net wall LW, when SPARTACUS-Urban is better. When using a facet temperature range the performance for both models is poorer. Harman et al. (2004) notably underestimate roof interception, most likely linked to the absence of downward emission from walls higher in the canopy, given all are same height.
The impact of vertically varying T is small on SPARTACUS-Urban, with little impact on the net LW fluxes. However, only one summer day in central London is considered, possibly with small variations in wall T. In other geometries or climates (e.g. subtropical city with taller buildings), the impact of T profile (single, varied) application to the results still needs to be assessed and could be explored in future research.
Overall, this offline evaluation suggests SPARTACUS-Urban's longwave fluxes agree well relative to the more complex and computationally and data-demanding DART model. Alongside the evaluation of SPARTACUS-Urban for shortwave radiation (Stretton et al., 2022b), good model performance is shown here, indicating it is suitable for implementing into a multi-layer urban model. Testing is underway with SPARTACUS-Urban coupled to the Surface Urban Energy and Water balance Scheme (SUEWS; Järvi et al., 2011, 2014; Ward et al., 2016; Omidvar et al., 2022) to predict the vertical profile of fluxes, surface temperatures, and heat stress metrics within the canopy, with future work including an online evaluation of SPARTACUS-Urban within SUEWS. Further, comparisons could be made between existing single- and multi-layer urban radiative transfer schemes, such as done in the RAMI intercomparison for vegetation (Widlowski et al., 2015) or urban energy balance intercomparisons (Grimmond et al., 2010, 2011; Lipson et al., 2023). Such models require high-resolution building geometry information (i.e. vertical descriptions of the urban canopy), which are unavailable for most cities. Therefore, to supplement these implementations an assessment should be made on how realistically available data influence model outputs, e.g. vertically distributed fluxes and temperatures.
The Fortran SPARTACUS-Surface package is available under an open-source license from https://github.com/ecmwf/spartacus-surface (Hogan, 2021). The DART model is available from https://dart.omp.eu (DART, 2022). All code and data used for this study are archived at https://doi.org/10.5281/zenodo.6798640 (Stretton et al., 2022a).
The supplement related to this article is available online at: https://doi.org/10.5194/gmd-16-5931-2023-supplement.
MAS performed the SPARTACUS-Urban simulations and data analysis and wrote the initial manuscript. WM developed the 3D DSM and performed the DART simulations with input from MAS. RJH is the main author of the SPARTACUS-Surface code, which was modified by MAS. All authors designed the manuscript structure, read the manuscript and provided feedback on it. SG and RJH formulated the initial idea. SG obtained funding to support all authors except RJH.
The contact author has declared that none of the authors has any competing interests.
Publisher's note: Copernicus Publications remains neutral with regard to jurisdictional claims in published maps and institutional affiliations.
This research has been supported by the Natural Environment Research Council (Scenario NERC Doctoral Training Partnership Grant), the Engineering and Physical Sciences Research Council (grant nos. 2130186 and EP/P002331/1), the Newton Fund (Newton Fund/Met Office CSSP China NGC), and the European Research Council, Synergy (urbisphere grant no. 855005).
This paper was edited by Volker Grewe and reviewed by two anonymous referees.
Aida, M.: Urban albedo as a function of the urban structure – A model experiment, Bound.-Lay. Meteorol., 23, 405–413, https://doi.org/10.1007/BF00116269, 1982.
Aida, M. and Gotoh, K.: Urban albedo as a function of the urban structure – A two-dimensional numerical simulation – Part II, Bound.-Lay. Meteorol., 23, 415–424, https://doi.org/10.1007/BF00116270, 1982.
Antoniou, N., Montazeri, H., Neophytou, M., and Blocken, B.: CFD simulation of urban microclimate: Validation using high-resolution field measurements, Sci. Total Environ., 695, 133743, https://doi.org/10.1016/J.SCITOTENV.2019.133743, 2019.
Ao, X., Grimmond, C. S. B., Liu, D., Han, Z., Hu, P., Wang, Y., Zhen, X., and Tan, J.: Radiation fluxes in a business district of Shanghai, China, J. Appl. Meteorol. Climatol., 55, 2451–2468, https://doi.org/10.1175/JAMC-D-16-0082.1, 2016.
Arnfield, A. J.: An approach to the estimation of the surface radiative properties and radiation budgets of cities, Phys. Geogr., 3, 97–122, https://doi.org/10.1080/02723646.1982.10642221, 1982.
Arnfield, A. J.: Validation of an estimation model for urban surface albedo, Phys. Geogr., 9, 361–372, https://doi.org/10.1080/02723646.1988.10642360, 1988.
Blankenstein, S. and Kuttler, W.: Impact of street geometry on downward longwave radiation and air temperature in an urban environment, Meteorol. Z., 13, 373–379, https://doi.org/10.1127/0941-2948/2004/0013-0373, 2004.
Bohnenstengel, S. I., Evans, S., Clark, P. A., and Belcher, S. E.: Simulations of the London urban heat island, Q. J. Roy. Meteor. Soc., 137, 1625–1640, https://doi.org/10.1002/QJ.855, 2011.
Chrysoulakis, N., Grimmond, S., Feigenwinter, C., Lindberg, F., Gastellu-Etchegorry, J. P., Marconcini, M., Mitraka, Z., Stagakis, S., Crawford, B., Olofson, F., Landier, L., Morrison, W., and Parlow, E.: Urban energy exchanges monitoring from space, Sci. Rep., 8, 11498, https://doi.org/10.1038/s41598-018-29873-x, 2018.
Crum, S. M. and Jenerette, D. G.: Microclimate variation among urban land covers: The importance of vertical and horizontal structure in air and land surface temperature relationships, J. Appl. Meteorol. Climatol., 56, 2531–2543, https://doi.org/10.1175/JAMC-D-17-0054.1, 2017.
DART: The Discrete Anisotropic Radiative Transfer Model, DART [software], https://dart.omp.eu, last access: 11 January 2022.
Dissegna, M. A., Yin, T., Wu, H., Lauret, N., Wei, S., Gastellu-Etchegorry, J. P., and Grêt-Regamey, A.: Modeling mean radiant temperature distribution in urban landscapes using dart, Remote Sens., 13, 1443, https://doi.org/10.3390/rs13081443, 2021.
Dou, J. and Miao, S.: Impact of mass human migration during Chinese New Year on Beijing urban heat island, Int. J. Climatol., 37, 4199–4210, https://doi.org/10.1002/JOC.5061, 2017.
Evans, S., Hudson-Smith, A., and Batty, M.: 3-D GIS; Virtual London and beyond: An exploration of the 3-D GIS experience involved in the creation of Virtual London, CyberGeo, 2006, 1–20, https://doi.org/10.4000/cybergeo.2871, 2006.
Gaitani, N., Burud, I., Thiis, T., and Santamouris, M.: High-resolution spectral mapping of urban thermal properties with Unmanned Aerial Vehicles, Build. Environ., 121, 215–224, https://doi.org/10.1016/j.buildenv.2017.05.027, 2017.
Gastellu-Etchegorry, J. P., Yin, T., Lauret, N., Cajgfinger, T., Gregoire, T., Grau, E., Feret, J. B., Lopes, M., Guilleux, J., Dedieu, G., Malenovsk?, Z., Cook, B. D., Morton, D., Rubio, J., Durrieu, S., Cazanave, G., Martin, E., and Ristorcelli, T.: Discrete anisotropic radiative transfer (DART 5) for modeling airborne and satellite spectroradiometer and LIDAR acquisitions of natural and urban landscapes, Remote Sens., 7, 1667–1701, https://doi.org/10.3390/rs70201667, 2015.
Grimmond, C. S. B. and Oke, T. R.: Aerodynamic Properties of Urban Areas Derived from Analysis of Surface Form, J. Appl. Meteorol., 38, 1262–1292, https://doi.org/10.1175/1520-0450(1999)038<1262:APOUAD>2.0.CO;2, 1999.
Grimmond, C. S. B. B., Blackett, M., Best, M. J., Barlow, J., Baik, J.-J. J., Belcher, S. E., Bohnenstengel, S. I., Calmet, I., Chen, F., Dandou, A., Fortuniak, K., Gouvea, M. L., Hamdi, R., Hendry, M., Kawai, T., Kawamoto, Y., Kondo, H., Krayenhoff, E. S., Lee, S.-H. H., Loridan, T., Martilli, A., Masson, V., Miao, S., Oleson, K., Pigeon, G., Porson, A., Ryu, Y.-H. H., Salamanca, F., Shashua-Bar, L., Steeneveld, G.-J. J., Tombrou, M., Voogt, J., Young, D., Zhang, N., Grimmond, C. S. B. B., Blackett, M., Best, M. J., Barlow, J., Baik, J.-J. J., Belcher, S. E., Bohnenstengel, S. I., Calmet, I., Chen, F., Dandou, A., Fortuniak, K., Gouvea, M. L., Hamdi, R., Hendry, M., Kawai, T., Kawamoto, Y., Kondo, H., Krayenhoff, E. S., Lee, S.-H. H., Loridan, T., Martilli, A., Masson, V., Miao, S., Oleson, K., Pigeon, G., Porson, A., Ryu, Y.-H. H., Salamanca, F., Shashua-Bar, L., Steeneveld, G.-J. J., Tombrou, M., Voogt, J., Young, D., and Zhang, N.: The International Urban Energy Balance Models Comparison Project: First Results from Phase 1, J. Appl. Meteorol. Climatol., 49, 1268–1292, https://doi.org/10.1175/2010JAMC2354.1, 2010.
Grimmond, C. S. B. B., Blackett, M., Best, M. J., Baik, J. J., Belcher, S. E., Beringer, J., Bohnenstengel, S. I., Calmet, I., Chen, F., Coutts, A., Dandou, A., Fortuniak, K., Gouvea, M. L., Hamdi, R., Hendry, M., Kanda, M., Kawai, T., Kawamoto, Y., Kondo, H., Krayenhoff, E. S., Lee, S. H., Loridan, T., Martilli, A., Masson, V., Miao, S., Oleson, K., Ooka, R., Pigeon, G., Porson, A., Ryu, Y. H., Salamanca, F., Steeneveld, G. J., Tombrou, M., Voogt, J. A., Young, D. T., and Zhang, N.: Initial results from Phase 2 of the international urban energy balance model comparison, Int. J. Climatol., 31, 244–272, https://doi.org/10.1002/joc.2227, 2011.
Guo, G., Zhou, X., Wu, Z., Xiao, R., and Chen, Y.: Characterizing the impact of urban morphology heterogeneity on land surface temperature in Guangzhou, China, Environ. Model. Softw., 84, 427–439, 2016.
Hamdi, R. and Masson, V.: Inclusion of a drag approach in the Town Energy Balance (TEB) scheme: Offline 1D evaluation in a street canyon, J. Appl. Meteorol. Climatol., 47, 2627–2644, https://doi.org/10.1175/2008JAMC1865.1, 2008.
Harman, I. N. and Belcher, S. E.: The surface energy balance and boundary layer over urban street canyons, Q. J. Roy. Meteor. Soc., 132, 2749–2768, 2006.
Harman, I. N., Best, M. J., and Belcher, S. E.: Radiative exchange in an urban street canyon, Bound.-Lay. Meteorol., 110, 301–316, https://doi.org/10.1023/A:1026029822517, 2004.
Heaviside, C., Macintyre, H., and Vardoulakis, S.: The Urban Heat Island: Implications for Health in a Changing Environment, Current Environ. Health Rep., 4, 296–305, https://doi.org/10.1007/s40572-017-0150-3, 2017.
Hénon, A., Mestayer, P. G., Lagouarde, J. P., and Voogt, J. A.: An urban neighborhood temperature and energy study from the CAPITOUL experiment with the Solene model: Part 2: Influence of building surface heterogeneities, Theor. Appl. Climatol., 110, 197–208, https://doi.org/10.1007/s00704-012-0616-z, 2012.
Hersbach, H., Bell, B., Berrisford, P., Hirahara, S., Horányi, A., Muñoz-Sabater, J., Nicolas, J., Peubey, C., Radu, R., Schepers, D., Simmons, A., Soci, C., Abdalla, S., Abellan, X., Balsamo, G., Bechtold, P., Biavati, G., Bidlot, J., Bonavita, M., De Chiara, G., Dahlgren, P., Dee, D., Diamantakis, M., Dragani, R., Flemming, J., Forbes, R., Fuentes, M., Geer, A., Haimberger, L., Healy, S., Hogan, R. J., Hólm, E., Janisková, M., Keeley, S., Laloyaux, P., Lopez, P., Lupu, C., Radnoti, G., de Rosnay, P., Rozum, I., Vamborg, F., Villaume, S., and Thépaut, J. N.: The ERA5 global reanalysis, Q. J. Roy. Meteor. Soc., 146, 1999–2049, https://doi.org/10.1002/QJ.3803, 2020.
Hertwig, D., Gough, H. L., Grimmond, S., Barlow, J. F., Kent, C. W., Lin, W. E., Robins, A. G., and Hayden, P.: Wake Characteristics of Tall Buildings in a Realistic Urban Canopy, Bound.-Lay. Meteorol., 172, 239–270, https://doi.org/10.1007/s10546-019-00450-7, 2019.
Hertwig, D., Grimmond, S., Hendry, M. A., Saunders, B., Wang, Z., Jeoffrion, M., Vidale, P. L., McGuire, P. C., Bohnenstengel, S. I., Ward, H. C., and Kotthaus, S.: Urban signals in high-resolution weather and climate simulations: role of urban land-surface characterisation, Theor. Appl. Climatol., 142, 701–28, https://doi.org/10.1007/s00704-020-03294-1, 2020.
Hertwig, D., Grimmond, S., Kotthaus, S., Vanderwel, C., Gough, H., Haeffelin, M., and Robins, A.: Variability of physical meteorology in urban areas at different scales: implications for air quality, Faraday Discuss., 226, 149–172, https://doi.org/10.1039/D0FD00098A, 2021.
Hilland, R. V. J. and Voogt, J. A.: The effect of sub-facet scale surface structure on wall brightness temperatures at multiple scales, Theor. Appl. Climatol., 140, 767–785, https://doi.org/10.1007/s00704-020-03094-7, 2020.
Hogan, R. J.: An Exponential Model of Urban Geometry for Use in Radiative Transfer Applications, Bound.-Lay. Meteorol., 170, 357–372, https://doi.org/10.1007/s10546-018-0409-8, 2019a.
Hogan, R. J.: Flexible Treatment of Radiative Transfer in Complex Urban Canopies for Use in Weather and Climate Models, Bound.-Lay. Meteorol., 173, 53–78, https://doi.org/10.1007/s10546-019-00457-0, 2019b.
Hogan, R. J.: spartacus-surface, https://github.com/ecmwf/spartacus-surface (last access: 29 November 2021), 2021.
Hogan, R. J., Schäfer, S. A. K., Klinger, C., Chiu, J. C., and Mayer, B.: Representing 3-D cloud radiation effects in two-stream schemes: 2. Matrix formulation and broadband evaluation, J. Geophys. Res., 121, 8583–8599, https://doi.org/10.1002/2016JD024875, 2016.
Hogan, R. J., Quaife, T., and Braghiere, R.: Fast matrix treatment of 3-D radiative transfer in vegetation canopies: SPARTACUS-Vegetation 1.1, Geosci. Model Dev., 11, 339–350, https://doi.org/10.5194/gmd-11-339-2018, 2018.
Hu, L. and Wendel, J.: Analysis of urban surface morphologic effects on diurnal thermal directional anisotropy, ISPRS J. Photogramm. Remote, 148, 1–12, 2019.
Järvi, L., Grimmond, C. S. B. S. B., and Christen, A.: The Surface Urban Energy and Water Balance Scheme (SUEWS): Evaluation in Los Angeles and Vancouver, J. Hydrol., 411, 219–237, https://doi.org/10.1016/j.jhydrol.2011.10.001, 2011.
Järvi, L., Grimmond, C. S. B., Taka, M., Nordbo, A., Setälä, H., and Strachan, I. B.: Development of the Surface Urban Energy and Water Balance Scheme (SUEWS) for cold climate cities, Geosci. Model Dev., 7, 1691–1711, https://doi.org/10.5194/gmd-7-1691-2014, 2014.
Kent, C. W., Grimmond, S., Gatey, D., and Hirano, K.: Urban morphology parameters from global digital elevation models: Implications for aerodynamic roughness and for wind-speed estimation, Remote Sens. Environ., 221, 316–339, https://doi.org/10.1016/j.rse.2018.09.024, 2019.
Kershaw, S. E. and Millward, A. A.: A spatio-temporal index for heat vulnerability assessment, Environ. Monit. Assess., 184, 7329–7342, https://doi.org/10.1007/s10661-011-2502-z, 2012.
Kondo, A., Ueno, M., Kaga, A., and Yamaguchi, K.: The influence of urban canopy configuration on urban albedo, Bound.-Lay. Meteorol., 100, 225–242, https://doi.org/10.1023/A:1019243326464, 2001.
Kotthaus, S., Smith, T. E. L., Wooster, M. J., and Grimmond, C. S. B. S. B.: Derivation of an urban materials spectral library through emittance and reflectance spectroscopy, ISPRS J. Photogramm. Remote, 94, 194–212, 2014.
Kusaka, H., Kondo, H., Kikegawa, Y., and Kimura, F.: A simple single-layer urban canopy model for atmospheric models: Comparison with multi-layer and slab models, Bound.-Lay. Meteorol., 101, 329–358, https://doi.org/10.1023/A:1019207923078, 2001.
Landier, L., Gastellu-Etchegorry, J. P., Al Bitar, A., Chavanon, E., Lauret, N., Feigenwinter, C., Mitraka, Z., and Chrysoulakis, N.: Calibration of urban canopies albedo and 3D shortwave radiative budget using remote-sensing data and the DART model, Eur. J. Remote Sens., 51, 739–753, https://doi.org/10.1080/22797254.2018.1462102, 2018.
Lee, S. H. and Park, S. U.: A vegetated urban canopy model for meteorological and environmental modelling, Bound.-Lay. Meteorol., 126, 73–102, https://doi.org/10.1007/s10546-007-9221-6, 2008.
Lipson, M., Grimmond, S., Best, M., Abramowitz, G., Coutts, A., Tapper, N., Baik, J.-J., Beyers, M., Blunn, L., Boussetta, S., Bou-Zeid, E., De Kauwe, M. G., de Munck, C., Demuzere, M., Fatichi, S., Fortuniak, K., Han, B.-S., Hendry, M., Kikegawa, Y., Kondo, H., Lee, D.-I., Lee, S.-H., Lemonsu, A., Machado, T., Manoli, G., Martilli, A., Masson, V., McNorton, J., Meili, N., Meyer, D., Nice, K. A., Oleson, K. W., Park, S.-B., Roth, M., Schoetter, R., Simon, A., Steeneveld, G.-J., Sun, T., Takane, Y., Thatcher, M., Tsiringakis, A., Varentsov, M., Wang, C., Wang, Z.-H., and Pitman, A.: Evaluation of 30 urban land surface models in the Urban-PLUMBER project: Phase 1 results, Q. J. Roy. Meteor. Soc., in review, 2023.
Martilli, A.: On the Derivation of Input Parameters for Urban Canopy Models from Urban Morphological Datasets, Bound.-Lay. Meteorol., 130, 301–306, https://doi.org/10.1007/s10546-008-9345-3, 2009.
Martilli, A., Clappier, A., and Rotach, M. W.: An Urban Surface Exchange Parameterisation for Mesoscale Models, Bound.-Lay. Meteorol., 104, 261–304, https://doi.org/10.1023/A:1016099921195, 2002.
Masson, V.: A Physically-Based Scheme For The Urban Energy Budget In Atmospheric Models, Bound.-Lay. Meteorol., 94, 357–397, https://doi.org/10.1023/A:1002463829265, 2000.
Masson, V.: Urban surface modeling and the meso-scale impact of cities, Theor. Appl. Climatol., 84, 35–45, https://doi.org/10.1007/s00704-005-0142-3, 2006.
Masson, V., Gomes, L., Pigeon, G., Liousse, C., Pont, V., Lagouarde, J. P., Voogt, J., Salmond, J., Oke, T. R., Hidalgo, J., Legain, D., Garrouste, O., Lac, C., Connan, O., Briottet, X., Lachérade, S., and Tulet, P.: The Canopy and Aerosol Particles Interactions in TOulouse Urban Layer (CAPITOUL) experiment, Meteorol. Atmos. Phys., 102, 135–157, https://doi.org/10.1007/s00703-008-0289-4, 2008.
Meyn, S. K. and Oke, T. R.: Heat fluxes through roofs and their relevance to estimates of urban heat storage, Energy Build., 41, 745–752, https://doi.org/10.1016/J.ENBUILD.2009.02.005, 2009.
Morrison, W., Kotthaus, S., Grimmond, C. S. B., Inagaki, A., Yin, T., Gastellu-Etchegorry, J. P., Kanda, M., and Merchant, C. J.: A novel method to obtain three-dimensional urban surface temperature from ground-based thermography, Remote Sens. Environ., 215, 268–283, https://doi.org/10.1016/j.rse.2018.05.004, 2018.
Morrison, W., Yin, T., Lauret, N., Guilleux, J., Kotthaus, S., Gastellu-Etchegorry, J. P., Norford, L., and Grimmond, S.: Atmospheric and emissivity corrections for ground-based thermography using 3D radiative transfer modelling, Remote Sens. Environ., 237, 111524, https://doi.org/10.1016/j.rse.2019.111524, 2020.
Morrison, W., Kotthaus, S., and Grimmond, S.: Urban surface temperature observations from ground-based thermography: intra- and inter-facet variability, Urban Clim., 35, 100748, https://doi.org/10.1016/j.uclim.2020.100748, 2021.
Myint, S. W., Wentz, E. A., Brazel, A. J., and Quattrochi, D. A.: The impact of distinct anthropogenic and vegetation features on urban warming, Landsc. Ecol., 28, 959–978, https://doi.org/10.1007/s10980-013-9868-y, 2013.
Nazarian, N. and Kleissl, J.: CFD simulation of an idealized urban environment: Thermal effects of geometrical characteristics and surface materials, Urban Clim., 12, 141–159, https://doi.org/10.1016/J.UCLIM.2015.03.002, 2015.
Nunez, M. and Oke, T. R.: The Energy Balance of an Urban Canyon, J. Appl. Meteorol., 16, 11–19, https://doi.org/10.1175/1520-0450(1977)016<0011:TEBOAU>2.0.CO;2, 1977.
Oke, T. R.: Canyon geometry and the nocturnal urban heat island: Comparison of scale model and field observations, J. Climatol., 1, 237–254, https://doi.org/10.1002/JOC.3370010304, 1981.
Oke, T. R.: The energetic basis of the urban heat island, Q. J. Roy. Meteor. Soc., 108, 1–24, 1982.
Oke, T. R.: Boundary Layer Climates, 2nd edn., Methuen Co., London, New York, 435, 1987.
Omidvar, H., Sun, T., Grimmond, S., Bilesbach, D., Black, A., Chen, J., Duan, Z., Gao, Z., Iwata, H., and McFadden, J. P.: Surface Urban Energy and Water Balance Scheme (v2020a) in vegetated areas: parameter derivation and performance evaluation using FLUXNET2015 dataset, Geosci. Model Dev., 15, 3041–3078, https://doi.org/10.5194/gmd-15-3041-2022, 2022.
Ryu, Y. H. and Baik, J. J.: Quantitative analysis of factors contributing to urban heat island intensity, J. Appl. Meteorol. Climatol., 51, 842–851, https://doi.org/10.1175/JAMC-D-11-098.1, 2012.
Ryu, Y.-H., Baik, J.-J., Kwak, K.-H., Kim, S., and Moon, N.: Impacts of urban land-surface forcing on ozone air quality in the Seoul metropolitan area, Atmos. Chem. Phys., 13, 2177–2194, https://doi.org/10.5194/acp-13-2177-2013, 2013.
Schubert, S., Grossman-Clarke, S., and Martilli, A.: A Double-Canyon Radiation Scheme for Multi-Layer Urban Canopy Models, Bound.-Lay. Meteorol., 145, 439–468, https://doi.org/10.1007/s10546-012-9728-3, 2012.
Sobrino, J. A., Mattar, C., Gastellu-Etchegorry, J. P., Jiménez-Muñoz, J. C., and Grau, E.: Evaluation of the DART 3D model in the thermal domain using satellite/airborne imagery and ground-based measurements, Int. J. Remote Sens., 32, 7453–7477, https://doi.org/10.1080/01431161.2010.524672, 2011.
Souch, C. and Grimmond, S.: Applied climatology: Urban climate, Prog. Phys. Geogr., 30, 270–279, https://doi.org/10.1191/0309133306PP484PR, 2006.
Stretton, M., Morrison, W., Hogan, R., and Grimmond, S.: Data and Code for: Evaluation of vertically resolved longwave radiation in SPARTACUS-Urban and the sensitivity to urban surface temperatures, Zenodo [code and data set], https://doi.org/10.5281/zenodo.6798640, 2022a.
Stretton, M. A., Morrison, W., Hogan, R. J., and Grimmond, S.: Evaluation of the SPARTACUS-Urban Radiation Model for Vertically Resolved Shortwave Radiation in Urban Areas, Bound.-Lay. Meteorol., 184, 301–331, https://doi.org/10.1007/s10546-022-00706-9, 2022b.
Voogt, J. A., Oke, T. R., and Voogt, T. O.: Complete urban surface temperatures, J. Appl. Meteorol., 36, 1117–1132, https://doi.org/10.1175/1520-0450(1997)036<1117:CUST>2.0.CO;2, 1997.
Ward, H. C., Kotthaus, S., Järvi, L., and Grimmond, C. S. B.: Surface Urban Energy and Water Balance Scheme (SUEWS): Development and evaluation at two UK sites, Urban Clim., 18, 1–32, https://doi.org/10.1016/j.uclim.2016.05.001, 2016.
Widlowski, J. L., Mio, C., Disney, M., Adams, J., Andredakis, I., Atzberger, C., Brennan, J., Busetto, L., Chelle, M., Ceccherini, G., Colombo, R., Côté, J. F., Eenmäe, A., Essery, R., Gastellu-Etchegorry, J. P., Gobron, N., Grau, E., Haverd, V., Homolová, L., Huang, H., Hunt, L., Kobayashi, H., Koetz, B., Kuusk, A., Kuusk, J., Lang, M., Lewis, P. E., Lovell, J. L., Malenovský, Z., Meroni, M., Morsdorf, F., Mõttus, M., Ni-Meister, W., Pinty, B., Rautiainen, M., Schlerf, M., Somers, B., Stuckens, J., Verstraete, M. M., Yang, W., Zhao, F., and Zenone, T.: The fourth phase of the radiative transfer model intercomparison (RAMI) exercise: Actual canopy scenarios and conformity testing, Remote Sens. Environ., 169, 418–437, https://doi.org/10.1016/j.rse.2015.08.016, 2015.
Wu, J., Zhou, Y., Gao, Y., Fu, J. S., Johnson, B. A., Huang, C., Kim, Y. M., and Liu, Y.: Estimation and uncertainty analysis of impacts of future heat waves on mortality in the Eastern United States, Environ. Heal. Persp., 122, 10–16, https://doi.org/10.1289/ehp.1308042r, 2014.
Zhang, J., Heng, C. K., Malone-Lee, L. C., Hii, D. J. C., Janssen, P., Leung, K. S., and Tan, B. K.: Evaluating environmental implications of density: A comparative case study on the relationship between density, urban block typology and sky exposure, in: Automation in Construction, 20, 90–101, https://doi.org/10.1016/j.autcon.2011.06.011, 2012.