the Creative Commons Attribution 4.0 License.
the Creative Commons Attribution 4.0 License.
 | 10 Oct 2023
A two-way coupled regional urban–street network air quality model system for Beijing, China
Tao Wang
Jie Li
Shuai Wang
Youngseob Kim
Wenyi Yang
Huiyun Du
Zifa Wang
Owing to the substantial traffic emissions in urban areas, especially near road areas, the concentrations of pollutants, such as ozone (O3) and its precursors, have a large difference compared to regional averages, and their distributions cannot be captured accurately by traditional single-scale air quality models. In this study, a new version of a regional urban–street network model (an Integrated Air Quality Modeling System coupling regional urban–street: IAQMS-street v2.0) is presented. An upscaling module is implemented in IAQMS-street v2.0 to calculate the impact of mass transfer to regional scale from street network. The influence of pollutants in the street network is considered in the concentration calculation on the regional scale, which is not considered in a previous version (IAQMS-street v1.0). In this study, the simulated results in Beijing during August 2021, using IAQMS-street v2.0, IAQMS-street v1.0, and the regional model (Nested Air Quality Prediction Modeling System, NAQPMS), are compared. On-road traffic emissions in Beijing, as the key model input data, were established using intelligent image-recognition technology and real-time traffic big data from navigation applications. The simulated results showed that the O3 and nitrogen oxide (NOx) concentrations in Beijing were reproduced by using IAQMS-street v2.0 on both the regional scale and street scale. The prediction fractions within a factor of 2 (FAC2s) between simulations and observations of NO and NO2 increased from 0.11 and 0.34 in NAQPMS to 0.78 and 1.00 in IAQMS-street v2.0, respectively. The normalized mean biases (NMBs) of NO and NO2 decreased from 2.67 and 1.33 to −0.25 and 0.08. In the coupled model, the concentration of NOx at the street scale is higher than that at the regional scale, and the simulated distribution of pollutants on a regional scale was improved in IAQMS-street v2.0 when compared with that in IAQMS-street v1.0. We further used IAQMS-street v2.0 to quantify the contribution of local on-road traffic emissions to the O3 and NOx emissions and analyze the effect of traffic regulation policies in Beijing. Results showed that heavy-duty trucks are the major source of on-road traffic emissions of NOx. The relative contributions of local traffic emissions to NO2, NO, and O3 concentrations were 53.41 %, 57.45 %, and 8.49 %, respectively. We found that traffic regulation policies in Beijing largely decreased the concentrations of NOx and hydrocarbons (HC); however, the O3 concentration near the road increased due to the decrease consumption of O3 by NO. To decrease the O3 concentration in urban areas, controlling the local emissions of HC and NOx from other sources requires consideration.
- Article
(8048 KB) - Full-text XML
-
Supplement
(828 KB) - BibTeX
- EndNote


Air pollution can affect climate change and human health, and it has been the focus of the public and policymakers, especially in recent years (An et al., 2013). In China, a series of strict clean-air action plans have been implemented to decrease the concentration of particulate matters with aerodynamic diameters less than 2.5 µm (PM2.5). The mean PM2.5 concentration was 61.8 µg m−3 in 2013 and reduced to 42.0 µg m−3 in 2017 (Zhang et al., 2019). In contrast, the concentration of surface ozone (O3) has generally been increasing (Li et al., 2019; Wang et al., 2019). The maximum 8 h O3 concentration reached 196 µg m−3 in the North China Plain in 2019. In addition, 48.2 % of the polluted days in 2019 were caused by O3. Owing to its increasing concentration trend and adverse impacts on humans and vegetation, an increasing number of studies have focused on the mechanism of O3 formation and relevant control strategies.
The O3 concentration is influenced by the meteorological fields, precursor–emission intensities, photochemical processes, and regional transport processes (Zheng et al., 2018; T. Wang et al., 2017). As the precursors of O3, nitrogen oxides (NOx) and volatile organic compounds (VOCs) have complicated nonlinear relationships. The formation of surface O3 can be divided into the NOx-sensitive and VOC-sensitive regions, owing to the complexity of photochemical processes (Sillman, 1999), with the primary control species of the precursors requiring careful consideration according to the sensitive region in each case. The O3 concentration may even increase after conducting inappropriate precursor control; consequently, increasing the precision of simulations of O3 and its precursors at the urban scale constitutes an urgent scientific topic.
Regional-scale air quality models are common tools for analyzing air pollution episodes, such as the Comprehensive Air Quality Model with Extensions (CAMx), the Community Multiscale Air Quality (CMAQ) model (Byun and Schere, 2006), and the Nested Air Quality Prediction Modeling System (NAQPMS), have been widely used in air quality research (J. Li et al., 2012; Y. J. Wang et al., 2017; Cheng et al., 2019; W. J. Zhang et al., 2020). The influence of anthropogenic emissions on the regional atmospheric environment has been assessed through sensitivity analyses using regional models (W. J. Zhang et al., 2020; Cheng et al., 2019) or source-apportionment analyses (Wagstrom et al., 2008; Yarwood et al., 1996; Y. J. Wang et al., 2017; Lin et al., 2016; Li et al., 2015; Y. Li et al., 2012). However, regional models have spatial resolutions that are usually coarser than 1×1 km, thereby being unable to capture the emission and diffusion characteristics of pollutants at the street scale (Baik and Kim, 2010). Thus, the influence of local emissions on air quality at the street scale cannot be simulated using regional models.
Local-scale air quality models, such as the computational fluid dynamic (CFD) and street-scale network models, which consider the impact of urban building topography on the diffusion of pollutants (Depaul and Sheih, 1985, 1986; Wedding et al., 1977), have been adopted by numerous researchers to investigate the distribution of pollutants at a finer spatial resolution (Vardoulakis et al., 2003; Y. Zhang et al., 2021; Patterson and Harley, 2019; Soulhac et al., 2012). The flow field and dispersion of pollutants on the local scale, such as street canyons, can be accurately simulated by the CFD model, but it is more suitable for air quality simulations over a few streets rather than at the urban scale. In addition, the CFD model does not usually consider complex chemical reactions; this introduces limitations to the simulation of secondary pollutants, such as O3 (Fellini et al., 2019; Thouron et al., 2019; Ashie and Kono, 2011). Street-scale network models, such as the Model of Urban Network of Intersecting Canyons and Highways (MUNICH), an operational urban dispersion model (SIRANE), and the Operational Street Pollution Model (OSPM; Kakosimos et al., 2010; Soulhac et al., 2011; Kim et al., 2018, 2022), can simulate the distribution of pollutants at the street scale with a lower computational cost. MUNICH has been widely used for investigating the air quality at the street scale (Gavidia-Calderón et al., 2021; Lugon et al., 2020; Kim et al., 2018). Further studies showed that the simulations of the street-scale model are influenced by the utilized background field in each case, which may be provided by a regional model (Lv et al., 2022; Wang et al., 2022a; Kim et al., 2018). Therefore, to provide a more dynamic and precise background field, it is essential to build a two-way integrated regional urban–street network air quality model, and the feedback of street-network-scale model on regional urban background needs to be considered. Many researchers have focused on the development and application of coupled regional urban–street-network-scale air quality models (Lv et al., 2022; Nuterman et al., 2021; Biggart et al., 2020; Lugon et al., 2020; Benavides et al., 2019; Kim et al., 2018; Hood et al., 2018; Isakov et al., 2007, 2009). However, most coupled models involve large uncertainties originating mainly from traffic emissions; hence, they need more refined emission inventories as input (Biggart et al., 2020).
The variation in the emission inventory of O3 precursors is critical to O3 generation. Traffic emissions become one of the main sources of O3 precursors, especially in urban areas. Cheng et al. (2019) found that the anthropogenic emissions of NOx and VOCs in 2017 decreased by 42.9 % and 42.4 %, respectively, when compared with the emissions in 2013, owing to strict industrial emission control in China. However, the contribution of traffic to the NOx emissions increased from 67.2 % in 2013 to >80 % in 2017. In additional, emission uncertainties, caused by the spatial mismatch between the locations of emissions and spatial proxies, can lead to additional uncertainties in air quality simulations, especially in small-scale regions (Zheng et al., 2017); hence, real-time, high-resolution traffic emission inventories are also essential for more precise coupled model simulations.
In this study, we developed a new version of dynamic urban street-scale model (Integrated Air Quality Modeling System coupling regional urban–street; IAQMS-street v2.0) using a two-way coupling between the MUNICH street-scale model and NAQPMS regional air quality model, based on previous version of IAQMS-street v1.0 (Wang et al., 2022a). The hourly variation and spatial distribution of O3 and NOx concentrations were simulated in Beijing during August 2021. An upscaling module is added to transfer the pollutants from the street-scale model to a regional model, which is not considered in IAQMS-street v1.0. We used image-recognition technology based on road monitoring and traffic big data to create high-resolution traffic emission inventories. To evaluate the performance of the IAQMS-street v2.0, we conducted simulations under different models (IAQMS-street v2.0, IAQMS-street v1.0, and NAQPMS) and validated the simulation results through comparison with observations from monitoring sites and on-road observations. In the following, we discuss the simulation differences among the two-way coupled (IAQMS-street v2.0), one-way coupled (IAQMS-street v1.0), and regional models (NAQPMS) and analyze the O3 and NOx distribution characteristics. Furthermore, we quantify the contribution of on-road vehicle emissions to the distribution of O3 and NOx concentration. The influence of traffic management and control measures on the variation in the traffic emissions and pollutant concentrations are quantified.
2.1 Coupled regional urban–street-network-scale model
As the regional-scale model used in IAQMS-street v2.0, the NAQPMS regional air quality model is a 3-dimensional Eulerian chemical transport model that reproduces the chemical and physical process of pollutants by solving the mass balance equations The physical processes include the horizontal advection, vertical advection and diffusion, dry and wet deposition in NAQPMS, and also includes a gaseous chemical mechanism (carbon bond mechanism Z, CBM-Z) for the chemical reaction processes of pollutants. NAQPMS has been widely used for investigating regional pollution events in China (Yang et al., 2019; Z. Wang et al., 2014; Z. F. Wang et al., 2014; Lin et al., 2007; Wang et al., 2006), since it performs well in operational forecasting. For additional information on the regional model, we refer to J. Li et al. (2007, 2011, 2012).
The pollutant concentration in NAQPMS at the next time step is calculated as follows:
where dt is the time step, Ct is the concentration in grid cell at time t, and Ct+dt is the concentration at the next time. As shown in Eq. (2), the variation in the pollutant concentration dC is influenced by the emissions process (Cemiss), advection process (Cadv), diffusion process (Cdiff), chemical process (Cchem), and dry and wet deposition (Cdep).
The MUNICH street network model was developed to simulate the concentration of pollutants in a street network by Kim et al. (2018). The emission, dry and wet deposition, horizontal transport, and vertical transport processes between the background and urban canopy were included in the model; it also includes a gaseous chemical mechanism (CB05), whose species were matched with those of CBM-Z in the regional model during the coupling process. For a more detailed description of MUNICH, we refer to Kim et al. (2018) and Lugon et al. (2020).
In MUNICH, the pollutant concentration in streets are calculated as follows:
where both the chemical process and physical process are considered in the calculation of pollutant concentration, and the physical process included the inflow rate of pollutant between streets (Qinflow), the vertical transfer process between streets and the urban background atmosphere (Qvert), the traffic emission rate from on-road vehicles (Qemis), and the dry and wet deposition (Fdep). Cbg is the background concentration that is simulated by regional model. γ is the transfer efficiency between the street and background concentration.
The introduction of detail parameter settings in MUNICH can be found in Lugon et al. (2020).
A one-way-integrated air quality modeling system named IAQMS-street v1.0 has been developed in previous research (Wang et al., 2022a). In IAQMS-street v1.0, the pollutant background concentrations in the study period were simulated by NAQPMS, and as the input data of MUNICH, the background concentrations were provided for the simulation of pollutants at street scale. MUNICH was used as a standalone model with a one-way coupling approach. The influence of mass transfer of pollutants from streets to urban background was not considered in IAQMS-street v1.0. In this study, IAQMS-street was further developed by adding an upscaling module to achieve the feedback of MUNICH to NAQPMS (named IAQMS-street v2.0), thereby influencing the variation in background concentrations. The simulation results from NAQPMS and MUNICH were two-way coupled to represent the hourly variation and spatial distribution of air pollutants at the regional scale and local scale.
In IAQMS-street v2.0, the influence of the mass flux from the street in MUNICH to grid cell in NAQPMS is considered to update the background concentration. An upscaling module is added in IAQMS-street v2.0; the pollutants were transferred from the street to urban background by Qvert in Eq. (4), and the mass flux of pollutants is set as an added traffic emission Cemiss in Eq. (2) to calculate the concentration in the grid cell at the next time step. The pollutant concentration in the grid cell at the next time step was calculated by the pollutant mass in street and background mass in grid cell.
where Cgrid is the mean pollutant concentration in the grid cell, Mstreet is the pollutant mass in streets, Mbg is the background pollutant mass, and Vgrid is grid volume, which includes the street volume. In this study, NAQPMS and MUNICH were two-way coupled and applied to Beijing. The coupling schematic diagram of NAQPMS and MUNICH is shown in Fig. 1. The simulation results of MUNICH at street scale are related to the simulated concentration in the bottom layer of NAQPMS. In the two-way coupled module, the background concentration and meteorological data were simulated by NAQPMS and provided to street scale by downscaling module, and the influence of mass flux of the pollutant from street to regional background were calculated by the upscaling module. MUNICH was located within the lowest NAQPMS layer. After the calculation of the mass flux between the urban canopy and urban background, the upscaling module would transfer the pollutants from MUNICH to NAQPMS to compute the pollutant concentrations in bottom layer of NAQPMS. The fixed time step for interfacing between NAQPMS and MUNICH was 20 min; i.e., the same as that of the regional model.
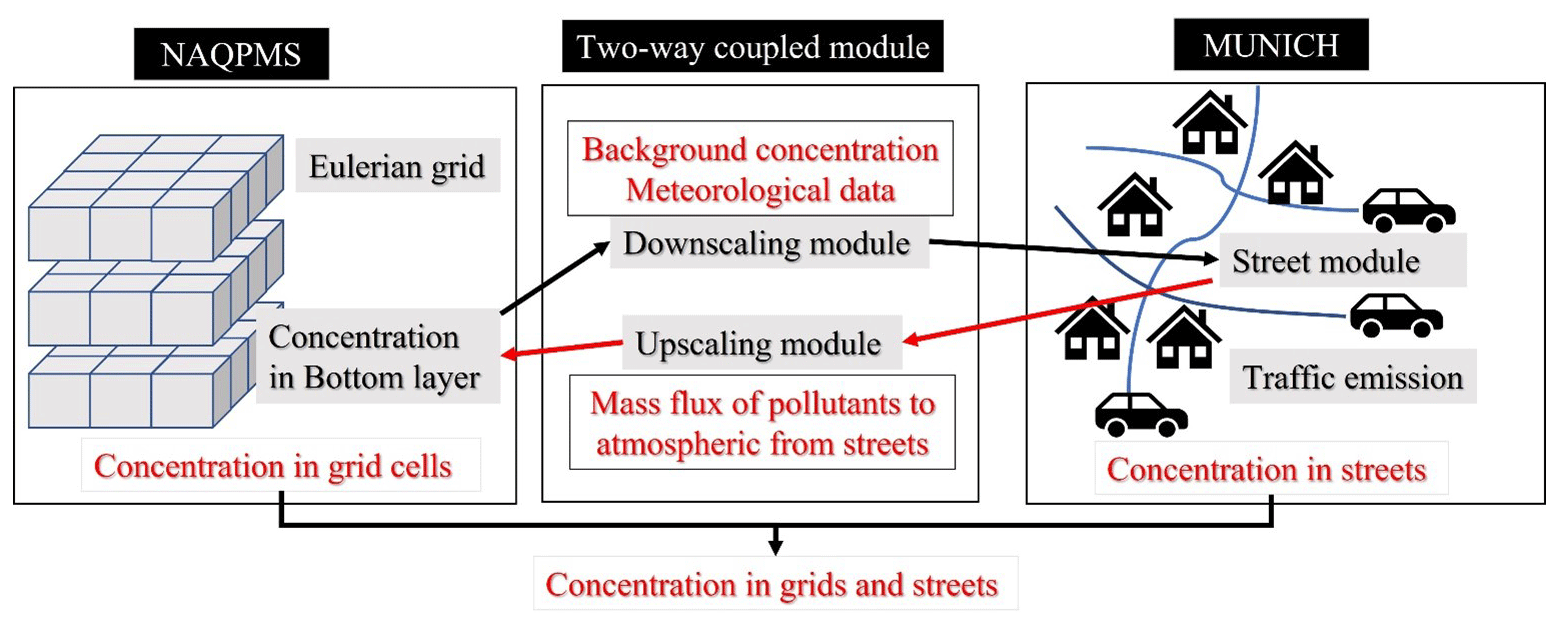
Figure 1The framework of the two-way coupled model IAQMS-street v2.0. An upscaling module is added in the two-way coupled module to transfer the calculated mass flux between streets and regional background in the street network model to the regional model.
The simulation space range is a two-level nested domain in NAQPMS (as shown in Fig. 2a), with the largest domain (d01) covering the middle and east of China, and the horizontal resolution of d01 in NAQPMS is 9 km. In the inner domain (d02), which is the simulation space range covering the whole Beijing area, the horizontal resolution in this study is 1 km. The domain setting covered the Beijing area in MUNICH, and the locations of the streets and observation sites in Beijing are shown in Fig. 2b. The simulation of the surface O3 and NOx concentrations was conducted from 1 to 31 August 2021, when the photochemical reactions were strong. In this study, the height of the bottom layer in the regional model is 48.32 m over the Beijing area, and the average building height in Beijing used in this study is 10.8 m, which meets the requirement that the height of the street model needs to be lower than the bottom height of the regional model in two-way coupled models (Lugon et al., 2020).
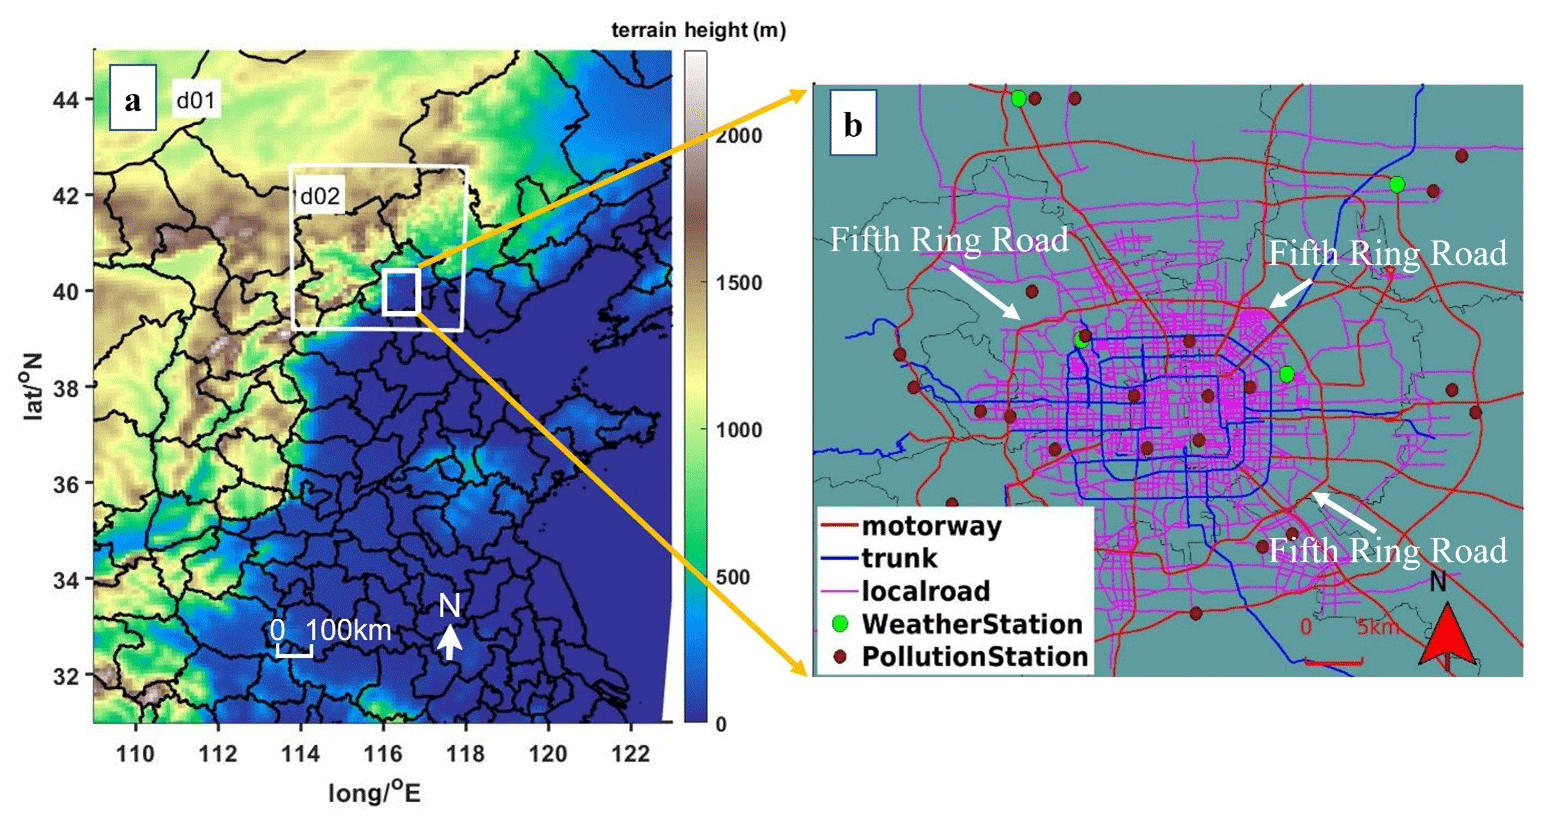
Figure 2(a) Simulation domains at regional scale. The largest domain 1 (d01) covers the middle and east of China, with a horizontal grid spacing of 9 km, and an inner domain (d02) covers Beijing and the surrounding areas with a horizontal grid spacing of 1 km. (b) The modeling area and street network in the street-scale model. Green and brown points indicate the locations of the urban monitoring stations.
2.2 Traffic emission model
As essential inputs to regional air quality model, emission inventories are important to the simulation results. The additional uncertainties in the simulation results arose for gridded emissions with finer resolutions because of spatial errors, especially in urban areas (Zheng et al., 2017). In this study, on-road traffic emissions were calculated based on real-time traffic speed data and road-vehicle-recognition technology to reduce additional uncertainties.
To obtain dynamic high-resolution traffic emission inventories, a real-time on-road traffic emission model (ROE) was developed by Wu et al. (2020); the street network traffic emissions were calculated by using real-time traffic-speed data, traffic volume, and vehicle emission factors. Navigation applications such as Gaode Map and Baidu Maps provide the original traffic speed data. Based on traffic big data, the traffic volume was calculated by using the Underwood speed–volume calculation formula (Underwood, 1961), with the proportion of different vehicles on the road being set before using the ROE. For a detailed description of ROE, we refer to Wu et al. (2020); for the model configuration of traffic emissions in Beijing, we refer to Wang et al. (2022b).
It is worth noting that because of the implementation of road traffic control measures (e.g., diesel vehicles below the national grade IV are forbidden from entering the Fifth Ring Road in Beijing), the proportions of vehicles in urban and suburban areas were different in Beijing. To obtain information on road vehicles on urban and suburban roads in Beijing, the traffic flow and proportion of vehicles on different roads were counted using a real-time object-detection system (YOLOv5s; Jocher, 2020). Sampling locations for vehicles at motorways, trunk roads, and local roads in Beijing during the study period are shown in Fig. 3a; the road vehicle detection results are shown in Fig. 3b.
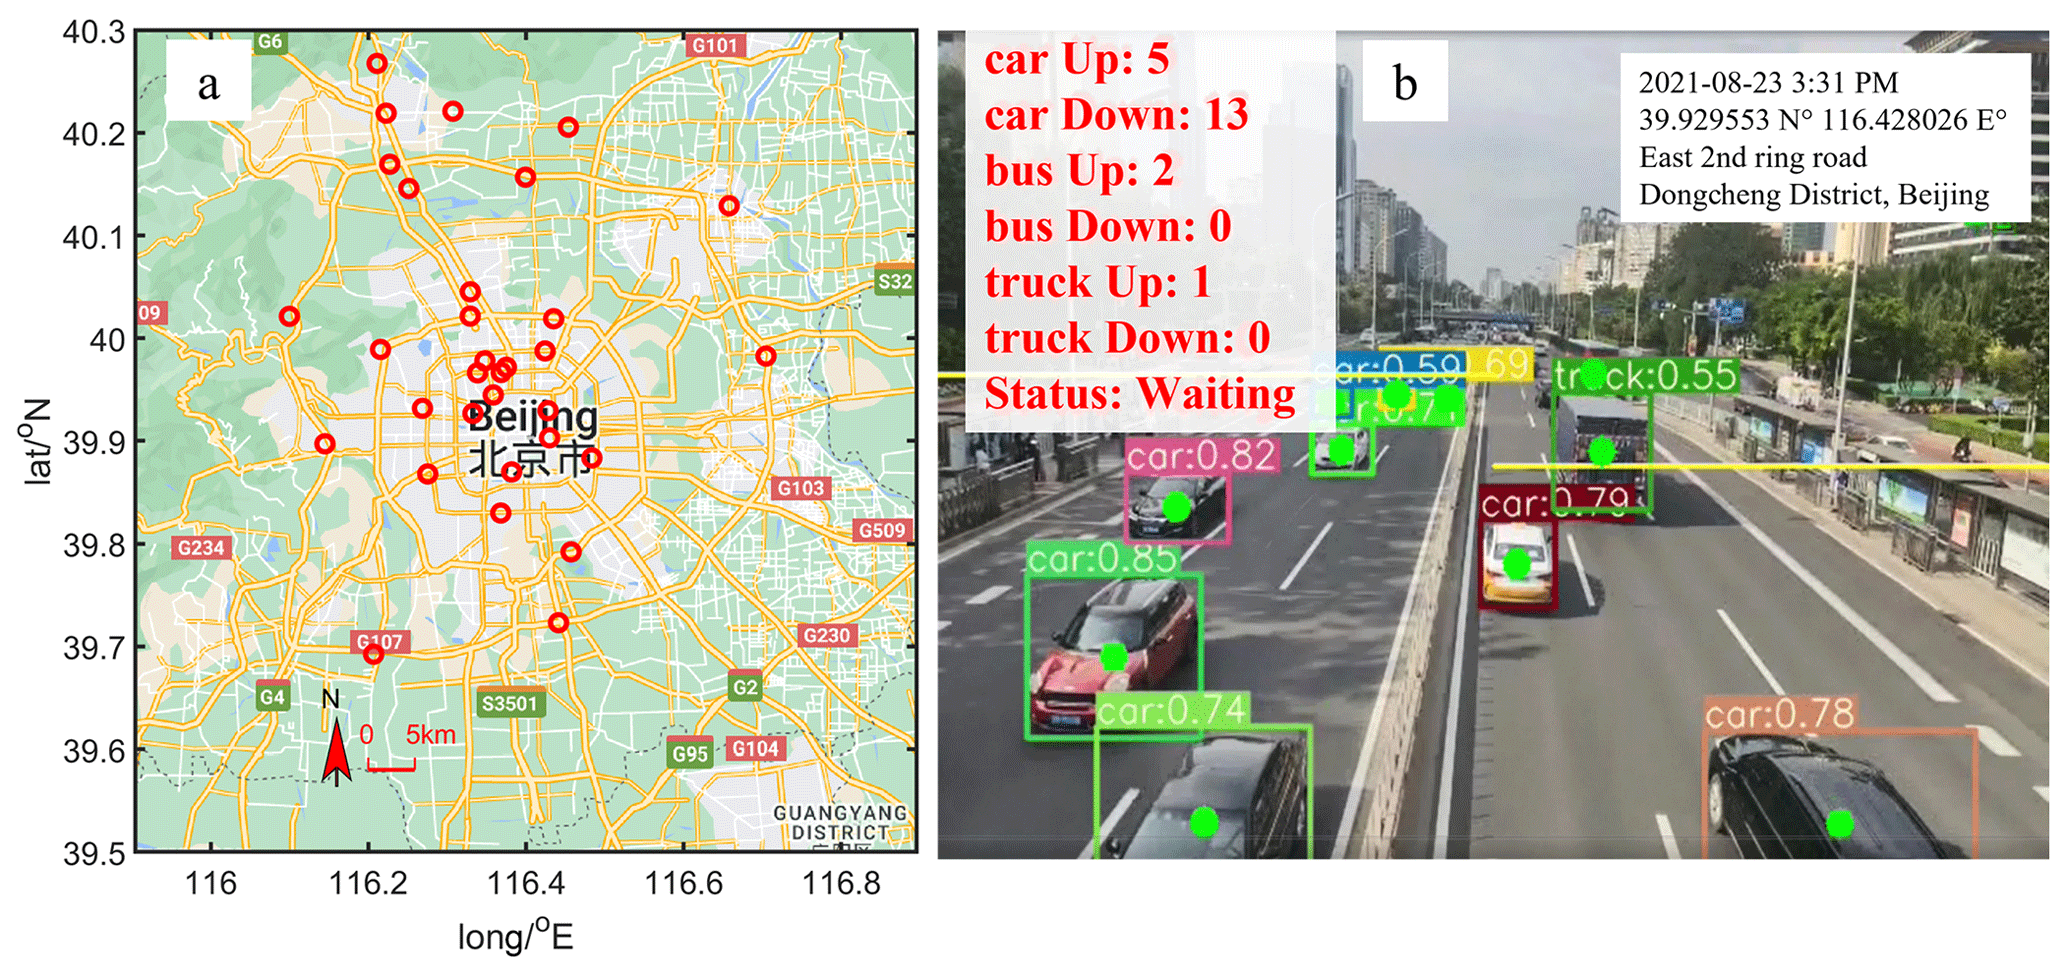
Figure 3(a) Locations of observation sites on different roads for vehicle information (imagery and map data: © Google 2022). (b) Detection results of vehicles on road from the YOLOv5s system.
2.3 Simulation scenarios
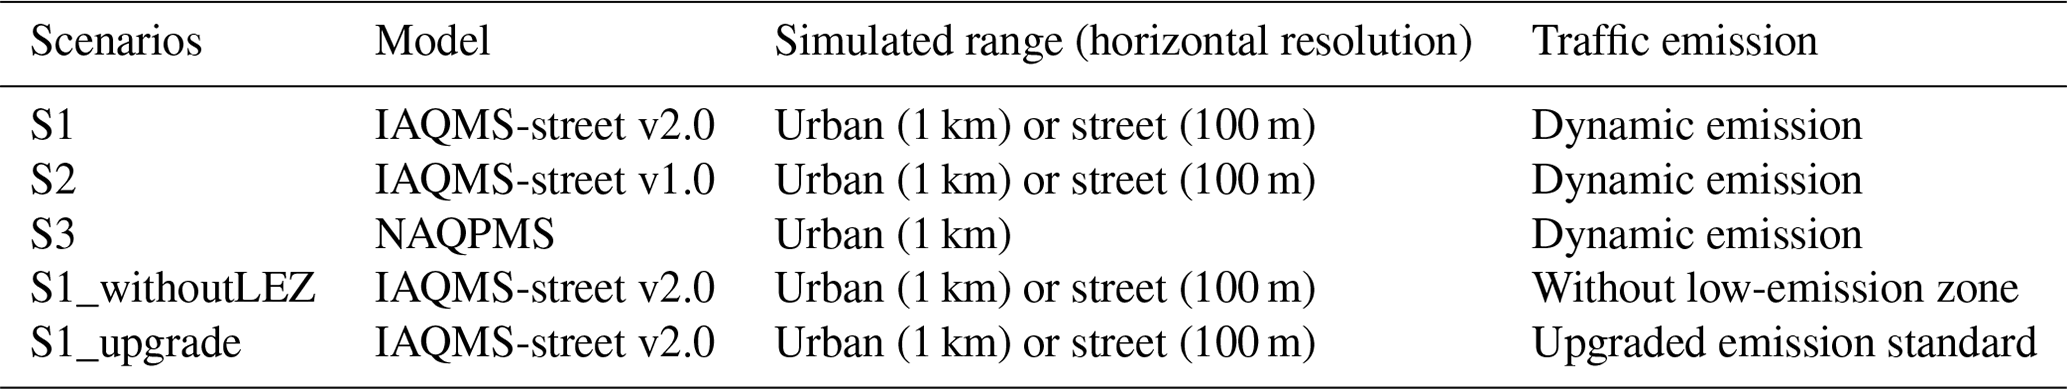
Model performances were evaluated through five simulation scenarios (Table 1). Three scenarios with different models, involving a two-way coupled model (S1 is IAQMS-street v2.0), one-way coupled model (S2 is IAQMS-street v1.0), and regional model (S3 is NAQPMS), were simulated with hourly dynamic traffic emissions generated by the ROE model. The simulated O3 and NOx concentrations in these three models were compared with observational data to demonstrate the differences between the coupled and regional models. In addition, we established two other scenarios (based on S1, although with different emissions) to investigate the impact of different traffic control measures. We assumed that the proportion of vehicles in urban areas within the Fifth Ring Road was the same as the proportion of vehicles in suburban areas in the scenario without a low-emission zone (i.e., S1_withoutLEZ). The simulation was compared with S1 to evaluate the impact of low-emission zones on air quality. All vehicles on roads in Beijing, including petrol and diesel vehicles, were assumed to meet the national grade V emission standards in the scenario with upgraded traffic emission standards (S1_upgrade), and the impact of the upgraded emission standard on the pollution concentration was evaluated by comparison with S1. These models and scenarios were used to simulate the concentration variations of O3 and its precursors in August 2021. The period from 20 to 31 July was the spin-up period in each case.
Table 1List of the simulations performed by two-way coupled model (IAQMS-street v2.0), one-way coupled model (IAQMS-street v1.0), and regional model (NAQPMS) in this study.
3.1 On-road vehicle emissions
We used the ROE model (Wu, 2019) to calculate the hourly on-road emission variations in the different types of vehicles, including taxis, buses, heavy-duty trucks (HDTs), middle-duty trucks (MDTs), light-duty trucks (LDTs), heavy-duty vehicles (HDVs), middle-duty vehicles (MDVs), and light-duty vehicles (LDVs). The diurnal variations in the on-road traffic emissions in Beijing in August 2021 are shown in Fig. 4. There are generally two high-emission peak times (i.e., 08:00–10:00 and 18:00–20:00 LT) on the roads in Beijing, which correspond to rush hours. The HDT contribution to vehicle NOx emissions reached 34.4 %, while vehicle hydrocarbon (HC) emissions mainly originated from the LDVs, reaching 56.4 %. The HDT contribution to vehicle NOx emissions increased to 51.1 % at midnight due to the reduced number of private petrol vehicles and the increased nighttime HDT traffic across urban Beijing.
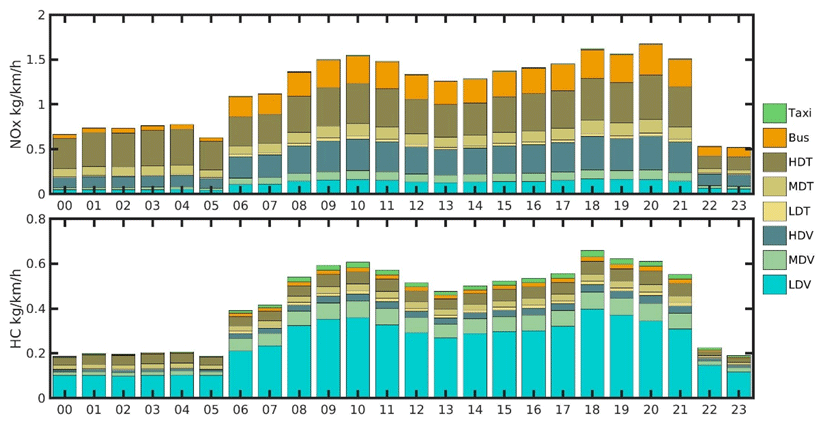
Figure 4Diurnal variations in the contributions of road vehicles to the NOx emissions and hydrocarbon (HC) emissions in Beijing during August 2021.
The spatial distributions of the on-road NOx and HC traffic emissions in Beijing are shown in Fig. 5. For a given area, emissions on ring roads were higher than those on local roads within the Fifth Ring Road because the traffic flow on the ring roads was higher than that on local roads. In addition, the traffic control measures and low-emission zones decreased the LDT proportions in urban areas, thereby leading to lower NOx emissions on roads within the Fifth Ring Road. NOx emission intensities exceeded 60 kg km−1 d−1 on the Fifth Ring Road and the highway outside the Fifth Ring Road. The NOx emissions inside the Fifth Ring Road were lower than 20 kg km−1 d−1. HC emissions exhibited a similar spatial distribution; however, the HC emission difference between urban and suburban areas was decreased compared with that of NOx because HC was mainly emitted by LDVs.
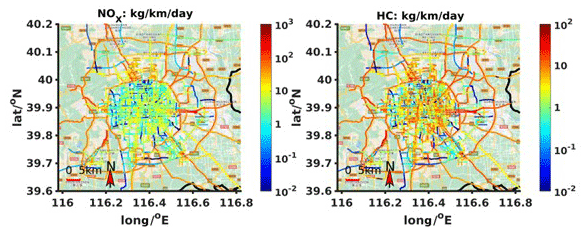
Figure 5Horizontal distributions of the NOx and HC emissions (units in kg km−1 d−1) at the street network in Beijing urban and suburban area during August 2021 (imagery and map data: © Google 2022).
3.2 Evaluation of the pollutant simulations on the regional and street scales
The simulated O3 and NOx concentrations by IAQMS-street v2.0, IAQMS-street v1.0, and NAQPMS were evaluated by comparing with observations from the pollutant monitoring stations during the study period. The results showed that the variation in the O3 and NOx concentrations simulated by three models were consistent with observations. However, the concentrations of pollutants simulated by IAQMS-street v2.0 were closer to the observations compared to those simulated by IAQMS-street v1.0 and NAQPMS, especially on the hourly variations in NO and NO2. The nighttime NO and NO2 concentrations were overestimated in NAQPMS, whereas the simulation of IAQMS-street v2.0 was closer to the observations. The NO and NO2 simulation performance was improved at different stations, especially at midnight in IAQMS-street v2.0, because the street-scale model was coupled with a regional model in the system, and the feedback of street-scale model on regional model was considered, IAQMS-street v2.0 was more suitable for simulating pollutants in urban areas. The underestimation of O3 during nighttime was improved in IAQMS-street v2.0 compared with that in NAQPMS because of the weakened O3 depletion by the NOx–O3 titration reaction in IAQMS-street v2.0. Table S1 in the Supplement shows the statistical parameters for the Dongcheng (DC) and Xicheng (XC) district stations, the simulated mean NO concentration during August 2021 decreased from 3.73 (4.12) µg m−3 in NAQPMS to 0.80 (0.77) µg m−3 in IAQMS-street v2.0 at the DC (XC) station, thereby being closer to the observed mean value of 0.57 (0.64) µg m−3. The root mean squared errors (RMSEs) of the NO, NO2, and O3 concentrations decreased from 5.96–6.60, 27.00–27.31, and 45.64–54.20 µg m−3 in NAQPMS to 1.53–1.71, 14.21–14.82, and 30.18–33.42 µg m−3 in S1, respectively. Overall, the simulation results of IAQMS-street v2.0 were closer to the observations; in IAQMS-street v1.0, the NO and O3 concentrations were underestimated, and the NO2 concentration was overestimated at the street scale, owing to the lack of feedback from the street urban canopy to the regional urban background.
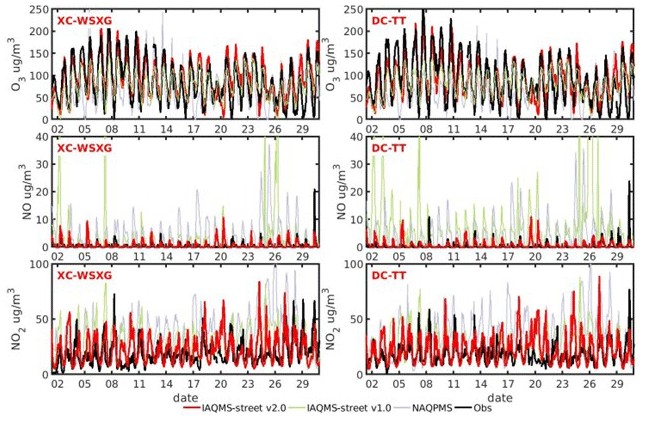
Figure 6Hourly variation in the O3, NO, and NO2 concentrations (units in µg m−3) during August 2021 at the Dongcheng–Tiantan (DC–TT) station and Xicheng–Wanshouxigong (XC–WSXG) station. Red lines indicate the values simulated by IAQMS-street v2.0, green lines indicate the values simulated by the IAQMS-street v1.0, blue lines indicate the values simulated by NAQPMS, and black lines indicate the observations.
The observed and simulated mean O3, NOx concentrations during August 2021 in IAQMS-street v2.0, IAQMS-street v1.0, and NAQPMS at all pollutant monitoring stations (site information is shown in Fig. 2b) in Beijing are shown in Fig. 7, and the hourly concentrations of pollutants are shown in Fig. S1 in the Supplement. The simulation results of the two-way coupled model (IAQMS-street v2.0) were improved by comparing with those of the one-way coupled model (IAQMS-street v1.0) and the regional model (NAQPMS). The prediction fractions, within a factor of 2 (FAC2s) between simulations and observations of NO and NO2, increased from 0.11 and 0.34 in NAQPMS to 0.78 and 1.00 in IAQMS-street v2.0, respectively. The normalized mean biases (NMBs) of NO and NO2 decreased from 2.67 and 1.33 in NAQPMS to −0.25 and 0.08, respectively.
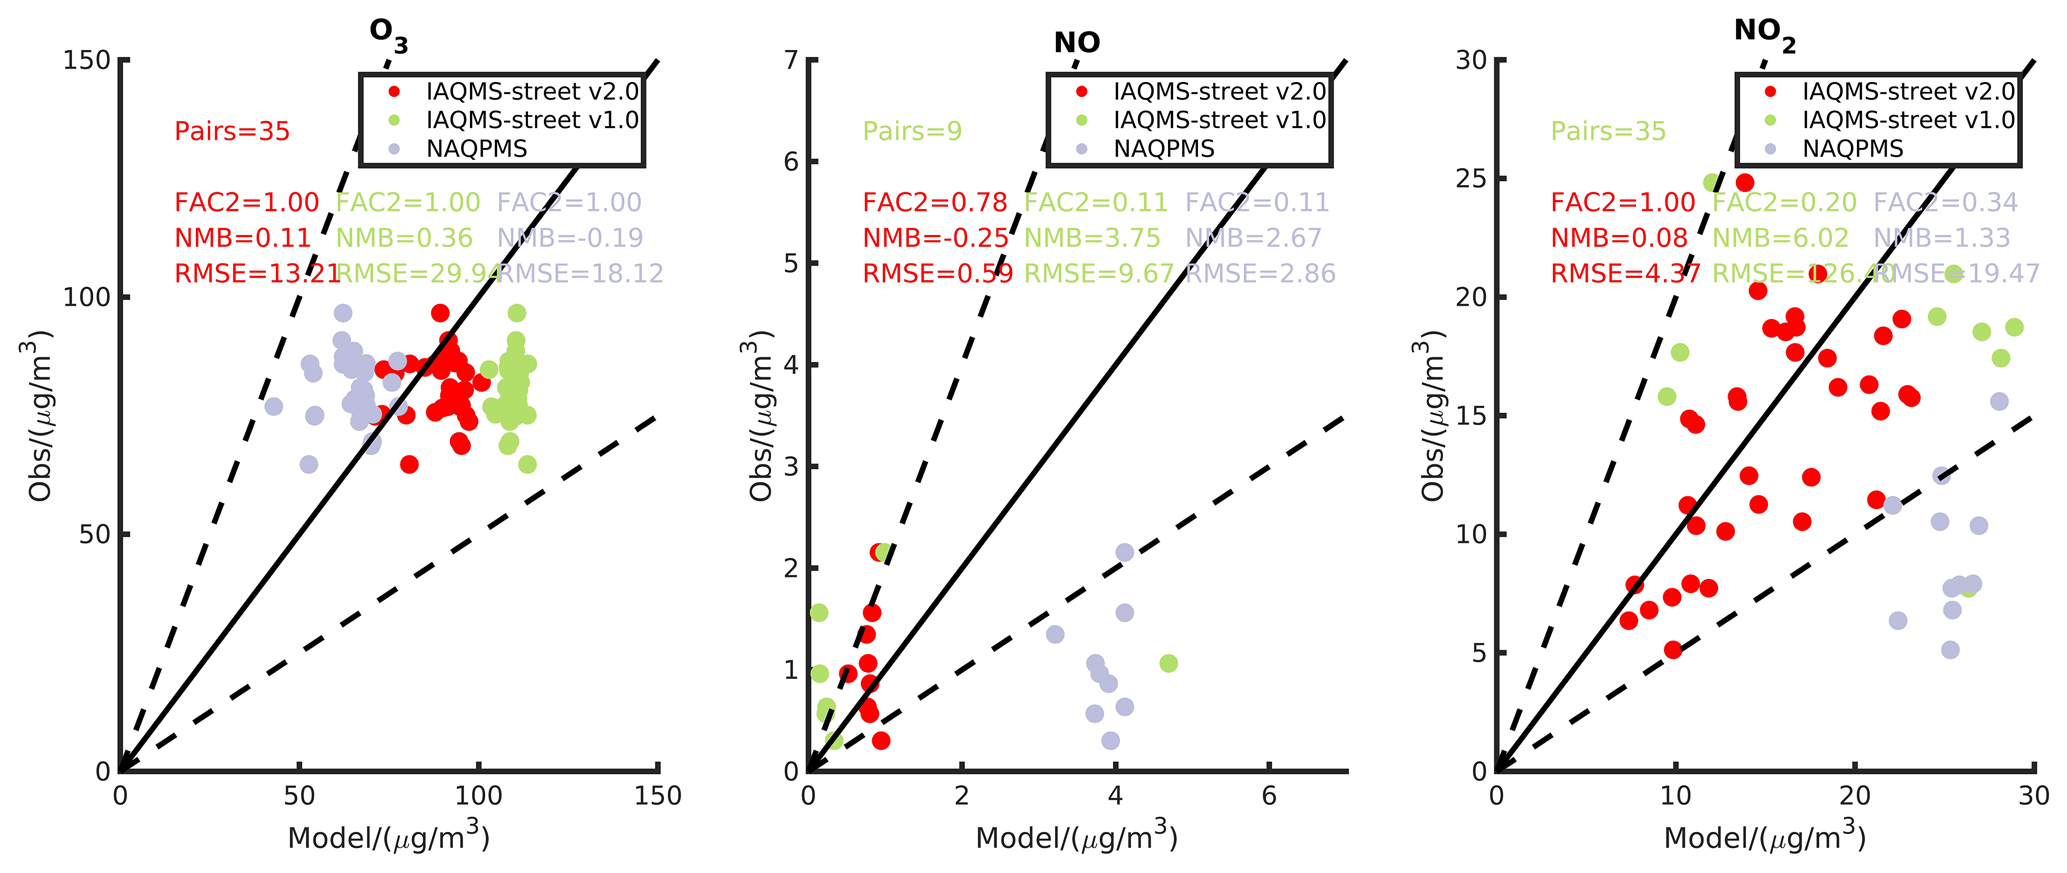
Figure 7Observed and simulated average O3, NO, and NO2 concentrations during August 2021 from different models (IAQMS-street v2.0 has red points; IAQMS-street v1.0 has green points; NAQPMS has blue points) at all pollutant monitoring stations in Beijing.
The spatial distributions of the simulated monthly averaged O3 and NOx concentrations during August 2021 in three models are shown in Fig. 8. At the urban scale, high NOx concentrations appeared near road areas, especially on busy roads. O3 exhibited opposite concentration trends in IAQMS-street v2.0, meaning that it reacted due to the high NO concentration near roads. The NOx concentrations near highways in suburban areas were higher than those within the Fifth Ring Road because of the implementation of traffic control measures. The NOx and O3 distributions exhibited similar trends in IAQMS-street v1.0 when compared with IAQMS-street v2.0 at the street scale; however, the NOx concentration was lower at the regional scale because local road emissions were not considered in the regional model, and the influence of mass transfer from the street-scale model was not considered in the regional model. Pollutant distributions in NAQPMS were similar to those in IAQMS-street v2.0; however, the NOx concentration was higher near the street area because street-scale processes were not taken into account by the regional model. The population-weighted average O3, NO, and NO2 concentrations was calculated based on the population density distribution in Beijing, and the results are shown in Table S2. We found that the population-weighted average NO and NO2 concentrations increased from 0.12 and 3.75 µg m−3 in IAQMS-street v1.0 to 0.79 and 16.64 µg m−3 in IAQMS-street v2.0, respectively, due to the influence of the street-scale model on the regional model. Moreover, the population-weighted average NO and NO2 concentrations reached 1.50 and 20.13 µg m−3 in NAQPMS because the NOx concentrations were overestimated at near-road environments.
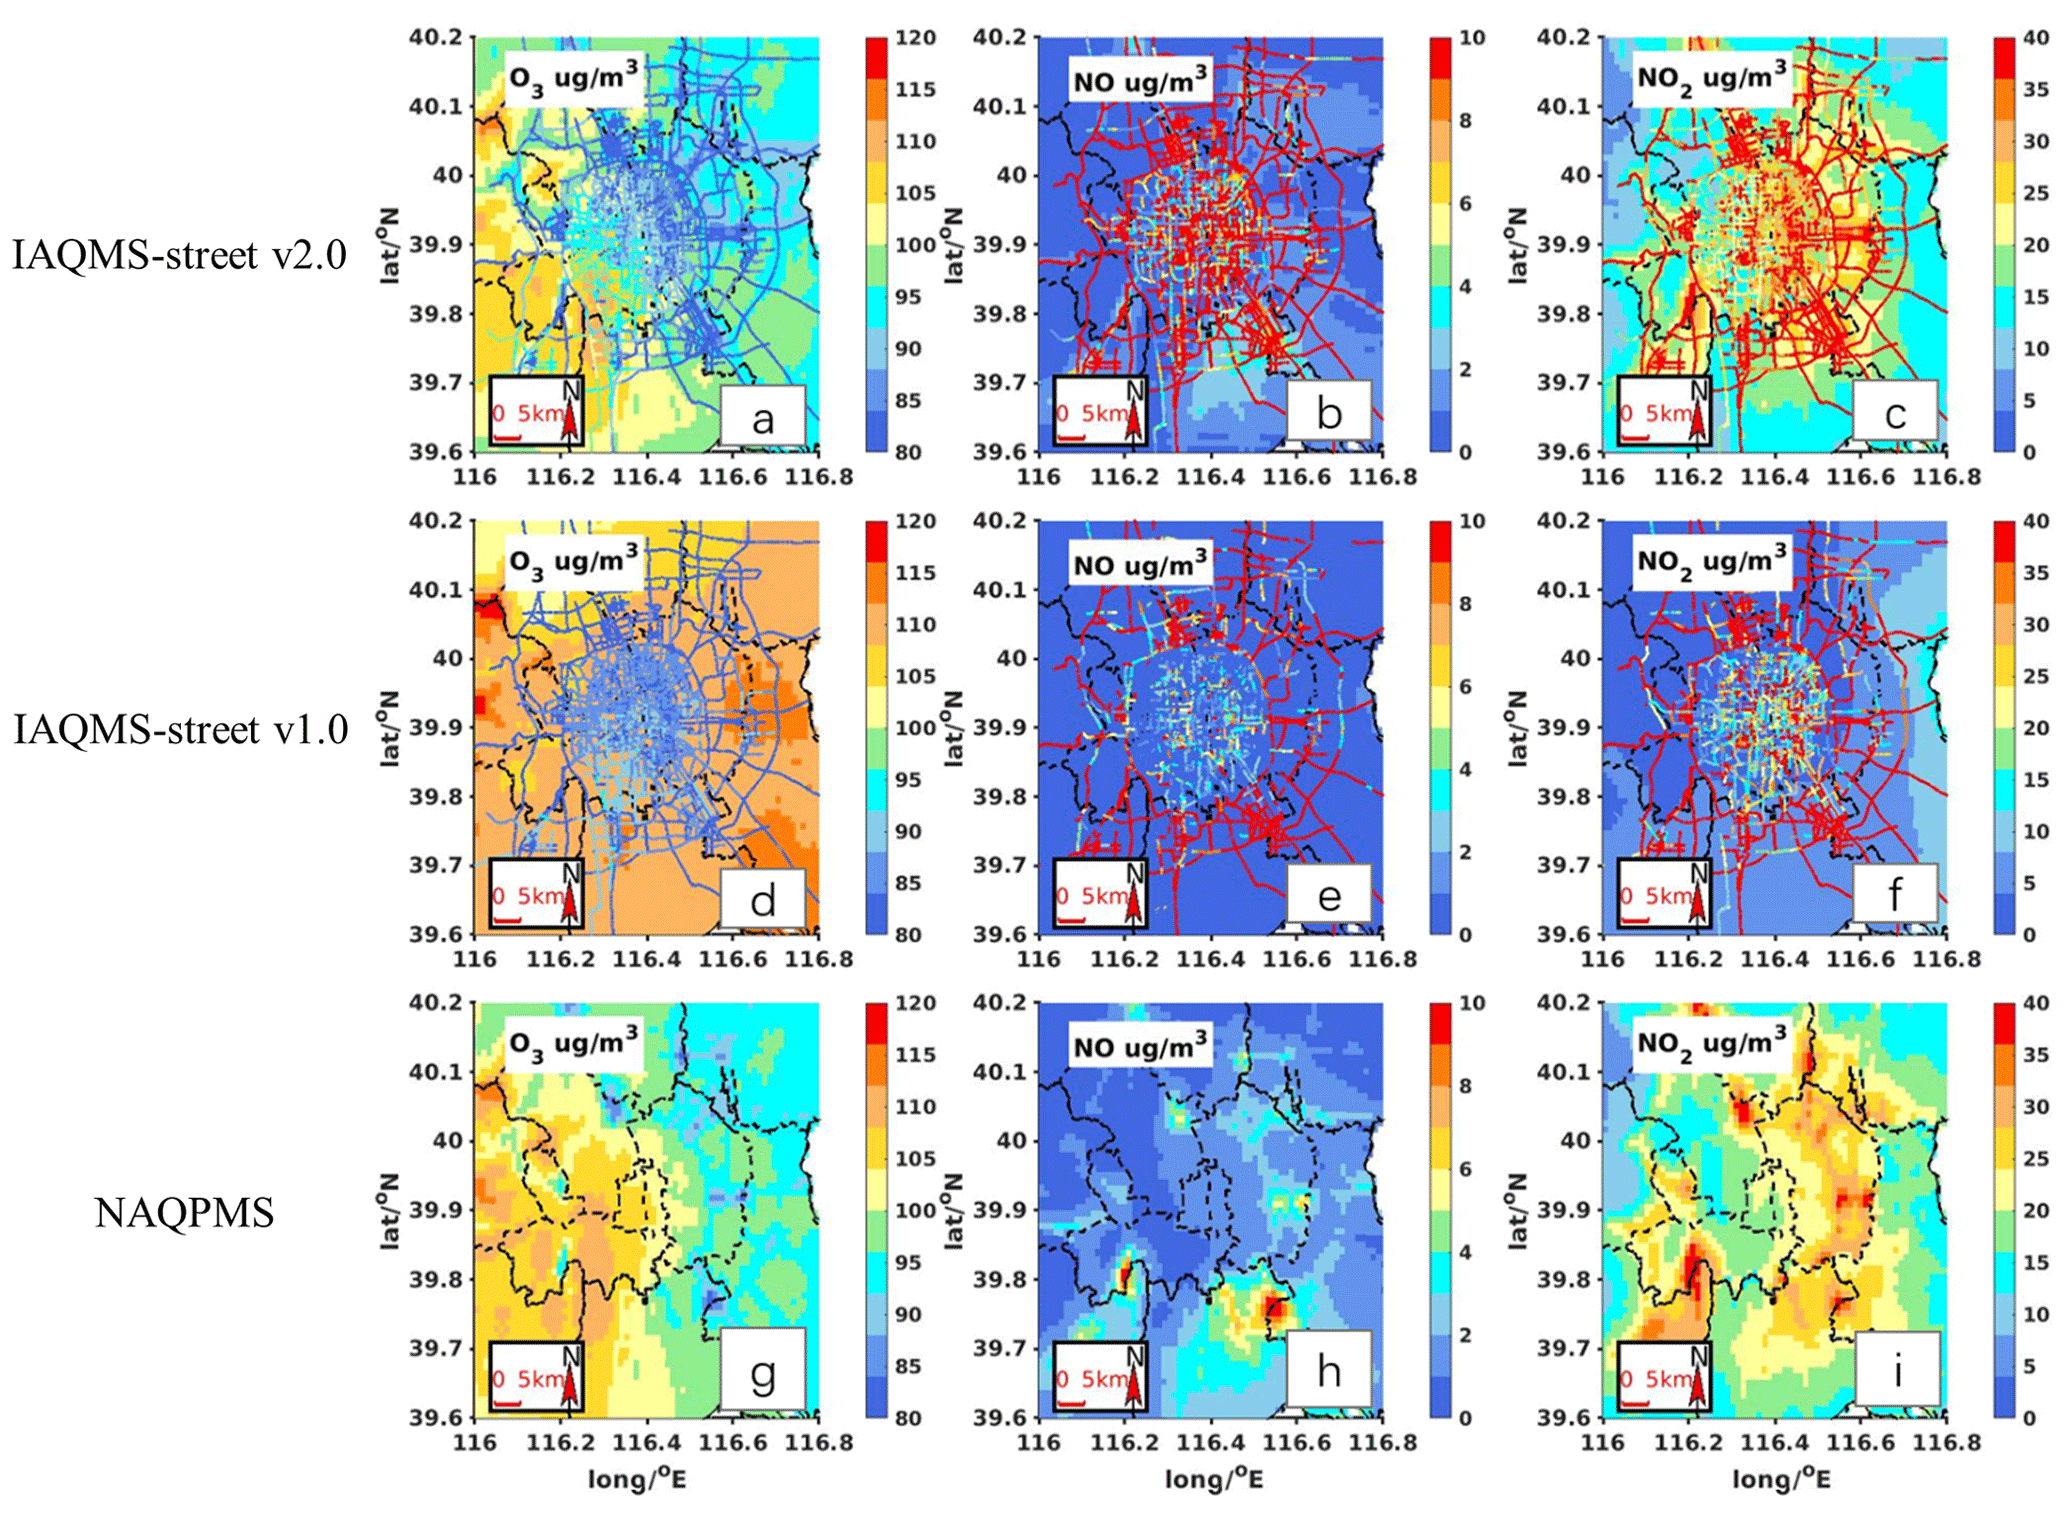
Figure 8Spatial distribution of the monthly averaged O3, NO, and NO2 concentrations (units in µg m−3) at the urban-street-network scale during August 2021, as simulated by IAQMS-street v2.0 (a–c), IAQMS-street v1.0 (d–f), and NAQPMS (g–i).
In this study, O3 and NOx were observed on Beijing roads to evaluate the performance of IAQMS-street v2.0 at the street network scale during 12:00–18:00 LT from 20 to 31 August 2021. As shown in Fig. 9, the distributions of the observed O3 and NOx concentrations were reproduced by the coupled model, especially the low NOx concentrations on roads in urban areas (i.e., areas within the Fifth Ring Road). High NOx emissions, caused by increased traffic flow and a large proportion of trunk roads, led to high NOx concentrations on roads in suburban areas. The O3 concentrations in suburban areas were lower, owing to the NOx–O3 titration mechanism. The statistical parameters between the observed and simulated data in three models at the street scale are shown in Fig. S2; the FAC2 values of O3, NO, and NO2 in IAQMS-street v2.0 reached 0.99, 0.42, and 0.83, respectively. In general, IAQMS-street v2.0 with dynamic traffic emissions can simulate the O3 and NOx at the street scale efficiently.
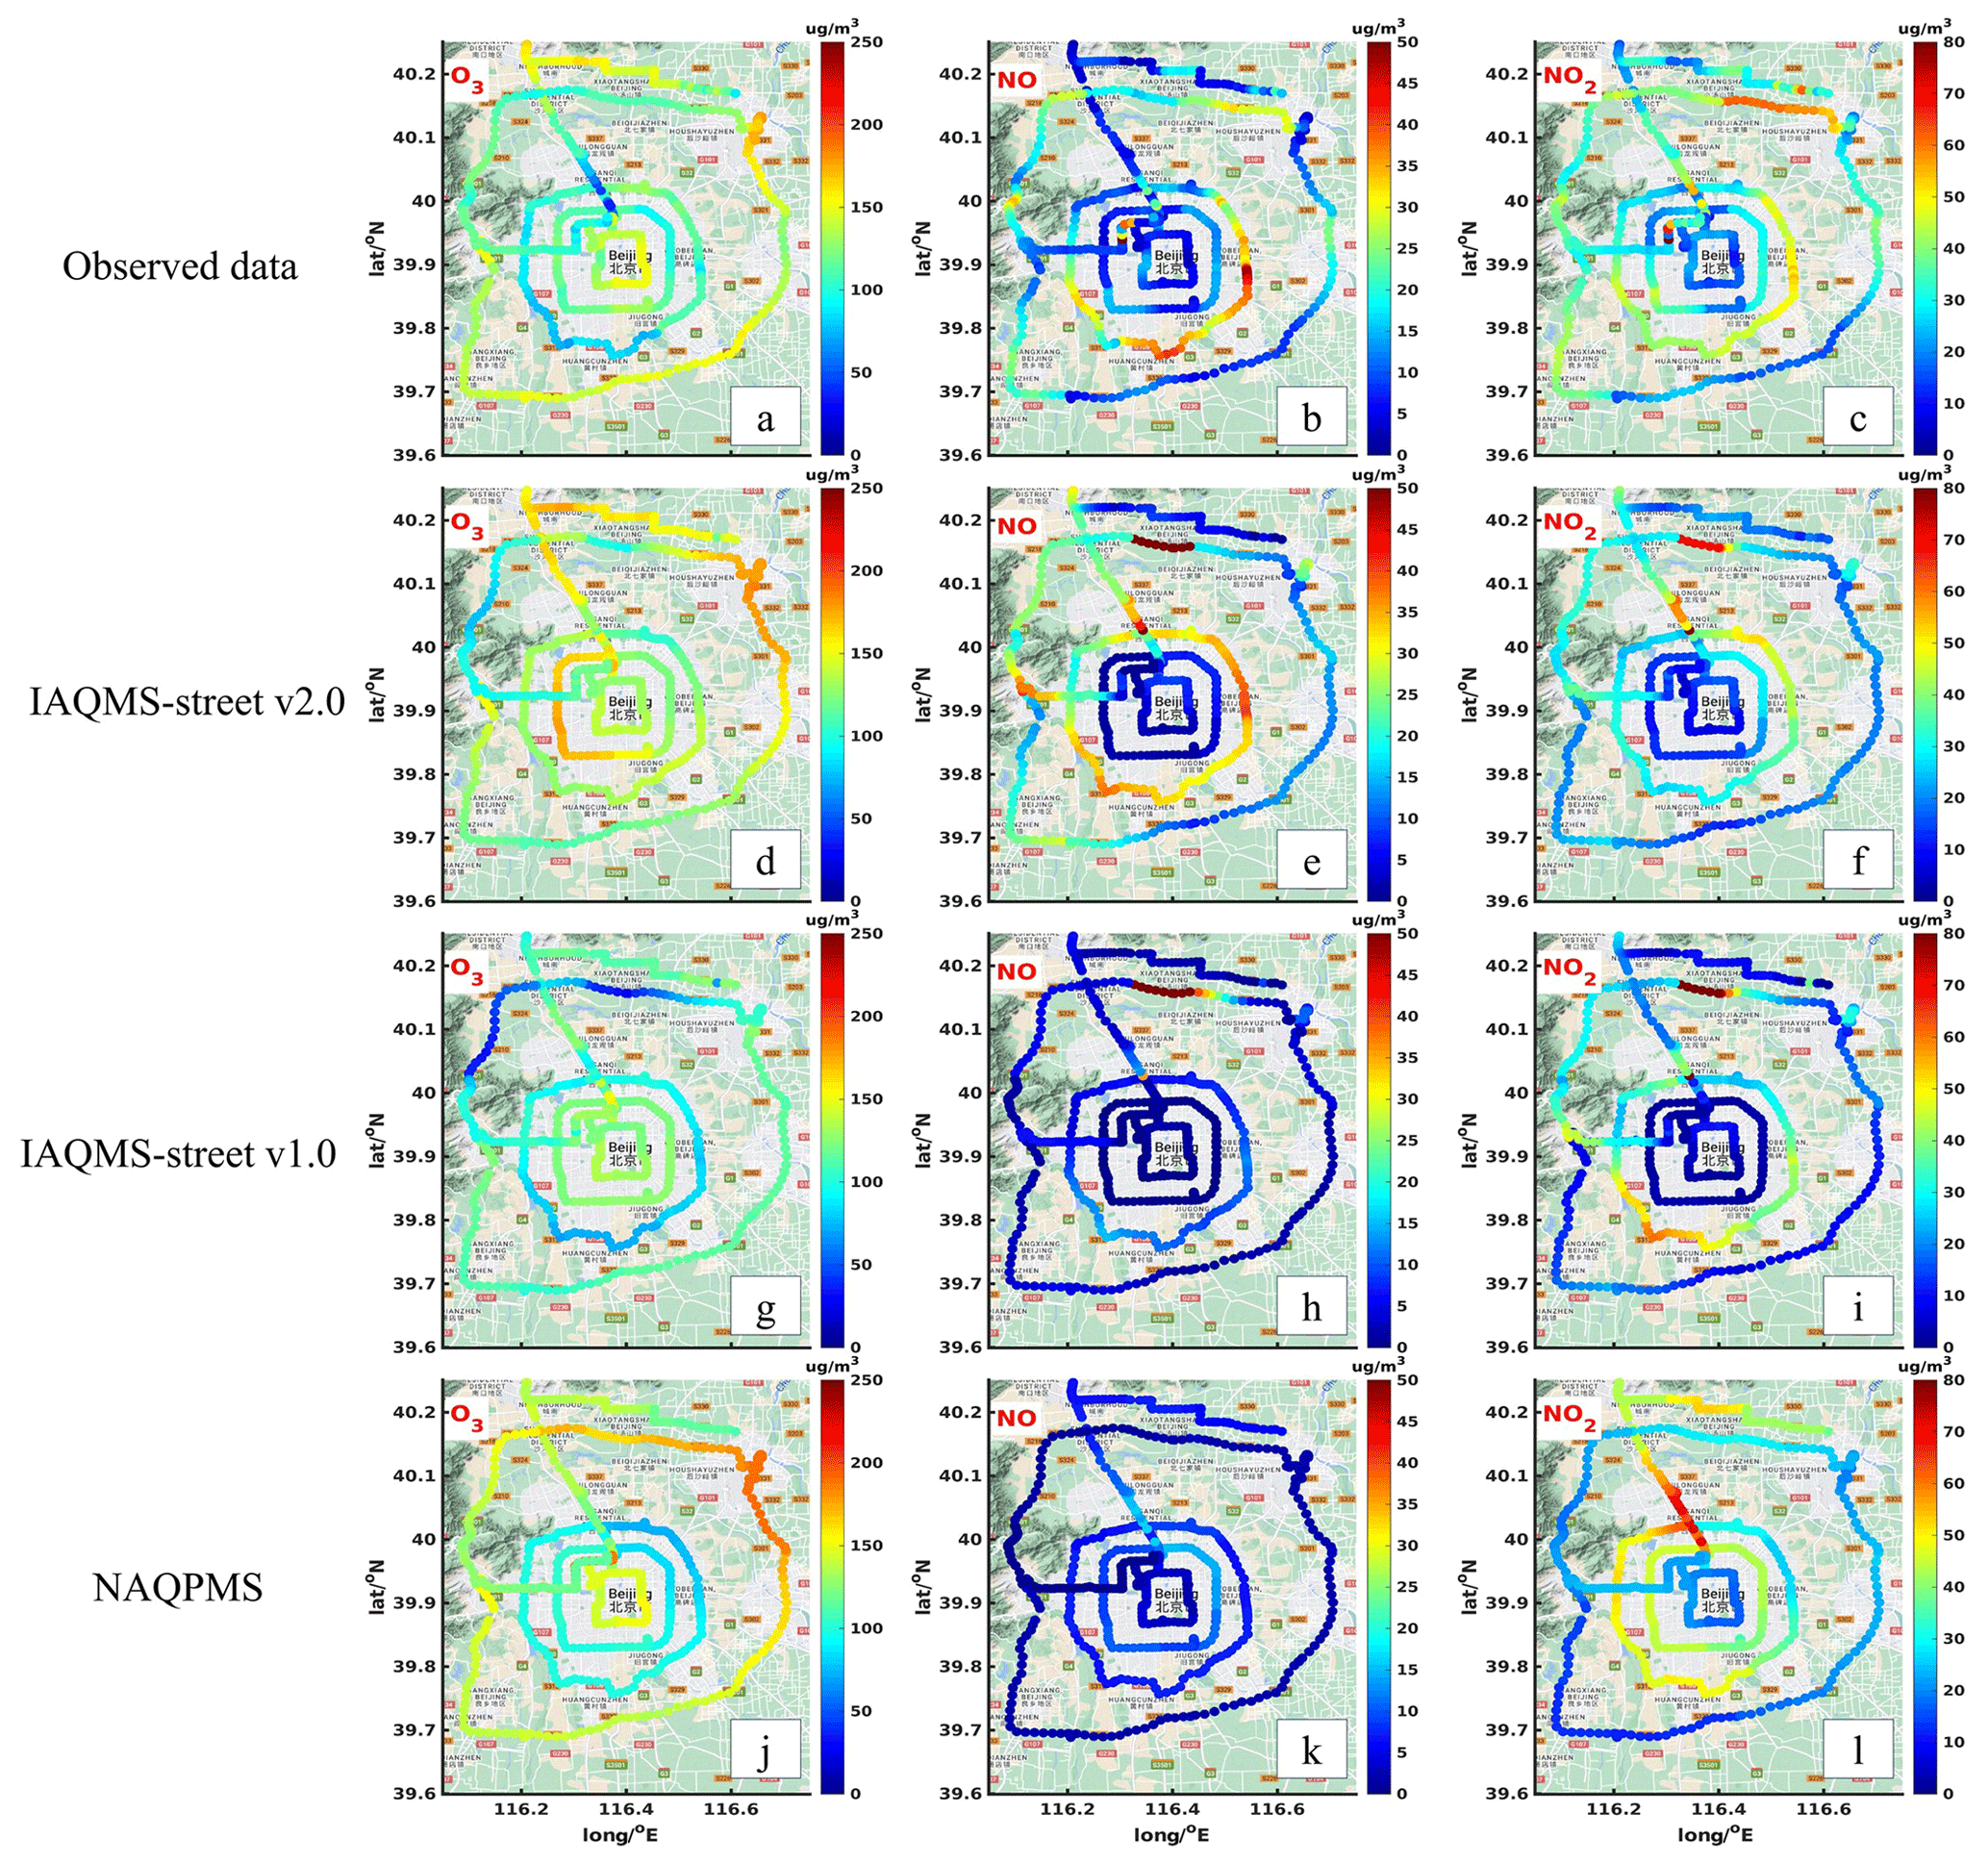
Figure 9Horizontal distributions of the observed O3 concentration (a), NO concentration (b), and NO2 concentration (c) at the street scale and simulation results by the two-way coupled model in IAQMS-street v2.0 (d–f), IAQMS-street v1.0 (g–i), and NAQPMS (j–l) (imagery and map data: © Google 2022).
3.3 Contributions of local traffic emissions
We also quantified the contributions of local traffic emissions to the pollutant concentrations in Beijing. We conducted a sensitivity analysis by comparing the results from IAQMS-street v2.0 and IAQMS-street v1.0 at the regional scale. In IAQMS-street v2.0, the results were simulated using the two-way coupled model with dynamic emissions, with the mass transfer of pollutants from the street scale being calculated in the regional model; conversely, in IAQMS-street v1.0, the pollutant concentrations were simulated without considering the local traffic emissions at the regional scale. The equation for calculating the contributions of local traffic emissions to the pollutant concentrations in Beijing is as follows:
where is the average concentration of pollutants in grid location (x,y) simulated by IAQMS-street v2.0; is the mean concentration of pollutants in grid location (x,y) simulated by IAQMS-street v1.0; and P(x,y) is the contribution of local traffic emissions to grid location (x,y) in Beijing.
The distributed results from Sect. 3.1 are shown in Fig. 10. The contributions of local on-road vehicle emissions to the NO and NO2 concentrations reached 90.63 % and 82.66 %, respectively, at the observation sites. The NO and NO2 concentrations increased by 14.37 and 37.49 µg m−3, respectively, due to the local traffic emissions, while the O3 concentration decreased by 11.3 %, indicating that urban areas in Beijing were in the VOC-sensitive region (i.e., the decreased NOx would increase the concentration of O3). As shown in Fig. 10, local traffic emissions mainly influenced the concentrations of pollutants near urban ring roads and highways. The relative contributions of local traffic emissions to NO2, NO, and O3 reached 53.41 %, 57.45 %, and 8.49 %, respectively. However, the contributions of local traffic emissions increased significantly with decreasing distance from main roads. The contribution of road vehicles to NO2 reached as high as 93.5 % on busy roads. Overall, local traffic emissions are important for the distribution of pollutants in Beijing.
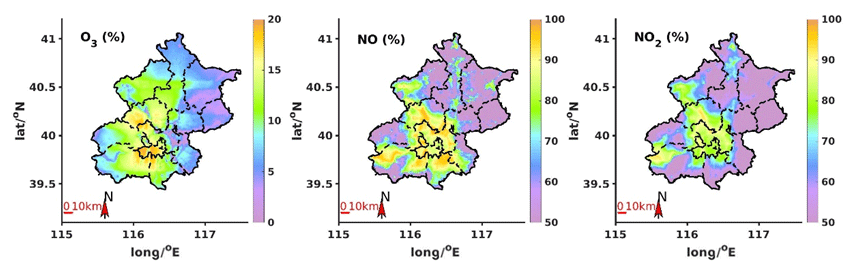
Figure 10Contribution of local on-road vehicles to the O3, NO, and NO2 distributions in Beijing.
3.4 Evaluation of vehicle control measures
To evaluate the influence of vehicle control measures on the distributions of pollutants in Beijing, we conducted simulations, based on two scenarios (i.e., S1_withoutLEZ and S1_upgrade, as described in Sect. 2.3) using IAQMS-street v2.0, and quantified the contributions of different control measures to the variations in the pollutant concentrations. The on-road NOx emissions within urban areas in Beijing increased from 53.82 t d−1 in S1 to 100.84 t d−1 in S1_withoutLEZ, suggesting a decrease of NOx emissions by 46.6 % due to the implementation of a policy that established the low-emission areas, according to which vehicles below the China stage III emission standards are forbidden from entering urban areas. The on-road HC emissions were 23.81 t d−1 in S1_withoutLEZ and 22.5 t d−1 in S1. The influence of the control measures on the HC emissions was small because on-road HC was mainly emitted by LDVs (Fig. 4). A comparison of the spatial distributions of pollutants of S1_withoutLEZ and S1 is shown in Fig. 11. The NOx concentration decreased in urban areas, especially on busy roads such as the Fourth and Fifth Ring Roads. The NO and NO2 concentrations decreased by 10 and 40 µg m−3 on busy roads, respectively. The decreased NO concentration caused O3 accumulation. The maximum 8 h O3 concentration in the urban areas in S1 increased by 40 µg m−3, compared to that in S1_withoutLEZ.
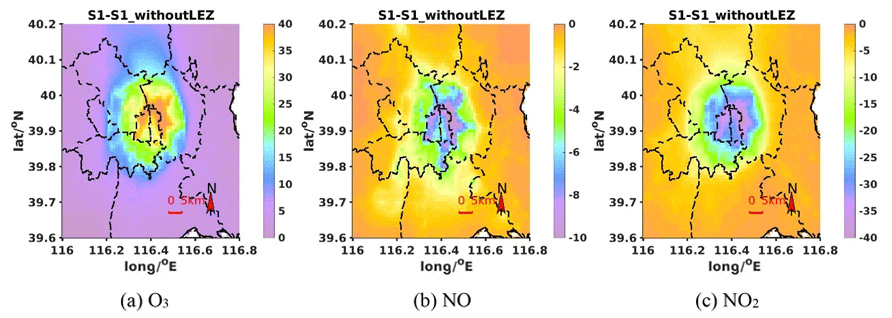
Figure 11Influence of policies that restrict vehicles in urban areas on the spatial distributions of (a) O3, (b) NO, and (c) NO2 in Beijing.
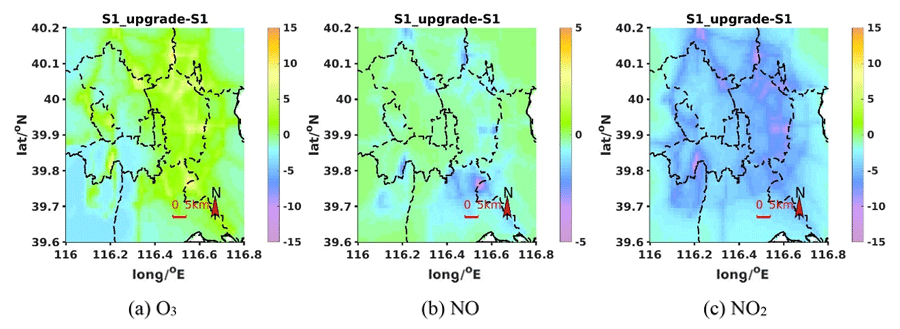
Figure 12Influence of policies with upgraded vehicle emission standards on the spatial distribution of (a) O3, (b) NO, and (c) NO2 in urban areas in Beijing.
In the S1_upgrade scenario, on-road NOx emissions in urban areas decreased to 37.62 t d−1; i.e., they were 30.1 % lower than those in S1. The on-road HC emissions were 11.46 t d−1; i.e., they were 49 % lower than those in S1. Results showed that the upgraded vehicle emission standards in S1_upgrade can significantly reduce traffic NOx emission and HC emission in street network. The distributions of O3, NO, and NO2 simulated in S1_upgrade was compared to those in S1. As shown in Fig. 12, the monthly average NO and NO2 concentrations decreased from 0.52 and 15.45 µg m−3 in S1 to 0.32 and 11.33 µg m−3 in S1_upgrade. The decreased NO concentrations led to increased O3 concentrations near road areas; however, in areas away from roads (such as the southwest of Beijing; see Fig. 12), O3 concentrations decreased due to the decreased NO2 and HC emissions. The monthly average maximum 8 h O3 concentration in urban areas eventually changed from 103.93 µg m−3 in S1 to 103.08 µg m−3 in S1_upgrade.
A comparison of the simulated results showed that both the established low-emission zone and the upgraded traffic emission standard could effectively decrease the NOx concentrations near roads; however, when the road traffic emissions decreased, the O3 concentration near the road increased due to the decrease consumption of O3 by NO. To decrease the O3 concentrations in urban areas, controlling the HC and NOx emissions from other sources must be considered.
3.5 Sensitivity analysis of time steps in IAQMS-street v2.0
In the base scenario (S1), the time step was set as 20 min in IAQMS-street v2.0. An additional simulation scenario was set with a time step of 5 min in IAQMS-street v2.0 to analyze the influence of the time step in the coupled model. The comparison of simulated pollutants in IAQMS-streetv2.0 with different time steps is shown in Figs. S3 and S4. The FAC2 between the simulation results of O3, NO, and NO2 for the time step of 20 and 5 min reached 0.99, 0.97, and 1.0. The NMB of O3, NO, and NO2 is 0.03, 0.11, and 0.03. Overall, the simulation results based on a 20 min time step can achieve similar simulation accuracy with a smaller time step of 5 min. The results showed that the simulated pollutants are numerically stable in the coupled model with nonstationary approaches, which is consistent with the previous research findings (Lugon et al., 2020).
In terms of computational time, the NAQPMS used four nodes and 24 ppn (processors per node) while MUNICH used one node and 28 ppn in this study. During the study period, the calculation time was 121.6 h in IAQMS-street v2.0 and 96.2 h in IAQMS-street v1.0, and the calculation time increased to 212.8 h in IAQMS-street v2.0, with a smaller time step of 5 min, which means that the smaller the time step, the longer the computation time.
In this study, a new version of the regional urban–street network air quality modeling system IAQMS-street v2.0 has been presented to simulate the urban background and street network pollution. A two-way coupled module was added in IAQMS-street v2.0 to transfer pollutants between a regional and local street urban canopy. The influence of pollutants in street network is considered in the concentration calculation on regional scale, which is not considered in previous version (IAQMS-street v1.0). Based on dynamic traffic emission inventories, we simulated the O3 and NOx distribution characteristics at the regional and street scales. The simulation concentrations of O3 and NOx in Beijing during August 2021 by the two-way coupled model (IAQMS-street v2.0), one-way coupled model (IAQMS-street v1.0), and regional model (NAQPMS) were compared. In addition, we quantified the contribution of local vehicle emissions to urban air quality and analyzed the influence of traffic-control measures on the pollutant distributions. The simulation results of IAQMS-street v2.0 were improved, particularly at the street scale. The conclusions of this study are shown below.
Dynamic emissions played an important role in the simulation of the coupled model. The HDT contribution to vehicle NOx emissions reached 34.4 % and increased to 51.1 % at midnight. NOx emissions were mainly distributed on the Fifth Ring Road and the highway outside of it, owing to the implementation of traffic control measures. By comparing the simulation results of IAQMS-street v2.0 and NAQPMS at the monitoring sites, we found the O3 underestimation and NOx overestimation were improved in IAQMS-street v2.0. And when compared with IAQMS-street v1.0, due to the feedback of street model to regional model being considered, the spatial distribution of O3 and NOx improved at the regional scale.
The comparison between simulations and observations on roads showed that IAQMS-street v2.0 performed well at the street scale, and the FAC2 values between observed and simulated O3, NO, and NO2 reached 0.99, 0.42, and 0.83, respectively. NOx concentrations on roads in urban areas were lower than those in suburban areas, which was confirmed by the observations, and the distributions of observed O3 and NOx were reproduced by IAQMS-street v2.0.
The contribution of local traffic emissions to air quality is important in Beijing. The relative contributions of local traffic emissions to NO2, NO, and O3 reached 53.41 %, 57.45 %, and 8.49 %, respectively; however, contributions increased significantly with decreasing distance from main roads, while the contribution of road vehicles to NO2 reached 93.5 % on busy roads. Both the established low-emission zone and upgraded vehicle emission standards could reduce the on-road NOx emissions; however, the O3 concentration increases, owing to the decreased consumption of O3 by NO. To decrease the O3 concentration in urban areas, controlling the HC and NOx emissions from other sources needs to be considered in future research.
The source codes, observation data, and model output in our work are available via Zenodo (https://doi.org/10.5281/zenodo.7298948, Wang et al., 2022b) and the Real-time On-road Emission (ROE v1.0) model is available via Zenodo (https://doi.org/10.5281/zenodo.3264859, Wu, 2019).
The supplement related to this article is available online at: https://doi.org/10.5194/gmd-16-5585-2023-supplement.
TW wrote the original draft, conducted the formal analysis, and developed the methodology and software. JL supervised, acquired funding, administered the projected, and reviewed and edited the paper. HL curated the data, conducted the formal analysis with ZhW, and reviewed and edited the paper. SW and YS curated the data. YK developed the software and reviewed and edited the paper. ZiW conceptualized the project and developed the methodology. WY and HD reviewed and edited the paper.
The contact author has declared that none of the authors has any competing interests.
Publisher's note: Copernicus Publications remains neutral with regard to jurisdictional claims in published maps and institutional affiliations.
We thank the National Key Scientific and Technological Infrastructure project “Earth System Science Numerical Simulator Facility” (EarthLab). We thank the anonymous reviewers for their constructive suggestions that helped improve the paper. We also thank Xuemei Wang and Luolin Wu for their helpful advice on the on-road traffic emission model.
This research has been supported by the National Key Research and Development Program of China (grant no. 2022YFC3700703).
This paper was edited by Leena Järvi and reviewed by two anonymous referees.
An, X. Q., Hou, Q., Li, N., and Zhai, S. X.: Assessment of human exposure level to PM10 in China, Atmos. Environ., 70, 376–386, https://doi.org/10.1016/j.atmosenv.2013.01.017, 2013.
Ashie, Y. and Kono, T.: Urban-scale CFD analysis in support of a climate-sensitive design for the Tokyo Bay area, Int. J. Climatol., 31, 174–188, https://doi.org/10.1002/joc.2226, 2011.
Baik, J. J. and Kim, J. J.: A Numerical Study of Flow and Pollutant Dispersion Characteristics in Urban Street Canyons, J. Appl. Meteorol., 38, 1576–1589, 2010.
Benavides, J., Snyder, M., Guevara, M., Soret, A., Pérez García-Pando, C., Amato, F., Querol, X., and Jorba, O.: CALIOPE-Urban v1.0: coupling R-LINE with a mesoscale air quality modelling system for urban air quality forecasts over Barcelona city (Spain), Geosci. Model Dev., 12, 2811–2835, https://doi.org/10.5194/gmd-12-2811-2019, 2019.
Biggart, M., Stocker, J., Doherty, R. M., Wild, O., Hollaway, M., Carruthers, D., Li, J., Zhang, Q., Wu, R., Kotthaus, S., Grimmond, S., Squires, F. A., Lee, J., and Shi, Z.: Street-scale air quality modelling for Beijing during a winter 2016 measurement campaign, Atmos. Chem. Phys., 20, 2755–2780, https://doi.org/10.5194/acp-20-2755-2020, 2020.
Byun, D. and Schere, K. L.: Review of the governing equations, computational algorithms, and other components of the models-3 Community Multiscale Air Quality (CMAQ) modeling system, Appl. Mech. Rev., 59, 51–77, https://doi.org/10.1115/1.2128636, 2006.
Cheng, J., Su, J., Cui, T., Li, X., Dong, X., Sun, F., Yang, Y., Tong, D., Zheng, Y., Li, Y., Li, J., Zhang, Q., and He, K.: Dominant role of emission reduction in PM2.5 air quality improvement in Beijing during 2013–2017: a model-based decomposition analysis, Atmos. Chem. Phys., 19, 6125–6146, https://doi.org/10.5194/acp-19-6125-2019, 2019.
Depaul, F. T. and Sheih, C. M.: A tracer study of dispersion in an urban street canyon, Atmos. Environ., 19, 555–559, https://doi.org/10.1016/0004-6981(85)90034-4, 1985.
Depaul, F. T. and Sheih, C. M.: Measurements of wind velocities in a street canyon, Atmos. Environ., 20, 455–459, https://doi.org/10.1016/0004-6981(86)90085-5, 1986.
Fellini, S., Salizzoni, P., Soulhac, L., and Ridolfi, L.: Propagation of toxic substances in the urban atmosphere: A complex network perspective, Atmos. Environ., 198, 291–301, https://doi.org/10.1016/j.atmosenv.2018.10.062, 2019.
Gavidia-Calderón, M. E., Ibarra-Espinosa, S., Kim, Y., Zhang, Y., and Andrade, M. D. F.: Simulation of O3 and NOx in São Paulo street urban canyons with VEIN (v0.2.2) and MUNICH (v1.0), Geosci. Model Dev., 14, 3251–3268, https://doi.org/10.5194/gmd-14-3251-2021, 2021.
Hood, C., MacKenzie, I., Stocker, J., Johnson, K., Carruthers, D., Vieno, M., and Doherty, R.: Air quality simulations for London using a coupled regional-to-local modelling system, Atmos. Chem. Phys., 18, 11221–11245, https://doi.org/10.5194/acp-18-11221-2018, 2018.
Isakov, V., Irwin, J. S., and Ching, J.: Using CMAQ for exposure modeling and characterizing the subgrid variability for exposure estimates, J. Appl. Meteorol. Climatol., 46, 1354–1371, https://doi.org/10.1175/jam2538.1, 2007.
Isakov, V., Touma, J. S., Burke, J., Lobdell, D. T., Palma, T., Rosenbaum, A., and Ozkaynak, H.: Combining regional- and local-scale air quality models with exposure models for use in environmental health studies, J. Air Waste Manage. Assoc., 59, 461–472, https://doi.org/10.3155/1047-3289.59.4.461, 2009.
Jocher, G.: YOLOv5 by ultralytics (version 7.0), Zenodo [code], https://doi.org/10.5281/zenodo.3908559, 2020, last access: 13 August 2023.
Kakosimos, K. E., Hertel, O., Ketzel, M., and Berkowicz, R.: Operational street pollution model (OSPM) – a review of performed application and validation studies, and future prospects, Environ. Chem., 7, 485–503, https://doi.org/10.1071/en10070, 2010.
Kim, Y., Wu, Y., Seigneur, C., and Roustan, Y.: Multi-scale modeling of urban air pollution: development and application of a Street-in-Grid model (v1.0) by coupling MUNICH (v1.0) and Polair3D (v1.8.1), Geosci. Model Dev., 11, 611–629, https://doi.org/10.5194/gmd-11-611-2018, 2018.
Kim, Y., Lugon, L., Maison, A., Sarica, T., Roustan, Y., Valari, M., Zhang, Y., André, M., and Sartelet, K.: MUNICH v2.0: a street-network model coupled with SSH-aerosol (v1.2) for multi-pollutant modelling, Geosci. Model Dev., 15, 7371–7396, https://doi.org/10.5194/gmd-15-7371-2022, 2022.
Li, J., Wang, Z. F., Akimoto, H., Gao, C., Pochanart, P., and Wang, X. Q.: Modeling study of ozone seasonal cycle in lower troposphere over east Asia, J. Geophys. Res.-Atmos., 112, 15, https://doi.org/10.1029/2006jd008209, 2007.
Li, J., Wang, Z., Wang, X., Yamaji, K., Takigawa, M., Kanaya, Y., Pochanart, P., Liu, Y., Irie, H., Hu, B., Tanimoto, H., and Akimoto, H.: Impacts of aerosols on summertime tropospheric photolysis frequencies and photochemistry over Central Eastern China, Atmos. Environ., 45, 1817–1829, https://doi.org/10.1016/j.atmosenv.2011.01.016, 2011.
Li, J., Wang, Z., Zhuang, G., Luo, G., Sun, Y., and Wang, Q.: Mixing of Asian mineral dust with anthropogenic pollutants over East Asia: a model case study of a super-duststorm in March 2010, Atmos. Chem. Phys., 12, 7591–7607, https://doi.org/10.5194/acp-12-7591-2012, 2012.
Li, K., Jacob, D. J., Liao, H., Shen, L., Zhang, Q., and Bates, K. H.: Anthropogenic drivers of 2013-2017 trends in summer surface ozone in China, P. Natl. Acad. Sci. USA, 116, 422–427, https://doi.org/10.1073/pnas.1812168116, 2019.
Li, X., Zhang, Q., Zhang, Y., Zheng, B., Wang, K., Chen, Y., Wallington, T. J., Han, W. J., Shen, W., Zhang, X. Y., and He, K. B.: Source contributions of urban PM2.5 in the Beijing–Tianjin–Hebei region: Changes between 2006 and 2013 and relative impacts of emissions and meteorology, Atmos. Environ., 123, 229–239, https://doi.org/10.1016/j.atmosenv.2015.10.048, 2015.
Li, Y., Lau, A. K. H., Fung, J. C. H., Zheng, J. Y., Zhong, L. J., and Louie, P. K. K.: Ozone source apportionment (OSAT) to differentiate local regional and super-regional source contributions in the Pearl River Delta region, China, J. Geophys. Res.-Atmos., 117, 18, https://doi.org/10.1029/2011jd017340, 2012b.
Lin, C. Y., Wang, Z. F., Chou, C. C. K., Chang, C. C., and Liu, S. C.: A numerical study of an autumn high ozone episode over southwestern Taiwan, Atmos. Environ., 41, 3684–3701, https://doi.org/10.1016/j.atmosenv.2006.12.050, 2007.
Lin, J., An, J., Qu, Y., Chen, Y., Li, Y., Tang, Y. J., Wang, F., and Xiang, W. L.: Local and distant source contributions to secondary organic aerosol in the Beijing urban area in summer, Atmos. Environ., 124, 176–185, https://doi.org/10.1016/j.atmosenv.2015.08.098, 2016.
Lugon, L., Sartelet, K., Kim, Y., Vigneron, J., and Chrétien, O.: Nonstationary modeling of NO2, NO and NOx in Paris using the Street-in-Grid model: coupling local and regional scales with a two-way dynamic approach, Atmos. Chem. Phys., 20, 7717–7740, https://doi.org/10.5194/acp-20-7717-2020, 2020.
Lv, Z., Luo, Z., Deng, F., Wang, X., Zhao, J., Xu, L., He, T., Zhang, Y., Liu, H., and He, K.: Development and application of a multi-scale modeling framework for urban high-resolution NO2 pollution mapping, Atmos. Chem. Phys., 22, 15685–15702, https://doi.org/10.5194/acp-22-15685-2022, 2022.
Nuterman, R., Mahura, A., Baklanov, A., Amstrup, B., and Zakey, A.: Downscaling system for modeling of atmospheric composition on regional, urban and street scales, Atmos. Chem. Phys., 21, 11099–11112, https://doi.org/10.5194/acp-21-11099-2021, 2021.
Patterson, R. F. and Harley, R. A.: Evaluating near-roadway concentrations of diesel-related air pollution using RLINE, Atmos. Environ., 199, 244–251, https://doi.org/10.1016/j.atmosenv.2018.11.016, 2019.
Sillman, S.: The relation between ozone, NOx and hydrocarbons in urban and polluted rural environments, Atmos. Environ., 33, 1821–1845, https://doi.org/10.1016/s1352-2310(98)00345-8, 1999.
Soulhac, L., Salizzoni, P., Cierco, F. X., and Perkins, R.: The model SIRANE for atmospheric urban pollutant dispersion; part I, presentation of the model, Atmos. Environ., 45, 7379–7395, https://doi.org/10.1016/j.atmosenv.2011.07.008, 2011.
Soulhac, L., Salizzoni, P., Mejean, P., Didier, D., and Rios, I.: The model SIRANE for atmospheric urban pollutant dispersion; part II, validation of the model on a real case study, Atmos. Environ., 49, 320–337, https://doi.org/10.1016/j.atmosenv.2011.11.031, 2012.
Thouron, L., Kim, Y., Carissimo, B., Seigneur, C., and Bruge, B.: Intercomparison of two modeling approaches for traffic air pollution in street canyons, Urban Clim., 27, 163–178, https://doi.org/10.1016/j.uclim.2018.11.006, 2019.
Underwood, R. T.: Speed, Volume, and Density Relationship: Quality and Theory of Traffic Flow, Yale Bureau of Highway Traffic, 141–188, https://trid.trb.org/view/115231 (last access: 8 October 2023), 1961.
Vardoulakis, S., Fisher, B. E. A., Pericleous, K., and Gonzalez-Flesca, N.: Modelling air quality in street canyons: a review, Atmos. Environ., 37, 155–182, https://doi.org/10.1016/s1352-2310(02)00857-9, 2003.
Wagstrom, K. M., Pandis, S. N., Yarwood, G., Wilson, G. M., and Morris, R. E.: Development and application of a computationally efficient particulate matter apportionment algorithm in a three-dimensional chemical transport model, Atmos. Environ., 42, 5650–5659, https://doi.org/10.1016/j.atmosenv.2008.03.012, 2008.
Wang, P. F., Guo, H., Hu, J. L., Kota, S. H., Ying, Q., and Zhang, H.: Responses of PM2.5 and O3 concentrations to changes of meteorology and emissions in China, Sci. Total Environ., 662, 297–306, https://doi.org/10.1016/j.scitotenv.2019.01.227, 2019.
Wang, T., Xue, L. K., Brimblecombe, P., Lam, Y. F., Li, L., and Zhang, L.: Ozone pollution in China: A review of concentrations, meteorological influences, chemical precursors, and effects, Sci. Total Environ., 575, 1582–1596, https://doi.org/10.1016/j.scitotenv.2016.10.081, 2017.
Wang, T., Li, J., Pan, J. X., Ji, D. S., Kim, Y., Wu, L. L., Wang, X. M., Pan, X. L., Sun, Y. L., Wang, Z. F., Yang, W. Y., and Du, H. Y.: An integrated air quality modeling system coupling regional-urban and street models in Beijing, Urban CLim., 43, 13, https://doi.org/10.1016/j.uclim.2022.101143, 2022a.
Wang, T., Li, J., and Wang, Z.: IAQMS-street online model data, Zenodo [code and data set], https://doi.org/10.5281/zenodo.7298948, 2022b.
Wang, Y. J., Bao, S. W., Wang, S. X., Hu, Y. T., Shi, X., Wang, J. D., Zhao, B., Jiang, J. K., Zheng, M., Wu, M. H., Russell, A. G., Wang, Y. H., and Hao, J. M.: Local and regional contributions to fine particulate matter in Beijing during heavy haze episodes, Sci. Total Environ., 580, 283–296, https://doi.org/10.1016/j.scitotenv.2016.12.127, 2017b.
Wang, Z., Wang, Z., Li, J., Zheng, H., Yan, P., and Li, J.: Development of a meteorology-chemistry two-way coupled numerical model (WRF-NAQPMS) and its application in a severe autumn haze simulation over the Beijing–Tianjin–Hebei area, China, Climatic and Environmental Research, 19, 153–163, 2014.
Wang, Z. F., Li, J., Wang, X. Q., Pochanart, P., and Akimoto, H.: Modeling of regional high ozone episode observed at two mountain sites (Mt. Tai and Huang) in East China, J. Atmos. Chem., 55, 253–272, https://doi.org/10.1007/s10874-006-9038-6, 2006.
Wang, Z. F., Li, J., Wang, Z., Yang, W. Y., Tang, X., Ge, B. Z., Yan, P. Z., Zhu, L. L., Chen, X. S., Chen, H. S., Wand, W., Li, J. J., Liu, B., Wang, X. Y., Wand, W., Zhao, Y. L., Lu, N., and Su, D. B.: Modeling study of regional severe hazes over mid-eastern China in January 2013 and its implications on pollution prevention and control, Sci. China-Earth Sci., 57, 3–13, https://doi.org/10.1007/s11430-013-4793-0, 2014.
Wedding, J. B., Lombardi, D. J., and Cermak, J. E.: Wind-tunnel study of gaseous-pollutants in city street canyons, Journal of the Air Pollution Control Association, 27, 557–566, https://doi.org/10.1080/00022470.1977.10470456, 1977.
Wu, L.: ROE-1.0 release (Version 1.0), Zenodo [code], https://doi.org/10.5281/zenodo.3264859, 2019.
Wu, L., Chang, M., Wang, X., Hang, J., Zhang, J., Wu, L., and Shao, M.: Development of the Real-time On-road Emission (ROE v1.0) model for street-scale air quality modeling based on dynamic traffic big data, Geosci. Model Dev., 13, 23–40, https://doi.org/10.5194/gmd-13-23-2020, 2020.
Yang, D., Zhang, S., Niu, T., Wang, Y., Xu, H., Zhang, K. M., and Wu, Y.: High-resolution mapping of vehicle emissions of atmospheric pollutants based on large-scale, real-world traffic datasets, Atmos. Chem. Phys., 19, 8831–8843, https://doi.org/10.5194/acp-19-8831-2019, 2019.
Yarwood, G., Morris, R. E., Yocke, M., Hogo, H., and Chico, T.: Development of a methodology for source apportionment of ozone concentration estimates from a photochemical grid model, the 89th Annual Meeting of the Air and Waste Management Association, 23–28 June 1996, Nashville Tenn, 1996.
Zhang, Q., Zheng, Y., Tong, D., Shao, M., and Hao, J.: Drivers of improved PM2.5 air quality in China from 2013 to 2017, P. Natl. Acad. Sci. USA, 116, 201907956, https://doi.org/10.1073/pnas.1907956116, 2019.
Zhang, W. J., Wang, H., Zhang, X. Y., Peng, Y., Zhong, J. T., and Zhao, Y. F.: Evaluating the contributions of changed meteorological conditions and emission to substantial reductions of PM2.5 concentration from winter 2016 to 2017 in Central and Eastern China, Sci. Total Environ., 716, 13, https://doi.org/10.1016/j.scitotenv.2020.136892, 2020.
Zhang, Y., Ye, X., Wang, S., He, X., Dong, L., Zhang, N., Wang, H., Wang, Z., Ma, Y., Wang, L., Chi, X., Ding, A., Yao, M., Li, Y., Li, Q., Zhang, L., and Xiao, Y.: Large-eddy simulation of traffic-related air pollution at a very high resolution in a mega-city: evaluation against mobile sensors and insights for influencing factors, Atmos. Chem. Phys., 21, 2917–2929, https://doi.org/10.5194/acp-21-2917-2021, 2021.
Zheng, B., Zhang, Q., Tong, D., Chen, C., Hong, C., Li, M., Geng, G., Lei, Y., Huo, H., and He, K.: Resolution dependence of uncertainties in gridded emission inventories: a case study in Hebei, China, Atmos. Chem. Phys., 17, 921–933, https://doi.org/10.5194/acp-17-921-2017, 2017.
Zheng, B., Tong, D., Li, M., Liu, F., Hong, C., Geng, G., Li, H., Li, X., Peng, L., Qi, J., Yan, L., Zhang, Y., Zhao, H., Zheng, Y., He, K., and Zhang, Q.: Trends in China's anthropogenic emissions since 2010 as the consequence of clean air actions, Atmos. Chem. Phys., 18, 14095–14111, https://doi.org/10.5194/acp-18-14095-2018, 2018.