the Creative Commons Attribution 4.0 License.
the Creative Commons Attribution 4.0 License.
 | 22 Aug 2023
Forcing the Global Fire Emissions Database burned-area dataset into the Community Land Model version 5.0: impacts on carbon and water fluxes at high latitudes
Hocheol Seo
Wildfires influence not only ecosystems but also carbon and water fluxes on Earth. Yet, the fire processes including the occurrence and consequences of fires are still limitedly represented in land surface models (LSMs). In particular, the performance of LSMs in estimating burned areas across high northern latitudes is poor. In this study, we employed the daily burned areas from the satellite-based Global Fire Emissions Database (version 4) (GFED4) into the Community Land Model (version 5.0) with a biogeochemistry module (CLM5-BGC) to identify the effects of accurate fire simulation on carbon and water fluxes over Alaska and Eastern Siberia. The results showed that the simulated carbon emissions with burned areas from GFED4 (i.e., experimental run) were significantly improved in comparison to the default CLM5-BGC simulation, which resulted in opposite signs of the net ecosystem exchange for 2004, 2005, and 2009 over Alaska between the default and experimental runs. Also, we identified that carbon emissions were more sensitive to the wildfires in Alaska than in Eastern Siberia, which could be explained by the vegetation distribution (i.e., tree cover ratio). In terms of water fluxes, canopy transpiration in Eastern Siberia was relatively insensitive to the size of the burned area due to the interaction between leaf area and soil moisture. This study uses CLM5-BGC to improve our understanding of the role of burned areas in ecohydrological processes at high latitudes. Furthermore, we suggest that the improved approach will be required for better predicting future carbon fluxes and climate change.
- Article
(2527 KB) - Full-text XML
- BibTeX
- EndNote


Wildfires are natural phenomena that directly and indirectly affect the life of humans as well as vegetated ecosystems (Bowman et al., 2009; Haque et al., 2021; Holloway et al., 2020; Li et al., 2017). Wildfires burn the leaves, stems, and roots of plants and alter ecological communities, which is called secondary succession (Knelman et al., 2015; Mętrak et al., 2008; Seo and Kim et al., 2019). Moreover, annual carbon emissions from wildfires were estimated to be approximately 2.1 Pg, which affects the global carbon cycle (Arora and Melton, 2018; van der Werf et al., 2010). Wildfires can be a potential disaster that results in enormous damage; for example, the damage costs of Australian wildfires from 2019 to 2020 were estimated to be over USD 100 billion, covering infrastructure damage, job losses, and firefighting cost (Deb et al., 2020). Moreover, the smoke particles from wildfires may be harmful to human health (Cascio, 2018; Black et al., 2017).
In particular, in high-latitude areas, such as boreal forest and tundra regions, the wildfire intensity and occurrence have increased over the past decades (Jiang et al., 2015; Madani et al., 2021; Veraverbeke et al., 2017). While few arctic fires had occurred historically because of the low temperatures in the summer season, snow cover, and short growing seasons, arctic fires are no longer unusual owing to warming trends. For instance, unprecedented large fires (more than 1.5 Mha of burned areas) in interior Alaska were reported in 2004 and 2015. From these fires, more than 50 Tg C was emitted, according to the Alaskan Fire Emissions Database (AKFED) (Veraverbeke et al., 2015a). These fires not only result in carbon emissions from vegetation but also increase the soil temperature in summer, which could induce permafrost thawing (Holloway et al., 2020; Jiang et al., 2015). This could result in the release of belowground carbon, which can increase the levels of carbon dioxide in the atmosphere.
Fires at high latitudes are primarily ignited by natural processes rather than by humans. Veraverbeke et al. (2017) reported that 76 %–87 % of fire ignition and 82 %–95 % of burned areas were the result of the lightning occurring between 1975 and 2015 in North American boreal forests. They also suggested that persisting warming and dryness accelerate the spread of fires, which could cause extreme fires. Furthermore, their regression analysis showed that lightning frequency will increase in the future (2050–2074), which may increase the burned area in Alaska. Therefore, understanding the fire mechanism is critical to predict future fires and carbon emissions as well as evaluate the fire risk to permafrost carbon.
To understand and describe wildfire dynamics, many fire models such as the Community Land Model (CLM) (Li et al., 2012), SPread and InTensity of FIRE (Thonicke et al., 2010), MC-FIRE (Conklin et al., 2016), Fire Including Natural and Agricultural Lands model (Rabin et al., 2018), and the interactive fire and emission algorithm for natural environments (Mangeon et al., 2016), which have been incorporated into Earth system models (ESMs) and land surface models (LSMs), have been developed. As individual fire models were developed for different purposes, each model calculates fire ignition, burned area, fire combustion, and mortality based on different structures of fire regime and input data. The Fire Modeling Intercomparison Project (FireMIP; Rabin et al., 2017) was executed for comparing the performance of these fire models and assessing their strengths and weaknesses in detail. Despite these efforts of developing fire models, LSMs are still limited in representing the burned area, thus simulating fire impacts on the land surface processes. This is because understanding of a process-based fire mechanism remains elusive, and thus large uncertainties of fire parameterization exist (Wu et al., 2021).
In this study, we aimed to understand the significance of fire prediction in further simulating fire impacts on ecohydrological processes in the LSMs. We implemented the daily burned areas derived from the Global Fire Emissions Database 4 (GFED4) for 12 years (2001–2012) over the arctic region into the National Center for Atmospheric Research (NCAR) CLM version 5.0 with a biogeochemistry module (CLM5-BGC), one of the widely used LSMs. In CLM5-BGC, the burned area is predicted based on the empirical relationships among lightning frequency, human population density, and vegetation composition. Nevertheless, the model is limited in capturing the observed burned areas from GFED4 over several areas, including those at high latitudes. We compared the results of the default CLM5-BGC simulation (hereafter, CLM-Default, which uses the default fire module) and the experimental simulation with GFED4 (hereafter, EXP-GFED4) with a focus on Alaska and Siberia, where there are large uncertainties of fire prediction (i.e., prediction of the burned area). Furthermore, we examined the simulated carbon fluxes and water fluxes, including evapotranspiration (ET) and soil moisture in CLM-Default and EXP-GFED4.
2.1 Model description
CLM5, a land component of the NCAR Community Earth System Model (version 2.0.1), is a grid-based computational model (Lawrence et al., 2019). Each grid cell is comprised of sub-grids that represent the land cover type (i.e., glacier, lake, wetland, urban, and vegetated). The 17 plant functional types (PFTs) are represented in the vegetated land cover. The model represents the instantaneous exchange of energy, and water and momentum were simulated between land and atmosphere across a variety of spatial and temporal scales at the sub-grid level. Furthermore, hydrological processes including evapotranspiration, surface runoff, sub-surface runoff, streamflow, aquifer recharge, and snow are simulated at the sub-grid level. When the BGC module is adopted (i.e., CLM5-BGC), the carbon and nitrogen cycles and seasonal vegetation phenology are simulated for the atmosphere, vegetation, and soil organic matter at the PFT level. These cycles, which are linked to climate, land cover and land use, fires, and atmosphere CO2 level, affect other cycles such as hydrological cycles and energy fluxes.
In CLM5-BGC, fire is simulated based on a process-based fire parameterization developed by Li et al. (2012). There are four types of fire in CLM5-BGC: non-peat fire, agriculture fire, deforestation fire, and peat fire. For non-peat fires, the number of fire ignitions is calculated as the sum of natural and anthropogenic ignitions. The estimation of natural ignition sources is based on the NASA Lightning Imaging Sensor (LIS)/Optical Transient Detector (OTD) lightning frequency datasets. The frequency of cloud-to-ground lightning that ignites fires is estimated with the latitudinally varying ratios of the total lightning frequency obtained from remotely sensed data (i.e., LIS/OTD), which include two different types of lightning, i.e., cloud-to-ground and the cloud-to-cloud lightning. Furthermore, the ignition source from human activity is calculated based on the human population density. The fire spread rate is then calculated by considering wind speed and vegetation condition (Arora and Boer, 2005). Socioeconomic influences are parameterized using gross domestic product (GDP) and population density, which means that higher populated and more developed regions will have a better fire suppression capacity.
In CLM, the burned area is calculated at the grid level, and the fire emissions are calculated at a PFT level. Once a grid-level burned area is calculated, the same fractional area burned is imposed on each PFT in the grid. The PFT-level carbon emission from the fire is calculated as follows (Li et al., 2012):
where CE is the carbon emission; A is the fractional area burned; C is a vector with the carbon density of leaves, stems, and roots, carbon transfer, and carbon pools; and CC is the corresponding combustion completeness factor vector.
Leaves and roots may be damaged in burned areas, which reduces their carbon-capturing productivities (Reyer et al., 2017; Seo and Kim, 2019; Swezy and Agee, 1991). In CLM5-BGC, the amount of leaf carbon to litter (Ψ) caused by fire is calculated as follows (Li et al., 2012):
where Ab is the calculated burned area, Ag is the area of the grid cell, fi is the fraction of coverage of each PFT, Cleaf is the amount of leaf carbon, and M is the mortality factor vector for each PFT. The leaf area index (LAI) is recalculated based on the adjusted amount of leaf carbon. In addition, the methods by which the amount of carbon in live stems, dead stems, and roots and the storage pool is adjusted due to fires are similar to those mentioned above.
Leaf area controls canopy evaporation and transpiration as well as carbon fluxes (gross primary production (GPP), net primary production (NPP), net ecosystem production (NEP), and net ecosystem exchange (NEE)). NEE, which represents the total carbon fluxes between an ecosystem and the atmosphere, is calculated by using the NEP and carbon emissions from wildfires. The equations for these carbon fluxes are as follows:
where Rp is plant respiration and Rh is heterotrophic respiration.
Because hydrological processes are highly linked to vegetation dynamics, fire processes may affect not only water cycles but also ecosystem products (Jiao et al., 2017). For instance, the water cycles on land surfaces, such as partitioning of ET, are affected by fires because the fire changes leaf area in ecosystems (Netzer et al., 2009; Park et al., 2020; Seo and Kim, 2019; Wang et al., 2019). More details on CLM5-BGC processes, including the equations for leaf phenology, hydrology cycles, fires, and carbon cycles, are described in Lawrence et al. (2019).
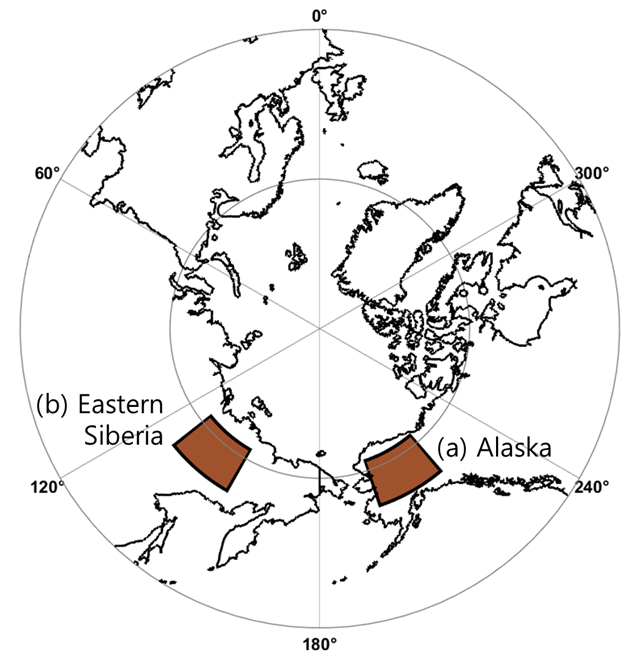
Figure 1Study domain: (a) Alaska (61–70∘ N and 200–218∘ E) and (b) Eastern Siberia (61–70∘ N and 130–148∘ E).
2.2 Site description
In this study, we focused on Alaska (61–70∘ N, 200–218∘ E) and Eastern Siberia (61–70∘ N, 130–148∘ E), which are located at northern high latitudes (Fig. 1). Both domains have the same size and latitudes. The average temperature based on Climate Research Unit (CRU)–National Centers for Environmental Prediction (NCEP) reanalysis data (2001–2012) is −5.11 and −15.28 ∘C in Alaska and Eastern Siberia, respectively. The average annual snowfall and rainfall are 83 and 218 mm in Alaska and 92 and 208 mm in Eastern Siberia, respectively.
There are differences in vegetation types in these regions, based on MODIS (Lawrence and Chase, 2007) (evergreen trees: 26.4 %, deciduous trees: 1.6 %, shrub: 28.5 %, grass: 34.5 %, crop: 3.9 %, and bare ground: 5.1 % in Alaska; evergreen trees: 1.2 %, deciduous trees: 14.9 %, shrub: 45.8 %, grass: 29.7 %, crop: 1.4 %, and bare ground: 7.1 % in Eastern Siberia). In summary, the tree fraction is higher in Alaska (28 %) than that in Eastern Siberia (16.1 %), and the fraction of low vegetation (i.e., grasses and shrubs) is lower in Alaska (63 %) than that in Eastern Siberia (74.5 %). Notably, the largest areas were the natural vegetation and crop land units, and the lake, urban, and glacier land units occupied less than 1 % in both regions.
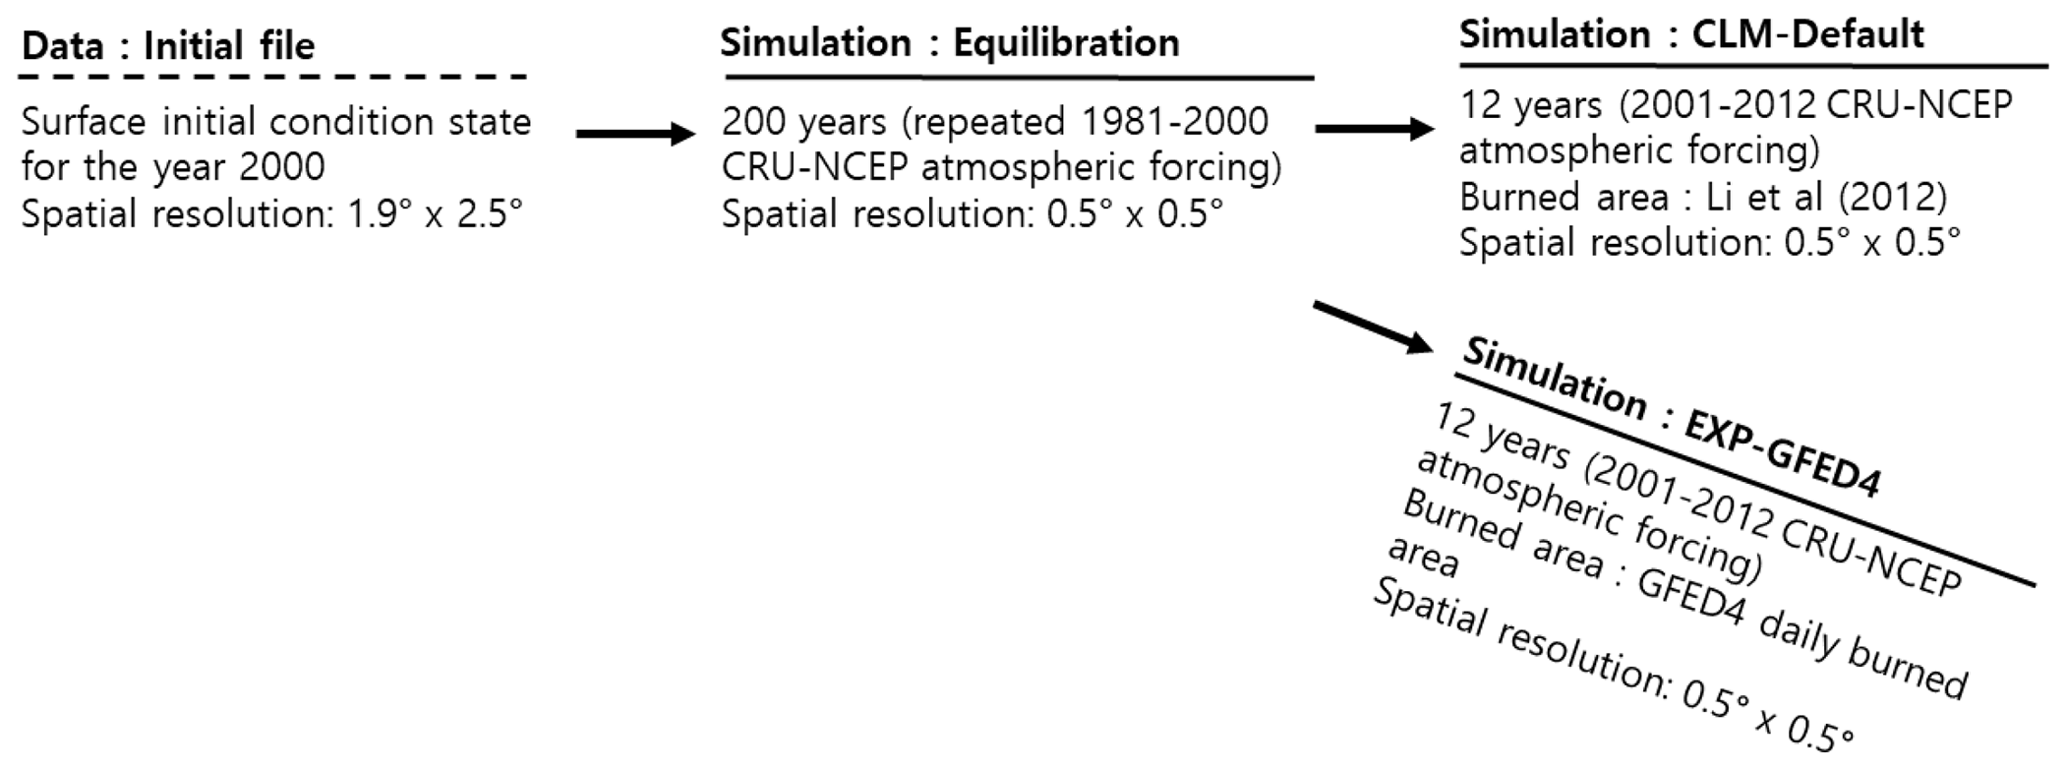
Figure 2Flow diagram for CLM-Default and EXP-GFED4. CLM-Default: default CLM5-BGC simulation; EXP-GFED4: experimental simulation with Global Fire Emissions Database.
2.3 Experimental design
In this study, we designed two sets of experiments to investigate the impact of burned area using fire simulation based on the study by Li et al. (2012) (i.e., CLM-Default) and satellite observations from GFED4 (i.e., EXP-GFED4) over Alaska and Eastern Siberia. Figure 2 shows the experimental process of this study. Our simulations started with a pre-existing initial condition state for the year 2000 at a 1.9∘ × 2.5∘ spatial resolution provided by NCAR. Because starting a new simulation at a different spatial resolution could introduce model artifacts, we ran CLM5-BGC at a 0.5∘ × 0.5∘ spatial resolution from the initial state, including the land use, such as cropland, for 200 years for the equilibration with repeated use of the Climate Research Unit (CRU)–National Centers for Environmental Prediction (NCEP) reanalysis climate data for 1981–2000. Then, CLM-Default and EXP-GFED4 were simulated for 12 years (2001–2012) at the 0.5∘ × 0.5∘ spatial resolution using CRU–NCEP atmospheric forcing, which includes precipitation, temperature, wind speed, surface pressure, specific humidity, longwave radiation, and solar radiation. While burned areas were simulated based on Li et al. (2012) in CLM-Default, the GFED daily burned area over the arctic region was directly inserted into CLM5-BGC in EXP-GFED4, with the daily data being equally divided into a half-hourly model time step (Seo and Kim, 2022).
In this study, we compared the carbon and water fluxes in CLM-Default and EXP-GFED4. In particular, carbon emissions and the NEE were evaluated using GFED4, AKFED, and GEOS-Carb CASA-GFED. Additionally, we analyzed the impacts of fire on carbon fluxes according to the distribution of PFT. Furthermore, comparisons of water fluxes such as ground evaporation, canopy evaporation, canopy transpiration, and soil moisture at grid level were performed to reveal the impacts of fire on water cycles.
2.4 Fire and carbon fluxes datasets
GFED4, which is based on satellite data such as MODIS and the Tropical Rainfall Measuring Mission Visible and Infrared Scanner, provides gridded data on the global burned area, fire persistence, land cover distribution, and fractional tree cover distribution of burned areas, among others (Giglio et al., 2013). The data are provided at a 0.25∘ × 0.25∘ resolution and daily and monthly temporal resolutions. Furthermore, details on fire impacts, such as carbon emissions, dry matter emissions, biosphere fluxes (NPP, heterotrophic respiration), and emission factors data are included. The carbon emission data are based on burned areas and the Carnegie–Ames–Stanford Approach (CASA) carbon-cycle terrestrial model for each month. In this study, daily burned-area data from GFED4 were incorporated into CLM5-BGC, and monthly scaled carbon emission data from GFED4 were used to evaluate the model performance (Table 1).
Table 1Model and data in this study.
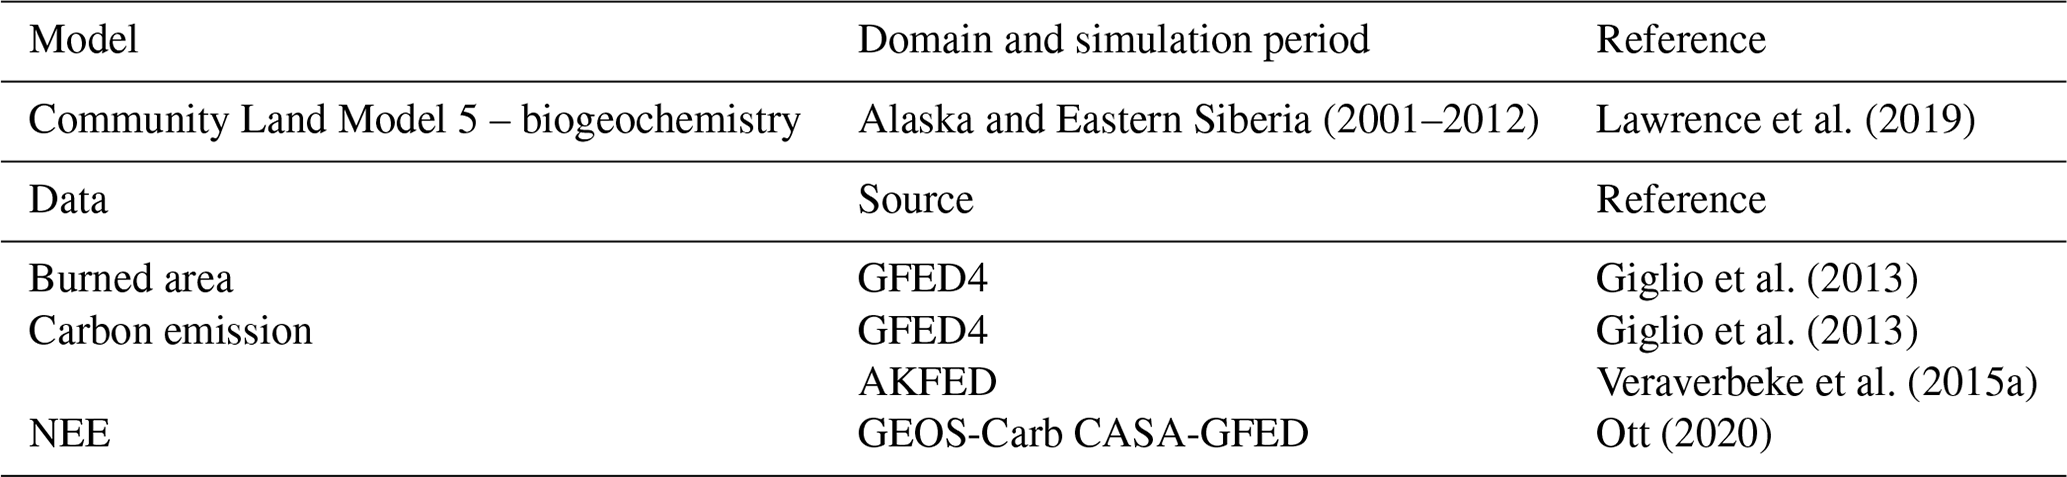
GFED4: Global Fire Emissions Database (version 4); NEE: net ecosystem exchange; AKFED: Alaskan Fire Emissions Database.
We also used data on Alaskan carbon emissions from AKFED (Veraverbeke et al., 2015a) to evaluate the model performance for carbon emissions in Alaska (Table 1). Veraverbeke et al. (2015a) developed a statistical model to calculate the carbon consumption in Alaska between 2001 and 2012. They employed environmental variables such as elevation, slope, and day of burning to calculate ground-level carbon consumption. In addition, pre-fire tree cover and differenced normalized burn ratio are used to predict aboveground carbon emission. Veraverbeke et al. (2015a) estimated that the highest carbon emission was 69 Tg C in 2004, and the annual carbon emission was 15 Tg C.
We used monthly NEE products from GEOS-Carb CASA-GFED for 2003 to 2012 to evaluate the performance of EXP-GFED4 and CLM-Default. However, the definitions of NEE according to CLM5-BGC and GEOS-Carb CASA-GFED are quite different. In CLM5-BGC, the NEE is the final carbon flux between an ecosystem and the atmosphere. Thus, the carbon flux of burning was included when calculating the NEE (Eq. 5), but it was excluded in GEOS-Carb CASA-GFED. To unify the definition of NEE, we redefined the NEE in GEOS-Carb CASA-GFED as follows.
where NEE is the total carbon flux between land and atmosphere including emission due to fires, NEEge is the value of NEE according to GEOS-Carb CASA-GFED, FireE is the wildfire carbon emissions, and FuelE is the carbon emissions from wood-fuel burning in GEOS-Carb CASA-GFED.
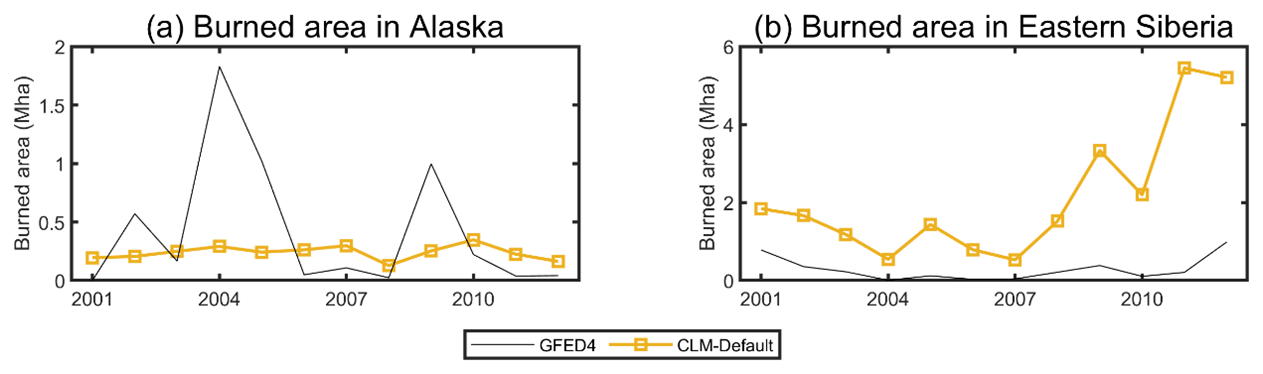
Figure 3Burned area based on GFED4 and simulated burned area of CLM-Default over (a) Alaska and (b) Eastern Siberia from 2001 to 2012. GFED4: Global Fire Emissions Database (version 4); CLM-Default: default CLM5-BGC simulation.
3.1 Burned area
We first evaluated the performance of estimating burned areas in Alaska and Eastern Siberia from CLM5-BGC (i.e., CLM-Default) and compared it to that of GFED4 (Fig. 3). While an average of 0.42 Mha of burned area from 2001 to 2012 was observed in Alaska, the average annual burned area was estimated at 0.24 Mha in CLM-Default (Fig. 3a). In Alaska, there were large discrepancies in burned areas for 2004, 2005, and 2008 between GFED4 and simulation results. More than 1 Mha of burned area existed for 3 years (2004, 2005, and 2009), which is remarkably different from that of the other years. Studies suggested that these large burned areas were associated with a high lightning frequency and drought (Littell et al., 2016; Veraverbeke et al., 2017; Xiao and Zhuang, 2007). However, this phenomenon was not captured in CLM5-BGC, which predicts relatively constant annual burned areas. In contrast, the burned area was dramatically overestimated in Eastern Siberia (Fig. 3b). While an average of 0.29 Mha of burned area was observed, the average annual burned area was estimated at 2.14 Mha with CLM5-BGC. Although the GFED4 burned area in Eastern Siberia did not vary significantly over time, the simulated burned area increased from 2001 to 2012 at a rate of 0.33 Mha yr−1.
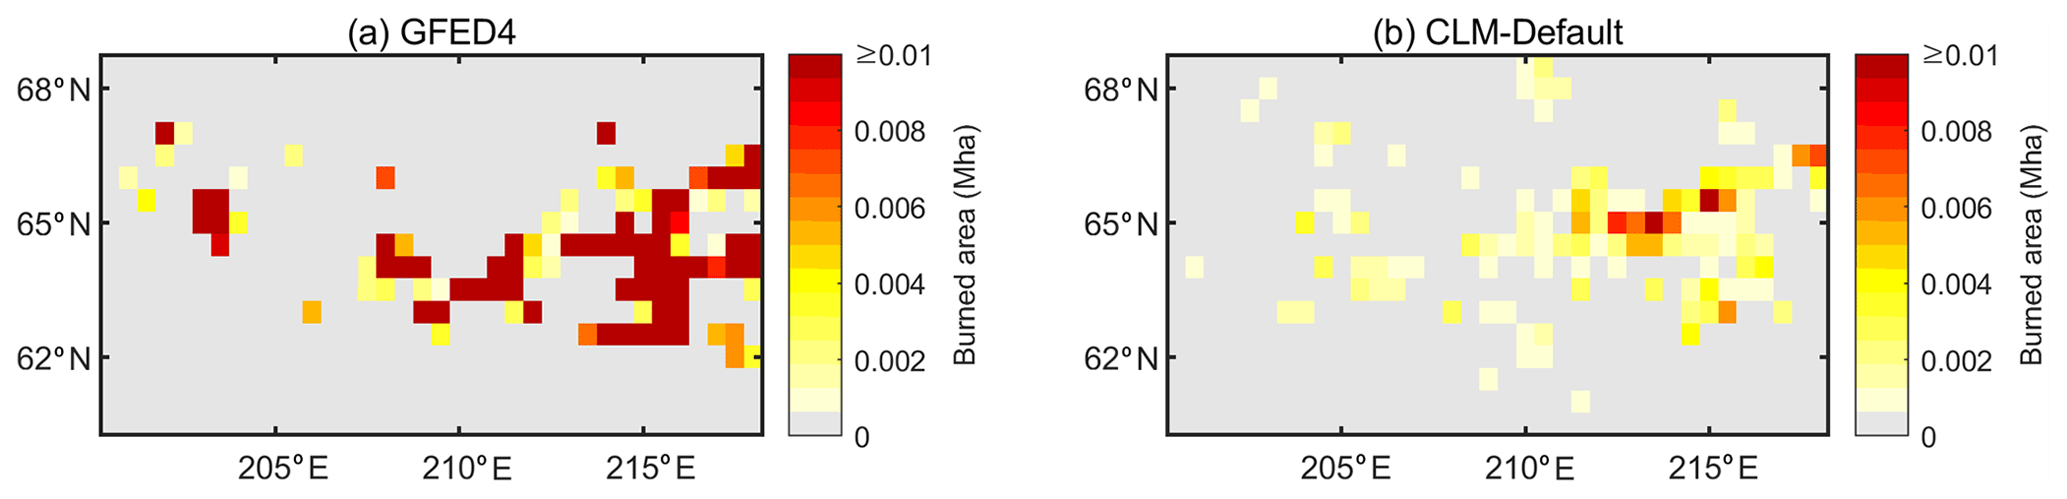
Figure 4Spatial distribution of the burned area of (a) GFED4 and (b) CLM-Default in 2004 over Alaska. GFED4: Global Fire Emissions Database (version 4); CLM-Default: default CLM5-BGC simulation.
Table 2Number of grid cells with more than 0.01 Mha of burned area of GFED4 and CLM-Default.
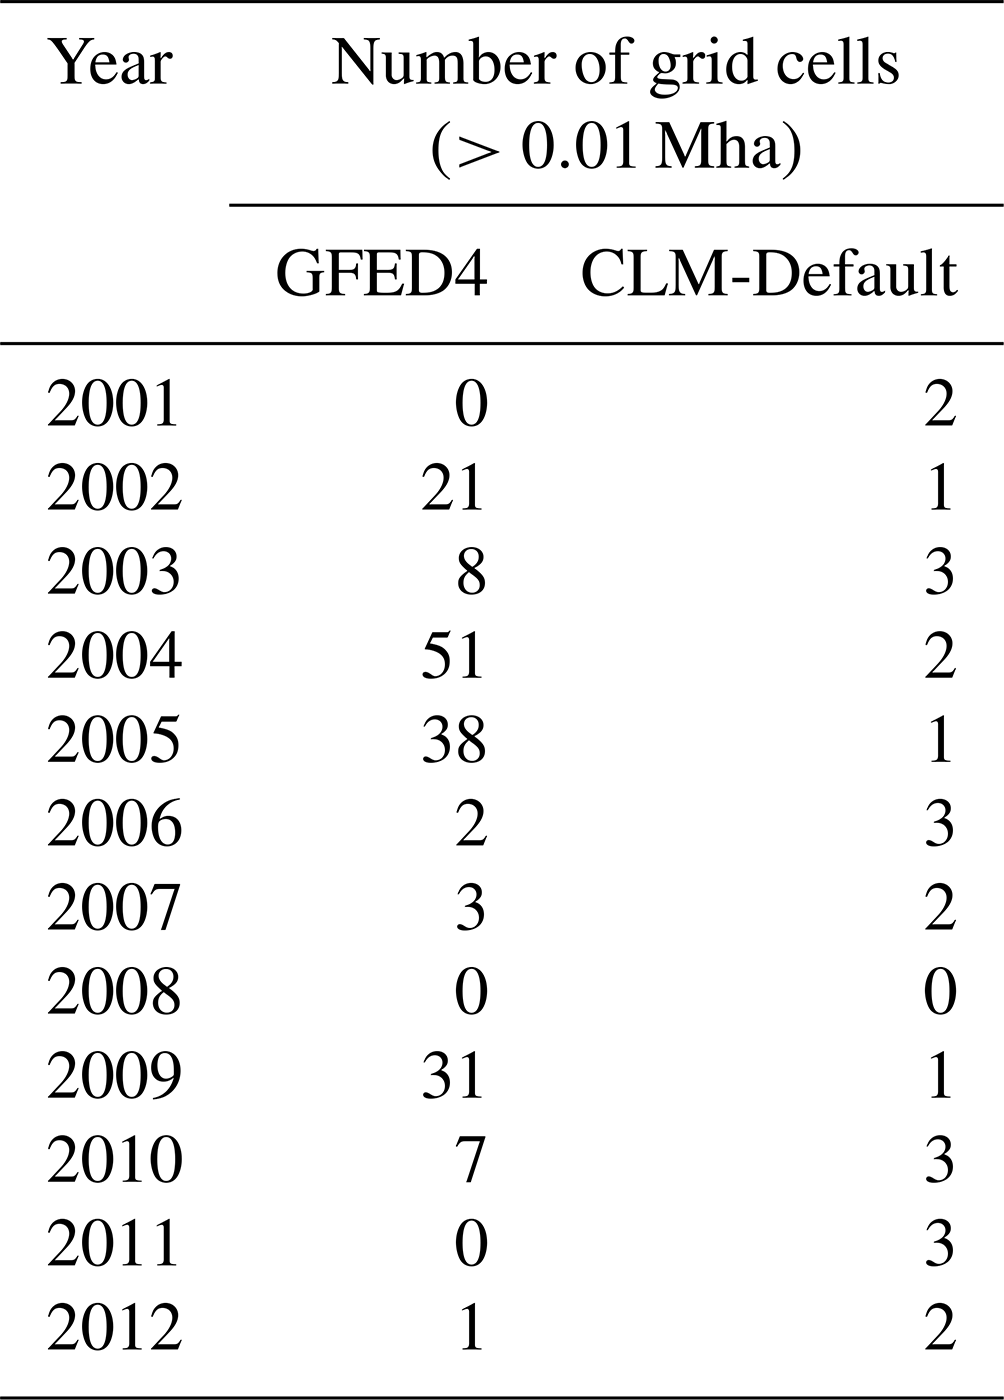
GFED4: Global Fire Emissions Database (version 4); CLM-Default: default CLM5-BGC simulation.
Figure 4 shows the spatial distribution of the burned areas of GFED4 and CLM-Default in 2004 over Alaska. The number of grid cells (0.5∘ × 0.5∘) in GFED4 where the burned areas exceeded 0.01 Mha in 2004 was more than 50. In contrast, there were two grid cells with more than 0.01 Mha of burned areas simulated using CLM5-BGC in Alaska (Table 2). Table 2 shows that CLM5-BGC has a limitation in simulating large burned areas in Alaska. Small fires were simulated in more grid cells, and the simulated burned areas were more widely distributed in CLM-Default than those in the GFED4 products.
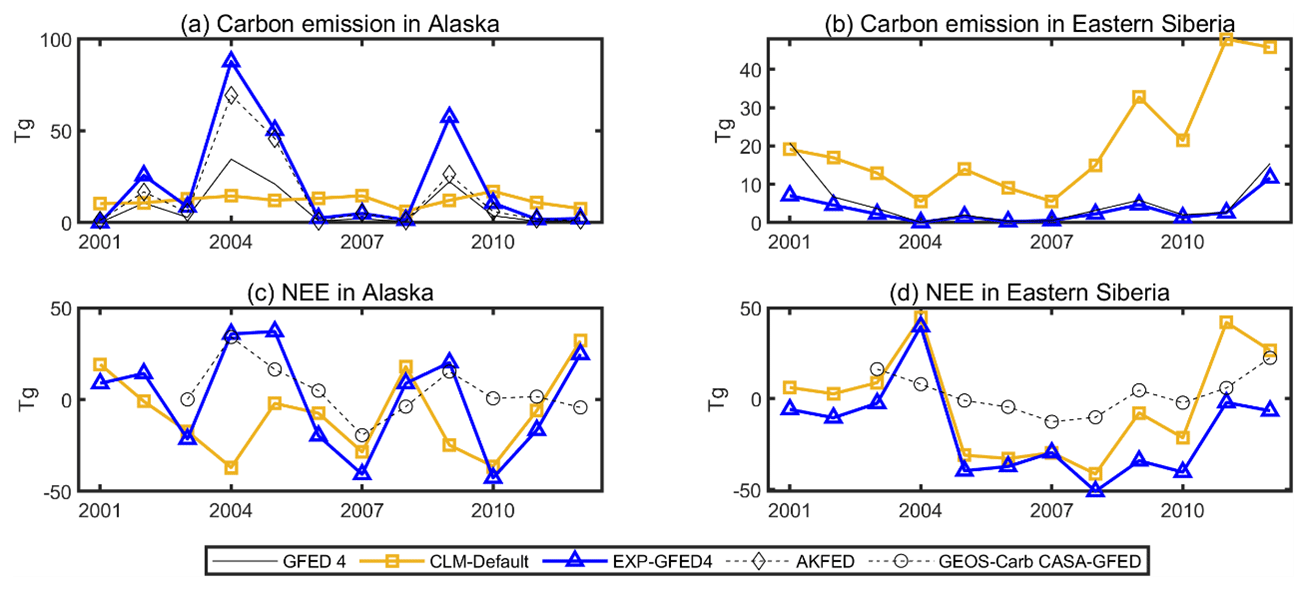
Figure 5Simulated carbon fluxes of CLM-Default and EXP-GFED4 such as carbon emission (a, b) as well as in (c, d) Alaska (a, c) and Eastern Siberia (b, d) from 2001 to 2012. The GFED carbon emission (a, b) and AKFED carbon emission (a) are added to evaluate the performance of carbon emission in CLM-Default and EXP-GFED4 runs. Also, NEE of GEOS-Carb CASA-GFED was added to evaluate the performance of NEE in CLM-Default and EXP-GFED4 runs (c, d). CLM-Default: default CLM5-BGC simulation; EXP-GFED4: experimental simulation with Global Fire Emissions Database (version 4); AKFED: Alaskan Fire Emissions Database; NEE: net ecosystem exchange.
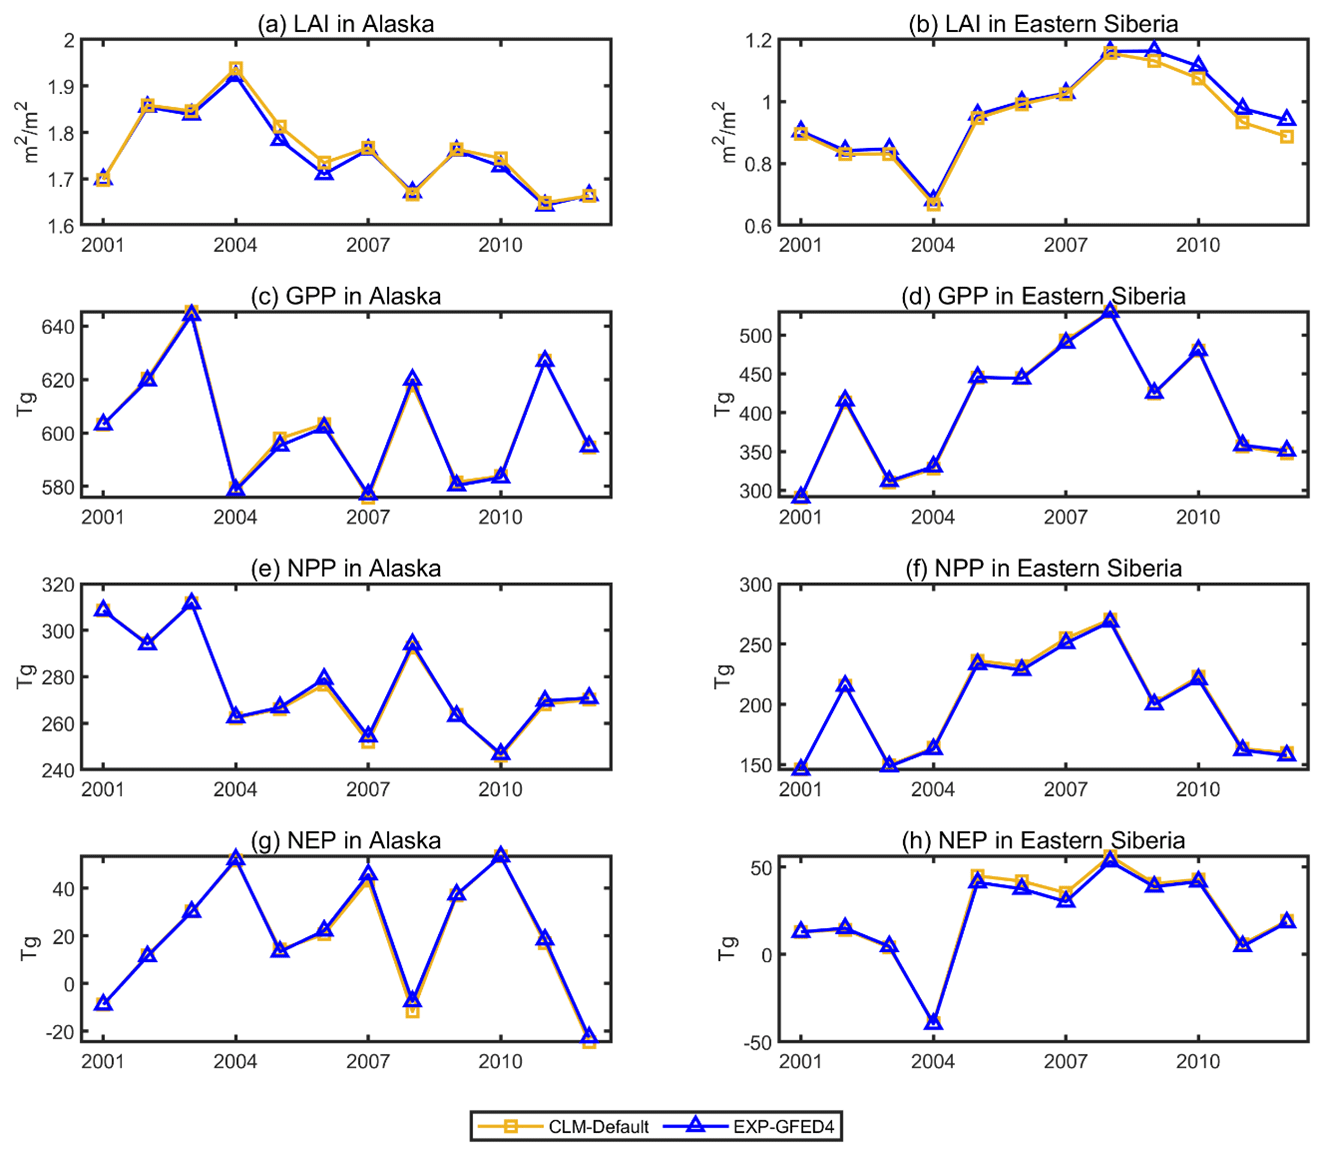
Figure 6Simulated LAI (a, b) and carbon fluxes of CLM-Default and EXP-GFED4 such as GPP (c, d), NPP (e, f), and NEP (g, h) in Alaska (a, c, e, g) and Eastern Siberia (b, d, f, h) from 2001 to 2012. LAI: leaf area index; CLM-Default: default CLM5-BGC simulation; EXP-GFED4: experimental simulation with Global Fire Emissions Database (version 4); GPP: gross primary production; NPP: net primary production; NEP: net ecosystem production.
Table 3Simulated carbon fluxes; carbon emission, GPP, NPP, NEP, and NEE in CLM-Default and CLM-GFED over Alaska and Eastern Siberia.
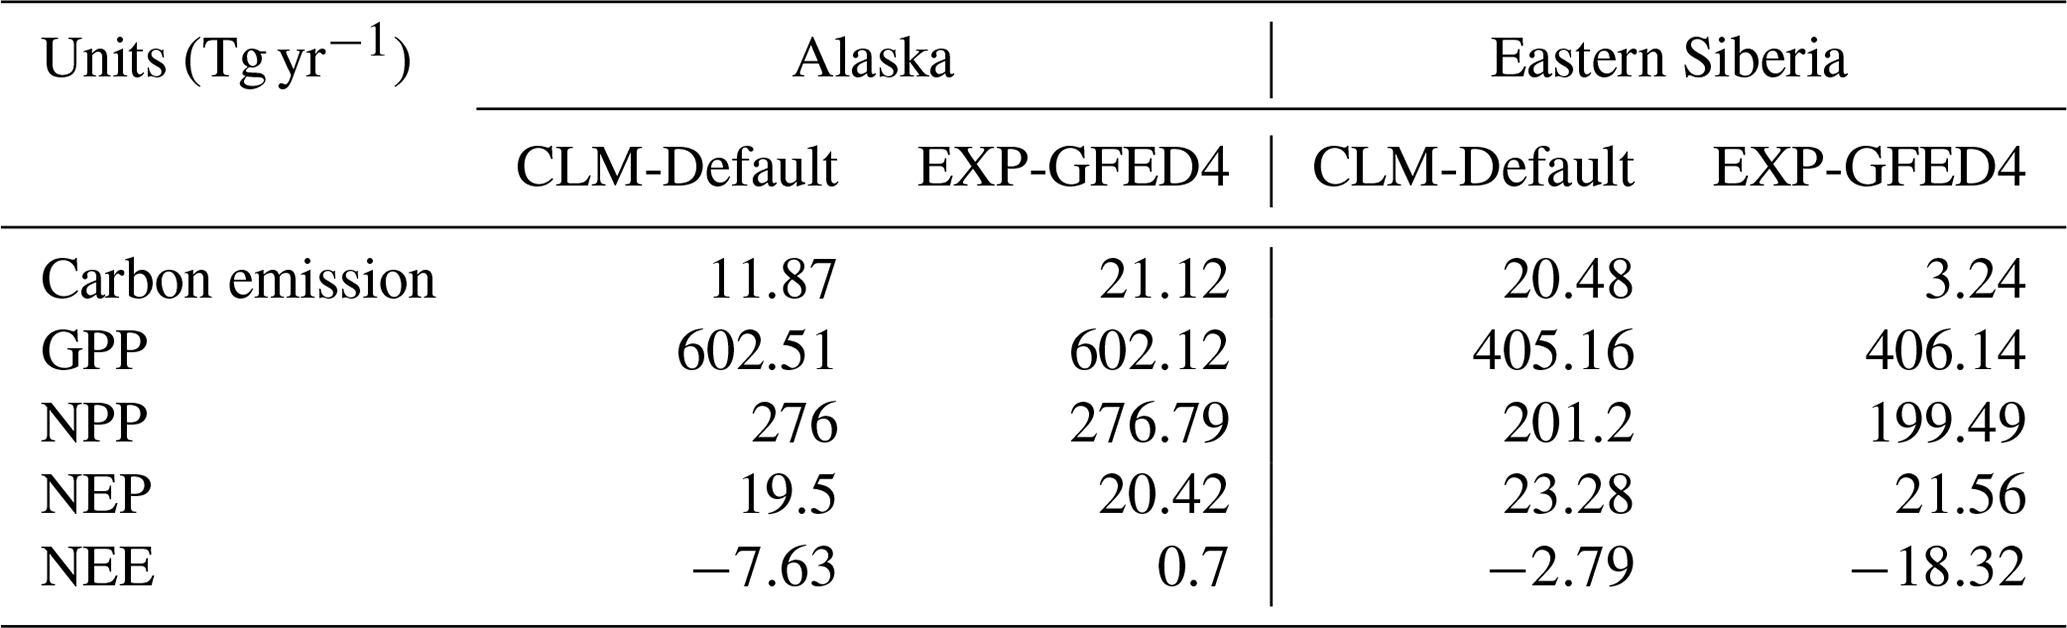
GPP: gross primary production; NPP: net primary production; NEP: net ecosystem production; NEE: net ecosystem exchange; CLM-Default: default CLM5-BGC simulation; EXP-GFED4: experimental simulation with Global Fire Emissions Database.
3.2 Fire impacts on carbon fluxes
We compared the carbon fluxes of CLM-Default and EXP-GFED4 to understand the impacts of fire on high-latitude regions (Figs. 5 and 6 and Table 3). The average carbon emissions were 11.87 and 21.11 Tg yr−1 in CLM-Default and EXP-GFED4 in Alaska, respectively, and 20.48 and 3.24 Tg yr−1 in CLM-Default and EXP-GFED4 in Eastern Siberia, respectively (Table 3). As expected, there were large differences in carbon emissions in CLM-Default and EXP-GFED4 in both regions because the simulated carbon emission was directly linked to burned areas. In the model, carbon emissions had a strong correlation with burned areas in both regions (Alaska: 0.99, Eastern Siberia: 0.89).
Table 4Carbon emission of CLM-Default, EXP-GFED4, GFED4, and AKFED from 2001 to 2012 over Alaska.
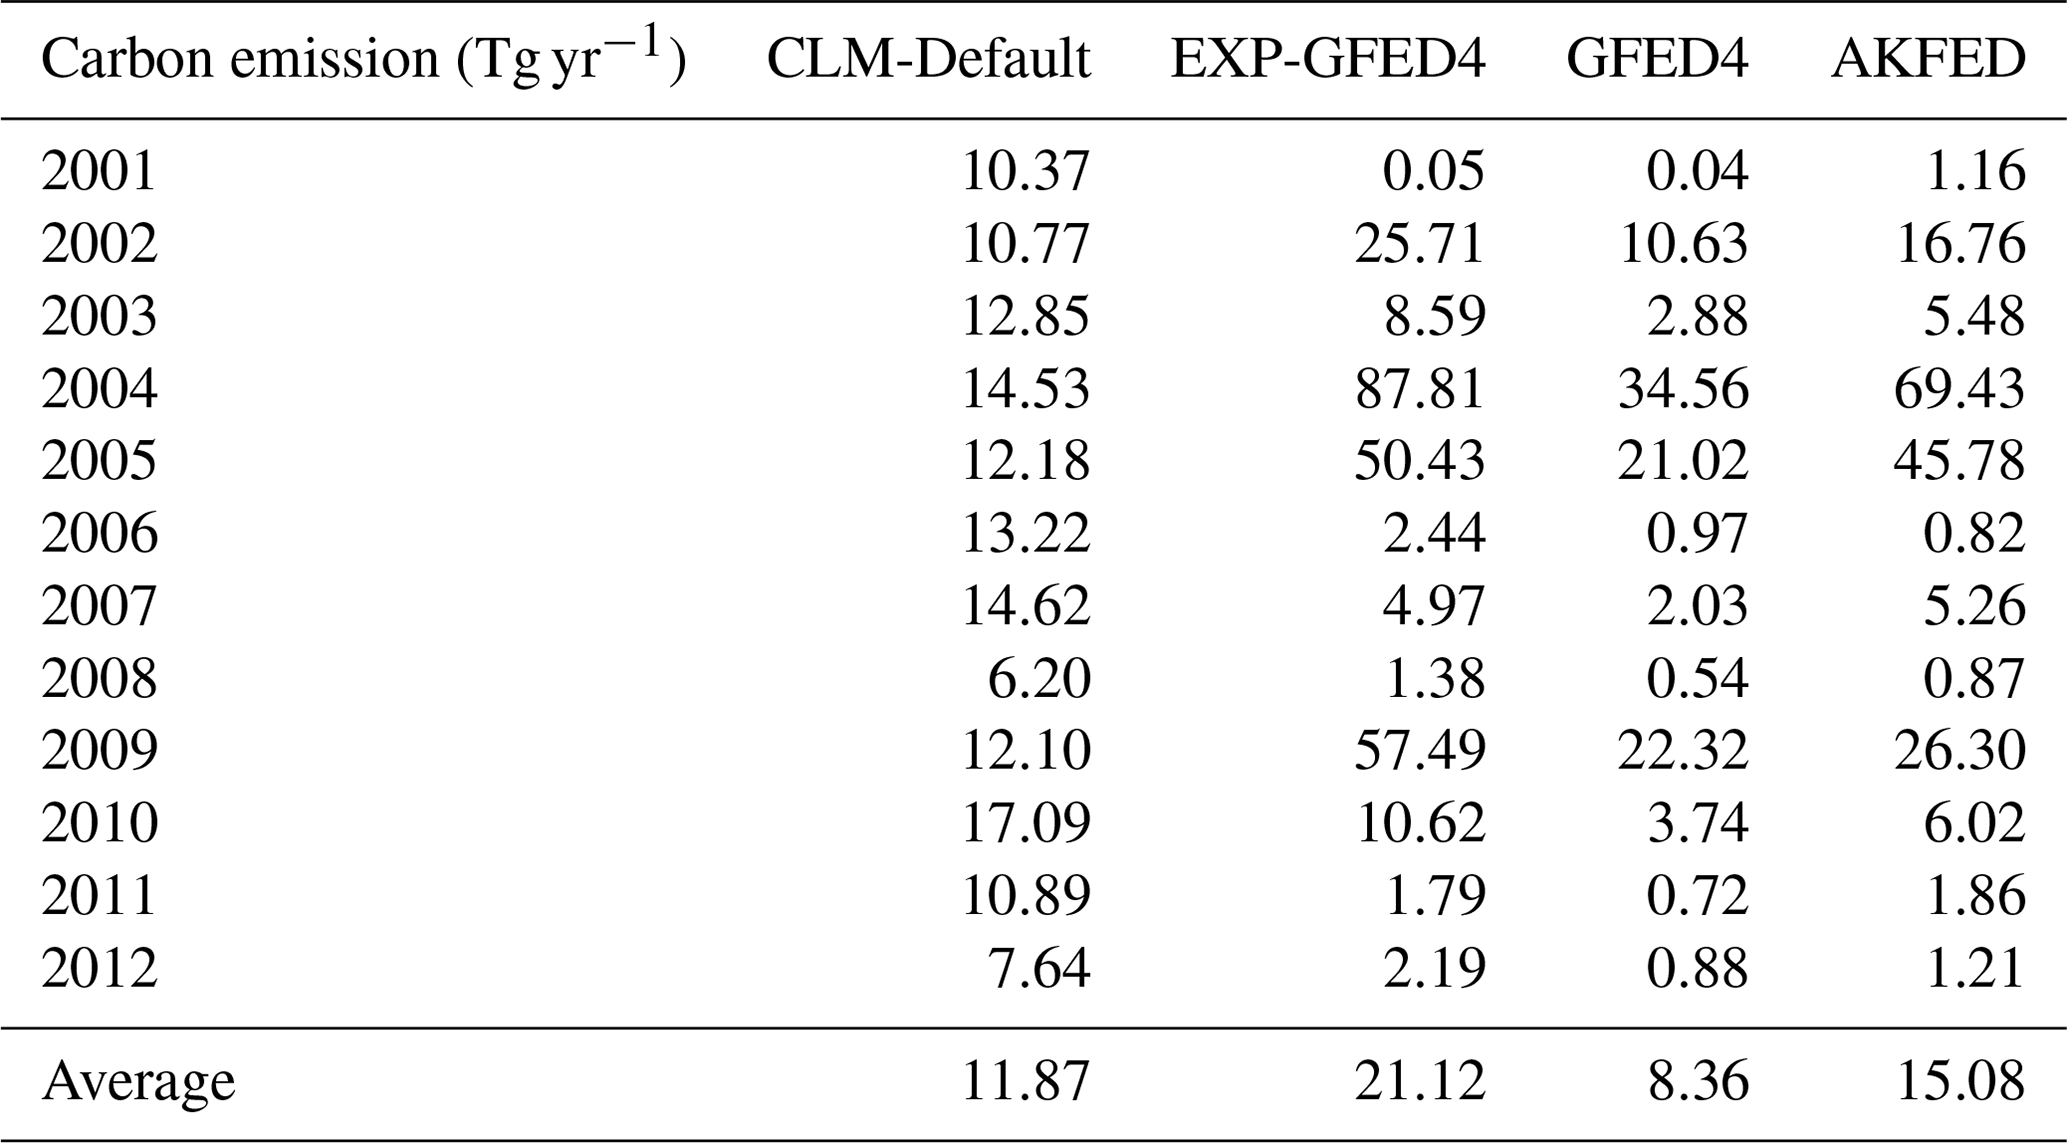
CLM-Default: default CLM5-BGC simulation; EXP-GFED4: experimental simulation with Global Fire Emissions Database; AKFED: Alaskan Fire Emissions Database.
Furthermore, the simulated Alaskan annual carbon emissions for CLM-Default and EXP-GFED4 were evaluated with AKFED carbon emission datasets and GFED4 (Fig. 5a and Table 4). The correlations of annual carbon emission between simulated carbon emissions (CLM-Default and EXP-GFED4) and GFED4 were 0.3 and 0.99, respectively. Moreover, the correlations between the simulated carbon emissions and AKFED carbon emissions were determined (CLM-Default: 0.31; EXP-GFED4: 0.96). While the root mean square error (RMSE) between the simulated carbon emissions and the AKFED carbon emissions decreased after applying the GFED4 burned area (CLM-Default: 20.48 Tg yr−1; EXP-GFED4: 10.98 Tg yr−1), the RMSE between the simulated carbon emissions and the GFED4 carbon emissions increased (CLM-Default: 11.02 Tg yr−1; EXP-GFED4: 20.93 Tg yr−1). This is because average carbon emissions for GFED4 were 8.36 Tg yr−1 and are relatively lower than carbon emissions in EXP-GFED4 and AKFED. The combustion completeness factor for leaves is 0.8, and that for stems ranges from 0.27–0.8, depending on the PFTs in CLM5-BGC. According to van der Werf et al. (2010), the combustion completeness factor of aboveground live biomass, which ranges from 0.3–0.4 in the boreal region, is lower than that in other regions. Therefore, the combustion completeness factors for boreal trees may be lower than the current default value in CLM5-BGC.
The carbon emission simulation was highly improved after replacing the fire simulation with GFED4 in Eastern Siberia (Fig. 5b); the correlation was improved from 0.41 in CLM-Default to 0.88 in EXP-GFED4, and the RMSE was reduced from 19.74 Tg yr−1 in CLM-Default to 4.2 Tg yr−1 in EXP-GFED4, compared with the GFED4 products. In Eastern Siberia, grasses are dominant, suggesting that the value of the combustion completeness factors for grass in CLM5-BGC is more similar to those of GFED4 products than to those of boreal trees.
Unlike carbon emissions, the regionally averaged GPP, NPP, and NEP (Fig. 6c–h) did not significantly change in EXP-GFED4. The differences in GPP, NPP, and NEP are less than 3 %, indicating that fires rarely impacted carbon fluxes related to vegetation and decomposition. This is because the ratio of the burned area to the total area was relatively small. For example, the highest annual burned area of all simulations was 6 Mha, which accounted for 6.87 % of our study domain. The simulated LAIs in Alaska and Eastern Siberia are presented in Fig. 6a and b, respectively. In Alaska (Fig. 6a), the difference in LAI between CLM-Default and EXP-GFED4 was the largest in 2005 (0.03 m2 m−2). Although the difference in burned area between CLM-Default and GFED4 (Fig. 3a) was the largest in 2004, the largest difference in LAI was in 2005 since vegetation damage caused by fire in 2004 had not fully recovered, and the difference in burned area in 2005 was also quite large. In Eastern Siberia (Fig. 6b), the difference in the simulated LAI between CLM-Default and EXP-GFED4 has been large since 2009, when the difference in the size of burned areas was amplified (Fig. 3b). Although the LAI, which affects primary GPP and other carbon fluxes, was reduced by fires, the LAI after fires was not substantially different owing to the small burned area compared to the total area.
However, NEE, which represents the net carbon fluxes between land and ecosystem (Eq. 5), was largely affected by fires, unlike other fluxes such as GPP, NEE, and NEP (Fig. 5c and d). NEE changed significantly with forcing of GFED4 into the model when the discrepancy in the burned area between CLM-Default and EXP-GFED4 was remarkable. Moreover, the NEE results for EXP-GFED4 and GEOS-Carb CASA-GFED had similar tendencies. For instance, we found that the net carbon in Alaska was emitted from land ecosystems to the atmosphere (i.e., positive NEE) in 2004, 2005, and 2009 in EXP-GFED4 and GEOS-Carb CASA-GFED, but it was absorbed (i.e., negative NEE) in CLM-Default. Although there was a change in NEE due to burned areas in Siberia, it was not as pronounced as that in Alaska.
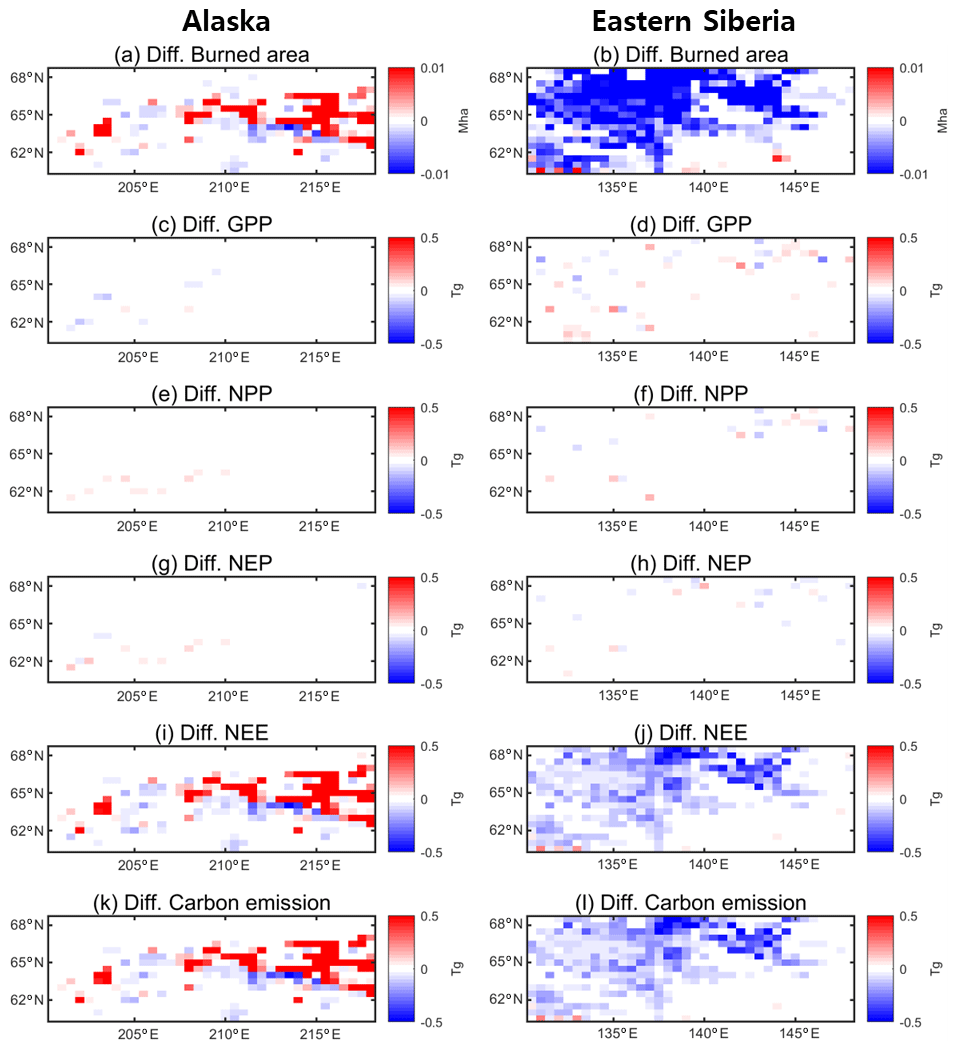
Figure 7Map of difference in the burned area (a, b) and carbon fluxes such as GPP (c, d), NPP (e, f), NEP (g, h), NEE (i, j), and carbon emission (k, l) in 2004 over Alaska (a, c, e, g, i, k) and in 2012 over Eastern Siberia (b, d, f, h, j, l). GPP: gross primary production; NPP: net primary production; NEP: net ecosystem production; NEE: net ecosystem production.
The results of the carbon fluxes at the grid level in Alaska and Eastern Siberia are investigated in Fig. 7, which shows the difference in carbon fluxes and burned areas between CLM-Default and GFED4 in Alaska for 2004 and in Eastern Siberia for 2012. As expected, the response of GPP, NPP, and NEP to fires were nonsignificant. However, fires significantly altered carbon emissions and the NEE in both regions, which can further alter the atmospheric carbon dioxide concentration and even climate. This suggests that high-latitude fires may influence the carbon sink or uptake markedly. Phillips et al. (2022) reported that boreal forest fires, which are largely distributed at high latitudes, make a significant contribution to releasing greenhouse gases. With an ESM combined with CLM5-BGC, the prediction of atmospheric carbon may become uncertain due to the limited performance of fire prediction models.
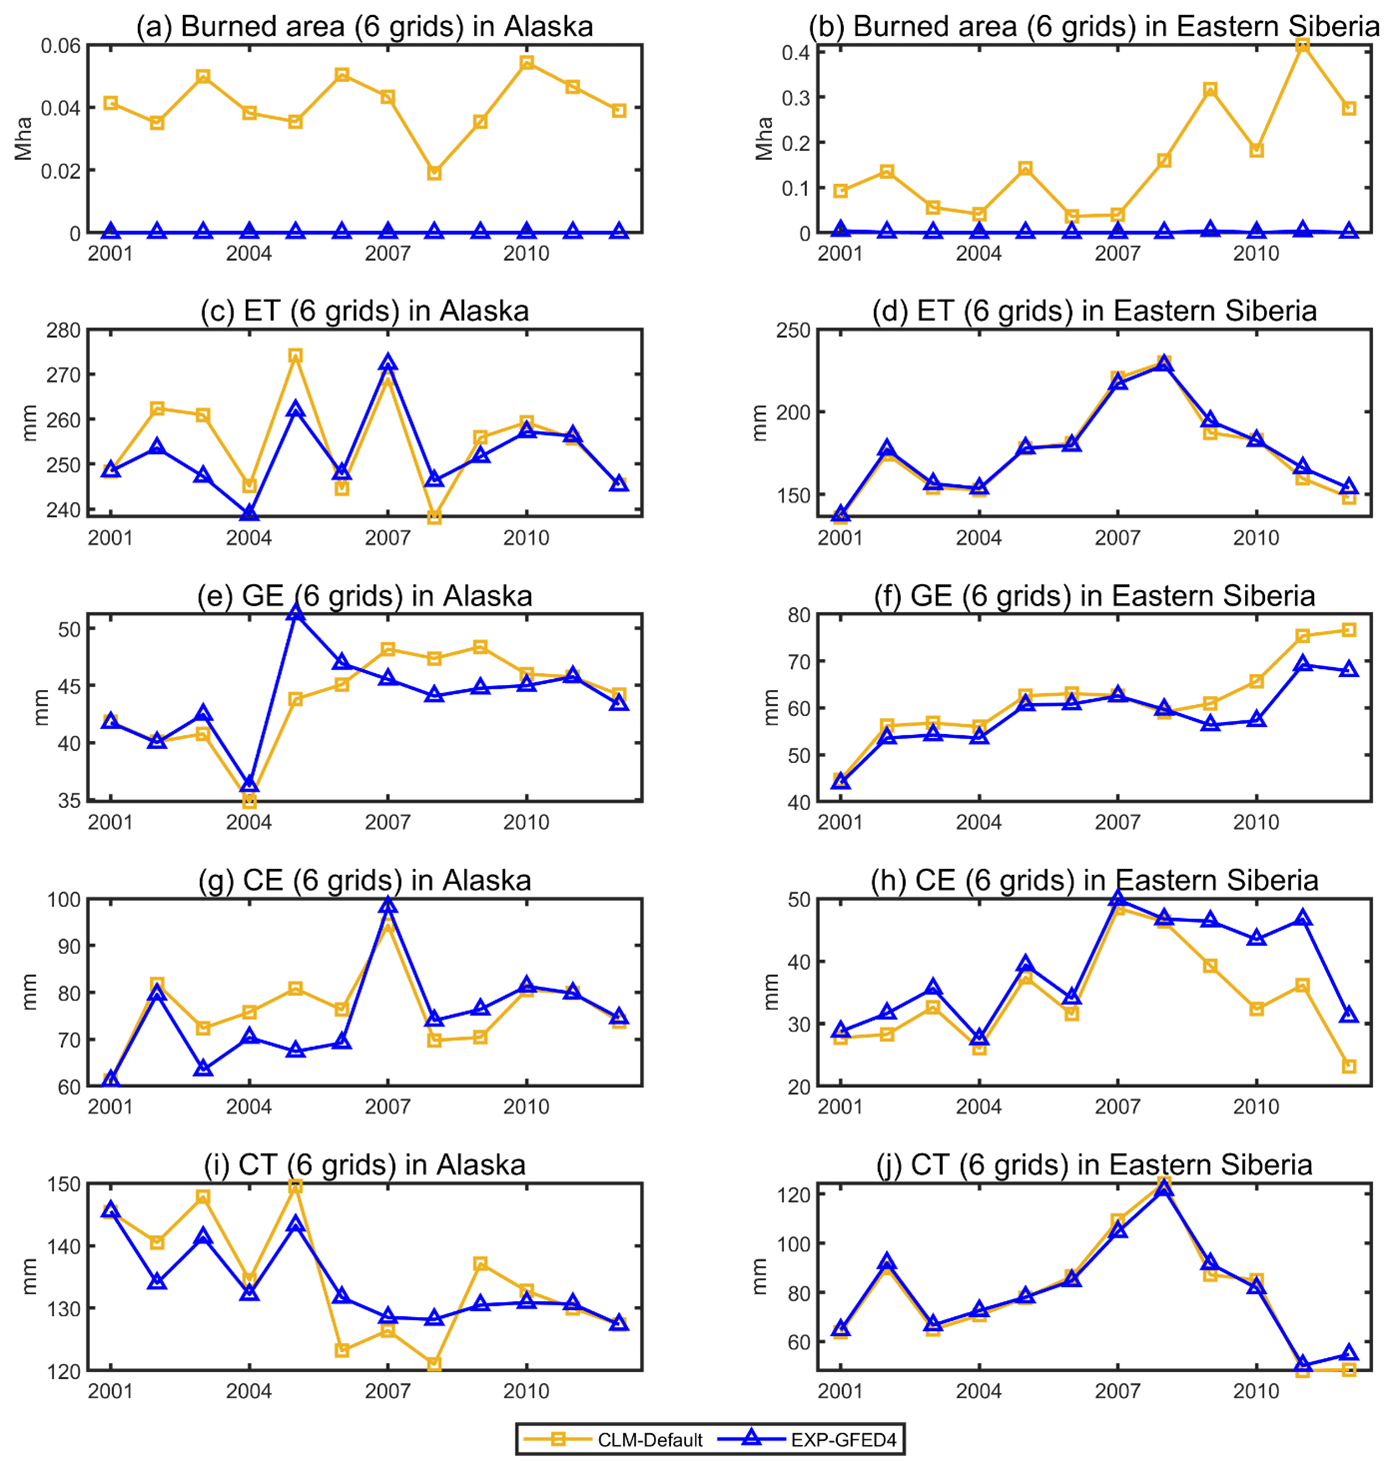
Figure 8Simulated burned area (a, b) and water fluxes of CLM-Default and EXP-GFED4 such as evapotranspiration (ET; c, d), ground evaporation (GE; e, f), canopy evaporation (CE; g, h), and canopy transpiration (CT; i, j) in five grids where the difference in burned area between CLM-Default and EXP-GFED4 is highest in Alaska (a, c, e, g, i) and Eastern Siberia (b, d, f, h, j) from 2001 to 2012. CLM-Default: default CLM5-BGC simulation; EXP-GFED4: experimental simulation with Global Fire Emissions Database (version 4).
3.3 Fire impacts on water fluxes
To investigate the fire impacts on water fluxes, we compared the results of ET and ET components, such as canopy evaporation, canopy transpiration, and ground evaporation, in six grid cells where the differences in burned area between CLM-Default and EXP-GFED4 are the largest in Alaska and Eastern Siberia (Fig. 8). Because the LAI decreases owing to wildfires, canopy evaporation and canopy transpiration decrease in the burned areas.
We observed that more rainfall reaches the ground, which would make the ground evaporation rate higher in regions with more burned areas, especially in 2004 and 2005 in Alaska. The differences in annual canopy evaporation, canopy transpiration, and ground evaporation between the two simulations were 5.41 and 13.37 mm, 2.3 and 6.26 mm, and −1.39 and −7.4 mm in 2004 and 2005, respectively. Canopy transpiration decreased by 3 %, canopy evaporation decreased by 12 %, and ground evaporation increased by 10 % in 2004 and 2005 after applying the GFED4 burned area to CLM. This is consistent with the findings of Li et al. (2017) and Seo and Kim (2019) showing that canopy evaporation and canopy transpiration decreased and ground evaporation increased when comparing the simulation with and without fire. Furthermore, the total ET in the presence of fire decreased by 6.32 and 12.08 mm in 2004 and 2005, respectively, indicating that canopy evaporation is more strongly influenced by fires over Alaska in CLM.
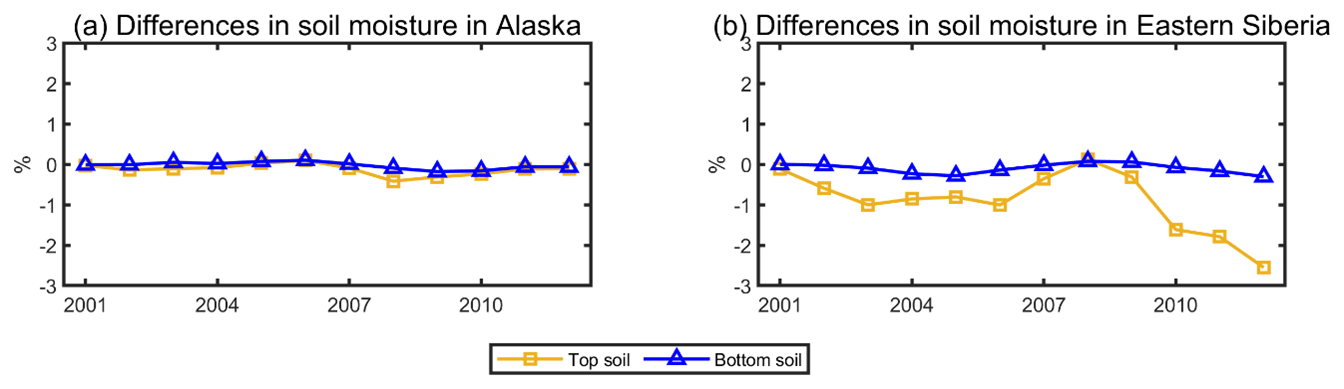
Figure 9Differences (the value of CLM-Default minus the value of EXP-GFED4) in simulated top soil (0–20 cm) moisture and bottom soil (70–150 cm) moisture in Alaska (a) and Eastern Siberia (b). CLM-Default: default CLM5-BGC simulation; EXP-GFED4: experimental simulation with Global Fire Emissions Database (version 4).
In Eastern Siberia, the patterns of canopy evaporation and ground evaporation were the same as those of Alaska. Canopy evaporation increased and ground evaporation decreased in EXP-GFED4 because the simulated burned area decreased, which was noticeable from 2009 to 2012 (Fig. 9f and h). However, the canopy transpiration of EXP-GFED4 was similar to that of CLM-Default. In other words, there was no significant change in canopy transpiration due to a change in burned area. Furthermore, the ET with the burned area applied changed slightly in Eastern Siberia. Differences in the average canopy evaporation and ground evaporation were −9.19 mm (−28 %) and 6.97 mm (10 %) from 2009 to 2012, respectively. The reasons for the smaller change in canopy transpiration are related to soil moisture and leaf area.
Figure 9 shows differences in the simulated soil moisture for CLM-Default and EXP-GFED4 at 0–20 cm (hereafter top soil) and 70–150 cm (hereafter bottom soil) in both regions. In Eastern Siberia, the top soil moisture and bottom soil moisture decreased after applying the observed burned areas. Although the leaf area increased with fewer burned areas applied, transpiration did not change significantly due to the decreased soil moisture. On the contrary, there was no considerable difference in the top and bottom soil moisture between CLM-Default and EXP-GFED4. Therefore, transpiration was positively correlated with leaf area. According to the McVicar et al. (2012) and Nemani et al. (2003), the Alaska region is drier and more water-limited than Eastern Siberia. Energy is sufficient to evaporate the increased stored water from the ground, which explains why soil moisture did not change considerably in Alaska.
The difference in burned area between the model and observation may be attributed to incorrect input data such as lightning frequency and fire management as well as a misrepresentation of fire processes. First, the limited representation of fire ignition sources and spread may create discrepancies between modeled and observed burned areas. Lightning, which is a major source of fire at high latitudes, especially in Alaska, has increased because of the warming climate (Kępski and Kubicki, 2022). Although the lightning frequency at high latitudes varied yearly, the climatology of the 3-hourly lightning frequency from 1995 to 2011 was used in CLM. Moreover, the calculated ratio of cloud-to-ground lightning has large uncertainties and may cause models to misestimate fire ignition and burned areas. Furthermore, it is inherent that the grid-based large-scale model is limited in capturing micro-environmental impacts on fire spread. Fire spread differs depending not only on the temperature, precipitation, wind speed, and direction but also on the composition of vegetation at the local scale.
In addition, wildfires are strongly affected by the weather conditions after the fire ignition. For example, wind and precipitation determine the spread and duration of fire. However, in CLM5-BGC, the fire ignition and fire spread rate are simultaneously calculated based on the weather conditions of fire ignition or pre-fire. Moreover, wildfires in ecosystems persist from hours to months, depending on ecosystem characteristics and climate conditions. However, the duration of each fire is assumed to be equal to 1 d in CLM5-BGC (Li et al., 2012). For example, Andela et al. (2019) reported that the average fire duration in a boreal forest was longer than those in other regions, and the average size of each fire in the boreal forest was larger than those in temporal forests and under deforestation. Moreover, wind speed is an important factor determining fire spread in the model. In CLM, the spread of fire increases as the wind speed increases. However, according to Lasslop et al. (2015), there is strong variation in the burned fraction with wind speed, characterized by an increase until a certain wind speed threshold is reached and a decrease thereafter. The study suggests that global fire models should avoid a strong amplification for higher wind speeds to prevent overestimation of modeled burned areas.
The management system and infrastructures for fires vary by country or region. For instance, there are four types of fire policy options in Alaska, namely critical, full, modified, and limited, according to the levels of anthropogenic effort in extinguishing the fire (Phillips et al., 2022). For example, fire suppression is the highest priority at the critical protection level because wildfire can threaten human life and inhabited property. The lowest priority for fire-related resource assignments is applied at the limited protection level. In Alaska, areas under the full, modified, and limited management options occupy 16 %, 16 %, and 67 % of Alaska, respectively. Critical-protection-level areas occupy less than 1 % of Alaska. In CLM5-BGC, however, the suppression impact is calculated based on the GDP and population, which may underestimate burned areas in the limited regions of Alaska because of the large GDP of the United States.
Moreover, inaccurate coverage of peatland can also cause a bias in burned-area calculations. Peat fire and smoldering fire have been reported over both regions for several years (Scholten et al., 2021). However, peat fire was barely simulated in CLM-BGC5 because the fractions of peatland, which were derived from three datasets (Olson et al., 2001; Tarnocai et al., 2011; Lehner and Döll, 2004), were low over both regions (Alaska: 0 %, Eastern Siberia: 2 %). On the contrary, several studies reported that there is sufficient coverage of peatland in both areas to consider the existence of peatland fires (Yu et al., 2010; Qiu et al., 2019). For instance, the coverage of peatland is 72–168 103 km2, and 16–32 Pg of carbon is stored in peatland in Alaska. Therefore, to simulate peat fires accurately, an improvement of the dataset used for peatland coverage in CLM should be considered.
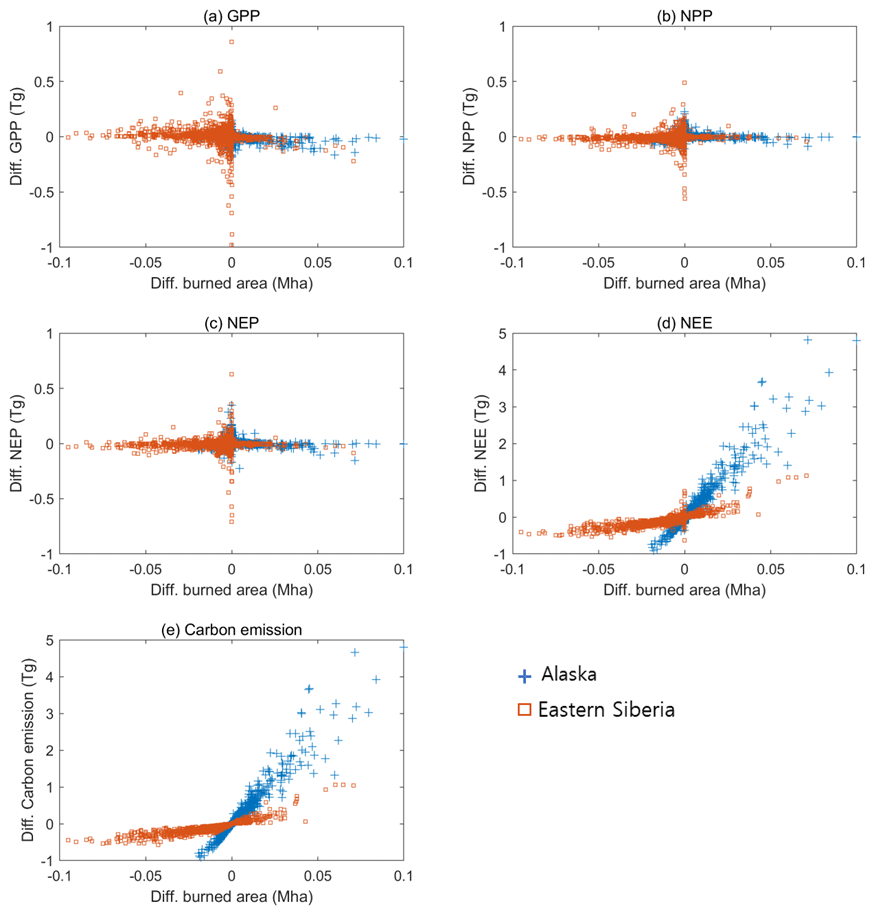
Figure 10The responses of the GPP (a), NPP (b), NEP (c), NEE (d), and carbon emission (e) to burned area at the grid level over Alaska and Eastern Siberia. GPP: gross primary production; NPP: net primary production; NEP: net ecosystem production; NEE: net ecosystem production.
Impacts on carbon fluxes were further examined. Figure 10 shows the responses of carbon flux to changes in the burned area at the grid level. The average change rates (difference in carbon fluxes / difference in burned area) of GPP, NEP, and NPP were −0.97, −0.05, and −0.32 Tg Mha−1 in Alaska and −0.55, 0.32, and 0.26 Tg Mha−1 in Eastern Siberia, respectively. The NPP was slightly positively correlated with fires because plant respiration is more sensitive compared to GPP in Eastern Siberia. In other words, if the burned area increases, both GPP and plant respiration will decrease. As plant respiration decreased more than GPP, it was simulated that NPP increases with the frequency of fires in Eastern Siberia with CLM-BGC5.
The average change rates of NEE and carbon emissions at the grid level were 49.14 and 48.81 Tg Mha−1 in Alaska and 7.71 and 7.97 Tg Mha−1 in Eastern Siberia, respectively. The response of carbon emissions to fires was much more sensitive than those of GPP, NPP, and NEP; therefore, changes in carbon emissions are a major cause of the change in the NEE, which is consistent with previous results. Carbon release owing to wildfires was more sensitive in Alaska than Eastern Siberia under CLM5-BGC, as boreal trees are more distributed in Alaska than in Eastern Siberia. Based on the above results, we suggest that more accurate fire predictions are needed to understand ecosystem carbon fluxes, especially in Alaska.
Therefore, one can tell that the carbon fluxes were more sensitive in Alaska than in Eastern Siberia. The reasons for carbon emissions being more pronounced in Alaska than in Eastern Siberia could be explained by the vegetation distribution. The average ratio of total carbon emissions to total burned areas was 49.98 Tg Mha−1 in Alaska and 9.76 Tg Mha−1 in Eastern Siberia. There was 95 Tg of leaf carbon and 8.3 Tg of live-stem carbon in Alaska and 29 Tg of leaf carbon and 2.4 Tg of live-stem carbon in Eastern Siberia in the averages of CLM-Default and EXP-GFED4. Trees have a larger LAI and larger stems and thus more fuel combustibility and availability. Therefore, the ratio of carbon emissions to burned areas was higher in forests than in grassland. Moreover, the final carbon fluxes between the atmosphere and vegetation were closely linked not only with vegetation metabolism but also with burned area and plant type. As the same fractional area burned is imposed on each PFT in a grid, the simulated carbon emission could differ from observed carbon emissions. For example, when an observation of forest fire is applied to CLM5-BGC, the fractional area burned is imposed on both grasses and trees in the same grid, causing biases in the carbon emission values. Therefore, a reasonable method of imposing grid-level burned areas on the PFT level is required.
In this study, we applied the daily burned area of GFED4 to CLM5-BGC over Alaska and Eastern Siberia. As the capacity of predicting the burned area with CLM5-BGC in high latitudes is poor, the simulated burned area was overestimated in Eastern Siberia, and it was underestimated in Alaska. Such model discrepancy could lead to the misunderstanding of terrestrial carbon and water fluxes. By comparing our experiments of CLM-Default and EXP-GFED4 in Alaska and Eastern Siberia, we identified the effects of accurate fire simulation on carbon fluxes over Alaska and Eastern Siberia. While GPP, NPP, and NEP were not significantly affected by burned area, carbon emissions changed considerably in both regions; thus, NEE was significantly influenced by the burned area. Furthermore, carbon emissions were remarkably improved after applying GFED4 to CLM5-BGC, which caused opposite trends of simulated NEE between CLM-Default and EXP-GFED4 for 2004, 2005, and 2009 in Alaska. In addition, the densities of leaf and stem carbon in Alaska were much higher than those in Siberia, indicating that carbon emissions from fire in Alaska are more sensitive than those in Siberia.
Furthermore, while analysis of burned-area impact on water fluxes showed that canopy evaporation and ground evaporation were changed consistently by fires, canopy transpiration and soil moisture were affected by the region. For example, canopy transpiration in Eastern Siberia was almost the same for CLM-Default and EXP-GFED4, because the leaf area was larger and soil moisture decreased due to reduced fires. However, the transpiration of EXP-GFED4 decreased as the leaf area was smaller, but there was no significant change in soil moisture in Alaska. This may have been because Alaska is a more water-limited region; thus, energy is sufficient to evaporate the increased stored water from the ground. Although an accurate estimation of carbon cycles is necessary to predict the future climate, we found that the fire model was limited in representing burned areas and, thus, in simulating carbon emissions and the NEE. Therefore, we suggest that innovative methods for simulating burned areas (i.e., using machine learning) should be required to better predict future carbon fluxes and climate change.
CLM5, a land part of CESM 2.0.1, is available on GitHub at https://github.com/escomp/cesm.git (git tag: release-cesm2.0.1; last access: 20 December 2022). GFED4 products are available at https://daac.ornl.gov/VEGETATION/guides/fire_emissions_v4_R1.html (last access: 20 December 2022) and https://doi.org/10.3334/ORNLDAAC/1293 (Randerson et al., 2018). The carbon emissions database from AKFED is available at https://daac.ornl.gov/CARVE/guides/AKFED_V1.html (last access: 20 December 2022) and https://doi.org/10.3334/ORNLDAAC/1282 (Veraverbeke et al., 2015b). NEE products from GEOS-Carb CASA-GFED are available at https://doi.org/10.5067/VQPRALE26L20 (Ott, 2020). The revised codes, which enable the application of GFED4 to CLM5-BGC, are achieved on Zenodo at https://doi.org/10.5281/zenodo.7483115 (Seo and Kim, 2022).
HS and YK designed the study. HS performed the model development, simulations, and result analysis under the supervision of YK. HS wrote the original manuscript, and YK reviewed and edited the manuscript.
The contact author has declared that neither of the authors has any competing interests.
Publisher's note: Copernicus Publications remains neutral with regard to jurisdictional claims in published maps and institutional affiliations.
We thank Sam Rabin and other anonymous reviewers for their feedback, which has improved the paper.
This research has been supported by the Korea Polar Research Institute (grant no. PE22900) and the Basic Science Research Program through the National Research Foundation of Korea, which was funded by the Ministry of Science, ICT and Future Planning (grant no. 2020R1A2C2007670).
This paper was edited by Sam Rabin and reviewed by two anonymous referees.
Andela, N., Morton, D. C., Giglio, L., Paugam, R., Chen, Y., Hantson, S., van der Werf, G. R., and Randerson, J. T.: The Global Fire Atlas of individual fire size, duration, speed and direction, Earth Syst. Sci. Data, 11, 529–552, https://doi.org/10.5194/essd-11-529-2019, 2019.
Arora, V. K. and Boer, G. J.: Fire as an interactive component of dynamic vegetation models, J. Geophys. Res.-Biogeo., 110, G02008, https://doi.org/10.1029/2005jg000042, 2005.
Arora, V. K. and Melton, J. R.: Reduction in global area burned and wildfire emissions since 1930s enhances carbon uptake by land, Nat. Commun., 9, https://doi.org/10.1038/s41467-018-03838-0, 2018.
Black, C., Tesfaigzi, Y., Bassein, J. A., and Miller, L. A.: Wildfire smoke exposure and human health: Significant gaps in research for a growing public health issue, Environ. Toxicol. Phar., 55, 186–195, https://doi.org/10.1016/j.etap.2017.08.022, 2017.
Bowman, D., Balch, J., Artaxo, P., Bond, W., Carlson, J., Cochrane, M., Antonio, C., Defries, R., Doyle, J., Harrison, S., Johnston, F., Keeley, J., Krawchuk, M., Kull, C., Marston, J., Moritz. M., Prentice,I., Roos, C., Scott, A., Swetnam, T., van der Werf, G., and Pyne, S.: Fire in the Earth System, Science, 324, 481–484, https://doi.org/10.1126/science.1163886, 2009.
Cascio, W. E.: Wildland fire smoke and human health, Sci. Total Environ., 624, 586–595, https://doi.org/10.1016/J.SCITOTENV.2017.12.086, 2018.
Conklin, D. R., Lenihan, J. M., Bachelet, D., Neilson, R. P., and Kim, J. B.: MCFire model technical description, Gen. Tech. Rep, Portland, OR, PNW-GTR-926, 75 pp., 2016.
Deb, P., Moradkhani, H., Abbaszadeh, P., Kiem, A. S., Engström, J., Keellings, D., and Sharma, A.: Causes of the Widespread 2019–2020 Australian Bushfire Season, Earth's Future, 8, e2020EF001671, https://doi.org/10.1029/2020EF001671, 2020.
Giglio, L., Randerson, J. T., and van der Werf, G. R.: Analysis of daily, monthly, and annual burned area using the fourth-generation global fire emissions database (GFED4), J. Geophys. Res.-Biogeo., 118, 317–328, https://doi.org/10.1002/jgrg.20042, 2013.
Haque, Md. K., Azad, Md. A. K., Hossain, Md. Y., Ahmed, T., Uddin, M., and Hossain, Md. M.: Wildfire in Australia during 2019-2020, Its Impact on Health, Biodiversity and Environment with Some Proposals for Risk Management: A Review, J. Environm. Protect., 12, 391–414, https://doi.org/10.4236/jep.2021.126024, 2021.
Holloway, J. E., Lewkowicz, A. G., Douglas, T. A., Li, X., Turetsky, M. R., Baltzer, J. L., and Jin, H.: Impact of wildfire on permafrost landscapes: A review of recent advances and future prospects, Permafrost Periglac. Process., 31, 371–382, https://doi.org/10.1002/ppp.2048, 2020.
Jiang, Y., Rocha, A. v., O'Donnell, J. A., Drysdale, J. A., Rastetter, E. B., Shaver, G. R., and Zhuang, Q.: Contrasting soil thermal responses to fire in Alaskan tundra and boreal forest, J. Geophys. Res.-Earth Surf., 120, 363–378, https://doi.org/10.1002/2014JF003180, 2015.
Jiao, Y., Lei, H. M., Yang, D. W., Huang, M. Y., Liu, D. F., and Yuan, X.: Impact of vegetation dynamics on hydrological processes in a semi-arid basin by using a land surface-hydrology coupled model, J. Hydrol., 551, 116–131, https://doi.org/10.1016/j.jhydrol.2017.05.060, 2017.
Kępski, D. and Kubicki, M.: Thunderstorm activity at high latitudes observed at manned WMO weather stations, Int. J. Climatol., 42, 7794–7816, https://doi.org/10.1002/joc.7678, 2022.
Knelman, J. E., Graham, E. B., Trahan, N. A., Schmidt, S. K., and Nemergut, D. R.: Fire severity shapes plant colonization effects on bacterial community structure, microbial biomass, and soil enzyme activity in secondary succession of a burned forest, Soil Biol. Biochem., 90, 161–168, https://doi.org/10.1016/j.soilbio.2015.08.004, 2015.
Lasslop, G., Hantson, S., and Kloster, S.: Influence of wind speed on the global variability of burned fraction: a global fire model’s perspective, Int. J. Wildland Fire, 24, 989–1000, https://doi.org/10.1071/WF15052, 2015.
Lawrence, D. M., Fisher, R. A., Koven, C. D., Oleson, K. W., Swenson, S. C., Bonan, G., Collier, N., Ghimire, B., van Kampenhout, L., Kennedy, D., Kluzek, E., Lawrence, P. J., Li, F., Li, H., Lombardozzi, D., Riley, W. J., Sacks, W. J., Shi, M., Vertenstein, M., Wieder, W. R., Xu, C., Ali, A. A., Badger, A. M., Bisht, G., van den Broeke, M., Brunke, M. A., Burns, S. P., Buzan, J., Clark, M., Craig, A., Dahlin, K., Drewniak, B., Fisher, J. B., Flanner, M., Fox, A. M., Gentine, P., Hoffman, F., Keppel-Aleks, G., Knox, R., Kumar, S., Lenaerts, J., Leung, L. R., Lipscomb, W. H., Lu, Y., Pandey, A., Pelletier, J. D., Perket, J., Randerson, J. T., Ricciuto, D. M., Sanderson, B. M., Slater, A., Subin, Z. M., Tang, J., Thomas, R. Q., Val Martin, M., and Zeng, X.: The Community Land Model Version 5: Description of New Features, Benchmarking, and Impact of Forcing Uncertainty, J. Adv. Model. Earth Sy., 11, 4245–4287, https://doi.org/10.1029/2018MS001583, 2019.
Lawrence, P. J. and Chase, T. N.: Representing a MODIS Consistent Land Surface in the Community Land Model (CLM 3.0): Part 1 Generating MODIS Consistent Land Surface Parameters, J. Geophys. Res., 112, G01023, https://doi.org/10.1029/2006JG000168, 2007.
Lehner, B. and Döll, P.: Development and validation of a global database of lakes, reservoirs and wetlands, J. Hydrol., 296, 1–22, https://doi.org/10.1016/j.jhydrol.2004.03.028, 2004.
Li, F., Zeng, X. D., and Levis, S.: A process-based fire parameterization of intermediate complexity in a Dynamic Global Vegetation Model, Biogeosciences, 9, 2761–2780, https://doi.org/10.5194/bg-9-2761-2012, 2012.
Li, F., Lawrence, D. M., and Bond-Lamberty, B.: Impact of fire on global land surface air temperature and energy budget for the 20th century due to changes within ecosystems, Environ. Res. Lett., 12, 044014, https://doi.org/10.1088/1748-9326/aa6685, 2017.
Littell, J. S., Peterson, D. L., Riley, K. L., Liu, Y., and Luce, C. H.: A review of the relationships between drought and forest fire in the United States, Glob. Change Biol., 22, 2353–2369, 2016.
Madani, N., Parazoo, N. C., Kimball, J. S., Reichle, R. H., Chatterjee, A., Watts, J. D., Saatchi, S., Liu, Z., Endsley, A., Tagesson, T., Rogers, B. M., Xu, L., Wang, J. A., Magney, T., and Miller, C. E.: The Impacts of Climate and Wildfire on Ecosystem Gross Primary Productivity in Alaska, J. Geophys. Res.-Biogeo., 126, e2020JG006078, https://doi.org/10.1029/2020JG006078, 2021.
Mangeon, S., Voulgarakis, A., Gilham, R., Harper, A., Sitch, S., and Folberth, G.: INFERNO: a fire and emissions scheme for the UK Met Office's Unified Model, Geosci. Model Dev., 9, 2685–2700, https://doi.org/10.5194/gmd-9-2685-2016, 2016.
McVicar, T. R., Roderick, M. L., Donohue, R. J., Li, L. T., Van Niel, T. G., Thomas, A., Grieser, J., Jhajharia, D., Himri, Y., Mahowald, N. M., Mescherskaya, A. V., Kruger, A. C., Rehman, S., and Dinpashoh, Y.: Global review and synthesis of trends in observed terrestrial near-surface wind speeds: Implications for evaporation, J. Hydrol., 416, 182–205, 2012.
Mętrak, M., Malawska, M., Kamiński, J., Błocka, A., and Wiłkomirski, B.: Plant secondary succession patterns after 2002 wildfire in the Biebrza National Park, Phytopedon, 7, 109–114, 2008.
Nemani, R. R., Keeling, C. D., Hashimoto, H., Jolly, W. M., Piper, S. C., Tucker, C. J., Myneni, R. B., and Running, S. W.: Climate-Driven Increases in Global Terrestrial Net Primary Production from 1982 to 1999, Science, 300, 1560–1563, https://doi.org/10.1126/science.1082750, 2003.
Netzer, Y., Yao, C., Shenker, M., Bravdo, B. A., and Schwartz, A.: Water use and the development of seasonal crop coefficients for Superior Seedless grapevines trained to an open-gable trellis system, Irrig. Sci., 27, 109–120, https://doi.org/10.1007/s00271-008-0124-1, 2009.
Olson, D. M., Dinerstein, E., Wikramanayake, E. D., Burgess, N. D., Powell, G. V. N., Underwood, E. C., D'Amico, J. A., Itoua, I., Strand, H. E., Morrison, J. C., Loucks, C. J., Allnutt, T. F., Ricketts, T. H., Kura, Y., Lamoreux, J. F., Wettengel, W. W., Hedao, P., and Kassem, K. R.: Terrestrial Ecoregions of the World: A New Map of Life on Earth, BioScience, 51, 933–938, 2001.
Ott, L.: GEOS-Carb CASA-GFED 3-hourly Ecosystem Exchange Fluxes 0.5 degree x 0.625 degree V3, Greenbelt, MD, USA, Goddard Earth Sciences Data and Information Services Center (GES DISC) [data set], https://doi.org/10.5067/VQPRALE26L20, 2020.
Park, S. W., Kim, J. S., and Kug, J. S.: The intensification of Arctic warming as a result of CO2 physiological forcing, Nat. Commun., 11, 2098, https://doi.org/10.1038/s41467-020-15924-3, 2020.
Phillips, C. A., Rogers, B. M., Elder, M., Cooperdock, S., Moubarak, M., Randerson, J. T., and Frumhoff, P. C.: Escalating carbon emissions from North American boreal forest wildfires and the climate mitigation potential of fire management, Sci. Adv., 8, eabl7161, https://doi.org/10.1126/sciadv.abl7161, 2022.
Qiu, C., Zhu, D., Ciais, P., Guenet, B., Peng, S., Krinner, G., Tootchi, A., Ducharne, A., and Hastie, A.: Modelling northern peatland area and carbon dynamics since the Holocene with the ORCHIDEE-PEAT land surface model (SVN r5488), Geosci. Model Dev., 12, 2961–2982, https://doi.org/10.5194/gmd-12-2961-2019, 2019.
Rabin, S. S., Melton, J. R., Lasslop, G., Bachelet, D., Forrest, M., Hantson, S., Kaplan, J. O., Li, F., Mangeon, S., Ward, D. S., Yue, C., Arora, V. K., Hickler, T., Kloster, S., Knorr, W., Nieradzik, L., Spessa, A., Folberth, G. A., Sheehan, T., Voulgarakis, A., Kelley, D. I., Prentice, I. C., Sitch, S., Harrison, S., and Arneth, A.: The Fire Modeling Intercomparison Project (FireMIP), phase 1: experimental and analytical protocols with detailed model descriptions, Geosci. Model Dev., 10, 1175–1197, https://doi.org/10.5194/gmd-10-1175-2017, 2017.
Rabin, S. S., Ward, D. S., Malyshev, S. L., Magi, B. I., Shevliakova, E., and Pacala, S. W.: A fire model with distinct crop, pasture, and non-agricultural burning: use of new data and a model-fitting algorithm for FINAL.1, Geosci. Model Dev., 11, 815–842, https://doi.org/10.5194/gmd-11-815-2018, 2018.
Randerson, J. T., van der Werf, G. R., Giglio, L., Collatz, G. J., and Kasibhatla, P. S.: Global Fire Emissions Database, Version 4.1 (GFEDv4), ORNL DAAC [data set], Oak Ridge, Tennessee, USA, https://doi.org/10.3334/ORNLDAAC/1293, 2018.
Reyer, C. P. O., Bathgate, S., Blennow, K., Borges, J. G., Bugmann, H., Delzon, S., Faias, S. P., Garcia-Gonzalo, J., Gardiner, B., Gonzalez-Olabarria, J. R., Gracia, C., Hernández, J. G., and Kellomäki, S.: Are forest disturbances amplifying or canceling out climate change-induced productivity changes in European forests?, Environ. Res. Lett., 12, 034027, https://doi.org/10.1088/1748-9326/aa5ef1, 2017.
Scholten, R. C., Jandt, R., Miller, E. A., Rogers, B. M., and Veraverbeke, S.: Overwintering fires in boreal forests, Nature, 593, 399–404, 2021.
Seo, H. and Kim, Y.: Interactive impacts of fire and vegetation dynamics on global carbon and water budget using Community Land Model version 4.5, Geosci. Model Dev., 12, 457–472, https://doi.org/10.5194/gmd-12-457-2019, 2019.
Seo, H. and Kim, Y.: Global Fire Emissions Database burned-area dataset into Community Land Model version 5.0 – Biogeochemistry, Zenodo [code], https://doi.org/10.5281/zenodo.7483115, 2022.
Swezy, D. M. and Agee, J. K.: Prescribed-fire effects on fine-root and tree mortality in old-growth ponderosa pine, Can. J. Forest Res., 21, 626–634, https://doi.org/10.1139/x91-086, 1991.
Tarnocai, C., Kettles, I. M., and Lacelle, B.: Peatlands of Canada, Geological Survey of Canada, Natural Resources Canada, Ottawa, Open File 6561, https://doi.org/10.4095/288786, 2011.
Thonicke, K., Spessa, A., Prentice, I. C., Harrison, S. P., Dong, L., and Carmona-Moreno, C.: The influence of vegetation, fire spread and fire behaviour on biomass burning and trace gas emissions: results from a process-based model, Biogeosciences, 7, 1991–2011, https://doi.org/10.5194/bg-7-1991-2010, 2010.
van der Werf, G. R., Randerson, J. T., Giglio, L., Collatz, G. J., Mu, M., Kasibhatla, P. S., Morton, D. C., DeFries, R. S., Jin, Y., and van Leeuwen, T. T.: Global fire emissions and the contribution of deforestation, savanna, forest, agricultural, and peat fires (1997–2009), Atmos. Chem. Phys., 10, 11707–11735, https://doi.org/10.5194/acp-10-11707-2010, 2010.
Veraverbeke, S., Rogers, B. M., and Randerson, J. T.: Daily burned area and carbon emissions from boreal fires in Alaska, Biogeosciences, 12, 3579–3601, https://doi.org/10.5194/bg-12-3579-2015, 2015a.
Veraverbeke, S., Rogers, B. M., and Randerson, J. T.: CARVE: Alaskan Fire Emissions Database (AKFED), 2001–2013, ORNL DAAC [data set], Oak Ridge, Tennessee, USA, https://doi.org/10.3334/ORNLDAAC/1282, 2015b.
Veraverbeke, S., Rogers, B. M., Goulden, M. L., Jandt, R. R., Miller, C. E., Wiggins, E. B., and Randerson, J. T.: Lightning as a major driver of recent large fire years in North American boreal forests, Nat. Clim. Change, 7, 529–534, https://doi.org/10.1038/nclimate3329, 2017.
Wang, Y., Cao, G., Wang, Y., Webb, A. A., Yu, P., and Wang, X.: Response of the daily transpiration of a larch plantation to variation in potential evaporation, leaf area index and soil moisture, Sci. Rep., 9, 4697, https://doi.org/10.1038/s41598-019-41186-1, 2019.
Wu, Z., Li, M., Wang, B., Quan, Y., and Liu, J.: Using artificial intelligence to estimate the probability of forest fires in heilongjiang, Northeast China, Remote Sens., 13, 1813, https://doi.org/10.3390/rs13091813, 2021.
Xiao, J. and Zhuang, Q.: Drought effects on large fire activity in Canadian and Alaskan forests, Environ. Res. Lett., 2, 044003, https://doi.org/10.1088/1748-9326/2/4/044003, 2007.
Yu, Z., Loisel, J., Brosseau, D. P., Beilman, D. W., and Hunt, S. J.: Global peatland dynamics since the Last Glacial Maximum, Geophys. Res. Lett., 37, L13402, https://doi.org/10.1029/2010GL043584, 2010.