the Creative Commons Attribution 4.0 License.
the Creative Commons Attribution 4.0 License.
 | 25 Jul 2023
Modeling of non-structural carbohydrate dynamics by the spatially explicit individual-based dynamic global vegetation model SEIB-DGVM (SEIB-DGVM-NSC version 1.0)
Hideki Ninomiya
Tomomichi Kato
Lea Végh
Lan Wu
Forest dynamics need to be considered when estimating the global carbon budget. The alteration of forest structure and function under a changing climate and expanding human activity could lead to a reduction of forest canopy cover and a spread of lower-biomass ecosystems in warm and dry regions. A non-structural carbohydrate (NSC) acts as a storage buffer between carbon supplied by assimilation and carbon consumed by, inter alia, respiration, reproduction, and pests. Estimation of NSC concentrations in a tree is very important for accurate projection of future forest dynamics. We developed a new NSC module for incorporation into a spatially explicit individual-based dynamic global vegetation model (SEIB-DGVM) to validate the simulated NSC dynamics with observations. NSC pools were simulated in three plant organs: leaves, trunk, and roots. The seasonal dynamics of the NSCs varied among plant species, and the sizes of the NSC pools inferred from observations differed between the boreal, temperate, and tropical climates. The NSC models were therefore validated for each of the three climatic regions at both point and global scales to assess the performance of the models. The modeled NSCs showed good agreement in seasonality with the observed NSCs at four sites – Canada (boreal), Austria and Switzerland (temperate), and Panama (tropical) – and in mean values for three climate zones derived from the global NSC dataset. The SEIB-DGVM-NSC version 1.0 is expected to enable simulation of biome shifts caused by the changes in NSC dynamics worldwide. These dynamics will contribute to changes in not only the global carbon cycle but also in forest structure and demography at a global scale.
- Article
(2006 KB) - Full-text XML
- BibTeX
- EndNote


Permanent shifts in forest vegetation dynamics have already been observed and are expected to accelerate under future changes in climate globally (McDowell et al., 2020). Forest dynamics are changing due to anthropogenic drivers, such as rising temperatures and CO2 partial pressures, and are affected by transient disturbances such as wildfires, droughts, biotic attacks, and land-use changes. The dependence of tree recruitment and growth on anthropogenic drivers and transient disturbances could lead to an increase in tree mortality rates in warm and dry regions (Stevens-Rumann et al., 2018; Xu et al., 2017). These changes will cause forests to become shorter and younger. The result will be a net reduction of forest canopy cover and a shift toward low-biomass ecosystems. Furthermore, higher tree mortality will have a negative impact on the global ecosystem: lower biological diversity and altered hydrological and carbon cycles (Adams et al., 2013). Understanding the drivers of vegetation dynamics requires accurately simulating the effect of climate change on global terrestrial biogeochemistry.
To increase their chance of survival, trees control their carbon resources and strategically allocate them to growth, respiration, storage, reproduction, and defense (Hoch et al., 2003; Hartmann et al., 2018). When the atmospheric partial pressure of CO2 increases, trees can allocate surplus carbon to either growth or carbon storage (Hoch et al., 2003; Huang et al., 2020). Changes in tree carbon allocation patterns have been shown to exert large effects on constituents of the terrestrial carbon cycle (Klein and Hoch, 2015). Clarification of the importance of carbon allocation has revealed that non-structural carbohydrates (NSCs) draw much from the other carbon resources because they are the most significant carbon compounds involved in the life processes of trees (He et al., 2020).
The NSC is comprised of starch and sugars, which are mobilized mainly for growth and metabolism when sink strength exceeds source activity (Gough et al., 2010; Richardson et al., 2013; Chuste et al., 2020; Herrera-Ramírez et al., 2020). During photosynthesis, freshly assimilated carbon is transported as triose phosphate from the chloroplast to the cytosol, where sucrose is synthesized from it. Some of the sucrose is then changed into starch in the chloroplast, and the starch is consumed to maintain growth and metabolism at times when recently assimilated carbon is not available to the plants (Dietze et al., 2014). Plants that seasonally shed leaves need to rely on stored carbon for maintenance during the leafless season. NSCs play an important role as substrates for the synthesis of compounds in plants and as energy sources for metabolic activities (Hartmann et al., 2018). Moreover, NSCs include key compounds that are used to buffer physiological stress when energy from photosynthesis does not satisfy metabolic demands (Gough et al., 2010; Sala et al., 2012) because carbohydrates such as starch can be easily mobilized and reallocated (Hartmann et al., 2018).
In long-lived plants, the ability to store carbon is a key to survival at times when photosynthetic rates are low because of shade, drought, and disturbance (Martínez-Vilalta et al., 2016). As a result, the amount of NSC storage or remobilization depends on the balance between the supply and demand of assimilated carbon and accounts for a large fraction of the annual carbon budget of plants (Richardson et al., 2013). When carbon allocation patterns favor storage over growth, tree growth is limited (Wang et al., 2021). Hence, the dynamics of stored carbon pools can be considered an indicator of the carbon balance of the plant.
The decline of stomatal conductance during a drought reduces photosynthetic carbon assimilation and thus decreases the amount of NSC (McDowell et al., 2008; Adams et al., 2017). Although an imbalance of the NSC pool could mechanistically trigger plant mortality, few ecological models predict tree mortality resulting from the role of NSC associated with climate change (Adams et al., 2013; McDowell, 2011). Simulations of the NSC dynamics of plants will elucidate the effects of different drivers on forested ecosystems (Gough et al., 2010).
Because the frequency, duration, and severity of droughts are expected to increase globally, the damage to plants through rising temperatures, water vapor pressure deficit, and associated water loss will also increase (IPCC, 2014; Sevanto and Dickman, 2015). Trees can be killed directly by drought, i.e., vial desiccation, or indirectly by associated increases in insect or pathogen attacks. Indirect effects that cause tree mortality include girdling by bark beetles and defoliation events. The frequency and severity of this indirect biotic disturbance from insects and insect–pathogen complexes have been increasing (McDowell et al., 2020; Seidl et al., 2017). According to multiple observational and experimental studies, the resulting imbalance between NSC demand and supply leads to carbon starvation, which is one of the mechanisms that contribute to drought-induced mortality (McDowell, 2011).
Dynamic global vegetation models (DGVMs) are often used to represent vegetation dynamics as well as biogeochemical cycles and to simulate the transition of the vegetation structure in response to climatic changes via modeling of competition and disturbance (Hickler et al., 2004; Krinner et al., 2005; Braakhekke et al., 2019). In DGVMs, plant species are classified into plant functional types (PFTs) based on their eco-physiological traits. However, most DGVMs oversimplify individual plant competition by using average values of traits for each PFT (Smith et al., 2001). Most of such models miss the effects of local competition for light, which must be considered when modeling gap population dynamics among individual trees (Sato et al., 2007).
In contrast, the spatially explicit individual-based dynamic global vegetation model (SEIB-DGVM; Sato et al., 2007) can simulate the growth of individual trees on numerous replicate patches and enable observation of how single, large trees can influence nearby trees. Plants in different patches do not interact with each other in terms of physical resources such as light and water. In each patch, the growth and mortality of each tree as well as competitive interactions between individual trees are calculated based on environmental conditions. Transient changes in vegetation distribution and dynamics can therefore be examined (Sato et al., 2007). Because the amount of stored NSC depends on the size of individual trees and because the SEIB-DGVM can simulate individual trees, we chose the SEIB-DGVM to estimate the NSC dynamics of plants.
The SEIB-DGVM has been used to simulate a transient change in the distribution and function of vegetation on the African continent in conjunction with the ranges of dispersal of trees and to address factors that had a strong impact on the transient change (Sato and Ise, 2012). Use of the SEIB-DGVM has enabled reconstruction of the geographical distributions of plant productivity and thermo-hydrology based on observations in eastern Siberia and partial representation of the effect of topography on the abundance of trees in larch forests (Sato et al., 2020). The SEIB-DGVM was coupled with an earth system model (MIROC-ESM; Watanabe et al., 2011).
However, the original SEIB-DGVM lacks the ability to compute NSC levels in trees, which means it cannot simulate the plant death caused by an imbalance in the NSC pool, as well as indirect impacts like insect infestations and defoliation. This also hinders the ability to investigate the effects of various drivers on forest ecosystems, such as the intensification of drought, and limits the development of the MIROC-ESM for simulating the global carbon cycle.
The objectives of the research were to (1) incorporate a module to simulate NSC dynamics in the SEIB-DGVM and (2) validate the simulated NSC dynamics with observational data at both point and global scales. We therefore created a new function in the SEIB-DGVM to represent the NSC dynamics of individual trees. How NSC is produced, stored, and distributed among different plant organs under environmental stress is poorly understood (Jones et al., 2020; Rademacher et al., 2021; Wang et al., 2021). Our enhanced model improves the physiological simulation of the leaf life cycle and enhances understanding of how NSC affects the distribution of vegetation, gross primary production (GPP), and net primary production (NPP) as well as tree dynamics (age, height, and trunk diameter) at global scales in the future. By adjusting the NSC accumulation rates of individual trees and the threshold of NSC-induced mortality during drought, the model can simulate the timing, location, and percentage of trees that die in response to moderate drought. Furthermore, the model can increase our understanding of the role of NSCs.
2.1 Spatially explicit individual-based dynamic global vegetation model (SEIB-DGVM)
The SEIB-DGVM (v3.02; http://seib-dgvm.com/data/seib_code302.zip, last access: 1 April 2020; Sato et al., 2016) is a carbon budget model that simulates the establishment of individual trees, competition between trees, and the death of individual trees according to input climate data. The default settings follow the structure of a three-dimensional virtual forest on a 30 m × 30 m stand of trees with 1 m × 1 m simulation grid cells. In each grid cell, a tree belonging to 1 of 14 woody plant functional types (PFTs) is assigned depending on conditions, in addition to 1 of 2 grass PFTs. All physical and physiological processes are calculated at daily time steps, trunk growth is estimated monthly, and vegetation dynamics and disturbance such as wildfire and heat stress are assessed annually. Because of the lack of field observations at the time the model was developed, there is no mechanism to control the NSC in leaves and roots in the original SEIB-DGVM, and only the NSC in trunks is simulated after adjusting the available organic matter for reproduction and respiration. The original SEIB-DGVM therefore cannot represent NSC-induced effects on forest ecosystems realistically without accounting for the NSC in leaves and roots.
2.2 NSC components
2.2.1 NSC pool
The new NSC pools are separated into three organs of an individual tree: leaves, trunk, and roots. In the original SEIB-DGVM, the NSC in trunks is supplemented to 250 g dry matter (DM) from the litter after seed establishment and is based on the existing leaf biomass after the first 30 d of the growing season. It is used for foliation after the dormant phase and metabolic processes such as the synthesis of a storage organ and remobilization of the nutrients within it. In the new model, the carbon newly assimilated via photosynthesis goes into three NSC pools. The NSC pools can be later mobilized for growth and respiration as follows (Fig. 1).
when NSC < NSCtrunk,max(t), NSC < NSCleaf,max(t), and NSC < NSCroot,max(t),
when NSC < NSCtrunk,max(t), NSC < NSCleaf,max(t), and NSC > NSCroot,max(t),
when NSC < NSCtrunk,max(t), NSC > NSCleaf,max(t), and NSC < NSCroot,max(t),
when NSC < NSCtrunk,max(t), NSC > NSCleaf,max(t), and NSC > NSCroot,max(t),
when NSC > NSCt,max(t), NSC < NSCleaf,max(t), and NSC < NSCroot,max(t),
when NSC > NSCt,max(t), NSC < NSCleaf,max(t), and NSC > NSCroot,max(t),
when NSC > NSCt,max(t), NSC > NSCleaf,max(t), and NSC < NSCroot,max(t),
when NSC > NSCt,max(t), NSC > NSCleaf,max(t), and NSC > NSCroot,max(t),
where t is the calculation day, t−1 is the previous day, NSCorgan is the amount of NSC in each organ, and NSCorgan,max(t) is the maximum amount of NSC in each organ on day t.
The NSC pools of the organs displays unique seasonality for each climatic zone. The NSC seasonality of each organ varies among tree species mainly because the climate and surrounding environment influence the capacity and utilization of NSCs in plants. To take into consideration the fact that field observations of NSC covered whole seasons and that various plant species were scarce, we classify NSC seasonality into three types: tropical, temperate, and boreal. Observations from temperate forests showed that the NSC seasonal cycles were similar among the organs and peaked around late spring–summer, although NSCorgan differed in size (Hoch et al., 2003; Richardson et al., 2013; Woodruff and Meinzer, 2011; Gruber et al., 2012). In contrast, the NSC concentrations in the leaves of boreal trees peak in June (Sveinbjörnsson et al., 2010), and NSCs in the fine roots increase until summer and then decline toward mid-summer and fall because of the initiation of root growth (Landhäusser and Lieffers, 2003). All 14 woody PFTs of the SEIB-DGVM are sorted into one of three NSC types, and carbon assimilated via photosynthesis was allocated to the NSC pool of each organ in temperate and boreal PFTs as follows.
where the organ is either a leaf, trunk, or root; a is the minimum value; and b is the seasonality parameter.
Tropical species have a different NSC seasonality from temperate and boreal species. The NSC of leaves display a concave upward seasonal pattern that reaches its minimum in late spring–early summer (Würth et al., 2005), which is a dry season when leaf production and flowering deplete NSC pools. Singh and Srivastava (1986) have observed that the NSC of roots is at a minimum level from July to September because the NSC pool is drained to enable survival of the rainy season during that period. The amount of NSCs then increases toward winter, when the fine-root biomass declines. Hence, Eq. (10), which is used for temperate and boreal forests, is inadequate for simulation of tropical forests because the NSC depends less on the seasonality of photosynthesis in the tropics. The size of the NSC pool of tropical species therefore accumulates as follows.
where the organ is either the leaf, trunk, or root; a is the minimum value; and b is the seasonality parameter.
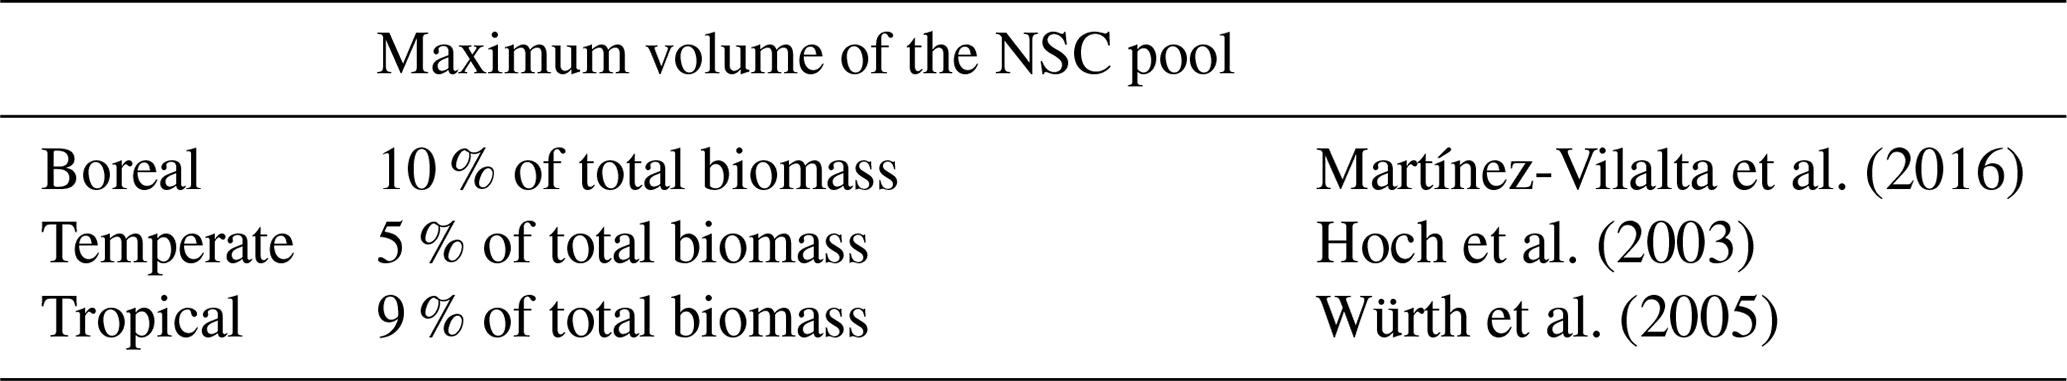
First, the surplus carbon that remains after respiration is assigned to NSCtrunk using Eq. (1). Once NSCtrunk has reached its maximum capacity, the rest of the assimilated carbon moves primarily into NSCleaf and secondarily into NSCroot. Finally, any remaining carbon is allocated to the growth of leaves, the trunk, and roots. The sum of the NSCs in the leaves, trunk, and roots (the total NSC) is maximized in relation to total biomass for each climate region (Table 1). In cases where the total NSC exceeds this upper limit, the surplus is directly consumed for the growth of each organ.
2.2.2 NSC expenditure
Respiration
Normally, photosynthetically assimilated carbon is used for maintenance respiration without entering the NSC pool. When the assimilated carbon is insufficient for maintenance respiration, the NSC compensates for the shortage. The NSC loss is allocated to each organ as follows.
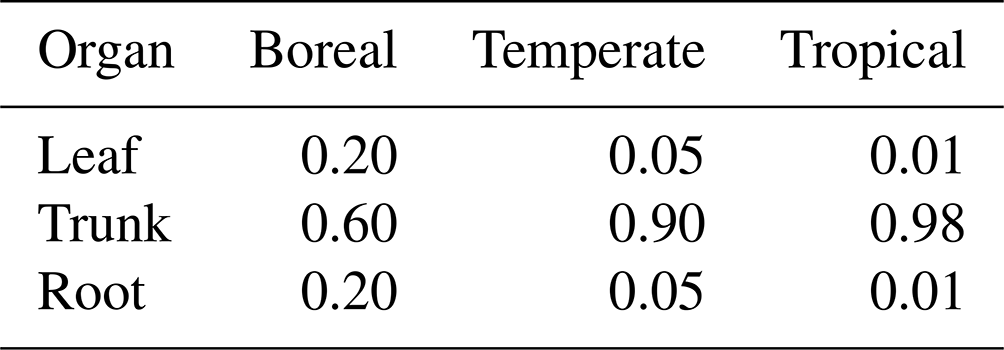
where autotrophic respiration (Ra) is the difference between assimilated carbon and maintenance respiration and c is the allocation factor for NSC utilization (). If the total NSC equals the carbon shortfall, the NSC of all organs becomes zero. If an NSCorgan is insufficient to provide the allocated share of Ra, the other organs will supply the difference: NSCleaf is supplemented first by NSCtrunk, and if that is not enough, it is supplemented by NSCroot. Similarly, if any of the other NSCorgan pools is unable to cover local shortages, the NSC pools of the remaining organs will balance the supply and demand. When the total NSC is not enough to pay for the charges, a 1 % reduction in the biomass of all of the living organs occurs. The removed biomass of sapwood is transformed into heartwood, while the removed biomass of other organs is placed into the litter pool. The allocation factors of NSC utilization depend on the climatic region (Table 2) and have been adjusted to prevent the allocated share of Ra from hindering an increase in NSCorgan during spin-up simulations.
Phenology
In SEIB-DGVM, every deciduous PFT has two phenology phases: a growth phase and a dormant phase. The NSCs are consumed for foliation after the dormant phase. The NSC is allocated at the rates shown in Table 2.
Turnover
Part of the NSC pools of leaves and roots is transformed into litter at the same fractional rates as in the turnover of general carbon pools for leaves and roots. This turnover is calculated at daily steps, regardless of the phenology phase.
Establishment
The establishment process is performed on the last day of each simulation year in the SEIB-DGVM. The characteristics of the PFT are determined by five bioclimatic parameters: (1) the maximum temperature in the coldest month, (2) the maximum growing-degree day, (3) the minimum growing-degree day, (4) the minimum photosynthetically active radiation, and (5) the duration of drought. All new trees, independent of their PFT, start with a sapwood diameter of 0.01 m and heartwood diameter of 0.00 m. Initially, these new trees have no leaves or fine roots. Their carbon cycle is therefore maintained by initial values of 250 g DM of assimilated carbon and 250 g DM of NSC (NSCleaf=10 g, NSCtrunk=190 g, and NSCroot=50 g) from the litter pool.
2.3 Validation of NSC for point and global simulations
Observational NSC data for model validation were derived from Martínez-Vilalta et al. (2016), who reviewed 296 papers and summarized NSC dynamics in forests. Their data include total NSCs in leaves, trunks, and roots of mature terrestrial plants from observations over at least 4 months. The new model was first validated at the point scale. After confirming that the model can accurately simulate at the point scale, it was then validated at the global scale. These data were used for both point-scale and global-scale model validations. For the point-scale simulation, several field sites were selected, the NSC data of which were available for all organ. At each site, the seasonality of the NSC was measured for at least 4 months. The modeled outputs were then compared to the observed data, which were calculated using local climate data on a grid that corresponds to the field site. For the global-scale simulation, global mean NSC values were derived by using all observed data from the relevant climate zones. The modeled outputs calculated using 0.5∘ × 0.5∘ gridded climate data were then compared to these values.
2.3.1 Validation at a point scale
Site descriptions
Four countries were used to validate the simulated NSC content in the plant organs: boreal (Canada), temperate (Austria and Switzerland), and tropical (Panama). We used local climate data from meteorological stations gap-filled by corrected gridded climate reanalysis data as the input at these sites. We ran the NSC module including the SEIB-DGVM with the location and climate provided and compared the model output with the observation data.
The boreal site is located near Alder Flats, Alberta, Canada (52∘58′ N, 114∘59′ W) in 2000. The site was dominated by boreal winter deciduous plants such as Populus tremuloides (Landhäusser and Lieffers, 2003). One of the temperate sites is located in the timberline ecotone at Mt. Patscherkofel to the south of Innsbruck, Austria (47∘13′ N, 11∘27′ E) in 2008 (Gruber et al., 2011). Temperate conifer species such as Pinus cembra were the dominating tree species. The other temperate site is at Mont Noble, Canton Valais, Swiss Central Alps (46∘12′ N, 7∘30′ E) and was dominated by temperate conifers (P. cembra L.; Hoch et al., 2003) in 2000. The tropical site is located at the Parque Natural Metropolitano near Panama City, the Republic of Panama in 1996 (85∘8′ N, 79∘34′ W; Würth et al., 2005). The site has mixed cover with 17 dominant species, including Cecropia longipes and Anacardium excelsum.
Input climate data
The SEIB-DGVM requires 10 climatic variables as environmental drivers: air temperature, soil temperature at a depth of 50 cm (soil layer 1), soil temperature at a depth of 100 cm (soil layer 2), soil temperature at a depth of 150 cm (soil layer 3), precipitation, shortwave radiation, longwave radiation, wind velocity, specific humidity, and diurnal range of air temperature. The input climate data were prepared by harmonizing a global reanalysis gridded climate dataset, the WATCH Forcing Data ERA-Interim (WFDEI, 0.5 × 0.5∘, 1979–2016, Weedon et al., 2018), and the climate generated by the SEIB generator (Tei et al., 2017), which is the monthly observation-based climatic datasets produced by Climatic Research Unit (CRU TS4.00, 0.5 × 0.5∘, 1901–2015, Harris et al., 2014) supplemented with the National Centers for Environmental Prediction/National Center for Atmospheric Research (NCEP/NCAR) daily climate datasets (Kalnay et al., 1996) for 1950, with local climatology recorded at meteorological stations near the sites. Local climatology in Panama is measured at the Parque Natural Metropolitano Canopy Crane meteorological station (1995–2019). The climatology in Austria (1979–2008) and Switzerland (1979–2000) was derived from the closest meteorological station to the field site under the European Climate Assessment (Klein Tank et al., 2002, https://www.ecad.eu, last access: 19 November 2020). WFDEI data were used for the climatology in Canada, except for precipitation data, which are measured in the Meteorological Service of Canada (1979–1984, https://climate.weather.gc.ca/historical_data/search_historic_data_e.html, last access: 1 December 2020).
The reanalysis of daily WFDEI and SEIB climate data included daily records, which were corrected by regression models to local climate data. For temperature, humidity, and shortwave radiation values, local climatology were used directly and the daily WFDEI data were supplemented by simple linear regression. Precipitation data and wind speeds were first adjusted to monthly and then annual averages and then scaled as a correction. WFDEI precipitation data were scaled after adjusting to the annual climatological precipitation of 995 mm in 2008 for Austria and 630 mm in 2000 for Switzerland. Longwave radiation was calculated using harmonized temperatures and humidities above (Brutsaert, 1975). Missing values were estimated via linear interpolation. Because soil temperature data were unavailable for local sites and for WFDEI, soil layer temperatures were calculated using the SEIB generator by regressing soil layer 1 on atmospheric temperature, soil layer 2 on layer 1, and layer 3 on layer 2. In Austria, humidity data were available from 2005. The WFDEI data were therefore used to estimate missing data via linear interpolation. In Canada, no observational data were available, except for temperature and precipitation. Precipitation in Canada was scaled with WFDEI data after adjusting to the total climatological precipitation for 1979–1984, shortwave radiation was taken from the WFDEI, and humidity data were harmonized in the same way as the humidity data in Austria.
Simulation scheme
To reach equilibrium conditions of the biomes, plant, and soil carbon pools, a 1000-year spin-up simulation was performed by looping the climate data and atmospheric CO2 concentrations between 1979–2000. Building on the final conditions of the spin-up simulations, continuous simulations corresponding to 1979–2001 in Canada, 1979–2008 in Austria, 1979–2000 in Switzerland, and 1979–1995 in Panama were carried out, and the NSC dynamics were compared with field data.
2.3.2 Validation at a global scale
In the global-scale simulation, the NSC seasonality in the SEIB-DGVM was validated using CRU/NCEP/MIROC integrated data (0.5 × 0.5∘, 1850–2100, Tei et al., 2017; Watanabe et al., 2011) as climatic input. The SEIB-DGVM-NSC version 1.0 is expected to simulate on future scenarios; thus, the different climate data that cover longer period than that of section “Input climate data”. are used for validation at a global scale. The SEIB-DGVM categorizes plant species into 16 PFTs for global-scale simulations.
The outputs of the SEIB-DGVM include two boreal biome types (evergreen and deciduous forests), three temperate biome types (conifer, broad-leaved evergreen, and deciduous forests), and two tropical biome types (evergreen and deciduous forests), whereas the observations included two boreal biome types (conifer and deciduous forests), three temperate biome types (conifer, evergreen, and deciduous forests), and two tropical biome types (evergreen and deciduous forests). The model outputs and observation data were compared for each climate zone. Global climate data were available from 1850 to 2005. The first 30 years (1850–1880) were therefore looped for a 1000-year spin-up simulation. After the spin-up, simulations were run for the period 1850–2005. The NSC dynamics from the period 1975–2005 were used for model validation.
2.4 Parameterization of NSC functions
Hoch et al. (2003) have reported that NSCleaf of temperate trees sampled near the village of Hofstetten in Switzerland varies between 7 %–20 % of the total leaf DM. They determined the seasonal mean of NSCtrunk in sapwood of temperate deciduous trees and temperate evergreen trees to be 4.7 % ± 0.1 % of DM and 1.8 % ± 0.1 % of DM, respectively. There were no significant seasonal differences. The mean NSCroot was less than 1.5 % of the root DM for forests in Austria throughout the whole season (Gruber et al., 2012), and the total NSC of temperate trees was around 4 %–5 % of the DM during the growing season (Gruber et al., 2011). For tropical trees collected in Parque Natural Metropolitano in Panama, NSCtrunk and NSCroot were 8 %–10 % of their biomass, whereas NSCleaf fluctuated within 5 %–9 % of leaf biomass (Würth et al., 2005). Landhäusser and Lieffers (2003) have reported that NSCroot of boreal trees in Canada, which is used to support leaf flush and root growth, is 3 %–4 % of their root mass. The stemwood NSCtrunk concentration is ∼ 18 mg g−1 of the DM for forest samples collected in the northeastern US (Carbone et al., 2013). Because of limited observational data, the parameters of the NSC processes were derived mostly from the values observed at each site used for point-scale validation, and the maximums of simulated NSCs were corrected so that they were in the range of measured NSCs.
First, the parameter a in Eq. (10) controls the base amount of photosynthetically fixed carbon mobilized for the NSC pools. The parameter b in Eq. (10) controls the seasonal fluctuations of the NSCs from the parameter a. In temperate zones, the value of b differs before and after July so that NSC peaks around mid-summer. In contrast, in tropical zones, the amount of NSC in leaves and trunks decreases throughout the spring–summer.
The same parameters a and b were basically used for global-scale validation as for point-scale validation. However, because the NSCs are influenced by environmental conditions at the field sites, the observed global mean values used for global-scale validation were different from the values used for setting parameters for point-scale validation. Therefore, some adjustments were made to certain parameters to align with the values used in the global-scale validation. Tables 3 and 4 show the parameters used for validation. Parameter values unrelated to the NSC module remain at the default values of the SEIB-DGVM (Sato et al., 2007).
Table 3Parameters of the NSC pool size function for point-scale simulation.
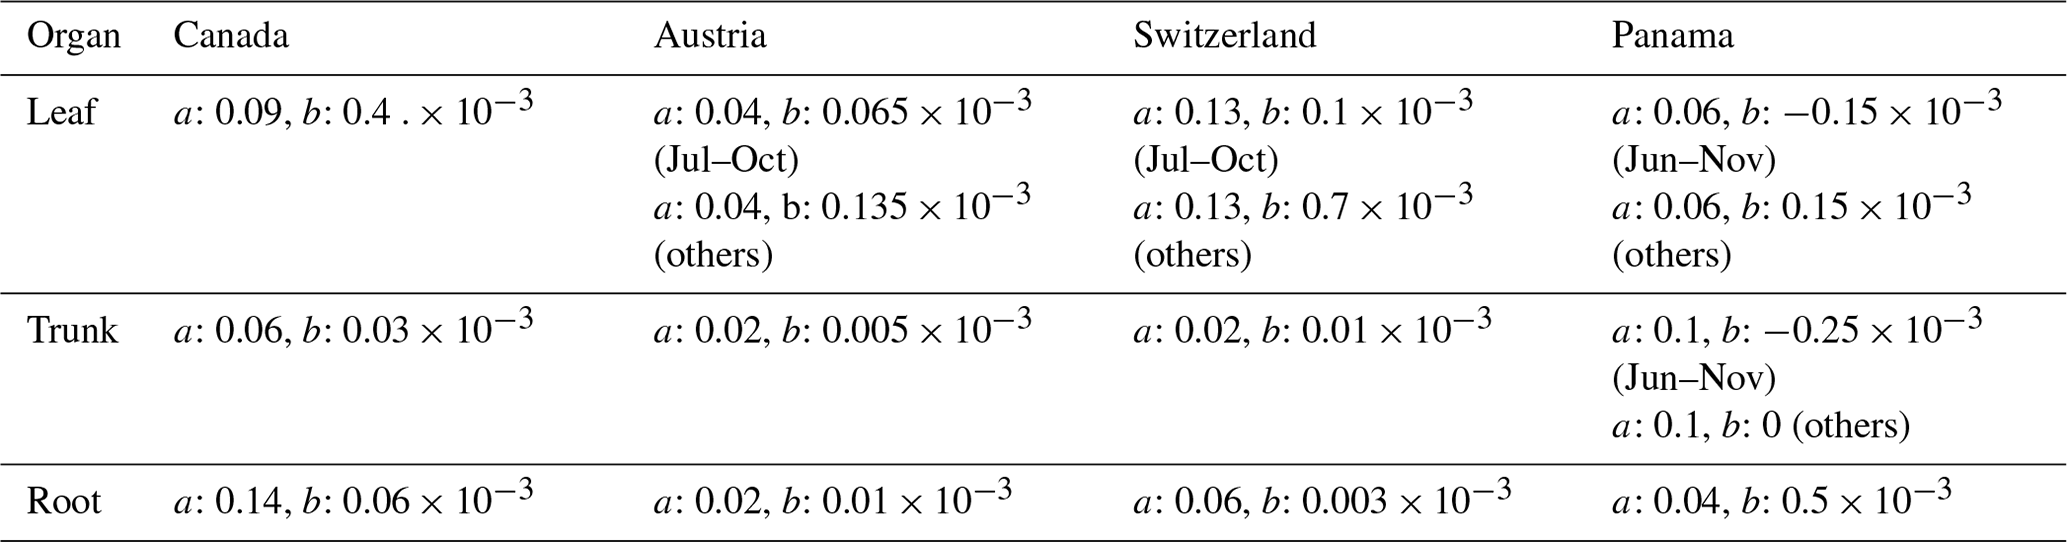
Table 4Parameters of the NSC pool size functions for global-scale simulation.
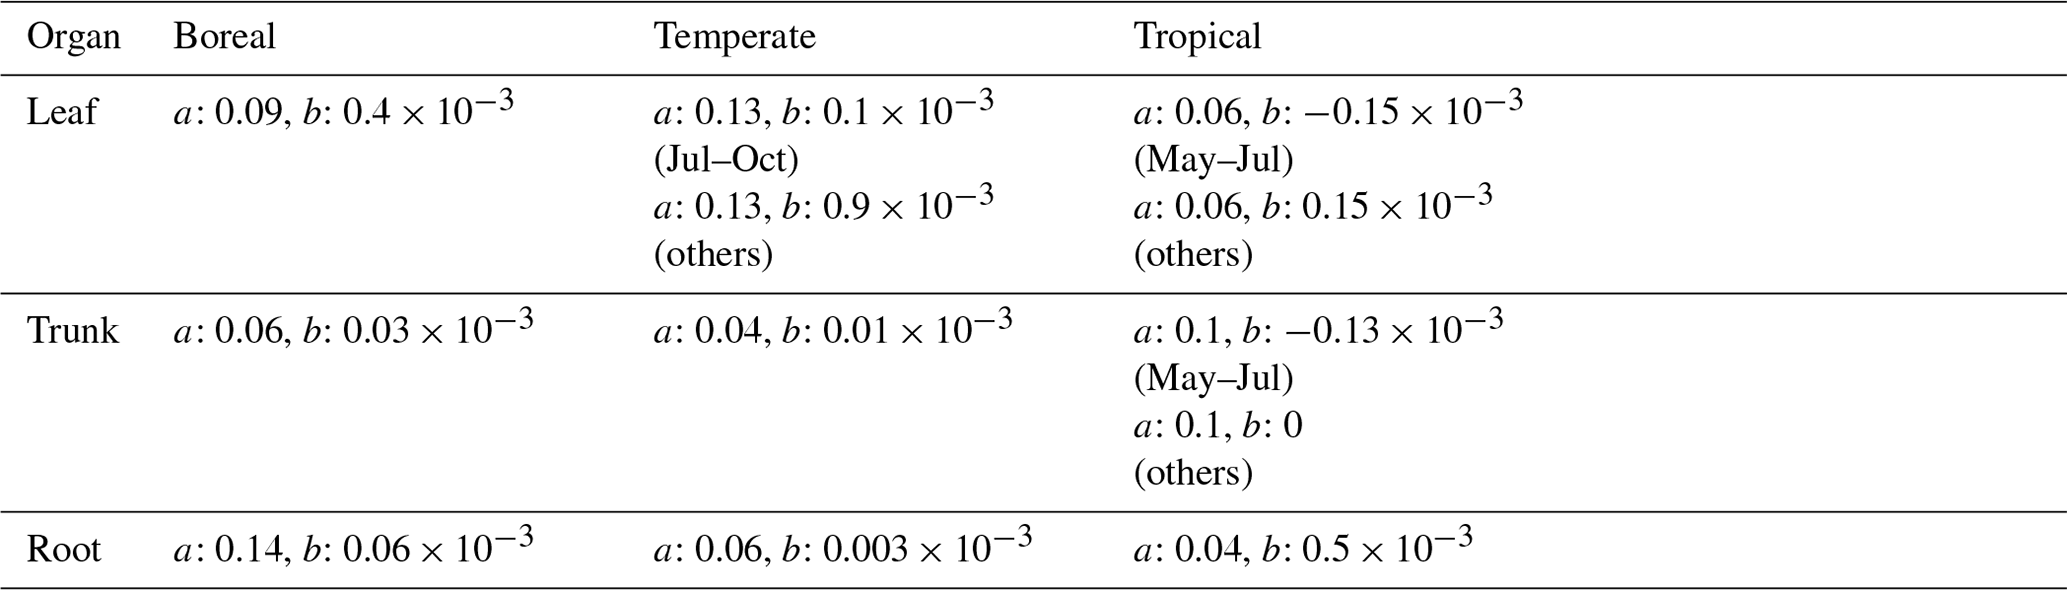
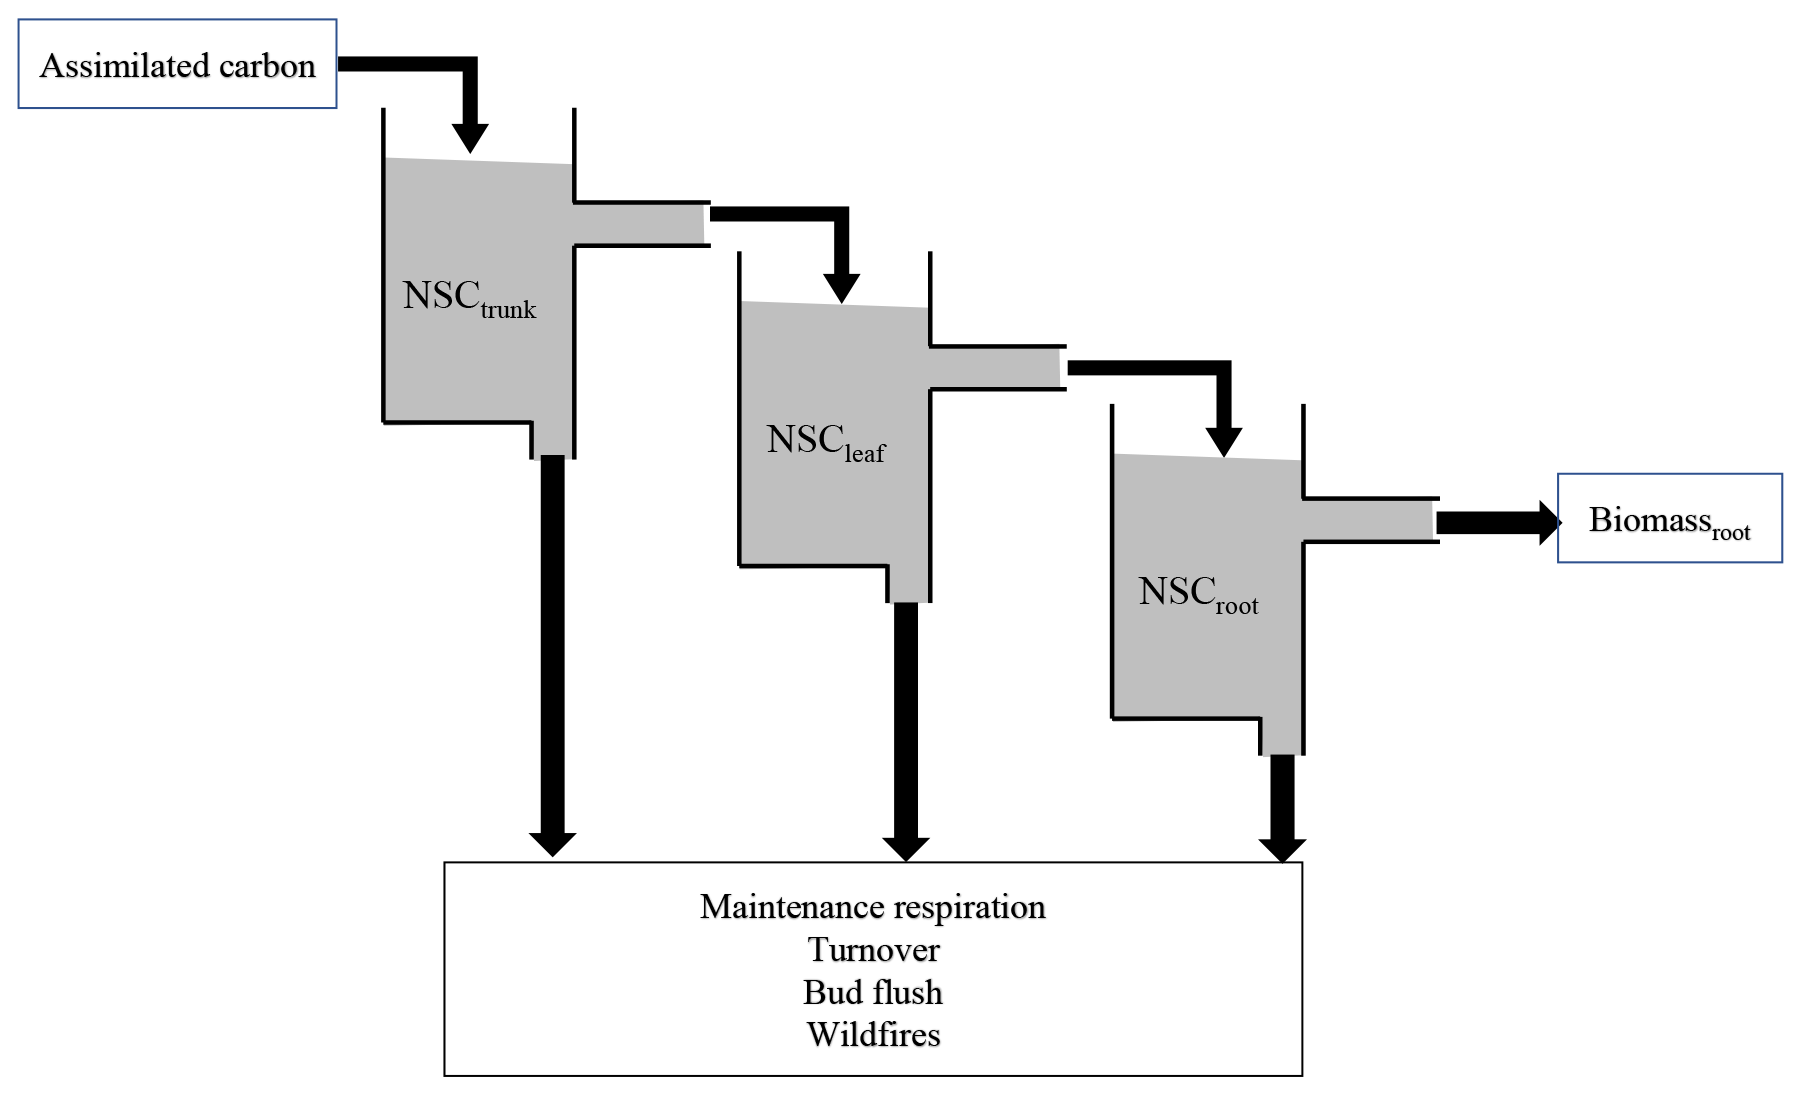
Figure 1Schematic model structure of the NSC pool. The assimilated carbon satisfies NSCtrunk, and then the excess assimilated carbon satisfies the next NSCleaf and NSCroot. The accumulated carbon in the NSC pool is used to compensate for the shortage of maintenance respiration and help with bud flush, and it is sometimes lost due to turnover. When the biomass of plants is lost due to wildfires, the NSC also decreases.
3.1 Seasonality of NSC at the point scale
3.1.1 Boreal
In Canada, the fact that the dominant PFT in the simulations was boreal deciduous trees was consistent with observations at the site. The model simulated an increase in the NSC of leaves from 80 to 203 mg g−1, whereas the observed NSC values were 89 mg g−1 in May and 185 mg g−1 in August (Fig. 2a). The modeled NSCs in leaves therefore captured the increasing trend during the growing season, but the simulations overestimated the maximum NSC a little. The observed NSCs in trunks fluctuated from 90 to 192 mg g−1 during a year with no specific seasonal trend (Fig. 2e). The model outputs in trunks were in the range 56–76 mg g−1. Although the observed fluctuations exceeded the modeled outputs, the modeled outputs were within 1 standard deviation of the observations. The range of the observed NSCs in roots was 97–138 mg g−1, whereas the range of the modeled NSCs was 117–132 mg g−1 (Fig. 2i). However, the observations peaked in August 2001 and in October 2002. The modeled NSCs of roots differed from the observed NSCs because the former peaked during August in both years. Overall, the simulated NSCs agreed well with the observed data (Fig. 3; RMSE = 69.92 mg g−1, r=0.21).
3.1.2 Temperate
In Austria, the fact that the dominant PFT in the simulations was temperate conifer forests was consistent with observations at the site in Austria. The modeled NSCs in leaves accumulated until July with a maximum of 142 mg g−1. This pattern was similar to the observed seasonality of the NSCs, which peaked at 150 mg g−1 (Fig. 2b). The modeled NSCs in trunks were stable in the range 19–26 mg g−1, and the observations were within the range 18–38 mg g−1, with no specific seasonality (Fig. 2f). The modeled values were interspersed between the observations. The modeled NSCs in roots varied in a curvilinear manner from 18 to 26 mg g−1, a range that was similar to the range of the observed NSCs, 13–32 mg g−1 (Fig. 2j). The seasonality and magnitudes of the modeled NSCs were consistent with observations (Fig. 3; RMSE = 9.52 mg g−1, r=0.95).
In Switzerland, the dominant PFT in the simulations corresponded to the temperate conifers observed at the field site. The NSCs in the tree leaves accumulated during early spring and reached up to 222 mg g−1 (Fig. 2c). The decrease in the NSCs after July to a minimum of 135 mg g−1 was similar to the decline of the observed NSCs to a minimum of 124 mg g−1. The modeled NSCs in trunks fell in the range 13–16 mg g−1, which was overlapped with the range of the observed NSCs in trunks, 15–33 mg g−1 (Fig. 2g), and the modeled NSCs all fell within 1 standard deviation of the observations. The modeled NSCs in roots increased gradually from 45 to 62 mg g−1, which is similar to the observed range of observations, 48–64 mg g−1 (Fig. 2k). The simulations captured the amounts and seasonal patterns of the NSCs in the different organs and produced results that compared well with observations (Fig. 3; RMSE = 25.83 mg g−1, r=0.91).
3.1.3 Tropical
In Panama, while a wide range of woody species was found at the Panama site, in the simulation the tropical evergreen PFT became dominant. The simulations showed that the NSCs in leaves were stored during winter and were then gradually consumed from July to October, when they reached a minimum of 52 mg g−1 (Fig. 2d). The observed NSCs in leaves likewise decreased from 69 to 48 mg g−1 between August and October. The model therefore followed the observed seasonality of the leaf NSCs. The modeled NSCs in trunks fell in the range 35–73 mg g−1 (Fig. 2h). The slight decrease in the modeled NSCs in trunks during the summer was not apparent in the observations. However, the simulated values fell within the range of the observed NSCs, 27–97 mg g−1. The simulated NSCs in roots fell in the range 23–55 mg g−1; the observed NSCs ranged from 43 to 70 mg g−1 (Fig. 2l). Despite the weak correlation between simulated and observed NSCs, the model results were within the acceptable margin of error (Fig. 3; RMSE = 20.75 mg g−1, r=0.08).
3.2 Comparison of annual mean NSC concentrations at a global scale
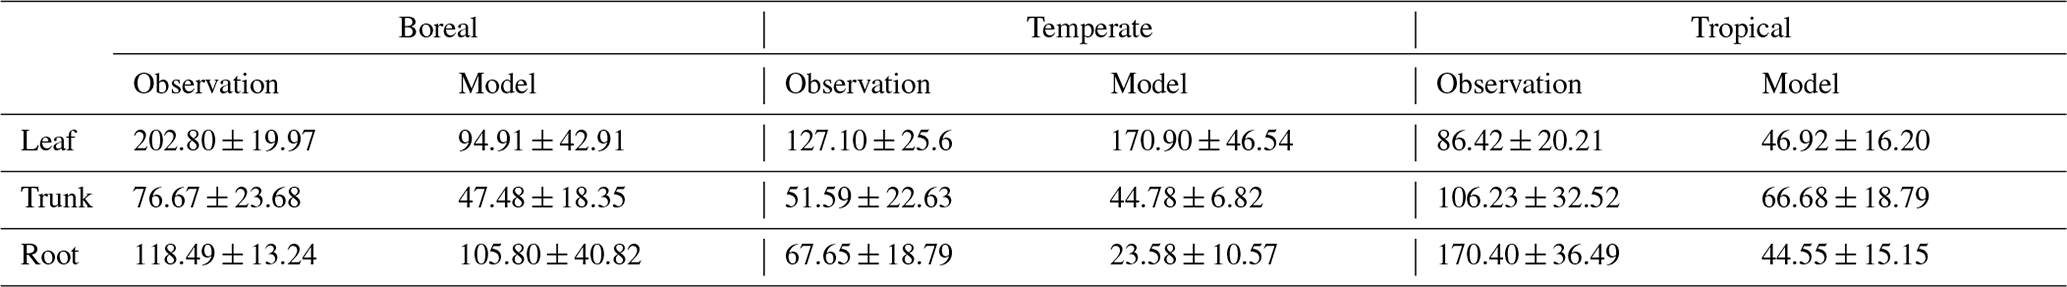
For validation at a global scale, the mean annual NSCs from the new model were compared with the observed mean annual NSCs in boreal, temperate, and tropical regions (Table 5). The model simulated the amounts of NSCs in forest tree trunks in all climate regions with high accuracy. The modeled NSCs in the trunks of trees in boreal forests averaged 47.48 ± 18.35 mg g−1, which compared favorably with the observed average of 76.67 ± 23.68 mg g−1. In temperate forests, the modeled NSCs of trunks averaged 44.78 ± 6.82 mg g−1, which was close to the observed average of 51.59 ± 22.63 mg g−1. The modeled NSCs of trunks in tropical forests averaged 66.68 ± 18.79 mg g−1, which was close to the average of the observations, 106.23 ± 32.52 mg g−1. Although the modeled NSCs in leaves of temperate and tropical forests were close to observed values, the modeled NSCs in leaves of boreal forests underestimated the observed values. Moreover, the modeled NSCs in roots of tropical forests were smaller than the observed NSCs. Overall, the simulated NSCs of all organs of forest trees in all climate regions agreed reasonably well with observations (Fig. 4; RMSE = 66.75 mg g−1, r=0.17). The model could simulate the NSCs with high accuracy, with the exception of the NSCs of tree leaves in boreal forests and of tree roots in tropical forests (Fig. 4; RMSE = 34.15 mg g−1, r=0.71). The original SEIB-DGVM only calculated NSCs in the trunks of trees with an average value of 63.70 ± 44.64 mg g−1 in boreal forests, 20.87 ± 15.91 mg g−1 in temperate forests, and 16.61 ± 10.22 mg g−1 in tropical forests. Although the NSC in trunks of boreal forests from the original SEIB-DGVM was close to observation, the old model underestimated the NSC in trunks of temperate and tropical forests. The simulated NSCs from the original SEIB-DGVM in all climate regions were found to be poorly correlated with observations (Fig. 4; RMSE = 55.37 mg g−1, r=0.01).
Table 5Comparison of modeled and observed annual mean NSC concentrations (mg g−1) on a global scale. The observed results are represented as the mean ± 1 standard deviation.
3.3 Woody biomass and total NSCs on a global scale
The average of the total GPP simulated from the new model during 1976–2005 was 123 PgC yr−1. The model estimated the mean total woody biomass to be 282 PgC yr−1 in boreal zones, 100 PgC yr−1 in temperate zones, and 337 PgC yr−1 in tropical zones globally during 1976–2005. In boreal zones, the new model estimated the mean concentration of total NSCs to be 4.98 % ± 1.87 % of total woody biomass, while the original SEIB-DGVM estimated it to be 6.37 % ± 4.46 % of total woody biomass (Fig. 5). The new model's estimation of the percentage of NSCs to total woody biomass in North America and North Russia was lower than the original SEIB-DGVM. In temperate zones, the mean concentration of total NSCs was 4.67 % ± 0.54 % of total woody biomass from the new model, while it was 2.09 % ± 1.59 % from the original SEIB-DGVM. The NSCs in the temperate forests of Asia and South America accounted for a larger fraction of total biomass in the new model compared to the original SEIB-DGVM. Total NSCs of tropical forests in South America and Africa from the new model were 6.19 % ± 1.66 % of their total woody biomass; the original SEIB-DGVM estimated it to be 1.66 % ± 1.02 % of the total biomass. The new model estimated a larger percentage of NSC to total biomass across tropical regions compared to the original SEIB-DGVM.
Table 6Comparison of modeled mean NSC concentrations to observed total NSC concentrations (%) for different types of biomes. The simulated results are expressed as the mean ± 1 standard deviation.
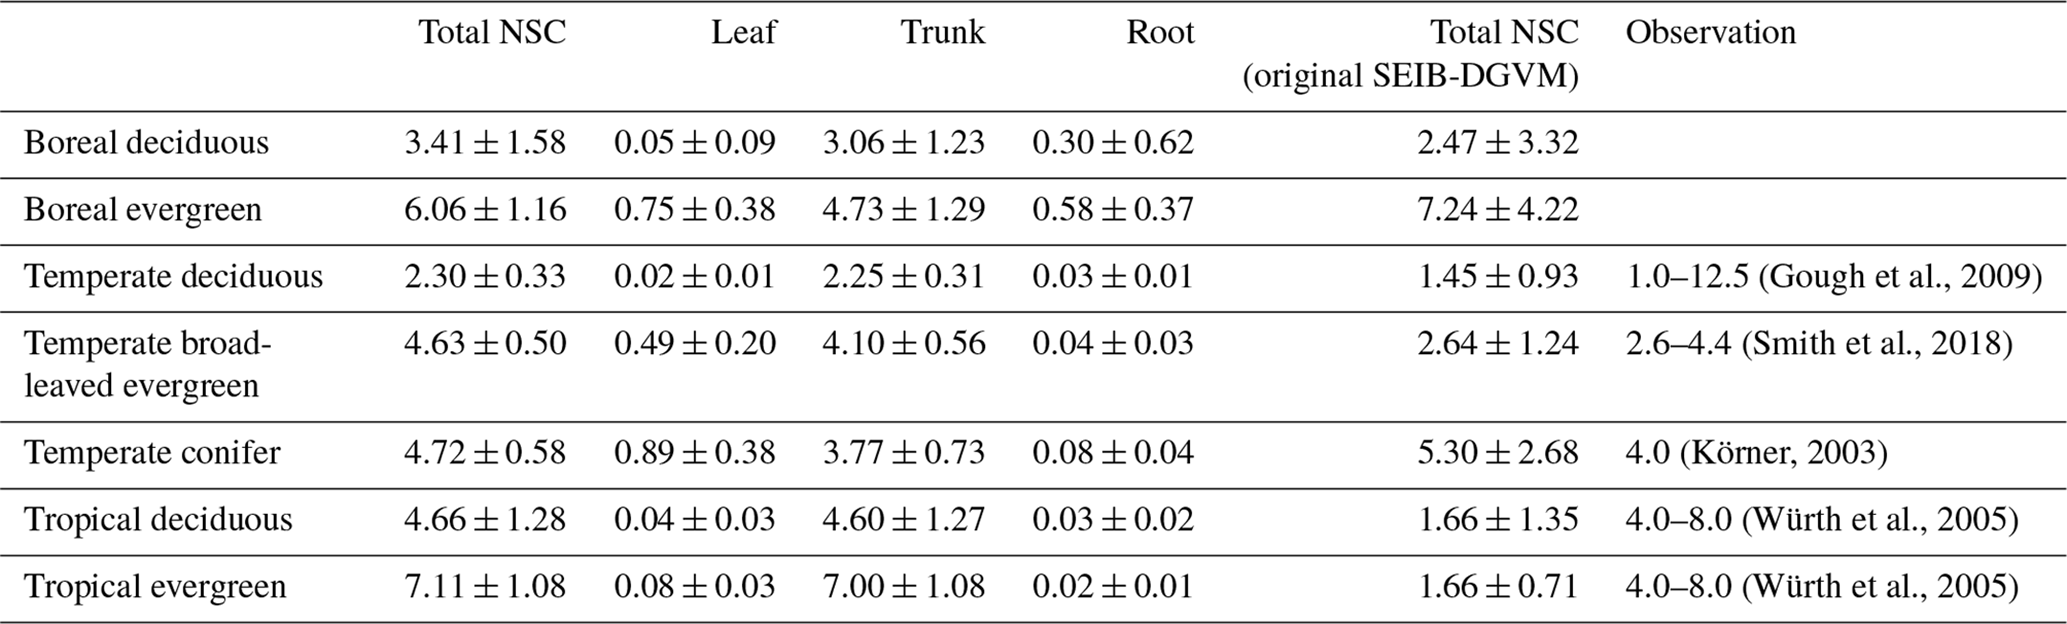
Mean values of the simulated total NSCs relative to total woody biomass from the new model were close to previous estimates for temperate and tropical forests (Table 6). The total NSCs of temperate, broad-leaved, evergreen forests from the new model were 4.63 % ± 0.50 %, which corresponded to the woody biomass reported by Smith et al. (2018). Furthermore, in the new model, the total NSCs of temperate conifer forests were 4.72 % ± 0.58 % of total woody biomass, which was close to the figure of 4 % reported by Körner (2003), while the original SEIB-DGVM calculated the total NSCs of temperate broad-leaved evergreen forests to be 2.64 % ± 1.24 %, and the total NSCs of temperate conifer forests were 5.30 % ± 2.68 % of the total woody biomass, which closely matched the observations. However, the original SEIB-DGVM only considered NSCs in the trunks, whereas the new model allocates the total NSC into three organs, resulting in a close match to the observed total NSC. According to Würth et al. (2005), the percentages of woody biomass contributed by NSCs are 4 %–8 % in tropical forests. The new model was calculated to be 4.66 % ± 1.28 % in tropical deciduous forests and 7.11 % ± 1.08 % in tropical evergreen forests. In contrast, the total NSCs of tropical deciduous forests from the original SEIB-DGVM were 1.66 % ± 1.35 %, and the total NSCs of tropical evergreen forests were 1.66 % ± 0.71 %, which were different from the observed values. These observed percentages are close to our simulated values from the new model.
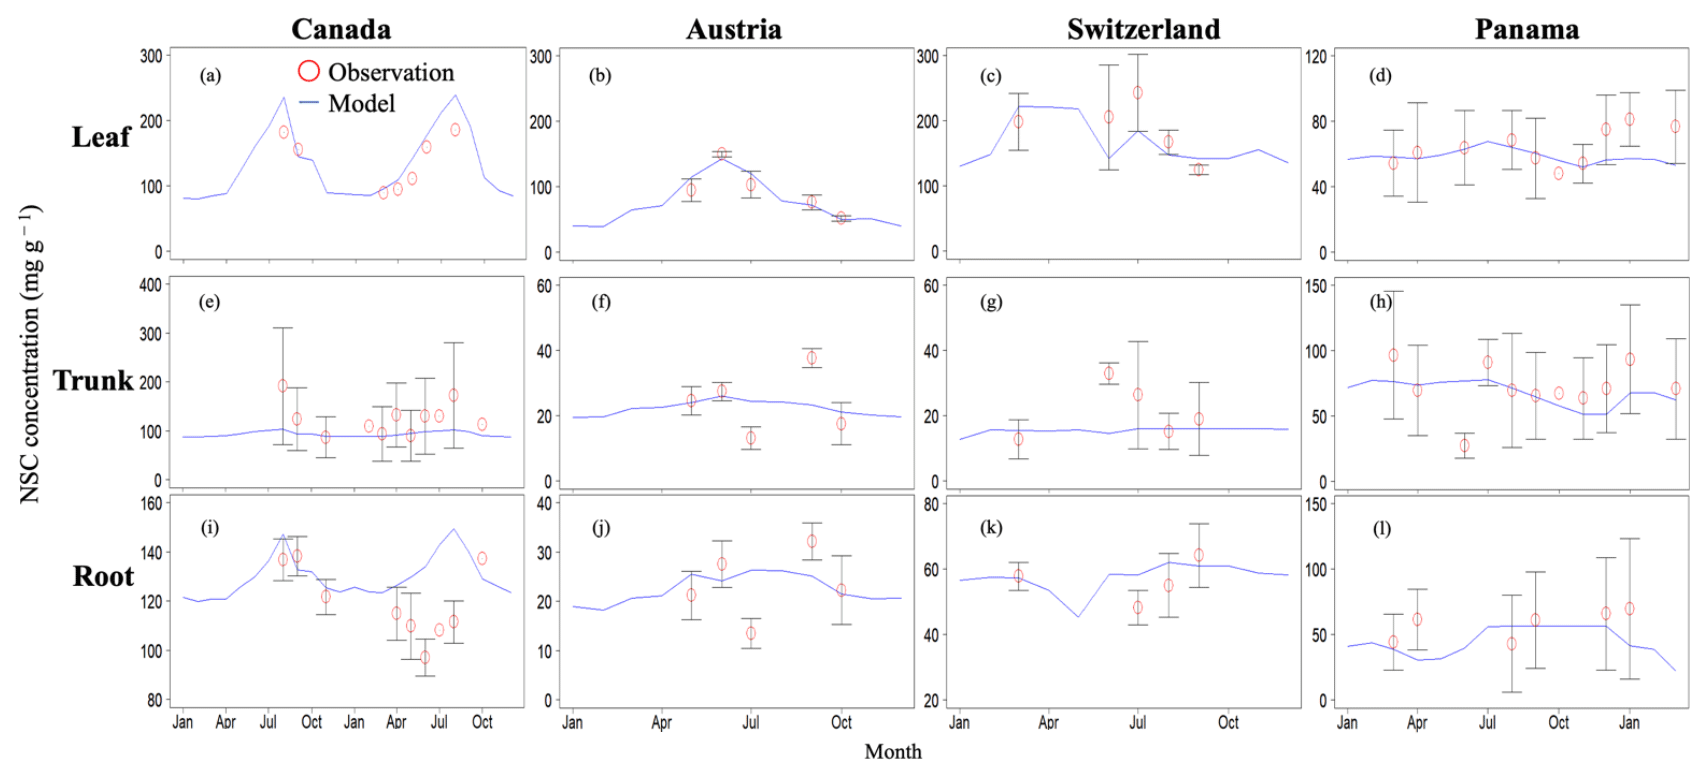
Figure 2Validation of the modeled NSC with observed NSC data (mg g−1) at sites in Canada, Austria, Switzerland, and Panama. Red circles indicate the observed data, and blue lines indicate the modeled NSC. The observed results are represented as mean ±1 standard deviation. Observed data are derived from Martínez-Vilalta et al. (2016).
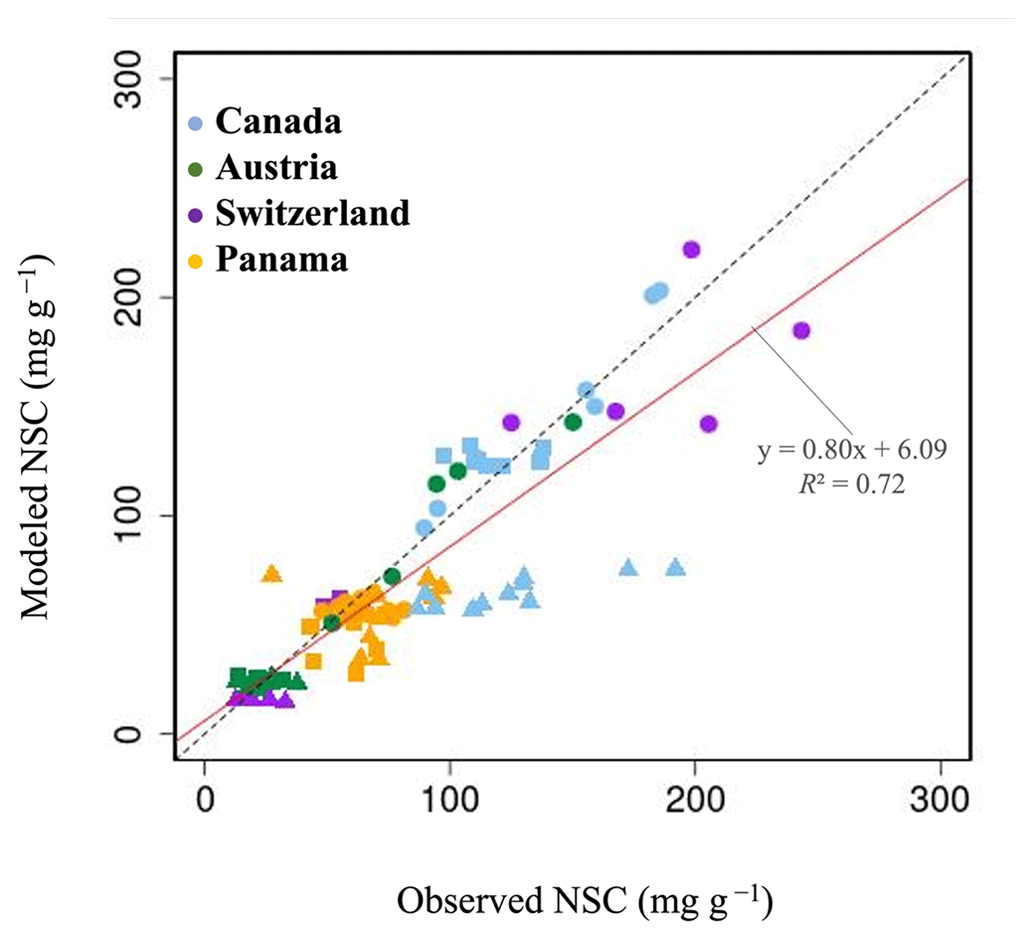
Figure 3Plot of modeled NSC (mg g−1) with observed NSC (mg g−1) at a point scale. •, leaves; ▴, trunks; ▪, roots. For all data, r is 0.72, and RMSE is 29.65 mg g−1.
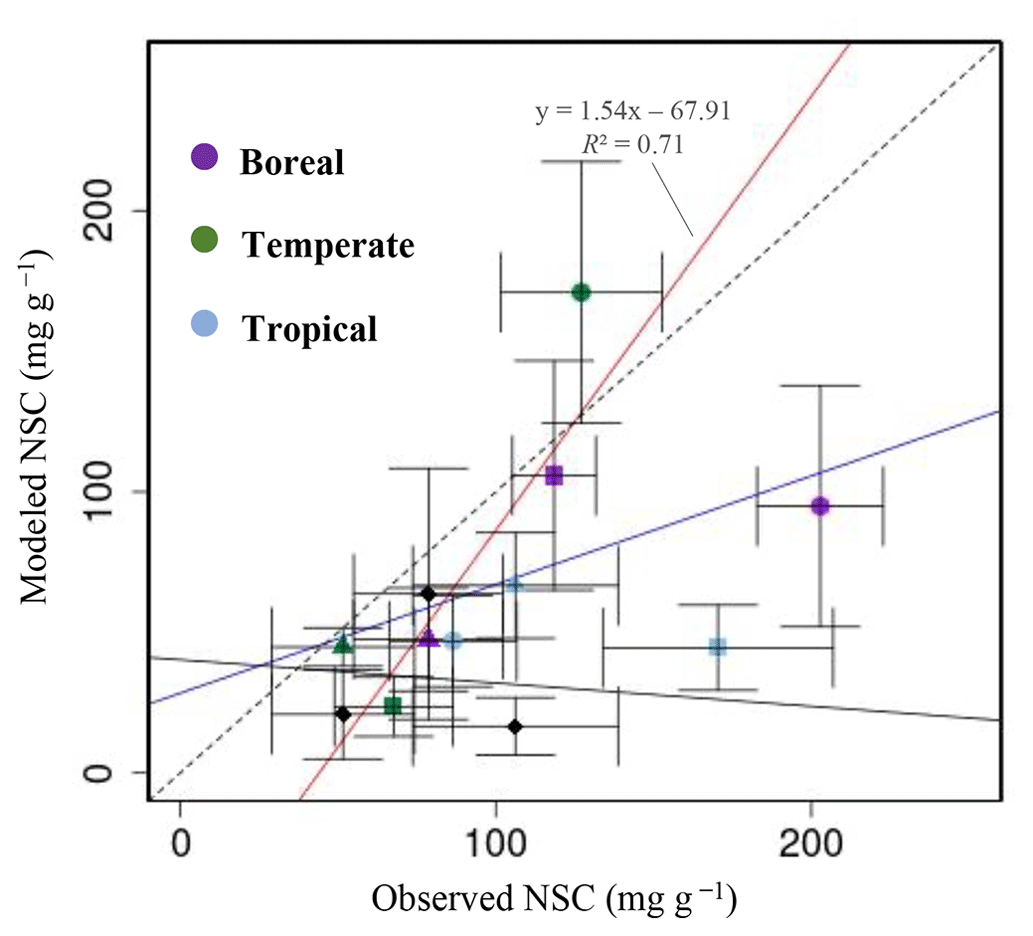
Figure 4Plot of modeled NSC (mg g−1) with observed NSC (mg g−1) at a global scale. •, leaves; ▴, trunks; ▪, roots; ⧫, trunks in the original SEIB-DGVM. The red line represents the regression line of the plot that compares the modeled NSC from the new model with the observed NSC, except for the NSCs of tree leaves in boreal forests and of tree roots in tropical forests. The blue line represents the regression line of all plots from the new model with the observed NSC. The solid black line represents the regression line of modeled NSC from the original SEIB-DGVM with the observed NSC.
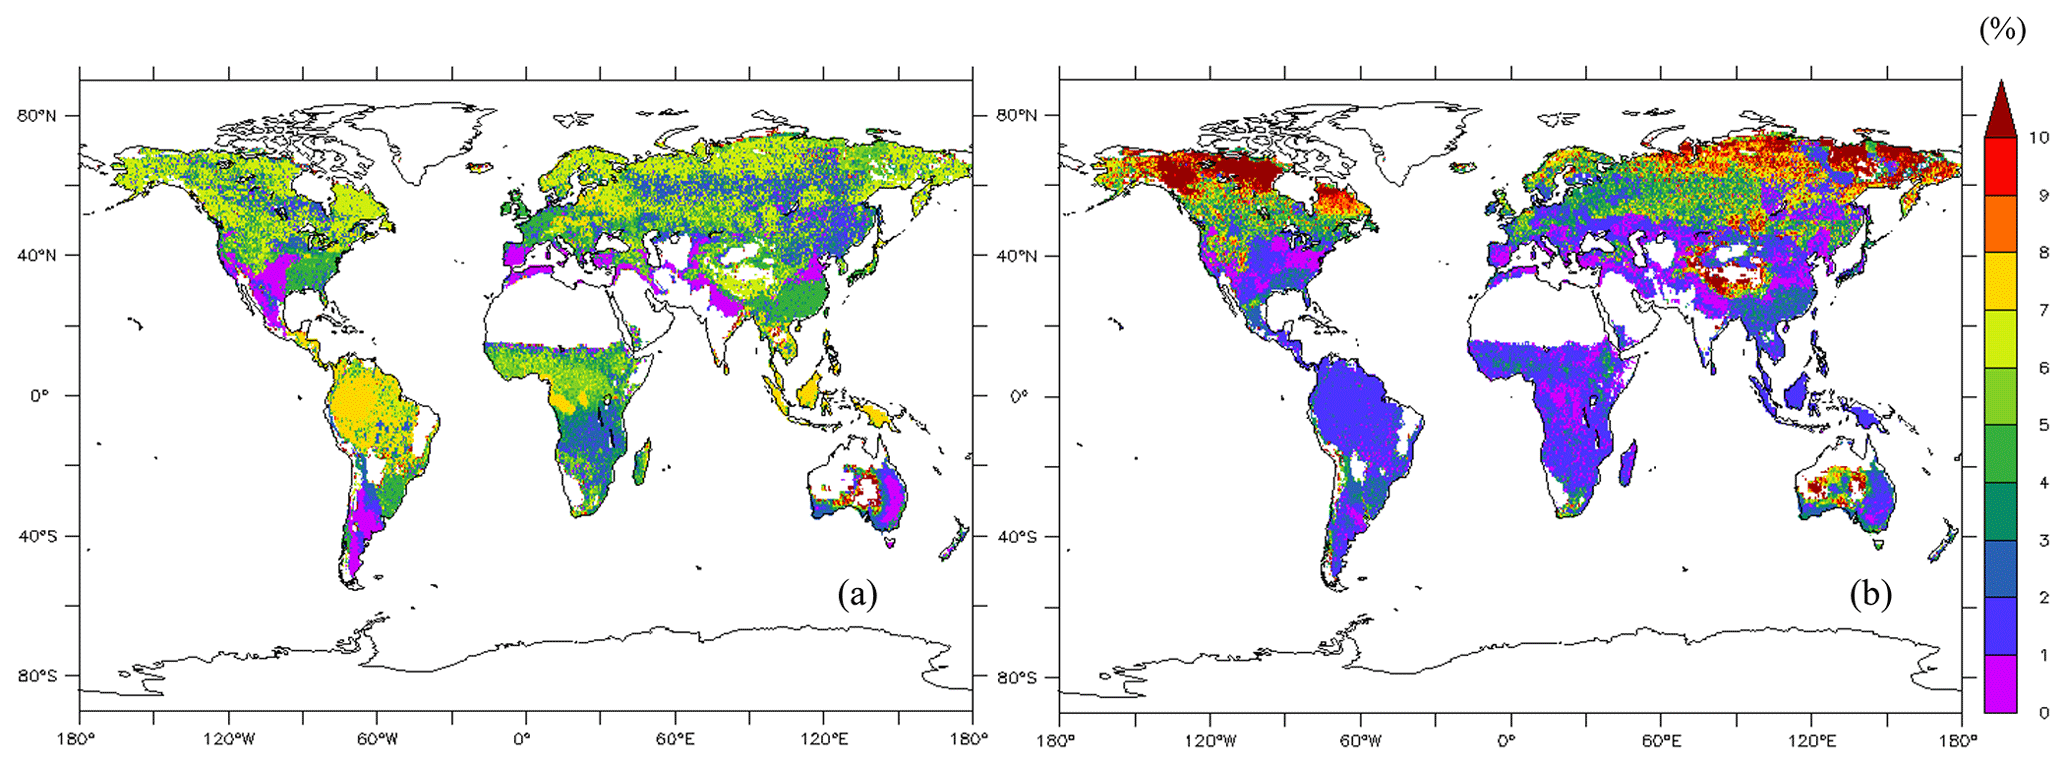
Figure 5The global map of the percentage of total NSC concentration relative to total dry woody biomass averaged during 1976–2005 (%) (a) from the new model and (b) from the original SEIB-DGVM.
At the point scale, the modeled NSCs for boreal forests in Canada were close to the observed NSCs. The seasonality of the modeled NSCs in leaves was consistent with observations. However, the seasonality of NSC in roots differed from the observations because there were insufficient observations in boreal regions that enabled assessment of the seasonality of NSCs in all organs. The seasonality of NSCs in roots is therefore still unclear. In temperate zones, the model simulated the observed NSCs very accurately. The simulated NSCs of temperate forests were close to observed values in Austria and Switzerland. The simulations showed that the NSCs in leaves were consumed in winter for bud flush, and the leaves accumulated NSCs during the growing season. This pattern corresponded to the seasonality reported in Asaadi et al. (2018) and Furze et al. (2019). In the tropical zones, the model also captured a seasonality of NSCs that was similar to observations. The NSC concentration in the canopy of tropical forests decreased from June to August to satisfy increased maintenance demands (Signori-Müller et al., 2022; Würth et al., 2005). The simulated NSCs in leaves followed a similar pattern from June to August, and the simulated NSCs in leaves, trunks, and roots were close to observed values.
At the global scale, the new model simulated NSC values in each organ of all climate regions that agreed with the observed data, except for the leaves of boreal forests and roots of tropical forests. As for the total NSCs of biome types, the modeled total NSCs of all temperate and tropical biomes matched the observed ranges well. In contrast, the original SEIB-DGVM only calculated NSC in trunks, and the modeled NSC in trunks of temperate and tropical forests were underestimated compared to observations. Total NSCs of tropical biomes were lower than observations, while those of temperate biomes were close to observations, but the original SEIB-DGVM did not assign the total NSC into leaves and roots. Therefore, these findings reveal that the new model can simulate NSC more accurately than the original SEIB-DGVM. In the original SEIB-DGVM, the NSC in trunks depended on the existing leaf biomass, which could not be applied to all biome types and climate zones, especially tropical forests. In the new model, NSCorgan is determined by the biomass of the organ and photosynthesis in some climate zones. The new function, which was validated at the point scale, could therefore perform well on a global scale. The NSCs in trunks, which contain the greatest amounts of carbon in trees, were simulated accurately in all climate regions. The new function could therefore calculate the total NSCs in trees with great accuracy.
The model with the new function calculated the global GPP to be 123 PgC yr−1, which is close to the previous estimates of 106.2 ± 2.9 PgC yr−1 by Zheng et al. (2020) and 130 ± 1.6 PgC yr−1 by Madani et al. (2020). Moreover, the simulated mean total woody biomass for boreal forests was 282 PgC yr−1, which is within the range of 249–295 PgC yr−1 reported by Pan et al. (2011). The simulated woody biomass of 100 PgC yr−1 for temperate forests was within the observed range of 59–139 PgC yr−1 (Hui et al., 2017) and a little lower than the range of 113–125 PgC yr−1 for other temperate forests (Pan et al., 2011). The calculated total woody biomass of 337 PgC yr−1 for tropical forests was within the range of 212–340 PgC yr−1 reported by Hui et al. (2017) and was not very different from the estimates of 378–564 PgC yr−1 by Pan et al. (2011) and 200–300 PgC yr−1 by Mitchard (2018). Furthermore, the total NSCs relative to total biomass output from the new function for temperate and tropical biome types agreed with previous research. The total NSC of boreal biome types could not be compared with observations due to lack of data.
The new model allows for simulation of various biotic effects on terrestrial ecosystems by calculating the NSC dynamics within each plant organ. The NSCs stored in the trunk and roots help to compensate for the deficit of CO2 uptake in trees under stress, and the NSC stored in roots is potentially indispensable for tree recovery after disturbances (Herrera-Ramírez et al., 2020). Therefore, the NSC changes in the trunk and roots provide better indicators of carbon source–sink relationships under elevated CO2 conditions and are more closely related to the carbon balance of plant bodies (Körner, 2003). While the original SEIB-DGVM was unable to simulate biotic effects due to the lack of consideration for NSCs in all organs, simulation of the dynamics of NSC in the three compartments in this research contributes to a better understanding plant growth and the response of carbon dynamics in each organ to increasing atmospheric CO2.
Carbon starvation may also be one of the causes of plant death during drought when photosynthesis decreases and water stress increases (McDowell et al., 2008). If reduced photosynthetic rates cannot supply enough carbon for NSC accumulation during drought, there will be greater canopy dieback in the next season (McDowell, 2011; Chen et al., 2017). The new model can simulate the dieback of long-lived temperate and tropical forests during drought, because it can represent the total NSC in plant bodies at a global scale. Additionally, insect pests have a significant impact on forest ecosystems, especially in temperate biomes, and their outbreaks have increased with climate change (Canelles et al., 2021). To recover from defoliation caused by insect pests and avoid decreased growth rates and lower survival rates, plants allocate carbon for NSC defense mechanisms. The new model accurately simulates the amount of total NSCs in temperate biomes, and, therefore, it can be used to estimate the impact of insect pests on a global and future scale.
The new model introduced NSC compartments in leaves, trunk, and roots that were validated at the point and global scales. Use of the model developed here enabled simulation of the environmental effects on forests resulting from the changing amount of NSC in each organ. The simulations depicted the amount of NSC in the trunk at a global scale especially well, which constitutes a significant portion of the total NSC. The model could thus be used as an indicator of the carbon cycle in terrestrial ecosystems to understand the effect of climate change. Simulation of photosynthetic carbon allocated into NSC storage in leaves, trunks, and roots enables a more dynamic simulation of the carbon cycle between terrestrial ecosystems and the atmosphere.
However, there were still some limitations to this research. We considered two potential limitations that could lead to some discrepancies between the modeled and measured NSC values. First, the relatively coarse spatial resolution of 0.5∘ × 0.5∘ gridded climate data at the global scale could not depict the details of local climates derived from observations. These differences were especially important in the case of temperature and short radiation, which play a key role in NSC dynamics. Temperature surrounding plants is a key factor for the rate of plant growth (Hatfield and Prueger, 2015). And different plant species have a specific temperature range. The short radiation is used for a calculation of the photosynthesis rate. These differences of two parameters between 0.5∘ × 0.5∘ gridded climate data and local climate data affect the ability of the trees to accumulate NSCs.
Second, the scarcity of ground-measured NSC seasonality prevented us from having more average information on NSC concentrations, especially in the tropical and boreal regions, where there were fewer available data. The NSC seasonality differs between biome types, but because it is difficult to measure NSC dynamics, there is a lack of long-term data for each biome type. Hence, we adjusted the new NSC process and its related parameters based on climate zones rather than biome types in our study. The fact that the NSC allocation was further influenced by environmental conditions caused the allocation patterns to change within the same biome type. The NSC allocation to roots was favored over aboveground allocations when soil resources were lacking, and tree size was considered an important determinant of carbon allocation as well as aridity (Hartmann et al., 2020). As we used data from different measurement sites for global-scale validation, we could not account for the potential influence of varying surrounding conditions on the data collected. In addition to the above factors, the number of samples and duration of observations differed between the various studies. These differences led to no explicit NSC seasonality. These potential sources of error in the field measurements jeopardized the model performances.
In this study, a new NSC model was incorporated into the SEIB-DGVM to understand the effect of NSC allocation on global forest dynamics through competition and establishment among individual trees. The new module calculated the NSC dynamics of three organs – leaves, trunk, and roots – and the general NSC seasonality based on ground measurements was determined for biome types in three climate zones: boreal, temperate, and tropical. The NSC seasonality was validated at four sites: Canada (boreal), Austria and Switzerland (temperate), and Panama (tropical). The mean values of simulated NSC concentration agreed reasonably well with observed data on a global scale.
The model enabled us to simulate the biotic effects resulting from insufficient NSC caused by factors such as carbon starvation and insect pests that are otherwise difficult to measure in terrestrial ecosystems globally. The difference of the NSC dynamics in the organs under elevated CO2 conditions highlighted the importance of modeling the organs separately when studying environmental stresses. As more observation data about NSC dynamics become available, the model can be further improved and can contribute to the simulations of the passive biome shifts that may occur globally.
The model code used in this study is archived at https://doi.org/10.5281/zenodo.8080601 (Ninomiya et al., 2022).
TK conceived and supervised this study and acquired the funding. HN developed the model code and carried out the analysis and produced the figures. HN prepared the original draft, and TK and LV reviewed it. LW prepared the modeling environment. All authors have read and agreed to the published version of the manuscript.
At least one of the (co-)authors is a member of the editorial board of Geoscientific Model Development. The peer-review process was guided by an independent editor, and the authors also have no other competing interests to declare.
Publisher’s note: Copernicus Publications remains neutral with regard to jurisdictional claims in published maps and institutional affiliations.
This study was funded by the Nippon Life Insurance Company. This work was supported by JSPS KAKENHI grant number JP 22J20286.
We thank all the contributors. Daniel Epron and Masako Dannoura in Kyoto University provided assistance. Tomohiro Hajima at the Japan Agency for Marine-Earth Science and Technology and Junko Mori at the Meteorological Research Institute for Technology Co., Ltd. converted MIROC and CRU/NCEP climate data for CRU/NCEP/MIROC integrated data. We acknowledge the data provided by the European Climate Assessment & Dataset project.
This research has been supported by the JSPS KAKENHI (grant no. JP 22J20286) and the Nippon Life Insurance Company (grant no. 4 of FY2021).
This paper was edited by Hisashi Sato and reviewed by two anonymous referees.
Adams, H. D., Germino, M. J., Breshears, D. D., Barron-Gafford, G. A., Guardiola-Claramonte, M., Zou, C. B., and Huxman, T. E.: Nonstructural leaf carbohydrate dynamics of Pinus edulis during drought-induced tree mortality reveal role for carbon metabolism in mortality mechanism, New Phytol., 197, 1142–1151, https://doi.org/10.1111/nph.12102, 2013.
Adams, H. D., Zeppel, M. J. B., Anderegg, W. R. L., Hartmann, H., Landhäusser, S. M., Tissue, D. T., Huxman, T. E., Hudson, P. J., Franz, T. E., Allen, C. D., Anderegg, L. D. L., Barron-Gafford, G. A., Beerling, D. J., Breshears, D. D., Brodribb, T. J., Bugmann, H., Cobb, R. C., Collins, A. D., Dickman, L. T., Duan, H., Ewers, B. E., Galiano, L., Galvez, D. A., Garcia-Forner, N., Gaylord, M. L., Germino, M. J., Gessler, A., Hacke, U. G., Hakamada, R., Hector, A., Jenkins, M. W., Kane, J. M., Kolb, T. E., Law, D. J., Lewis, J. D., Limousin, J. M., Love, D. M., Macalady, A. K., Martínez-Vilalta, J., Mencuccini, M., Mitchell, P. J., Muss, J. D., O'Brien, M. J., O'Grady, A. P., Pangle, R. E., Pinkard, E. A., Piper, F. I., Plaut, J. A., Pockman, W. T., Quirk, J., Reinhardt, K., Ripullone, F., Ryan, M. G., Sala, A., Sevanto, S., Sperry, J. S., Vargas, R., Vennetier, M., Way, D. A., Xu, C., Yepez, E. A., and McDowell, N. G.: A multi-species synthesis of physiological mechanisms in drought-induced tree mortality, Nat. Ecol. Evol., 1, 1285–1291, https://doi.org/10.1038/s41559-017-0248-x, 2017.
Asaadi, A., Arora, V. K., Melton, J. R., and Bartlett, P.: An improved parameterization of leaf area index (LAI) seasonality in the Canadian Land Surface Scheme (CLASS) and Canadian Terrestrial Ecosystem Model (CTEM) modelling framework, Biogeosciences, 15, 6885–6907, https://doi.org/10.5194/bg-15-6885-2018, 2018.
Braakhekke, M. C., Doelman, J. C., Baas, P., Müller, C., Schaphoff, S., Stehfest, E., and van Vuuren, D. P.: Modeling forest plantations for carbon uptake with the LPJmL dynamic global vegetation model, Earth Syst. Dynam., 10, 617–630, https://doi.org/10.5194/esd-10-617-2019, 2019.
Brutsaert, W.: On a derivable formula for long-wave radiation from clear skies, Water Resour. Res., 11, 742–744, https://doi.org/10.1029/WR011i005p00742, 1975.
Carbone, M. S., Czimczik, C. I., Keenan, T. F., Murakami, P. F., Pederson, N., Schaberg, P. G., Xu, X., and Richardson, A. D.: Age, allocation and availability of nonstructural carbon in mature red maple trees, New Phytol., 200, 1145–1155, https://doi.org/10.1111/nph.12448, 2013.
Canelles, Q., Aquilué, N., James, P. M. A., Lawler, J., and Brotons, L.: Global review on interactions between insect pests and other forest disturbances, Landsc. Ecol., 36, 945–972, https://doi.org/10.1007/s10980-021-01209-7, 2021.
Chen, Z., Wang, L., Dai, Y., Wan, X., and Liu, S.: Phenology-dependent variation in the non-structural carbohydrates of broadleaf evergreen species plays an important role in determining tolerance to defoliation (or herbivory), Sci. Rep., 7, 10125, https://doi.org/10.1038/s41598-017-09757-2, 2017.
Chuste, P. A., Maillard, P., Bréda, N., Levillain, J., Thirion, E., Wortemann, R., and Massonnet, C.: Sacrificing growth and maintaining a dynamic carbohydrate storage are key processes for promoting beech survival under prolonged drought conditions, Trees – Struct. Funct., 34, 381–394, https://doi.org/10.1007/s00468-019-01923-5, 2020.
Dietze, M. C., Sala, A., Carbone, M. S., Czimczik, C. I., Mantooth, J. A., Richardson, A. D., and Vargas, R.: Nonstructural carbon in woody plants, Annu. Rev. Plant Biol., 65, 667–687, https://doi.org/10.1146/annurev-arplant-050213-040054, 2014.
Furze, M. E., Huggett, B. A., Aubrecht, D. M., Stolz, C. D., Carbone, M. S., and Richardson, A. D.: Whole-tree nonstructural carbohydrate storage and seasonal dynamics in five temperate species, New Phytol., 221, 1466–1477, https://doi.org/10.1111/nph.15462, 2019.
Gough, C. M., Flower, C. E., Vogel, C. S., Dragoni, D., and Curtis, P. S.: Whole-ecosystem labile carbon production in a north temperate deciduous forest, Agric. For. Meteorol., 149, 1531–1540, https://doi.org/10.1016/j.agrformet.2009.04.006, 2009.
Gough, C. M., Flower, C. E., Vogel, C. S., and Curtis, P. S.: Phenological and temperature controls on the temporal non-structural carbohydrate dynamics of Populus grandidentata and Quercus rubra, Forests, 1, 65–81, https://doi.org/10.3390/f1010065, 2010.
Gruber, A., Pirkebner, D., Oberhuber, W., and Wieser, G.: Spatial and seasonal variations in mobile carbohydrates in Pinus cembra in the timberline ecotone of the Central Austrian Alps, Eur. J. For. Res., 130, 173–179, https://doi.org/10.1007/s10342-010-0419-7, 2011.
Gruber, A., Pirkebner, D., Florian, C., and Oberhuber, W.: No evidence for depletion of carbohydrate pools in Scots pine (Pinus sylvestris L.) under drought stress, Plant Biol., 14, 142–148, https://doi.org/10.1111/j.1438-8677.2011.00467.x, 2012.
Harris, I., P. D. Jones, T. J. Osborn, and D. H. Lister: Updated high-resolution grids of monthly climatic observations – the CRU TS3.10 Dataset, Int. J. Climatol., 34, 623–642, https://doi.org/10.1002/joc.3711, 2014.
Hartmann, H., Adams, H. D., Hammond, W. M., Hoch, G., Landhäusser, S. M., Wiley, E., and Zaehle, S.: Identifying differences in carbohydrate dynamics of seedlings and mature trees to improve carbon allocation in models for trees and forests, Environ. Exp. Bot., 152, 7–18, https://doi.org/10.1016/j.envexpbot.2018.03.011, 2018.
Hartmann, H., Bahn, M., Carbone, M., and Richardson, A. D.: Plant carbon allocation in a changing world – challenges and progress: introduction to a Virtual Issue on carbon allocation: Introduction to a virtual issue on carbon allocation, New Phytol., 227, 981–988, https://doi.org/10.1111/nph.16757, 2020.
Hatfield, J. L. and Prueger, J. H.: Temperature extremes: Effect on plant growth and development, Weather Clim. Extrem., 10, 4–10, https://doi.org/10.1016/j.wace.2015.08.001, 2015.
He, W., Liu, H., Qi, Y., Liu, F., and Zhu, X.: Patterns in nonstructural carbohydrate contents at the tree organ level in response to drought duration, Glob. Change Biol., 26, 3627–3638, https://doi.org/10.1111/gcb.15078, 2020.
Herrera-Ramírez, D., Muhr, J., Hartmann, H., Römermann, C., Trumbore, S., and Sierra, C. A.: Probability distributions of nonstructural carbon ages and transit times provide insights into carbon allocation dynamics of mature trees, New Phytol., 226, 1299–1311, https://doi.org/10.1111/nph.16461, 2020.
Hickler, T., Smith, B., Sykes, M. T., Davis, M. B., Sugita, S., and Walker, K.: Using a generalized vegetation model to simulate vegetation dynamics in northeastern USA, Ecology, 85, 519–530, https://doi.org/10.1890/02-0344, 2004.
Hoch, G., Richter, A., and Körner, C.: Non-structural carbon compounds in temperate forest trees, Plant, Cell Environ., 26, 1067–1081, https://doi.org/10.1046/j.0016-8025.2003.01032.x, 2003.
Huang, J., Kautz, M., Trowbridge, A. M., Hammerbacher, A., Raffa, K. F., Adams, H. D., Goodsman, D. W., Xu, C., Meddens, A. J. H., Kandasamy, D., Gershenzon, J., Seidl, R., and Hartmann, H.: Tree defence and bark beetles in a drying world: carbon partitioning, functioning and modelling, New Phytol., 225, 26–36, https://doi.org/10.1111/nph.16173, 2020.
Hui, D., Deng, Q., Tian, H., and Luo, Y.: Climate Change and Carbon Sequestration in Forest Ecosystems, in: Handbook of Climate Change Mitigation and Adaptation, edited by: Chen, W. Y., Suzuki, T., and Lackner, M., Springer, Cham, 555–594, https://doi.org/10.1007/978-3-319-14409-2_13, 2017.
IPCC: 2014: Climate Change 2014: Synthesis Report. Contribution of Working Groups I, II and III to the Fifth Assessment Report of the Intergovernmental Panel on Climate Change, edited by: Core Writing Team, Pachauri, R. K., and Meyer, L. A., IPCC, Geneva, Switzerland, https://www.ipcc.ch/site/assets/uploads/2018/02/SYR_AR5_FINAL_full.pdf (last access: 5 April 2022), 2014.
Jones, S., Rowland, L., Cox, P., Hemming, D., Wiltshire, A., Williams, K., Parazoo, N. C., Liu, J., da Costa, A. C. L., Meir, P., Mencuccini, M., and Harper, A. B.: The impact of a simple representation of non-structural carbohydrates on the simulated response of tropical forests to drought, Biogeosciences, 17, 3589–3612, https://doi.org/10.5194/bg-17-3589-2020, 2020.
Kalnay, E., Kanamitsu, M., Kistler, R., Collins, W., Deaven, D., Gandin, L., Iredell, M., Saha, S., White, G., Woollen, J., Zhu, Y., Chelliah, M., Ebisuzaki, W., Higgins, W., Janowiak, J., Mo, K. C., Ropelewski, C., Wang, J., Leetmaa, A., Reynolds, R., Jenne, R., and Joseph, D.: The NCEP/NCAR 40-Year Reanalysis Project, B. Am. Meteorol. Soc., 77, 437–472, 1996
Klein, T. and Hoch, G.: Tree carbon allocation dynamics determined using a carbon mass balance approach, New Phytol., 205, 147–159, https://doi.org/10.1111/nph.12993, 2015.
Klein Tank, A. M. G., Wijngaard, J. B., Können, G. P., Böhm, R., Demarée, G., Gocheva, A., Mileta, M., Pashiardis, S., Hejkrlik, L., Kern-Hansen, C., Heino, R., Bessemoulin, P., Müller-Westermeier, G., Tzanakou, M., Szalai, S., Pálsdóttir, T., Fitzgerald, D., Rubin, S., Capaldo, M., Maugeri, M., Leitass, A., Bukantis, A., Aberfeld, R., van Engelen, A. F. V., Forland, E., Mietus, M., Coelho, F., Mares, C., Razuvaev, V., Nieplova, E., Cegnar, T., Antonio López, J., Dahlström, B., Moberg, A., Kirchhofer, W., Ceylan, A., Pachaliuk, O., Alexander, L. V., and Petrovic, P.: Daily dataset of 20th-century surface air temperature and precipitation series for the European Climate Assessment, Int. J. Climatol., 22, 1441–1453, 2002.
Körner, C.: Carbon limitation in trees, J. Ecol., 91, 4–17, https://doi.org/10.1046/j.1365-2745.2003.00742.x, 2003.
Krinner, G., Viovy, N., de Noblet-Ducoudré, N., Ogée, J., Polcher, J., Friedlingstein, P., Ciais, P., Sitch, S., and Prentice, I. C.: A dynamic global vegetation model for studies of the coupled atmosphere-biosphere system, Global Biogeochem. Cy., 19, GB1015, https://doi.org/10.1029/2003GB002199, 2005.
Landhäusser, S. M. and Lieffers, V. J.: Seasonal changes in carbohydrate reserves in mature northern Populus tremuloides clones, Trees – Struct. Funct., 17, 471–476, https://doi.org/10.1007/s00468-003-0263-1, 2003.
Madani, N., Parazoo, N. C., Kimball, J. S., Ballantyne, A. P., Reichle, R. H., Maneta, M., Saatchi, S., Palmer, P. I., Liu, Z., and Tagesson, T.: Recent Amplified Global Gross Primary Productivity Due to Temperature Increase Is Offset by Reduced Productivity Due to Water Constraints, AGU Adv., 1, e2020AV000180, https://doi.org/10.1029/2020av000180, 2020.
Martínez-Vilalta, J., Sala, A., Asensio, D., Galiano, L., Hoch, G., Palacio, S., Piper, F. I., and Lloret, F.: Dynamics of non-structural carbohydrates in terrestrial plants: A global synthesis, Ecol. Monogr., 86, 495–516, https://doi.org/10.1002/ecm.1231, 2016.
McDowell, N., Pockman, W. T., Allen, C. D., Breshears, D. D., Cobb, N., Kolb, T., Plaut, J., Sperry, J., West, A., Williams, D. G., and Yepez, E. A.: Mechanisms of plant survival and mortality during drought: Why do some plants survive while others succumb to drought?, New Phytol., 178, 719–739, https://doi.org/10.1111/j.1469-8137.2008.02436.x, 2008.
McDowell, N. G.: Mechanisms linking drought, hydraulics, carbon metabolism, and vegetation mortality, Plant Physiol., 155, 1051–1059, https://doi.org/10.1104/pp.110.170704, 2011.
McDowell, N. G., Allen, C. D., Anderson-Teixeira, K., Aukema, B. H., Bond-Lamberty, B., Chini, L., Clark, J. S., Dietze, M., Grossiord, C., Hanbury-Brown, A., Hurtt, G. C., Jackson, R. B., Johnson, D. J., Kueppers, L., Lichstein, J. W., Ogle, K., Poulter, B., Pugh, T. A. M., Seidl, R., Turner, M. G., Uriarte, M., Walker, A. P., and Xu, C.: Pervasive shifts in forest dynamics in a changing world, Science, 368, eaaz9463, https://doi.org/10.1126/science.aaz9463, 2020.
Mitchard, E. T. A.: The tropical forest carbon cycle and climate change, Nature, 559, 527–534, https://doi.org/10.1038/s41586-018-0300-2, 2018.
Ninomiya, H., Kato, T., Végh, L., and Wu, L.: Modeling of non-structural carbohydrate dynamics by the spatially explicitly individual-based dynamic global vegetation model SEIB-DGVM (SEIB-DGVM-NSC ver1.0), Zenodo [code and data set], https://doi.org/10.5281/zenodo.8080601, 2022.
Pan, Y., Birdsey, R. A., Fang, J., Houghton, R., Kauppi, P. E., Kurz, W. A., Phillips, O. L., Shvidenko, A., Lewis, S. L., Canadell, J. G., Ciais, P., Jackson, R. B., Pacala, S. W., McGuire, A. D., Piao, S., Rautiainen, A., Sitch, S., and Hayes, D.: A large and persistent carbon sink in the world's forests, Science, 333, 988–993, https://doi.org/10.1126/science.1201609, 2011.
Rademacher, T., Fonti, P., LeMoine, J. M., Fonti, M. V., Basler, D., Chen, Y., Friend, A. D., Seyednasrollah, B., Eckes-Shephard, A. H., and Richardson, A. D.: Manipulating phloem transport affects wood formation but not local nonstructural carbon reserves in an evergreen conifer, Plant Cell Environ., 44, 2506–2521, https://doi.org/10.1111/pce.14117, 2021.
Richardson, A. D., Carbone, M. S., Keenan, T. F., Czimczik, C. I., Hollinger, D. Y., Murakami, P., Schaberg, P. G., and Xu, X.: Seasonal dynamics and age of stemwood nonstructural carbohydrates in temperate forest trees, New Phytol., 197, 850–861, https://doi.org/10.1111/nph.12042, 2013.
Sala, A., Woodruff, D. R., and Meinzer, F. C.: Carbon dynamics in trees: Feast or famine?, Tree Physiol., 32, 764–775, https://doi.org/10.1093/treephys/tpr143, 2012.
Sato, H. and Ise, T.: Effect of plant dynamic processes on African vegetation responses to climate change: Analysis using the spatially explicit individual-based dynamic global vegetation model (SEIB-DGVM), J. Geophys. Res.-Biogeo., 117, G03017, https://doi.org/10.1029/2012JG002056, 2012.
Sato, H., Itoh, A., and Kohyama, T.: SEIB-DGVM: A new Dynamic Global Vegetation Model using a spatially explicit individual-based approach, Ecol. Modell., 200, 279–307, https://doi.org/10.1016/j.ecolmodel.2006.09.006, 2007.
Sato, H., Kobayashi, H., Iwahana, G., and Ohta, T.: Endurance of larch forest ecosystems in eastern Siberia under warming trends, Ecol. Evol., 6, 5690–5704, https://doi.org/10.1002/ece3.2285, 2016.
Sato, H., Kobayashi, H., Beer, C., and Fedorov, A.: Simulating interactions between topography, permafrost, and vegetation in Siberian larch forest, Environ. Res. Lett., 15, 095006, https://doi.org/10.1088/1748-9326/ab9be4, 2020.
Seidl, R., Thom, D., Kautz, M., Martin-Benito, D., Peltoniemi, M., Vacchiano, G., Wild, J., Ascoli, D., Petr, M., Honkaniemi, J., Lexer, M. J., Trotsiuk, V., Mairota, P., Svoboda, M., Fabrika, M., Nagel, T. A., and Reyer, C. P. O.: Forest disturbances under climate change, Nat. Clim. Change, 7, 395–402, https://doi.org/10.1038/nclimate3303, 2017.
Sevanto, S. and Dickman, L. T.: Where does the carbon go?-Plant carbon allocation under climate change, Tree Physiol., 35, 581–584, https://doi.org/10.1093/treephys/tpv059, 2015.
Signori-Müller, C., Oliveira, R. S., Valentim Tavares, J., Carvalho Diniz, F., Gilpin, M., de V. Barros, F., Marca Zevallos, M. J., Salas Yupayccana, C. A., Nina, A., Brum, M., Baker, T. R., Cosio, E. G., Malhi, Y., Monteagudo Mendoza, A., Phillips, O. L., Rowland, L., Salinas, N., Vasquez, R., Mencuccini, M., and Galbraith, D.: Variation of non-structural carbohydrates across the fast–slow continuum in Amazon Forest canopy trees, Funct. Ecol., 36, 341–355, https://doi.org/10.1111/1365-2435.13971, 2022.
Singh, K. P. and Srivastava, K.: Seasonal variation in the biomass and non-structural carbohydrate content of fine roots of teak (Tectona grandis L. f.) plantations in a dry tropical region, Tree Physiol., 1, 31–36, https://doi.org/10.1093/treephys/1.1.31, 1986.
Smith, B., Prentice, I. C., and Sykes, M. T.: Representation of vegetation dynamics in the modelling of terrestrial ecosystems: Comparing two contrasting approaches within European climate space, Glob. Ecol. Biogeogr., 10, 621–637, https://doi.org/10.1046/j.1466-822X.2001.t01-1-00256.x, 2001.
Smith, M. G., Miller, R. E., Arndt, S. K., Kasel, S., and Bennett, L. T.: Whole-tree distribution and temporal variation of non-structural carbohydrates in broadleaf evergreen trees, Tree Physiol, 38, 570–581, https://doi.org/10.1093/treephys/tpx141, 2018.
Stevens-Rumann, C. S., Kemp, K. B., Higuera, P. E., Harvey, B. J., Rother, M. T., Donato, D. C., Morgan, P., and Veblen, T. T.: Evidence for declining forest resilience to wildfires under climate change, Ecol. Lett., 21, 243–252, https://doi.org/10.1111/ele.12889, 2018.
Sveinbjörnsson, B., Smith, M., Traustason, T., Ruess, R. W., and Sullivan, P. F.: Variation in carbohydrate source-sink relations of forest and treeline white spruce in southern, interior and northern Alaska, Oecologia, 163, 833–843, https://doi.org/10.1007/s00442-010-1597-1, 2010.
Tei, S., Sugimoto, A., Liang, M., Yonenobu, H., Matsuura, Y., Osawa, A., Sato, H., Fujinuma, J., and Maximov, T.: Radial Growth and Physiological Response of Coniferous Trees to Arctic Amplification, J. Geophys. Res.-Biogeo., 122, 2786–2803, https://doi.org/10.1002/2016JG003745, 2017.
Wang, Z., Zhou, Z., and Wang, C.: Defoliation-induced tree growth declines are jointly limited by carbon source and sink activities, Sci. Total Environ., 762, 143077, https://doi.org/10.1016/j.scitotenv.2020.143077, 2021.
Watanabe, S., Hajima, T., Sudo, K., Nagashima, T., Takemura, T., Okajima, H., Nozawa, T., Kawase, H., Abe, M., Yokohata, T., Ise, T., Sato, H., Kato, E., Takata, K., Emori, S., and Kawamiya, M.: MIROC-ESM 2010: model description and basic results of CMIP5-20c3m experiments, Geosci. Model Dev., 4, 845–872, https://doi.org/10.5194/gmd-4-845-2011, 2011.
Weedon, G. P., Balsamo, G., Bellouin, N., Gomes, S., Best, M. J., and Viterbo, P.: The WFDEI Meteorological Forcing Data, Research Data Archive at the National Center for Atmospheric Research, Computational and Information Systems Laboratory [data set], https://doi.org/10.5065/486N-8109, 2018.
Woodruff, D. R. and Meinzer, F. C.: Water stress, shoot growth and storage of non-structural carbohydrates along a tree height gradient in a tall conifer, Plant, Cell Environ., 34, 1920–1930, https://doi.org/10.1111/j.1365-3040.2011.02388.x, 2011.
Würth, M. K. R., Peláez-Riedl, S., Wright, S. J., and Körner, C.: Non-structural carbohydrate pools in a tropical forest, Oecologia, 143, 11–24, https://doi.org/10.1007/s00442-004-1773-2, 2005.
Xu, C., Liu, H., Anenkhonov, O. A., Korolyuk, A. Y., Sandanov, D. V., Balsanova, L. D., Naidanov, B. B., and Wu, X.: Long-term forest resilience to climate change indicated by mortality, regeneration, and growth in semiarid southern Siberia, Glob. Change Biol., 23, 2370–2382, https://doi.org/10.1111/gcb.13582, 2017.
Zheng, Y., Shen, R., Wang, Y., Li, X., Liu, S., Liang, S., Chen, J. M., Ju, W., Zhang, L., and Yuan, W.: Improved estimate of global gross primary production for reproducing its long-term variation, 1982–2017, Earth Syst. Sci. Data, 12, 2725–2746, https://doi.org/10.5194/essd-12-2725-2020, 2020.