the Creative Commons Attribution 4.0 License.
the Creative Commons Attribution 4.0 License.
 | 22 Mar 2023
A dynamic ammonia emission model and the online coupling with WRF–Chem (WRF–SoilN–Chem v1.0): development and regional evaluation in China
Chuanhua Ren
Tengyu Liu
Yu Song
Zhang Wen
Xuejun Liu
Aijun Ding
The volatilization of ammonia (NH3) from fertilizer application and livestock wastes is an overwhelmingly important pathway of nitrogen losses in agricultural ecosystems and constitutes the largest source of atmospheric NH3. The volatilization of NH3 highly depends on environmental and meteorological conditions, however, this phenomenon is poorly described in current emission inventory and atmospheric models. Here, we develop a dynamic NH3 emission model capable of calculating the NH3 emission rate interactively with temporal- and spatial-varying meteorological and soil conditions. The NH3 flux parameterization relies on several meteorological factors and anthropogenic activity including fertilizer application, livestock waste, traffic, residential, and industrial sectors. The model is then embedded into a regional WRF–Chem model and is evaluated against field measurements of NH3 concentrations, emission flux, and satellite retrievals of column loading. The evaluation shows a substantial improvement in the model performance of NH3 flux and ambient concentration in China. The model represents the spatial and temporal variations of ambient NH3 concentration well, indicating the highest emission in the North China Plain (NCP) and Sichuan Basin, especially during summertime. Compared with normal simulations using fixed emission inventory input, this model features superior capability in simulating NH3 emission flux and concentration during drastic weather changes like frontal activities and precipitation. Such advances in emission quantification also improve the model performance of secondary inorganic aerosol on synoptic scales. While more laboratory and field measurements are still needed for better parameterization of NH3 volatilization, the seamless coupling of soil emission with meteorology provides a better understanding of NH3 emission evolution and its contribution to atmospheric chemistry.
- Article
(5210 KB) - Full-text XML
-
Supplement
(977 KB) - BibTeX
- EndNote


Ammonia (NH3) is the most important alkaline gas in the atmosphere and has important impacts on the ecological environment and human health (Behera et al., 2013). Gas-phase NH3 can react with ambient sulfuric and nitric acids to form ammonium sulfate ((NH4)2SO4), ammonium bisulfate (NH4HSO4), and ammonium nitrate (NH4NO3) aerosols (Wang et al., 2013), which constitute a significant fraction of atmospheric fine particles associated with potential human health impacts (Emmanouil et al., 2017; Oprea et al., 2017). Besides, soil NH3 volatilization releases a large amount of nitrogen into the atmosphere, which is in turn deposited back to terrestrial and aquatic ecosystems, contributing to acid deposition and eutrophication. Thus, the atmospheric emission, transport, and deposition of NH3 play a societally and ecologically important role in the global nitrogen cycle (Fowler et al., 2013; Liu et al., 2022).
Due to the health and ecological significance of atmospheric NH3, a range of air quality models have been applied to investigate its spatiotemporal variation and sink (Spindler et al., 2001; Asman, 2001; Van Pul et al., 2009). To accurately simulate NH3 in numerical models, considerable approaches have been developed to estimate NH3 emissions from natural and anthropogenic sources, which vary greatly in their complexity and data requirements. A common method named the “bottom-up” method is to use emission factors (EFs) multiplied by activity data (fertilizer application amounts corresponding to each crop, mileage of motor vehicles, etc.). Based on this approach, several organizations and researchers established gridded NH3 emission inventories, such as the MEIC, PKU-NH3, EDGAR, and REAS (Li et al., 2017; Huang et al., 2012; Paulot et al., 2014; Crippa et al., 2020; Kurokawa and Ohara, 2020). Based on the human activity level and land-use type in different regions, the bottom-up emission inventories can reflect geographic variations. In addition, these inventories offer highly formatted gridded datasets of monthly variation and spatial distribution of NH3 emissions, which are extensively utilized in atmospheric chemical transport models.
On both global and regional scales, NH3 is mostly emitted from agricultural activities, mainly including the fertilization and livestock waste (Bouwman et al., 1997). Multiple lines of evidence from field trials, meta-analysis, and a statistical model indeed showed that local meteorological conditions strongly influence the ammonia emission rate (Paerl, 2002; Misselbrook et al., 2005; Bouwman et al., 2002). Temperature is the most important meteorological parameter that affects the partial pressure of NH3 in soil by changing the equilibrium constant of the NH(soil)–NH3(soil)–NH3(gas) equilibrium reaction (Van Slyke and Cullen, 1914; Clay et al., 1990). Furthermore, high temperature increases the rate of urea hydrolysis and the diffusion rate of NH and NH3 in soil (Overrein and Moe, 1967). Riddick et al. (2016) showed that increasing the ground temperature from 290 to 300 K (at a pH of 7) increases the NH3 emissions by a factor of 3. Besides temperature, soil moisture also strongly controls NH3 loss by influencing urea hydrolysis and NH3/NH concentration in soil solution. Results from a field experiment showed that the rate of ammonia volatilization was highly limited at low soil moisture, even though the ammoniacal N concentration and pH were high (Smith et al., 1988). On the contrary, if the soil moisture content is quite high, the concentration of ammonia in solution tends to be diluted and thus the ammonia volatilization is prone to be reduced (Fenn and Kissel, 1976). Moderate amounts of soil moisture are found to be more favorable for NH3 volatilization. Additionally, rainfall, wind speed, and relative humidity (RH) have also been proved by laboratory experiments to affect NH3 emissions (Longhini et al., 2020; Parker et al., 2005). Generally, the environmental elements appreciably influencing ammonia emissions have drastic weather-scale variations or diurnal variations. As one of the main monsoon regions with the most intense agriculture activities in the world, east Asia is a region experiencing complex synoptic weather and high-level NH3 emissions (Ding et al., 2017; Van Damme et al., 2015; Zhang et al., 2017). Dramatic changes of ammonia emissions caused by different meteorological conditions could also substantially influence the level of nitrogen-containing aerosol (e.g., ammonium nitrate) at the same time. However, the majority of current temporal resolution of existing ammonia inventory still remains at the monthly or annual scale, which is not capable of accurately reflecting the time-resolved and spatial-varying ammonia emission due to weather change on a synoptic scale.
Although in recent years, bidirectional flux models that consider the meteorological influence have been applied in regional chemistry models (Cooter et al., 2010; L. Zhang et al., 2010), such as the WRF–CMAQ–EPIC (Pleim et al., 2019), this method requires users to collect and build complex agriculture-related files. In this work, we develop and evaluate a new user-friendly ammonia flux module (WRF–SoilN–Chem) capable of simulating dynamic NH3 volatilization under different meteorological conditions. The whole NH3 flux model and input dataset are embedded directly into the WRF–Chem model and can be activated by simply turning on an option in the model control file. It then enables the seamless coupling of meteorology simulation, the NH3 flux flows, and the atmospheric chemistry module. The WRF–SoilN–Chem model is easy to install and use, it is open source, version-controlled, and well documented. In this paper, Sect. 2 presents the overall methodology including a detailed description of the model's framework, data source, and emission factor algorithm. Section 3 compares the simulated NH3 flux and concentrations with site measurements and satellite retrievals as well as in-depth analyses of case studies where the simulation of ammonia and secondary inorganic aerosol are improved on a synoptic scale. Discussion of model uncertainty and future improvement of the model like bidirectional parameterization and other dynamic reactive nitrogen emission models are provided in Sect. 4.
2.1 The parent model: WRF–Chem
The WRF–Chem is a state-of-the-art online coupled meteorology–chemistry model that can simulate meteorological fields and atmospheric chemical compositions including aerosols (Grell et al., 2005). It has been widely used in air quality forecasting and aerosol-related studies (Chen et al., 2016). The WRF model provides users with many options for model configurations and physical schemes, and it is used to simulate meteorological processes and advection of atmospheric constituents. The WRF model uses the advanced research WRF (ARW) dynamical solver, which solves fully compressible, nonhydrostatic Eulerian equations on either hybrid sigma–eta (default) or terrain-following vertical coordinates defined by the user. Besides, the WRF model offers many options for land surface physics, planetary boundary layer (PBL) physics, radiative transfer, cloud microphysics, and cumulus parameterization, for use in meteorological studies, real-time numerical weather prediction, idealized simulations, and data assimilation on meso- to regional scales (Skamarock, 2019). The WRF–Chem model is an extended version of WRF, including chemical transformation of trace gases and aerosols simultaneously with meteorology. The chemical transport model numerically solves the concentration of chemical species through emissions, advection, vertical mixing with dry deposition, convective transport, gas chemistry, cloud chemistry (for activated aerosols in cloud water), aerosol chemistry, and wet scavenging. The WRF-Chem model can simulate trace gases and particles in an interactive way, allowing for feedbacks between the meteorology and radiatively active gases and particles. The detailed model configuration is described in Sect. 3.1.
2.2 General framework of WRF–SoilN–Chem model
The dynamic NH3 flux model within the WRF–Chem model estimates the emission rate of NH3 (mol km−2 h−1) from the natural and anthropogenic source into the atmosphere at a specific location and time. Figure 1 gives an architectural overview of the WRF–SoilN–Chem coupled model. Briefly, the model contains three parts: (1) the static input data on basic NH3 emissions, (2) the WRF mesoscale meteorological model, (3) and the online NH3 emission model coupled into the Chem model. The static input data cover the whole China region with ∼1 km2 spatial resolution. The emission sources are classified into six sectors, including fertilizer application, livestock waste, agricultural soil, transport, residential, and industrial sectors. The data are embedded into geog_data_path as binary format and read by geogrid.exe in WPS (WRF Pre-Processing System). The WRF model is used to set up the simulation initialization and perform dynamical and physical calculations to get the meteorological parameters for online emission calculation. The online NH3 model is merged into the Chem model by modifying the chem_driver and emissions_driver modules to simulate the NH3 flux under different meteorological conditions.
Users can turn on the dynamic NH3 emission model in WRF–Chem by specifying nh3emis_opt=1 in the namelist.input control file, similar to the way that users specify the dust emission mechanism in WRF–Chem. The simulated conditions like meteorological element and soil properties provided by the WRF solver are transported to the NH3 emission model to calculate the meteorology-dependent correction factor (CF). Consequently, the CF is multiplied by the part (1) basic emission data to obtain the meteorology-dependent NH3 emission flux. In the Chem model, the flux will be considered as a source of NH3 in atmosphere and participate in the next atmospheric physicochemical processes (deposition, accumulation, convection, boundary layer mixing, and chemistry). At the end of the simulation, WRF–SoilN–Chem outputs all meteorological parameters, NH3 emission rates, and other chemical diagnostic quantities in WRF's standard format.
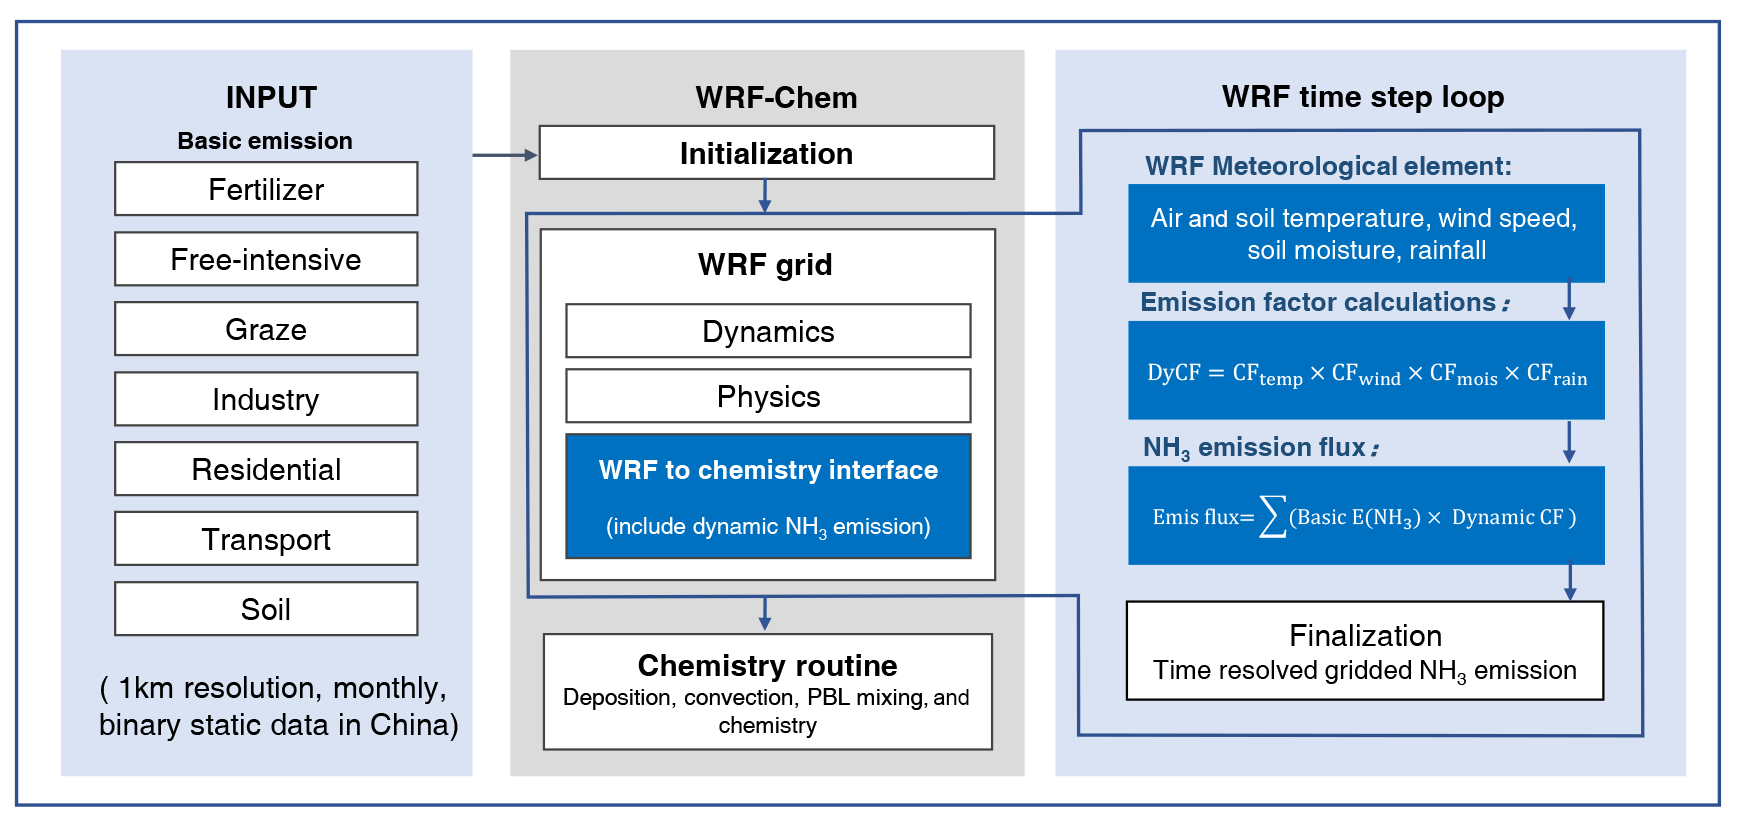
Figure 1Architectural overview of the WRF–SoilN–Chem model (v1.0). The NH3 emission flux calculation (all parts shown in blue) includes basic emission data and dynamic calculation. The parent model WRF–Chem (shown in gray) displays standard codes downloaded from their sources, without any modification.
2.3 Basic emission data
In this study, the basic emission data used as static input were divided into six sections which are fertilizer application, livestock waste, agricultural soil, transport, residential, and industrial sectors, covering a total of more than 50 emission sources. Due to intensive agricultural activities in China, synthetic fertilizer application and livestock manure represent the most important sources of NH3, jointly accounting for more than 80 %–90 % of total emissions in China (Li et al., 2021). In the fertilizer section of basic emission, urea and ammonium bicarbonate (ABC) are two dominant emitters, followed by others like ammonium nitrate and ammonium sulfate. For the livestock waste section, nitrogen in animal excrement in the form of urea can rapidly hydrolyze to form ammonium carbonate and then volatilize as gaseous NH3. The other minor sources include agricultural soil, N-fixing plants, the compost of crop residues, biomass burning, excrement waste from rural populations and chemical industry, waste disposal, traffic sources, and NH3 escape from thermal power plants. All the basic static emissions data were monthly and were obtained by multiplying the monthly activity data and corresponding static EFs, as shown in Eq. (1). The province-level activity data of important sources were obtained from the National Bureau of Statistics of China (NBSC), the more detailed information of each source can be found in Table S1.
where denotes the basic NH3 emissions of a specific source section; i, p, and m represent source type, the province of China, and the month, respectively. is the activity data of a specific source; and is the static emission factor for specific emission sources.
In the fertilizer application section, the fertilizer type, soil pH, fertilizer application rate, and method are introduced as parameters to develop EFs for specific conditions. The fertilization rate and method are relatively stable in a month based on the farmers' traditional growing habits. As for soil pH, although it significantly increases after fertilizer application, it gradually falls back to the normal state within 30 d due to the nitrification of NH (Curtin et al., 2020). Thus, the pH, fertilizer rate, and method were assumed to be relatively stable in monthly scales and were introduced as stable parameters to adjust emission factors for static conditions. The static EF for fertilizer at a specific condition is shown in Eq. (2):
where EF0i is the reference emission factor for a type i fertilizer; CFpH is the correction factor for different soil acidity; CFmethod is the correction factor for the fertilization method, including basal dressing and top dressing; and CFrate is the correction factor for different application rates. The EF0 for urea and ABC were based on experiments carried out in the Henan and Jiangsu provinces through the micrometeorological method (Cai et al., 1986; Zhu et al., 1989). The EF0 for other less prevalent fertilizers refers to the up-to-date and reliable EFs provided by the European Environment Agency (2019), as shown in Table S2. The values of CFpH, CFmethod, CFrate are all referred to in Huang et al. (2012) (Table S2).
As for the livestock waste section, free-range, grazing, and intensive are three main animal-rearing systems in China and produce a huge number of wastes. The nitrogen in waste can be converted into gaseous NH3 or lost through other pathways during different processes of manure management, including animal housing, manure storage, manure spreading, and the grazing stage (Webb and Misselbrook, 2004; Webb et al., 2006). The ammonia emissions from each stage of livestock manure management are affected by many factors, such as species, age, housing structure, manure storage system, spreading technique, time spent outside or inside, and meteorological conditions (Y. Zhang et al., 2010). In the livestock section, the static emission factors are set separately according to the animal species, age, manure status, and rearing system, as shown in Eq. (3):
where represents the emission factor of livestock waste; c represents each animal class; a represents different age; s represents different rearing systems, such as grazing, free-range, and intensive; and f represents the form of manures like slurry or solid manures. The typical animal categories and EFs in the estimation of ammonia emission from livestock waste management are listed in Table S3.
As for other miscellaneous sources, further details on the estimation methods and gridded and monthly allocation of the various sources are fully presented in Huang et al. (2012). All the basic emissions are allocated to each 1 km spatial resolution on the basis of land cover, rural population, and other proxies. Eventually, all the data are converted to the binary format and embedded into geog_data_path required by WPS.
2.4 Meteorology-dependent NH3 dynamic emission factor
In this section, we describe the algorithm for dynamic ammonia emissions from fertilizer application and livestock waste. Many dynamically changing meteorological factors have proven to impact NH3 emissions significantly. Based on previous works, Tian et al. (2001) showed that near-surface air temperature, soil moisture, wind speed, and precipitation are the four meteorological factors had the greatest influence on soil ammonia emissions. Besides, Table S4 illustrates that these factors have also been required as important meteorological factors in previous ammonia emission models. Therefore, we chose these four meteorological parameters as the main factors modulating emission rate in the parameterization scheme.
For fertilizer application, the main factors governing ammonia volatilization are identified to be ammoniacal N concentration, soil pH, temperature in soil or floodwater, wind speed, soil moisture, and rainfall by a variety of laboratory experiments. Among these factors, ammoniacal N concentration and soil pH are assumed to be stable in monthly scales and used in the monthly basic emission data mentioned above. Other factors that change dynamically under different meteorological conditions need to be calculated in real time in the model. The effects of these dynamical factors on ammonia emissions are reflected by the following correction factors (CFs), and the calculations are performed in the WRF–Chem model at each time step.
For fertilization source, the dynamic NH3 emission flux from fertilizer is estimated using Eq. (4):
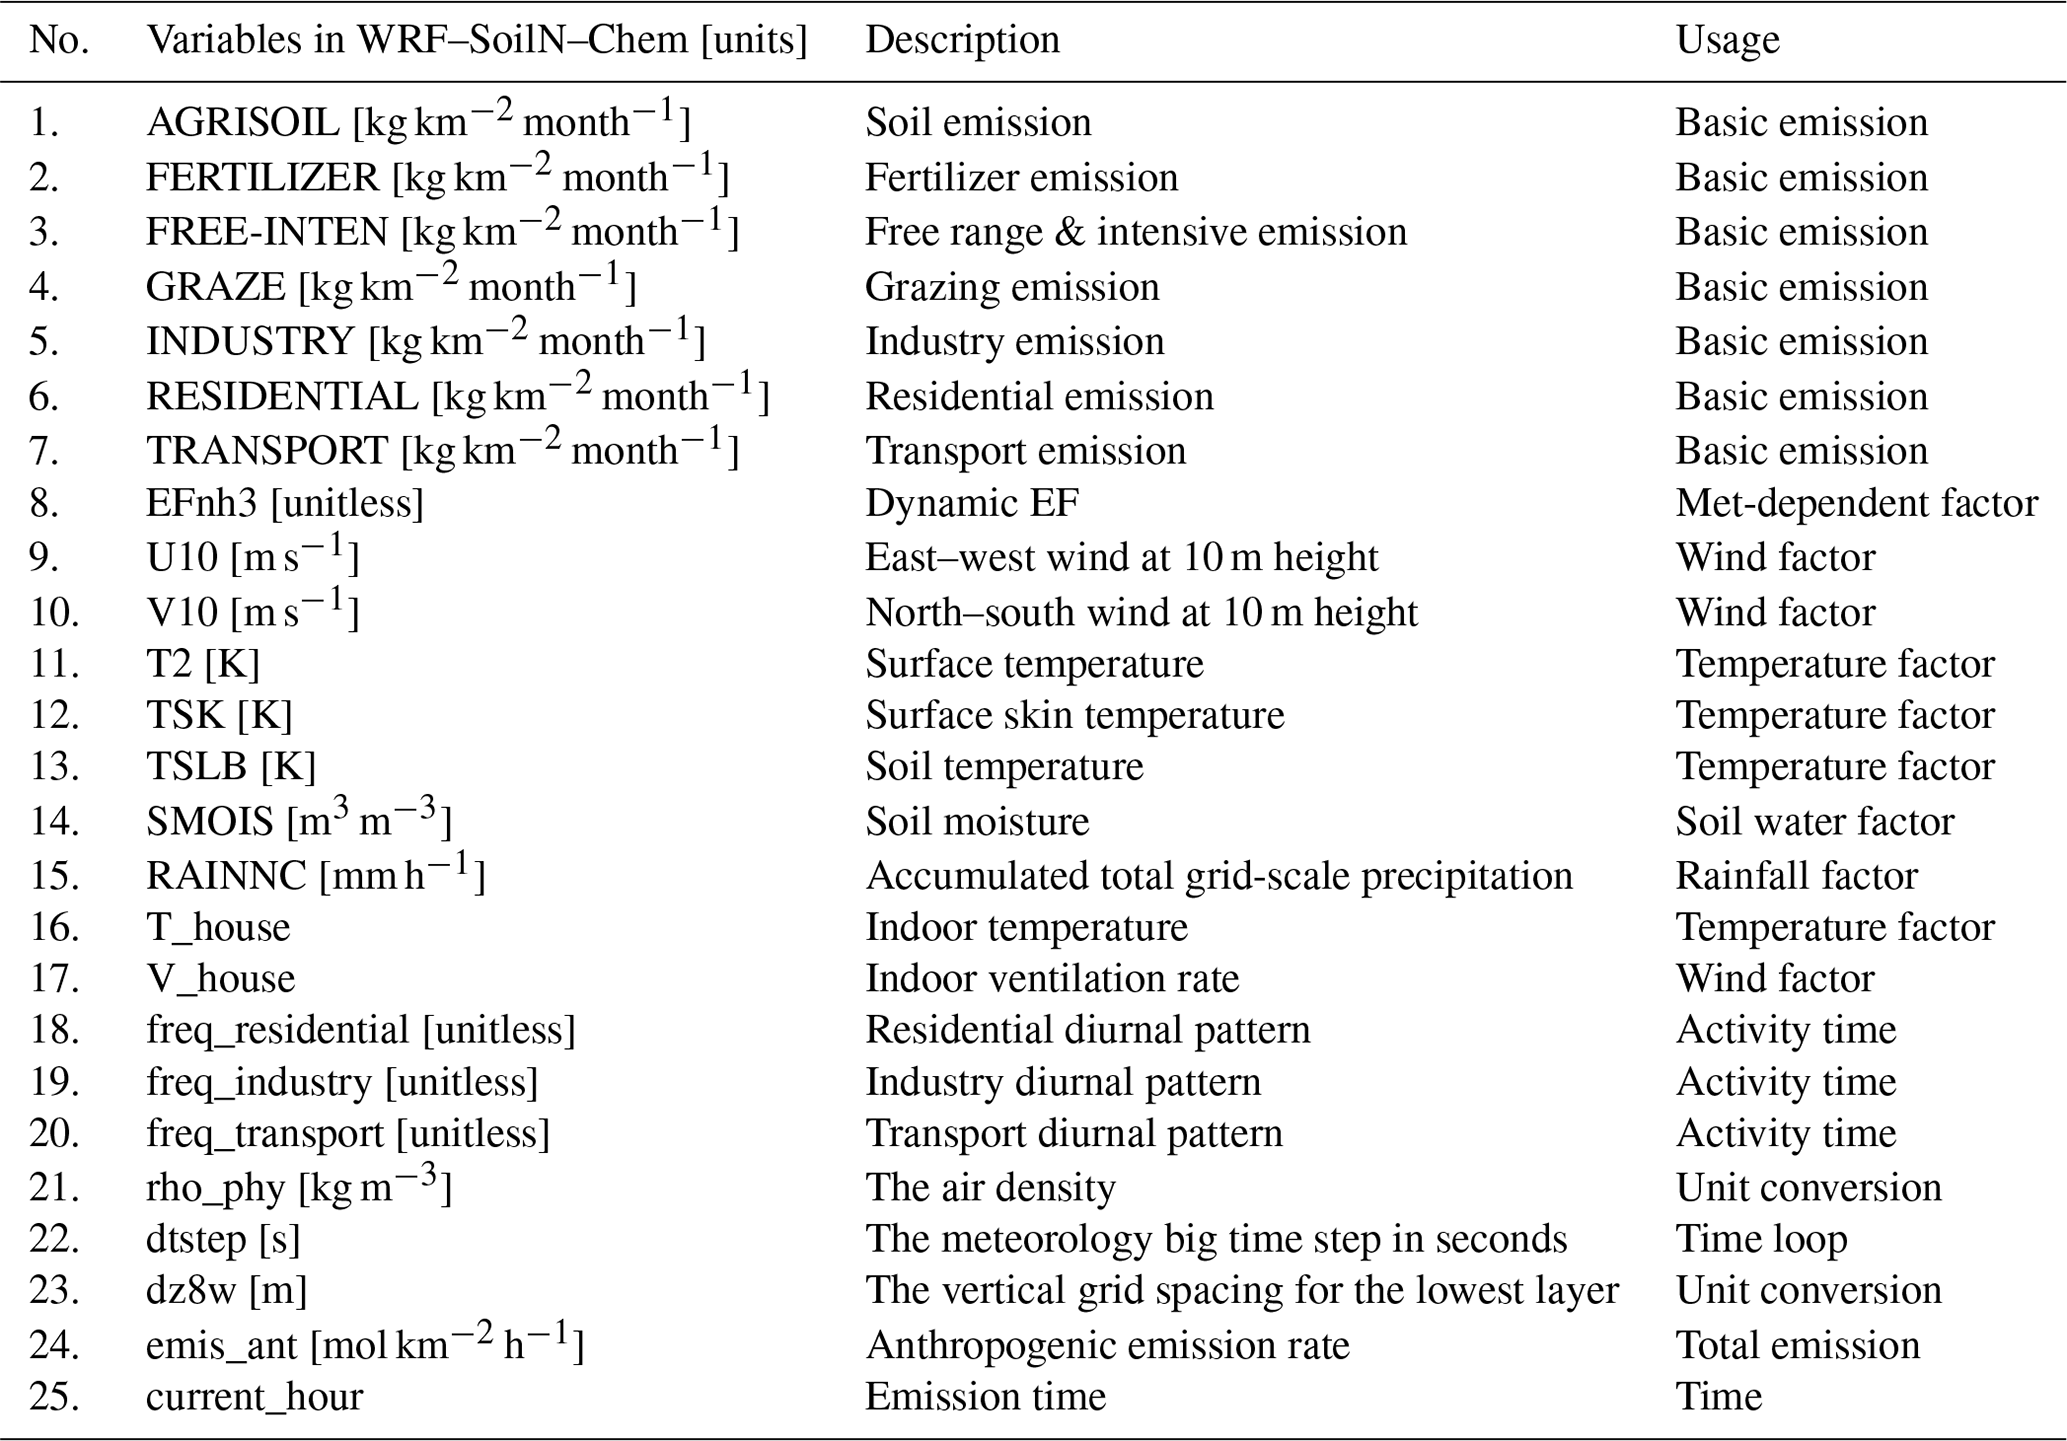
where represents the basic emission presented in Sect. 2.3; CFwind is the correction factor for wind speed; is the correction factor for soil temperature; is the correction factor for soil moisture content; and CFrain is the correction factor for rainfall. The detailed calculation of these CFs is presented in the following subsections, and Table 1 summarizes the relevant variables used in the WRF–SoilN–Chem model.
For livestock waste, we divided the NH3 emissions into three sections based on where the manure was located, including manure storage, outdoor, and housing. As for the manure storage section, 77 % of the manure will be used for composting, 23 % will be used for biogas production (Jia, 2014). Biogas is often placed in sealed tanks due to the need for an anaerobic environment. As for composting, the handling of a manure site should be “anti-seepage, rain-proof, anti-spillage” (Ministry of Agriculture and Rural Affairs, 2019), so people usually lay fine soil and straw on the ground and spread a layer of mud or plastic sheeting on the manure or just compost the manure in a closed greenhouse, so as to form a closed environment to avoid the influence of external temperature, wind speed, and precipitation. Thus, we assume that NH3 emissions from the storage section are not affected by the outdoor environment and therefore do not need to be corrected.
For outdoor farming such as grazing and free range and the application of manure into a field, the excreta were directly deposited in the open air without any treatment. Since the emissions are directly affected by local atmospheric conditions, the estimation of outdoor emissions is the same as above for fertilization:
where Basic (Eoutdoor) represents the basic emission from outdoor livestock waste, including outdoor grazing in daytime, outdoor free-ranging, and manure spreading onto the field.
For the housing section, since animals are farmed in buildings, NH3 emissions are directly affected by indoor temperature and ventilation rate. To maintain a healthy environment inside the animal house, a suitable ventilation rate and temperature are required. Specifically, when the outside temperatures drop below a certain level, farmers usually install manual heating to maintain stable temperatures to prevent the decline of animal production. When the outside temperature reaches a maximum level, the mechanical ventilation system is opened to maintain the temperature inside the animal house close to the recommended temperature (Gyldenkaerne et al., 2005). To keep the house clean and animals comfortable, the floor of the farmhouse often has holes or slits to allow the leakage of manure onto the soil below, making the manure easy to be swept away by cleaning machines. So, the manure is still in touch with the soil and therefore will be affected by surface soil moisture:
where Basic (Ehouse) represents the basic emission from animal houses, including indoor grazing at night and intensive rearing. The indoor wind speed and temperature are calculated according to outdoor weather conditions, and the detailed calculation methods were reported by Gyldenkaerne et al. (2005).
2.4.1 Wind speed
Increasing wind speed increases the rate of ammonia volatilization by promoting the rapid transport of ammonia away from the surface. Denmead et al. (1982) suggested that the enhanced volatilization at higher wind speeds is due to better mechanical mixing of the N solution in the soil, which replenishes ammonia in the layer next to the surface. Moreover, Denmead et al. (1982) found an exponential relationship between the transfer velocity for ammonia and wind speed. After testing and comparing several published approaches, we followed the approach of Gyldenkaerne et al. (2005) to introduce the effects of wind speed on NH3 volatilization from synthetic fertilizer and manure application. The correction factor of wind speed is
where WS is the surface wind speed (m s−1).
2.4.2 Soil temperature
Temperature is the most important meteorological parameter that affects the partial pressure of NH3 in soil by changing the equilibrium constant of the NH(soil)–NH3(soil)–NH3(gas) equilibrium reaction. Several studies have noted an increase in emission from N fertilizers and livestock waste with increasing temperature, and revealed the empirical volatilization rates as functions of air temperatures (Sommer et al., 1991; Pedersen et al., 2021). Mcinnes et al. (1986) reported that diurnal patterns of NH3 loss coincided with fluctuations in soil temperature and water content. However, after our tests, we found that the published relationship can hardly reflect the diurnal pattern of the ammonia flux. Thus, the effects of soil temperature and in situ measurements of NH3 flux conducted by our research group in a typical cropland were involved to derive the CF for synthetic fertilizer and manure emissions in this study. The deriving method and fitting results are demonstrated in Fig. S1. The exponential fitting of is
where ΔsoilT is the soil temperature gradient, and it can be represented by the difference between the soil temperature of 5 cm and surface skin temperature (K); soilT is the soil temperature (K) at a depth of 5 cm.
2.4.3 Soil water
The soil moisture content is also an important factor controlling ammonia loss. The presence of water in soil is a prerequisite for dissolution of fertilizer N as well as for the hydrolysis of urea, leading to the conversion of other forms of N to ammoniacal N in soil solution. Ammonia volatilization can also be enhanced where water evaporates from the soil surface. On the other hand, if the soil moisture content is high, the concentration of NH in solution will be low due to dilution and NH3 volatilization should be reduced. Ferguson and Kissel (1986) and Fenn and Kissel (1976) also found that ammonia loss was low when soil moisture was at the extremes. Experiments from Maru et al. (2019) showed that the moderate amounts of soil moisture content were around 50 %, where the NH3 emission reached a peak at this turning point (Maru et al., 2019). Considering the complex effect of soil moisture, we followed the approach of Lian et al. (2021) to introduce the two kinds of effects on NH3 volatilization. The correction factor of soil moisture is
where soilm represents the soil water content (m3 m−3) at a depth of 5 cm.
2.4.4 Rainfall
As NH3 readily dissolves in water, NH3 flux can be scavenged by raindrops near the surface (Delitsky and Baines, 2016; Shimshock and De Pena, 1989). Several studies reported that rainfall events after fertilizer application can influence the maximum potential emission of NH3 in the field (Parker et al., 2005; Smith et al., 2009). Wind tunnel experiments from Sanz-Cobena et al. (2011) showed that the addition of 7 and 14 mm of water to the soil, immediately after urea fertilizing, reduced NH3 emission by 77 % and 89 %, respectively. We derived a relationship between emission rate and rainfall for agriculture emissions based on the available native experimental data (Longhini et al., 2020). The correction factor of rainfall is
where rainfall refers to the precipitation (mm h−1) simulated from the WRF model.
Table 1Meteorological and activity variables required to drive WRF–SoilN–Chem.
2.5 Observational data for model validation
2.5.1 NH3 field measurement flux
A set of 17 d (11–27 October 2012) of NH3 flux data from field measurements were used to validate the model. Huo et al. (2015) conducted a field-scale experiment in the spring of 2012 at a winter wheat cropland, quantifying NH3 emissions from surface fertilization under realistic cultivation conditions. In the field, three types of fertilizers (i.e., urea, ammonium sulfate, and compound nitrogen–phosphorous–potassium fertilizer) were used and the fertilization lasted about 20 d for hundreds of divided plots, which have great representation for the agricultural situation in the North China Plain (NCP). The NH3 concentrations were continuously measured at two heights (2.5 and 8 m) by Picarro (G2103) and the Inverse Dispersion Method (IDM) was employed to derive the heterogeneous NH3 emissions rate. Besides the NH3 flux, ancillary environment measurements of air temperature at 2 m, soil temperature at 0.05 m underground, wind speed, and soil water content were also taken. The total input N for urea, nitrogen–phosphorous–potassium, and ammonium sulfate are averaged as 140, 117, and 122 kg N ha−1, respectively. The details of the measurement procedure are described in Huo et al. (2015).
2.5.2 Long-term NH3 concentration in Beijing and Nanjing sites
Continuous measurements of NH3 and NH concentration located in the Beijing and Nanjing sites of 2019 were used to evaluated the NH3 simulation. In both sites, the hourly NH3 and NH were measured by Monitor for AeRosols and GAses in ambient air (MARGA, Metrohm Ltd., Switzerland). In Beijing, the observation is conducted at the Chinese Research Academy of Environmental Sciences (CRAES) (40.05∘ N, 116.42∘ E). In Nanjing, the site is located in the Station for Observing Regional Processes of the Earth System (SORPES) at the Nanjing University Xianlin Campus, which is a regional background station in the western part of the Yangtze River Delta (YRD) region (32.11∘ N, 118.95∘ E) (Ding et al., 2016).
2.5.3 Spatial distribution of NH3: IASI and NNDMN
Observations of the NH3 spatial distribution from space and ground stations were used in this study. Tropospheric vertical column densities (VCDs) of NH3 were derived from the measurements of the infrared atmospheric sounding interferometer (IASI) on board MetOp-A (Van Damme et al., 2015, 2017; Clarisse et al., 2009). We determined the monthly averages of the NH3 column concentrations over eastern China during 2019, based on the relative error-weighting mean method (Van Damme et al., 2014). Surface NH3 concentrations in the Nationwide Nitrogen Deposition Monitoring Network (NNDMN) including 43 observation stations were used to compare with simulations. The land types of the NNDMN sites cover cities, farmland, coastal areas, forests, and grasslands. Measurements during the period from January 2010 to December 2015 by the NNDMN were used. Surface NH3 concentrations were measured using an active DELTA (DEnuder for Long-Term Atmospheric sampling) system(Flechard et al., 2011).
3.1 Modeling configuration for estimating China's ammonia emission
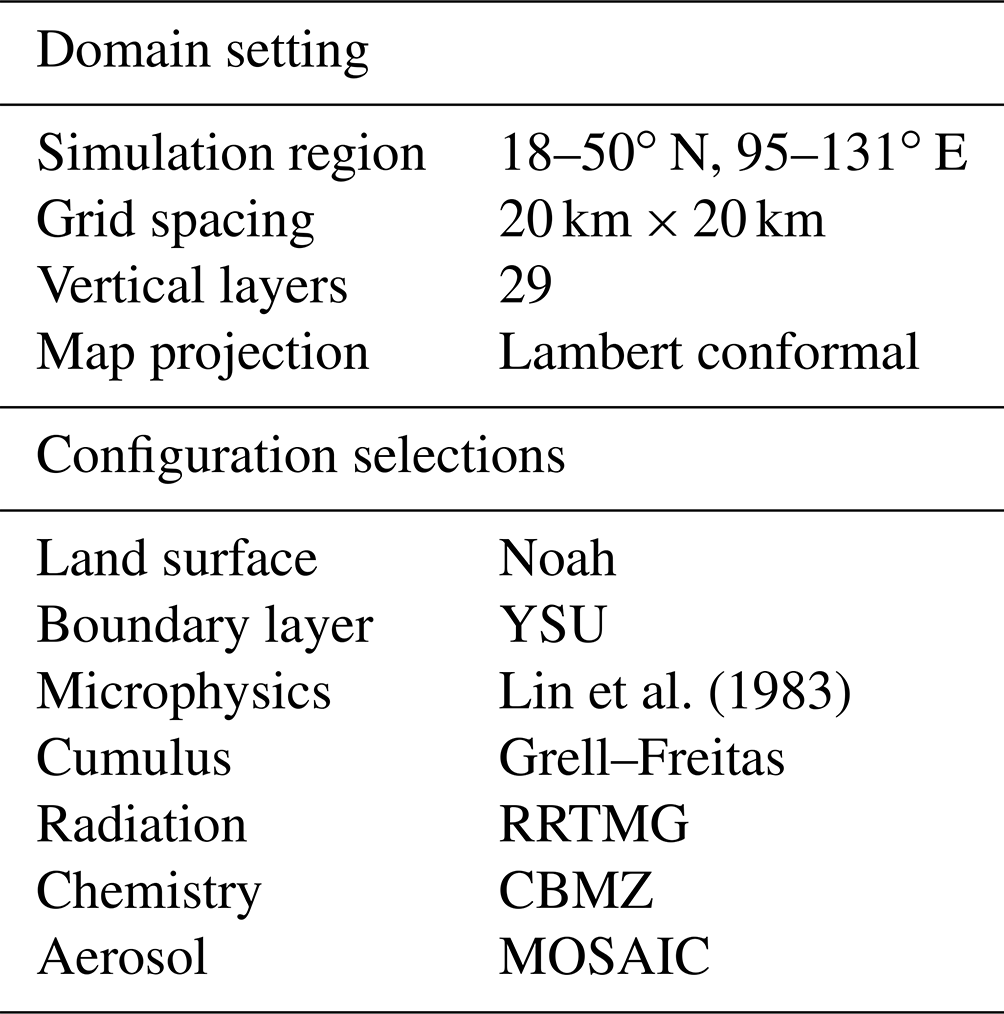
To evaluate the dynamic NH3 flux model and figure out the aerosol response to the dynamic NH3 emission, we designed a pair of parallel experiments by using WRF–Chem. The simulation with the coupled dynamic model is referred to as the “online” experiment, while the simulation without the dynamic model is referred to as the “base” experiment. The base simulation used monthly country-level NH3 emission based on the MEIC NH3 inventory, which is described by Huang et al. (2012). The comparison of online emissions and fixed MEIC NH3 inventory map are shown in Fig. S2. Other anthropogenic gas emissions from power plant, industrial, residential, and vehicle sectors were taken from the MEIC database (Li et al., 2017). Both experiments were run for the entire year of 2019, as well as some individual cases over the NH3 hotspot region in eastern China (18–50∘ N, 95–131∘ E) with 20 km grid resolution. For 2019, the running time is from 10 December 2018 to 31 December 2019, each run covered 24 h and in the last hour, chemical outputs from the preceding run were used as the initial conditions for the following run. The first 20 d were regarded as the model spin-up period for atmospheric chemistry, so as to better characterize aerosol distributions and minimize the influences of initial conditions and allow the model to reach a state of statistical equilibrium under the applied forcing (Berge et al., 2001). The initial and boundary conditions of meteorological fields were updated from the 6 h NCEP (National Centers for Environmental Prediction) global final analysis (FNL) data with a 1∘ × 1∘ spatial resolution. The NCEP automated data processing (ADP) surface and global upper air observational weather data of wind, temperature, and moisture are assimilated to better characterize meteorological factors. The setting of each individual case is also the same as above.
The main configurations for the base and online experiments are listed in Table 2. A new version of the rapid radiative transfer model for general circulation model applications (RRTMG) was employed to depict the radiative transfer process for both short-wave and long-wave radiation (Iacono et al., 2008). The Noah land surface scheme (Ek et al., 2003) was used to describe the land–atmosphere interactions, implemented with the Yonsei University PBL scheme (Hong et al., 2006) to describe the diurnal evolution of the planetary boundary layer (PBL). As for cloud and precipitation processes, the new Grell–Freitas cumulus ensemble parameterization (Grell and Freitas, 2014) along with Lin microphysics (Lin et al., 1983), accounting for six forms of hydrometers, were employed. The WRF simulation was thoroughly evaluated through comparison to comprehensive surface meteorology data and compiled in a publicly accessible report (US EPA, 2021). As for the Chem model, the Model for Simulating Aerosol Interactions and Chemistry (MOSAIC) (Zaveri et al., 2008) and the CBM-Z (carbon bond mechanism) photochemical mechanism (Zaveri and Peters, 1999) were used. The MOSAIC aerosol scheme includes physical and chemical processes of nucleation, condensation, coagulation, aqueous phase chemistry, and water uptake by aerosols.
3.2 Spatiotemporal pattern of ammonia emission in China
In 2019, the total atmospheric ammonia emission in China was estimated to be 12.67 Tg, and the emission density was around 1.32 Mg km−2. The total amount was approximately 3-fold that obtained for Europe (4.18 Tg) and contributed approximately 38 % of Asian NH3 emissions (Kurokawa and Ohara, 2020). Further, this estimated emission was relatively close to the improved emissions based on the Ammonia Monitoring Network in China (AMoN-China) and the ensemble Kalman filter (13.1 Tg) (Kong et al., 2019). The most important contributor is livestock manure management (5.25 Tg), accounting for approximately 41.4 % of the total budget. Next is the fertilizer application (5.09 Tg), which was responsible for 40.1 % of emissions. With high nitrogen content of about 46 %, urea fertilizer is the most widely used N fertilizer in China, accounting for 89 % of the total fertilizer. Regarding livestock waste, the free-range is the largest contributor (65.6 %) to livestock-waste-related NH3 emissions. Next is intensive rearing (approximately 30 %), which refers to the process of raising livestock in confinement at high stocking density. In this process, the farm operates as a factory. Grazing, a relatively less important system without additional feed supplementation, only dominates in the northern and western parts of China.

Figure 2Spatial distribution of ammonia emissions with a spatial resolution of 1 km × 1 km grid (kg yr−1).
The spatial distribution of NH3 emissions in 2019 is illustrated in Fig. 2. It is clear that the high emission rate concentrates in the Shandong, Jiangsu, Henan, and Hebei provinces and in eastern Sichuan. Shandong province has the highest NH3 emission density of 4.46 Mg km−2, which is 3 times higher than the national average. A multiple-cropping system is a widely applied agricultural practice in China and varies from region to region. Northeastern China is mainly a single-cropping area, with spring wheat as the main crop. The double-cropping area (∼27.74 % of total cropland area) is mainly distributed in the North China Plain (NCP), with a 25 624 000 and 5 754 000 ha area under cultivation of cereal crops and vegetables, respectively, is responsible for 49 % of the NH3 emissions from fertilization in China. Triple-cropping and limited triple-cropping systems are prevalent in southern China due to the tropical subtropical monsoon climate with high temperature and ample rainfall. With intensive cultivation, the cropping lands in the Guangdong, Fujian, Hunan, and Jiangxi provinces also show large NH3 volatilization. Paddy fields are common in this region, with early rice and late rice being the dominant crop and contributing the most emissions. The smaller emitters are mostly located in western China, with a minimal amount of arable land or low use of synthetic nitrogenous fertilizers.
The spatial distribution of NH3 emissions from livestock waste is similar to that from synthetic fertilizers, with high emission rates in NCP, eastern Sichuan, and western parts of Xinjiang province. Besides intensive agriculture fertilization, the Henan, Shandong, Hebei, and eastern Sichuan provinces are well-known for their large animal population. In Henan, Hebei, and Shandong, many kinds of animals are extensively bred like beef, dairy, pork, and poultry, providing approximately 0.38, 0.31, and 0.48 Tg ammonia emissions, respectively. Sichuan province is also a large emitter (0.30 Tg), with cattle and pigs as the main animals accounting for most emissions. In Xinjiang province, sheep are widely raised and responsible for remarkable ammonia emissions related to sheep manure management. Cattle are widely raised in northeast China and responsible for around 50 % of the NH3 emission in the Liaoning and Heilongjiang provinces.
The peak of NH3 emissions over NCP might be the joint result of intensive agricultural activities and environmental conditions like high soil pH and wind speed and less rainfall. In China, the soils in the NCP are mainly neutral (pH 6.5–7.5) or alkaline (pH >7.5), and soils distributed in southern or northeastern China are mainly acid soil (pH 5.5–6.5) or strong acid soil (pH <5.5). The NH3 volatilization increases significantly with an increase in soil pH, due to the high potential for NH3 emission (Ryan et al., 1981). Thus, the relatively high pH in northern China is another key reason for the large flux in the NCP. Besides soil acidity, NH3 volatilization increases exponentially with wind speed. Spatially, northern China features frequent strong wind. The annual mean wind speed varied from 4.64 m s−1 in northeastern China to 3.55 m s−1 in southern China (Liu et al., 2019). Higher wind speed leads to a rapid NH3 release from soil to the atmosphere, which may contribute to the high ammonia emissions in the northern part of China. The annual mean meteorology-dependent dynamic CFs over eastern China are shown in Fig. S2a. For both northern China and northwest China, the CFs are greater than 1, indicating that meteorological conditions in the north are more conducive to ammonia emissions.
In addition to great regional disparities, China's NH3 emissions are also characterized by obvious seasonality. The monthly variation in Fig. 3 clearly indicates that the emissions were primarily concentrated from April to September due to the intensive agricultural activities and high temperature. In China, the new spring seeding generally begins in April. During this period, spring wheat, soybeans, and cotton are sown in the single-cropping area with a large amount of N fertilizer applied to the cropland as the base fertilizer. In the following 1–2 months, due to the application of top fertilizer and warming air temperature, NH3 emissions tend to continuously increase to August. From summer on, the winter wheat–summer maize rotation system begins in the NCP. The winter wheat–summer maize rotation system has been practiced as a characteristic farming practice, producing about 60 % of the total wheat and 33 % of the total maize production in China (Zheng et al., 2021). There are two cropping cycles for the NCP region, beginning in summer and late-autumn, respectively. June to August is one of the main cropping periods in the NCP, with the sowing, basal dressing, and top dressing of summer maize. The seeding and basal dressing of winter wheat begin in mid-September and the top dressing is applied 2 months later, which could be responsible for the high emission rate during the autumn season. Meanwhile, in southern China with a large triple-cropping area, fertilization of early and late rice was carried out intermittently from April to mid-October. Most of the crops begin to harvest in autumn, which leads to a declining emission thereafter. Different from the hot seasons, because of less NH3 volatilization related to lower temperatures and relatively rare cultivation during winter, the NH3 emissions decreased to one-third of summer levels.
Figure 3 also shows that the monthly national average NH3 emissions in China features obvious day-to-day variation with large disparities between the 10th and 90th percentiles, especially during hot seasons. Such a large discrepancy in daily emission rate could be attributed to the highly fluctuating daily weather condition and the associated meteorological parameters throughout the year, and the existence of the summer monsoon makes China have more obvious daily emission changes in summer. However, the fixed NH3 emission inventories that are widely utilized currently assume no daily variation of emission rate, and thus could not represent the day-to-day variation of emission rate under real weather conditions.
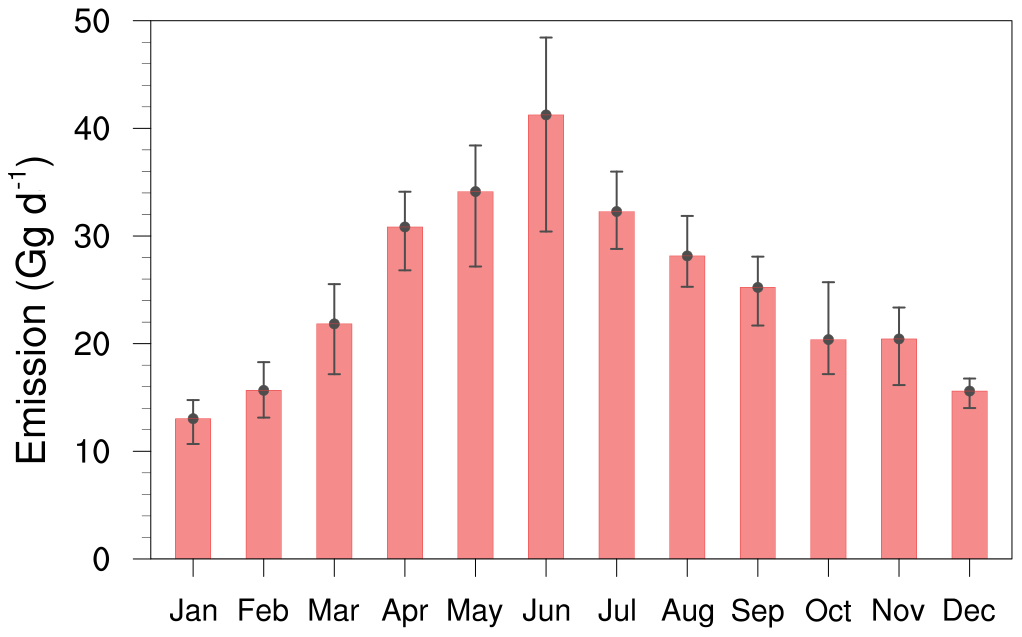
Figure 3Seasonal pattern of averaged daily ammonia emission in eastern China (18–50∘ N, 95–131∘ E). The lower and upper points of vertical lines show the 10th and 90th percentiles, respectively.
3.3 Comparison of hourly emission flux with field experiments
The most important advance of this model is the online calculation of the highly time-resolved emission rate. Available NH3 emission flux at high temporal resolution was also collected to further validate the model. Air–surface exchanges of NH3 were measured over a fertilized wheat canopy in the spring of 2012 in Hengshui, China. In the field, different plots of the cropland were cultivated by different farmers and the fertilization practices were conducted plot by plot. Ammonia flux measured from this kind of realistic cultivation conditions can represent real agricultural emissions in the NCP. The high temporal resolution variations of measured NH3 flux and simulated flux are shown in Fig. 4. The mean observed and modeled fluxes during this period were 0.38 and 0.63 kg km−2 h−1, respectively. In Fig. 4a, during 16–17 October, the flux significantly decreased during the experiment for the duration of the rain. A similar tendency of low NH3 flux during rainy days was found during observations, as reported from other studies (Osada, 2020; Roelle and Aneja, 2002). Increased contents of soil pore water dilute NH in the liquid phase and inhibit its evaporation as NH3. Furthermore, wet surfaces of cuticular leaves absorb ambient NH3 under high relative humidity during rain. The model was able to reproduce the low emission during the rain. In Fig. 4b, the online dynamic model agrees well with the diurnal field flux for the median values, while the 95th percentiles are much lower during the daytime. The model captured the observed diurnal trends well with emissions dominating during the day, generally peaking at around the time of the maximum daily air temperature (12:00–14:00 LT). However, the model seemed to overestimate the measurements during the late morning when the measurements were dominated by deposition. Since the model only estimates unidirectional emission fluxes, the major deposition flux during 09:00–10:00 LT is not included in the model results, which leads to the overestimation of net emission flux by the model.
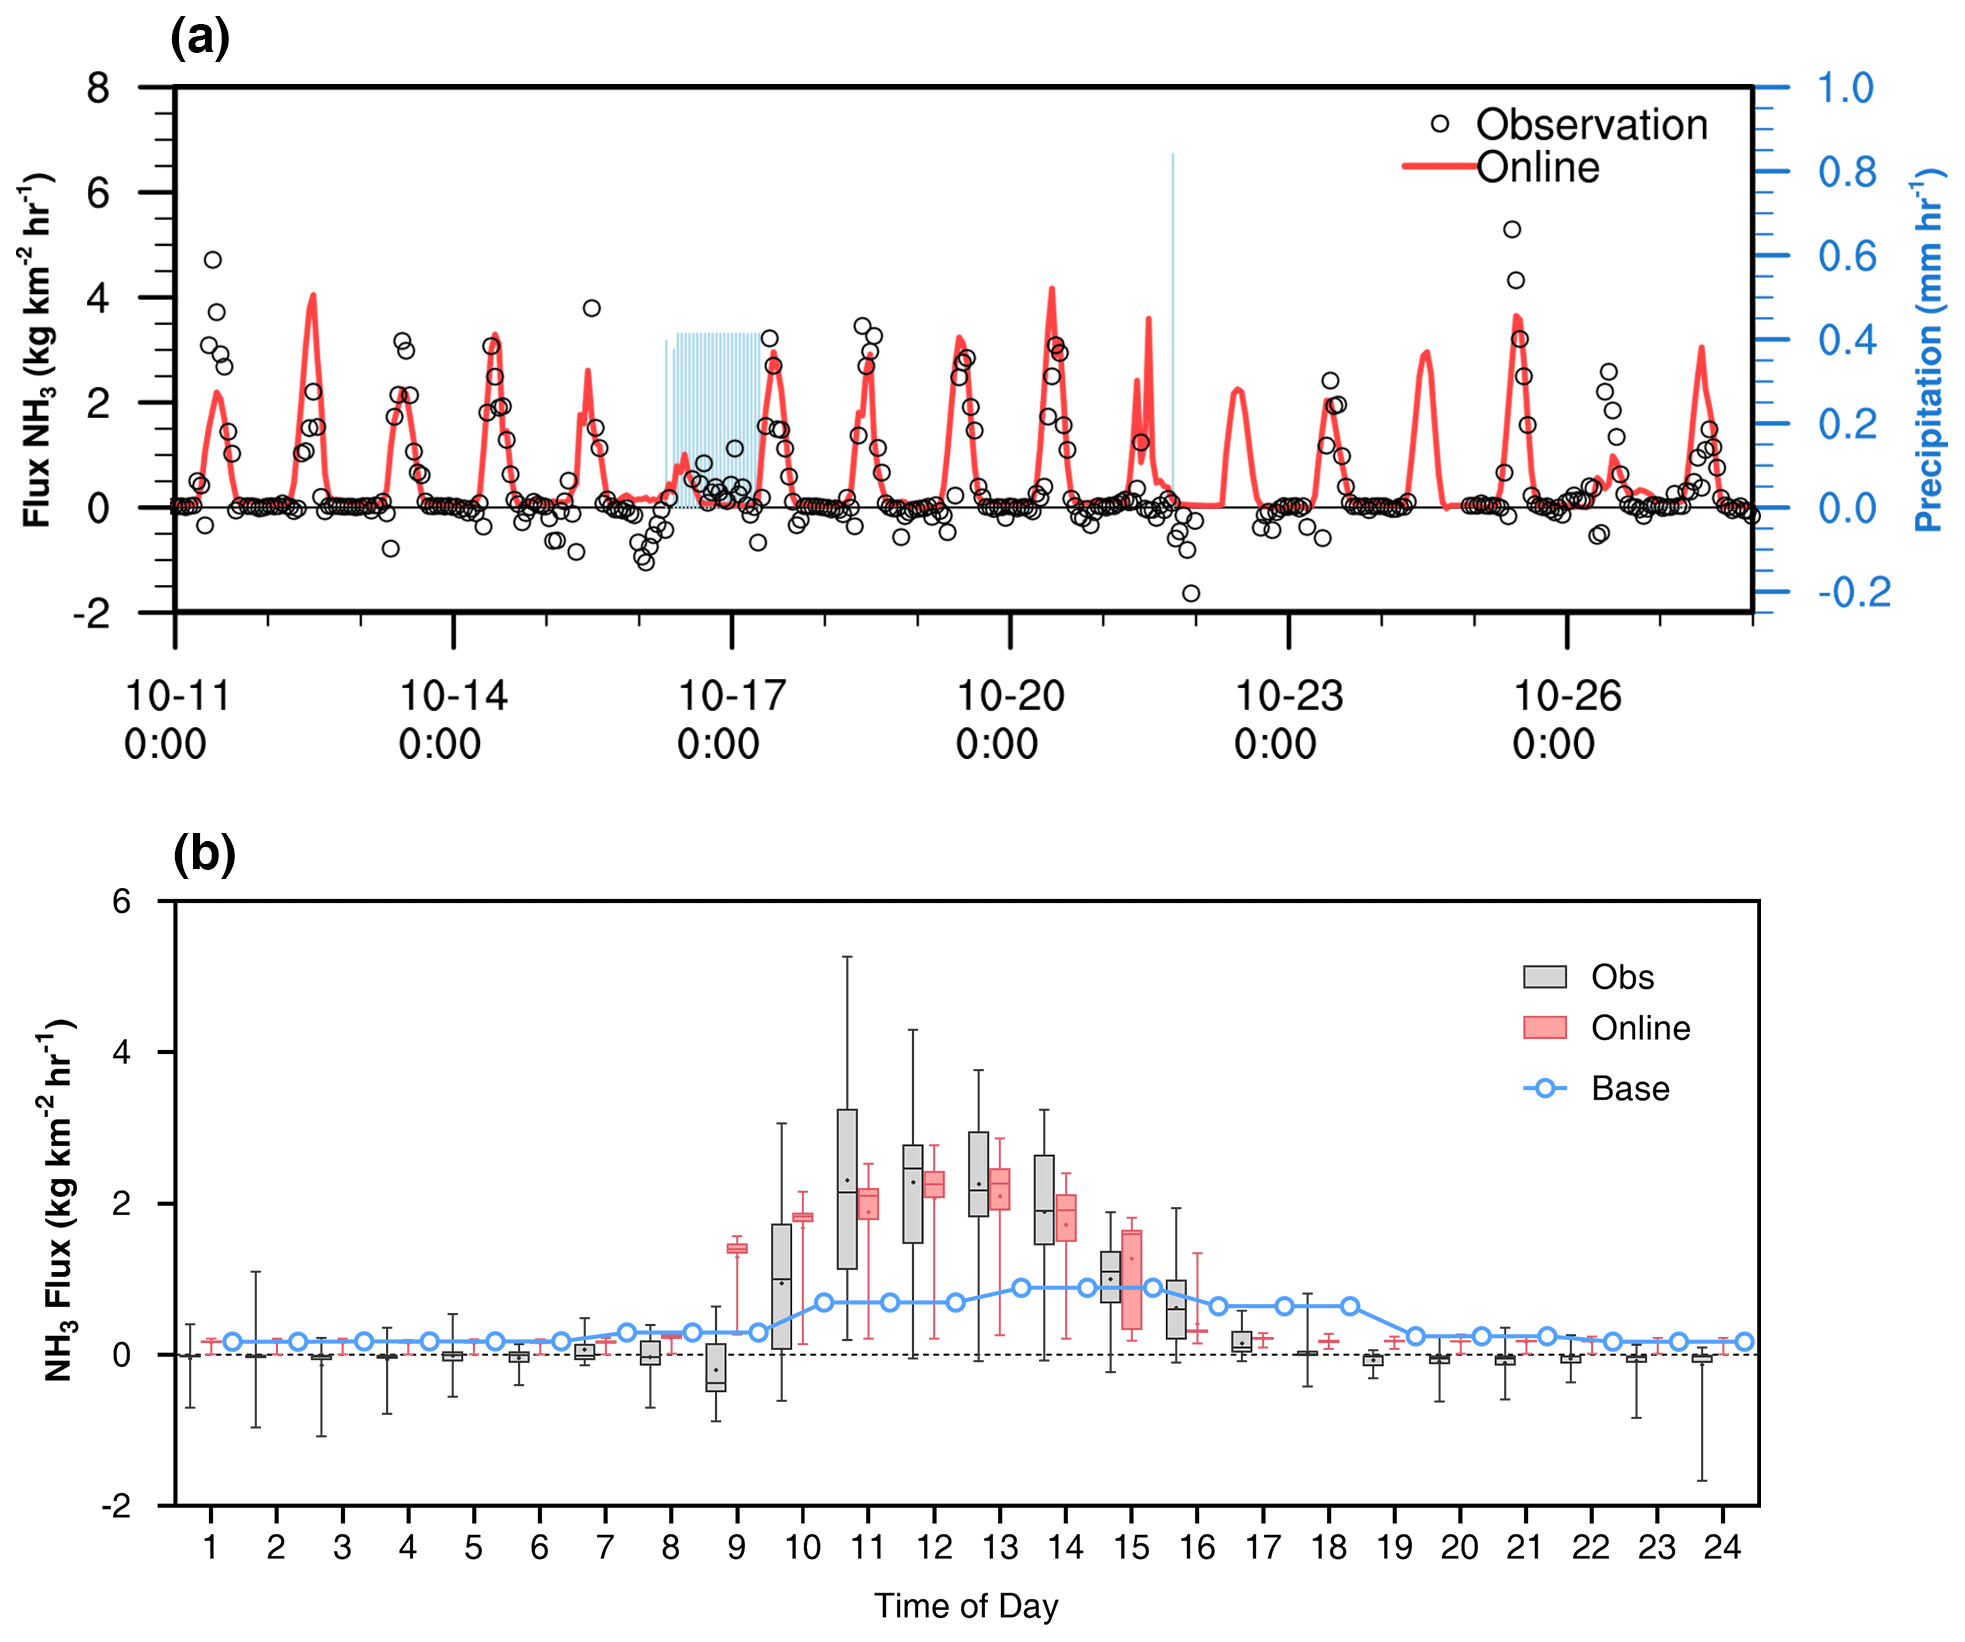
Figure 4(a) Time series of observed (black symbol) and WRF–Chem online model NH3 flux (red line) above the agricultural field in Hengshui, China from the 11 to 27 October 2012. (b) Diel hourly box plots of observations flux measurements (gray), paired with online model results (pink) and base model results (blue). The 5th and 95th percentiles are represented by the whiskers, the 25th and 75th quantiles are enclosed in the box, the median is represented by the horizontal line through the box, and the mean value is the dot in the box. Diurnal profile of emissions from agriculture is applied in the base experiment following Du et al. (2020).
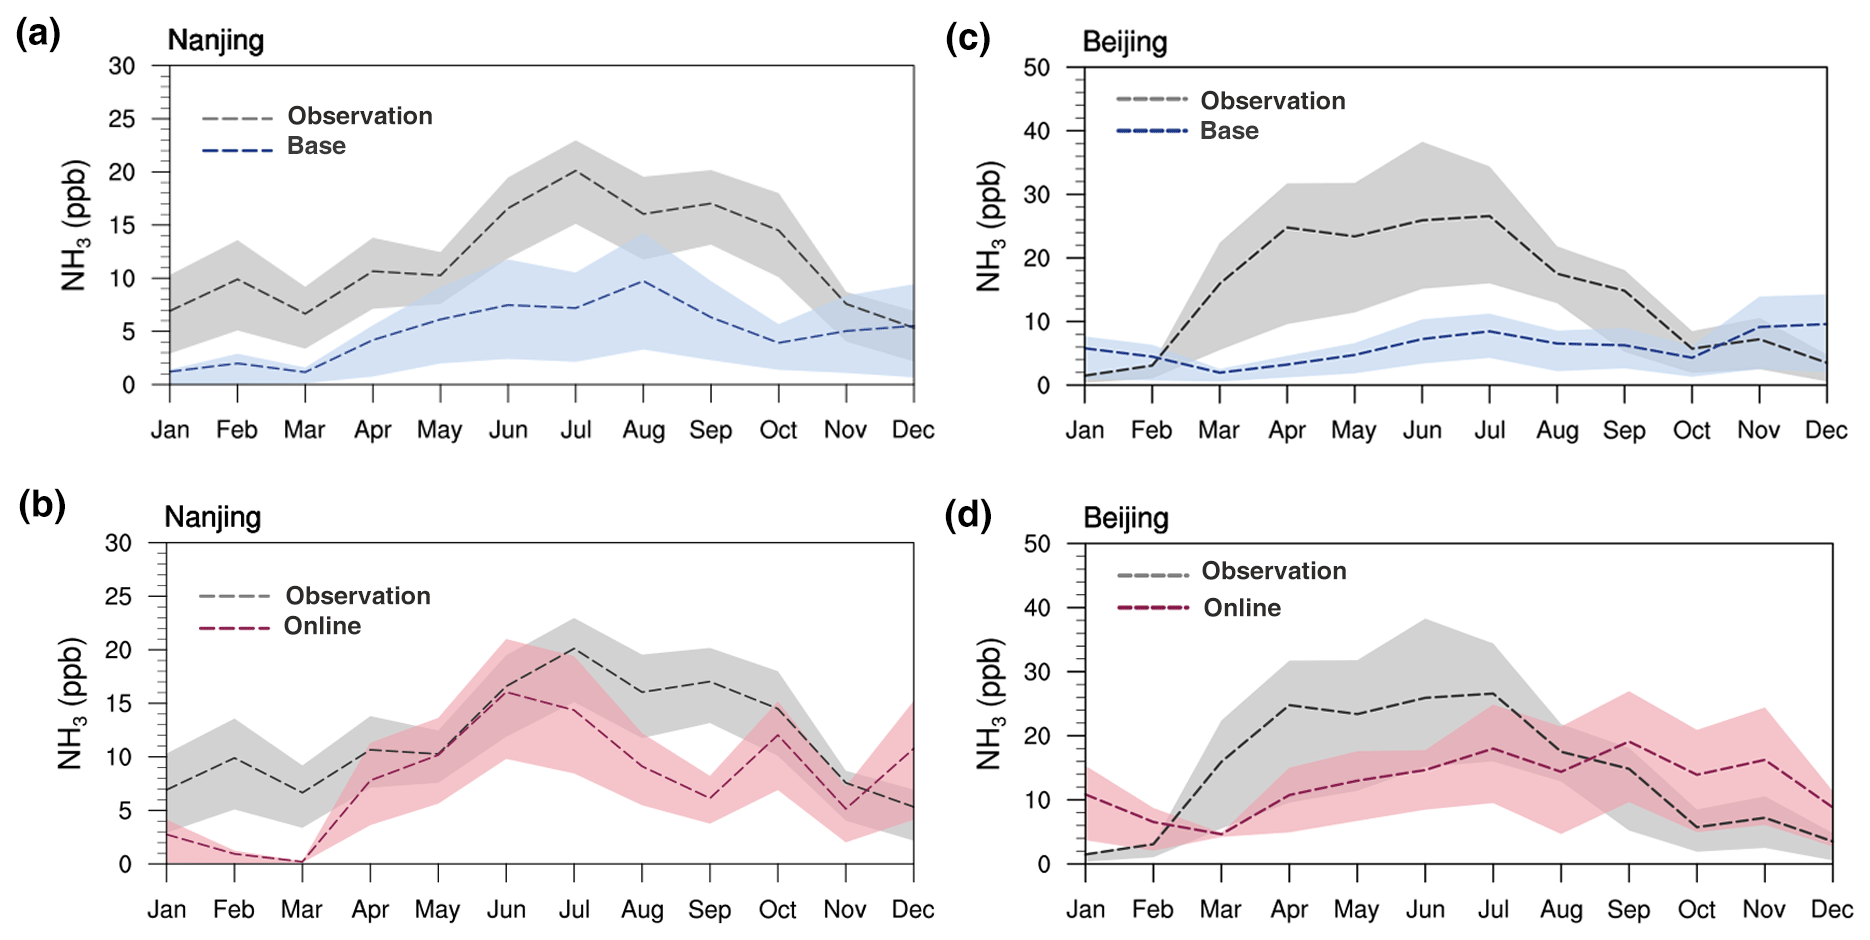
Figure 5Monthly average ammonia concentrations at the 2019 Nanjing site for base (a) and online (b) model runs and measurements locally. The dashed lines indicate mean values. Lower and upper ends of the filled area indicate the 25th and 75th percentiles of each distribution. Panels (c) and (d) are in the Beijing site.
Due to weather change during the experiment, the diurnal NH3 emissions varied considerably with the large disparities between 5th and 95th percentiles, although at the same time of day. Despite the underestimation of the 5th percentiles, online emission results have obvious distribution with at least 25 % overlap with observation for each hour. However, fixed inventory used in the base simulation are monthly and has no diurnal variation of emission. To integrate this inventory into the WRF–Chem simulation, we adopted a diurnal profile with 80 % of NH3 emissions in the daytime, following previous studies (Du et al., 2020). Obviously, the single-line diurnal variation of the base experiment is underestimated and could not represent ammonia emissions under real weather conditions.
3.4 Monthly variation of ammonia concentration and validation by in situ observations
The newly developed model in this work is capable of simulating varying NH3 emission rates with changing climate, and monthly variations in the emission rates are compared with available observations. Figure 5 shows the monthly average of ground-site NH3 with model results extracted at Nanjing and Beijing site locations. The observed NH3 variations at two sites clearly demonstrated a minimum in winter and a maximum in summer that reflect the enhanced emission in a growing season with higher temperature and denser fertilization. In the Nanjing site, the concentration of observed NH3 ranged from 2.2 ppb in December to 23.0 ppb in July, with the annual average of 11.8 ppb. The small peak in April may be partly explained by the local seeding and fertilization of early rice. However, for base simulation, the NH3 range was 0.02–14.26 ppb and the annual average was 4.99 ppb, which greatly underestimates NH3 concentrations, particularly for the warm season (e.g., May–September) (Fig. 5a). The base simulation NH3 increases slightly from March to May, unable to reproduce the peak in April at all. Compared to the base run, the model with online flux shapes better seasonal variation, and the April–July averaged concentration has a similar magnitude as the observed NH3 values (Fig. 5b). The interquartile ranges (shed width) are closer to the observations, and the proportion of overlaid area between observed and online shadows is reaching about 50 %, which is significantly larger than the base. Besides, the online experiment can capture the small peak in April with similar magnitude. For the Beijing site, the annual level of NH3 is 14.2 ppb, which is higher than that in the Nanjing site. This is consistent with the higher emission in the northern region as opposed to the southern region. The observed NH3 concentration exhibits a large increase from 0.4 in January to 38.3 ppb in June. In contrast, the base-simulated monthly ammonia concentration was almost flat throughout the whole year, which could not reproduce the observed significant seasonal variation at all (Fig. 5c). By comparison, online simulations notably narrowed the gap with observations, especially from March to September (Fig. 5d). The mean bias (MB) of NH3 simulation was 10.5 and 8.2 ppb for the base and online experiments, respectively. However, for the winter seasons, from October to January, the online experiment overpredicts NH3 at the Beijing site by an average of 95 %. This overestimation may be due to the meteorological or chemical simulation bias from WRF–Chem (Du et al., 2020; Liu et al., 2021) since both online and base experiments show overestimations of the Beijing site in winter.
3.5 Evaluation of spatiotemporal pattern by monitoring network and satellite retrievals
To better validate the model performance on the spatial and temporal pattern of NH3 emissions, we then collected NH3 concentration measurements across China and compared them with the corresponding result from the WRF–SoilN–Chem model. Ideally, the model results and observed data should be in the same period in 2019. However, NH3 is not routinely measured at national networks, so there is a lack of published observations for the last 5 years in China. Since the main emission source of atmospheric NH3 and the activity level would not vary a lot in a short time, and the meteorological parameters for 2019 were closed to mean state of the multiple-year average for 2010 (Fig. S3), therefore, a database of atmospheric nitrogen concentration from the nationwide monitoring network (NNDMN) between 2010 to 2015 is used to evaluate the spatial pattern and magnitude of surface NH3 concentrations in China (Xu et al., 2019b). Figure 6 shows spatial plots of annual observed NH3 by the NNDMN and two sets of model results. In Fig. 6a, the base experiment underestimated NH3 concentration in areas with a high emission density. For instance, the NH3 concentrations in sites located in the southern region of Hebei province and the north of Shandong province were underestimated by ∼15 ppb. Besides, the base experiment cannot reproduce the high level of NH3 in the Pearl River Delta (PRD) region. Nonetheless, in southern China, the base experiments overestimated NH3 concentration by ∼5 ppb for the two northern sites in Hubei province. In Fig. 6b, the spatial accuracy of online experiment is better than that of the base fixed inventory. The online model well reproduces the overall pattern of high values in the NCP, the Sichuan Basin, and the PRD, with low values in other regions.
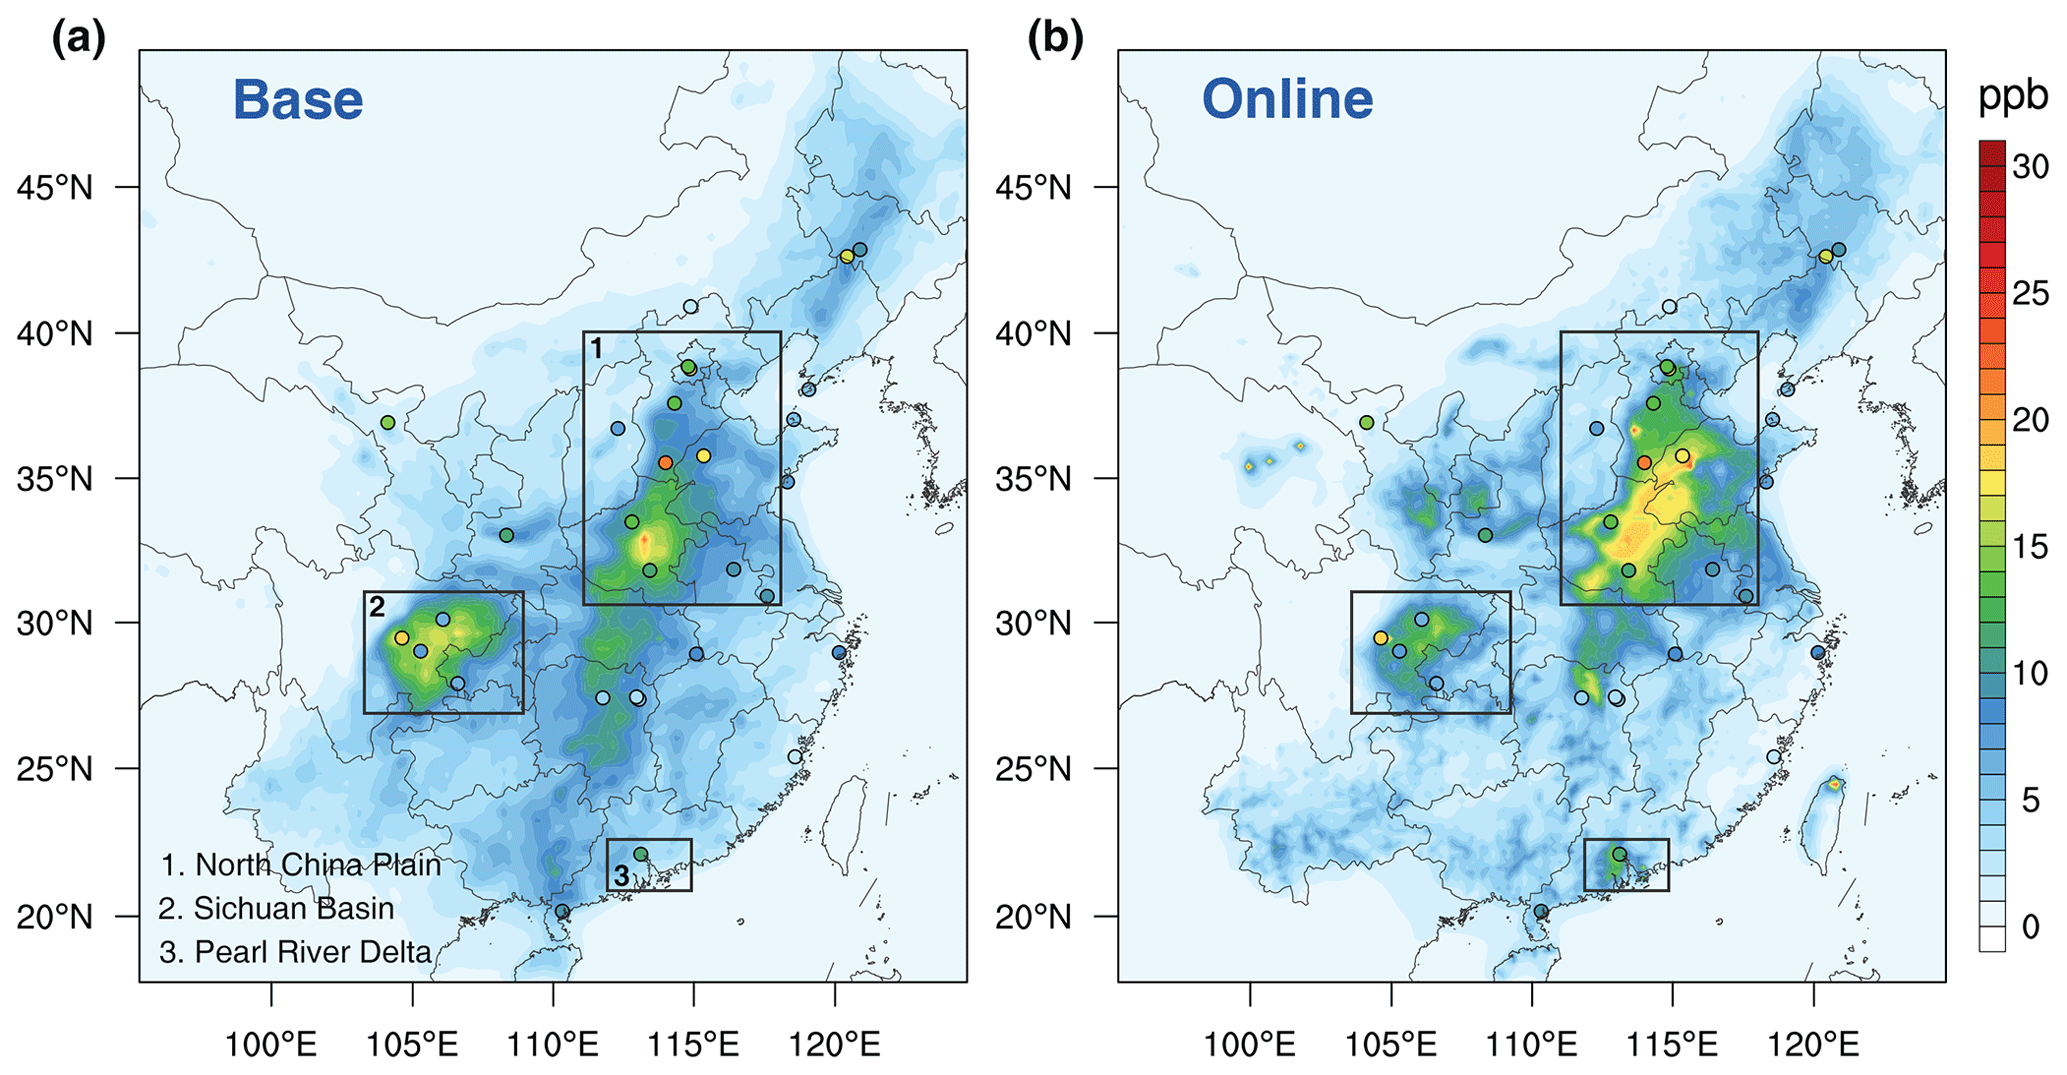
Figure 6Spatial patterns of annual NH3 concentrations over eastern China. The circles represent measured NH3 concentration at the Nationwide Nitrogen Deposition Monitoring Network (NNDMN), averaged for 2010–2015. The contour plots represent model NH3 in 2019 from the base experiment (a) and online experiment (b) of this study. The black rectangles represent the three focused regions in eastern China.
Additionally, the infrared atmospheric sounding interferometer (IASI-A), launched aboard the European Space Agency's MetOpA in 2006, has observed atmospheric NH3 at a global distribution and bi-daily resolution (09:30 and 21:30 local solar time). Here, we use morning observations when the thermal contrast is more favorable for retrievals (Van Damme et al., 2014). The monthly NH3 vertical column densities (VCDs) were determined based on the relative error-weighting mean method (Van Damme et al., 2014). The NH3 VCDs from the simulations were calculated by integrating NH3 molecular concentrations from the surface level to the top of the troposphere at 09:00 and 10:00 LT. As shown in Fig. 7, the online WRF–SoilN–Chem model was able to capture the general spatial distribution of NH3 VCDs, including the higher concentrations over eastern China relative to western China, as well as the hotspots over the NCP and the Sichuan Basin. As for temporal variation, monthly average NH3 concentrations from online runs compared to the IASI data showed similar seasonal cycles with highest concentrations in summer, which is consistent with the time of agricultural activities and high ambient temperature. However, the online experiment slightly underestimated the NH3 concentrations in spring (April) and winter (December) and a similar phenomenon was found by Li et al. (2021) and Liu et al. (2018). The difference between our model results and satellite-observed distributions could be attributed to the uncertainty of the NH3 emission model and biases of the satellite inversion algorithm. In the satellite VCDs algorithm, the relative error-weighting mean method always biases a high result due to the smaller relative error in a larger column (Van Damme et al., 2014).
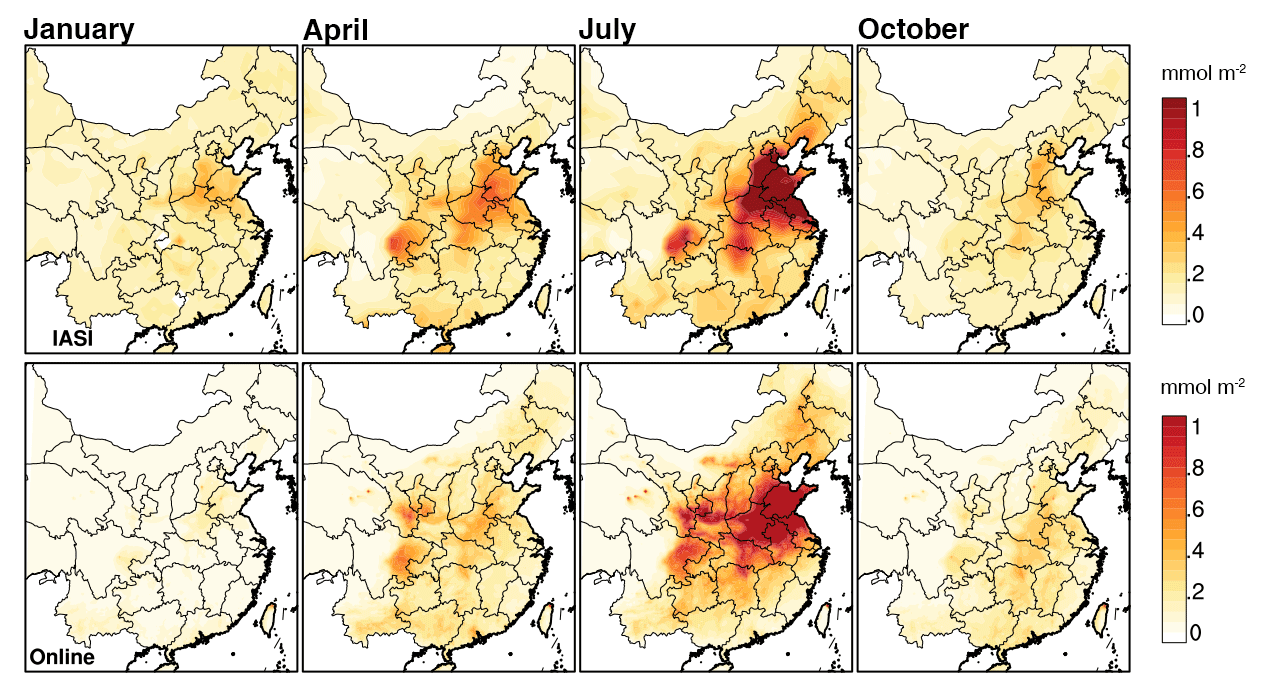
Figure 7Comparison of column NH3 concentrations between IASI satellite retrievals (upper row) and WRF–Chem online (lower row), averaged for January, April, July and October 2019.
3.6 Improved simulation of ammonia and secondary inorganic aerosol on synoptic scale
Once the gas ammonia is released into the atmosphere, some of them could actively participate in the atmospheric chemical reactions. As aforementioned, NH3 is a very important alkaline constituent in the atmosphere and is a key precursor to the neutralization of gaseous sulfuric acid and gaseous nitric acid in the atmosphere to form the secondary inorganic aerosols, like sulfate, nitrate, and ammonium, which contribute to ambient particulate matter. The amount that becomes aerosol ammonium (NH) depends on the concentrations of anions in the air, typically sulfate, nitrate, and chloride, which can form (NH4)2SO4, NH4HSO4, NH4NO3, and ammonium chloride (NH4Cl). Thus, an evaluation of ammonia flux would include both gas and aerosol forms (NHx= NH3+ NH). To investigate the response of NH3 emissions and aerosols to significant synoptic change, we choose two pronounced cases to evaluate the performance of the modified online model.

Figure 8(a) Time series of total ammonia (NHx) concentrations (gray bar) from 22 March to 11 April 2019 in the Nanjing site. The T2 (pink bar) represents the air temperature at 2 m ground level from the local site. (b) Daily NH3 emission rate, same as (a) in the Nanjing site. (c) Time series of NHx concentrations (gray bar) from 6 to 18 January 2015 in the Beijing site; Smois (blue bar) represents the top 5 cm thick layer soil water which is derived from the WRF model calculations. The mean bias of modeled concentrations is labeled as MB. (d) Daily NH3 emissions rate, same as (c) in the Beijing site. Blue lines represent the MEIC NH3 emission used in the base simulation, red lines represent online emissions from WRF–SoilN–Chem.
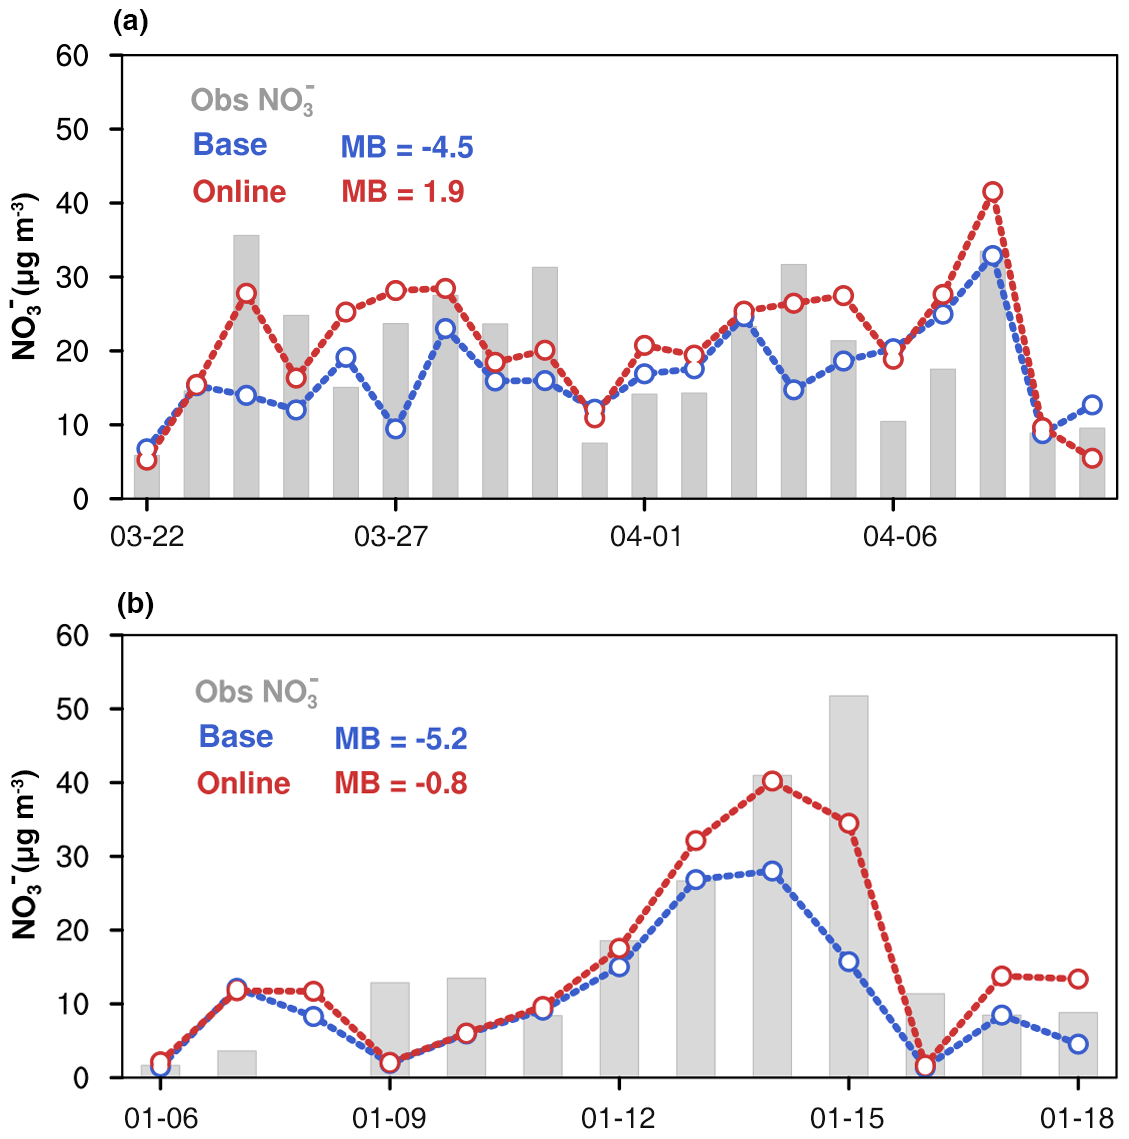
Figure 9(a) Time series of nitrate (NO) concentrations from 22 March to 11 April 2019 in the Nanjing site. (b) Time series of nitrate (NO) concentrations from 6–18 January 2015 in the Beijing site. The gray bar represents the observation nitrate concentration, blue lines represent the nitrate concentration in the base simulation, and red lines represent the nitrate concentration in the online simulation.
Figure 8a shows a typical case of NHx episodes from 1 April to 8 April 2019 in Nanjing. There is a close association between the dramatic air temperature change and NHx surface level. To be specific, NHx concentration increased from 15 µg m−3 at air temperature below 10 ∘C to more than 30 µg m−3 at temperatures higher than 20 ∘C, suggesting a promotion effect of higher temperature to NH3 emission and NHx concentration on the surface. In online emissions, the NH3 emission flux also shows dynamic variation and the pattern is quite similar to the temperature and NH3 concentration (Fig. 8b). A similar phenomenon of a strong relationship between temperature and ammonia emissions has also been proved by previous laboratory experiments (Clay et al., 1990; Pedersen et al., 2021; Niraula et al., 2018). However, since the resolution of the offline inventory was only monthly, the emission intensity showed only monthly differences between March and April, which could not reproduce the variation of the daily dramatic emission rate at all. Overall, the model with meteorology-dependent mechanisms tracked the NHx variation trends well in the observation period and remarkably improved NHx simulations, with the MB decreasing from −9.5 to 0.7 µg m−3 in NHx concentrations. Figure 8c shows the soil moisture and measured NHx concentration variation from 1 to 18 January 2015 in the Beijing site. In this case, the local NHx concentration and soil moisture have similar variations with reaching peak together on 8 January and 15 January. The variation of the online ammonia emission rate also has a similar pattern to soil moisture (Fig. 8d). Without considering soil moisture's effect, the base simulation significantly underestimates the NHx peak concentration by ∼30 µg m−3. The online data can greatly capture the magnitude and temporal variation of NHx concentration with the MB decreasing from −12.4 to −3.1 µg m−3. As the precursor gas, the performance of the NH3 simulation directly affects the formation of simulated secondary inorganic aerosols like NO. In Nanjing and Beijing, the base experiment shows that nitrate aerosol was generally underestimated with a MB of −5 µg m−3 due to the lack of NHx (Fig. 9). The online model generally reproduced the observed nitrate concentration, with a small mean bias from −4.5 to 1.9 µg m−3 in the Nanjing case and from −5.2 to 0.8 µg m−3 in the Beijing case. Through the diagnostic analysis of WRF–Chem, the chemical reaction between NH3 and HNO3 was the main reason for the nitrate pollution in both cases (Fig. S4). That is to say, nitrate formation in this region is highly sensitive to the ambient NH3 availability. In both cases, the online emission rates were higher than base emissions and the nitrate and total ammonia better simulated, indicating that the traditional emission inventories may be underestimated. Comparison between fixed emission input and online emission modeling clearly demonstrates that the numerical description of highly time-resolved NH3 emissions has a superior performance on the magnitude and temporal variation of secondary aerosols.
We developed the WRF–SoilN–Chem (v1.0) model, which is an online coupling of the WRF meteorological model and dynamic NH3 flux model, to simulate meteorology-dependent regional NH3 emissions at high spatiotemporal resolution. In this model, high-resolution basic emission data and meteorology-dependent parameterizations were implemented, and soil temperature, wind speed, soil moisture, and rainfall simulated from WRF were considered as the important factors in the parametrization to control NH3 emissions. This version can be easily implemented in other regional or global models and could serve as a tool for more precise and highly time-resolved estimations of the NH3 emission calculations.
The preliminary evaluation by multiple ground-based and satellite observations indicates that the WRF–SoilN–Chem model is able to better represent the spatiotemporal variation of surface NH3 concentrations over eastern China than the widely used offline MEIC NH3 inventory. We evaluated the model by field experimental data and monitored observations and satellite retrievals. Compared to the monthly offline inventory, this simple model well reproduced the diurnal variation of NH3 flux measured in the typical farmland. Our first application showed that the WRF–SoilN–Chem model was able to capture the magnitude of the spatiotemporal variation of NH3 surface and column concentrations over China in 2019. And this model has smaller biases in the simulation of ammonia at both the Beijing and Nanjing monitoring stations. The seasonal variations from the online calculation in the WRF–SoilN–Chem model are distinct and have similar patterns as observations which are characterized by high concentrations in summer and low concentrations in winter.
The consideration of meteorological factors makes the model more accurate for ammonia simulations under conditions of drastic weather changes. To be specific, the mean bias of NHx simulations during the Nanjing and Beijing case periods were −9.5 and −12.4 µg m−3, respectively, without the influence of the dynamic meteorological factor, reducing to 0.7 and −3.1 µg m−3 when considering temperature and soil moisture's effects. Besides, higher and precise NHx concentration favors the formation of nitrate by enhancing gas-particle conversion, reducing the mean bias of nitrate concentration from −4.5 to 1.9 µg m−3 and from −5.2 to −0.8 µg m−3 in Nanjing and Beijing, respectively. In general, with the meteorological-dependence mechanism, the online model can optimize the simulation of surface NHx and NO under dynamically changing weather.
Despite providing more accurate and high-resolution estimations of NH3 emissions, the current version of the WRF–SoilN–Chem (version 1.0) still has some limitations, including (1) the basic EFs that were assumed to be the same throughout the month. However, in reality, the soil pH and nitrogen content of the soil after fertilizer application usually increases rapidly under the hydrolysis of urea and gradually depletes, which leads to variation in EFs as well. So, the constant basic EFs could underestimate the peak emission after fertilization. (2) The meteorological CF parameterization scheme used in the model is the same for all agricultural soil. However, the emissions can be different from soils with the same water content but different porosity (soil water content at saturation), which is not considered in the model. (3) The gradual decay of NH3 emissions after fertilization is not added in the model because the specific fertilizer application date for each agricultural plot is not accessible. The model can be updated and further developed as more laboratory or field measurements data are accessible. The planned further improvements include (i) the option to use a bidirectional NH3 flux model based on a resistance approach; (ii) an update of the dynamic emission factor parameterization with more field experiment results; and (iii) the development of soil emission modules for other atmospherically reactive species, such as HONO and NOx. Such improvements could make the WRF–SoilN–Chem an increasingly useful tool to analyze NH3 emissions and its impact on air pollution and biogeochemical nitrogen cycling.
NH3 vertical column density data are freely available through the AERIS database: https://iasi.aeris-data.fr/NH3/ (Van Damme et al., 2017). The Nationwide Nitrogen Deposition Monitoring Network (NNDMN) data are publicly available in Xu et al. (2019b) and at https://doi.org/10.6084/m9.figshare.7451357 (Xu et al., 2019a). The standard WRF–Chem v3.9 is freely accessible to the public by following https://github.com/wrf-model/WRF/releases (last access: 1 June 2021; NCAR, 2019). The source codes of the dynamic NH3 emission model and input files about basic emission files that are presented in the article have been archived and made publicly available for downloading from https://doi.org/10.5281/zenodo.7134286 (Ren and Huang, 2022).
The supplement related to this article is available online at: https://doi.org/10.5194/gmd-16-1641-2023-supplement.
XH, YS, and TZ conceived the idea and guided the study. CR and XH did model construction, simulations, and wrote the paper. YS provided the field experiment and flux measurement. XL and ZW provided NNDMN monitoring data of ammonia concentration. All authors contributed to the writing and editing of this paper.
The contact author has declared that none of the authors has any competing interests.
Publisher's note: Copernicus Publications remains neutral with regard to jurisdictional claims in published maps and institutional affiliations.
The authors thank the anonymous reviewers for their incisive comments and technical discussions.
This work was supported by the National Natural Science Foundation of China (grant no. 41875150), the Ministry of Science and Technology of the People's Republic of China (grant no. 2022YFC3701105), and the Fundamental Research Funds for the Central Universities (grant no. 14380187).
This paper was edited by Christoph Knote and reviewed by two anonymous referees.
Asman, W. A. H.: Modelling the atmospheric transport and deposition of ammonia and ammonium: an overview with special reference to Denmark, Atmos. Environ., 35, 1969–1983, https://doi.org/10.1016/S1352-2310(00)00548-3, 2001.
Behera, S. N., Sharma, M., Aneja, V. P., and Balasubramanian, R.: Ammonia in the atmosphere: a review on emission sources, atmospheric chemistry and deposition on terrestrial bodies, Environ. Sci. Pollut. R., 20, 8092–8131, https://doi.org/10.1007/s11356-013-2051-9, 2013.
Berge, E., Huang, H. C., Chang, J., and Liu, T. H.: A study of the importance of initial conditions for photochemical oxidant modeling, J. Geophys. Res.-Atmos., 106, 1347–1363, https://doi.org/10.1029/2000jd900227, 2001.
Bouwman, A. F., Lee, D. S., Asman, W. A. H., Dentener, F. J., VanderHoek, K. W., and Olivier, J. G. J.: A global high-resolution emission inventory for ammonia, Global Biogeochem. Cy., 11, 561–587, https://doi.org/10.1029/97gb02266, 1997.
Bouwman, A. F., Boumans, L. J. M., and Batjes, N. H.: Estimation of global NH3 volatilization loss from synthetic fertilizers and animal manure applied to arable lands and grasslands, Global Biogeochem. Cy., 16, 102, https://doi.org/10.1029/2000gb001389, 2002.
Cai, G. X., Zhu, Z. L., Trevitt, A. C. F., Freney, J. R., and Simpson, J. R.: Nitrogen Loss from Ammonium Bicarbonate and Urea Fertilizers Applied to Flooded Rice, Fert. Res., 10, 203–215, https://doi.org/10.1007/Bf01049350, 1986.
Chen, D., Liu, Z., Fast, J., and Ban, J.: Simulations of sulfate–nitrate–ammonium (SNA) aerosols during the extreme haze events over northern China in October 2014, Atmos. Chem. Phys., 16, 10707–10724, https://doi.org/10.5194/acp-16-10707-2016, 2016.
Clarisse, L., Clerbaux, C., Dentener, F., Hurtmans, D., and Coheur, P. F.: Global ammonia distribution derived from infrared satellite observations, Nat. Geosci., 2, 479–483, https://doi.org/10.1038/ngeo551, 2009.
Clay, D. E., Malzer, G. L., and Anderson, J. L.: Ammonia volatilization from urea as influenced by soil-temperature, soil-water content, and nitrification and hydrolysis inhibitors, Soil. Sci. Soc. Am. J., 54, 263–266, https://doi.org/10.2136/sssaj1990.03615995005400010042x, 1990.
Cooter, E. J., Bash, J. O., Walker, J. T., Jones, M. R., and Robarge, W.: Estimation of NH3 bi-directional flux from managed agricultural soils, Atmos. Environ., 44, 2107–2115, https://doi.org/10.1016/j.atmosenv.2010.02.044, 2010.
Crippa, M., Solazzo, E., Huang, G. L., Guizzardi, D., Koffi, E., Muntean, M., Schieberle, C., Friedrich, R., and Janssens-Maenhout, G.: High resolution temporal profiles in the emissions database for global atmospheric research, Sci. Data, 7, 121, https://doi.org/10.1038/s41597-020-0462-2, 2020.
Curtin, D., Peterson, M. E., Qiu, W., and Fraser, P. M.: Predicting soil pH changes in response to application of urea and sheep urine, J. Environ. Qual., 49, 1445–1452, https://doi.org/10.1002/jeq2.20130, 2020.
Delitsky, M. L. and Baines, K.: Scavenging of ammonia by raindrops in Saturn's great storm clouds, 1 October, in: AAS/Division for Planetary Sciences Meeting Abstracts # 48, 48, 508-03, 2016DPS....4850803D, 2016.
Denmead, O. T., Freney, J. R., and Simpson, J. R.: Dynamics of Ammonia Volatilization during Furrow Irrigation of Maize, Soil. Sci. Soc. Am. J., 46, 149–155, https://doi.org/10.2136/sssaj1982.03615995004600010028x, 1982.
Ding, A. J., Nie, W., Huang, X., Chi, X. G., Sun, J. N., Kerminen, V. M., Xu, Z., Guo, W. D., Petaja, T., Yang, X. Q., Kulmala, M., and Fu, C. B.: Long-term observation of air pollution-weather/climate interactions at the SORPES station: a review and outlook, Front. Env. Sci. Eng., 10, 15, https://doi.org/10.1007/s11783-016-0877-3, 2016.
Ding, A., Huang, X., and Fu, C.: Air Pollution and Weather Interaction in East Asia, Environ. Sci., published online, https://doi.org/10.1093/acrefore/9780199389414.013.536, 2017.
Du, Q., Zhao, C., Zhang, M., Dong, X., Chen, Y., Liu, Z., Hu, Z., Zhang, Q., Li, Y., Yuan, R., and Miao, S.: Modeling diurnal variation of surface PM2.5 concentrations over East China with WRF-Chem: impacts from boundary-layer mixing and anthropogenic emission, Atmos. Chem. Phys., 20, 2839–2863, https://doi.org/10.5194/acp-20-2839-2020, 2020.
Ek, M. B., Mitchell, K. E., Lin, Y., Rogers, E., Grunmann, P., Koren, V., Gayno, G., and Tarpley, J. D.: Implementation of Noah land surface model advances in the National Centers for Environmental Prediction operational mesoscale Eta model, J. Geophys. Res.-Atmos., 108, 8851, https://doi.org/10.1029/2002jd003296, 2003.
Emmanouil, C., Drositi, E., Vasilatou, V., Diapouli, E., Krikonis, K., Eleftheriadis, K., and Kungolos, A.: Study on particulate matter air pollution, source origin, and human health risk based of PM10 metal content in Volos City, Greece, Toxicol. Environ. Chem., 99, 691–709, https://doi.org/10.1080/02772248.2016.1242005, 2017.
European Environment Agency (EEA): EMEP/EEA air pollutant emission inventory guidebook 2019, Tech. Rep. 13/2019, Copenhagen, 2019.
Fenn, L. B. and Kissel, D. E.: The Influence of Cation Exchange Capacity and Depth of Incorporation on Ammonia Volatilization from Ammonium Compounds Applied to Calcareous Soils, Soil Sci. Soc. Am. J., 40, 394–398, https://doi.org/10.2136/sssaj1976.03615995004000030026x, 1976.
Ferguson, R. B. and Kissel, D. E.: Effects of Soil Drying on Ammonia Volatilization from Surface-applied Urea, Soil Sci. Soc. Am. J., 50, 485–490, https://doi.org/10.2136/sssaj1986.03615995005000020047x, 1986.
Flechard, C. R., Nemitz, E., Smith, R. I., Fowler, D., Vermeulen, A. T., Bleeker, A., Erisman, J. W., Simpson, D., Zhang, L., Tang, Y. S., and Sutton, M. A.: Dry deposition of reactive nitrogen to European ecosystems: a comparison of inferential models across the NitroEurope network, Atmos. Chem. Phys., 11, 2703–2728, https://doi.org/10.5194/acp-11-2703-2011, 2011.
Fowler, D., Coyle, M., Skiba, U., Sutton, M. A., Cape, J. N., Reis, S., Sheppard, L. J., Jenkins, A., Grizzetti, B., Galloway, J. N., Vitousek, P., Leach, A., Bouwman, A. F., Butterbach-Bahl, K., Dentener, F., Stevenson, D., Amann, M., and Voss, M.: The global nitrogen cycle in the twenty-first century, Philos. Trans. R. Soc. Lond., B, 368, 20130164, https://doi.org/10.1098/rstb.2013.0164, 2013.
Grell, G. A. and Freitas, S. R.: A scale and aerosol aware stochastic convective parameterization for weather and air quality modeling, Atmos. Chem. Phys., 14, 5233–5250, https://doi.org/10.5194/acp-14-5233-2014, 2014.
Grell, G. A., Peckham, S. E., Schmitz, R., McKeen, S. A., Frost, G., Skamarock, W. C., and Eder, B.: Fully coupled “online” chemistry within the WRF model, Atmos. Environ., 39, 6957–6975, https://doi.org/10.1016/j.atmosenv.2005.04.027, 2005.
Gyldenkaerne, S., Skjoth, C. A., Hertel, O., and Ellermann, T.: A dynamical ammonia emission parameterization for use in air pollution models, J. Geophys. Res.-Atmos., 110, D07108, https://doi.org/10.1029/2004jd005459, 2005.
Hong, S. Y., Noh, Y., and Dudhia, J.: A new vertical diffusion package with an explicit treatment of entrainment processes, Mon. Weather. Rev., 134, 2318–2341, https://doi.org/10.1175/Mwr3199.1, 2006.
Huang, X., Song, Y., Li, M. M., Li, J. F., Huo, Q., Cai, X. H., Zhu, T., Hu, M., and Zhang, H. S.: A high-resolution ammonia emission inventory in China, Global Biogeochem. Cy., 26, GB1030, https://doi.org/10.1029/2011gb004161, 2012.
Huo, Q., Cai, X. H., Kang, L., Zhang, H. S., Song, Y., and Zhu, T.: Estimating ammonia emissions from a winter wheat cropland in North China Plain with field experiments and inverse dispersion modeling, Atmos. Environ., 104, 1–10, https://doi.org/10.1016/j.atmosenv.2015.01.003, 2015.
Iacono, M. J., Delamere, J. S., Mlawer, E. J., Shephard, M. W., Clough, S. A., and Collins, W. D.: Radiative forcing by long-lived greenhouse gases: Calculations with the AER radiative transfer models, J. Geophys. Res.-Atmos., 113, D13103, https://doi.org/10.1029/2008jd009944, 2008.
Jia, W.: Studies on the Evaluation of Nutrient Resources Derived from Manure and Optimized Utilization in Arable Land of China, PhD thesis, 5 pp., 2014.
Kong, L., Tang, X., Zhu, J., Wang, Z. F., Pan, Y. P., Wu, H. J., Wu, L., Wu, Q. Z., He, Y. X., Tian, S. L., Xie, Y. Z., Liu, Z. R., Sui, W. X., Han, L. N., and Carmichael, G.: Improved Inversion of Monthly Ammonia Emissions in China Based on the Chinese Ammonia Monitoring Network and Ensemble Kalman Filter, Environ. Sci. Technol., 53, 12529–12538, https://doi.org/10.1021/acs.est.9b02701, 2019.
Kurokawa, J. and Ohara, T.: Long-term historical trends in air pollutant emissions in Asia: Regional Emission inventory in ASia (REAS) version 3, Atmos. Chem. Phys., 20, 12761–12793, https://doi.org/10.5194/acp-20-12761-2020, 2020.
Li, B., Chen, L., Shen, W., Jin, J., Wang, T., Wang, P., Yang, Y., and Liao, H.: Improved gridded ammonia emission inventory in China, Atmos. Chem. Phys., 21, 15883–15900, https://doi.org/10.5194/acp-21-15883-2021, 2021.
Li, M., Liu, H., Geng, G. N., Hong, C. P., Liu, F., Song, Y., Tong, D., Zheng, B., Cui, H. Y., Man, H. Y., Zhang, Q., and He, K. B.: Anthropogenic emission inventories in China: a review, Natl. Sci. Rev., 4, 834–866, https://doi.org/10.1093/nsr/nwx150, 2017.
Lian, Z. M., Ouyang, W., Liu, H. B., Zhang, D., and Liu, L. H.: Ammonia volatilization modeling optimization for rice watersheds under climatic differences, Sci. Total Environ., 767, 144710, https://doi.org/10.1016/j.scitotenv.2020.144710, 2021.
Lin, Y. L., Farley, R. D., and Orville, H. D.: Bulk Parameterization of the Snow Field in a Cloud Model, J. Appl. Meteorol. Climatol., 22, 1065–1092, https://doi.org/10.1175/1520-0450(1983)022<1065:Bpotsf>2.0.Co;2, 1983.
Liu, C., Huang, J. P., Hu, X. M., Hu, C., Wang, Y. W., Fang, X. Z., Luo, L., Xiao, H. W., and Xiao, H. Y.: Evaluation of WRF-Chem simulations on vertical profiles of PM2.5 with UAV observations during a haze pollution event, Atmos. Environ., 252, 118332, https://doi.org/10.1016/j.atmosenv.2021.118332, 2021.
Liu, F., Sun, F. B., Liu, W. W., Wang, T. T., Wang, H., Wang, X. M., and Lim, W. H.: On wind speed pattern and energy potential in China, Appl. Energy, 236, 867–876, https://doi.org/10.1016/j.apenergy.2018.12.056, 2019.
Liu, L., Xu, W., Lu, X. K., Zhong, B. Q., Guo, Y. X., Lu, X., Zhao, Y. H., He, W., Wang, S. H., Zhang, X. Y., Liu, X. J., and Vitousek, P.: Exploring global changes in agricultural ammonia emissions and their contribution to nitrogen deposition since 1980, P. Natl. Acad. Sci. USA, 119, e2121998119, https://doi.org/10.1073/pnas.2121998119, 2022.
Liu, M., Huang, X., Song, Y., Xu, T., Wang, S., Wu, Z., Hu, M., Zhang, L., Zhang, Q., Pan, Y., Liu, X., and Zhu, T.: Rapid SO2 emission reductions significantly increase tropospheric ammonia concentrations over the North China Plain, Atmos. Chem. Phys., 18, 17933–17943, https://doi.org/10.5194/acp-18-17933-2018, 2018.
Longhini, V. Z., Cardoso, A. D., Berca, A. S., Boddey, R. M., Reis, R. A., Dubeux, J. C. B., and Ruggieri, A. C.: Nitrogen supply and rainfall affect ammonia emissions from dairy cattle excreta and urea applied on warm-climate pastures, J. Environ. Qual, 49, 1453–1466, https://doi.org/10.1002/jeq2.20167, 2020.
Maru, A., Haruna, A., Majid, N., Charles Primus, W., Maikol, N., Asap, A., Naharuddin, A., and Jeffary, A.: Using Soil Water to Control Ammonia Emission from Acid Soils with and Without Chicken Litter Biochar, Sustain. Environ. Res., 8, 23, https://doi.org/10.5539/sar.v8n3p23, 2019.
Mcinnes, K. J., Ferguson, R. B., Kissel, D. E., and Kanemasu, E. T.: Ammonia Loss from Applications of Urea Ammonium-Nitrate Solution to Straw Residue, Soil Sci. Soc. Am. J., 50, 969–974, https://doi.org/10.2136/sssaj1986.03615995005000040028x, 1986.
Ministry of Agriculture and Rural Affairs (MARA): Technical specification for livestock manure composting, standard reference, NYT 3442-2019, 2 pp., 2019.
Misselbrook, T. H., Nicholson, F. A., Chambers, B. J., and Johnson, R. A.: Measuring ammonia emissions from land applied manure: an intercomparison of commonly used samplers and techniques, Environ. Pollut., 135, 389–397, https://doi.org/10.1016/j.envpol.2004.11.012, 2005.
National Center for Atmospheric Research (NCAR): WRF Version v3.9 (Bug-fix Release), GitHub [code], https://github.com/wrf-model/WRF/releases (last access: 1 June 2021), 2019.
Niraula, S., Rahman, S., and Chatterjee, A.: Temperature response of ammonia and greenhouse gas emission from manure amended silty clay soil, Acta Agric. Scand. B Soil. Plant. Sci., 68, 663–677, https://doi.org/10.1080/09064710.2018.1459822, 2018.
Oprea, M., Dunea, D., and Liu, H. Y.: Development of a Knowledge Based System for Analyzing Particulate Matter Air Pollution Effects on Human Health, Environ. Eng. Manag. J., 16, 669–676, https://doi.org/10.30638/eemj.2017.068, 2017.
Osada, K.: Measurement report: Short-term variation in ammonia concentrations in an urban area increased by mist evaporation and emissions from a forest canopy with bird droppings, Atmos. Chem. Phys., 20, 11941–11954, https://doi.org/10.5194/acp-20-11941-2020, 2020.
Overrein, L. N. and Moe, P. G.: Factors Affecting Urea Hydrolysis and Ammonia Volatilization in Soil, Soil. Sci. Soc. Am. J., 31, 57, https://doi.org/10.2136/sssaj1967.03615995003100010018x, 1967.
Paerl, H. W.: Connecting atmospheric nitrogen deposition to coastal eutrophication, Environ. Sci. Technol., 36, 323a–326a, https://doi.org/10.1021/es022392a, 2002.
Parker, D. B., Pandrangi, S., Greene, L. W., Almas, L. K., Cole, N. A., Rhoades, A. B., and Koziel, J. A.: Rate and frequency of urease inhibitor application for minimizing ammonia emissions from beef cattle feedyards, Trans. ASAE, 48, 787–793, 2005.
Paulot, F., Jacob, D. J., Pinder, R. W., Bash, J. O., Travis, K., and Henze, D. K.: Ammonia emissions in the United States, European Union, and China derived by high-resolution inversion of ammonium wet deposition data: Interpretation with a new agricultural emissions inventory (MASAGE_NH3), J. Geophys. Res.-Atmos., 119, 4343–4364, https://doi.org/10.1002/2013jd021130, 2014.
Pedersen, J., Nyord, T., Feilberg, A., and Labouriau, R.: Analysis of the effect of air temperature on ammonia emission from band application of slurry, Environ. Pollut., 282, 117055, https://doi.org/10.1016/j.envpol.2021.117055, 2021.
Pleim, J. E., Ran, L., Appel, W., Shephard, M. W., and Cady-Pereira, K.: New bidirectional ammonia flux model in an air quality model coupled with an agricultural model, J. Adv. Model. Earth Syst., 11, 2934–2957, https://doi.org/10.1029/2019MS001728, 2019.
Ren, C. and Huang, X.: WRF-soilN-Chem for NH3 code and inputdata, Zenodo [code], https://doi.org/10.5281/zenodo.7134286, 2022.
Riddick, S., Ward, D., Hess, P., Mahowald, N., Massad, R., and Holland, E.: Estimate of changes in agricultural terrestrial nitrogen pathways and ammonia emissions from 1850 to present in the Community Earth System Model, Biogeosciences, 13, 3397–3426, https://doi.org/10.5194/bg-13-3397-2016, 2016.
Roelle, P. A. and Aneja, V. P.: Characterization of ammonia emissions from soils in the upper coastal plain, North Carolina, Atmos. Environ., 36, 1087–1097, https://doi.org/10.1016/S1352-2310(01)00355-7, 2002.
Ryan, J., Curtin, D., and Safi, I.: Ammonia Volatilization as Influenced by Calcium-Carbonate Particle-Size and Iron-Oxides, Soil. Sci. Soc. Am. J., 45, 338–341, https://doi.org/10.2136/sssaj1981.03615995004500020022x, 1981.
Sanz-Cobena, A., Misselbrook, T., Camp, V., and Vallejo, A.: Effect of water addition and the urease inhibitor NBPT on the abatement of ammonia emission from surface applied urea, Atmos. Environ., 45, 1517–1524, https://doi.org/10.1016/j.atmosenv.2010.12.051, 2011.
Shimshock, J. P. and De Pena, R. G.: Below-cloud scavenging of tropospheric ammonia, Tellus B, 41, 296–304, https://doi.org/10.1111/j.1600-0889.1989.tb00308.x, 1989.
Skamarock, C., Klemp, B., Dudhia, J., Gill, O., Liu, Z., Berner, J., Wang, W., Powers, G., Duda, G., Barker, D. M., and Huang, X.: A Description of the Advanced Research WRF Model Version 4 (No. NCAR/TN-556+STR), https://doi.org/10.5065/1dfh-6p97, 2019.
Smith, C. J., Freney, J. R., Chalk, P. M., Galbally, I. E., Mckenney, D. J., and Cai, G. X.: Fate of Urea Nitrogen Applied in Solution in Furrows to Sunflowers Growing on a Red-Brown Earth – Transformations, Losses and Plant Uptake, Aust. J. Agric. Resour. Econ., 39, 793–806, https://doi.org/10.1071/Ar9880793, 1988.
Smith, E., Gordon, R., Bourque, C., Campbell, A., Genermont, S., Rochette, P., and Mkhabela, M.: Simulated management effects on ammonia emissions from field applied manure, J. Environ. Manage, 90, 2531–2536, https://doi.org/10.1016/j.jenvman.2009.01.012, 2009.
Sommer, S. G., Olesen, J. E., and Christensen, B. T.: Effects of temperature, wind speed and air humidity on ammonia volatilization from surface applied cattle slurry, J. Agric. Sci., 117, 91–100, https://doi.org/10.1017/s0021859600079016, 1991.
Spindler, G., Teichmann, U., and Sutton, M. A.: Ammonia dry deposition over grassland – micrometeorological flux-gradient measurements and bidirectional flux calculations using an inferential model, Q. J. Roy. Meteor. Soc., 127, 795–814, https://doi.org/10.1002/qj.49712757305, 2001.
Tian, G. M., Cai, Z. C., Cao, J. L., and Li, X. P.: Factors affecting ammonia volatilisation from a rice-wheat rotation system, Chemosphere, 42, 123–129, https://doi.org/10.1016/S0045-6535(00)00117-X, 2001.
U.S. EPA: https://www.tceq.texas.gov/downloads/air-quality/modeling/meetings/hgb/2021/20210623-meteorologicalmodelperformance-tceq-dornblaser.pdf (last access: 17 March 2023), 2021.
Van Damme, M., Clarisse, L., Heald, C. L., Hurtmans, D., Ngadi, Y., Clerbaux, C., Dolman, A. J., Erisman, J. W., and Coheur, P. F.: Global distributions, time series and error characterization of atmospheric ammonia (NH3) from IASI satellite observations, Atmos. Chem. Phys., 14, 2905–2922, https://doi.org/10.5194/acp-14-2905-2014, 2014.
Van Damme, M., Erisman, J. W., Clarisse, L., Dammers, E., Whitburn, S., Clerbaux, C., Dolman, A. J., and Coheur, P. F.: Worldwide spatiotemporal atmospheric ammonia (NH3) columns variability revealed by satellite, Geophys. Res. Lett, 42, 8660–8668, https://doi.org/10.1002/2015gl065496, 2015.
Van Damme, M., Whitburn, S., Clarisse, L., Clerbaux, C., Hurtmans, D., and Coheur, P.-F.: Version 2 of the IASI NH3 neural network retrieval algorithm: near-real-time and reanalysed datasets, Atmos. Meas. Tech., 10, 4905–4914, https://doi.org/10.5194/amt-10-4905-2017, 2017 (data available at: https://iasi.aeris-data.fr/NH3/, last access: 17 March 2023).
van Pul, A., Reis, S., Dore, T., Liu, X. J., Fagerli, H., Geels, C., Hertel, O., Kruijt, R. W., Kryza, M., Bergstrom, R., Vieno, M., Smith, R., and Nemitz, E.: Modelling the National and Regional Transport and Deposition of Ammonia, chap. 19, Atmospheric Ammonia, 409, 301–358, https://doi.org/10.1007/978-1-4020-9121-6_25, 2009.
Van Slyke, D. D. and Cullen, G. E.: The mode of action of urease and of enzymes in general, J. Biol. Chem., 19, 141–180, https://doi.org/10.1016/S0021-9258(18)88300-4, 1914.
Wang, Y., Zhang, Q. Q., He, K., Zhang, Q., and Chai, L.: Sulfate-nitrate-ammonium aerosols over China: response to 2000–2015 emission changes of sulfur dioxide, nitrogen oxides, and ammonia, Atmos. Chem. Phys., 13, 2635–2652, https://doi.org/10.5194/acp-13-2635-2013, 2013.
Webb, J. and Misselbrook, T. H.: A mass-flow model of ammonia emissions from UK livestock production, Atmos. Environ., 38, 2163–2176, https://doi.org/10.1016/j.atmosenv.2004.01.023, 2004.
Webb, J., Ryan, M., Anthony, S. G., Brewer, A., Laws, J., Aller, M. F., and Misselbrook, T. H.: Cost-effective means of reducing ammonia emissions from UK agriculture using the NARSES model, Atmos. Environ., 40, 7222–7233, https://doi.org/10.1016/j.atmosenv.2006.06.029, 2006.
Xu, W., Zhang, L., and Liu, X.: A database of atmospheric nitrogen concentration and deposition from a nationwide monitoring network in China, figshare [data set], https://doi.org/10.6084/m9.figshare.7451357.v5, 2019a.
Xu, W., Zhang, L., and Liu, X. J.: A database of atmospheric nitrogen concentration and deposition from the nationwide monitoring network in China, Sci. Data, 6, 51, https://doi.org/10.1038/s41597-019-0061-2, 2019b.
Zaveri, R. A. and Peters, L. K.: A new lumped structure photochemical mechanism for large-scale applications, J. Geophys. Res.-Atmos., 104, 30387–30415, https://doi.org/10.1029/1999jd900876, 1999.
Zaveri, R. A., Easter, R. C., Fast, J. D., and Peters, L. K.: Model for Simulating Aerosol Interactions and Chemistry (MOSAIC), J. Geophys. Res.-Atmos., 113, D13204, https://doi.org/10.1029/2007jd008782, 2008.
Zhang, L., Wright, L. P., and Asman, W. A. H.: Bi-directional air-surface exchange of atmospheric ammonia: A review of measurements and a development of a big-leaf model for applications in regional-scale air-quality models, J. Geophys. Res.-Atmos., 115, D20310, https://doi.org/10.1029/2009jd013589, 2010.
Zhang, T. Y., Li, T., Yue, X., and Yang, X. G.: Impacts of aerosol pollutant mitigation on lowland rice yields in China, Environ. Res. Lett., 12, 104003, https://doi.org/10.1088/1748-9326/aa80f0, 2017.
Zhang, Y., Dore, A. J., Ma, L., Liu, X. J., Ma, W. Q., Cape, J. N., and Zhang, F. S.: Agricultural ammonia emissions inventory and spatial distribution in the North China Plain, Environ. Pollut., 158, 490–501, https://doi.org/10.1016/j.envpol.2009.08.033, 2010.
Zheng, X. J., Yu, Z. W., Zhang, Y. L., and Shi, Y.: Effect of nitrogen rates on wheat photosynthesis, anatomical parameters and photoassimilate partitioning in North China Plain, Int. J. Plant. Prod., 15, 161–172, https://doi.org/10.1007/s42106-020-00123-3, 2021.
Zhu, Z. L., Cai, G. X., Simpson, J. R., Zhang, S. L., Chen, D. L., Jackson, A. V., and Freney, J. R.: Processes of Nitrogen Loss from Fertilizers Applied to Flooded Rice Fields on a Calcareous Soil in North-Central China, Fert. Res., 18, 101–115, https://doi.org/10.1007/BF01049507, 1989.