the Creative Commons Attribution 4.0 License.
the Creative Commons Attribution 4.0 License.
 | 15 Dec 2022
The Mission Support System (MSS v7.0.4) and its use in planning for the SouthTRAC aircraft campaign
Reimar Bauer
Jens-Uwe Grooß
May Bär
Markus Geldenhuys
Lars Hoffmann
The Mission Support System (MSS) is an open source software package that has been used for planning flight tracks of scientific aircraft in multiple measurement campaigns during the last decade. It consists of three major components: a web map server located close to the model data storage site that is capable of producing a variety of 2-D figures from 4-D meteorological data; a client application capable of displaying the figures in combination with the planned flight track and an assortment of additional information; and a new collaboration server component that enables real-time collaboration of multiple remote parties. During the last decade, these components were constantly improved towards being simple to set up and use and being standard compliant.
Here, we describe the use of MSS during the Southern Hemisphere Transport, Dynamics, and Chemistry–Gravity Waves (SouthTRAC-GW) measurement campaign in 2019. This campaign, based in Rio Grande, Argentina, used the German research aircraft HALO to investigate several scientific objectives related to the Southern Hemisphere chemistry and dynamics. We present the diverse data products offered by the MSS web map server dedicated to the campaign, which were derived from the European Centre for Medium-Range Weather Forecasts (ECMWF) forecast data, Chemical Lagrangian Model of the Stratosphere (CLaMS) simulations, and Atmospheric Infrared Sounder (AIRS) near-real time brightness temperature measurements. As an example for how the MSS software is used in conjunction with the different data sets, we describe the planning of a single flight, which eventually took place on 12 September 2019, probing orographic gravity waves propagating up into the lower mesosphere.
- Article
(6428 KB) - Full-text XML
- BibTeX
- EndNote


Planning and executing aircraft-based scientific measurement campaigns is an involved process. These campaigns take years to prepare and typically operate with a very constrained budget in terms of both execution time and money – thus, the more important it is to exploit each possible flight to the fullest. This requires thorough planning and leveraging forecast data by operational and scientific atmospheric models. Typically, scientific research flights are conducted to answer a set of defined scientific questions. Predictions of relevant parameters by a model simulation for a particular location provide guidance on where to fly to answer these scientific questions through measurements. Many other constraints concerning, e.g., flight altitude and range, ambient temperature, overflight permits, secondary airports, down-to-penguin protection zones, or commercial flight corridors need be observed.
One tool that simplifies the task of planning scientific measurements flights is the Mission Support System (MSS v7.0.4; Bauer et al., 2022a). It includes powerful features to allow scientists to plan measurement flights remotely and in the field based on the characteristics of their instruments and model data. In 2010, the Mission Support System was developed by Marc Rautenhaus at Deutsches Zentrum für Luft- und Raumfahrt (DLR) in collaboration with Forschungszentrum Jülich (FZJ) (Rautenhaus et al., 2012). Since then, MSS has become open source. The software essentially consists of three major components: a graphical user interface (GUI) to display data and to plan the flights; a server to provide maps and cross-sectional plots through model data; a server to facilitate real-time collaboration from multiple sites.
The software was employed in many campaigns during the last decade, the major ones being the Midlatitude Cirrus experiment (ML-Cirrus; e.g. Voigt et al., 2017) in 2014; the Polar Stratosphere in a Changing Climate campaign in 2015 (POLSTRACC; Oelhaf et al., 2019); the North Atlantic Waveguide and Downstream Impact Experiment (NAWDEX; e.g. Schäfler et al., 2018) in 2016; the Stratospheric and upper tropospheric processes for better climate predictions campaign in 2017 (StratoClim; e.g. Höpfner et al., 2019); the Wave-driven ISentropic Exchange campaign in 2017 (WISE; e.g. Kunkel et al., 2019); the Carbon Dioxide and Methane Mission (CoMet 1.0; e.g. Fix et al., 2018) campaign in 2018; the Effect of Megacities on the transport and transformation of pollutants on the Regional and Global scales in 2018 (EMeRGe; Andrés Hernández et al., 2022); the Southern Hemisphere Transport, Dynamics, and Chemistry–Gravity Waves campaign in 2019 (SouthTRAC; Rapp et al., 2021); the CIRRUS in High Latitudes (CIRRUS-HL) in 2021; the Arctic Air Mass Transformations During Warm Air Intrusions And Marine Cold Air Outbreaks (HALO-(AC)3) campaign in 2022; and, so far finally, the Development and Testing of Airborne Laminar Flow Inlet for Condensable Vapors in 2022 (TI3GER).
This paper describes the recent development of this software in Sect. 2 and, as an example for its use in practice, its use in planning flights for the SouthTRAC campaign in Sect. 3. A summary is given in Sect. 4.
The MSS flight planning tool suite is an open source software package designed to combine a powerful flight path designer with a host of overlay features to combine horizontal and vertical cross-sections through model data along the flight path. In particular, it is designed to allow remote operation – i.e., the planning can take place at a location that is far away from the location – of the typically bulky forecast model data, and therefore, it avoids excessive data transfers between the sites of the campaign and the data centre.
It does so by providing three major components:
-
a server component (Mission Support Web Map Server; MSWMS) to deliver images of horizontal and vertical cross-sections through model data – this builds on top of an Open Geospatial Consortium (OGC) Web Map Service standard-compliant server (International Organization for Standardization, 2005) enhanced by MSS-specific features, allowing for vertical cross-sections or sampling of 4-D data along the flight path;
-
a real-time collaboration server (Mission Support Collaboration server; MSColab), which allows multiple clients to simultaneously work on a single flight plan stored on a server;
-
a client component (Mission Support User Interface; MSUI) implementing an OGC Web Map Service client (which is also able to connect to third-party servers) in combination with a visual flight planning tool – this is supplemented by several plugins dedicated to a variety of typical tasks of scientific flight planning, such as visualising solar angles or computing the effect of dive manoeuvers on the range of the aircraft.
The software project also contains several ancillary components, such as an exemplifying set of scripts describing how to download and process weather forecast data from the European Centre for Medium-Range Weather Forecast (ECMWF) automatically for use in the server component or a plugin to the Windy website (Windy, 2022) connecting to the real-time collaboration server.
2.1 Architecture
Figure 1 shows the interaction of the main components MSUI, MSWMS, and MSColab.

The client application allows the users to interact with the servers. On the one hand, it allows one to retrieve arbitrary images via the HTTP protocol from the MSWMS component. On the other hand, it communicates with the MSColab server to modify flight plans, to use the chat, etc. A detailed description of the individual components follows.
2.2 Mission Support Web Map Server (MSWMS)
The MSWMS data server implementation follows the OGC Web Map Service (OGC WMS) standard (International Organization for Standardization, 2005). This is a standard for geoscientific data formats combined with a web service for generating images of maps. It specifies, e.g., what kind of projections must be supported by the server. Using it allows us to generate graphics based on defined HTTP requests from meteorological data files in a standardised fashion. Since OGC WMS is an open standard, there are a large number of third party servers available that offer, e.g., satellite imagery that has also proven useful for flight planning in the past.
The MSWMS server is designed to be updated with new data from model calculations on a regular basis so that the user is offered the most recent data as soon as it becomes available.
The standard prescribes two main functions. With the GetCapabilities request, the user receives a catalogue of available products in the form of an Extensible Markup Language (XML) file. The GetMap request contains parameters such as the map section and projection, the desired product and layer, the time, etc.; the server replies with a graphic in the compressed portable network graphics format, generated according to the specification. In this way, the amount of transferred data is limited to the size of a compressed image, which is negligible in comparison to the 4-D model data available to the server.
The OGC WMS standard only defines horizontal maps. But our MSWMS server can also produce vertical cross-sections following a series of longitude and latitude coordinates, i.e., a flight path. This is a key feature of the software that sets it apart from campaigns supporting web pages or galleries providing standardised horizontal maps for a predefined region. This feature greatly helps in defining desired flight levels or in predicting the outcome of, e.g. vertical lidar measurements. A new feature is also the sampling of model data along a one-dimensional flight path, which allows for correlation plots in the client or for predicting the measurements of in situ instruments.
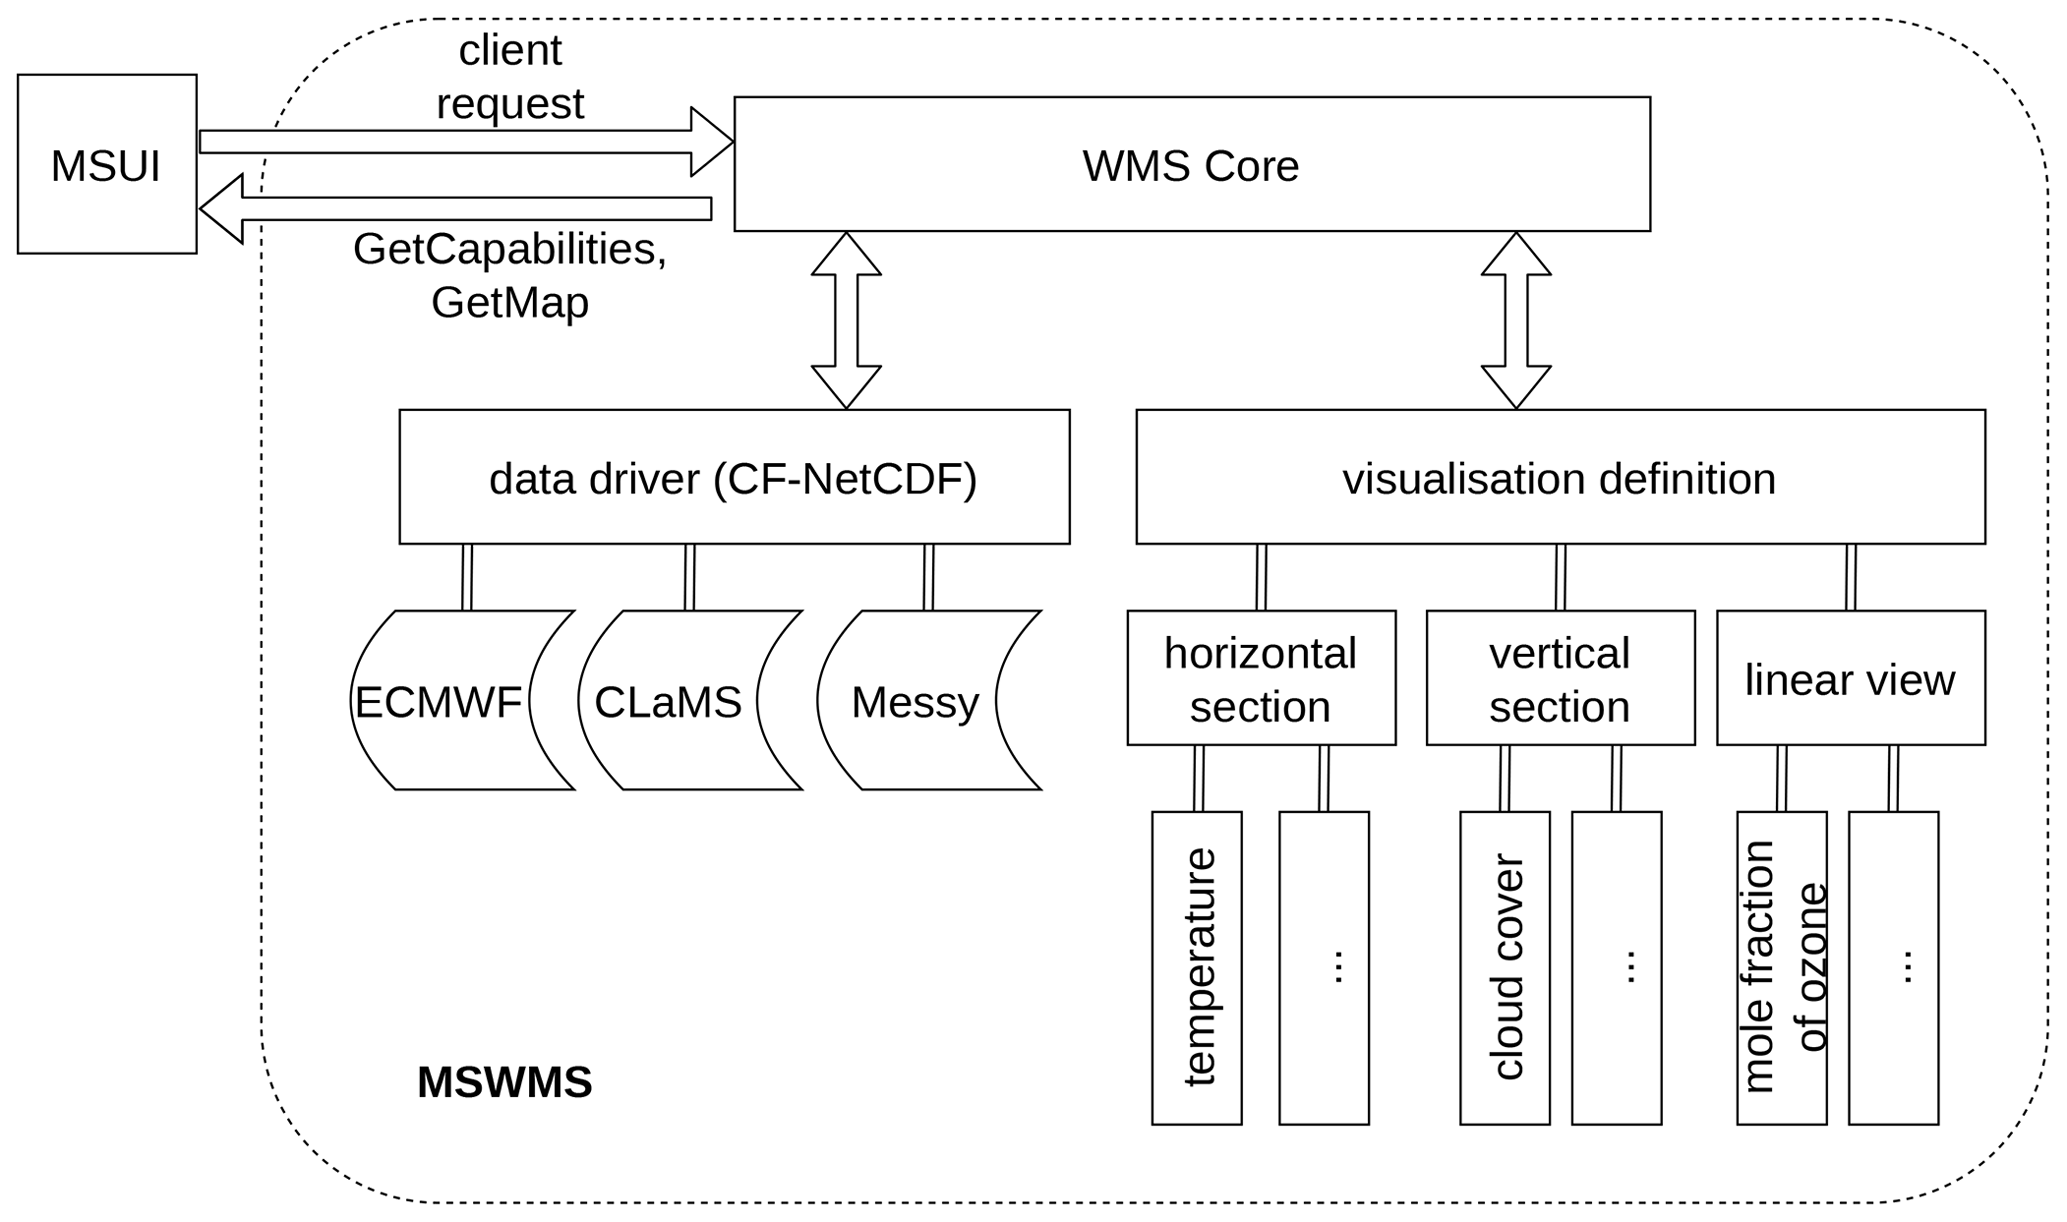
The architecture of the server component is shown in Fig. 2. The left hand side shows a generic data processing tool chain that supplies geophysical data to the server. A simple tool chain is provided as an example to show how to provide MSS-compliant model data from ECMWF Reanalysis v5 (ERA5) and operational data (Hersbach et al., 2020; Bauer et al., 2022b). The WMS core component is implemented as a Flask Web Server Gateway Interface (WSGI) component for use in any WSGI web server.
This mostly handles the two request types described above. The server is fully configurable and modifiable by a configuration Python script. This script configures, amongst other things, the desired plotting layers and the location of data stored in the self-describing Network Common Data Form (NetCDF). The plotting layers are a set of Python classes that perform the actual task of cross-section plotting of geophysical quantities. The data driver component parses all data found in specified directories and extracts provided data fields leveraging the Climate and Forecast metadata conventions (Hassell et al., 2017). Plotting layers of the visualisation definition component are connected with needed data using the standard_name attribute, observing the units specified in the units attribute of the NetCDF file. It is possible and very simple to define new plotting layers from within the server configuration file.
In addition to the OGC WMS service, the MSWMS component also provides a configurable web gallery of the provided layers and data, which can be used without installing the client component (e.g. from a smart phone). While being of practical use, this feature also allows the server maintainer to plot all configured layers for testing purposes quickly.
2.3 Mission Support User Interface (MSUI)
The MSUI component supports the planning of flight tracks along a series of geospatial coordinates.
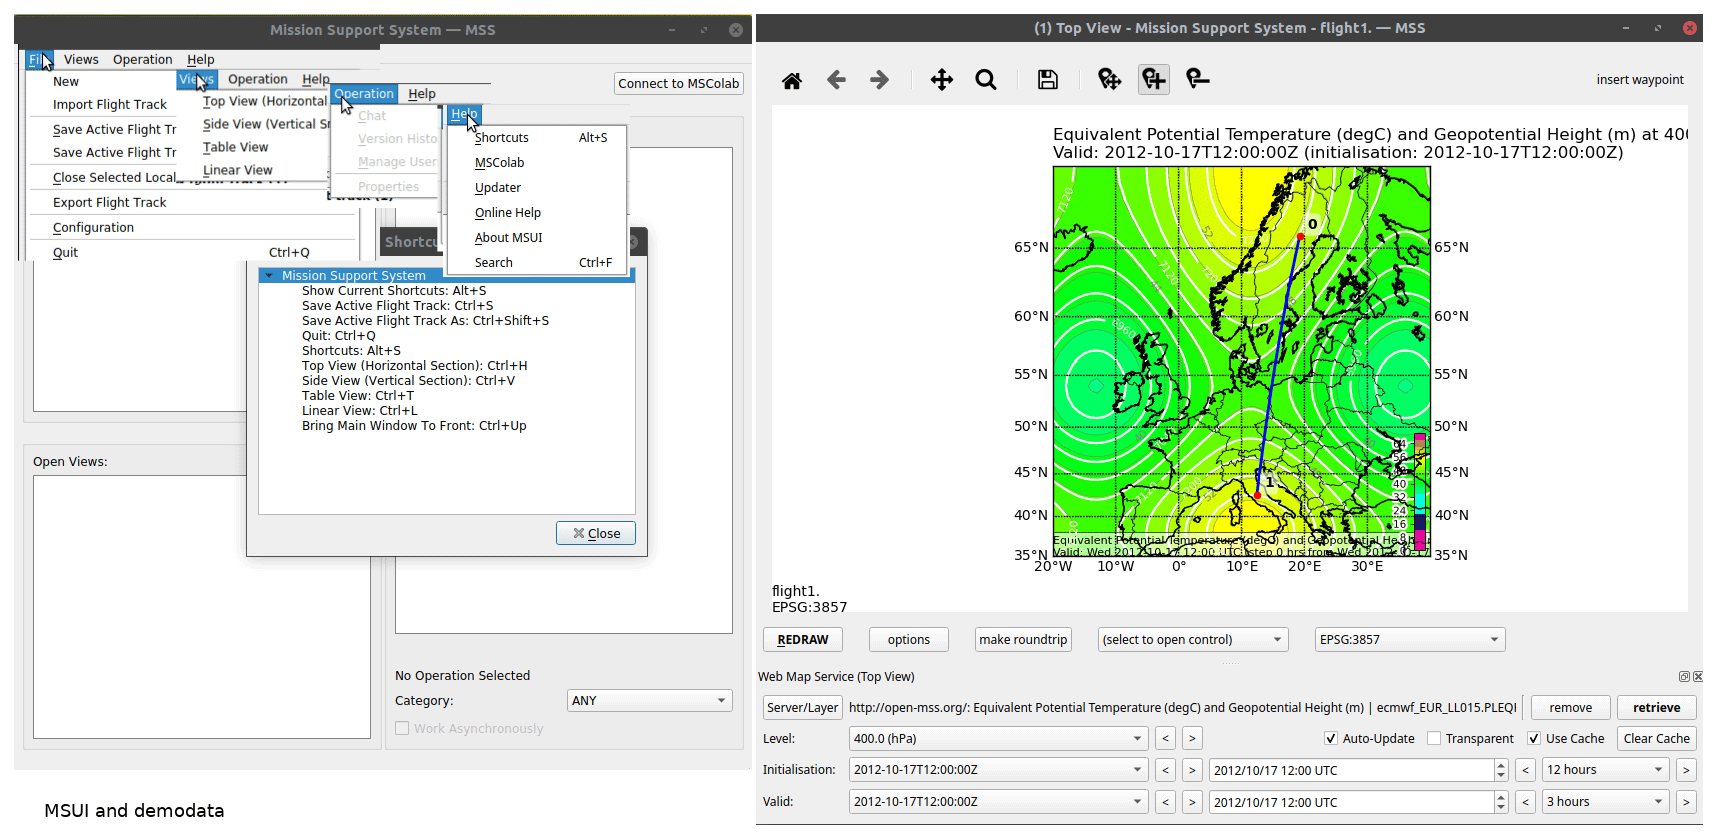
Figure 3Main window of the MSUI.
The main interface is shown in Fig. 3. On the left is the flight track management and MSColab interface. On the right is a top view window with a simple flight path consisting of only two waypoints on top of a visualisation of test data. The waypoints can be interactively modified to align with features on the displayed images from the MSWMS component. The vertical movement of the aircraft can be defined in the side view. The MSWMS component provides vertical cross-sections for this purpose. The third currently supported linear view visualises model data along the flight path similar to the measurements an in situ instrument would make. Section 3.1 provides ample examples for all types of plots.
All views can be opened simultaneously and multiple times to display different information on each. The user interface of the individual views has an interface for selecting different OGC WMS servers. This allows the combination of different and multiple maps and layers from one or several OGC WMS servers into one view (see Sect. 3.2 for an example). In addition to the images provided by OGC WMS servers, further information can be displayed by a series of widgets, e.g. Keyhole Markup Language (KML; Open Geospatial Consortium, 2015) data, airports and air data, or satellite tracks.
User-specific configuration like favourite OGC WMS servers or predefined map sections can be stored permanently in a local configuration file. Typically, a default configuration file containing the relevant servers and access details for a campaign is prepared and distributed to all users for initialising their flight planning environment.
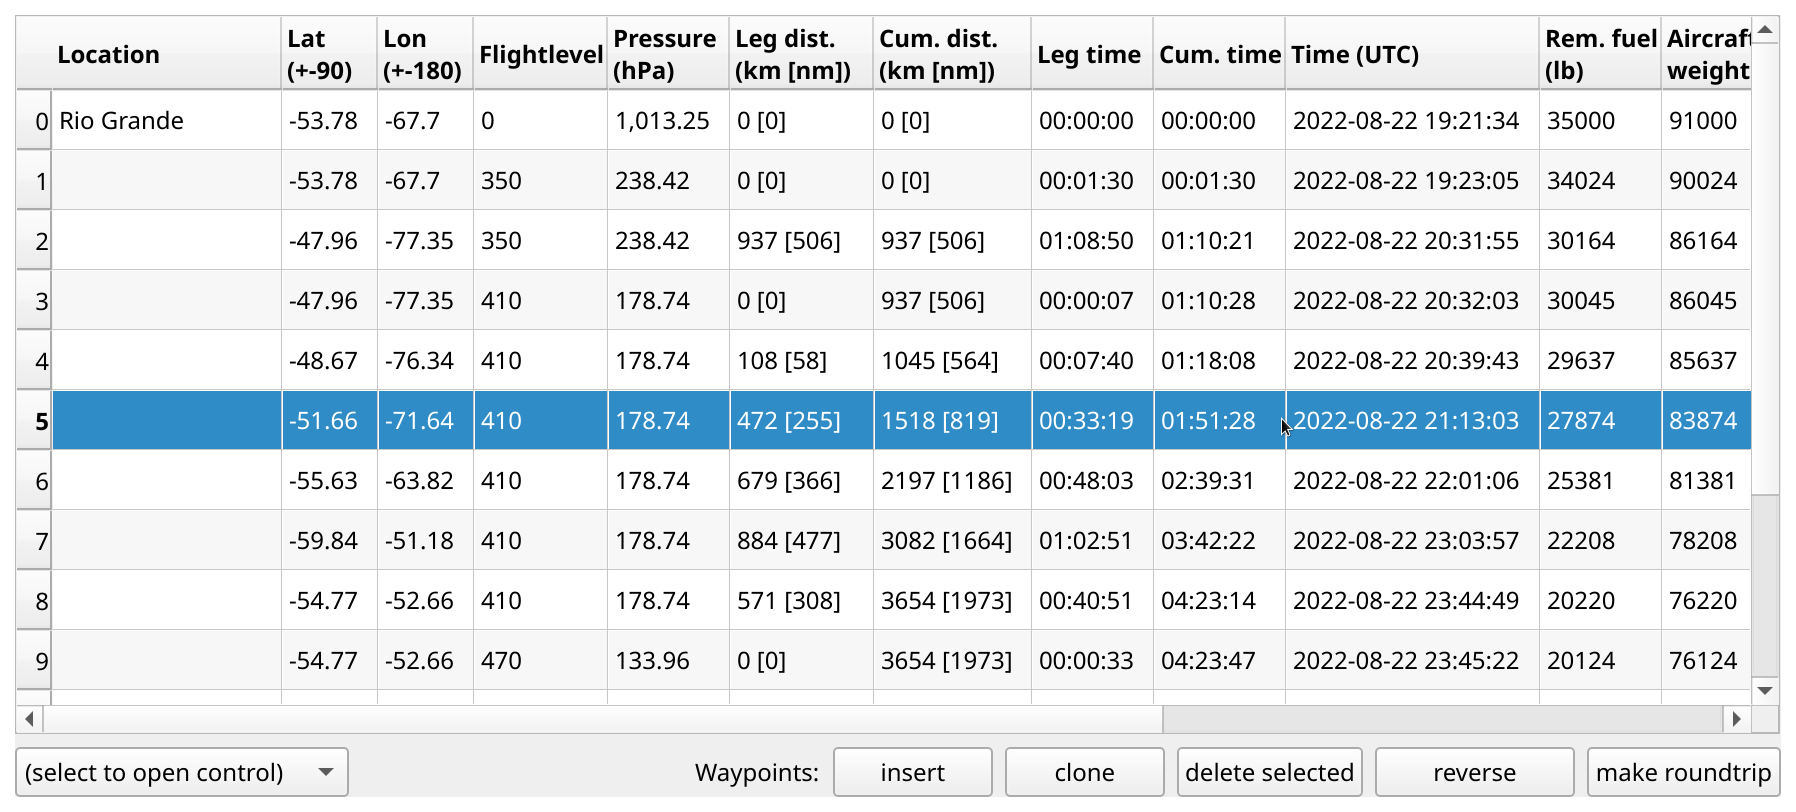
Figure 4The table view window of the MSUI.
In the table view, which resembles a spreadsheet, all waypoints are displayed numerically. Here, exact coordinates can be entered. When performance data of the aircraft are provided, estimates of range and peak altitude of the aircraft can also be computed and displayed in the table. Figure 4 shows an example for the flight discussed in Sect. 3.2. The first column allows one to select pre-defined named waypoints or NAVIDS or to name a waypoint for the current session. The next columns allow one to specify longitude, latitude, and flight level exactly. A performance file for the employed aircraft that allows for the calculation of a rough approximation of flight time and remaining fuel, i.e. range, was loaded.
The resulting flight track can be exported or imported by different formats. MSUI supports text, comma-separated values (CSV), and KML, but other formats can be added in a simple fashion by providing plugins in the configuration directory (with examples being provided in the documentation).
2.4 Mission Support Collaboration tool (MSColab)
A recent improvement of MSS is the remote collaboration server for sharing all flight planning data in a synchronized usage. This feature has been put to practical use during the CIRRUS in High Latitudes (CIRRUS-HL) campaign in 2021, which was heavily affected by the Corona pandemic, posing a need for virtual rather than in-person interactions for campaign planning.
The server is based on Flask-SocketIO and can be deployed, for example, by a Gunicorn web server with an Eventlet worker. Usually, NGINX is then used as a WebSocket reverse proxy. The MSColab server is configured by a Python script, very similarly to the MSWMS server. Here, the user can specify the database driver and, for example, the cross-origin resource sharing (CORS) origins for communications with your server.
The MSColab component allows multiple users to jointly work on a single operation. An operation is thereby the general activity of performing a measurement flight – including, in particular, its flight track – but it extends this with additional features. Specifically, each operation consists of a (version) history of the contained flight track, a fine-grained user permission mode, and an associated real-time chat component, which is also used to communicate changes to the managed flight track. Each operation can be assigned different users with different roles: admin, creator, collaborator, and viewer. For example, a user with the admin or creator role can add users to the operation. A user with the collaborator role can edit the flight path, and one with a viewer role can only view.
The flight track of the active operation can be simultaneously displayed within the MSUI client for all participants. Depending on their role, each participant may or may not modify it. Each change results in a new revision, and all attached MSUI clients are updated immediately. The CORS implementation of the server allows the development of plugins with access to the flight track in other software products, e.g. a prototype plugin for the Windy website (Windy, 2022) is available.
This feature is fully integrated into the MSUI client, which remains fully functional for designing a flight track even without an MSColab server. But with such a server, MSUI supports multi-user collaboration on operations that are stored on the server.
The Southern Hemisphere Transport, Dynamics, and Chemistry–Gravity Waves campaign (SouthTRAC-GW; Rapp et al., 2021) took place from September to November 2019, operating from bases located at Oberpfaffenhofen, Germany, and Rio Grande, Argentina. The scientific objectives were very diverse, ranging from examining air polluted by biomass burning in the tropics (Johansson et al., 2022) (and, as a target of opportunity, Australia; Ohneiser et al., 2022), the breakdown of the Antarctic polar vortex and the associated chemical and physical structure, the general chemical composition of the Southern Hemisphere's upper troposphere–lower stratosphere (Johansson et al., 2022), to studying gravity waves. Some exemplary outcomes from the gravity wave part of the SouthTRAC campaign include clear-air turbulence studies (Rodriguez Imazio et al., 2022; Dörnbrack et al., 2022), gravity wave propagation from the Southern Andes and the Antarctic peninsula into the mesosphere (Reichert et al., 2021; Conte et al., 2022), gravity wave observation and model intercomparison (Gisinger et al., 2022; Dörnbrack et al., 2022; Liu et al., 2022; Alexander et al., 2022), mountain waves drifting upwind of the Andes (Krasauskas et al., 2022), gravity wave refraction due to wind shear (Geldenhuys et al., 2022), and gravity waves from orographic and non-orographic sources (Alexander et al., 2022; de la Torre et al., 2022).
In this section, we will take a more practical view on the setup of the MSWMS server for the campaign and the use of the MSUI client for the planning of one of the research flights as an example.
3.1 Data products
An outstanding part of MSS use is the interplay between scientific mission goals and available data products. The usefulness of the tool largely depends on defining a comprehensive set of products to be displayed, which must be implemented within the MSWMS component. Here, we will give a brief overview of the most important mission-specific data products we generated and/or made available for this campaign.
3.1.1 Gravity wave analysis
An important objective of the SouthTRAC campaign was the measurement of gravity wave propagation into the upper atmosphere. To that end, we set up a processing chain operating on ECMWF forecast temperature data. First, the background temperature structure was removed by means of a detrending routine (Strube et al., 2020). This generates 4-D temperature residuals, which are largely caused by gravity wave activity. Second, the sine fit 3D (S3D) gravity wave analysis program analysed the temperature residuals to identify gravity wave parameters such as amplitude, wave length, or momentum flux on three separate atmospheric layers (Lehmann et al., 2012). Both the residuals and the parameters are offered as layers on the MSWMS server. Some examples for generated plots are given in Fig. 5.
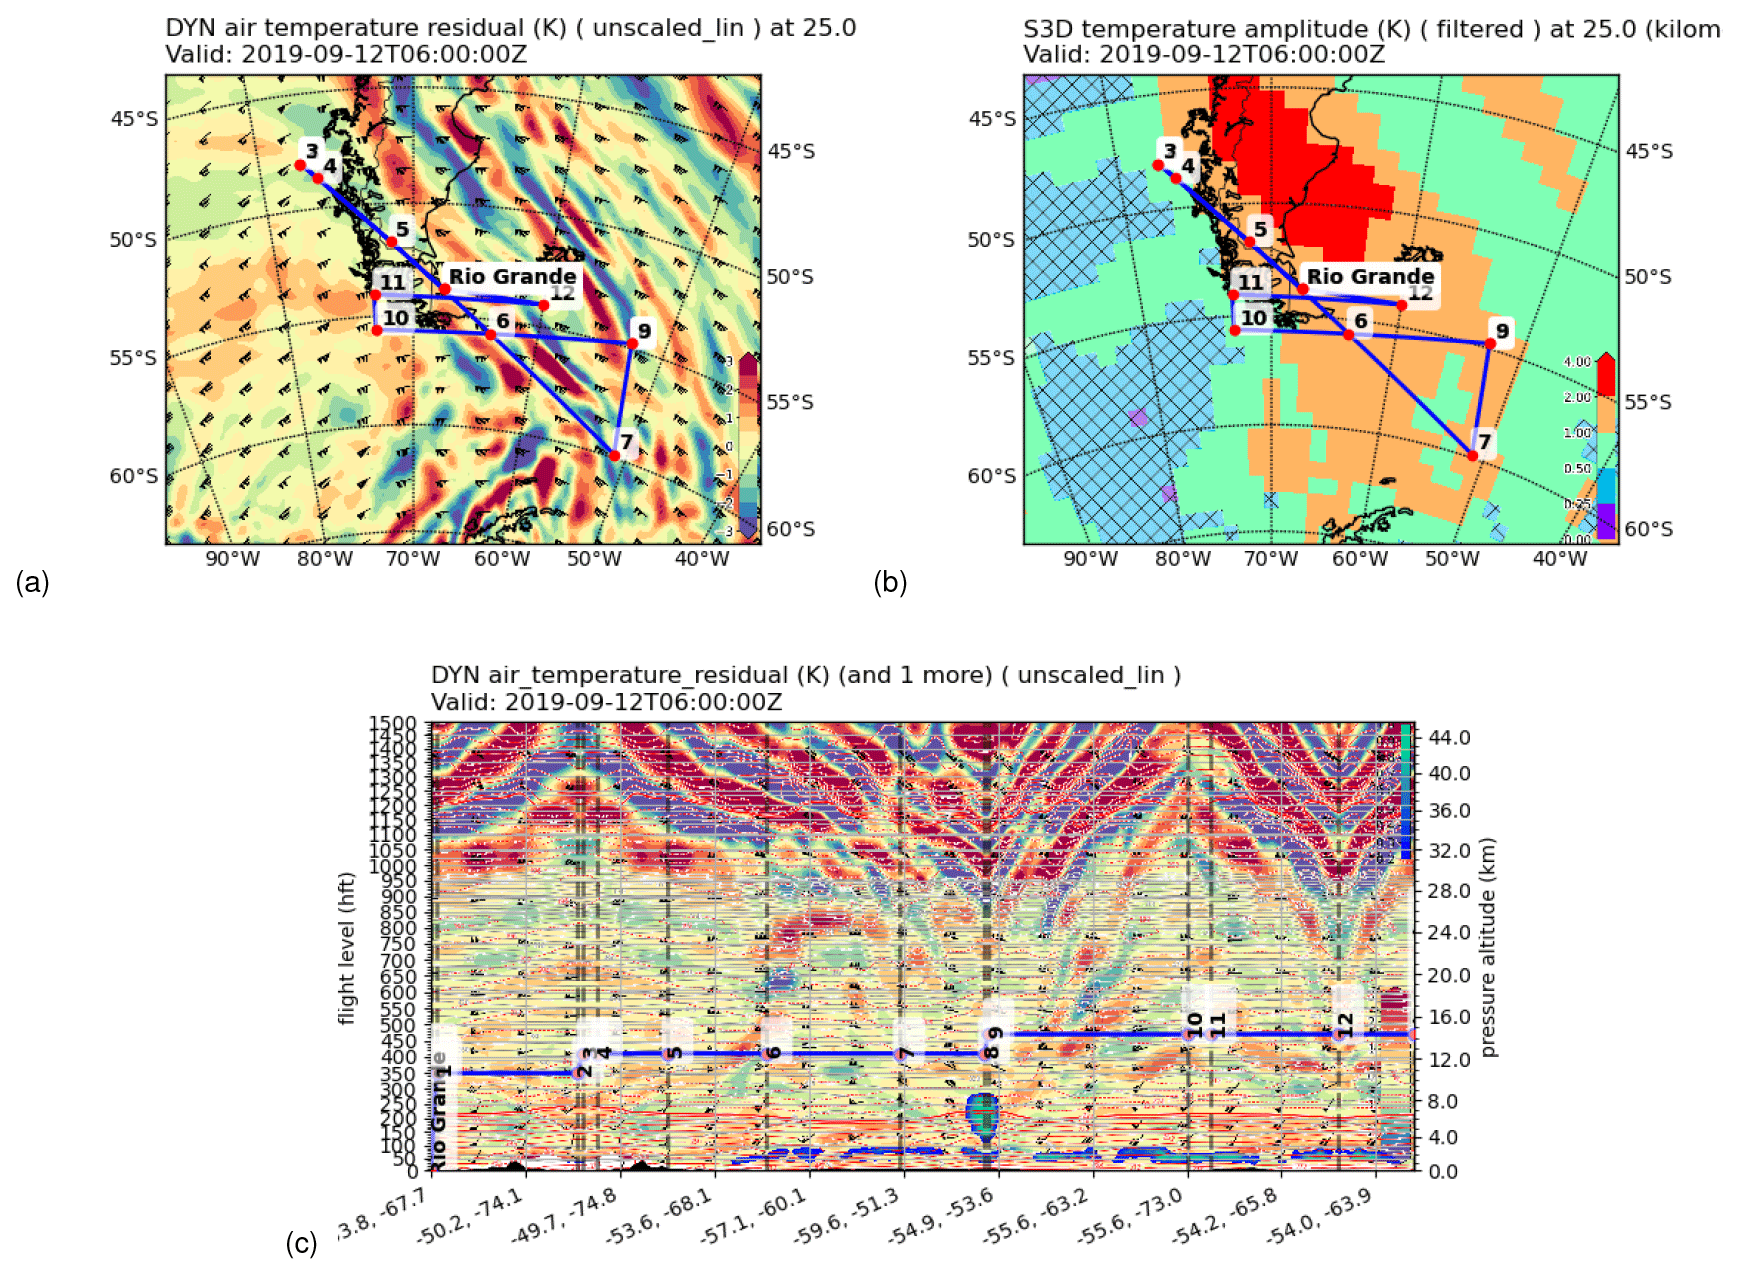
Figure 5Gravity wave analysis figures: temperature perturbations derived from ECMWF data at 25 km altitude (a); derived gravity wave amplitudes, with hatched regions indicating high uncertainty at the same altitude (b); temperature perturbations derived from one time step of ECMWF data sampled vertically along the planned flight path (c) – a cloud layer is displayed on top using the new multi-layering feature.
3.1.2 AIRS brightness temperatures
An important part of the post-campaign analysis was envisioned to follow the gravity wave propagation to higher altitudes and to identify the waves measured closer to ground level by aircraft measurements in satellite data. To this end, we implemented two data products: on the one hand, we added near-real time data of brightness temperature perturbations, as measured by the Atmospheric InfraRed Sounder (AIRS) aboard the National Aeronautics and Space Administration's (NASA) Aqua satellite (Hoffmann et al., 2013, 2016); on the other hand, we implemented a scheme that predicted brightness temperature perturbations as detected by AIRS based on the temperature residuals derived from ECMWF forecast data. To that end, we employed Jacobian matrices computed by the Juelich Rapid Spectral Simulation Code (JURASSIC) forward model (Hoffmann and Alexander, 2009) for standardised polar-night atmospheric profiles. Multiplying these Jacobian matrices with the temperature residuals allows one to immediately estimate the AIRS brightness temperature perturbations for this situation.
Having both products available also allowed us to examine the reliability of the forecast by comparing the original forecast perturbations with the actually measured ones. The actual AIRS data also allowed us to identify matching structures quickly after the flights took place, thus allowing a quick first analysis. Some examples are given in Fig. 6. The forecast brightness temperature residual data product has proven to be largely reliable for forecasting strong gravity wave structures visible to AIRS for the upcoming days.
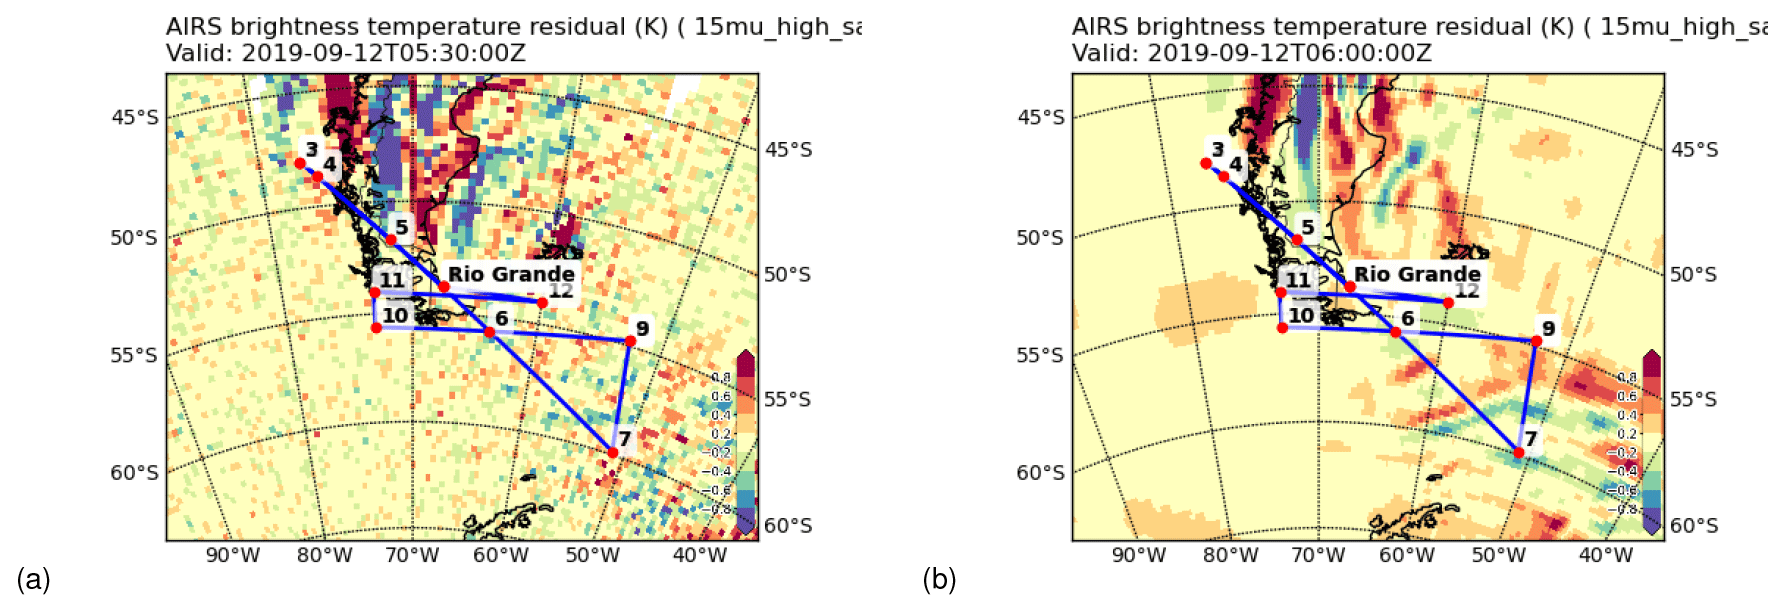
Figure 6AIRS-related figures: brightness temperature perturbation from AIRS 15 µm measurements (a); brightness temperature perturbations predicted by ECMWF model temperatures (b).
3.1.3 Further dynamics-related plots
Aside from the main plots for gravity wave forecasts described above, a number of ancillary plots were provided to be used for analysing the general synoptic situation or for more specific scientific topics. The examples shown below showcase the more advanced plotting capabilities of the MSWMS server, which combine multiple data products into one dedicated plot.
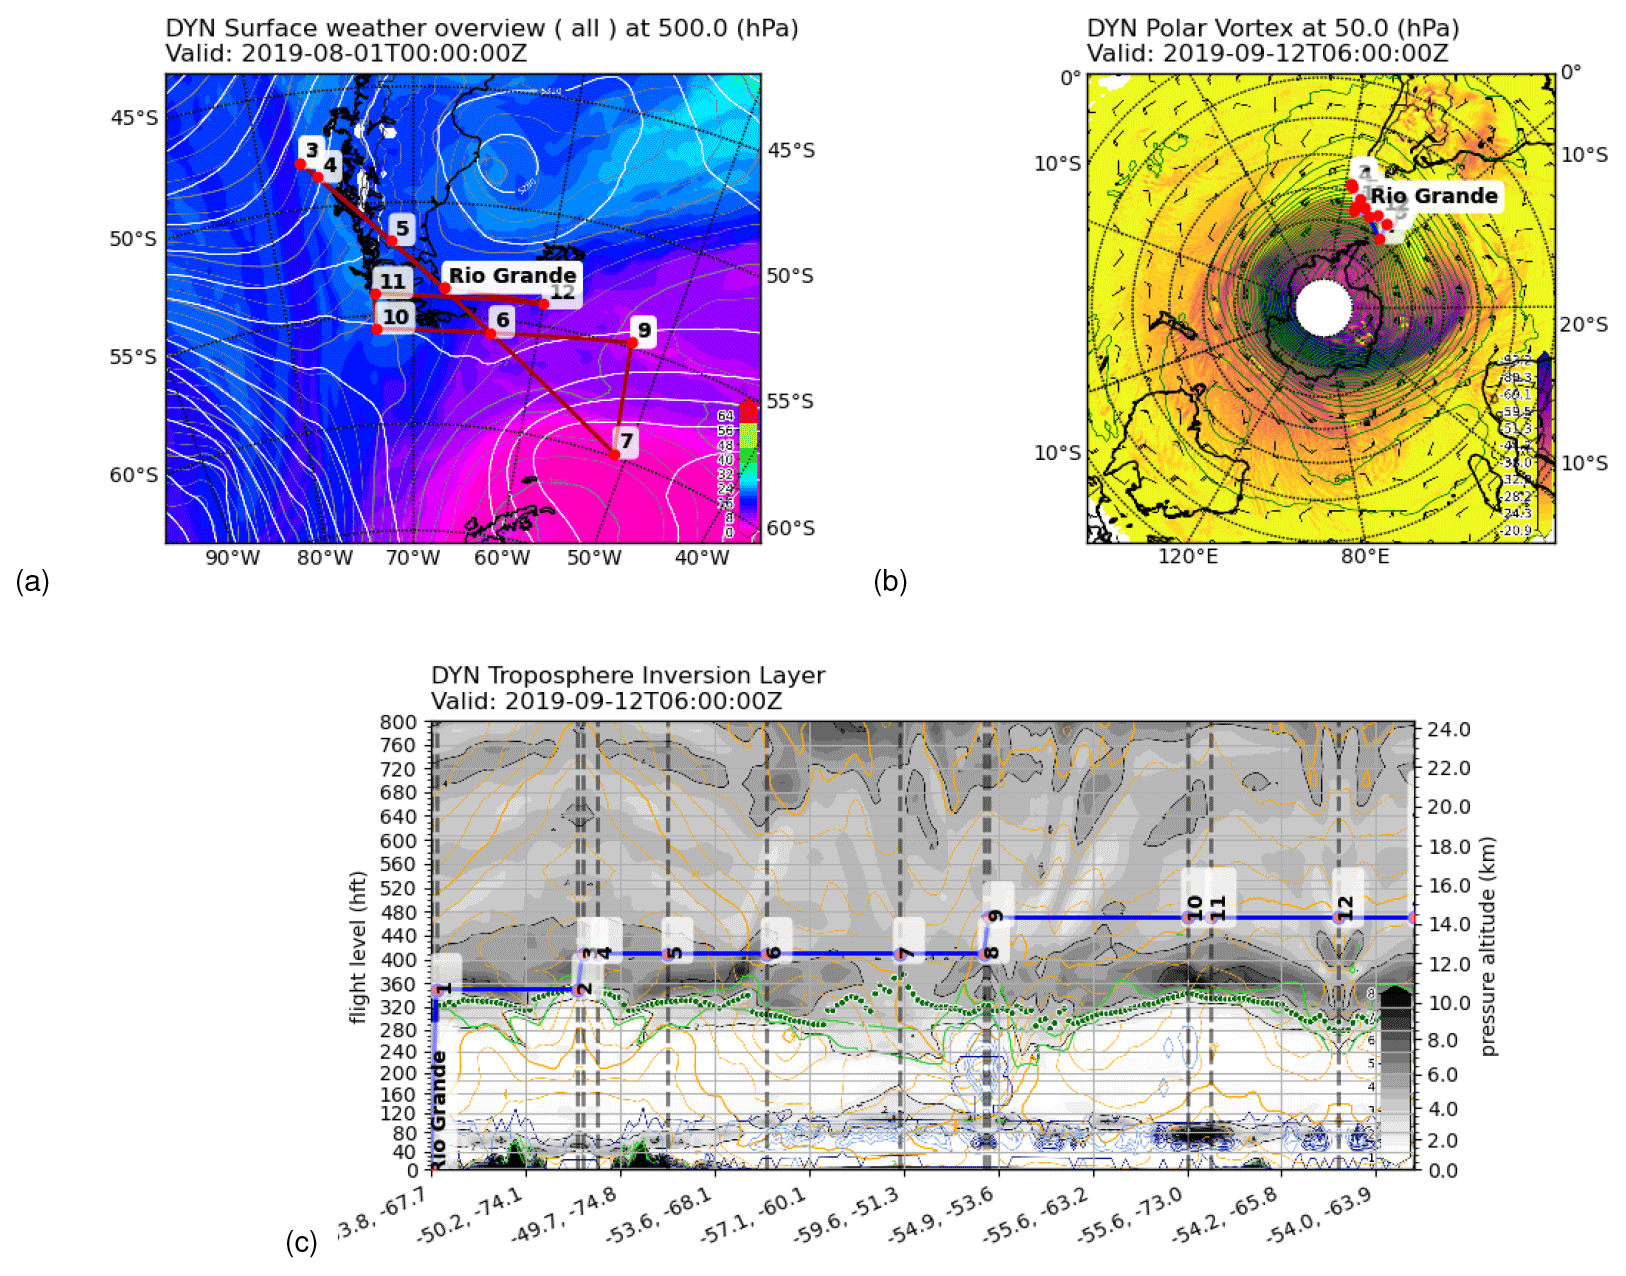
Figure 7Dynamics-related plots: surface weather-related plot (panel a; equivalent potential temperature at 850 hPa (∘C) as coloured contour surfaces, sea level pressure (hPa, grey), and geopotential height at 500 hPa (m, white) as contours); state of the polar vortex (panel b; Ertel's potential vorticity at a given altitude as coloured contour surface (PVU), geopotential altitude as green contours, and wind speed as barbs); static stability and tropopause inversion layer diagnostics (panel c; square of Brunt–Vaisala frequency (greys, 1×10⁴ s−2), horizontal wind speed (orange, m s−1), potential vorticity (green, PVU), cloud liquid water (navy, g kg−1), cloud ice water (light blue, g kg−1), thermal tropopause (dark green)).
The surface weather is depicted in a meteorological standard plot in Fig. 7a, where equivalent potential temperature at 850 hPa is combined with sea-level surface pressure contours and geopotential height at 500 hPa. This plots allows one to identify frontal systems and to estimate their development in the near future. The second plot in Fig. 7b depicts the state of the Antarctic vortex at 50 hPa, which was used to identify regions where gravity waves could propagate to high altitudes and to examine the state of the vortex itself during the sudden stratospheric warming event. Panel (c) of Fig. 7 shows a vertical cross-section bringing together several ECMWF data products. The grey colours indicate the static stability in combination with the dynamic (light green contours) and thermal (dark green dots) tropopause. The horizontal wind speed (orange contours) allows the identification of jet streams, whereas the presence of clouds (light and dark blue contours) can be used to diagnose radiative effects on the tropopause. This plot is useful for identifying interesting dynamic situations in relation to tropopause inversion layers (see Kunkel et al., 2019 for the inspiration for this plot).
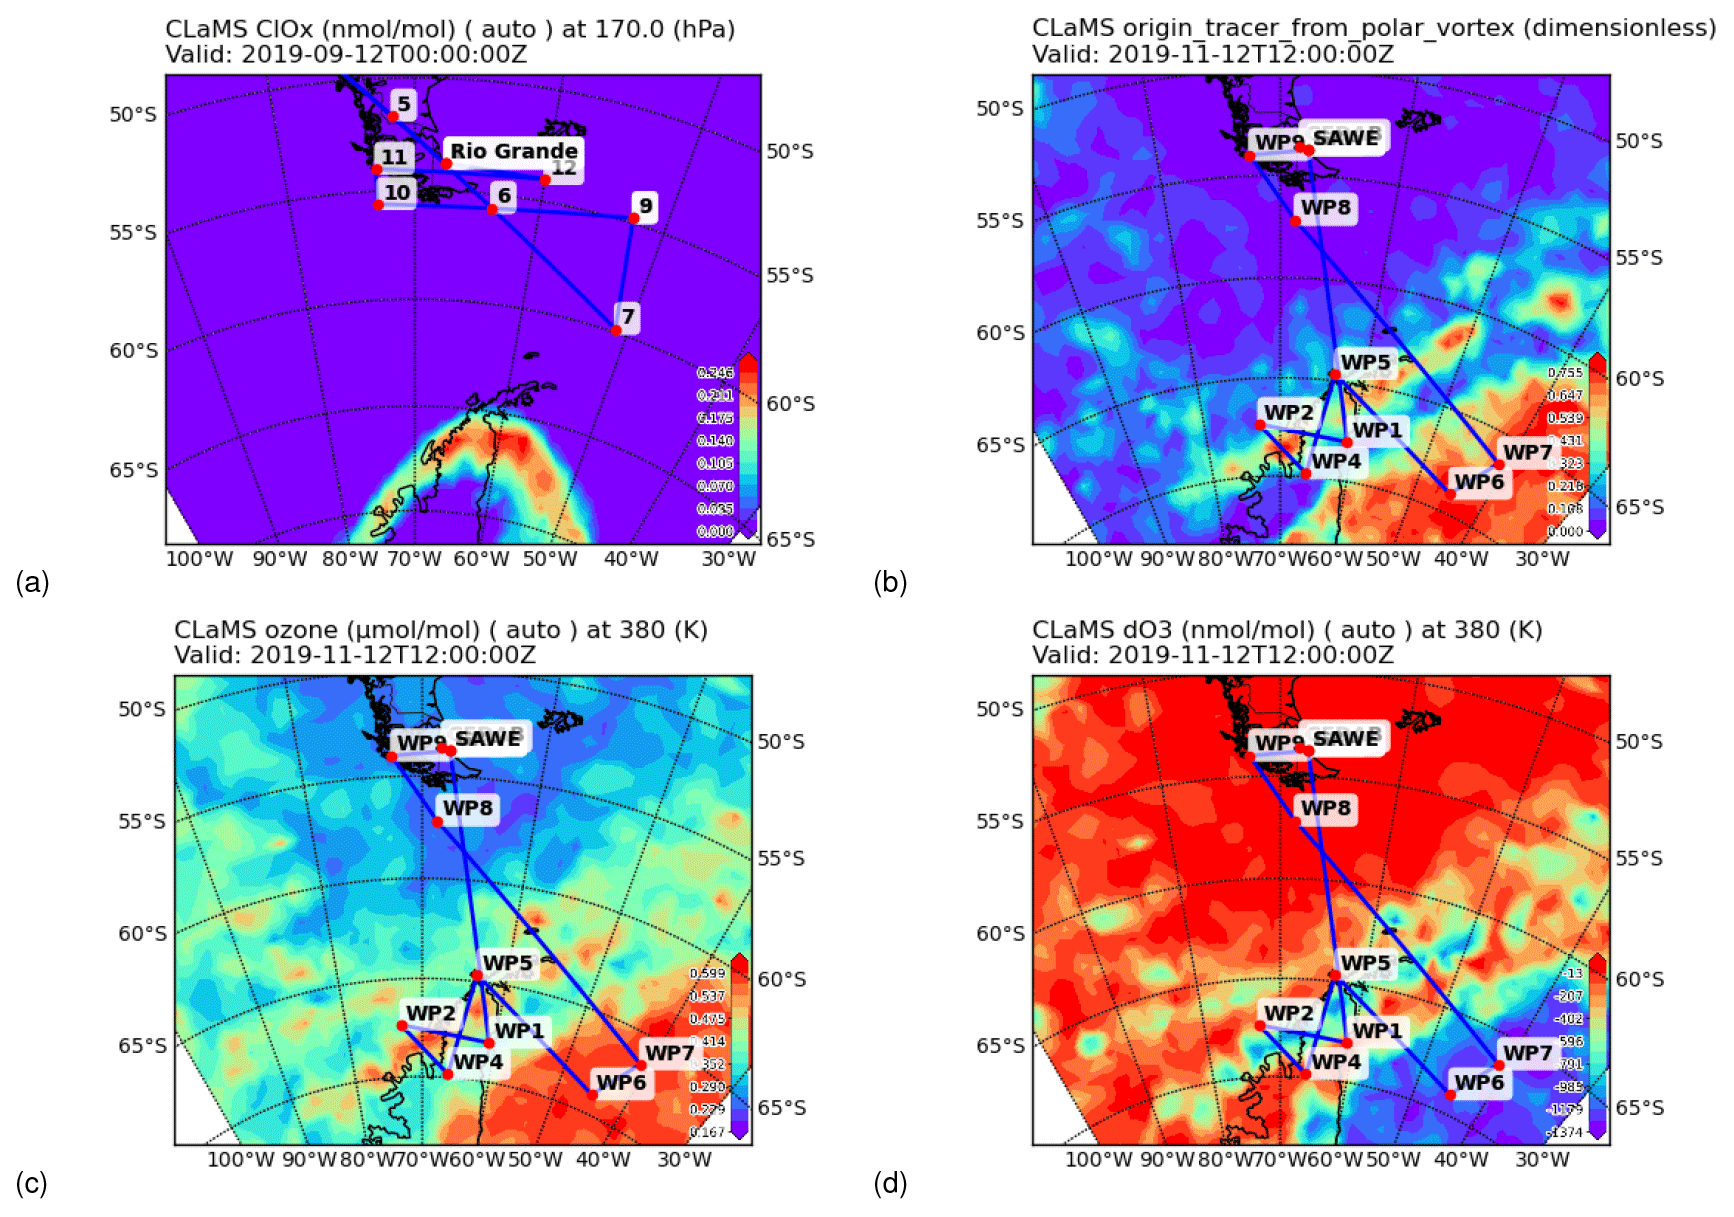
Figure 8Chemistry-related plots: active chlorine ClOx for flight ST08 (a); the origin tracer from polar vortex for flight ST25 (b); ozone mixing ratio (c); and simulated accumulated ozone depletion (dO3) (d). Panel (a) is in cylindric projection, while the others are in stereographic projection. Panels (c) and (d) also show the borders of the Flight Information Regions (FIR) as green lines (kml overlay).
3.1.4 CLaMS chemical forecasts
For the SouthTRAC campaign, forecasts of the chemical composition of the atmosphere by the Chemical Lagrangian Model of the Stratosphere (CLaMS; McKenna et al., 2002b, a) have been provided. As a full global integration for each of the envisaged output time steps is numerically rather costly, the forecasts were provided by the reverse domain filling (RDF) method. For that, a regular-spaced latitude and longitude grid for each level in the forecast area is defined for each forecasted time step. For those points, Lagrangian back trajectories are calculated until the time where the global simulation is available. Typically, this time is the previous day at 12:00 UTC. Only along those trajectories is the CLaMS chemistry scheme integrated to provide the chemical composition for the above-defined grid points in time and space. In addition to the simulation of the chemical composition, model parameters like origin tracers and accumulated ozone depletion are also provided. Figure 8 shows examples of map projections from the SouthTRAC campaign flight planning. Panel (a) shows the active chlorine ClOx for the above-mentioned gravity wave flight ST08. From this, it is clear that, for this specific flight, the observation of active chlorine in the polar vortex is not compatible with the other flight goals (see Sect. 3.2). Panels (b) to (d) show flight planning plots for the research flight 25 conducted on 12 November 2019, which was dedicated to probing the structure of a filament of vortex origin and also the vortex air itself. Panel (b) shows the vortex origin tracer, a model quantity initialised with 1 inside the vortex and 0 outside and then transported and mixed in the same way as the other chemical compounds. Panels (c) and (d) show the mixing ratio of ozone and the simulated accumulated ozone loss at the potential temperature level of 380 K.
Besides the simulated composition of chemical trace gases, CLaMS also allows one to display special model parameters. These are the so-called surface origin tracers (Vogel et al., 2015) as well as the age spectrum (Ploeger and Birner, 2016). These quantities cannot be measured but give insight of the history of the air masses to be observed. Surface origin tracers are model quantities that are initialised on the lower model boundary, with 1 for a specific source area and with 0 elsewhere. These quantities undergo transport and mixing and have no sink within the atmosphere. Thus, the calculated numbers between 0 and 1 correspond to the fraction of air originating from the specific source area. The age of the air reflects the amount of time since the specific air mass left a source area, such as the tropical troposphere. It is a typical measure of how long an air mass has spent in the Brewer–Dobson circulation (Brewer, 1949; Dobson et al., 1946). Besides the mean age of the air, the so-called age spectrum is also an important quantity. Due to mixing in the atmosphere, air masses with different histories are always mixed. The age spectrum is the calculation of the contribution of different origins of varying age to one specific air mass (Ploeger and Birner, 2016). From that, the following quantities have been derived for display by MSS: (1) the fraction below 6 months of the age of the air, (2) the fraction above 24 months of the age of the air, and (3) the median of the age of the air spectrum.

Figure 9This shows an example of the linear view, with ozone volume mixing rations (blue) and CFC-11 (red) sampled along the flight track.
As an example of a linear-view plot, Fig. 9 shows two trace gas species commonly used as stratospheric (ozone) and tropospheric tracers (CFC-11).
3.1.5 Cirrus forecast
One further important research topic of SouthTRAC was the characterisation of cirrus clouds. Cirrus clouds are composed of ice particles that nucleate upon cooling of the air by different processes. Depending on the number concentration and ice water content, cirrus clouds either have a net cooling or net heating climate effect. The model package CLaMS-ice (e.g. Baumgartner et al., 2022) was developed to simulate the characteristics of these ice particles using a two-moment bulk scheme (Spichtinger and Gierens, 2009) that simulates ice water content (IWC) and ice particle number concentration. From this, a mean mass radius is also calculated. This model is typically calculated along 24 h CLaMS backward trajectories, while the water content is also initialised from the ECMWF operational analysis or forecast. As this simulation is rather costly and scales with the number of forecast points, these forecasts are typically provided in a limited resolution for only a few vertical levels.
3.2 Planning of a research flight
One of the main objectives of the SouthTRAC campaign was to measure the propagation of mountain waves into the polar vortex (Rapp et al., 2021). Mountain waves are excited by the wind blowing across a mountain ridge. Forecasting mesoscale phenomena like mountain waves calls for both accurate and accessible forecasts.
Mountain waves favour strong wind conditions and require an increase in wind speed with altitude for effective propagation (Sato et al., 2012). A decreasing wind speed with height frequently induces wave dissipation (Geldenhuys et al., 2022). SouthTRAC was dominated by an anomalously early breakdown of the polar vortex (Fig. 7b). The evolving sudden stratospheric warming triggered a rapid slow down in the westerly winds extending down from the polar vortex. This implied reduced propagation heights for mountain waves.

Figure 10Horizontal wind speeds at 1 hPa. Geopotential altitude (m) in green. Wind direction and magnitude also barb.
The rapidly weakening polar vortex endangered the campaign objectives. Hence, the first scientific flight of the campaign was aimed at measuring mountain waves from the Andes propagating as high as possible into the polar vortex. Thus, knowledge of the location of the polar vortex was of the utmost importance. During flight planning, multiple figures like Figs. 7 and 10 were consulted to ensure that the strong wind region (mountain wave pathway) would be probed by the instruments. The plan was to cross the Andes mountains and to align the flight track to the polar-vortex winds at 1 hpa (points 1 to 7 on Fig. 10). By aligning it to the polar-vortex winds, the propagation into the jet could be studied later.
The racetrack pattern (two parallel tracks – points 9 to 12 in Fig. 5) was designed for a dual purpose: the thermal limb sounder Gimballed Limb Observer for Radiance Imaging of the Atmosphere (GLORIA; e.g. Riese et al., 2014) was to observe the mountain waves below flight altitude (down to ≈5 km), and the Airborne Lidar for Studying the Middle Atmosphere (ALIMA; Rapp et al., 2021) above (up to ≈80 km). The objective was to trace the same gravity wave packet from the troposphere to the lower mesosphere. In addition, the racetrack was meant to compensate for a weakness of the ALIMA instrument: it measures at a high resolution over a massive altitude range but only in a 2-D vertical profile. A vertical profile provides a vertical wavelength and an along-track horizontal wavelength. However, by combining two racetracks, the phase orientation of the mountain wave can be estimated and, thus, an accurate horizontal wavelength computed (as done in Geldenhuys et al., 2022).
Successful experiment design requires intimate knowledge of the instruments' strengths and weaknesses. For example, the GLORIA instrument is a limb infrared imager with multiple strengths (e.g. allowing 3-D tomography), but one weakness is that water vapour in clouds saturates the signal, and no measurement is obtained behind the cloud. For this reason, cloud forecasts are of the utmost importance and are closely monitored during flight planning. By studying the vertical cross-section (Fig. 5c), MSUI allows one to easily adjust waypoints and flight days to minimise the impact of cloud cover. Another useful feature of the vertical cross-sections is to ensure that desired targets are indeed measured by all instruments. The forecast in Fig. 5c shows mountain waves predominantly above the flight altitude, with only some seen below over the main Andes (points 5 to 6) and in the racetrack over the south part of Patagonia (points 9 to 12).
Before the flight path is finalised, MSS products are used to check that the flight path does not violate, e.g. penguin protection zones or commercial flight corridors. MSS is also used to check that the flight path does not exceed the range of the aircraft. If the range is exceeded, the flight waypoints are easily adjusted in MSS to reduce the range but also to keep the scientific objectives intact. The flight plan was executed successfully on 12 September 2019, and the obtained observations allow for the first gravity wave refraction study using high resolution observations (see Geldenhuys et al., 2022, for details).
The MSS software package is designed to support scientific aircraft measurement campaigns. It was put to regular and increasing use and greatly matured during the last decade. Thus, it has contributed to the successful implementation of the ML-Cirrus, NAWDEX, POLSTRACC, StratoClim, WISE, CoMet 1.0, EMeRGe, SouthTRAC, CIRRUS-HL, HALO-(AC)3, and TI3GER aircraft measurement campaigns. The focus of development has been to improve the ease of use, both for the actual flight planning and for setting up the MSWMS server component. Most recently, the addition of the MSColab component for collaborative flight planning was found to be very useful during the Corona pandemic; beyond this, it also offers a central location for versioning planned and executed operations.
In particular, we used the MSS for flight planning of the SouthTRAC campaign. The data products we made available have proven very useful during the campaign. As an example, we described the reasoning behind the planning of the first scientific flight and how the available data products supported the definition of the final waypoints. This demonstrates how the scientists can make the best use of MSS. More detailed documentation is beyond the scope of this paper but is available on the web. MSS is an open source project that invites contributions by the community, and so far, each campaign has contributed to its improvement.
MSS is implemented in the Python programming language, with minor parts being written in JavaScript or Shell Script. The package is maintained as a conda-forge (Conda-forge community, 2015) package for easy installation (Bauer et al., 2022c). This allows the installation of MSS on the three major platforms Windows, MacOS, and Linux. MSS depends on many open source libraries, such as NumPy, SciPy, MetPy, Matplotlib, Basemap, palletsprojects, Git, OWSLib, PyQt5, PyFilesystem2, and socketIO.
The software is developed openly in the Open-MSS GitHub project (Mission Support System on github, 2022). There, it is continuously tested by a comprehensive test bench. We also maintain docker images for the purpose of testing or using any component of the software. Since 2019, several students have contributed significantly to the development of the project within the framework of Google Summer of Code (Google Summer of Code, 2022). By now (14 September 2022), the software has 3396 commits by 42 contributors, representing 85 062 lines of code (Mission Support System on openhub, 2022).
The software is licensed according to the Apache License (Version 2.0) (2022).
The following sections describe some technical details interesting for users.
A1 Installing MSS
The software is available on GitHub and as an Anaconda package on conda-forge. In addition, we provide automated installation scripts for Windows, Linux, and MacOS. Specific instructions can be found at https://mss.rtfd.io/en/stable/installation.html (last access: 25 November 2022).
A2 Import and export plugins
We found that different flight crews and scientists have widely varying requirements with respect to which kinds of data formats the flight tracks need to be provided in. Thus, MSS offers a simple way of adding plugins for importing and exporting flight track data in different formats. Included in the installation are several import and export filters located in the mslib.plugins.io module, which also serve as an example for the definition of own plugins. With the Navigational Aids (NAVAID) plugin for exporting flight path data, we give an example that writes out the waypoints in the NAVAID-DME (distance measuring equipment) formalism, which is defined by a radial distance and direction to the nearest NAVAID radio beacon (for documentation, see https://mss.rtfd.io/en/stable/plugins.html, last access: 25 November 2022).
A3 Installing server components
All components are described in https://mss.rtfd.io/en/stable/components.html (last access: 25 November 2022). For development and testing, we use simple and insecure built-in web servers, but for production, one should set up a more advanced robust server. For the MSWMS server, one can use any WSGI deployment. Currently, we provide in our documentation examples for the Apache web server. For the MSColab server, we use Gunicorn and a Nginx proxy.
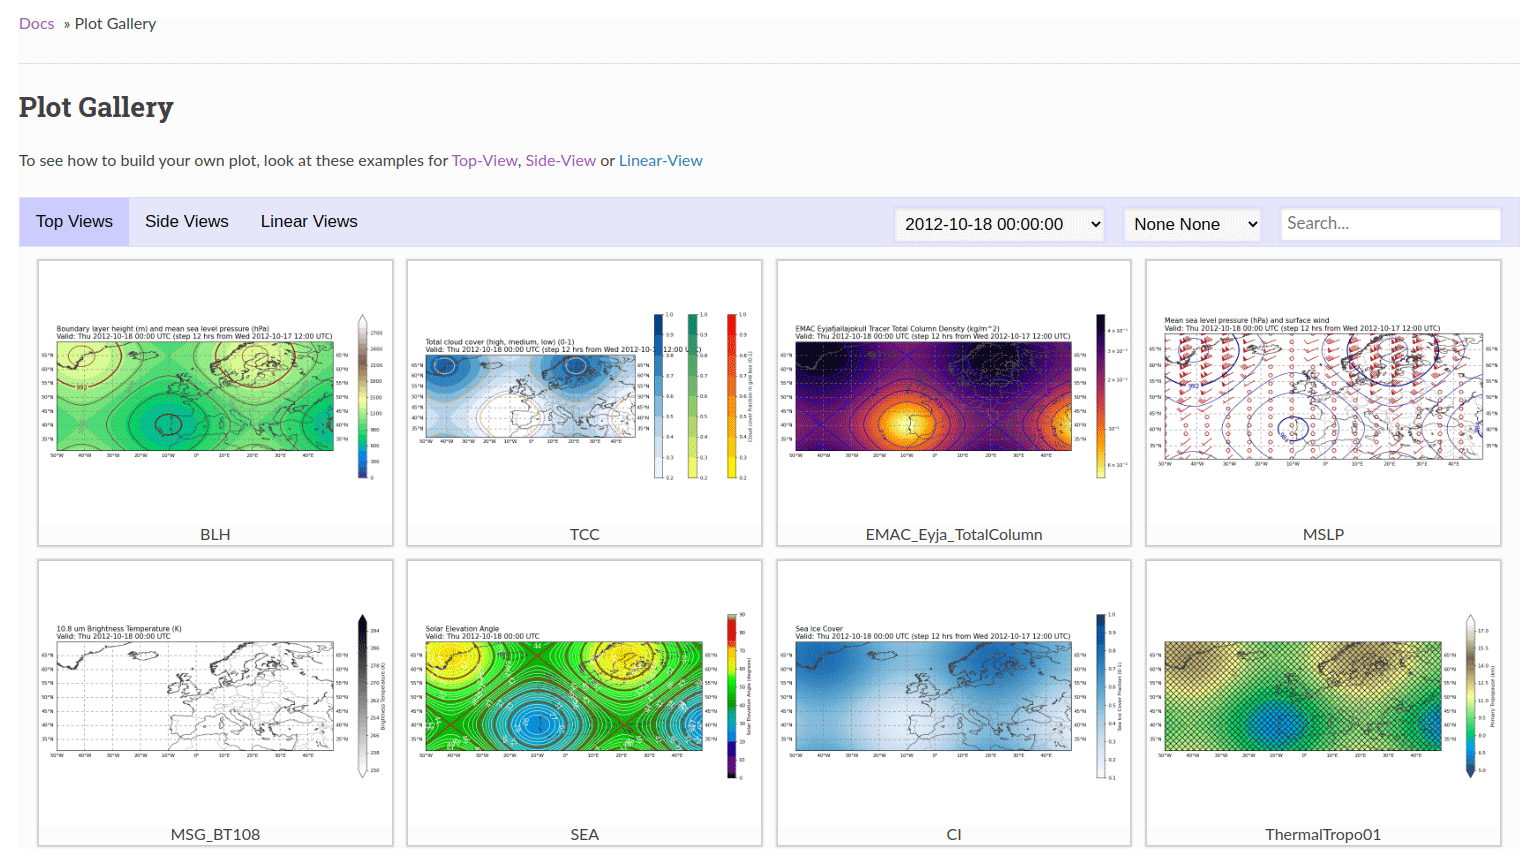
A4 Plot gallery
For the MSWMS server definition, all available plots can be created by the gallery option. An example based on a simple test dataset is available within our documentation (https://mss.rtfd.io/en/stable/gallery/index.html, last access: 25 November 2022). The same data can also be seen in Fig. A1.
MSS has been published under the Apache License 2.0 open source software licence (Apache License (Version 2.0), 2022; Mission Support System on github, 2022). The most recent version is available on GitHub at https://github.com/Open-MSS (last access: 25 November 2022). The current version, v7.0.4, is also available at Zenodo at https://doi.org/10.5281/zenodo.7056451 (Bauer et al., 2022a).
The data used to generate Fig. A1 are contained within the MSS software package. The documentation specifies how to generate and access the data.
RB and JU developed or contributed to all work in this paper and wrote most of it. JUG contributed the CLaMS-related sections. LH provided the AIRS near-real time gravity wave data products for integration into the MSS. MB contributed largely to the MSS development of features described here. MG provided the section on flight planning for SouthTRAC. All authors reviewed the paper and provided textual improvements.
The contact author has declared that none of the authors has any competing interests.
Publisher's note: Copernicus Publications remains neutral with regard to jurisdictional claims in published maps and institutional affiliations.
Atmospheric research with HALO is supported by the Priority Programme SPP 1294 of the Deutsche Forschungsgemeinschaft (DFG). This work was funded by the Deutsche Forschungsgemeinschaft (DFG, German Research Foundation) – UN 311/3-1. The European Centre for Medium-Range Weather Forecasts (ECMWF) is acknowledged for meteorological data support.
This research has been supported by the Deutsche Forschungsgemeinschaft (grant no. UN 311/3-1).
The article processing charges for this open-access publication were covered by the Forschungszentrum Jülich.
This paper was edited by Holger Tost and reviewed by two anonymous referees.
Alexander, P., de la Torre, A., Llamedo, P., Hierro, R., Marcos, T., Kaifler, B., Kaifler, N., Geldenhuys, M., Giez, A., Rapp, M., and Hormaechea, J. L.: The coexistence of gravity waves from diverse sources during a SOUTHTrac flight, Earth and Space Science Open Archive, p. 52, https://doi.org/10.1002/essoar.10511611.1, 2022. a, b
Andrés Hernández, M. D., Hilboll, A., Ziereis, H., Förster, E., Krüger, O. O., Kaiser, K., Schneider, J., Barnaba, F., Vrekoussis, M., Schmidt, J., Huntrieser, H., Blechschmidt, A.-M., George, M., Nenakhov, V., Harlass, T., Holanda, B. A., Wolf, J., Eirenschmalz, L., Krebsbach, M., Pöhlker, M. L., Kalisz Hedegaard, A. B., Mei, L., Pfeilsticker, K., Liu, Y., Koppmann, R., Schlager, H., Bohn, B., Schumann, U., Richter, A., Schreiner, B., Sauer, D., Baumann, R., Mertens, M., Jöckel, P., Kilian, M., Stratmann, G., Pöhlker, C., Campanelli, M., Pandolfi, M., Sicard, M., Gómez-Amo, J. L., Pujadas, M., Bigge, K., Kluge, F., Schwarz, A., Daskalakis, N., Walter, D., Zahn, A., Pöschl, U., Bönisch, H., Borrmann, S., Platt, U., and Burrows, J. P.: Overview: On the transport and transformation of pollutants in the outflow of major population centres – observational data from the EMeRGe European intensive operational period in summer 2017, Atmos. Chem. Phys., 22, 5877–5924, https://doi.org/10.5194/acp-22-5877-2022, 2022. a
Apache License (Version 2.0): https://opensource.org/licenses/Apache-2.0, last access: 14 September 2022. a, b
Bauer, R., Ungermann, J., Grooß, J.-U., Rolf, C., Rautenhaus, M., and MSS AUTHORS: Mission Support System Software Version 7.0.4, Zenodo [code], https://doi.org/10.5281/zenodo.7056451, 2022a. a, b
Bauer, R., Ungermann, J., Grooß, J.-U., Rolf, C., Rautenhaus, M., and MSS AUTHORS: Mission Support System (MSS) data retrieval on github, GitHub [code], https://github.com/Open-MSS/data-retrieval, last access: 14 September 2022b. a
Bauer, R., Ungermann, J., Grooß, J.-U., Rolf, C., Rautenhaus, M., and MSS AUTHORS: Mission Support System (MSS) on conda-forge, Anaconda.org [code], https://anaconda.org/conda-forge/mss, last access: 14 September 2022c. a
Baumgartner, M., Rolf, C., Grooß, J.-U., Schneider, J., Schorr, T., Möhler, O., Spichtinger, P., and Krämer, M.: New investigations on homogeneous ice nucleation: the effects of water activity and water saturation formulations, Atmos. Chem. Phys., 22, 65–91, https://doi.org/10.5194/acp-22-65-2022, 2022. a
Brewer, A. W.: Evidence for a world circulation provided by the measurements of helium and water vapour distribution in the stratosphere, Q. J. Roy. Meteor. Soc., 75, 351–363, https://doi.org/10.1002/qj.49707532603, 1949. a
Conda-forge community: The conda-forge Project: Community-based Software Distribution Built on the conda Package Format and Ecosystem, Zenodo [code], https://doi.org/10.5281/zenodo.4774216, 2015. a
Open Geospatial Consortium: OGC KML 2.3, Version 1.0., edited by: Burggraf, D., Geospatial Consortium, Wayland, MA, Open, OGC 12-007r2, 266 pp, https://doi.org/10.25607/OBP-598, 2015. a
Conte, J. F., Chau, J. L., Liu, A., Qiao, Z., Fritts, D. C., Hormaechea, J. L., Salvador, J. O., and Milla, M. A.: Comparison of MLT Momentum Fluxes Over the Andes at Four Different Latitudinal Sectors Using Multistatic Radar Configurations, J. Geophys. Res.-Atmos., 127, e2021JD035982, https://doi.org/10.1029/2021JD035982, 2022. a
de la Torre, A., Alexander, P., Marcos, T., Hierro, R., Llamedo, P., Hormaechea, J. L., Preusse, P., Geldenhuys, M., Krasauskas, L., Giez, A., Kaifler, B., Kaifler, N., and Rapp, M.: A Spectral Rotary Analysis of Gravity Waves: An Application during one of the SOUTHTrac Flights, Earth and Space Science Open Archive, p. 42, https://doi.org/10.1002/essoar.10512227.1, 2022. a
Dobson, G. M. B., Brewer, A. W., and Cwilong, B. M.: Meteorology of the lower stratosphere, Proc. R. Soc. London A, 185, 144–175, 1946. a
Dörnbrack, A., Bechtold, P., and Schumann, U.: High-resolution aircraft observations of turbulence and waves in the free atmosphere and comparison with global model predictions, J. Geophys. Res.-Atmos., 127, e2022JD036654, https://doi.org/10.1029/2022JD036654, 2022. a, b
Fix, A., Amediek, A., Bovensmann, H., Ehret, G., Gerbig, C., Gerilowski, K., Pfeilsticker, K., Roiger, A., and Zöger, M.: CoMet: an airborne mission to simultaneously measure CO2 and CH4 using lidar, passive remote sensing, and in-situ techniques, EPJ Web Conf., 176, 02003, https://doi.org/10.1051/epjconf/201817602003, 2018. a
International Organization for Standardization: Geographic information – Web map server interface, ISO/DIS Standard No. 19128:2005, 2005. a, b
Geldenhuys, M., Kaifler, B., Preusse, P., Ungermann, J., Alexander, P., Krasauskas, L., Rhode, S., Woiwode, W., Ern, M., Rapp, M., and et al.: Observations of gravity wave refraction and its causes and consequences, Earth and Space Science Open Archive, p. 36, https://doi.org/10.1002/essoar.10511036.1, 2022. a, b, c, d
Gisinger, S., Polichtchouk, I., Dörnbrack, A., Reichert, R., Kaifler, B., Kaifler, N., Rapp, M., and Sandu, I.: Gravity-Wave-Driven Seasonal Variability of Temperature Differences Between ECMWF IFS and Rayleigh Lidar Measurements in the Lee of the Southern Andes, J. Geophys. Res.-Atmos., 127, e2021JD036270, https://doi.org/10.1029/2021JD036270, 2022. a
Google Summer of Code: https://summerofcode.withgoogle.com/, last access: 14 September 2022. a
Hassell, D., Gregory, J., Blower, J., Lawrence, B. N., and Taylor, K. E.: A data model of the Climate and Forecast metadata conventions (CF-1.6) with a software implementation (cf-python v2.1), Geosci. Model Dev., 10, 4619–4646, https://doi.org/10.5194/gmd-10-4619-2017, 2017. a
Hersbach, H., Bell, B., Berrisford, P., Hirahara, S., Horányi, A., Muñoz-Sabater, J., Nicolas, J., Peubey, C., Radu, R., Schepers, D., Simmons, A., Soci, C., Abdalla, S., Abellan, X., Balsamo, G., Bechtold, P., Biavati, G., Bidlot, J., Bonavita, M., De Chiara, G., Dahlgren, P., Dee, D., Diamantakis, M., Dragani, R., Flemming, J., Forbes, R., Fuentes, M., Geer, A., Haimberger, L., Healy, S., Hogan, R. J., Hólm, E., Janisková, M., Keeley, S., Laloyaux, P., Lopez, P., Lupu, C., Radnoti, G., de Rosnay, P., Rozum, I., Vamborg, F., Villaume, S., and Thépaut, J.-N.: The ERA5 global reanalysis, Q. J. Roy. Meteor. Soc., 146, 1999–2049, https://doi.org/10.1002/qj.3803, 2020. a
Hoffmann, L. and Alexander, M. J.: Retrieval of stratospheric temperatures from Atmospheric Infrared Sounder radiance measurements for gravity wave studies, J. Geophys. Res., 114, D07105, https://doi.org/10.1029/2008JD011241, 2009. a
Hoffmann, L., Xue, X., and Alexander, M. J.: A global view of stratospheric gravity wave hotspots located with Atmospheric Infrared Sounder observations, J. Geophys. Res.-Atmos., 118, 416–434, https://doi.org/10.1029/2012JD018658, 2013. a
Hoffmann, L., Grimsdell, A. W., and Alexander, M. J.: Stratospheric gravity waves at Southern Hemisphere orographic hotspots: 2003–2014 AIRS/Aqua observations, Atmos. Chem. Phys., 16, 9381–9397, https://doi.org/10.5194/acp-16-9381-2016, 2016. a
Höpfner, M., Ungermann, J., Borrmann, S., Wagner, R., Spang, R., Riese, M., Stiller, G., Appel, O., Batenburg, A. M., Bucci, S., Cairo, F., Dragoneas, A., Friedl-Vallon, F., Hünig, A., Johansson, S., Krasauskas, L., Legras, B., Leisner, T., Mahnke, C., Möhler, O., Molleker, S., Müller, R., Neubert, T., Orphal, J., Preusse, P., Rex, M., Saathoff, H., Stroh, F., Weigel, R., and Wohltmann, I.: Ammonium nitrate particles formed in upper troposphere from ground ammonia sources during Asian monsoons, Nat. Geosci., 12, 1752–0908, https://doi.org/10.1038/s41561-019-0385-8, 2019. a
Johansson, S., Wetzel, G., Friedl-Vallon, F., Glatthor, N., Höpfner, M., Kleinert, A., Neubert, T., Sinnhuber, B.-M., and Ungermann, J.: Biomass burning pollution in the South Atlantic upper troposphere: GLORIA trace gas observations and evaluation of the CAMS model, Atmos. Chem. Phys., 22, 3675–3691, https://doi.org/10.5194/acp-22-3675-2022, 2022. a, b
Krasauskas, L., Kaifler, B., Rhode, S., Ungermann, J., Woiwode, W., and Preusse, P.: Oblique propagation of mountain waves to the upwind side of the Andes observed by GLORIA and ALIMA during the SouthTRAC campaign, Earth and Space Science Open Archive, p. 37, https://doi.org/10.1002/essoar.10512325.1, 2022. a
Kunkel, D., Hoor, P., Kaluza, T., Ungermann, J., Kluschat, B., Giez, A., Lachnitt, H.-C., Kaufmann, M., and Riese, M.: Evidence of small-scale quasi-isentropic mixing in ridges of extratropical baroclinic waves, Atmos. Chem. Phys., 19, 12607–12630, https://doi.org/10.5194/acp-19-12607-2019, 2019. a, b
Lehmann, C. I., Kim, Y.-H., Preusse, P., Chun, H.-Y., Ern, M., and Kim, S.-Y.: Consistency between Fourier transform and small-volume few-wave decomposition for spectral and spatial variability of gravity waves above a typhoon, Atmos. Meas. Tech., 5, 1637–1651, https://doi.org/10.5194/amt-5-1637-2012, 2012. a
Liu, G., Janches, D., Ma, J., Lieberman, R. S., Stober, G., Moffat-Griffin, T., Mitchell, N. J., Kim, J.-H., Lee, C., and Murphy, D. J.: Mesosphere and Lower Thermosphere Winds and Tidal Variations During the 2019 Antarctic Sudden Stratospheric Warming, J. Geophys. Res.-Space, 127, e2021JA030177, https://doi.org/10.1029/2021JA030177, 2022. a
McKenna, D. S., Grooß, J.-U., Günther, G., Konopka, P., Müller, R., Carver, G., and Sasano, Y.: A new Chemical Lagrangian Model of the Stratosphere (CLaMS): 2. Formulation of chemistry scheme and initialization, J. Geophys. Res., 107, 4256, https://doi.org/10.1029/2000JD000113, 2002a. a
McKenna, D. S., Konopka, P., Grooß, J.-U., Günther, G., Müller, R., Spang, R., Offermann, D., and Orsolini, Y.: A new Chemical Lagrangian Model of the Stratosphere (CLaMS): 1. Formulation of advection and mixing, J. Geophys. Res., 107, 4309, https://doi.org/10.1029/2000JD000114, 2002b. a
Mission Support System (MSS) on github: https://github.com/Open-MSS, last access: 14 September 2022. a, b
Mission Support System (MSS) on openhub: https://www.openhub.net/p/mss, last access: 14 September 2022. a
Oelhaf, H., Sinnhuber, B., Woiwode, W., Bo”nisch, H., Bozem, H., Engel, A., Fix, A., Friedl-Vallon, F., Grooß, J., Hoor, P., Johansson, S., Jurkat-Witschas, T., Kaufmann, S., Krämer, M., Krause, J., Kretschmer, E., Lörks, D., Marsing, A., Orphal, J., Pfeilsticker, K., Pitts, M., Poole, L., Preusse, P., Rapp, M., Riese, M., Rolf, C., Ungermann, J., Voigt, C., Volk, C., Wirth, M., Zahn, A., and Ziereis, H.: POLSTRACC: Airborne Experiment for Studying the Polar Stratosphere in a Changing Climate with the High Altitude and Long Range Research Aircraft (HALO), B. Am. Meteorol. Soc., 100, 2634–2664, https://doi.org/10.1175/BAMS-D-18-0181.1, 2019. a
Ohneiser, K., Ansmann, A., Kaifler, B., Chudnovsky, A., Barja, B., Knopf, D. A., Kaifler, N., Baars, H., Seifert, P., Villanueva, D., Jimenez, C., Radenz, M., Engelmann, R., Veselovskii, I., and Zamorano, F.: Australian wildfire smoke in the stratosphere: the decay phase in 2020/2021 and impact on ozone depletion, Atmos. Chem. Phys., 22, 7417–7442, https://doi.org/10.5194/acp-22-7417-2022, 2022. a
Ploeger, F. and Birner, T.: Seasonal and inter-annual variability of lower stratospheric age of air spectra, Atmos. Chem. Phys., 16, 10195–10213, https://doi.org/10.5194/acp-16-10195-2016, 2016. a, b
Rapp, M., Kaifler, B., Dörnbrack, A., Gisinger, S., Mixa, T., Reichert, R., Kaifler, N., Knobloch, S., Eckert, R., Wildmann, N., Giez, A., Krasauskas, L., Preusse, P., Geldenhuys, M., Riese, M., Woiwode, W., Friedl-Vallon, F., Sinnhuber, B.-M., de la Torre, A., Alexander, P., Hormaechea, J. L., Janches, D., Garhammer, M., Chau, J. L., Conte, J. F., Hoor, P., and Engel, A.: SOUTHTRAC-GW: An Airborne Field Campaign to Explore Gravity Wave Dynamics at the World's Strongest Hotspot, B. Am. Meteorol. Soc., 102, E871–E893, https://doi.org/10.1175/BAMS-D-20-0034.1, 2021. a, b, c, d
Rautenhaus, M., Bauer, G., and Dörnbrack, A.: A web service based tool to plan atmospheric research flights, Geosci. Model Dev., 5, 55–71, https://doi.org/10.5194/gmd-5-55-2012, 2012. a
Reichert, R., Kaifler, B., Kaifler, N., Dörnbrack, A., Rapp, M., and Hormaechea, J. L.: High-Cadence Lidar Observations of Middle Atmospheric Temperature and Gravity Waves at the Southern Andes Hot Spot, J. Geophys. Res.-Atmos., 126, e2021JD034683, https://doi.org/10.1029/2021JD034683, 2021. a
Riese, M., Oelhaf, H., Preusse, P., Blank, J., Ern, M., Friedl-Vallon, F., Fischer, H., Guggenmoser, T., Höpfner, M., Hoor, P., Kaufmann, M., Orphal, J., Plöger, F., Spang, R., Suminska-Ebersoldt, O., Ungermann, J., Vogel, B., and Woiwode, W.: Gimballed Limb Observer for Radiance Imaging of the Atmosphere (GLORIA) scientific objectives, Atmos. Meas. Tech., 7, 1915–1928, https://doi.org/10.5194/amt-7-1915-2014, 2014. a
Rodriguez Imazio, P., Dörnbrack, A., Urzua, R. D., Rivaben, N., and Godoy, A.: Clear Air Turbulence Observed Across a Tropopause Fold Over the Drake Passage — A Case Study, J. Geophys. Res.-Atmos., 127, e2021JD035908, https://doi.org/10.1029/2021JD035908, 2022. a
Sato, K., Tateno, S., Watanabe, S., and Kawatani, Y.: Gravity Wave Characteristics in the Southern Hemisphere Revealed by a High-Resolution Middle-Atmosphere General Circulation Model, J. Atmos. Sci., 69, 1378–1396, https://doi.org/10.1175/JAS-D-11-0101.1, 2012. a
Schäfler, A., Craig, G., Wernli, H., Arbogast, P., Doyle, J. D., McTaggart-Cowan, R., Methven, J., Rivière, G., Ament, F., Boettcher, M., Bramberger, M., Cazenave, Q., Cotton, R., Crewell, S., Delanoë, J., Dörnbrack, A., Ehrlich, A., Ewald, F., Fix, A., Grams, C. M., Gray, S. L., Grob, H., Groß, S., Hagen, M., Harvey, B., Hirsch, L., Jacob, M., Kölling, T., Konow, H., Lemmerz, C., Lux, O., Magnusson, L., Mayer, B., Mech, M., Moore, R., Pelon, J., Quinting, J., Rahm, S., Rapp, M., Rautenhaus, M., Reitebuch, O., Reynolds, C. A., Sodemann, H., Spengler, T., Vaughan, G., Wendisch, M., Wirth, M., Witschas, B., Wolf, K., and Zinner, T.: The North Atlantic Waveguide and Downstream Impact Experiment, B. Am. Meteorol. Soc., 99, 1607–1637, https://doi.org/10.1175/BAMS-D-17-0003.1, 2018. a
Spichtinger, P. and Gierens, K. M.: Modelling of cirrus clouds – Part 1a: Model description and validation, Atmos. Chem. Phys., 9, 685–706, https://doi.org/10.5194/acp-9-685-2009, 2009. a
Strube, C., Ern, M., Preusse, P., and Riese, M.: Removing spurious inertial instability signals from gravity wave temperature perturbations using spectral filtering methods, Atmos. Meas. Tech., 13, 4927–4945, https://doi.org/10.5194/amt-13-4927-2020, 2020. a
Vogel, B., Günther, G., Müller, R., Grooß, J.-U., and Riese, M.: Impact of different Asian source regions on the composition of the Asian monsoon anticyclone and of the extratropical lowermost stratosphere, Atmos. Chem. Phys., 15, 13699–13716, https://doi.org/10.5194/acp-15-13699-2015, 2015. a
Voigt, C., Schumann, U., Minikin, A., Abdelmonem, A., Afchine, A., Borrmann, S., Boettcher, M., Buchholz, B., Bugliaro, L., Costa, A., Curtius, J., Dollner, M., Dörnbrack, A., Dreiling, V., Ebert, V., Ehrlich, A., Fix, A., Forster, L., Frank, F., Fütterer, D., Giez, A., Graf, K., Grooß, J.-U., Groß, S., Heimerl, K., Heinold, B., Hüneke, T., Järvinen, E., Jurkat, T., Kaufmann, S., Kenntner, M., Klingebiel, M., Klimach, T., Kohl, R., Krämer, M., Krisna, T. C., Luebke, A., Mayer, B., Mertes, S., Molleker, S., Petzold, A., Pfeilsticker, K., Port, M., Rapp, M., Reutter, P., Rolf, C., Rose, D., Sauer, D., Schäfler, A., Schlage, R., Schnaiter, M., Schneider, J., Spelten, N., Spichtinger, P., Stock, P., Walser, A., Weigel, R., Weinzierl, B., Wendisch, M., Werner, F., Wernli, H., Wirth, M., Zahn, A., Ziereis, H., and Zöger, M.: ML-CIRRUS: The Airborne Experiment on Natural Cirrus and Contrail Cirrus with the High-Altitude Long-Range Research Aircraft HALO, B. Am. Meteorol. Soc., 98, 271–288, https://doi.org/10.1175/BAMS-D-15-00213.1, 2017. a
Windy: Windy website, https://www.windy.com, last access: 20 August 2022. a, b