the Creative Commons Attribution 4.0 License.
the Creative Commons Attribution 4.0 License.
 | 18 Nov 2022
Simulating long-term responses of soil organic matter turnover to substrate stoichiometry by abstracting fast and small-scale microbial processes: the Soil Enzyme Steady Allocation Model (SESAM; v3.0)
Marion Schrumpf
Sönke Zaehle
Understanding the coupling of nitrogen (N) and carbon (C) cycles of land ecosystems requires understanding microbial element use efficiencies of soil organic matter (SOM) decomposition. Whereas important controls of those efficiencies by microbial community adaptations have been shown at the scale of a soil pore, a simplified representation of those controls is needed at the ecosystem scale. However, without abstracting from the many details, models are not identifiable; i.e. they cannot be fitted without ambiguities to observations. There is a need to find, implement, and validate abstract simplified formulations of theses processes.
Therefore, we developed the Soil Enzyme Allocation Model (SEAM). The model explicitly represents community adaptation strategies of resource allocation to extracellular enzymes and enzyme limitations on SOM decomposition. They thus provide an abstraction from several microbial functional groups to a single holistic microbial community. Here we further simplify SEAM using a quasi-steady-state assumption for extracellular enzyme pools to derive the Soil Enzyme Steady Allocation Model (SESAM) and test whether SESAM can provide the same decadal-term predictions as SEAM.
SESAM reproduced the priming effect, the SOM banking mechanism, and the damping of fluctuations in carbon use efficiency with microbial competition as predicted by SEAM and other more detailed models. This development is an important step towards a more parsimonious representation of soil microbial effects in global land surface models.
- Article
(1644 KB) - Full-text XML
- Companion paper
- BibTeX
- EndNote


Soil organic matter (SOM) dynamics constitutes a strong link of global nutrient cycles because the microbial decomposer community has a rather strict homeostatic regulation of their stoichiometry (Sterner and Elser, 2002; Zechmeister-Boltenstern et al., 2015). Hence, understanding and properly modelling SOM dynamics is required to understand the linkage of the global element cycles of nitrogen (N) and carbon (C) (Thornton et al., 2007; Janssens et al., 2010; Zaehle and Dalmonech, 2011; Todd-Brown et al., 2012; Xu et al., 2014). The discussion about microbial carbon use efficiency (CUE), the ratio between microbial carbon uptake and microbial growth, has received attention in the literature (Wieder et al., 2013; Bradford et al., 2016; Hagerty et al., 2018; Liu et al., 2018; Fatichi et al., 2019) as an important predictor for building up SOM stocks. However, relevant processes happen at the pore scale, and processes strongly vary between microsites and sites. On the other hand we are concerned with dynamics at the pedon or ecosystem scale and strive for general predictions that do not depend on the varying details. Hence, there is a discrepancy in detail and scale between process understanding and what is feasible to implement in global models.
CUE is an emergent value that depends on microbial traits, such as maintenance requirements, and stoichiometric imbalances of the substrates that microbes feed on (Sect. 2.1.1). At the micro-pore scale, Kaiser et al. (2014) have shown that competition between microbes allows for a dampening of CUE fluctuations despite changing stoichiometry of the decomposed SOM. Specifically, by using a detailed individual-based model they showed how the succession of different microbial populations with different substrate preferences sustained high community CUE despite changing substrate stoichiometry.
In a first abstraction step models represent different microbial groups or guilds instead of single microbes (Allison, 2014; Perveen et al., 2014; Huang et al., 2018). This matches the scale of inputs and outputs to the SOM model, making it potentially feasible to implement them as submodels in global models. However, for each microbial group properties and parameters have to be determined. The increase in number of model parameters inflates the risk of equifinality, i.e. simulating the observed data for the wrong reasons, and renders model–data-integration studies difficult. For example Huang et al. (2018) used 11 microbe-related model parameters for each group.
An alternative model abstraction represents a single microbial community with adapting properties by, for example, optimizing microbial growth in the model. This concept was applied in the Soil Enzyme Allocation Model (SEAM) (Wutzler et al., 2017), which was successful in reproducing the simulated patterns of the group-based SYMPHONY model (Perveen et al., 2014).
In a further model abstraction, the effect of changing CUE can be modelled in conventional pool-based models without explicit microbial community by a growth-adapted humification coefficient and stoichiometry-dependent decomposition rates as in the PRIM model (Guenet et al., 2016). However, such a model cannot represent the changes in decomposition rate with apparent CUE depending on biomass properties (Tang and Riley, 2014).
Hence, there is a need for a model abstraction with fewer details that is still able to represent effects of stoichiometry such as priming effects due to N mining from SOM under N limitation (Kuzyakov, 2010) and the banking mechanism (Perveen et al., 2014; Wutzler et al., 2017), where excess available N is stored by SOM build-up and made available again by increased SOM decomposition during periods of N limitation. To meet this need, we previously developed SEAM (Wutzler et al., 2017) and, here, present the Soil Enzyme Steady Allocation Model (SESAM), a further simplification of SEAM.
SESAM is intended to capture the longer-term, i.e. decadal, dynamics of SOM decomposition and abstracts from short-term dynamics, i.e. shorter than seasonal, by applying the quasi-steady-state assumption (Wutzler and Reichstein, 2013) to soil extracellular enzyme pools.
The aim of this paper is to present SESAM without pre-knowledge of SEAM and show that it can reproduce the predictions of SEAM at a decadal timescale and is therefore able to simulate the priming effect due to N mining and the banking mechanism.
2.1 SESAM
The dynamic Soil Enzyme Steady Allocation Model (SESAM) allows exploration of the consequences of soil microbial stoichiometry for SOM cycling at the soil core to the ecosystem scale at a decadal timescale. The modelled system consists of C and N pools in SOM in a volume of soil. Such a system can be a layer of a soil profile or a laboratory incubation. It can be integrated into a larger model that explicitly represents the entire soil column and vertical transport.
Table 1State variables and model drivers. Values refer to the reference state of the sensitivity analysis and were adopted from Wutzler et al. (2017).

∗ Arbitrary high value so that plant uptake is constraint by (Eq. A7c).
SESAM models several SOM pools containing C and N by differential equations for their mass fluxes. Model drivers are inputs of C and N by plant litter (both aboveground litter and rhizodeposition), input of inorganic N from deposition and fertilizers, and prescribed root uptake of inorganic N (Table 1).
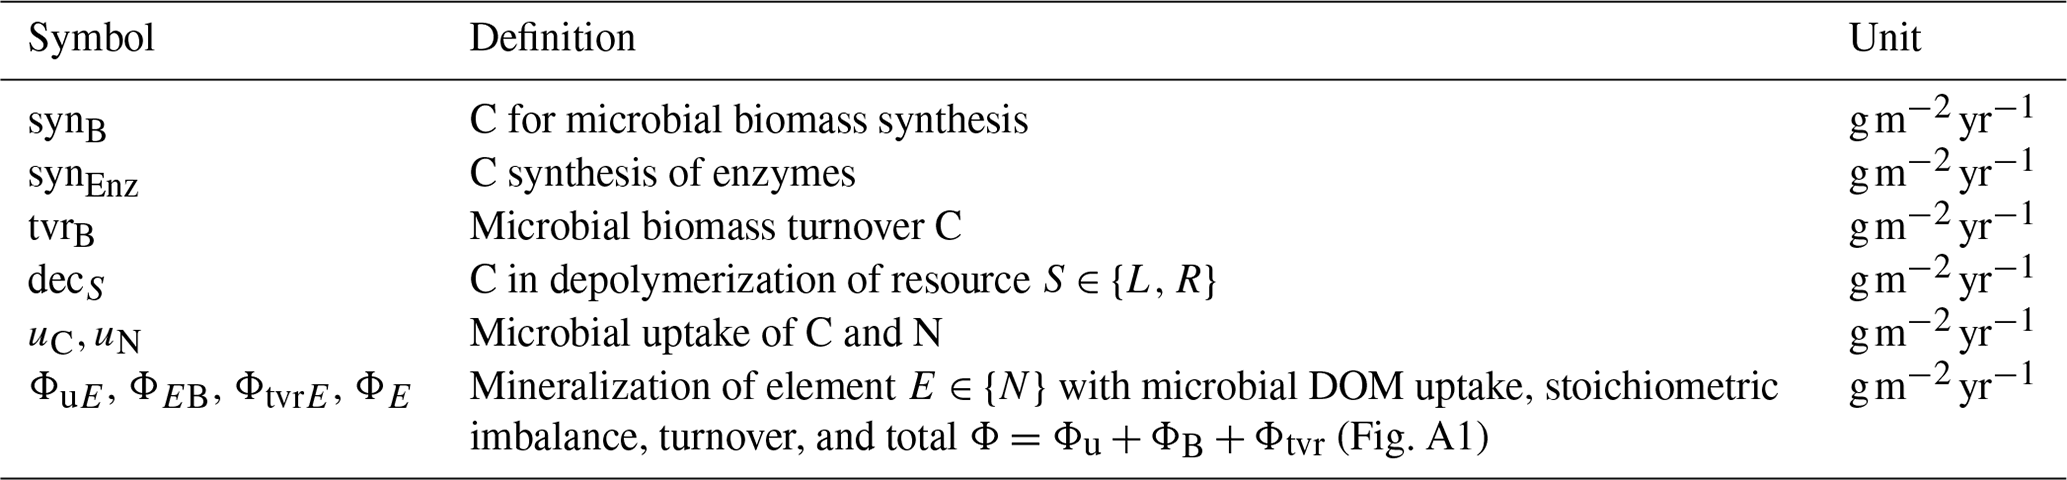
SESAM represents several SOM fractions by several pools that differ by their stoichiometry, and it represents changes in microbial community structure by changing preferences in degrading specific SOM pools. The litter pool, L, is rich in C; the residue pool, R, is richer in N (Fig. 1, Table 1). While Appendix A provides all the detailed model equations, the following paragraph summarizes the most important assumptions. Table A1 explains the symbols used.
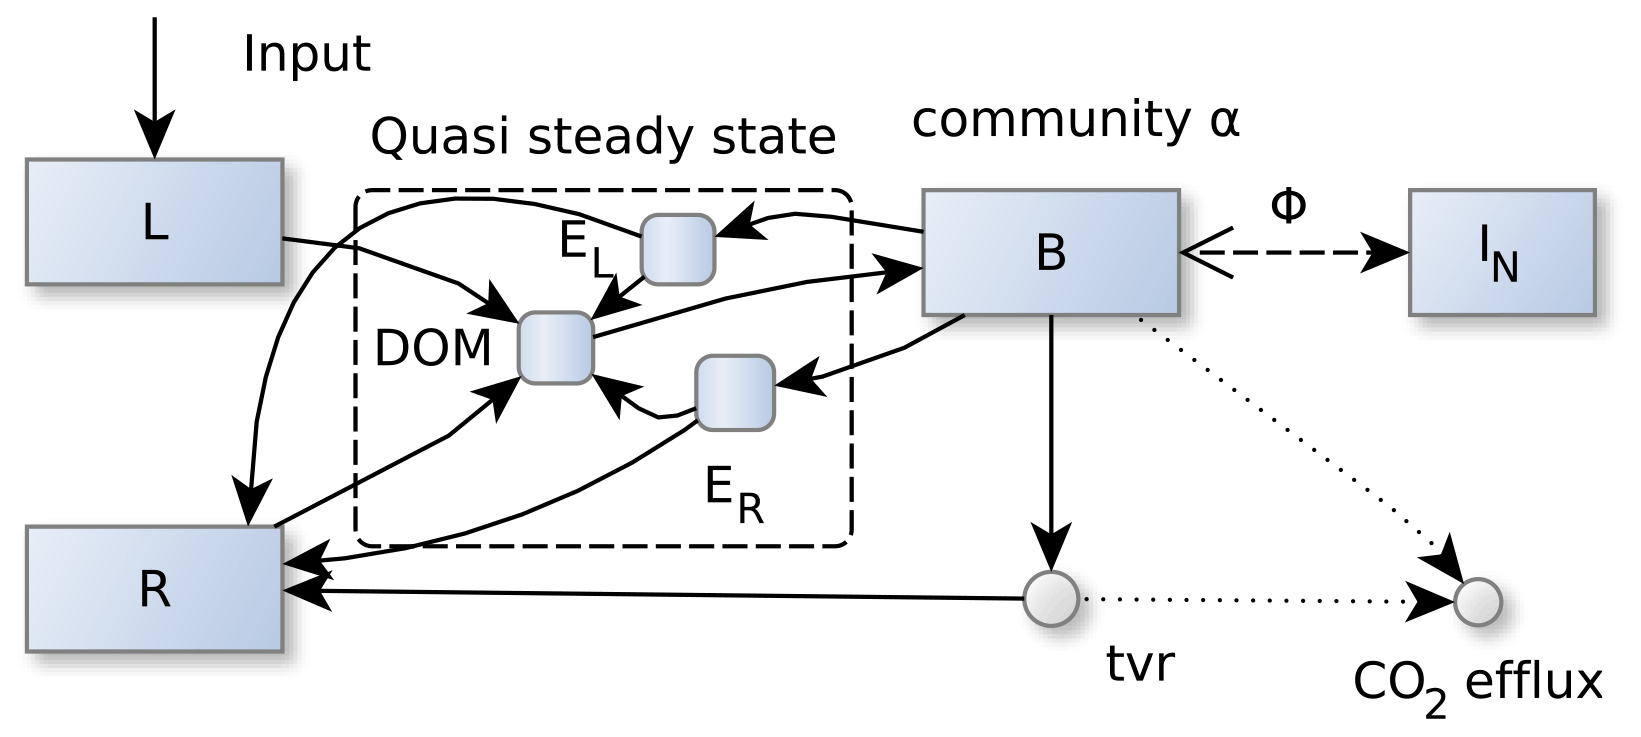
Figure 1SESAM structure: microbial biomass B produces enzymes that depolymerize substrate pools (L and R) that differ in their elemental ratios. Microbial community enzyme allocation α determines which part of the microbial community depolymerizes L versus R by producing respective enzymes EL and ER. Microbes take up dissolved organic matter (DOM) and use it for synthesizing new biomass or new enzymes or for catabolic respiration. A part of microbial turnover (tvr) adds to the residue pool, another part is mineralized, and another part adds to DOM and is recycled into microbial biomass. Stoichiometric imbalance between DOM and B is resolved by mineralizing the excess element or immobilizing the required element (ΦB) from inorganic N (I) (further detailed in Fig. A1). Boxes correspond to pools, disks to fluxes. Solid lines represent fluxes of both C and N, while dotted and dashed lines represent separate C or N fluxes, respectively.
This paper presents model version 3, which in addition to the enzyme steady-state assumption differs from published SEAM (Wutzler et al., 2017) by explicitly tracking community composition, α, as a state variable; by using a modified formula for weighting optimal states near co-limitation; and by using a modified calculation of the revenue, which is used in the optimality assumption. The enzymes are assumed to be in a steady state; i.e. production of enzymes equals their turnover. This assumption allows computation of the size of the enzyme pools based on other pools, simplification of equations, and use of fewer parameters in the overall model. The microbial community is assumed to self-organize in ways to optimize growth of the entire community. This involves adjusting the relative proportion of groups that preferentially decompose litter and groups that preferentially decompose microbial residues. The enzymes, which are produced in different shares, in turn affect the decomposition of the respective pools.
Decomposition of the litter and residue pools is modelled by reverse Michaelis–Menten kinetics (Schimel and Weintraub, 2003). ratios, βN, of fluxes are equal to the ratios of the source pools. While the ratios of the substrate pools may change over time due to changing ratio of total influxes to these pools, the ratios of biomass and enzymes are assumed to be fixed. Total enzyme allocation is modelled as a fraction, aE, of the microbial biomass, B, per time. SESAM assumes the DOM pool to be in a quasi-steady state (Wutzler and Reichstein, 2013) and does not explicitly simulate its changes because the dynamics of the DOM pool is usually much faster than the dynamics of the other pools. Therefore, microbial uptake equals the sum of all influxes to the DOM pool, i.e. decomposition plus part of the enzyme turnover. The microbial carbon balance can be negative (i.e. uptake is smaller than maintenance and enzyme synthesis), and then microbial biomass declines.
2.1.1 Soil microbial stoichiometry
SESAM assumes that stoichiometry is one of the overarching controls of decadal-scale SOM changes. It assumes that microbial community and development of different SOM stocks adapt to changes in drivers without the need to explicitly model all the details of this adaptation.
There are three principle ways (Mooshammer et al., 2014b) in which decomposers can adapt to stoichiometric imbalance, i.e. differences in elemental composition between the requirement of feeders and its food (Sterner and Elser, 2002). First, decomposer communities can change their nutrient use efficiencies (Sinsabaugh et al., 2013) by overflow respiration or mineralizing N. For example, if there is more N in DOM uptake for biomass synthesis than constrained by other ways, such as available C, excess N will be mineralized. Such regulation of nutrient use efficiencies has large consequences for loss of nutrients from the ecosystem (Mooshammer et al., 2014a), plant nutrition and soil–plant feedback (Rastetter, 2011), and carbon sequestration in SOM (Allison, 2014; Wieder et al., 2013). Second, microbes can adapt their stoichiometric requirements. There are possible shifts in community composition between species with lower ratio, such as many bacteria, or species with high ratio, such as many fungi (Cleveland and Liptzin, 2007; Xu et al., 2013). However, the range of adjustment is quite constrained. Third, microbial community can alter the stoichiometry of uptake by adapting their preferences of degrading SOM fractions that vary in elemental composition (Moorhead et al., 2012; Li et al., 2021).
SEAM and SESAM assume that a combination of options 1 and 3 is used in a way to optimize growth, and option 2 is negligible. Modelled microbial community develops in a way so that different kinds of enzymes are produced in proportion to their revenue, i.e. the decomposition return per unit of limiting element invested into enzyme production. This microbial enzyme allocation strategy performed better in simulation experiments (Wutzler et al., 2017) than a fixed enzyme allocation or stoichiometrically optimized allocation irrespective of the amount of substrate (Moorhead et al., 2012).
While this adaptive single microbial community was a necessary step in the direction to simplify models, SEAM required two model parameters for the dynamics of the enzyme pools. These parameters are hard to measure and added complexity to model–data integration. The presented SESAM uses only one enzyme-production-related parameter, while the enzyme turnover parameter merges with the half-saturation parameter of the SOM decomposition.
2.1.2 Quasi-steady-state approximation of enzyme dynamics
SESAM abstracts from short-term dynamics of enzyme pools in SEAM by assuming that soil extracellular enzyme pools are in a quasi-steady state (Wutzler and Reichstein, 2013); i.e. pools are at levels where current enzyme production equals enzyme turnover.
It assumes that compared to the intended decadal modelling timescale, the amount of soil extracellular enzyme mass and the composition of the microbial community approach a steady state given the annually smoothed inputs and drivers of the modelled system and current SOM stocks. This yields the enzyme states in Eq. (1).
where denote enzymes depolymerizing litter and residue substrate. αZ is the proportion of biosynthesis invested into the respective enzyme (Sect. 2.1.3); aE is the enzyme production per microbial biomass, B, per time; and kN is the enzyme turnover rate.
This steady-state expression is used instead of the explicitly modelled enzyme pool in SEAM to simplify other equations. For example, decomposition of the residue pool now depends on biomass rather than enzyme levels (Eq. 2).
where km is the half-saturation constant of the original enzyme-limited decomposition equation. In the steady-state equations, half-saturation km and the enzyme turnover rate kN always occur together as a product. Hence, they can be replaced by a single parameter kmN.
We further explored two additional potential simplifying model assumptions. First the microbial biomass can be assumed to be in a quasi-steady state (SteadyB; Appendix F). Second, the mass fluxes from microbial biomass to DOM due to production and turnover of enzymes can be neglected (NoEnzFlux; Appendix E). Both assumptions yielded models with the same number of parameters. The SteadyB variant had one fewer state variable; however, the representation of biomass B by the solution of a third polynomial yielded no further simplification of model equations compared to SESAM. The NoEnzFlux variant still required the parameters for enzyme production to compute revenues and did not result in model simplification.
2.1.3 Community enzyme allocation α
Enzyme allocation α is defined as the proportion of total enzyme synthesis that is invested into production of a specific enzyme. With SESAM it is computed to be proportional to the revenue, i.e. return per investment. It is normalized to add up to unity (Eq. 3).
where revZ is the revenue from a given enzyme Z.
While the original SEAM computed both the return and the investment for each element separately, SESAM computes the revenue based on limitation-weighted return divided by a limitation-weighted investment. The return is determined by the mineralization flux of element E from enzyme action, the investment is calculated by the amount of E required for enzyme production, and the weight for E is determined by the difference in potential growth constrained by other elements and growth constrained by E (Appendix A4). Compared to the original SEAM formulation this avoids the unreasonable high revenues when the concentration of the limiting element in enzymes is low, e.g. for an extension of SESAM which includes phosphorus limitation.
The return of an element E for enzyme Z in SESAM is the flux toward the microbial biomass from decomposition of targeted substrate, S, computed with current steady-state enzyme levels, which are determined by current enzyme production (Eq. 2). Alternatively to decomposition flux, the microbial uptake flux can define the return. This option is discussed in Appendix B, where it is argued that this only differs from the simpler decomposition approach in rare cases.
When inserting the steady-state revenue into Eq. (3), one notices that the revenue in turn depends on current α. Nevertheless explicit formulas for optimal α can be obtained for either assuming C limitation or assuming N limitation. However, situations near co-limitations then pose a problem. At the same substrate levels, a community optimized for C usage is N-limited, while a community optimized for N usage then is C-limited. In SEAM this was prevented by the inertia of explicitly modelled enzyme levels. In contrast, SESAM does not use these explicit formulas to compute α but rather computes the revenues based on current instead of the optimum enzyme allocation. To this end it models α as an additional state variable that develops towards an optimal value, αOpt, that can be computed by Eq. (3) given the current value of α and corresponding decomposition fluxes and revenues (Eq. A13). Since α represents a property of the microbial community, it changes at the timescale of growth and microbial turnover (Eq. A12).
2.2 Increased C input simulations
In order to show the ability of SESAM to reproduce the priming effects due to N mining and the banking mechanism, we repeated the CO2 fertilization experiment in Wutzler et al. (2017). It studied the effect of increased continuous litter C input on SOM cycling. Such increased C input is expected with elevated atmospheric CO2 concentration. The simulations started from a steady state corresponding to initial litter C input of 400 , applied 20 % increased C inputs during years 10 to 60, and applied initial litter inputs again during the next 50 years. The litter N inputs were kept constant over time, implying an increase in the litter ratio of 20 % in annual average litter inputs. Maximum plant uptake rate of inorganic N was set to litter input rate, plus N deposition of of litterfall N was compensated by a small leaching rate.
We compared results of the following model variants:
-
SEAM – baseline model with explicit representation of extracellular enzymes,
-
SESAM – enzyme levels assumed in a quasi-steady state,
-
SESAM-NoEnzFlux – additionally neglecting the mass flux of N from microbial biomass to DOM via enzyme production and turnover (Appendix E),
-
SESAM-SteadyB – additionally microbial biomass assumed in a quasi-steady state (Appendix F).
The derivatives of the model variants were implemented in the R programming language (R Core Team, 2021) and solved, i.e. simulated over time, using the function lsoda from the package deSolve (Soetaert et al., 2010).
2.3 Substrate pulse simulations
In order to show the ability of SESAM to reproduce the damping of fluctuations in CUE with adapting microbial community, we simulated an incubation experiment. SESAM models CUE as an emergent property instead of a model parameter. With the substrate pulse scenario we simulated an experiment similar to the one in Kaiser et al. (2014), who showed that competition among microbial groups controlled the emergent CUE in a spatially explicit model.
In this experiment microbial community decomposes a carbon-rich chunk of initial litter whose initial ratio varied by simulation scenario. Continuous L input rate was set close to 0 to 40 , and N leaching rate was set to zero. CUE was computed as a synthesis of microbial biomass carbon, i.e. excluding enzyme production and turnover, per carbon taken up.
Simulations were compared between SESAM, which has dynamic enzyme allocation, and a model version where we fixed community enzyme allocation αZ=0.5 to not dynamically change over time.
We used the same R-based computational setup as in the increased C input simulations.
2.4 Sensitivity analysis
In order to explore which parameters most influence the steady-state and transient predictions of the increased C input simulation (Sect. 2.2), we performed a global sensitivity analysis using Sobol sensitivity indices (Saltelli et al., 2008) with the soboltouati method in the sensitivity R package using two samples of N = 5000.
For each parameter we prescribed prior distributions of possible parameter values (Table A1). Next, we computed the cumulative probability of initial parameters and sampled cumulative probabilities ± 10 % around this value. Two samples of cumulative probabilities were used to generate design matrices of the sensitivity method. Next we transformed the cumulative probabilities of the design matrices back to parameter values and simulated model output. Hence, we performed a global uncertainty analysis in a subspace of the entire parameter space that covered 20 % of the parameter range of each parameter. This procedure sampled larger intervals for more uncertain parameters and avoided many unreasonable parameter combinations that would occur with a global sensitivity analysis across the entire prior space not accounting for parameter correlations.
We checked robustness of the setting by repeating the analysis by sampling ± 20 % around the reference parameter values to cover 40 % of each parameter range.
While the increased C input simulations (Sect. 2.2) used a high decomposition rate of the residue pool, kR, for demonstrating stock changes after 50 years, the sensitivity analysis and fluctuation analysis used a lower decomposition rate farther away from the edge of the parameter's prior distribution (Table A1) and simulated increased inputs from year 0 to 100. This helped to avoid severely truncated intervals of sampled parameter space around the decomposition rate.
For each model run, we computed (a) the steady-state SOM stocks and (b) the change in SOM stocks after 100 years of increased C input. The computed sensitivity indices tell about the proportion of variance in these outputs due to variation in input parameters by either the single effect of a given parameter (first-order index) or the combined effect with interaction with other parameters (total sensitivity index) (Saltelli et al., 2008; Sobol, 1990).
SESAM was recoded using the Julia programming language (Bezanson et al., 2017) using the package ModelingToolkit.jl (Ma et al., 2021) and solved using the method Tsit5 (Tsitouras, 2011) implemented in the package DifferentialEquations.jl (Rackauckas and Nie, 2017). This allowed faster simulation and the application of global sensitivity analysis.
2.5 Fluctuation nonlinearity experiment
In order to explore the possible bias in long-term predictions due to the enzyme steady-state assumption combined with the non-linearity of its effect on decomposition we simulated strong seasonal fluctuations in litter inputs causing seasonal fluctuations in elemental limitation and enzyme community allocation.
SESAM incorporates nonlinear functions. Hence, average decomposition computed with fluctuating enzyme levels will give different results compared to decomposition computed with first averaging enzyme levels. Hence, the difference between explicitly modelled enzyme levels and steady-state enzyme levels has the potential to introduce bias also in the average long-term predictions.
In order to investigate the effect of both the time-averaging and enzyme steady-state assumption we performed an experiment where we ran both SESAM and a version of SEAM that explicitly tracks enzyme pools but otherwise uses the same formulations, with the setting of the increased C input simulation (Sect. 2.2) and seasonally varying litter input. We imposed higher litter input in autumn and lower input during the rest of the year (Fig. 2) and inspected possible bias in the simulation results.

Figure 2Seasonally fluctuating litter input rate was simulated by assuming 50 % of litter input by aboveground litterfall in autumn only. Physical decay of an aboveground litter pool with turnover time of 2 months then contributed to inputs to the SOM model. At year zero an increase in average annual litter input was prescribed.
The fluctuating litter scenario displayed stiff properties; hence we used the Vern7 method (Verner, 2010) to solve, i.e. simulate the system across time.

Figure 3SOM stocks, here approximated by the sum of litter, L, and residue, R, develop in the same way as the “increased C input” simulation with the different model version. All model variants could simulate the liberation of N from organic R stocks with the stoichiometric imbalance with increased C inputs.
3.1 Increased C input simulations
The imbalance in stoichiometry with increased C input was compensated by shifting enzyme production towards decomposition of the N-rich residue pool. This led to an increase in litter stocks and a decrease in residue stocks over time (Fig. 3). After input stoichiometry returned to initial conditions, the stocks slowly recovered towards the initial state.
Hence, the models simulated microbial N mining, i.e. the behaviour where under increased C input and hence N limitation, N is liberated from SOM. They also simulated the banking mechanism, i.e. the build-up of N-rich SOM stocks when N limitation was relieved.
At this timescale there were no apparent differences between the enzyme explicit SEAM and the quasi-steady-state models SESAM and its SteadyB variant. The NoEnzFlux variant lacked a refuelling of the DOM pool by the N-rich enzyme turnover and hence simulated a residue pool with higher ratio and decomposition slightly shifted towards the residue pool already in an initial steady state. However, the variant predicted the same pattern across time.
3.2 Substrate pulse simulations
CUE varied dynamically in the substrate pulse simulations (Fig. 4). During initial stages there was not enough N in the substrate, leading to overflow respiration and low CUE. The lowest CUE was found with the highest initial substrate ratios. The subsequent accumulation of microbial residues provided a source of N, which helped increase CUE again.
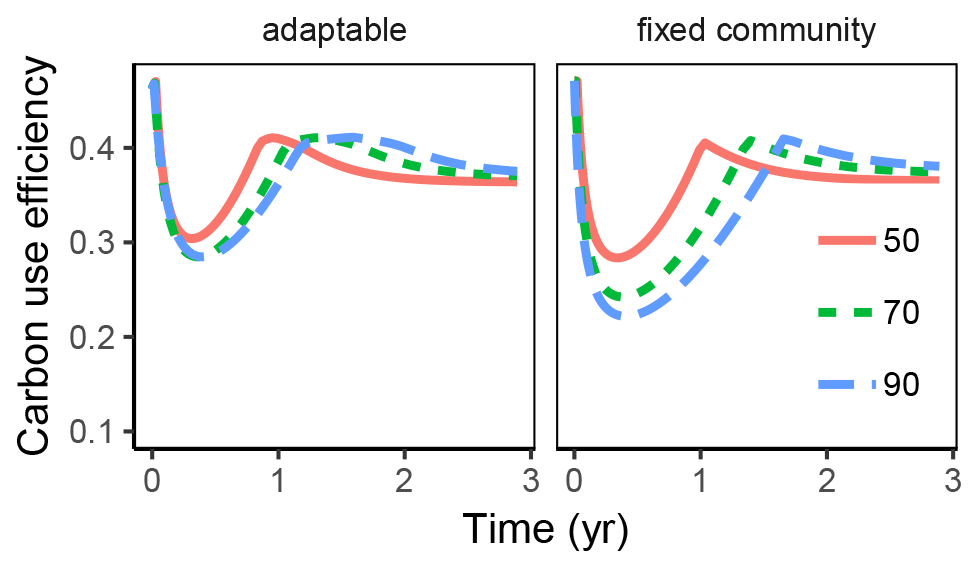
Figure 4Variation in carbon use efficiency (CUE) over time with the substrate pulse simulation is more dampened, i.e. is not changing as much with changing substrate stoichiometry, if microbial community can adapt enzyme allocation compared to fixed allocation. This was true both across time (x axis) and across initial substrate ratio (line colour and line type).
The differences in CUE across time and across initial litter ratios was damped with adaptable enzyme allocation compared to fixed enzyme allocation.
3.3 Sensitivity analysis
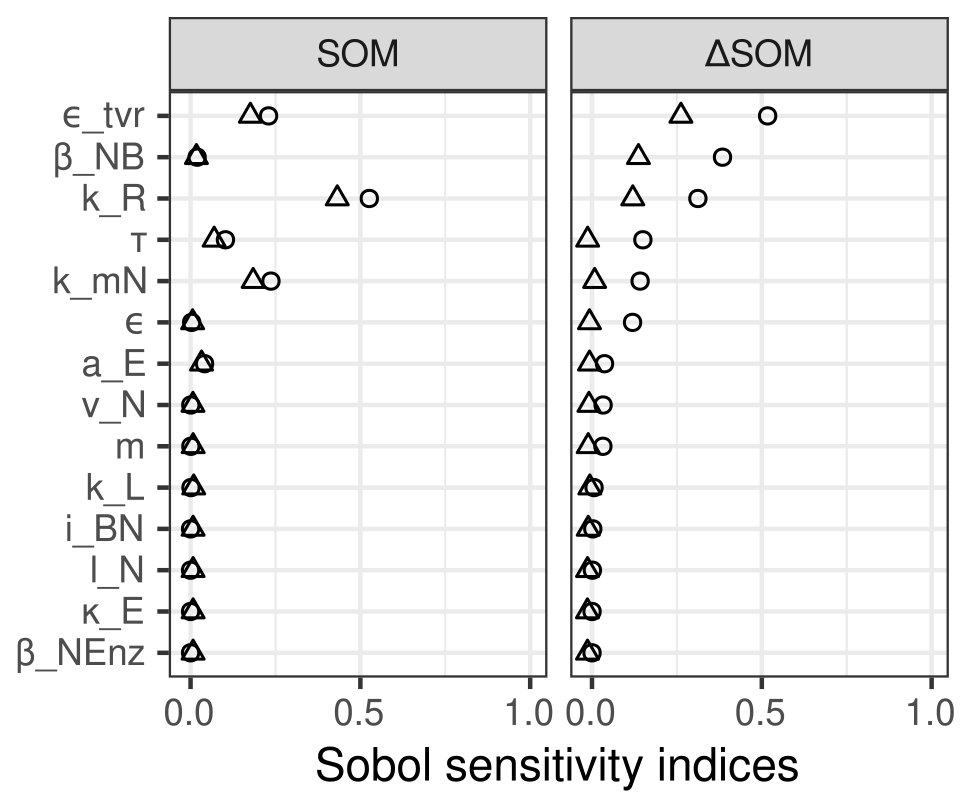
SOM stocks and their transient changes in the increased C input simulation were only sensitive to 5 out of 14 model parameters (Fig. 5). As expected, the total stocks in a steady state were most sensitive to the potential decomposition rate, kR, of the residue pool, which is the largest SOM pool. In addition, they were sensitive to parameters of microbial turnover, τ and ϵtvr, and turnover of enzymes, kmN. Transient changes in SOM stocks were also sensitive to microbial turnover, but not to decomposition rate. Rather they were sensitive to stoichiometric parameters, specifically the ratio of microbial biomass, βNB, and the intrinsic CUE, ϵ.
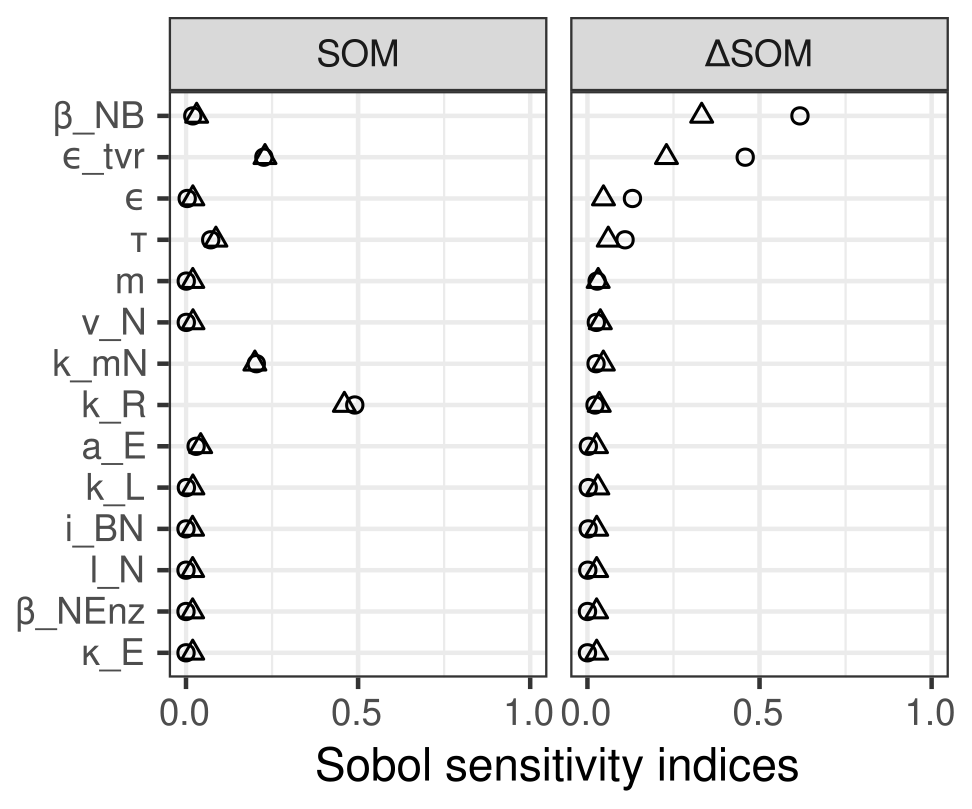
Figure 5Simulated stock change with increased C litter input (ΔSOM) was most sensitive to ratio of microbial biomass (βNB), while initial steady-state stocks (SOM) were most sensitive to turnover rate of the residue pool (kR). Both were sensitive to parameters of microbial turnover. The first-order effects (triangles) were very similar to total order effects (circles) for SOM but not for ΔSOM. This means that effects on steady-state stocks were mostly direct, while the effects on stock changes were mostly sensitive to interactions of parameters.
When repeating the sensitivity analysis on a subspace that included 40 % rather than 20 % of each parameter range, the results were influenced by extreme values due to unusual parameter combinations. We observed similar total effects of SOM stocks, but first-order effects were slightly smaller. SOM stock changes now were additionally sensitive to decomposition rate, kR, and the sensitivity to ratio of microbial biomass, βNB, was less strong (Fig. C1 in the Appendix).
3.4 Fluctuation analysis
Simulation results differed only marginally between steady-state enzymes (SESAM) and explicit representation of enzyme level (SEAM) in the fluctuating litter input simulations (Fig. 6; sesam_annual overplotting seam_annual). This resulted from steady-state enzymes being close to the explicit enzyme levels (Appendix D). Hence, the enzyme steady-state assumptions did not introduce bias in predictions.
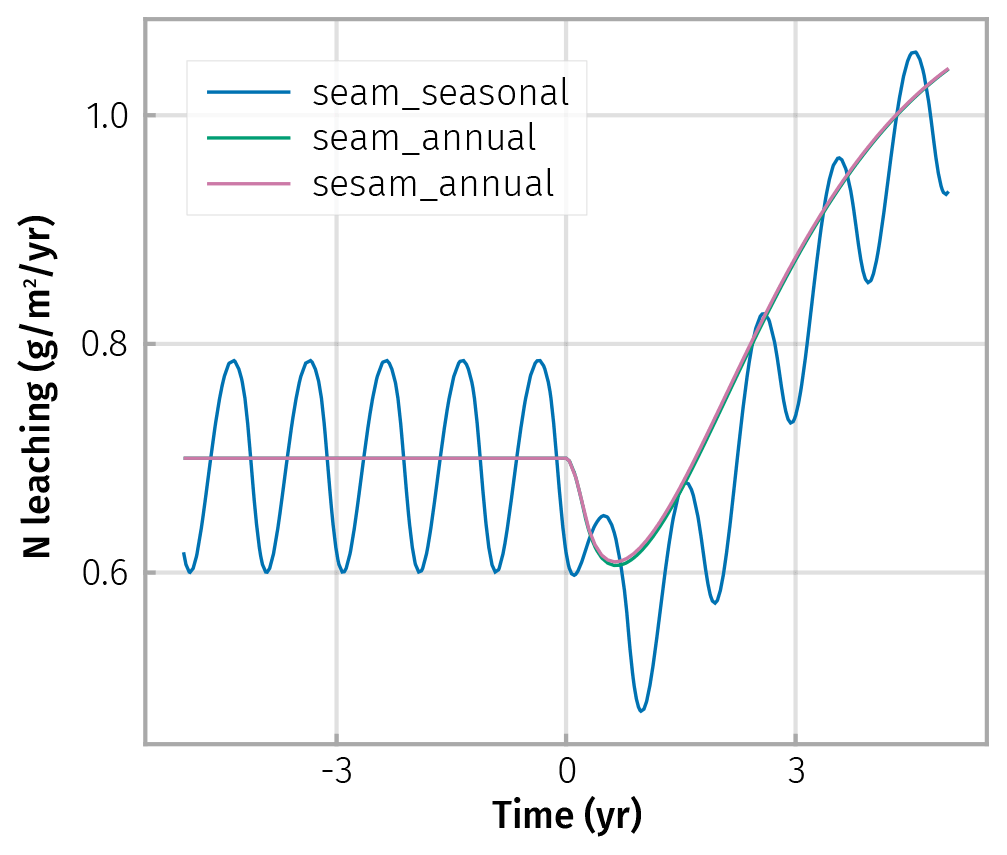
Figure 6Small differences in transient N-leaching between simulation scenarios of seasonally fluctuating litter input (wiggling curves) and annually averaged litter inputs (smooth curves) were caused by different timing of litter input between the scenarios after the prescribed increase in average annual inputs at year zero. Abstraction of enzyme steady states (sesam) did not cause additional differences between the litter scenarios, as seen by overplotting.
Fluxes based on averaging litter inputs also roughly matched the average of the fluxes based on fluctuating litter inputs at a steady state (Fig. 6 before increase in C input at time t<0). Hence, also averaging litter inputs did not introduce bias at a steady state.
The largest simulated differences due to averaging litter input were observed in transient changes in the fast pools, e.g. the inorganic N pool and associated leaching (Fig. 6 after increase in C input at time t>0). This is expected because immediate transient changes depend on the timing of litter inputs within the year.
4.1 Abstract from microbial details at the seasonal and pedon scale
Soil organic matter (SOM) science has experienced a paradigm shift from understanding persistence of SOM formerly on chemical SOM properties towards understanding persistence as an interactive effect of environmental conditions (Schmidt et al., 2011). SOM formation and turnover are expected to be controlled by microbial processes, such as depolymerization of SOM, respiration, mineralization/immobilization, and microbial turnover. Hence, a more mechanistic representation of microbial processes should improve dynamic SOM models and their applicability across different sites. Indeed, microbial models have shown to be able to better represent global patterns of SOM stocks (Wieder et al., 2013). However, differences in representing these microbial processes lead to qualitatively different predictions. Furthermore, it is hard to get observations as required to constrain their parameters (Marschmann et al., 2019).
Microbial processes work on pore spatial scale and hourly to daily temporal scales. In our work we pursue the hypothesis that at the pedon scale and longer decadal-term scale, stoichiometry provides one of the most important constraints (Buchkowski et al., 2019) and that at this scale we can abstract from many detailed processes while keeping the effects that are most important when averaged across pedons and years.
The presented SESAM employs the simplifying assumption of enzyme levels being close to steady-state (Sect. 2.1.2). Further, both SEAM and SESAM abstract from detailed microbial strategies to cope with varying litter stoichiometry such as internal reserves (Manzoni et al., 2021) or energetic trade-offs (Dufour et al., 2021) and neglect smoothing dynamics that occurs when explicitly modelling DOM and enzyme pools. Hence, SESAM was expected to not precisely reproduce seasonal dynamics with litter inputs due to nonlinear effects of enzymes on decomposition. It may predict overflow respiration or excess N mineralization due to stoichiometric imbalance in uptake of DOM due to short-term fluctuations in model drivers.
4.2 Possible bias due to abstraction
Because of the just-explained problems of omitting buffering capabilities of soil microbes to sudden environmental changes, we recommend driving SESAM with annually averaged model drivers. However, averaging inputs together with nonlinear functions can cause bias (Chakrawal et al., 2020; Graham et al., 2019), and also the timing of litter inputs can be important (Luu et al., 2022; Zhou et al., 2021). Specifically, the mostly concave functions of decomposition according to Michaelis–Menten kinetics yield a higher decomposition flux of the average stock (input argument to the decomposition function) compared to the average of the fluxes computed using the fluctuating stocks. Hence, we expected slightly higher decomposition rates and lower stocks with the average litter input scenario. The fluctuation analysis revealed, fortunately, that due to inherent dynamics of community pools, there was no apparent bias due to the enzyme steady-state assumption. Rather, there were only small transient deviations in averaged predictions by driving SESAM with annually averaged litter inputs compared to supplying seasonally fluctuating litter inputs (Fig. 6). This shows that SESAM may be applicable also at shorter timescales under some conditions, although the model has been primarily designed to predict the effect of decadal-term changes considering annually averaged model inputs.
4.3 Simulate patterns emerging from microbial processes
Competition between microbial groups and adaptation of the microbial community is one of the detailed processes that have been shown to exert strong control on decadal-term SOM dynamics (Kaiser et al., 2014). SESAM represents such competition by modelling adaptation of community traits, specifically the allocation of enzyme production. We performed simulation experiments to see whether the model can predict similar patterns to more detailed models. The “substrate pulse simulations” (Fig. 4) reproduced the pattern shown by Kaiser et al. (2014) of more dampened CUE with microbial adaptation, i.e. smaller range of fluctuating CUE on fluctuating substrate stoichiometry. Avoiding the low CUE with litter pulses by shifting the community to grow more on the N-rich substrates helps sequester more C to the soil pools. The “increased C input simulations” (Fig. 3) reproduced the pattern shown by Perveen et al. (2014) of liberating N from SOM stocks during conditions of imbalanced higher C inputs. Making this N available for plants helps them to avoid or delay progressive N limitation (Averill et al., 2015).
Whether increased C inputs lead to decrease in SOM due to priming or to increase in SOM due to larger input of microbial turnover to SOM is still an open question in soil science. As it probably depends on the combination of other constraints such as nutrient availability (Hicks et al., 2021; Vain et al., 2021; Feng and Zhu, 2021), we might gain new insights using the SESAM concept in model–data-integration studies.
Model–data-integration studies require observations at the modelled timescale. SESAM predicts a change in proportion of different SOM pools in response to shifting nutrient limitations. While the relative changes in SOM pools are so small that they are very hard to directly measure, changes can potentially be detected by observing changing ratio of the total SOM (vandenEnden et al., 2021; Melillo, 2019).
4.4 Model complexity and identifiability
Optimal detail or complexity of models depends on the purpose of the model and on the available data to constrain the models (Jakeman et al., 2006). Microbial processes are strongly determined by the pore-scale environment (Pot et al., 2021; Kaiser et al., 2014), and available data are mostly from the laboratory and from hourly to seasonal timescales. Larger-scale compilations are available for stoichiometry of litter, microbial biomass, and enzyme activities (Xu et al., 2013; Zechmeister-Boltenstern et al., 2015) but scarce for microbial growth and turnover rates (Spohn et al., 2016) and element use efficiencies (Manzoni et al., 2018) and very rare for different groups of microbes. Hence, microbial parameters need to be constrained by calibrating models to larger-scale observations.
There are many attempts to directly implement microbial processes into global models with introducing many free parameters (Campbell and Paustian, 2015). For example the ORCHIMIC (Huang et al., 2018) explicitly models several microbial functional types and active and dormant fractions. It introduces nGroup ⋅ 11 microbial parameters. More parameters raise the problem of model identifiability in model inversions. The model may fit the observations for the wrong reasons, and predictions then likely fail for conditions different from that of the calibration.
SESAM aims at reducing model complexity. There are in total 14 model parameters, and long-term SOM stock changes were sensitive to only a few of them. This is a more tractable number of parameters for model inversions, although there will be more parameters for temperature and moisture dependencies and transport when integrated into larger models. Because SESAM targets the decadal-term scale, decadal-term drivers and observations should also be used in SESAM model–data-integration studies. Currently, the free air enrichment experiments are running about 20 years. Thus, obtained observations are getting long enough to calibrate and test models at a decadal timescale.
4.5 Sensitivity of predictions to microbial properties
ratio of microbial biomass, βBN, was the most sensitive parameter for SOM changes (Fig. 5). Hence, the assumption that it can be fixed because its range is rather constrained has to be revisited. We think of future developments to let it change together with other microbial properties of enzyme allocation.
The turnover rate of microbial biomass, τ, was also among the most sensitive parameters. One reason is that it contributes an important source for inorganic N when microbes are N-limited (Joly et al., 2020; Clarholm, 1985). Without predation of microbes and associated mineralization, N would be largely locked in the organic loop. In SESAM microbial turnover it is currently modelled first-order to microbial biomass and predation as a fixed factor of this turnover. A part of the turnover feeds to the DOM pool, and a part adds to the residue pool. Developments of SESAM focus on refining those processes in several ways. Predation rate is smaller at low microbial biomass when predators have to move farther between encountering microbes. Further, the stoichiometry of the parts feeding to DOM and the residue pool will be different because there is different cell material in lysed cells and cell walls. Differences in stoichiometry of microbial decay becoming DOM and decay becoming residue will have a large impact on modelled SOM stocks (Yu et al., 2020).
The application of the quasi-steady-state assumption for extracellular enzyme pools simplified a model of microbial adaptation to substrate stoichiometry. The simplified SESAM could reproduce important effects of microbial stoichiometry on SOM dynamics at a decadal timescale, specifically the priming effect, microbial N mining, the SOM banking mechanism, and dampened CUE. This development is an important step towards more parsimonious representation of soil microbial effects in global land surface models.
For an overview of symbol definitions see Tables 1, A1, and A2.
Table A1Model parameters and distributions used in the sensitivity analysis.

Table A2Further symbols of quantities derived within the system.
A1 Carbon dynamics
where ϵtvr is the fraction of microbial turnover C that is respired by predators, iL is the litter C input to the system, and κE is the fraction of enzyme turnover that is transferred to the DOM instead of the R pool. Details of the specific fluxes are given below.
Total enzyme production synEnz, maintenance respiration rM, and microbial turnover tvrB are modelled as a first-order kinetics of biomass:
With assuming enzyme production and turnover to be in a quasi-steady state and reverse Michaelis–Menten kinetics for substrate decomposition (Schimel and Weintraub, 2003; Tang and Riley, 2019), substrate depolymerization is
where decS,Pot is the decomposition flux when enzymes are saturated, is one of the substrate pools, kS is the maximum decomposition rate of S, αS is the proportion of total investment into enzymes that is allocated to S (Sect. A4), and kmN is a lumped parameter of enzyme half-saturation constant and enzyme turnover.
We assume a quasi-steady state of the DOM pool, and hence, microbial uptake equals the sum of all influxes to the DOM pool (decomposition + part of the enzyme turnover).
With C limitation, CsynBC, the carbon available for synthesis of new biomass, equals the C uptake minus the expenses for enzyme synthesis (Eq. A2a) and maintenance respiration (Eq. A2b). If this balance is positive, then a part is used for growth respiration.
A part of synB (Eq. A10), the C balance for biomass synthesis is used for catabolic growth respiration rG to support biomass synthesis, and the remaining fraction ϵ, the anabolic carbon use efficiency, is used for synthesis of biomass and enzymes. ϵ is assumed to be equal for all substrates for simplicity. SESAM assumes that requirements for maintenance and enzyme synthesis must be met first. Therefore, the microbial C balance can become negative, resulting in starvation of and decline in microbial biomass.
where synB is the C balance for biomass synthesis and is given below by Eq. (A10).
A2 Nitrogen dynamics
Nitrogen fluxes are computed by dividing the respective C fluxes (Eq. A1) by the ratio, βN, of their source.
We assumed fixed ratios and of the microbial biomass and enzymes. However, substrate N pools are modelled explicitly because their ratio of the substrate pools may change over time.
The inorganic N pool IN balances external inputs (), leaching (lNIN), plant uptake (uPlant,N), and the exchange flux with soil microbial biomass (ΦN) (Fig. A1).
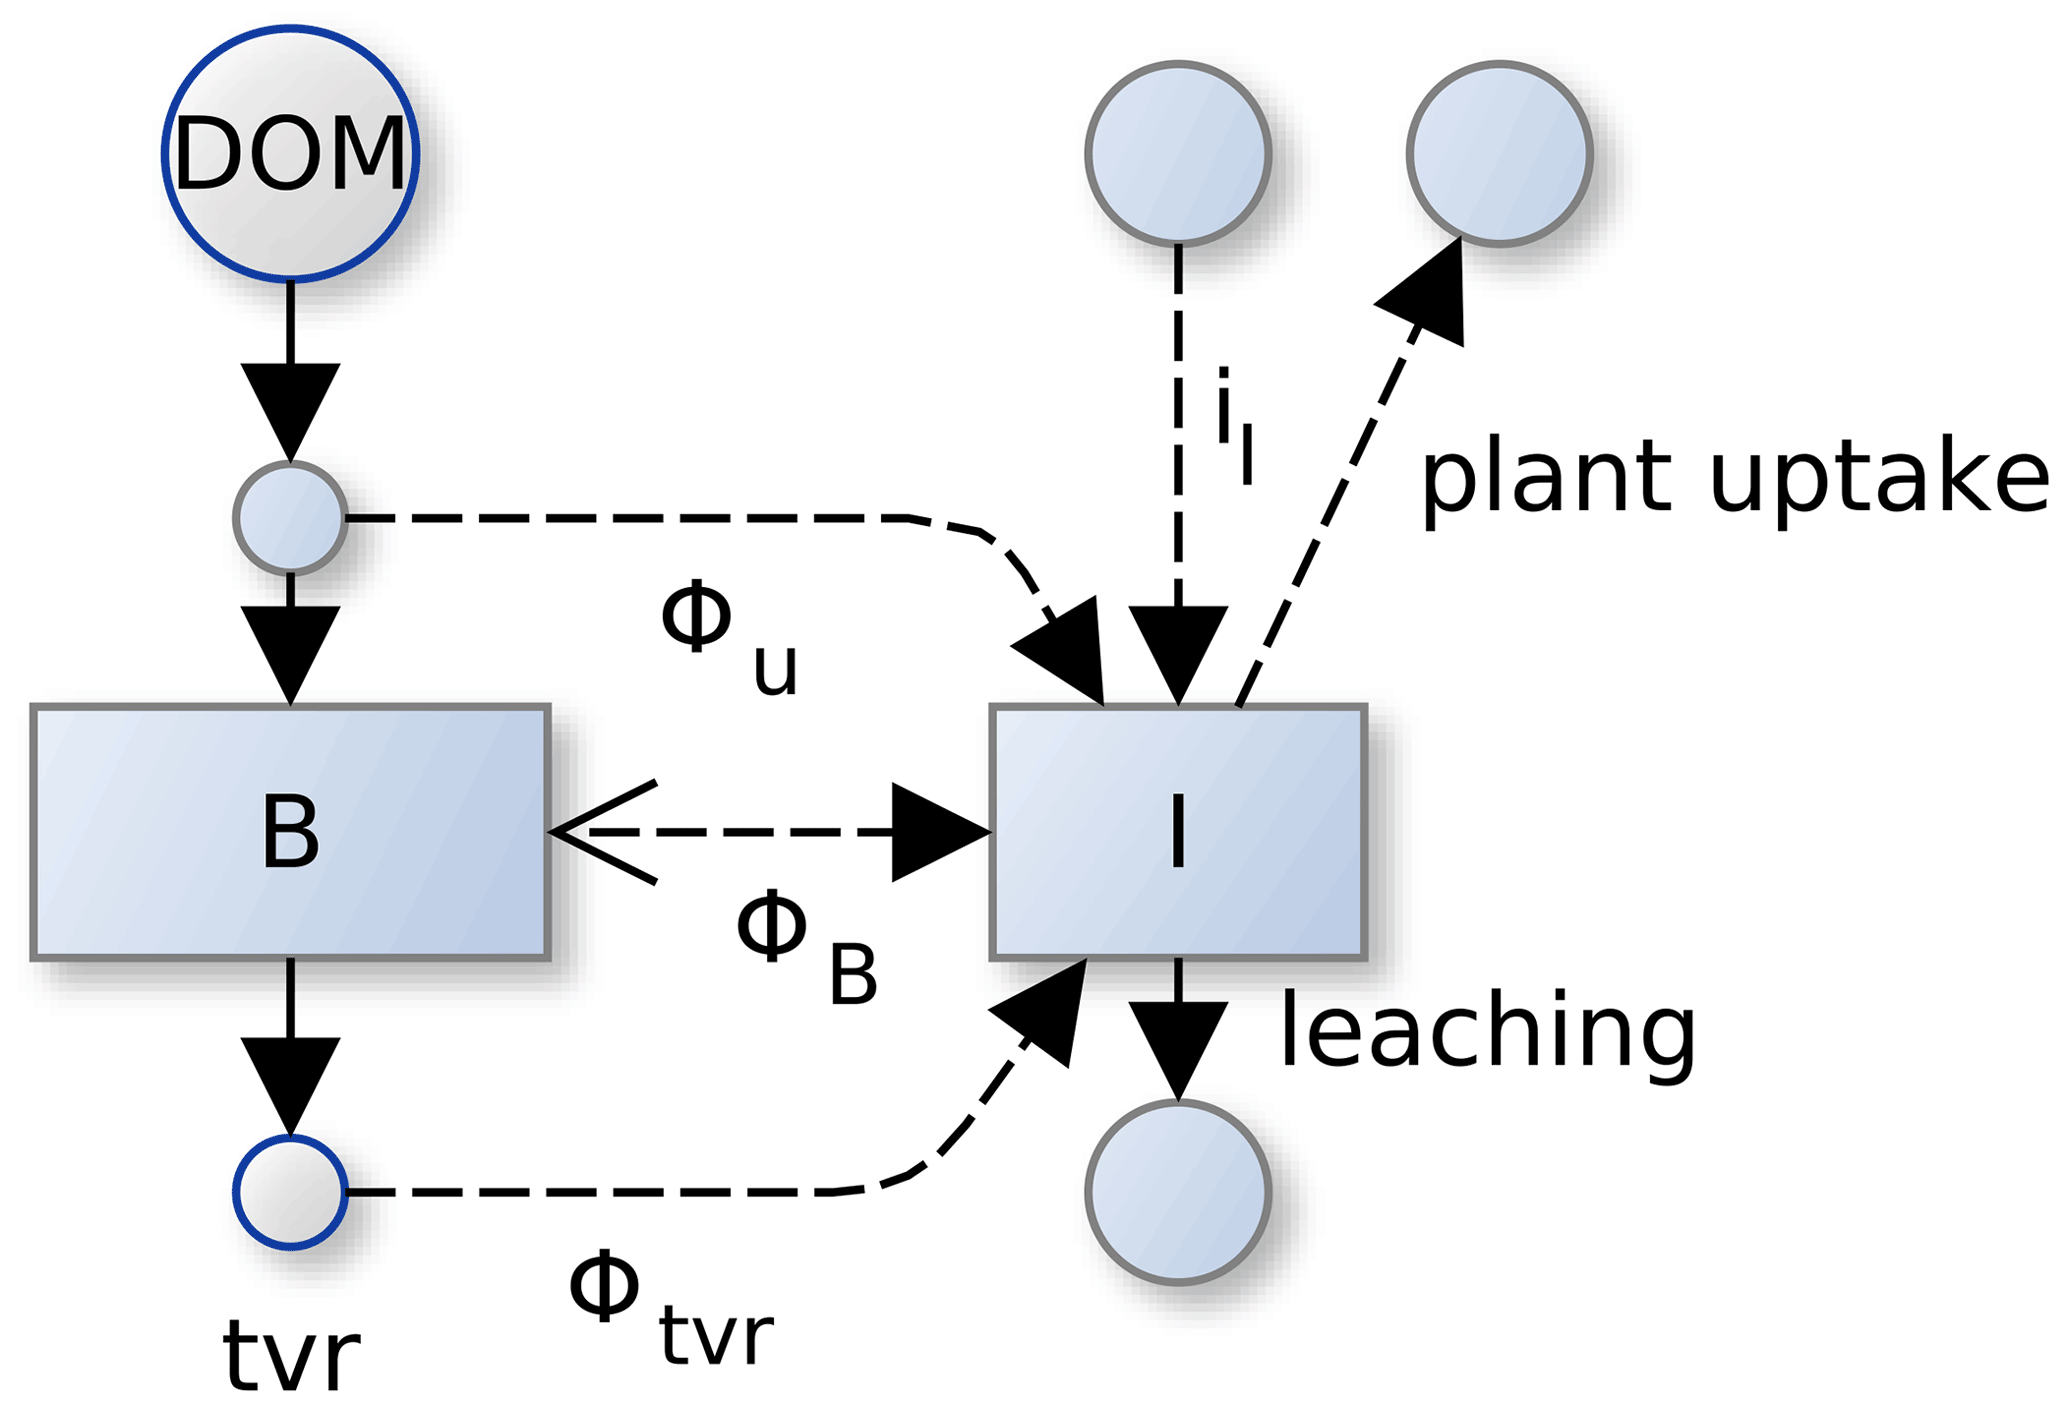
Figure A1Several component fluxes sum to total mineralization flux in SESAM: . A negative mineralization flux, ΦB, corresponds to N immobilization of inorganic pool, I, by microbial biomass, B. In addition there is mineralization during microbial turnover, Φtvr, and mineralization during uptake, Φu. Fluxes across the system boundary are inputs of inorganic N (iI), inputs of organic N with litter, plant uptake of inorganic N, and leaching.
In addition to the mineralization–immobilization imbalance flux, ΦNB (Eq. A11c), microbes exchange N with the inorganic pools by apparent mineralization due to soil heterogeneity, ΦNu (Manzoni et al., 2008), and mineralization of a part of microbial turnover, (Eq. A16, Sect. A5).
Potential N uptake by microbes, uN,Pot (Eq. A8), is the sum of effective organic N uptake and potential inorganic uptake. The parallel scheme (PAR) (Manzoni et al., 2008) is used to model effective organic uptake. It accounts for an apparent mineralization at the soil core scale caused by sub-scale soil spots with high N concentration in DOM. With PAR, a part of the total organic N uptake, , is mineralized. Uptake from DOM, uN,OM, equals the influxes to DOM multiplied by the apparent N use efficiency νN.
where ratios βNL and βNR are calculated using current C and N substrate pools: . Note that uN is the potential microbial N uptake using the potential immobilization flux. The actual net inorganic flux, ΦNB, is computed taking other limitations into account (Eq. A11c).
The N constraint on biomass synthesis is potential microbial N uptake minus enzyme synthesis. Converted to C units this reads .
Equation (A9a) assumes that the N taken up is only used for enzyme production and biomass synthesis. A potential contribution of N to maintenance processes is neglected.
A3 Imbalance fluxes of microbes limited by C or N
There is a constraint on the synthesis of new biomass by each chemical element. In SESAM synthesis follows the minimum of these constraints (Eq. A10).
The elements in excess then are lost by imbalance fluxes (Eq. A11) so that the mass balance is closed. Excess N is mineralized (MImb), and excess C is respired by overflow respiration (rO).
The actual mineralization–immobilization flux ΦEB for element E is the difference between excess mineralization of E and the potential immobilization flux. With substrate N limitation, ΦNB will be negative (N immobilization), whereas if microbes are limited by C availability, ΦNB will be positive (N mineralization). If the required immobilization is larger than potential immobilization () then stoichiometry must be balanced by overflow respiration.
A4 Community composition
Microbes in SESAM allocate a proportion αZ of their total enzyme investments to the synthesis of enzyme Z. This enzyme allocation coefficient, αZ, reflects the community composition, i.e. the mix of species growing on different portions of the organic matter.
SESAM models composition, αZ, as a vector of state variables that develop over time towards the optimal composition, αZOpt. The timescale of this change is assumed to be equal to the timescale of microbial turnover, τ, and biomass synthesis, synB (Eq. A12).
Community can change fast either if it is growing fast or if it is decaying fast. Hence, both terms are considered in Eq. (A12).
SESAM3 adopts the revenue strategy where investment in enzyme synthesis is proportional to its revenue (Wutzler et al., 2017). It differs from SEAM by considering the weights also in the computation of the investment.
where αZ is the current community enzyme allocation, revZ is the revenue from given enzyme depolymerizing substrates of organic matter and its version computed with enzymes assumed in a steady state, and is the decomposition due to biomass-produced enzymes (Eq. A3). The elemental limitation weights, wE, occur in both the return and the investment; therefore they do not need to be normalized to one.
The unnormalized weight of an element limitation, wE, decreases exponentially with the excess of biosynthesis flux constrained by the given element only over the actual biosynthesis flux constrained by all elements. This excess in potential biosynthesis flux is normalized by microbial turnover in order to derive a unitless quantity. Compared to the SEAM version 2 formulation of weights (Wutzler et al., 2017), this formulation works better for starving microbial community with negative biomass synthesis and can be extended to more than two limiting elements.
where δ, arbitrarily set to 40, controls the steepness of the transition between states limited by different elements. CsynBE denotes the available biosynthesis flux in microbial biomass carbon equivalents given the limitation of element E (Eqs. A5 and A9a), e.g. for nitrogen, .
Compared with SEAM, already a small C limitation causes an increased preference for the C-rich labile pool, i.e. lower αR. This is because the elemental N limitation is divided by ratio in Eq. (A13).
A5 Fate of microbial turnover
During microbial turnover, a part (1−ϵtvr) of microbial biomass is mineralized, e.g. by grazing.
A respective proportion of N () is also mineralized and transferred to the inorganic N pools.
The remainder of the microbial turnover goes to the residue pool. The current SESAM version ignores the part that enters the DOM pool and is taken up again by living microbial biomass. This corresponds to an effective uptake rate, assuming that the effects of this DOM flux on pools cancel in their parameterizations. This shortcut leads to a joint small underestimation of microbial turnover, uptake, and CUE. Investigating the effect of this simplifying assumption on isotopic tracers is an outlook.
Instead of taking the entire decomposition flux as return, one could account for the mineralization–immobilization pathway and the fact that during this path, part of the decomposition flux is routed away from microbial biomass.
where νTE is the total nutrient efficiency that includes the uptake by the mineralization–immobilization pathway, and pimmo,E is the ratio of microbial uptake from the pool of the inorganic form of the element E to the sum of all losses from this pool.
This leads to updated equations of return, revenue, and community composition (Eq. B2).
Notice that νTN depends via its dependence on pimmo,E on many aspects of the current state. This makes reasoning about the system more difficult.
When one element is clearly limiting, then the returns in both the numerator and the denominator in the computation of αZ (Eq. A13a) are dominated by only a single term. In this case the νTN can be factored out and cancels. Hence, the computed αZ equals the version computed by adopting the decomposition flux as the return.
We argue that the case of clear co-limitation is quite rare. Depending on fluctuations in litter input and soil heterogeneity, the microbial community at a given time and a given spot is usually limited by one of the elements. Therefore, SESAM currently adopts the simpler version of the return (Eq. A13).
The following figures help to understand the result of Sect. 3.4 that enzyme steady-state assumptions did not introduce bias in predictions despite the non-linearity of decomposition with enzyme levels.
The aboveground litter inputs in autumn caused time-lagged responses and smoothed responses in the modelled soil properties (Fig. D1). This smoothing behaviour is similar to a daily temperature signal travelling down from top soil to deeper soil layers where the signal is delayed and smoothed.
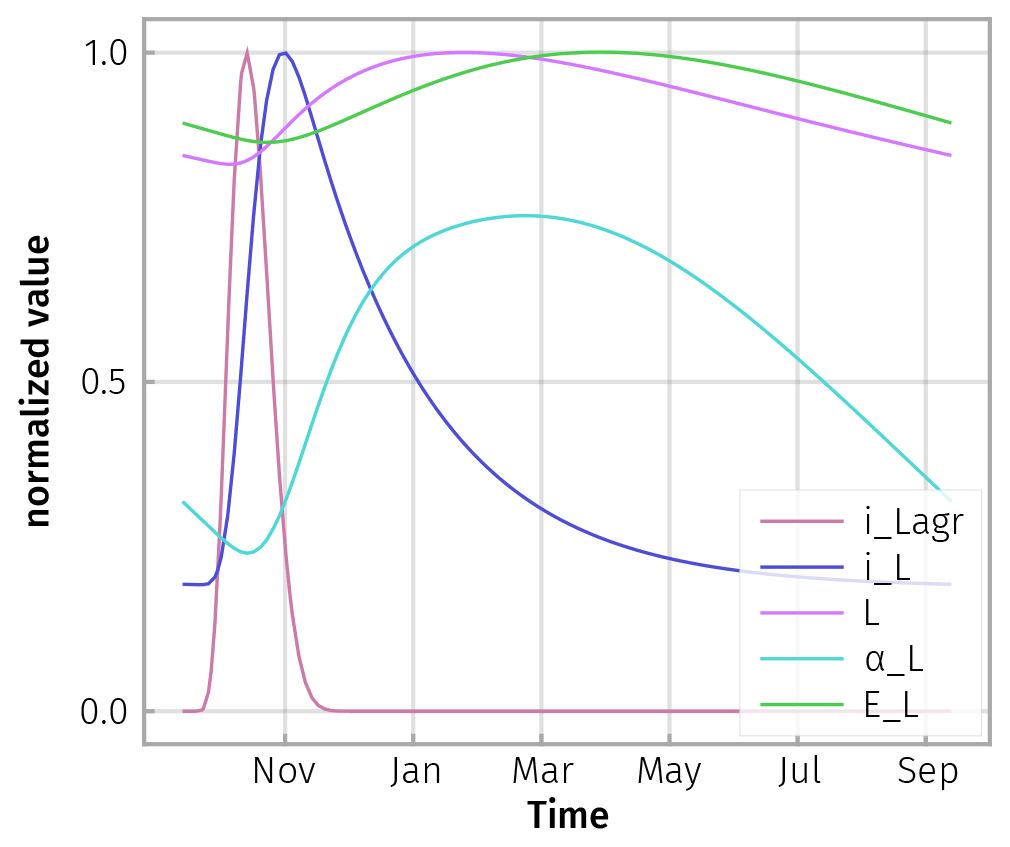
Figure D1Model responses to a spike of aboveground litterfall in autumn, iLagr, are damped. There is a cascade of delays in litter input from litter layer and roots to soil, iL; change in litter substrate pool, L; increased share of microbial community depolymerizing this pool, αL; and an increase in enzyme concentration, EL. All fluxes were normalized by dividing by their maximum, except αL, whose range additionally was scaled to 0.5 because it varied only marginally across seasons.
Due to this smoothing and lagging behaviour, the simulated steady-state enzyme levels closely tracked the explicit enzyme levels (Fig. D2).
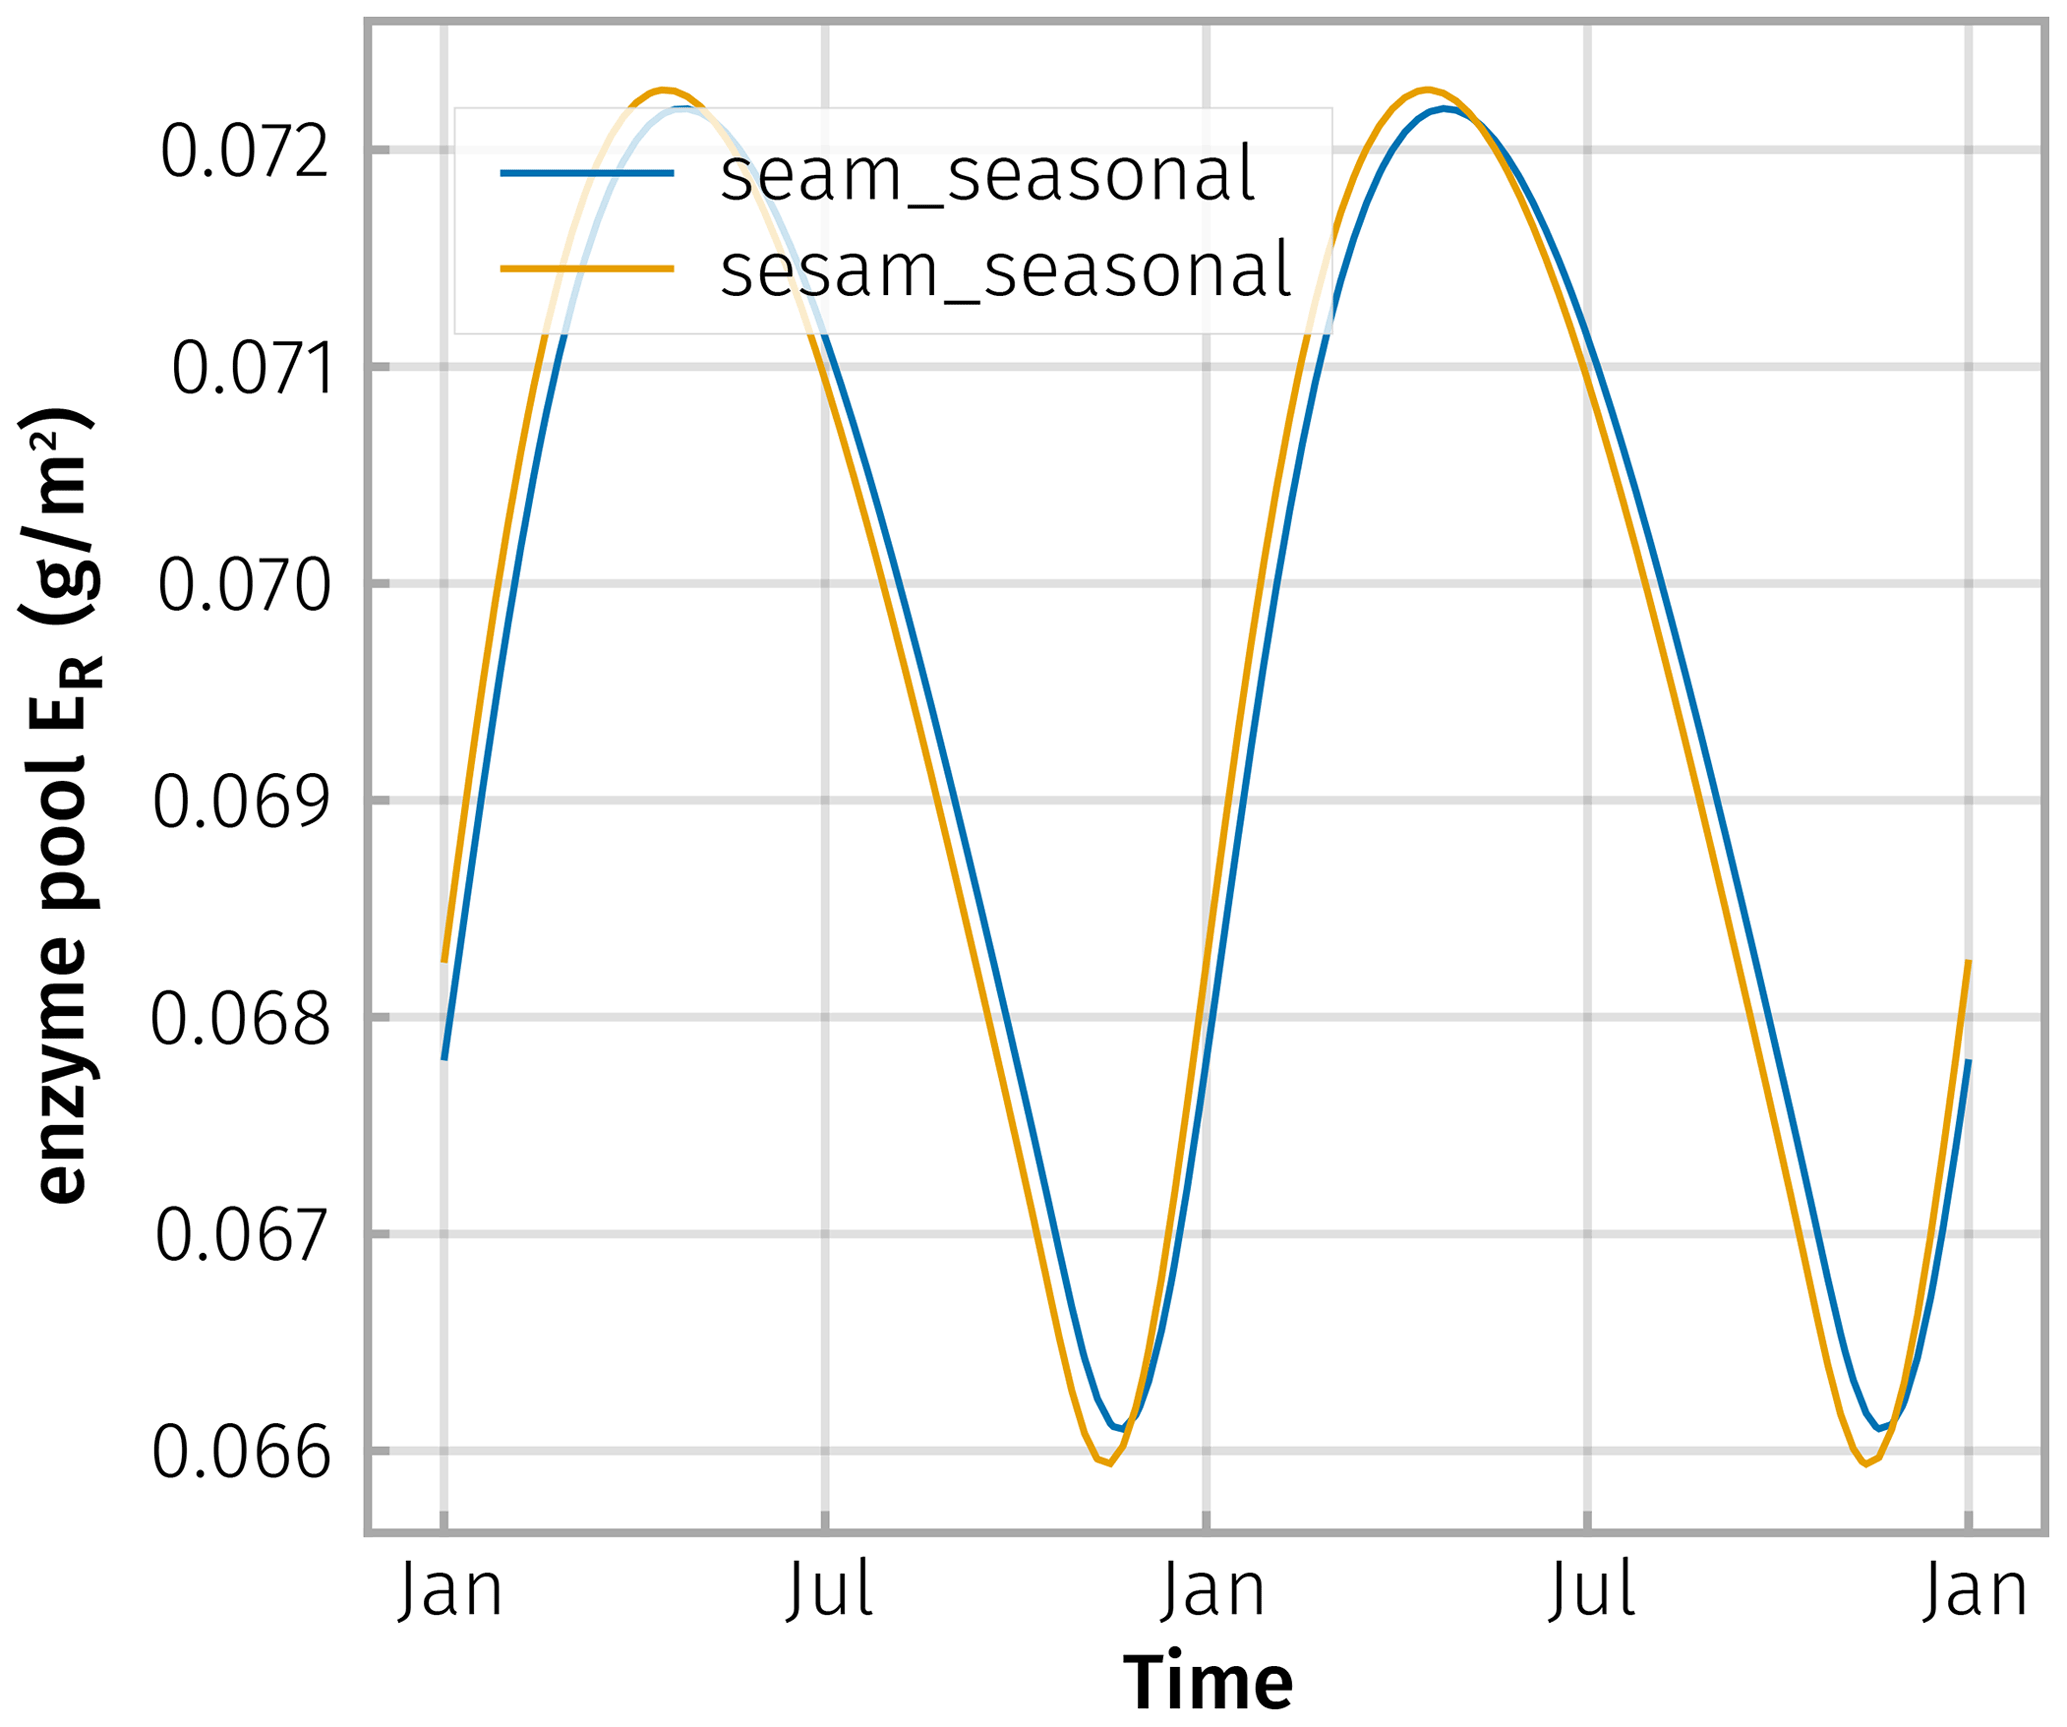
Figure D2Enzyme levels, here shown for residue degrading enzyme, ER, differ only marginally across simulations of explicit enzymes (seam) and steady-state enzymes (sesam).
SESAM does not explicitly represent enzyme pools. However, the mass fluxes across the enzyme pool from biomass to DOM and to the residue pool are represented.
A model variant “NoEnzFlux” has been implemented, where the enzyme pools are still part of the revenue computation, but mass fluxes across the enzyme pools are neglected. This has been accomplished by using synEnz=0 instead of Eq. (A2a) and using aEB directly in computation of decomposition (Eq. A3) and subsequently in computation of revenue (Eq. A13).
Here we derive equations for microbial biomass in a quasi-steady state.
By setting dB=0, synB=tvrB.
Carbon available for biomass synthesis, synB, is the minimum for each element at limitation, by either C or N. Hence, we compute the steady-state biomass for all limitations and then take the minimum .
F1 Carbon limitation
With enzymes in a quasi-steady state, the uptake from enzyme turnover equals enzyme production, aEB. While enzyme investments are subtracted from uptake for computing biomass synthesis, a part κE occurs in uptake.
with abbreviations
This results in a square equation. If there is no real positive solution, biomass cannot be sustained, otherwise the maximum of the two roots gives the required steady-state biomass, BsC.
F2 Nitrogen limitation
For N limitation, the potential immobilization flux does not cancel, and a complex cubed polynomial equation results.
with abbreviations
This results in a cubic equation. Its second root is real and gives the steady-state biomass, BsN.
While steady-state biomass can be computed and passed to other equations that involve biomass, these other equations are not simplified.
SESAM (v3.0) is available coded in R at https://github.com/bgctw/sesam (last access: 1 November 2022) (https://doi.org/10.5281/zenodo.6758806; Wutzler, 2022a) and coded in Julia at https://github.com/bgctw/Sesam.jl (last access: 1 November 2022) (https://doi.org/10.5281/zenodo.7188881; Wutzler, 2022b). R source code is released using the GPL-2 licence because it uses other GPL libraries. Julia code is released using the more permissive MIT license.
The model version comparison code of this study is part of the R repository in the file develop/19GMD_paper/CompareModels.Rmd. The sensitivity analysis code of this study is part of the Julia repository at inst/22paper_upscaling/sensitivity_Face.jl and the fluctuation analysis at inst/22paper_upscaling/fluctuation_analysis.jl.
TW developed the model and led the writing of the manuscript. LY implemented SESAM into a larger land model, which initiated several reformulations of model aspects. TW, LY, MS, and SZ contributed to the discussion of results and writing of the manuscript.
The contact author has declared that none of the authors has any competing interests.
Publisher's note: Copernicus Publications remains neutral with regard to jurisdictional claims in published maps and institutional affiliations.
We thank Bernhard Ahrens and Markus Reichstein for fruitful discussion. We thank the Max Planck Society for funding. Lin Yu is supported by the Swedish-government-funded Strategic Research Area Biodiversity and Ecosystems in a Changing Climate, BECC.
The article processing charges for this open-access publication were covered by the Max Planck Society.
This paper was edited by Christoph Müller and reviewed by Nadezda Vasilyeva and one anonymous referee.
Allison, S. D.: Modeling adaptation of carbon use efficiency in microbial communities, Front. Microbiol., 5, 517, https://doi.org/10.3389/fmicb.2014.00571, 2014. a, b
Averill, C., Rousk, J., and Hawkes, C.: Microbial-mediated redistribution of ecosystem nitrogen cycling can delay progressive nitrogen limitation, Biogeochemistry, 126, 11–23, https://doi.org/10.1007/s10533-015-0160-x, 2015. a
Bezanson, J., Edelman, A., Karpinski, S., and Shah, V. B.: Julia: A fresh approach to numerical computing, SIAM Rev., 59, 65–98, 2017. a
Bradford, M. A., Wieder, W. R., Bonan, G. B., Fierer, N., Raymond, P. A., and Crowther, T. W.: Managing uncertainty in soil carbon feedbacks to climate change, Nat. Clim. Change, 6, 751–758, https://doi.org/10.1038/nclimate3071, 2016. a
Buchkowski, R. W., Shaw, A. N., Sihi, D., Smith, G. R., and Keiser, A. D.: Constraining Carbon and Nutrient Flows in Soil With Ecological Stoichiometry, Frontiers in Ecology and Evolution, 7, 382, https://doi.org/10.3389/fevo.2019.00382, 2019. a
Campbell, E. E. and Paustian, K.: Current developments in soil organic matter modeling and the expansion of model applications: a review, Environ. Res. Lett., 10, 123004, https://doi.org/10.1088/1748-9326/10/12/123004, 2015. a
Chakrawal, A., Herrmann, A. M., Koestel, J., Jarsjö, J., Nunan, N., Kätterer, T., and Manzoni, S.: Dynamic upscaling of decomposition kinetics for carbon cycling models, Geosci. Model Dev., 13, 1399–1429, https://doi.org/10.5194/gmd-13-1399-2020, 2020. a
Clarholm, M.: Interactions of bacteria, protozoa and plants leading to mineralization of soil nitrogen, Soil Biol. Biochem., 17, 181–187, https://doi.org/10.1016/0038-0717(85)90113-0, 1985. a
Cleveland, C. C. and Liptzin, D.: stoichiometry in soil: is there a Redfield ratio for the microbial biomass?, Biogeochemistry, 85, 235–252, https://doi.org/10.1007/s10533-007-9132-0, 2007. a
Dufour, L., Herrmann, A., Leloup, J., Przybylski, C., Foti, L., Abbadie, L., and Nunan, N.: Energetic return on investment determines overall soil microbial activity, Research Square, 173, 108800, https://doi.org/10.21203/rs.3.rs-388050/v1, 2021. a
Fatichi, S., Manzoni, S., Or, D., and Paschalis, A.: A Mechanistic Model of Microbially Mediated Soil Biogeochemical Processes: A Reality Check, Global Biogeochem. Cy., 33, 620–648, https://doi.org/10.1029/2018gb006077, 2019. a
Feng, J. and Zhu, B.: Global patterns and associated drivers of priming effect in response to nutrient addition, Soil Biol. Biochem., 153, 108118, https://doi.org/10.1016/j.soilbio.2020.108118, 2021. a
Graham, L. J., Spake, R., Gillings, S., Watts, K., and Eigenbrod, F.: Incorporating fine-scale environmental heterogeneity into broad-extent models, Methods Ecol. Evol., 10, 767–778, https://doi.org/10.1111/2041-210x.13177, 2019. a
Guenet, B., Moyano, F. E., Peylin, P., Ciais, P., and Janssens, I. A.: Towards a representation of priming on soil carbon decomposition in the global land biosphere model ORCHIDEE (version 1.9.5.2), Geosci. Model Dev., 9, 841–855, https://doi.org/10.5194/gmd-9-841-2016, 2016. a
Hagerty, S. B., Allison, S. D., and Schimel, J. P.: Evaluating soil microbial carbon use efficiency explicitly as a function of cellular processes: implications for measurements and models, Biogeochemistry, 140, 269–283, https://doi.org/10.1007/s10533-018-0489-z, 2018. a
Hicks, L. C., Lajtha, K., and Rousk, J.: Nutrient limitation may induce microbial mining for resources from persistent soil organic matter, Ecology, 102, e03328, https://doi.org/10.1002/ecy.3328, 2021. a
Huang, Y., Guenet, B., Ciais, P., Janssens, I. A., Soong, J. L., Wang, Y., Goll, D., Blagodatskaya, E., and Huang, Y.: ORCHIMIC (v1.0), a microbe-mediated model for soil organic matter decomposition, Geosci. Model Dev., 11, 2111–2138, https://doi.org/10.5194/gmd-11-2111-2018, 2018. a, b, c
Jakeman, A. J., Letcher, R. A., and Norton, J. P.: Ten iterative steps in development and evaluation of environmental models, Environ. Modell. Softw., 21, 602–614, 2006. a
Janssens, I., Dieleman, W., Luyssaert, S., Subke, J., Reichstein, M., Ceulemans, R., Ciais, P., Dolman, A., Grace, J., Matteucci, G., Papale, D., Piao, S., Schulze, E., Tang, J., and Law, B.: Reduction of forest soil respiration in response to nitrogen deposition, Nat. Geosci., 3, 315–322, 2010. a
Joly, F.-X., Coq, S., Coulis, M., David, J.-F., Hättenschwiler, S., Mueller, C. W., Prater, I., and Subke, J.-A.: Detritivore conversion of litter into faeces accelerates organic matter turnover, Communications Biology, 3, 660, https://doi.org/10.1038/s42003-020-01392-4, 2020. a
Kaiser, C., Franklin, O., Dieckmann, U., and Richter, A.: Microbial community dynamics alleviate stoichiometric constraints during litter decay, Ecol. Lett., 17, 680–690, https://doi.org/10.1111/ele.12269, 2014. a, b, c, d, e
Kuzyakov, Y.: Priming effects: Interactions between living and dead organic matter, Soil Biol. Biochem., 42, 1363–1371 https://doi.org/10.1016/j.soilbio.2010.04.003, 2010. a
Li, T., Wang, R., Cai, J., Meng, Y., Wang, Z., Feng, X., Liu, H., Turco, R. F., and Jiang, Y.: Enhanced carbon acquisition and use efficiency alleviate microbial carbon relative to nitrogen limitation under soil acidification, Ecological Processes, 10, 32, https://doi.org/10.1186/s13717-021-00309-1, 2021. a
Liu, W., Qiao, C., Yang, S., Bai, W., and Liu, L.: Microbial carbon use efficiency and priming effect regulate soil carbon storage under nitrogen deposition by slowing soil organic matter decomposition, Geoderma, 332, 37–44, https://doi.org/10.1016/j.geoderma.2018.07.008, 2018. a
Luu, A. T., Hoang, N. T., Dinh, V. M., Bui, M. H., Grandy, S., and Hoang, D. T. T.: Effects of carbon input quality and timing on soil microbe mediated processes, Geoderma, 409, 115605, https://doi.org/10.1016/j.geoderma.2021.115605, 2022. a
Ma, Y., Gowda, S., Anantharaman, R., Laughman, C., Shah, V., and Rackauckas, C.: ModelingToolkit: A Composable Graph Transformation System For Equation-Based Modeling, arXiv [preprint], https://doi.org/10.48550/arXiv.2103.05244, 9 March 2021. a
Manzoni, S., Porporato, A., and Schimel, J. P.: Soil heterogeneity in lumped mineralization-immobilization models, Soil Biol. Biochem., 40, 1137–1148, https://doi.org/10.1016/j.soilbio.2007.12.006, 2008. a, b
Manzoni, S., Čapek, P., Porada, P., Thurner, M., Winterdahl, M., Beer, C., Brüchert, V., Frouz, J., Herrmann, A. M., Lindahl, B. D., Lyon, S. W., Šantrůčková, H., Vico, G., and Way, D.: Reviews and syntheses: Carbon use efficiency from organisms to ecosystems – definitions, theories, and empirical evidence, Biogeosciences, 15, 5929–5949, https://doi.org/10.5194/bg-15-5929-2018, 2018. a
Manzoni, S., Ding, Y., Warren, C., Banfield, C. C., Dippold, M. A., and Mason-Jones, K.: Intracellular storage reduces stoichiometric imbalances in soil microbial biomass–A theoretical exploration, Frontiers in Ecology and Evolution, p. 663, https://doi.org/10.1038/s41396-021-01110-w, 2021. a
Marschmann, G. L., Pagel, H., Kügler, P., and Streck, T.: Equifinality, sloppiness, and emergent structures of mechanistic soil biogeochemical models, Environ. Modell. Softw., 122, 104518, https://doi.org/10.1016/j.envsoft.2019.104518, 2019. a
Melillo, J.: Changes in Soil Carbon Dynamics in Response to Long-Term Soil Warming – Integration Across Scales from Cells to Ecosystems, Tech. rep., DOE's Office of Science (BER), https://doi.org/10.2172/1502957, 2019. a
Moorhead, D. L., Lashermes, G., and Sinsabaugh, R. L.: A theoretical model of C- and N-acquiring exoenzyme activities, which balances microbial demands during decomposition, Soil Biol. Biochem., 53, 133–141, https://doi.org/10.1016/j.soilbio.2012.05.011, 2012. a, b
Mooshammer, M., Wanek, W., Hämmerle, I., Fuchslueger, L., Hofhansl, F., Knoltsch, A., Schnecker, J., Takriti, M., Watzka, M., Wild, B., Keiblinger, K., Zechmeister-Boltenstern, S., and Richter, A.: Adjustment of microbial nitrogen use efficiency to carbon:nitrogen imbalances regulates soil nitrogen cycling, Nat. Commun., 5, 3694, https://doi.org/10.1038/ncomms4694, 2014a. a
Mooshammer, M., Wanek, W., Zechmeister-Boltenstern, S., and Richter, A.: Stoichiometric imbalances between terrestrial decomposer communities and their resources: mechanisms and implications of microbial adaptations to their resources, Front. Microbiol., 5, 22, https://doi.org/10.3389/fmicb.2014.00022, 2014b. a
Perveen, N., Barot, S., Alvarez, G., Klumpp, K., Martin, R., Rapaport, A., Herfurth, D., Louault, F., and Fontaine, S.: Priming effect and microbial diversity in ecosystem functioning and response to global change: a modeling approach using the SYMPHONY model, Glob. Change Biol., 20, 1174–1190, https://doi.org/10.1111/gcb.12493, 2014. a, b, c, d
Pot, V., Portell, X., Otten, W., Garnier, P., Monga, O., and Baveye, P. C.: Accounting for soil architecture and microbial dynamics in microscale models: Current practices in soil science and the path ahead, Eur. J. Soil Sci., 73, e13142, https://doi.org/10.1111/ejss.13142, 2021. a
R Core Team: R: A Language and Environment for Statistical Computing, R Foundation for Statistical Computing, Vienna, Austria, 2021. a
Rackauckas, C. and Nie, Q.: Differentialequations.jl – a performant and feature-rich ecosystem for solving differential equations in julia, Journal of Open Research Software, 5, 15, https://doi.org/10.5334/jors.151, 2017. a
Rastetter, E. B.: Modeling coupled biogeochemical cycles, Front. Ecol. Environ., 9, 68–73, https://doi.org/10.1890/090223, 2011. a
Saltelli, A., Ratto, M., Andres, T., Campolongo, F., Cariboni, J., Gatelli, D., Saisana, M., and Tarantola, S.: Global Sensitivity Analysis. The Primer, 1 edn., John Wiley & Sons, ISBN 0-470-05997-4, 2008. a, b
Schimel, J. P. and Weintraub, M. N.: The implications of exoenzyme activity on microbial carbon and nitrogen limitation in soil: a theoretical model, Soil Biol. Biochem., 35, 549–563, 2003. a, b
Schmidt, M. W. I., Torn, M. S., Abiven, S., Dittmar, T., Guggenberger, G., Janssens, I. A., Kleber, M., Kogel-Knabner, I., Lehmann, J., Manning, D. A. C., Nannipieri, P., Rasse, D. P., Weiner, S., and Trumbore, S. E.: Persistence of soil organic matter as an ecosystem property, Nature, 478, 49–56, https://doi.org/10.1038/nature10386, 2011. a
Sinsabaugh, R. L., Manzoni, S., Moorhead, D. L., and Richter, A.: Carbon use efficiency of microbial communities: stoichiometry, methodology and modelling, Ecol. Lett., 16, 930–939, https://doi.org/10.1111/ele.12113, 2013. a
Sobol, I. M.: On sensitivity estimation for nonlinear mathematical models, Matem. Mod., 2, 112–118, 1990. a
Soetaert, K., Petzoldt, T., and Setzer, R.: Solving Differential Equations in R: Package deSolve, J. Stat. Softw., 33, 1–25, https://doi.org/10.18637/jss.v033.i09, 2010. a
Spohn, M., Klaus, K., Wanek, W., and Richter, A.: Microbial carbon use efficiency and biomass turnover times depending on soil depth – Implications for carbon cycling, Soil Biol. Biochem., 96, 74–81, https://doi.org/10.1016/j.soilbio.2016.01.016, 2016. a
Sterner, R. W. and Elser, J. J.: Ecological stoichiometry: the biology of elements from molecules to the biosphere, Princeton University Press, ISBN 9780691074917, ISSN 0-691-07491-7, https://www.ebook.de/de/product/3379282/robert_w_sterner_james_j_elser_ecological_stoichiometry.html (last access: 8 November 2022), 2002. a, b
Tang, J. and Riley, W. J.: Weaker soil carbon–climate feedbacks resulting from microbial and abiotic interactions, Nat. Clim. Change, 5, 56–60, https://doi.org/10.1038/nclimate2438, 2014. a
Tang, J. and Riley, W. J.: Competitor and substrate sizes and diffusion together define enzymatic depolymerization and microbial substrate uptake rates, Soil Biol. Biochem., 139, 107624, https://doi.org/10.1016/j.soilbio.2019.107624, 2019. a
Thornton, P. E., Lamarque, J.-F., Rosenbloom, N. A., and Mahowald, N. M.: Influence of carbon-nitrogen cycle coupling on land model response to CO2 fertilization and climate variability, Global Biogeochem. Cy., 21, GB4018, https://doi.org/10.1029/2006gb002868, 2007. a
Todd-Brown, K. E. O., Hopkins, F. M., Kivlin, S. N., Talbot, J. M., and Allison, S. D.: A framework for representing microbial decomposition in coupled climate models, Biogeochemistry, 109, 19–33, https://doi.org/10.1007/s10533-011-9635-6, 2012. a
Tsitouras, C.: Runge–Kutta pairs of order 5 (4) satisfying only the first column simplifying assumption, Comput. Math. Appl., 62, 770–775, 2011. a
Vain, A.-C., Rakotondrazafy, N., Razanamalala, K., Trap, J., Marsden, C., Blanchart, E., and Bernard, L.: The fate of primed soil carbon between biomass immobilization and respiration is controlled by nutrient availability, Eur. J. Soil Biol., 105, 103332, https://doi.org/10.1016/j.ejsobi.2021.103332, 2021. a
vandenEnden, L., Anthony, M. A., Frey, S. D., and Simpson, M. J.: Biogeochemical evolution of soil organic matter composition after a decade of warming and nitrogen addition, Biogeochemistry, 156, 161–175, https://doi.org/10.1007/s10533-021-00837-0, 2021. a
Verner, J. H.: Numerically optimal Runge-Kutta pairs with interpolants, Numer. Algorithms, 53, 383–396, 2010. a
Wieder, W. R., Bonan, G. B., and Allison, S. D.: Global soil carbon projections are improved by modelling microbial processes, Nat. Clim. Change, 3, 909–912, https://doi.org/10.1038/nclimate1951, 2013. a, b, c
Wutzler, T.: bgctw/sesam: GMD_Wutzler22 (gmd_wutzler22), Zenodo [code], https://doi.org/10.5281/zenodo.6758806, 2022a. a
Wutzler, T.: bgctw/Sesam.jl: GMD_Wutzler22_submission3 (gmd_wutzler22_submission3), Zenodo [code], https://doi.org/10.5281/zenodo.7188881, 2022b. a
Wutzler, T. and Reichstein, M.: Priming and substrate quality interactions in soil organic matter models, Biogeosciences, 10, 2089–2103, https://doi.org/10.5194/bg-10-2089-2013, 2013. a, b, c
Wutzler, T., Zaehle, S., Schrumpf, M., Ahrens, B., and Reichstein, M.: Adaptation of microbial resource allocation affects modelled long term soil organic matter and nutrient cycling, Soil Biol. Biochem., 115, 322–336, https://doi.org/10.1016/j.soilbio.2017.08.031, 2017. a, b, c, d, e, f, g, h, i
Xu, X., Thornton, P. E., and Post, W. M.: A global analysis of soil microbial biomass carbon, nitrogen and phosphorus in terrestrial ecosystems, Global Ecol. Biogeogr., 22, 737–749, https://doi.org/10.1111/geb.12029, 2013. a, b
Xu, X., Schimel, J. P., Thornton, P. E., Song, X., Yuan, F., and Goswami, S.: Substrate and environmental controls on microbial assimilation of soil organic carbon: a framework for Earth system models, Ecol. Lett., 17, 547–555, https://doi.org/10.1111/ele.12254, 2014. a
Yu, L., Ahrens, B., Wutzler, T., Schrumpf, M., and Zaehle, S.: Jena Soil Model (JSM v1.0; revision 1934): a microbial soil organic carbon model integrated with nitrogen and phosphorus processes, Geosci. Model Dev., 13, 783–803, https://doi.org/10.5194/gmd-13-783-2020, 2020. a
Zaehle, S. and Dalmonech, D.: Carbon-nitrogen interactions on land at global scales: current understanding in modelling climate biosphere feedbacks, Curr. Opin. Env. Sust., 3, 311–320, https://doi.org/10.1016/j.cosust.2011.08.008, 2011. a
Zechmeister-Boltenstern, S., Keiblinger, K. M., Mooshammer, M., Penuelas, J., Richter, A., Sardans, J., and Wanek, W.: The application of ecological stoichiometry to plant – microbial – soil organic matter transformations, Ecol. Monogr., 85, 133–155, https://doi.org/10.1890/14-0777.1, 2015. a, b
Zhou, J., Wen, Y., Shi, L., Marshall, M. R., Kuzyakov, Y., Blagodatskaya, E., and Zang, H.: Strong priming of soil organic matter induced by frequent input of labile carbon, Soil Biol. Biochem., 152, 108069, https://doi.org/10.1016/j.soilbio.2020.108069, 2021. a
- Abstract
- Introduction
- Methods
- Results
- Discussion
- Conclusions
- Appendix A: SESAM equations
- Appendix B: Alternative return of microbial uptake
- Appendix C: Robustness of sensitivity parameters
- Appendix D: Supplementary figures of the fluctuation analysis
- Appendix E: No mass flux by enzymes
- Appendix F: Steady state of microbial biomass
- Code and data availability
- Author contributions
- Competing interests
- Disclaimer
- Acknowledgements
- Financial support
- Review statement
- References