the Creative Commons Attribution 4.0 License.
the Creative Commons Attribution 4.0 License.
 | 28 Jan 2022
Modeling symbiotic biological nitrogen fixation in grain legumes globally with LPJ-GUESS (v4.0, r10285)
Stefan Olin
Peter Anthoni
Sam S. Rabin
Anita D. Bayer
Sylvia S. Nyawira
Almut Arneth
Biological nitrogen fixation (BNF) from grain legumes is of significant importance in global agricultural ecosystems. Crops with BNF capability are expected to support the need to increase food production while reducing nitrogen (N) fertilizer input for agricultural sustainability, but quantification of N fixing rates and BNF crop yields remains inadequate on a global scale. Here we incorporate two legume crops (soybean and faba bean) with BNF into a dynamic vegetation model LPJ-GUESS (Lund–Potsdam–Jena General Ecosystem Simulator). The performance of this new implementation is evaluated against observations from a range of water and N management trials. LPJ-GUESS generally captures the observed response to these management practices for legume biomass production, soil N uptake, and N fixation, despite some deviations from observations in some cases. Globally, simulated BNF is dominated by soil moisture and temperature, as well as N fertilizer addition. Annual inputs through BNF are modeled to be 11.6±2.2 Tg N for soybean and 5.6±1.0 Tg N for all pulses, with a total fixation of 17.2±2.9 Tg N yr−1 for all grain legumes during the period 1981–2016 on a global scale. Our estimates show good agreement with some previous statistical estimates but are relatively high compared to some estimates for pulses. This study highlights the importance of accounting for legume N fixation process when modeling C–N interactions in agricultural ecosystems, particularly when it comes to accounting for the combined effects of climate and land-use change on the global terrestrial N cycle.
- Article
(5929 KB) - Full-text XML
-
Supplement
(3018 KB) - BibTeX
- EndNote


The agricultural sector is the main contributor to anthropogenic nitrous oxide (N2O) emissions (Reay et al., 2012; Tian et al., 2020) and a key nitrate pollution source to freshwater systems (Moss, 2008), mostly due to the intensive use of synthetic nitrogen (N) fertilizer and animal manure (Lu and Tian, 2017). This trend has been amplified by the expansion of agricultural land to provide food for a growing population and changing dietary patterns (FAO, 2018). The use of crops with biological N fixation (BNF) capability in agriculture has been discussed as one option to address the conflict between the need to increase food production and the associated environmental problems of N loss (Becker, et al., 1995; Fageria, 2007; Northup and Rao, 2016). N-fixing crops, like grain and forage legumes, not only provide protein-rich food for the human population and farmed animals (Voisin et al., 2014; Stagnari et al., 2017), but they are also directly useable as “green manure”, reducing the amount of chemical N fertilizer required in agricultural systems (Liu et al., 2011; Meena et al., 2018).
Soybean (Glycine max L.), with its countless and varied uses, is now one of the most widely grown crops in the world because of attractive cash return from its grain yield (FAOSTAT, 2021). There are concerns about the sustainability of soybean production, in particular because of its links to deforestation and loss of native vegetation in the Amazon and other areas of South America (Fehlenberg et al., 2017; Heilmayr et al., 2020). Other grain legumes, such as faba bean (Vicia faba L.), chickpea (Cicer arietinum L.), and cowpea (Vigna unguiculata L.), play an important role in improving soil quality as green manure when they are rotated or used as intercrops between cereals depending on the region (Williams et al., 2014; Denton et al., 2017). In comparison to non-legume plants, using legumes as green manure is more effective to build up or maintain soil fertility, as they not only increase soil organic matter when adding their biomass to soils, but also add extra N into the soil as a result of their symbiotic association with bacteria (Peoples et al., 2009; Ciampitti and Salvagiotti, 2018). The enriched soil N and soil organic carbon contents jointly support growth and productivity in subsequent crops (Jensen et al., 2012; Hajduk et al., 2015). Much experimental evidence has indicated that grain legume biomass increases linearly with an increasing BNF rate (Salvagiotti et al., 2008; Unkovich et al., 2010; Córdova et al., 2019) and that the N benefit to soil fertility from green manure is closely correlated with N fixation capacity, assuming that the entire legume plant is tilled into the soil (Fageria, 2007; Meena et al., 2018). Estimating the rate of BNF is thus important not only for an accurate prediction of grain legume production but also for a better understanding of where and to what degree N loss (i.e., N leaching and gaseous N emission) in cropland systems can be reduced by partially or fully replacing chemical N fertilizer with legume green manure.
Although grain legumes' BNF rates can be measured at field sites and in controlled environments, ecological models are needed for understanding and quantifying the rate of BNF on larger spatial scales and longer temporal perspectives. In many process-based crop models, a common method of representing BNF is to use a pre-defined potential or maximum N fixation rate that is adjusted by limiting environmental factors (Liu et al., 2011). The potential N fixation rate is then estimated either from plant nodule, root, and aboveground biomass (e.g., Boote et al., 2008; Corre-Hellou et al., 2009; Wu et al., 2020) or from plant N demand status (e.g., Cabelguenne et al., 1999; Robertson et al., 2002), varying with plant life cycle. Environmental constraining factors, such as soil temperature, water availability, soil mineral N concentration, and plant growth stage, are mostly taken into account (Liu et al., 2011; Chen et al., 2016). The big challenge in modeling legume BNF is that the process of symbiotic N fixation is always accompanied by the cost of fixed total photosynthetic carbon (C) to maintain legume symbiotic growth, activity, and reserves, which may be around 4 %–16 % of C (Kaschuk et al., 2009). Such a photosynthetic consumption strength would result in productivity loss if the photosynthesis rate did not increase to compensate for the cost (Kaschuk et al., 2010). In most models C cost mechanisms have not been implemented into N fixation, consistent with the assumption that the plant N uptake from soils does not cost carbon (e.g., Cabelguenne et al., 1999; Robertson et al., 2002; Corre-Hellou et al., 2009; Drewniak et al., 2013; Von Bloh et al., 2018; Wu et al., 2020), despite many field experiments demonstrating that the energy consumption required for BNF is far larger than soil mineral N uptake (Ryle et al., 1979; Harris et al., 1985; Macduff et al., 1996). In several other models, root substrate C concentration was adopted as an alternative to represent the C demand of N fixation (e.g., Thornley and Cannell, 2000; Yu and Zhuang, 2020). Only a few models assume that such a consumption can be assessed directly against C acquired in photosynthesis, in which the C cost per unit of fixed N is defined as either a constant of 6 kg C kg N−1 (Boote et al., 2008; Meyerholt et al., 2016) or a dynamic function of soil temperature ranging between 7.5 and 12.5 kg C kg N−1 (Houlton et al., 2008; Fisher et al., 2010).
The global production and consumption of grain legumes have greatly increased over recent decades (FAOSTAT, 2021). Accurately representing and quantifying the dynamic process of biological N fixation in models is important for better understanding grain legumes' contribution to food security and agriculture sustainability, particularly in the context of global environmental change. However, because of inadequate information on the environment and crop management, as well as the missing or incomplete BNF mechanism in models (e.g., C cost as mentioned above), current simulation of grain legume N fixation and its yield is still very weak, especially when it comes to global-scale modeling.
Thus, in this study, by accounting for the importance of soybean in overall agriculture and trade, as well as the higher N fixation capacity of faba bean compared to other pulses (Peoples et al., 2009; Unkovich et al., 2010; Denton et al., 2017; Liu et al., 2019), we implement these two grain legumes with BNF into a process-based vegetation model (LPJ-GUESS; Smith et al., 2014; Olin et al., 2015). Processes are added to LPJ-GUESS to estimate the symbiotic relationship between legumes and bacteria, also taking into account the plant C cost of BNF. Model results are extensively evaluated with worldwide site-level observed data and compared against country-level yield statistics, as well as continent-level BNF rates. The model-based and large-scale quantification of the N fixation capacity in legumes provides a scientific foundation for predicting the present and future N cycle in agro-ecosystems, allowing recommendations for fertilizer N application under different climatic conditions in legume-based farming systems.
2.1 Model description
LPJ-GUESS is a process-based dynamic vegetation model that simulates carbon and nitrogen (C–N) dynamics at scales typically ranging from regional to global (Smith et al., 2014). The model represents vegetation and soil dynamic processes as well as their interactions in response to changes in the environment and management, such as climate, CO2 concentration, soil physical properties, N deposition, and N fertilization. Three land-use types are included in the model: natural vegetation, pasture, and cropland. Vegetation on natural land is represented as the establishment, growth, and mortality of 12 plant function types (PFTs). Pastures are simulated by competing C3 and C4 grasses, in which 50 % of aboveground biomass is annually harvested to account for the effects of grazing (Lindeskog et al., 2013). Crops in LPJ-GUESS are described by crop functional types (CFTs), which differ in their C allocation scheme, morphological traits, and heat sum requirement for growth. At present, four CFTs are represented in the C–N version of LPJ-GUESS: two temperate C3 crops with sowing carried out in spring and autumn, a tropical C3 crop (representing rice), and a C4 crop (representing maize). Sowing dates on a large scale are determined dynamically in the model based on local climatology in each grid cell with five seasonality types represented (a combination of temperature- and precipitation-limited behaviors; Waha et al., 2012), and crops are harvested once each year when prescribed heat sum requirements are fulfilled (Lindeskog et al., 2013). Multi-cropping systems within a year are not yet implemented in the model. The recent representation of crops includes the incorporation of soil N transformation (Tian et al., 2020) together with a C–N allocation for crops operating on a daily time step (Lindeskog et al., 2013; Olin et al., 2015). Cropland management options for global-scale application include irrigation, tillage, N application, cover crop grass between the main growing seasons, and residue retention (Pugh et al., 2015; Olin et al., 2015). In this study, soybean is simulated as one additional crop because of its large importance as a food, fodder, and oil crop, and the parametrization of faba bean is representative for the group of pulses in general. The model schematic and other calculations including the C cycle and the N cycle follow an earlier version of LPJ-GUESS (Smith et al., 2014; Wårlind et al., 2014; Olin et al., 2015).
2.2 Updated daily carbon allocation parameters
Similar to most ecosystem and crop models, LPJ-GUESS adopts crop-specific accumulated heat requirements to model plant growth development, and crops are allowed to adapt to the local climate by dynamically adjusting the heat requirements to different climatic zones (Lindeskog et al., 2013). To better represent C and N allocation in various phenological phases, Olin et al. (2015) defined crop development stage by considering the effects of temperature, vernalization days, and photo-period following Wang and Engel (1998). In this study, we assume that the grain legume development stage is linearly correlated with its accumulated heat units according to the field-based soybean experiments described in Irmak et al. (2013). It is estimated as
where DS is crop development stage ranging from 0 to 2 (DS=0, sowing; DS=1, flowering; DS=2, harvest); fphu is the fraction of today's accumulated heat units to the total heat requirement; fphuanthesis is the threshold of fphu when anthesis starts, below (above) which crop growth belongs to the vegetative (reproductive) stage; and a and b are the linear regression coefficients, varying between the vegetative and reproductive phases. The values of a and b, as well as the crop-specific base temperature (∘ C) to estimate the accumulated heat units, are both given in Table S1 in the Supplement.
The daily fraction of assimilate allocation to leaves, stems, and roots is an important process before storage organs are formed. The assimilate invested in roots can help crops overcome water or nutrient limitation when they suffer from stress in the vegetative stage, whereas new assimilate invested in leaves generally gives a highly efficient return from the photosynthesis product (Penning de Vries et al., 1989). Unlike cereal crops, nodulated plants, particularly soybeans, are more likely to achieve a higher photosynthesis rate and delay leaf senescence due to the continued N supply from biological N fixation (Abu-shakra et al., 1978; Kaschuk et al., 2010). A precise representation of assimilate partitioning to the plant organs when modeling BNF in grain legumes is especially important considering the high C cost from fixing N from the atmosphere. Productivity loss would be simulated if the leaf photosynthesis rate did not increase to compensate for the costs (Macduff et al., 1996; Kaschuk et al., 2009).
Following Olin et al. (2015), relationships between assimilate allocation to legume organs were established based on the data from Penning de Vries et al. (1989) and Boote et al. (2002). We fitted the allocation functions using a Richards logistic growth curve (Eq. 2, Richards, 1959) to model the allocation to each organ dynamically and separately. For each allocation function fi (see Eqs. 3–5 below),
where DS is crop development stage, and ai, bi, ci, and di are fitting coefficients for the three functions (specific values given in Table S1).
Maintaining BNF in the reproductive stage (i.e., after anthesis; DS>1) would reduce the flow of carbon assimilation to storage organs. We adjusted the allocation functions from Olin et al. (2015) so that the model allowed a dynamic adaptation of the allocation to grain over the seed-filling period in response to BNF cost (see Eqs. 3–5 for details).
2.2.1 Yield vs. the whole plant
After anthesis (DS>1), most assimilates are allocated and re-translocated from the vegetative organs to the grains. During the late seed-filling period (DS≥d1, see Eq. 3), we assumed that the fraction of carbon allocated to yield would increase to partly compensate for the productivity loss caused by spending on N fixation at the cost of reducing the flow of carbon to leaves and stem (see Eq. 4). We established the ratio of the allocation to yield relative to the whole plant as
where Pyield and Pveg are the fraction of carbon allocated to yield and vegetative organs, respectively, ranging from 0 to 1; PBNFcost is the proportion of net primary production (NPP) used for BNF to today's total NPP; and d1 is the fitting coefficient representing the DS of the maximum growth rate of grain (d=1.41 for soybean and 1.46 for faba bean, see Table S1).
2.2.2 Leaf vs. shoot vegetative organs
Similarly, the ratio of leaf vs. shoot vegetative allocation is specified as
where Pleaf and Proot are the fraction of carbon allocated to leaf and root, respectively. The fitting function of leaf vs. shoot vegetative organs in soybean is given in Fig. 1a.
2.2.3 Root vs. vegetative organs
When a plant experiences water or nutrient stress, it invests more assimilate to roots relative to shoot vegetative organs (Penning de Vries et al., 1989). We implemented dynamic increases in the allocation to roots during the late seed-filling period to help legumes cope with the C loss from BNF cost and established the relationship between the allocation to root and that to vegetative organs as
In addition, carbon partitioning to vegetative organs (Pveg) can be calculated by subtracting the reproductive allocation (i.e., Pyield) from the whole plant as
Finally, we can achieve dynamic carbon allocation to the plant organs over the growing season by combining Eqs. (3)–(6).
Partitioning functions are plotted for soybean in Fig. 1b and for faba bean in Fig. S1 in the Supplement. Significant differences in allocation patterns can exist between cultivars. Compared to cereals (Olin et al., 2015), we found that grain legumes are more likely to allocate more assimilate to leaves not only in partitioning proportion but also in the length of allocation time, probably corresponding to their higher leaf activities in response to N fixation (Kaschuk et al., 2010).
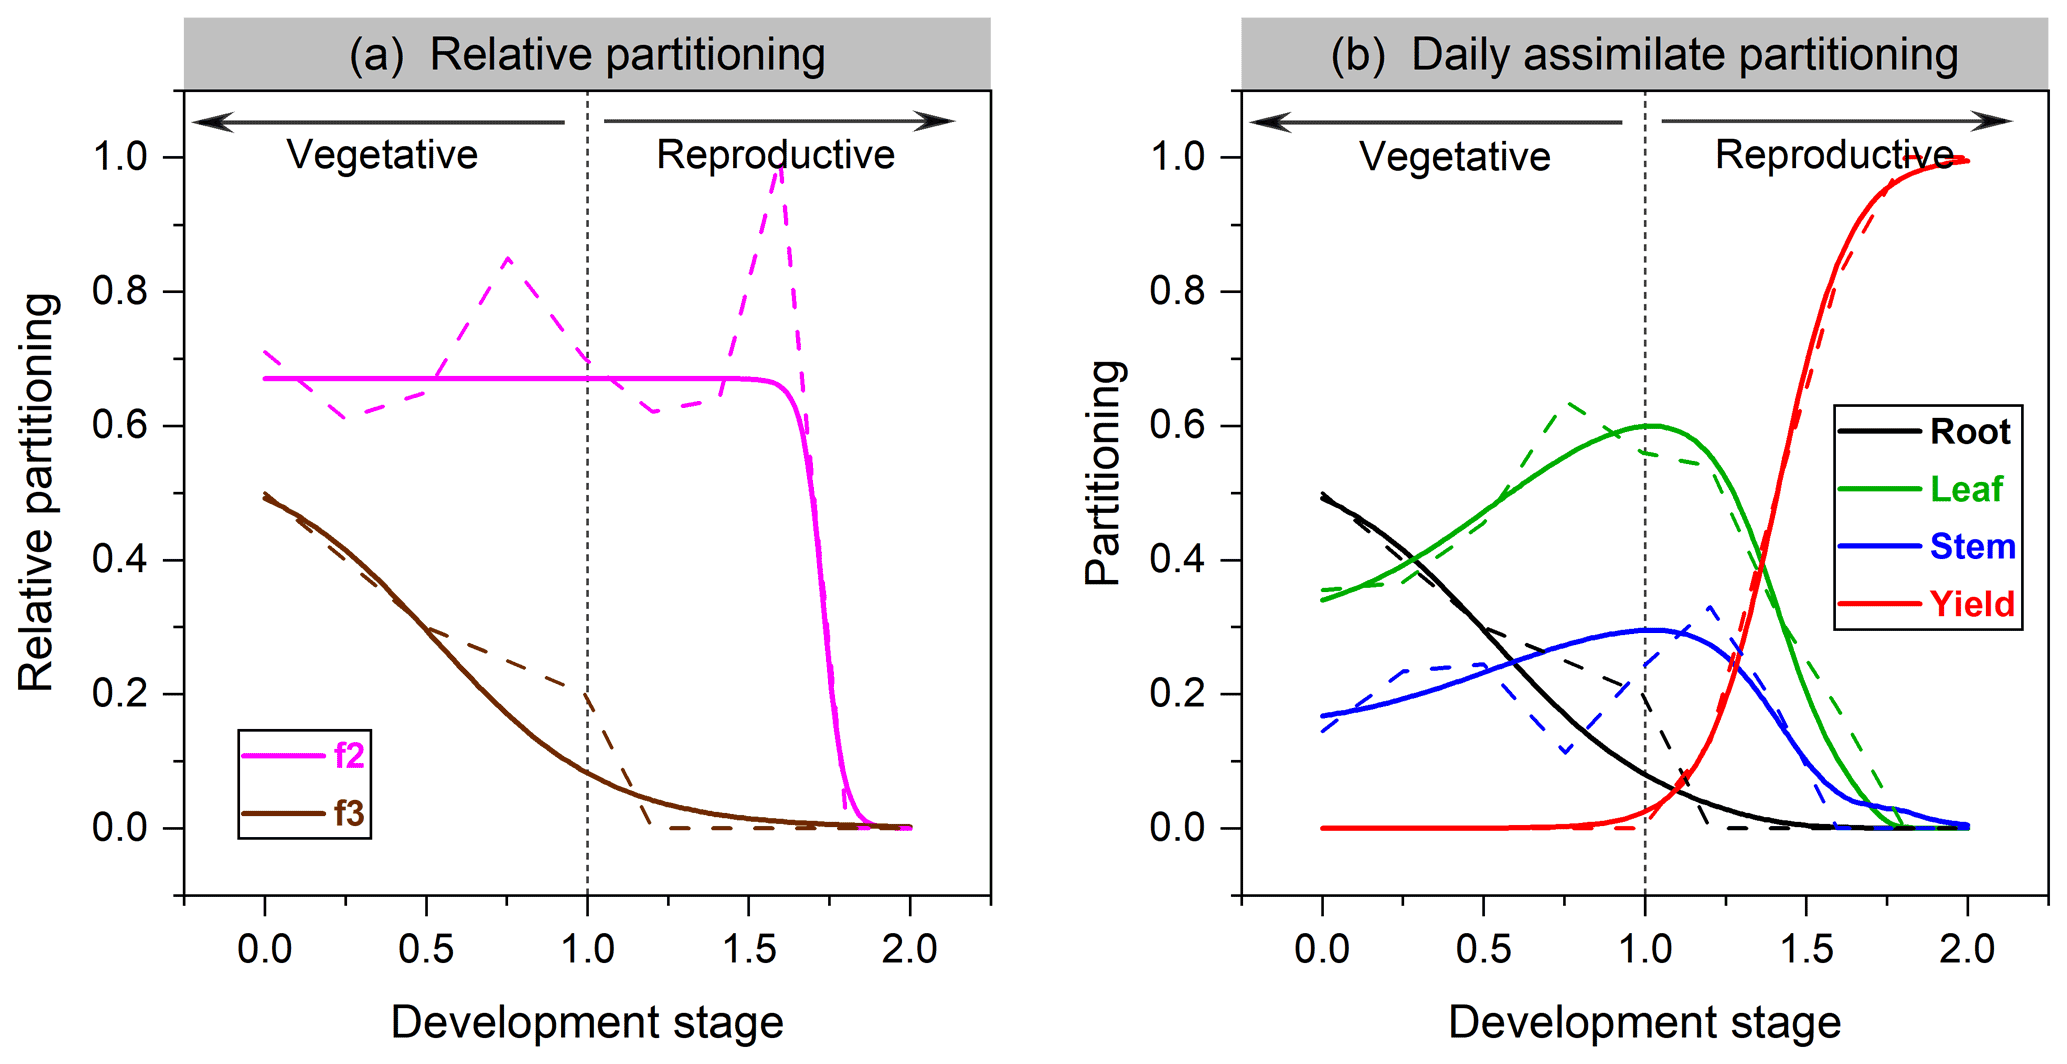
Figure 1The organ's relative allocation (a) and assimilate partitioning (b) to roots, leaves, stem, and yields for soybean. Solid lines represent the fitted Richards functions in this study, and dashed lines are the allocation scheme from Penning de Vries et al. (1989). f2 in (a) denotes leaf relative allocation to shoot vegetative organs (Eq. 4), whereas f3 is root relative allocation to vegetative organs (Eq. 5).
2.3 Representation of BNF
Fixing N from the atmosphere and N uptake from soils represents two N sources for grain legumes to meet their total plant N demand. The latter has a higher priority for plants because the process is less energy-consuming than N fixation (Ryle et al., 1979; Macduff et al., 1996). Following on this idea, in LPJ-GUESS, N fixation will only be triggered when the following two assumptions are valid at the same time (Fig. 2): (1) if today's plant growth still suffers from N limitation after N uptake from soils (i.e., the N deficit, plant N demand minus soil N uptake, is greater than zero). The plant will then be allowed to fix N from the atmosphere to fill the N deficit. (2) Since N fixation is strongly related to photosynthetic assimilate due to its high energy consumption, BNF in the model is assumed to take place only when today's NPP is positive so that adequate C supply can be provided to meet the BNF cost.
Modeling the BNF rate is adapted from previously published methods (e.g., CROPGRO, EPIC, APSIM; see Liu et al., 2011) in that it considers (1) the potential N fixation rate, (2) the limitation of temperature, (3) soil water status, and (4) the crop growth stage as
where Nfix is the N fixation rate; Nfixpot is the potential N fixation rate; and fT, fW, and fDS are limitations (ranging 0 to 1) on BNF by soil temperature, soil water availability, and crop development stage function, respectively.
The definition of the potential N fixation rate in some studies is based on the strong relationship between N fixation and either nodule size, biomass (Weisz et al., 1985; Voisin et al., 2003), or root dry matter (Soussana et al., 2002; Voisin et al., 2007). Due to the difficulties in measuring both nodules and roots in the field directly, some studies also adopt shoot biomass to replace nodule or root biomass based on the empirical relationship between these two variables (Yu et al., 2002; Corre-Hellou et al., 2009; Wu et al., 2020). In our implementation, since the nodulation process of legumes has not yet been implemented in LPJ-GUESS, Nfixpot is assumed to be proportional to root dry matter:
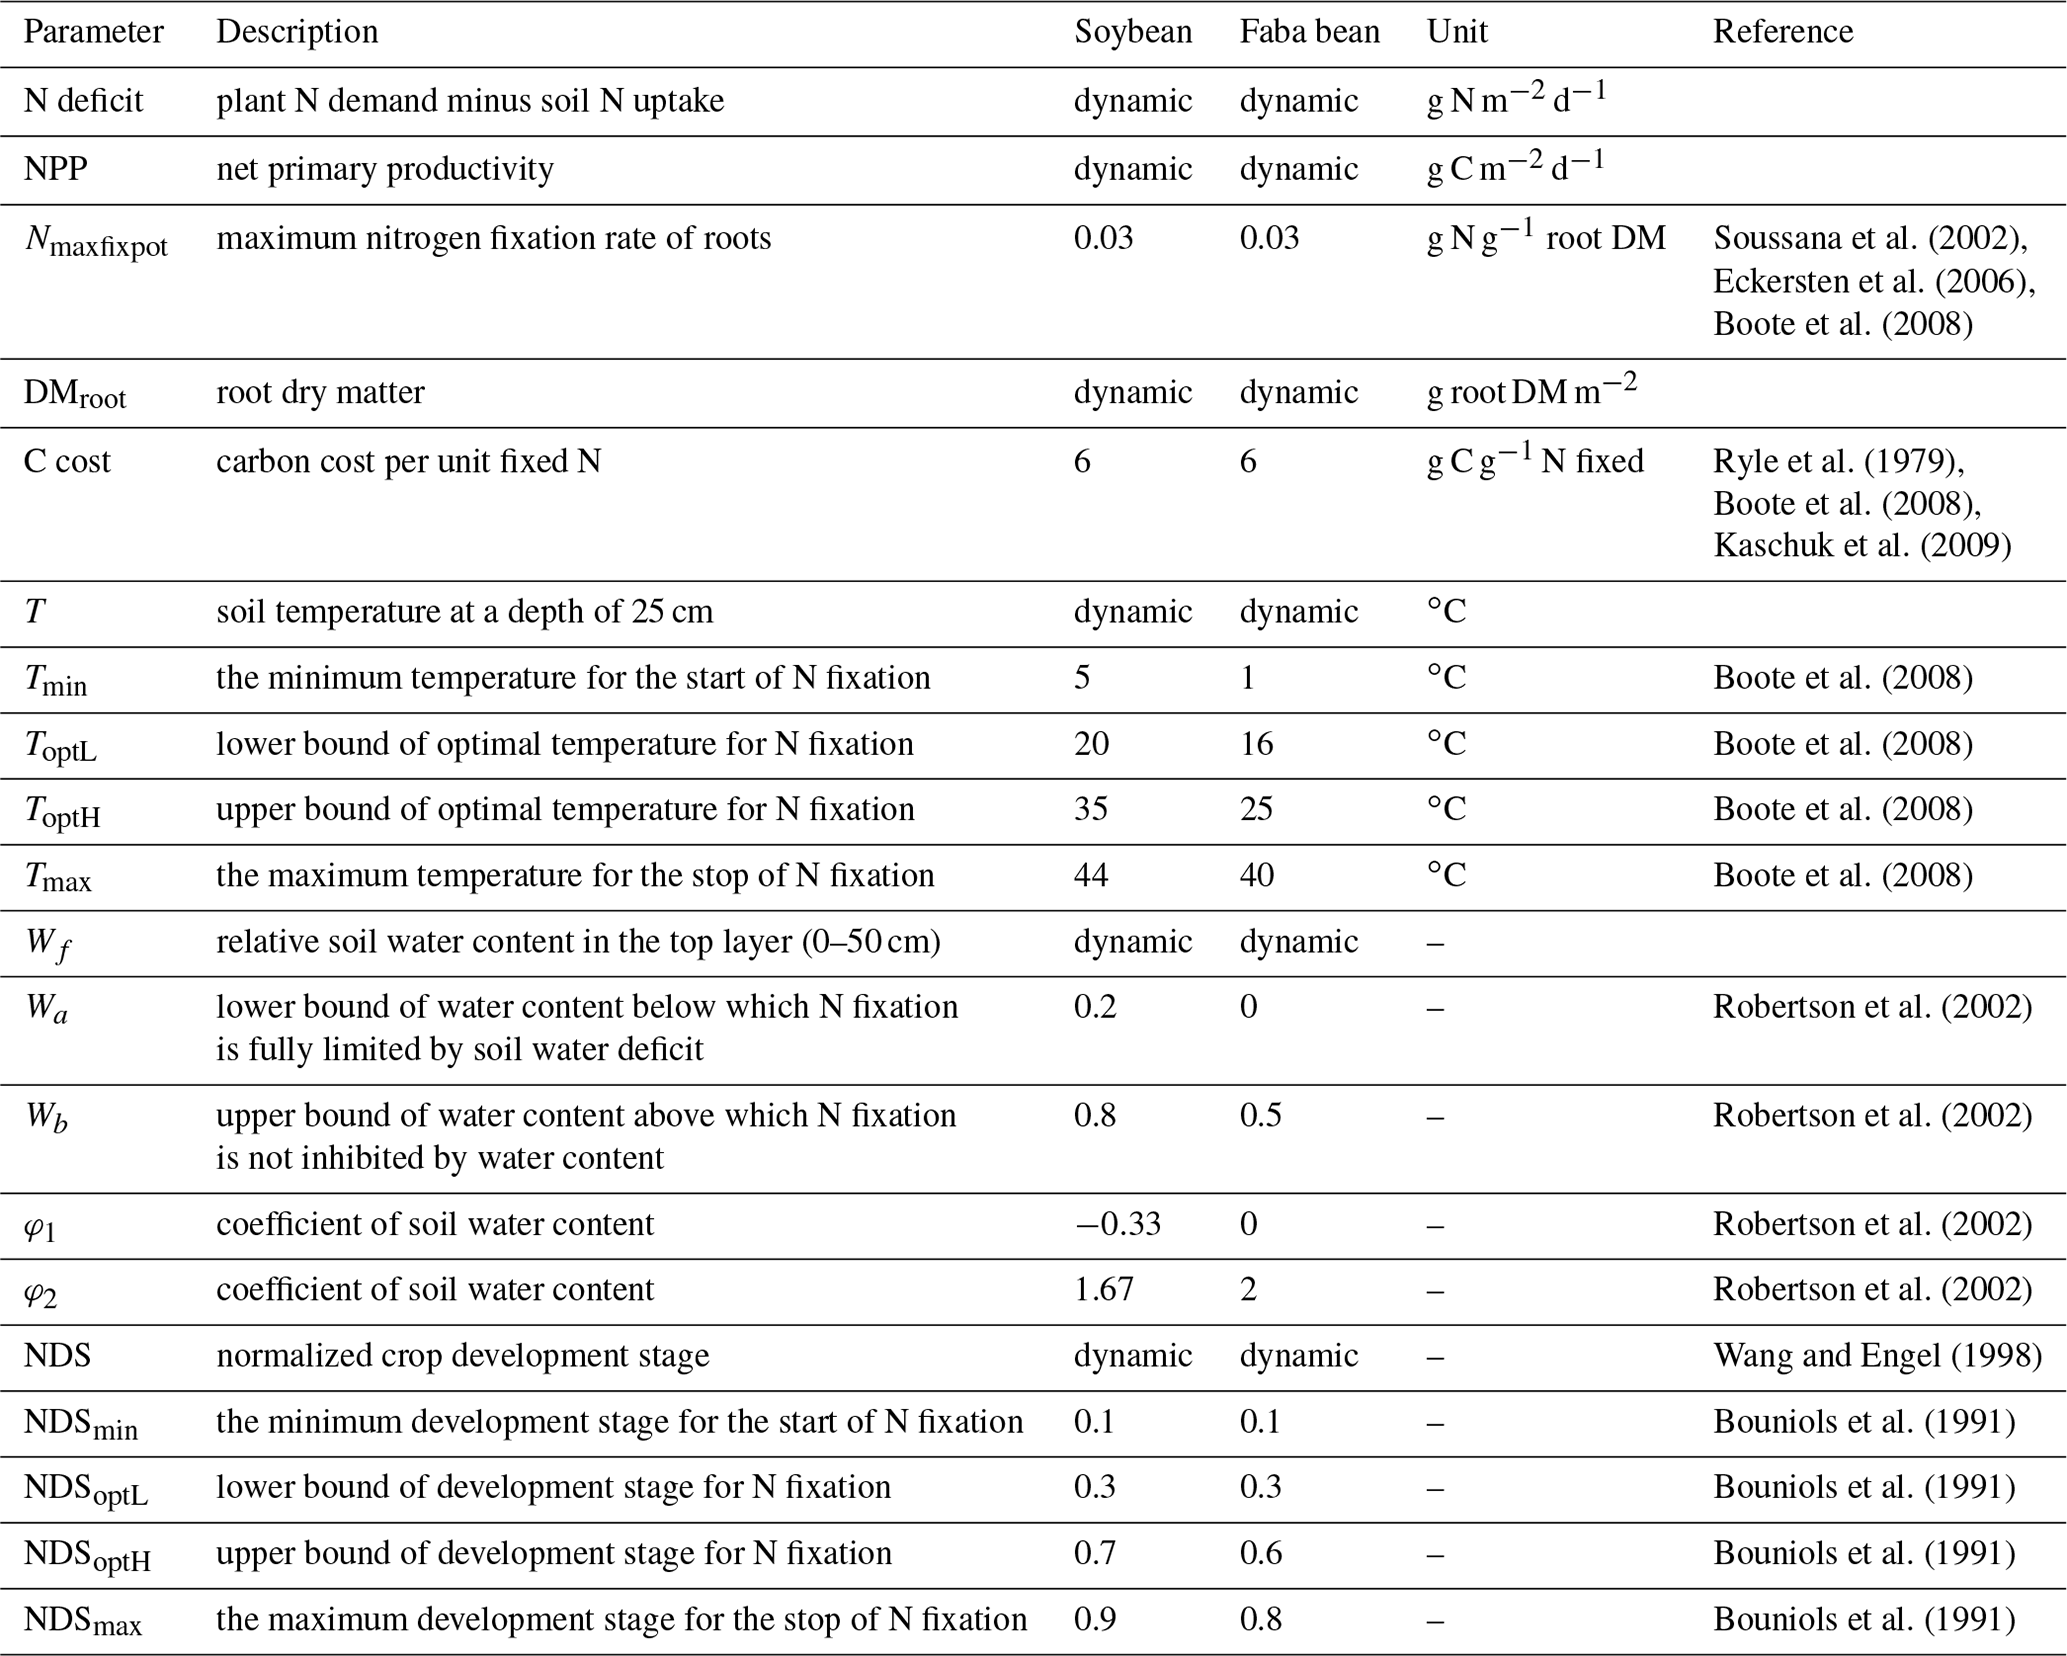
where Nmaxfixpot is the maximum nitrogen fixation rate of roots (g N g−1 root DM), and DMroot is root dry matter (g root DM m−2). Since the experimental parameter Nmaxfixpot is strongly related to the effectiveness of rhizobial strains and varies widely between species and sites, it is not easy to obtain the parameter for each legume crop. In this study, we assume that legumes are either inoculated or there are high enough populations of strains in the soil that Nmaxfixpot is not constrained by the effectiveness of rhizobia. Here Nmaxfixpot is assumed to be a constant as 0.03 g N g−1 root DM for both grain legumes as a moderate value taken from the literature (Soussana et al., 2002; Eckersten et al., 2006; Boote et al., 2008).
Soil temperature is a controlling factor for both microbial activities and plant growth. For soybean, 20–35 ∘C has been found to be optimal for nitrogenase activity and for faba bean the optimal soil temperature can range from 16–25 ∘C (Boote et al., 2008). The influence of soil temperature on legume BNF is represented in the model as a four-threshold-temperature function:
where T is soil temperature (∘C) at a depth of 25 cm representing the mean temperature of the topsoil layer in the model (0–50 cm), Tmin (Tmax) is the minimum (maximum) temperature below (above) which N fixation stops, and ToptL and ToptH are the lower and higher optimal temperatures within which N fixation is not limited by temperature. The values of these four temperature thresholds vary among legume crops and are given in Table 1.
In addition to temperature, soil water content is a major factor controlling the rate of N fixation (Srivastava and Ambasht, 1994). Too little water strongly inhibits BNF due to impacts of drought stress on nodule nitrogenase activity (Serraj et al., 1999; Marino et al., 2007). Although oxygen is needed to support the respiration of legume roots and bacteria in the nodules, nitrogenase is more active in anoxic, waterlogged environments (Jiang et al., 2021). A linear water limitation function is thus incorporated into LPJ-GUESS (Wu and McGechan, 1999) and is represented as
where Wf is relative soil water content in the topsoil layer (0–50 cm) ranging from 0 to 1, φ1 and φ2 are empirical coefficients, Wa is the threshold of Wf below which N fixation is fully restricted by soil water deficit, and Wb is the value above which N fixation is not inhibited by soil water content. The values of the parameters are shown in Table 1.
The influence of plant growth stage on legume BNF rate is taken into account in very few models; the process is generally stopped forcibly after the crop reaches a certain development stage. For example, in the CROPGRO model (Boote et al., 2008), N fixation in soybean starts in the second trifoliolate stage and continues until the end of physiological maturity, whereas it ceases at the middle of the seed-filling period in the EPIC model (Cabelguenne et al., 1999). Much experimental evidence has indicated that the N fixed by legumes varies widely among crop growth stages, with the largest BNF rate observed between the late vegetative phase and the early seed-filling period (Santachiara et al., 2017; Córdova et al., 2020; Ciampitti et al., 2021). In this study, a specific function, similar to the temperature response function, is thus implemented in the BNF scheme to represent the variation of N fixation with the course of the legume life cycle:
where NDS is normalized crop development stage ranging from 0 to 1 (0, sowing; 0.5, flowering; 1, harvest), NDSmin is the time before which there is no N fixation due to inadequate nodulation, NDSmax is the time after which N fixation suspends due to nodule senescence, and NDSoptL and NDSoptH define the period within which the legume BNF rate is not inhibited by development stage. The values of the parameters for two grain legumes are derived from the literature and listed in Table 1.
In addition to the environmental limitation factors, the amount of daily NPP also affects N fixation in the model. The NPP requirement for BNF cost is computed based on the estimated N fixation rate (Nfix, Eq. 8) by multiplying the C cost per unit fixed N, which is assumed to be a fixed value of 6 g C g−1 N as a moderate value taken from previous studies (Ryle et al., 1979; Patterson and Larue, 1983; Boote et al., 2008; Kaschuk et al., 2009). The NPP cost to maintain BNF is released as CO2 to the atmosphere and modeled as part of the autotrophic respiration of the soil (Fig. 2). Since the fixed N is partly transported to plant leaves and continues to support photosynthesis, the plant may get additional C profits from the investment of BNF by enhancing the leaf N content that optimizes the carboxylation capacity (Vmax) (Kull, 2002). Following on this idea, another assumption adopted in this study is that at most 50 % of today's NPP can be used for N fixation before the crops reach the development stage of grain maximum growth rate (DS<d1, see Eq. 13). After this the maximum proportion of today's NPP used for BNF cost is dynamically reduced and assumed to be the fraction of carbon allocation to leaves and stem:
where MAXNPPBNFcost is the maximum proportion of today's NPP used for N fixation varying from 0–0.5, and Pleaf and Pstem are the fraction of carbon (i.e., NPP) allocated to leaf and stem, respectively (see Eq. 7 for details). A flowchart of the BNF scheme in LPJ-GUESS is shown in Fig. 2.
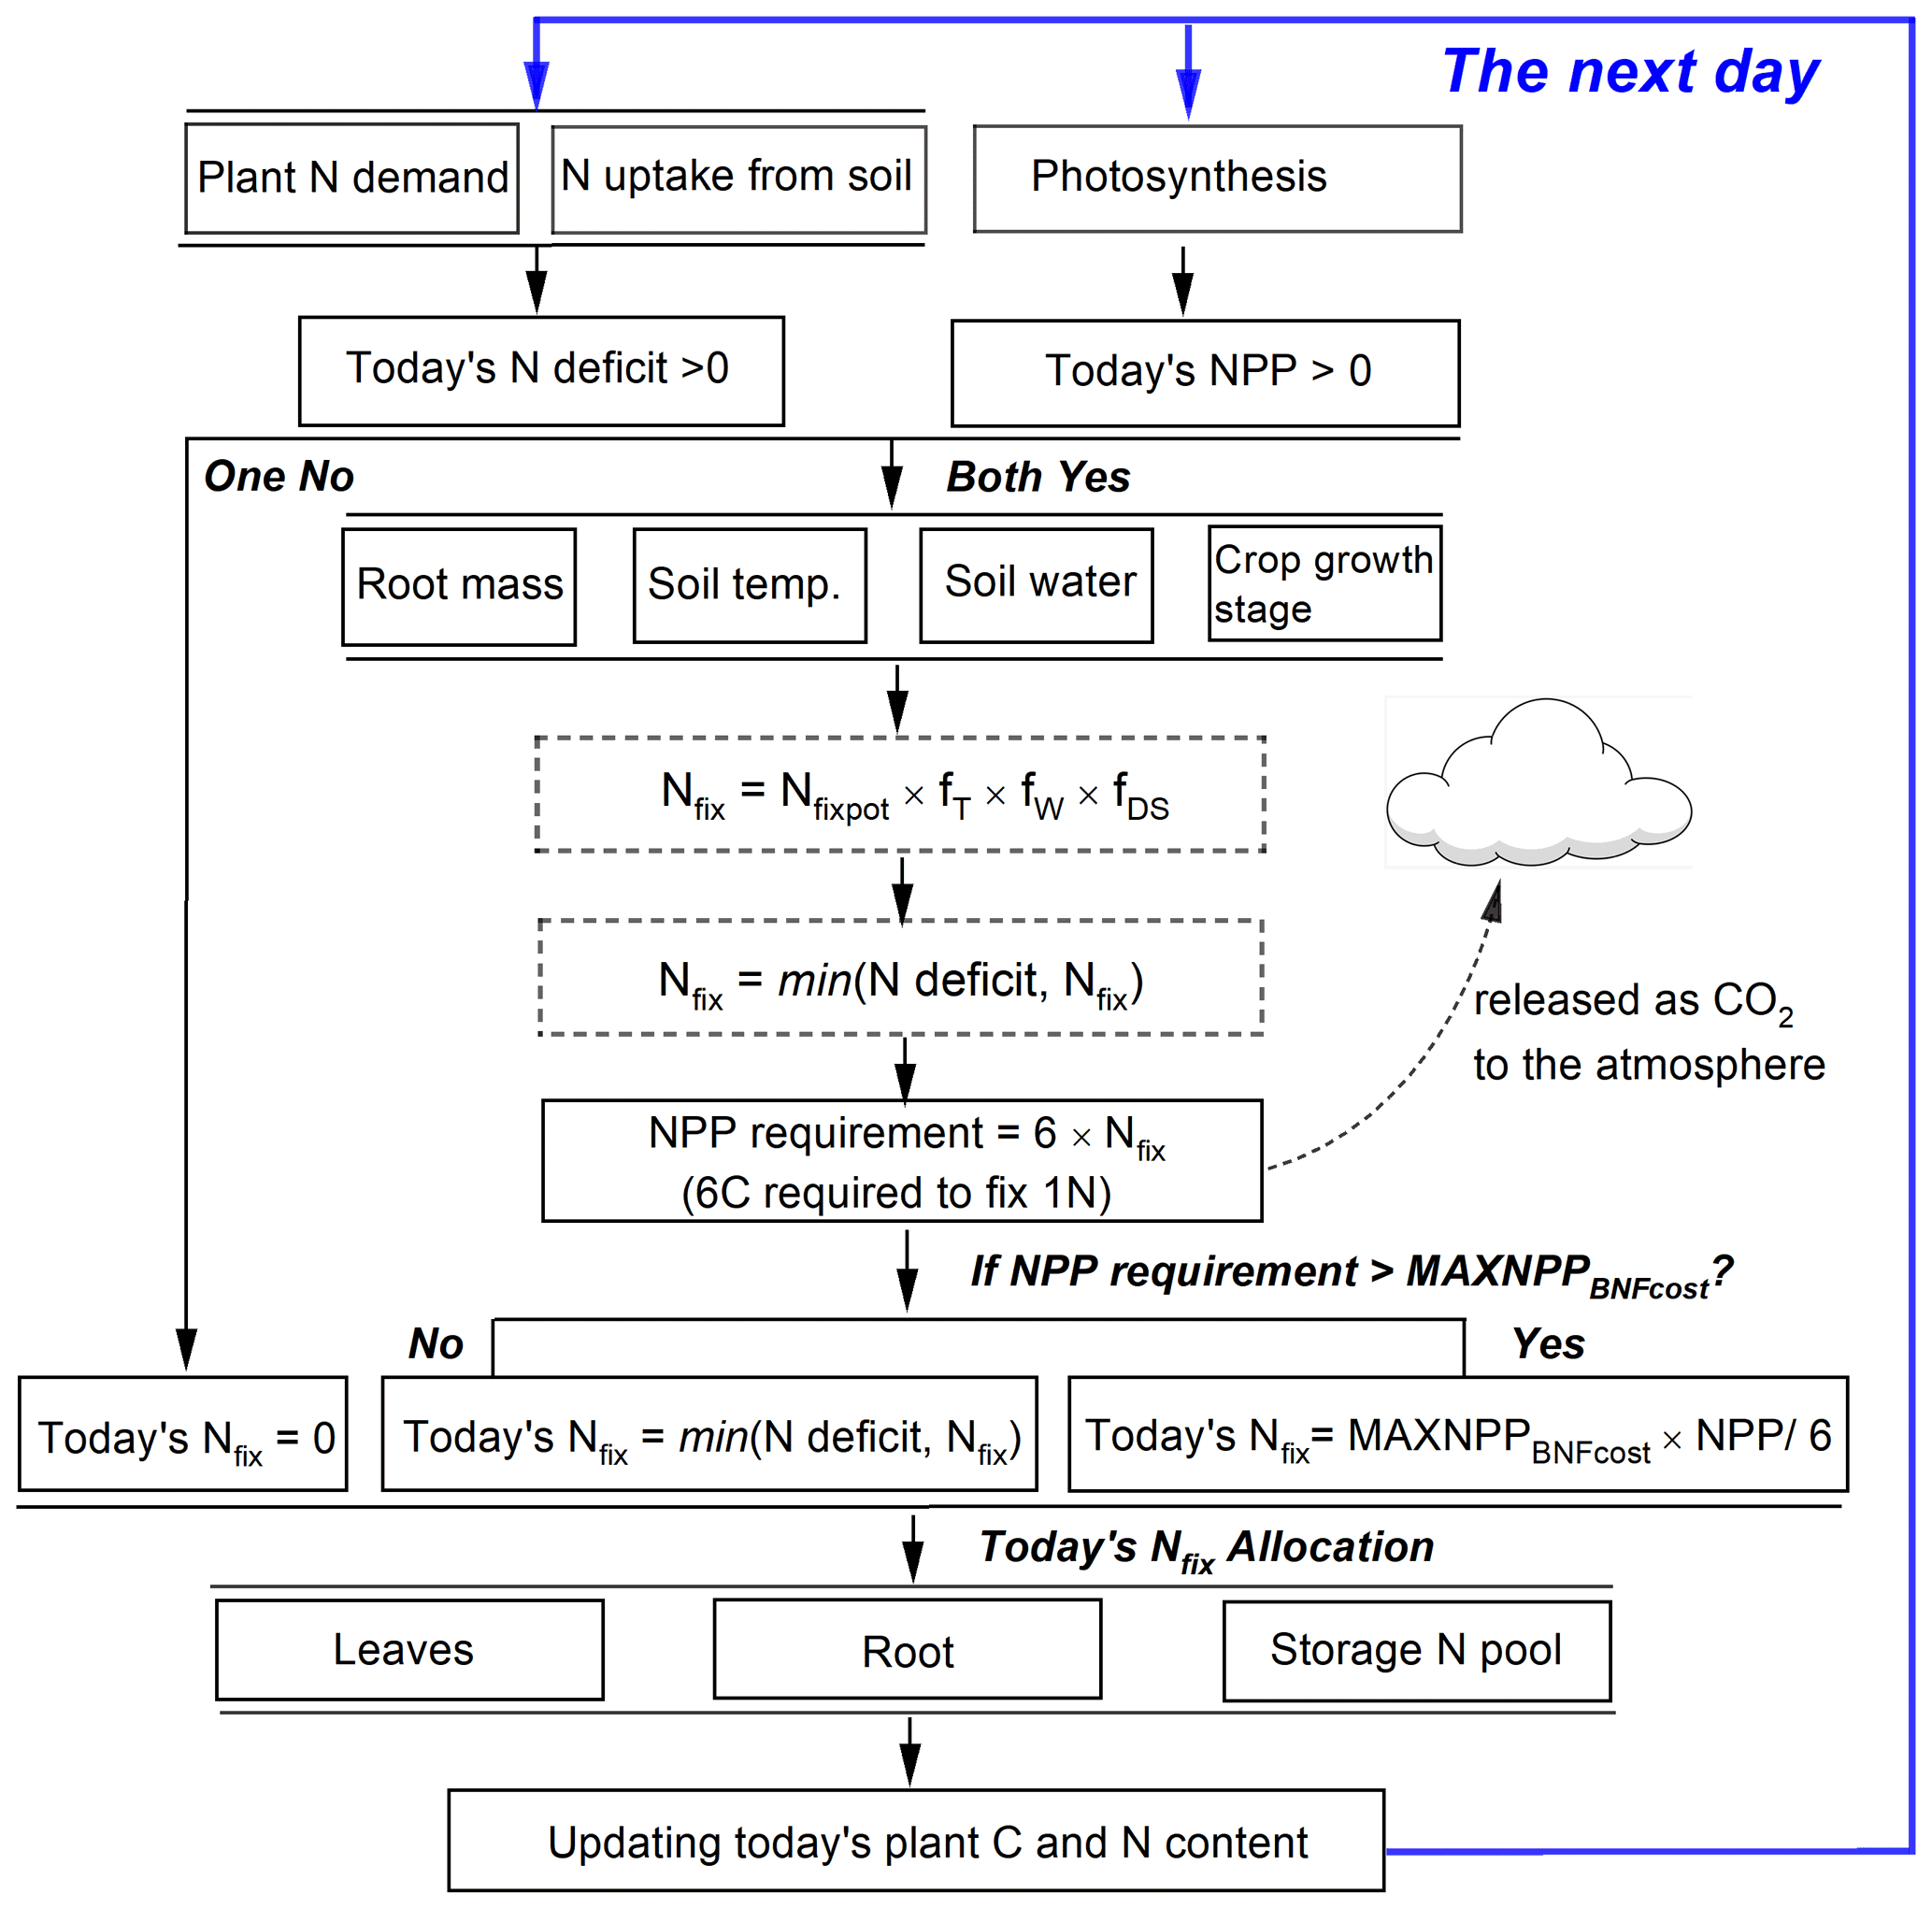
Figure 2Representation of the N fixation route used in grain legumes in LPJ-GUESS. Today's N deficit is calculated as the difference between plant N demand and soil mineral N uptake. Nfix in dotted boxes represents intermediate values.
Table 1Overview of BNF-related variables and parameters used in the model for soybean and faba bean.
2.4 Experimental setup
Field-based data from the literature, together with global yield statistics from legume-producing countries and region-level N fixation data from published sources, were compared to model runs to examine performance in simulating yields and BNF rate from the site scale to a larger region.
In order to build up cropland soil C and N pools, all simulations were initialized with a 500-year spin-up using atmospheric CO2 from 1901 combined with repeating detrended 1901–1930 climate from GSWP3-W5E5 (Dirmeyer et al., 2006; Lange, 2019; Cucchi et al., 2020). The cropland fraction linearly increased from zero to the first historic value (1901) during the last 30 years of spin-up. Monthly atmospheric N deposition (NHx, NOy) was used as simulated by CCMI (NCAR Chemistry–Climate Model Initiative). The value was interpolated to from the original resolution () to match the resolution of the climate data (Tian et al., 2018). Below, the setup of the different experiments is explained in detail.
2.4.1 Model evaluation at site scale
To evaluate the model's ability to simulate BNF rate and yields, field-based N fixation trials with detailed measurements of soil N uptake, biomass, and N mass allocation were collected from the published literature. This dataset comprised 17 soybean and 7 faba bean sites located between ∼33∘ S and ∼53∘ N (Fig. 3). In these trials, BNF response to various management practices (such as N fertilizer addition and irrigation) were investigated. Details about these sites – their geographic coordinates, BNF trials, and the years of available data, as well as corresponding site-specific plant traits (e.g., specific leaf area and grain C:N ratio) – are provided in Table S2.
In some field experiments, BNF rate and/or soil N uptake are not directly reported in the literature, so we estimated these values as
where %Ndfa is the proportion of plant N derived from the atmosphere (ranging 0–100), representing the contribution of N fixation to the plant total N uptake, and Nplant is the amount of N accumulated in the plant (kg N ha−1), defined as either the shoot or the whole plant N mass, depending on the measurement method adopted in the experiment.
In general, grain yields, plant tissue dry mass, and N mass, together with %Ndfa, soil N uptake, and N fixation, are widely measured variables in field-based BNF trials (see Table S2). These data were chosen as our target variables used for model evaluation. In addition, to convert plant C mass to dry matter, a conversion factor of 2.0 was used (Smith et al., 2014). Dry weight was converted to wet weight by assuming a water fraction of 0.13 in the grain legumes (Córdova et al., 2019).
Since specific leaf area (SLA) and target grain C:N ratio play a very important role in determining N uptake and N re-translocation to grain during seed-filling in the model (Olin et al., 2015), we implemented two simulations to explicitly explore model performance across all sites. For “site-specific” simulations, the reported SLA and grain C:N ratio listed in Table S2 were adopted for the simulation (for sites for which these were available). For “global uniform” parameter simulations, SLA was set to 40 and 45 m2 kg−1 C (Penning de Vries et al., 1989), and the target grain C:N ratio was represented as a constant of 8 for soybean and 10 for faba bean (Kattge et al., 2020). These values were also used for global-scale simulations.
Due to the unavailable information on weather data at the majority of the sites evaluated, gridded daily climate data for air temperatures (maximum, minimum, and mean), precipitation, and solar radiation were used from GSWP3-W5E5 (Dirmeyer et al., 2006; Lange, 2019; Cucchi et al., 2020), chosen for the grid cell representative for each experimental site. We compared model-required input variables from GSWP3-W5E5 with observations at three sites, finding that the gridded climate data had fairly good agreement with weather records in the field, despite some solar radiation deviations between two datasets for individual days over the experimental period (Fig. S2). There was no information on land-use and management practices in years preceding the experiments at most sites. Therefore, to maintain soil N and C pools in equilibrium after model spin-up, we decided to implement a common cropping system of maize–legume rotation annually from 1901 to the year before the trial start, with no N fertilizer applied to legumes. Over the trial period, the management practices were implemented according to information provided in the literature (Table S2). In addition, site-specific soil physical properties, such as fractions of sand, silt, and clay, were also used as forcing to further compute corresponding soil water characteristics in the model (Olin et al., 2015).
2.4.2 Global yields and BNF rate
To evaluate the model's ability to simulate legume yields and BNF on a large scale, national crop yield statistics from FAOSTAT (http://www.fao.org/faostat/en/#data/QC, last access: 9 May 2021) were collected and compared with modeled output. Furthermore, Peoples et al. (2009) divided N fixation data for widely grown legume crops collated from a range of published sources into different geographical regions. In order to compare our simulated BNF with the literature-based records, each simulated grid cell was classified to be in one of the 10 regions given in Table 1 in Peoples et al. (2009) (Fig. S3).
For regional comparison, the modeled gridded yield and BNF rate were aggregated to national and continental scales, respectively, using information on crop-specific cover area in the spatial pattern (described below):
where Var is yield or BNF rate; Varregion is the aggregated result in a given region; i is the grid cell number in that region, ranging from 1 to n; Varrain and Varirri represent the modeled yield or BNF rate under rain-fed and irrigated conditions, respectively; and Arearain and Areairri are the crop-specific rain-fed and irrigated areas used in simulations, respectively.
As land-use and land cover input, data from LUH2 (Land-Use Harmonization 2, Hurtt et al., 2020) with fractions of cropland, pasture, and natural vegetation at each grid cell were adopted, spanning from 1901 to 2014 in 0.5∘ resolution. The fractional cover of different crop species was derived from MIRCA (Monthly Irrigated and Rain-fed Crop Areas; Portmann et al., 2010). Since no detailed information was available on the growth distribution of the faba bean, the “pulse” fraction in MIRCA was used as input instead, and pulse country-level yield statistics provided by FAOSTAT (2021) were collected to compare with faba bean outputs by LPJ-GUESS. As information on cropland soil characteristics, data in the top layer (30 cm) were derived from the GGCMI (Global Gridded Crop Model Intercomparison) phase 3 soil input dataset (Volkholz and Müller, 2020). In general, although the total cropland cover in a grid cell could change annually over the course of the simulation, the relative fractions of each crop species within that cover fraction were held constant.
In terms of timing of N fertilizer application, a recent meta-analysis conducted by Mourtzinis et al. (2018) indicated that splitting N application between planting and the early reproductive stage resulted in significantly greater soybean yields than a single application. Mineral N fertilizer for legumes in the model was thus split into two equal applications at the time of sowing (DS=0) and flowering (DS=1.0). Manure was added to soils at the time of sowing as a single application to reflect real-world practices that account for the time required for manure N to be made available to plants. Data sources for mineral N fertilizer and manure over the period 1901–2014 were derived from Ag-GRID (AgMIP GRIDded Crop Modeling Initiative; Elliott et al., 2015 and Zhang et al., 2017, respectively) (Fig. S4).
2.5 Statistical methods
In order to quantify the agreement between modeled and observed variables, the coefficient of determination (adjusted R2), relative bias (RB, Eq. 16), absolute bias (AB, Eq. 17), and the root mean square error (RMSE, Eq. 18) were computed:
where Mi and Oi indicate modeled and observed values, and n is the number of observations. To evaluate the fit of the interannual variability of modeled and reported yields on the country level, the standard deviation (SD) and Pearson correlation coefficient (r, Eq. 19) were calculated:
where and represent modeled and observed mean, and n is the number of reported years.
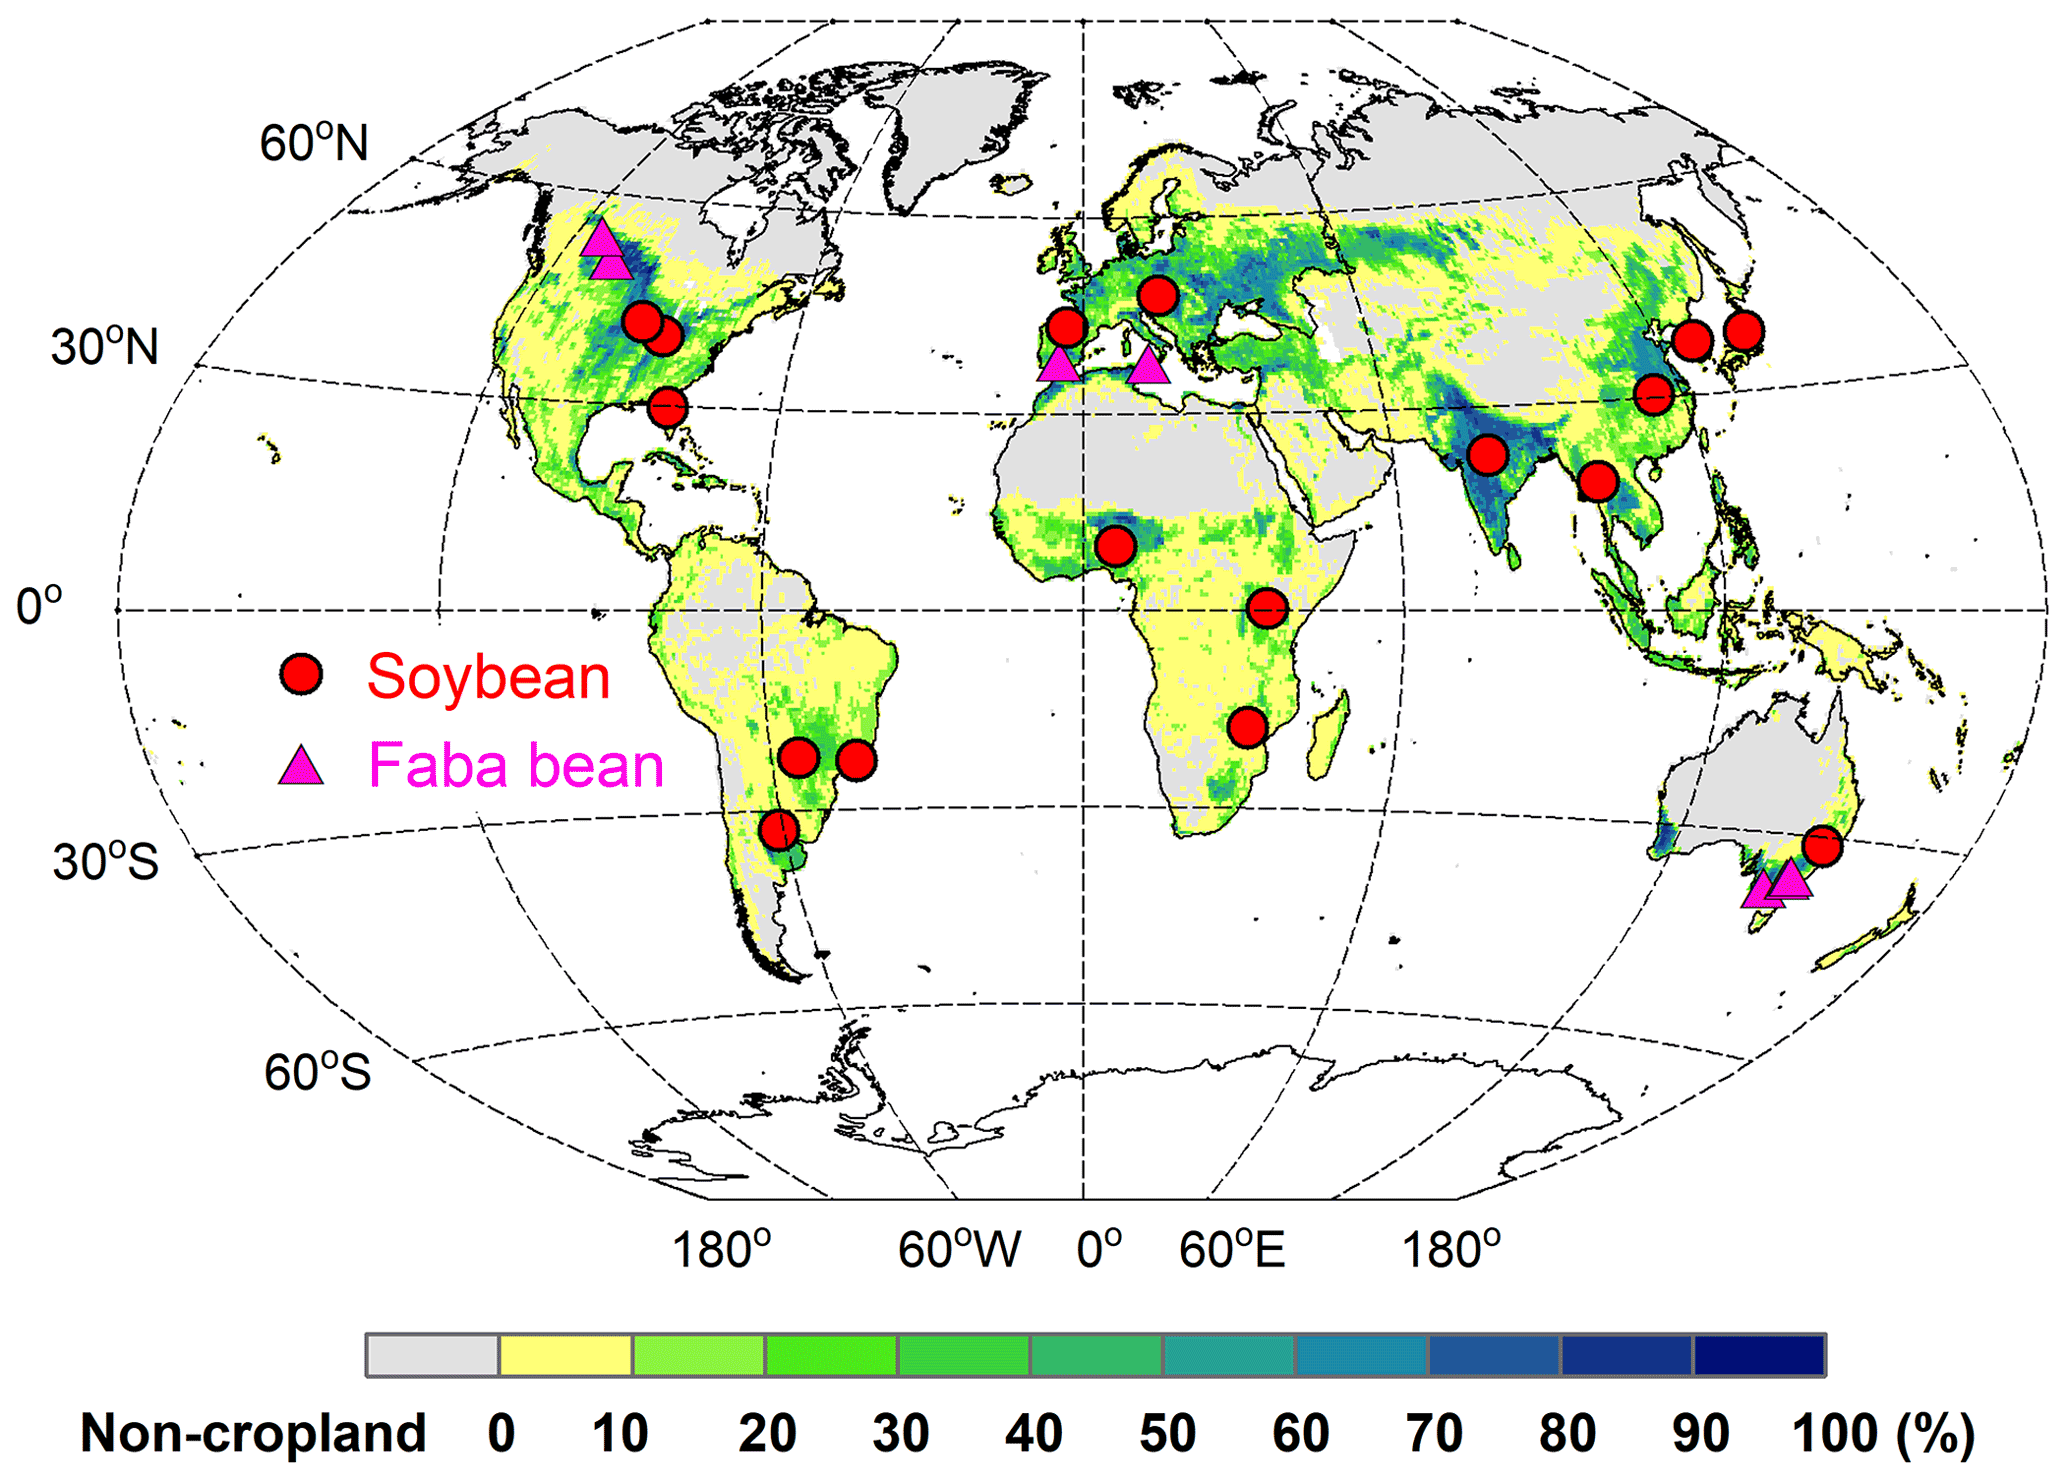
Figure 3Spatial distribution of soybean (red circles) and faba bean (magenta triangles) sites used for BNF evaluation. The map background is cropland fraction ( %) averaged over 1996–2005 at the resolution of , derived from the LUH2 dataset (Hurtt et al., 2020).
3.1 Model evaluation at site scale
3.1.1 Model performance across all sites
In order to examine model performance in simulating BNF-related variables across all grain legume sites described in Table S2, we compiled six widely measured variables related to N fixation at harvest, as shown in Fig. 4. Modeled yields generally agreed well with observations, especially in the site-specific simulation setup. These had a higher regression slope (0.83) and lower absolute bias (28 %) compared with the global uniform simulation setup (Fig. 4a). N content in grains and shoots showed lower agreement, with simulated values underestimating the observations for most sites (Fig. 4b–c), likely arising from two important N sources to grain legumes not being captured well by the model (i.e., soil N uptake and BNF, shown in Fig. 4d–e). The global uniform run did not capture observed N fixation well, with a regression slope of 0.22 and absolute bias of 39 %. The simulated BNF compared to observations was notably improved when using site-specific parameters, with the regression slope increasing to 0.41 and the absolute bias being reduced to 31 % (Fig. 4e). The field-based measurements showed that the N derived from the atmosphere (%Ndfa) was the main contributor to the legumes' total N uptake, ranging from 15 % to 95 %, with a mean of 64 % across all field trials. LPJ-GUESS generally captured the mean response well, with simulated %Ndfa being 60 % and 58 % in the site-specific and global uniform runs, respectively, despite several extreme disagreements at several faba bean sites (Fig. 4f).
A linear relationship between legume yields and the rate of BNF was found across a range of field sites in this study (Fig. S5a). Simulations from LPJ-GUESS mostly captured the close correlation between these variables, with R2 ranging 0.46–0.63 (p<0.001) in both runs, which is not far from the measured value of 0.67 (Fig. S5a). Linear regression parameters (i.e., slope and intercept) in both runs were close to the observations, indicating that the model reproduces the N fixation effect on yield well for individual sites.
A negative exponential relationship was observed between N fertilizer application rate and N fixation across the field trials (Fig. S5b). LPJ-GUESS reasonably reproduced the decreased trend of BNF to N fertilizer increase, with similar fitting functions to observations, although higher N fixation rates were modeled in the highest-fertilized trial (600 kg N ha−1) compared with measurements (Fig. S5b).

Figure 4Comparison of modeled and observed yield (a), grain N mass (b), shoot N mass (c), soil N uptake (d), BNF (e), and %Ndfa (the proportion of plant N derived from the atmosphere) (f) at harvest across all soybean and faba bean sites. Filled red and grey circles depict the “site-specific” and “global uniform” runs, respectively. The dashed line is a fitted linear regression with red for site-specific and grey for global uniform; and denote regressions statistically significant at p=0.001 and 0.01, respectively; AB is absolute bias (Eq. 17), represented in percent (%); the unit of RMSE is the same as the associated variable; AVG in (f) is the averaged value of %Ndfa across all field trials.
3.1.2 Response to irrigation
The ability of the model to simulate the observed response of soybean tissue biomass and N mass to irrigation management was examined using data from an experiment with rain-fed and irrigated treatments in Florida, USA (82.4∘ W, 29.6∘ N; see Table S2). Since the timing and quantity of irrigation were not reported in the literature (DeVries et al., 1989a, b), we assumed that soybean was irrigated automatically when it experienced water stress in the model, with the amount of plant water deficit as supplemental irrigation.
The mean observed grain yields at harvest were 2.0 and 2.9 t ha−1 under rain-fed and irrigated conditions, respectively, whereas the modeled yields were 1.9 and 2.5 t ha−1 for the site-specific parameter run and 1.6 and 2.1 t ha−1 for the global uniform parameter run, suggesting good model performance for rain-fed crops but an underestimation of the effect of irrigation on yields (Fig. 5a). Grain dry matter over the cropping season was simulated to increase by 32 % and 45 % on average in response to irrigation in the site-specific and global uniform runs, respectively. The observations show a similar response but with a higher increase of 75 %. The modeled increase in grain N content caused by irrigation also showed good agreement, with an increase of 35 %–58 % in both runs, in line with the observed response of 42 % (Fig. 5b).
The model generally reproduced observed leaf biomass and N mass better than the total aboveground production under rain-fed and irrigated treatments, with higher accuracy in the site-specific run. Over the growing season there was an obvious underestimation of the total aboveground production of biomass for both runs (Fig. 5a). This may be partially due to the fact that LPJ-GUESS at this point does not model soybean hulls, which account for ∼15 %–20 % of the total aboveground dry matter at harvest in the US soybean rain-fed cropping system (Córdova et al., 2020). The observed increase in shoot and leaf biomass due to water supply was 19 % and 21 %, respectively. In comparison, the site-specific parameterized model resulted in increases of 13 % and 14 %, respectively (15 % and 14 % for the global uniform parameter run, see Fig. 5b). Overall, the observed soybean tissue biomass and N content under rain-fed and irrigated conditions, as well as their response to irrigation management, were captured reasonably well by the model at the US Florida site, despite some deviations from observations in some cases.
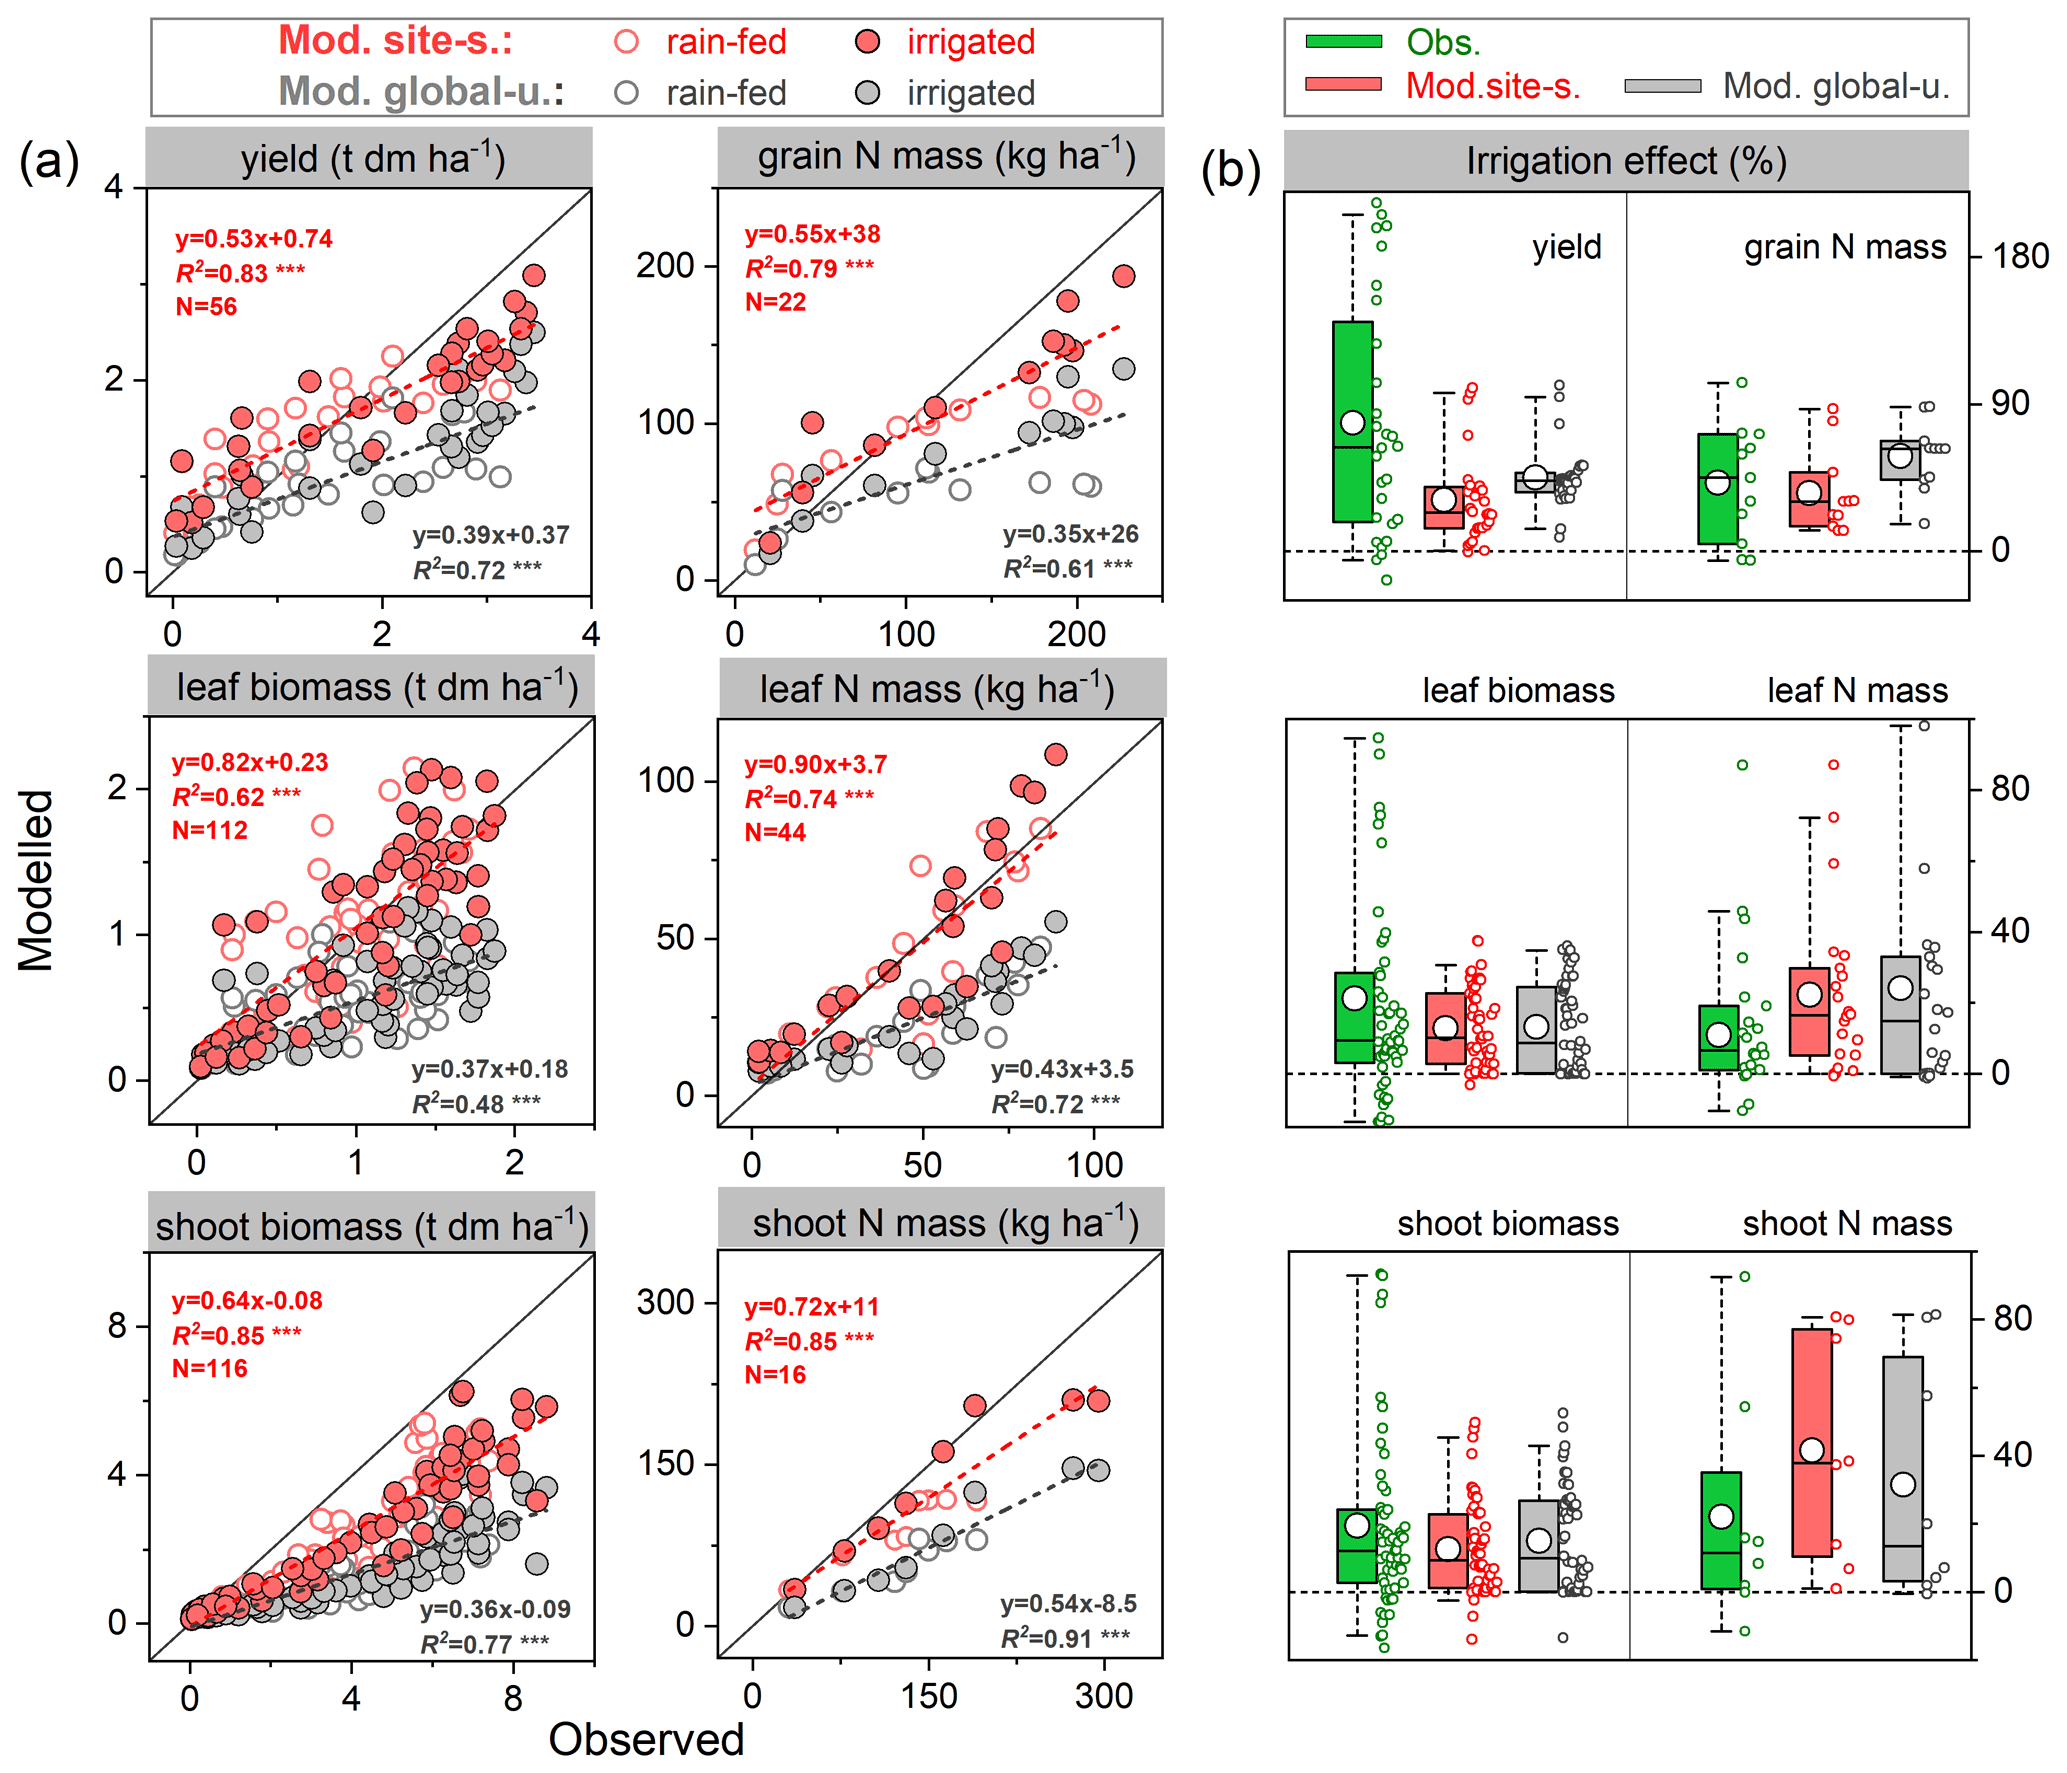
Figure 5Comparison of modeled and observed soybean tissue biomass and N mass (a) and their responses to irrigation management (b) compared with those grown at rain-fed conditions. Red and grey circles depict “site-specific” and “global uniform” run, respectively; the dashed line is fitted linear regression; denotes the regression statistically significant at p=0.001. Box plots in (b) denote the 5th and 95th percentiles with whiskers, median and interquartile range with box lines, and mean with a white dot (all data distributed next to the box). The seasonal data at each phenological stage for tissue biomass are available from 1978–1979 and 1984–1985 with rain-fed and irrigated treatments; those for N mass are available for 1979 and 1984, while the seasonal shoot N mass is only available for 1984.
3.1.3 Response to nodulating soybean
In Zapata et al. (1987), two field trials with non-nodulating and nodulating soybean were conducted in Seibersdorf, Austria (16.5∘ E, 48.0∘ N; see Table S2), resulting in different plant C and N production at various growth stages. As described in Sect. 2.3, the nodulation process of legumes has not yet been implemented in LPJ-GUESS; we thus switched off (on) the BNF function in the model to simply represent the non-nodulating (nodulating) soybean experiment.
During the growing season, yield and grain N mass in the field trials increased rapidly after the vegetative stage, peaking around harvest. Simulations from LPJ-GUESS mostly captured those seasonal dynamics and the response to nodulating soybean (Fig. 6a–b): the modeled increase in yield and grain N mass due to nodulation was 34 % and 51 % in the site-specific run (34 % and 45 % in the global uniform run), respectively, in line with the observed response of 20 % and 41 % at harvest (Table 2), which suggests appropriate sensitivity of yield and N content in grain to N addition from N fixation. Similarly, the model generally reproduced the observed seasonal pattern of shoot N mass well, but with some underestimations in the nodulation trial (Fig. 6c).
Accumulated soil N uptake was captured reasonably well over the entire growing season, with higher accuracy at harvest in the global uniform simulation (Fig. 6d). Measured mineral N uptake from soils declined on average by 25 % in response to nodulation. In comparison, the simulated reduction in uptake was 50 % and 46 % for the site-specific and global uniform runs (Table 2). The BNF rates were low at the early growth stages when nodules were still establishing and increased rapidly between floral initiation and the early seed-filling, after which nodule senescence occurred and the increase in N fixation rate declined until physiological maturity (Fig. 6e). Simulations from LPJ-GUESS reproduced the seasonal pattern of N fixation with some overestimations in the accumulated BNF at the end of the growth period; the site-specific and global uniform runs simulated 113 and 140 kg N ha−1, respectively, compared to the measured value of 103 kg N ha−1 (Table 2).
Table 2Comparison of modeled and observed yield (t ha−1), grain N mass (kg N ha−1), shoot N mass (kg N ha−1), soil N uptake (kg N ha−1), and N fixation rate (kg N ha−1) from a soybean nodulation and non-nodulation experiment at harvest. The observed data were compiled using Tables 2–4 in Zapata et al. (1987).
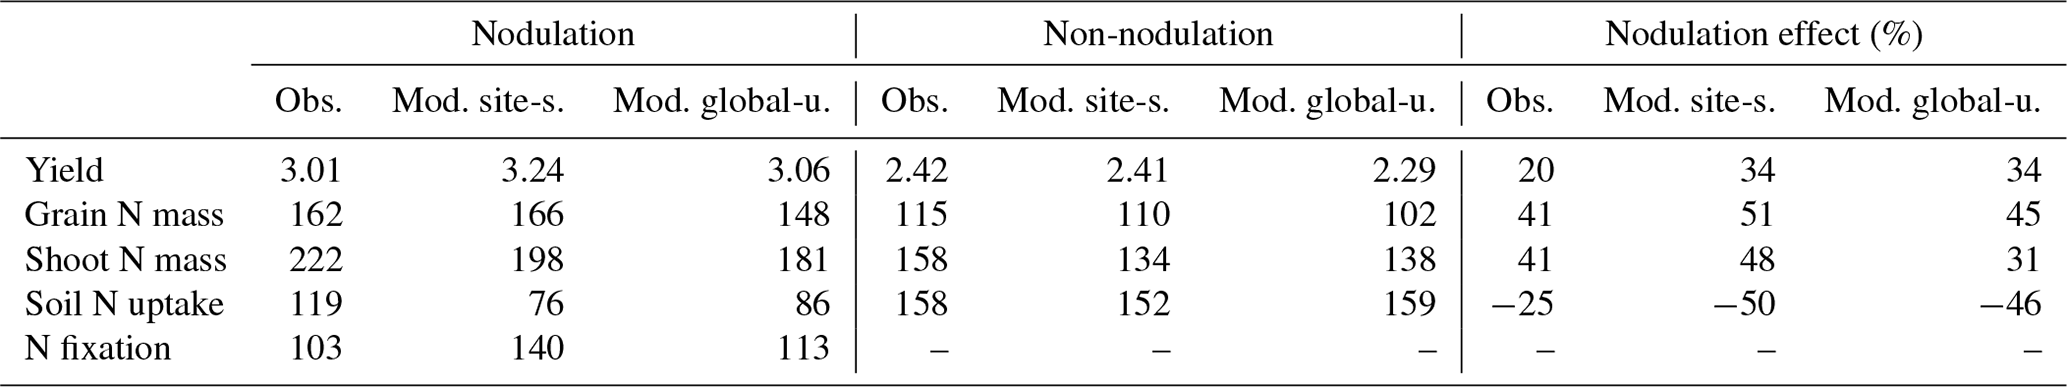
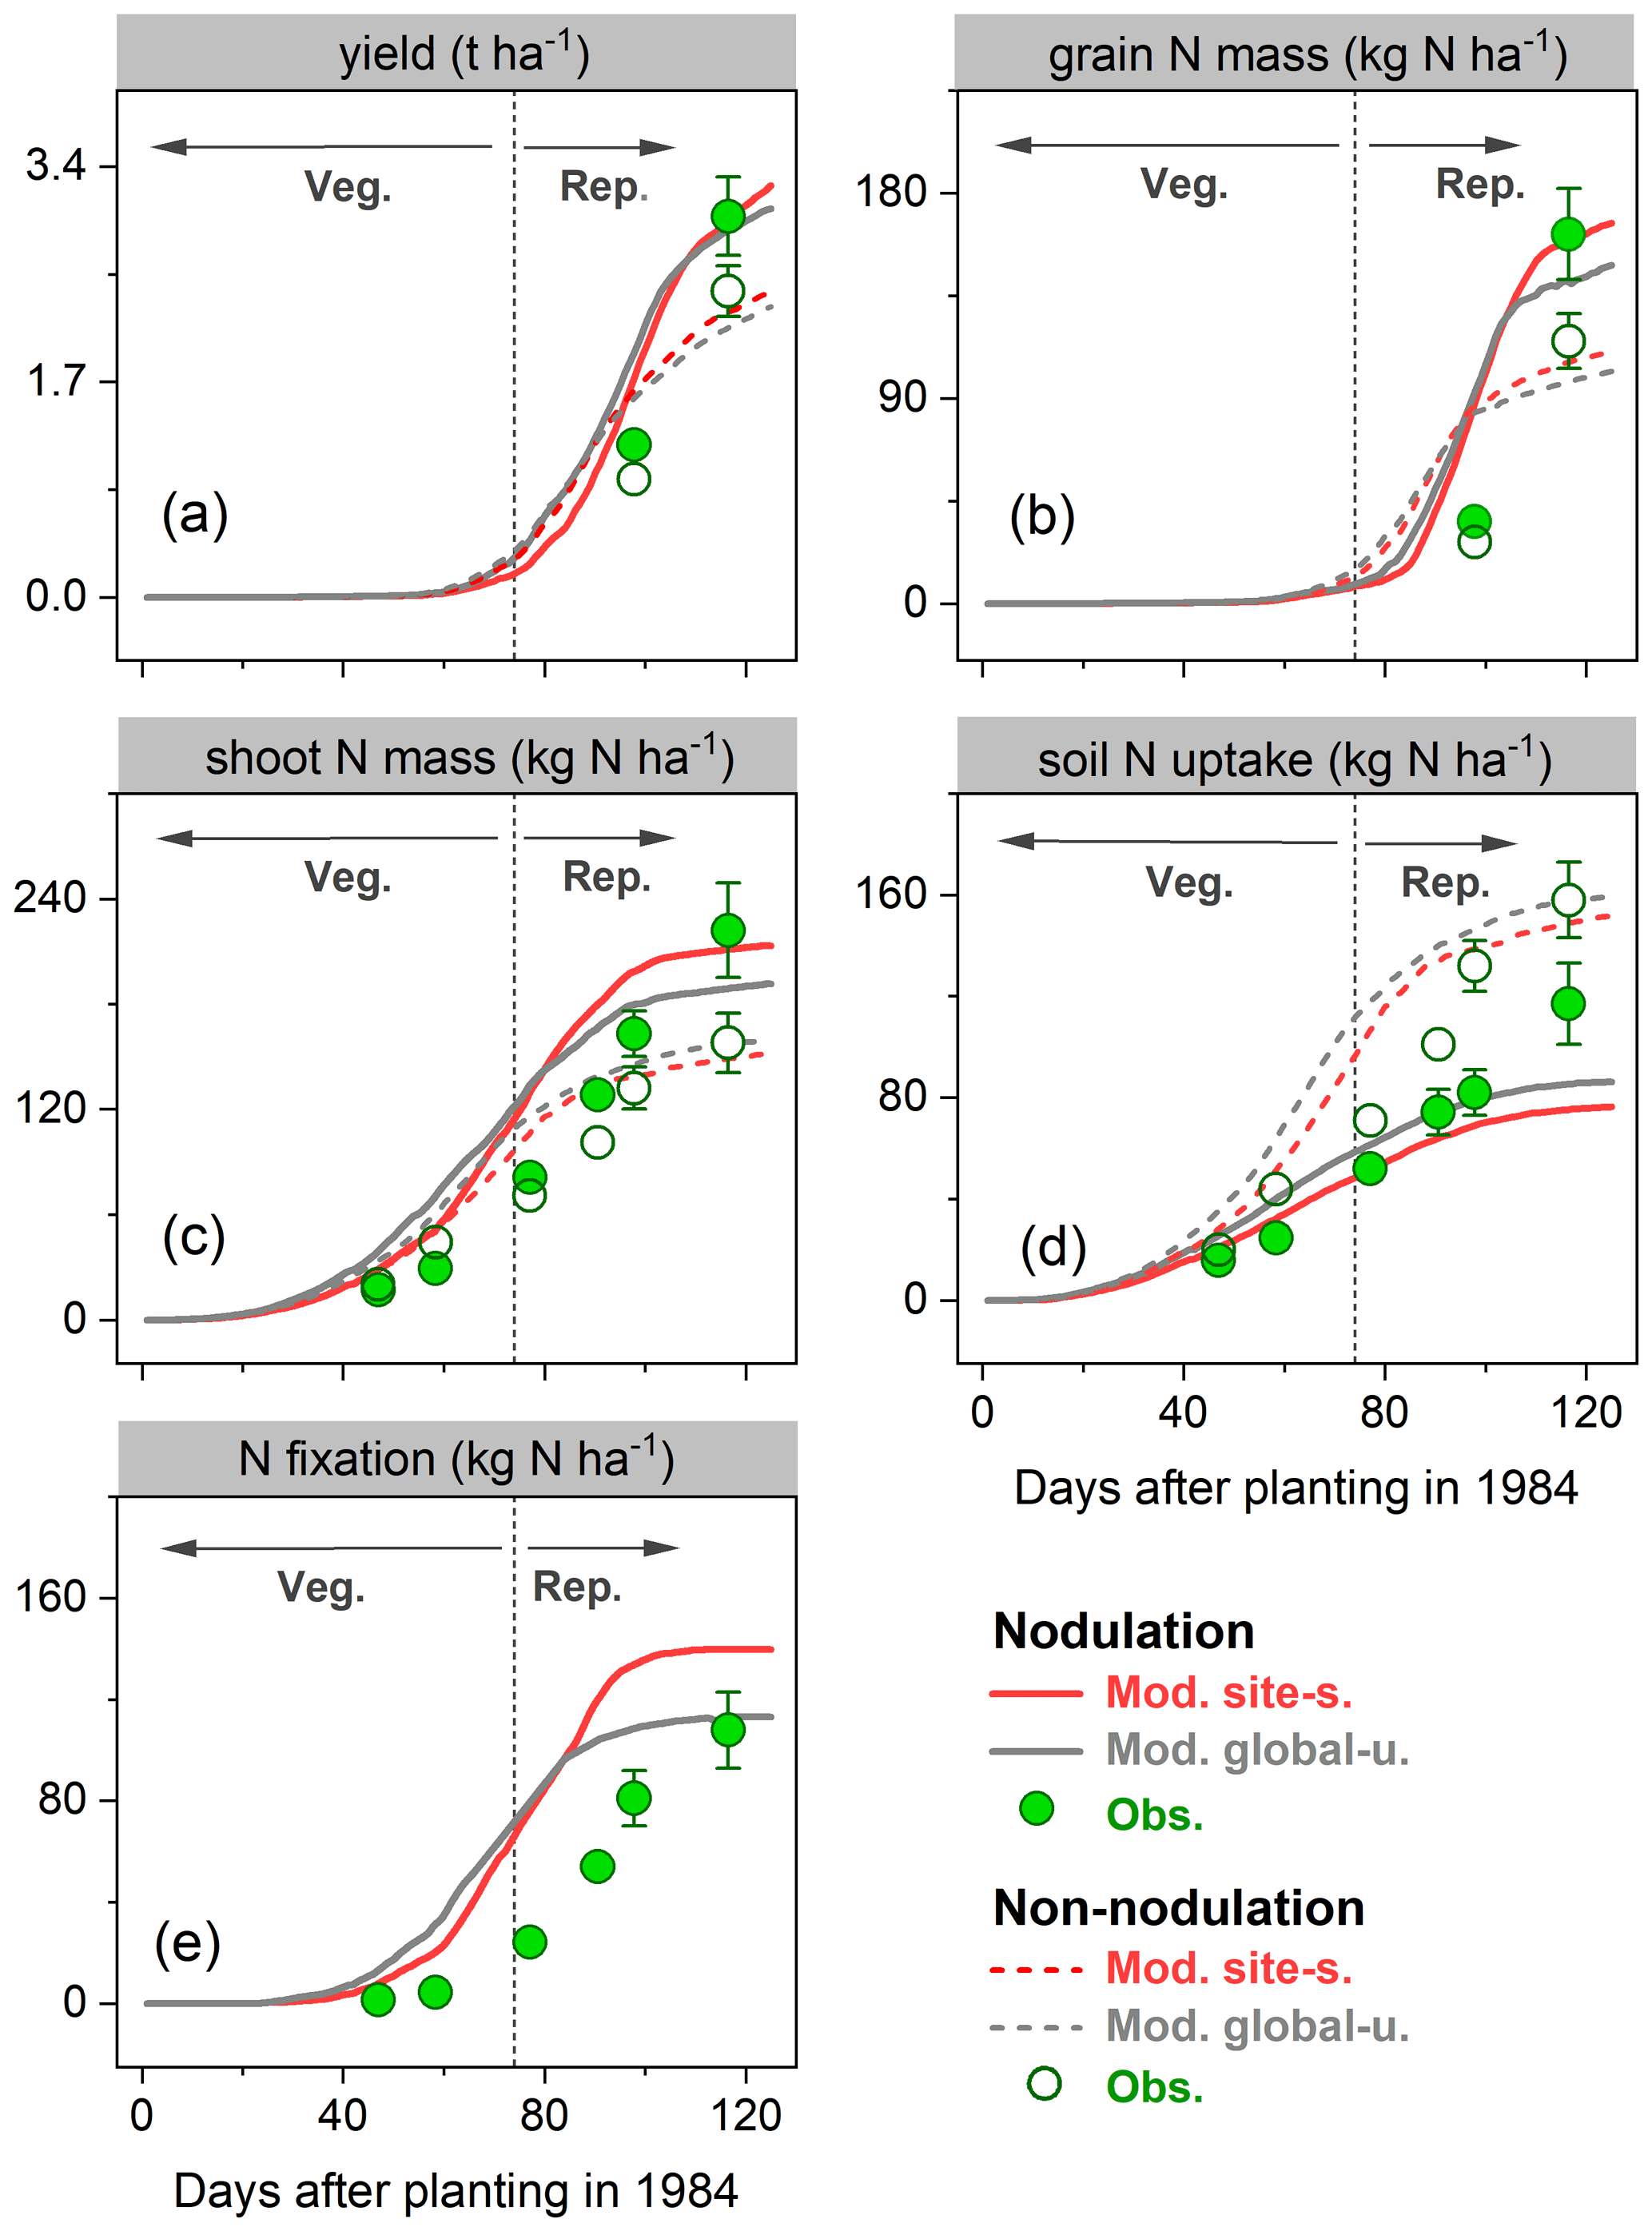
Figure 6Observed (circles) and modeled (lines) yield (a), grain N mass (b), shoot N mass (c), soil N uptake (d), and BNF (e) for a field site in Austria (Zapata et al., 1987) for the cropping season 1984 with nodulating and non-nodulating soybean. The observed values of soil N uptake and BNF across all growth stages were calculated based on Fig. 1 given in Zapata et al. (1987), and the vertical bars represent the standard error of a four-replicate mean in the original literature. Veg. and Rep. indicate vegetative and reproductive growth phase, respectively.
3.1.4 Response to N fertilizer in faba bean
In the N fertilizer experiment from Mínguez et al. (1993), four field trials were compared with N applications between 0 and 300 kg N ha−1 at three crop growth stages and two faba bean varieties grown in a Mediterranean climate (Spain, 4.8∘ W, 37.9∘ N; see Table S2). Over the entire growing season, leaf biomass and N content in the field trials increased until around May, after which leaf senescence started and biomass and N content declined (Fig. 7a–b). The model broadly reproduced these seasonal patterns and the response to different N application rates. The largest difference between modeled and measured leaf biomass was found at the end of the growing season as a result of the simulated leaf senescence rate being much lower than derived from measurements (Fig. 7a). In addition, the simulations showed modeled leaf N mass to decline rapidly during the late reproductive phase. This can be attributed to the transfer of N from vegetative parts to grain because of the high N demand in seeds during the grain-filling period.
As seen in Fig. 7c, modeled soil N uptake was stimulated by soil mineral N availability, with an increase of 120 %–160 % compared to the unfertilized treatment. In contrast, fixing N from the atmosphere was constrained in the presence of elevated levels of soil mineral N, with a reduction of 15 %–20 %. The total N uptake for the cropping season 1987–1988 was observed to only increase by 3 % in response to N application as a consequence of the inoculation implemented in the unfertilized treatment (Mínguez et al., 1993). By contrast, LPJ-GUESS produced relatively large increases of 14 %–16 % in both runs, resulting in the observed increase in plant biomass and N mass accumulation caused by N addition being largely overestimated in the model (Fig. 7c).
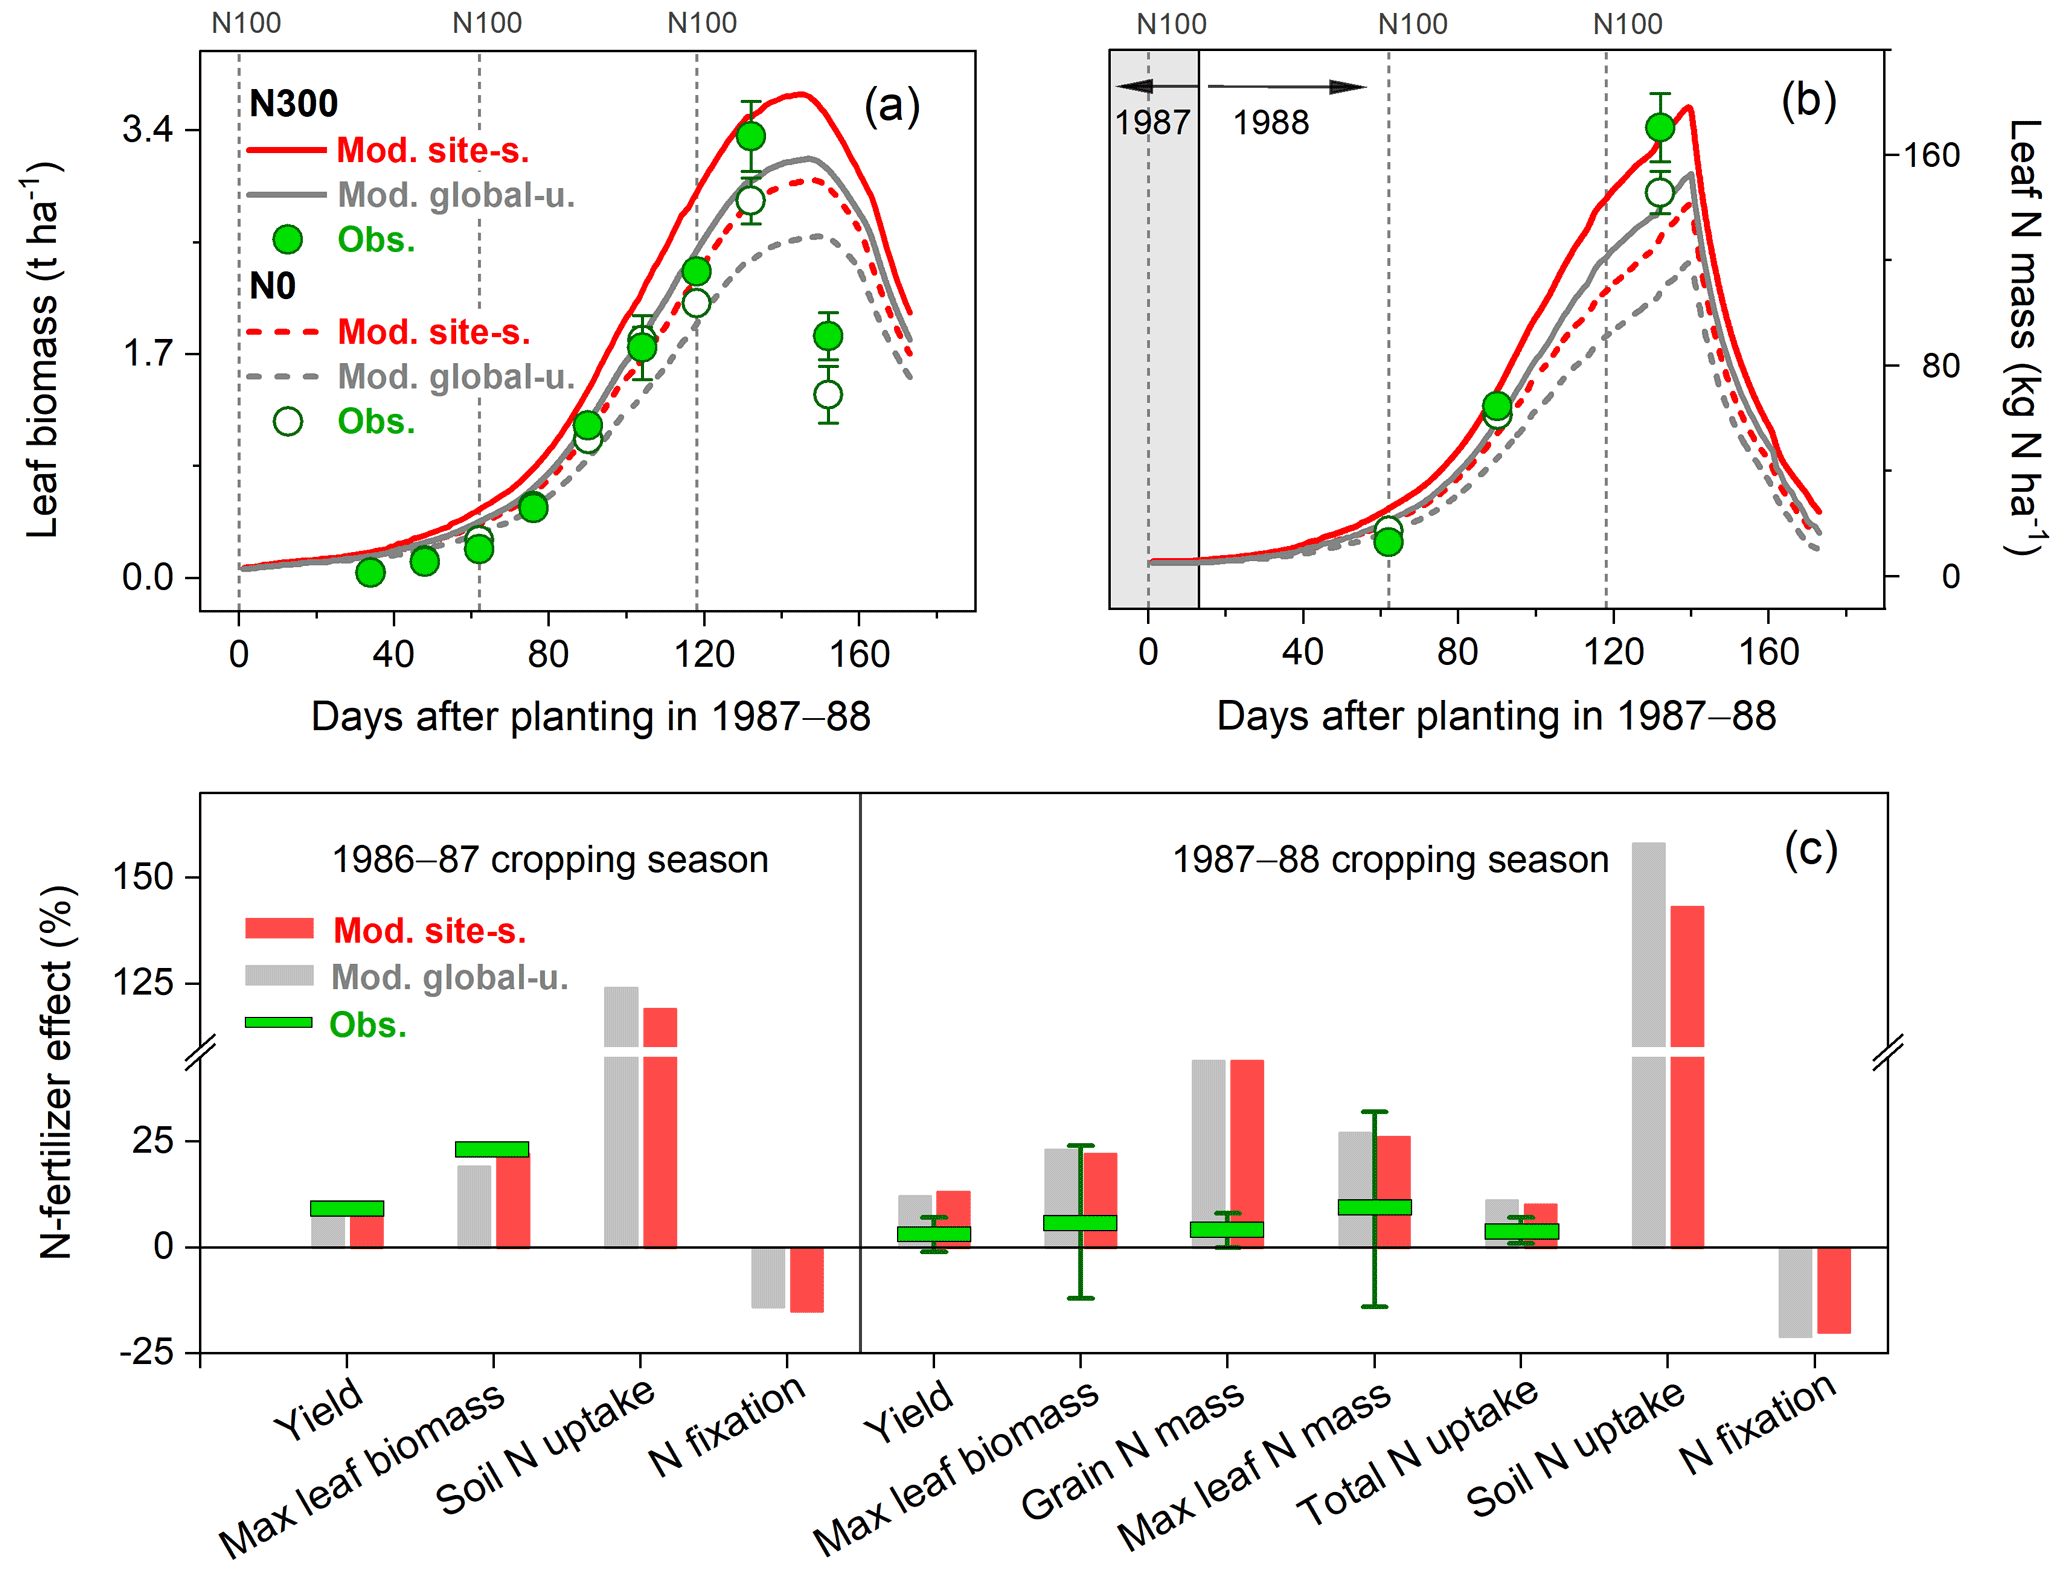
Figure 7Observed and modeled seasonal pattern of leaf biomass (a) and leaf N (b) of faba bean in Spain for the cropping season 1987–1988, with two different levels of N fertilizer input (0 and 300 kg N ha−1 represented as N0 and N300, respectively), and the response of faba bean yields and N uptake to fertilized treatment at harvest (c) compared with those grown in unfertilized conditions in the 1986–1987 and 1987–1988 cropping seasons. The observed values were derived from the average of two faba bean varieties described in Mínguez et al. (1993), and their measured ranges are shown by the vertical bars. The vertical dashed lines in (a)–(b) represent the timing and amount of fertilizer applied in the N300 treatment.
3.2 Model evaluation at global scale
3.2.1 Attained yields
Using the global uniform parameters described in Sect. 2.4.1, combined with the time-dependent gridded N fertilizer dataset introduced in Sect. 2.4.2, we simulated soybean and all pulses (applying the faba bean parameterization, see Sect. 2.4.2) at a global scale. We computed data for the period 1996–2005, since crop-specific fractional cover from the MIRCA dataset was available for the year 2000 (Portmann et al., 2010).
Modeled yields in the top 10 soybean-producing countries showed good agreement, with a higher R2 of 0.52 (p<0.001) and lower RMSE value of 0.8 t ha−1 yr−1 when low-productivity countries (defined as all countries not belonging to the top 10 producer countries) were excluded. With all producer countries included, R2 of 0.17 (p<0.001) and RMSE of 1.4 t ha−1 yr−1 were found (Fig. 8a). LPJ-GUESS generally tended to overestimate the reported yield for most countries where soybean production is low (e.g., most African countries, see Fig. 9a), with a mean relative bias in such countries of 81 % (Fig. 8a). Modeled low yields were found in some arid and semi-arid countries (e.g., Egypt, Iran, and Turkey), with the underestimation spanning from 10 %–70 % (Fig. 9a). Overestimated yields were also found when comparing simulated yields using the faba bean parameterization against FAO-reported values for pulses in general, with an overestimation also visible for some of the top producing countries (Fig. 8b). Likely, the higher yields simulated by LPJ-GUESS arise from the fairly high N fixation capacity simulated with the faba bean parameterization (see Sect. 3.2.2) and the wide distribution of pulses worldwide, which grow under a broad range of climate and soil conditions.
A good fit of the interannual variability of modeled and reported yields is a further indicator of model performance. Despite the deviation between the model and observations for individual years, simulated variation in soybean yield over the period 1981–2016 matched reported yields well among the top 10 producer countries – especially in Argentina, India, and China – with a high Pearson correlation coefficient (r) around 0.60 (p<0.001) and similar standard deviations (Fig. 9). The degree of yield variability between years was larger than seen in the FAO records, especially in the US, Canada, and Italy (Fig. 9), indicating high sensitivity of modeled soybean yield to changing environmental factors on spatial scales, such as weather, N fertilizer application rates, and climate-related N fixation.
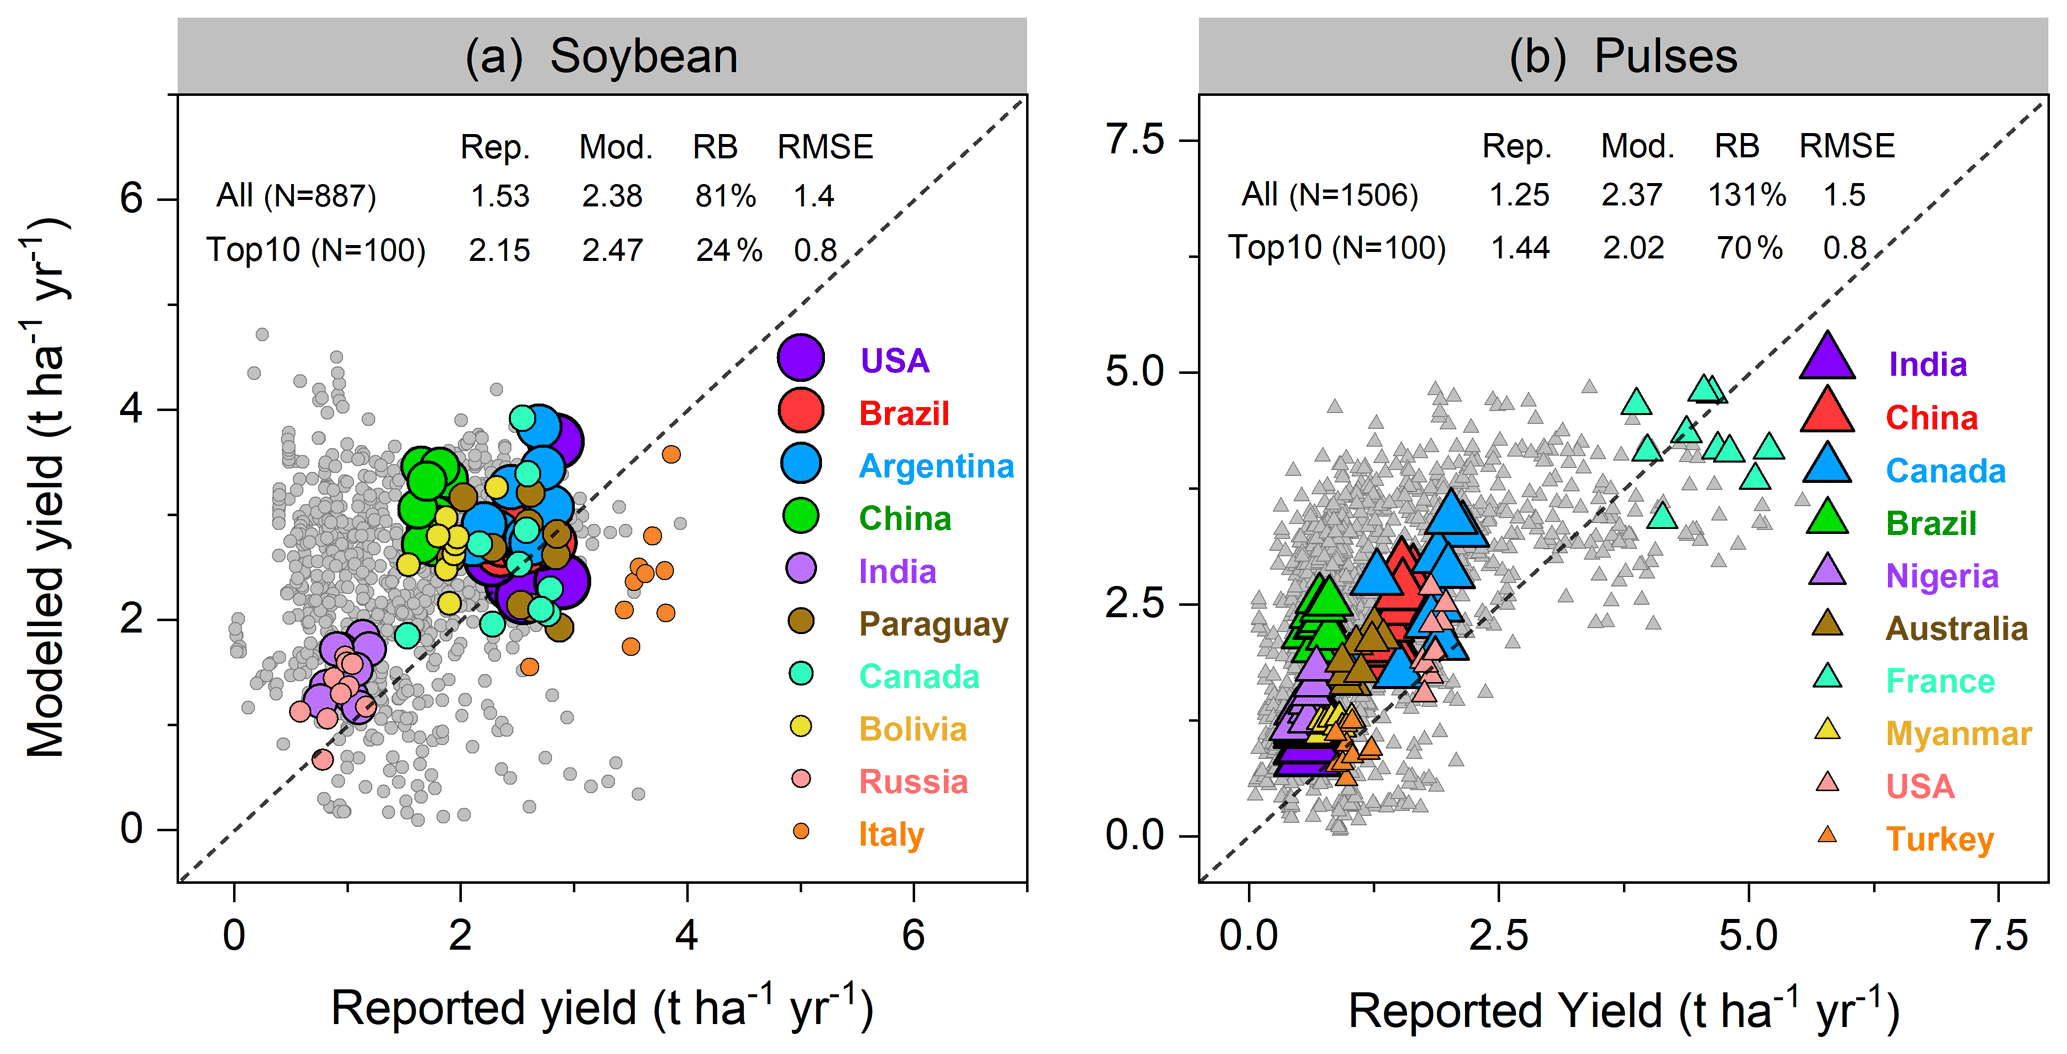
Figure 8Per-country and per-year comparison of modeled yields of soybean (a) and pulses (b) against reported FAO statistics from 1996–2005. Each filled circle in (a) represents 1 year and one country; thus, a country can have up to 10 circles over 1996–2005. In total, 887 and 1506 country–year yield data points were used for comparison in soybean and pulses, respectively. The top 10 producer countries (shown in color) were chosen based on their total production over the same period, and marker size from large to small indicates their total relative production in descending order. Rep. and Mod. respectively denote reported and modeled yield (t ha−1 yr−1) averaged from 1996–2005. RB is relative bias (Eq. 16), represented in percent (%). The unit of RMSE is the same as yield (t ha−1 yr−1).
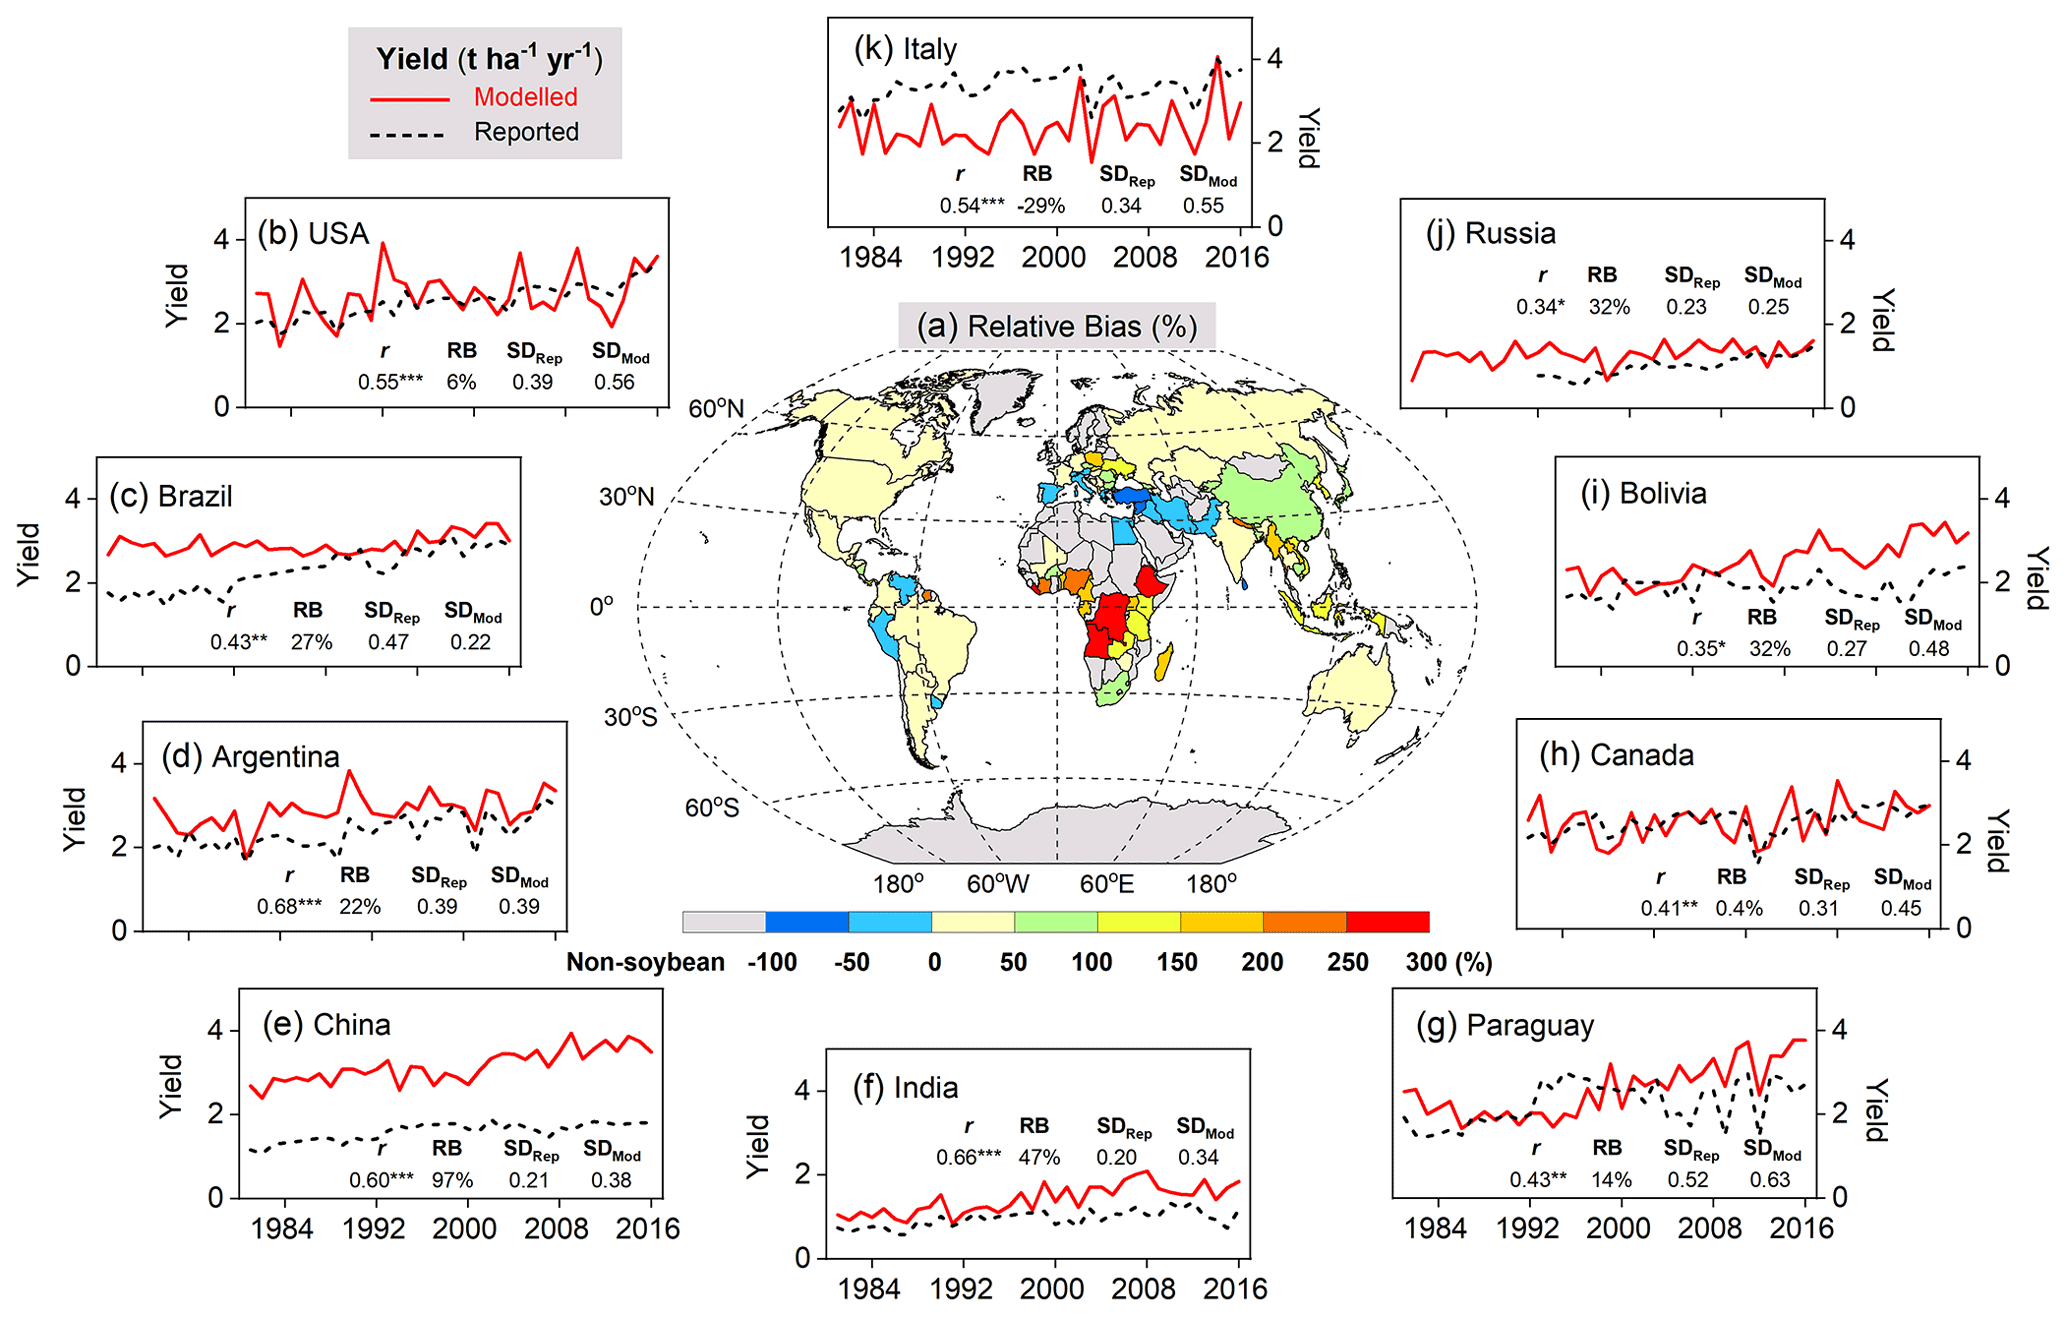
Figure 9Comparison of simulated and FAO-reported yields on the country level averaged over 1996–2005 (a), as well as time series of modeled soybean yield (red solid line) and reported FAO statistics (black dashed line) in the top 10 producer countries over the period 1981–2016. The top 10 producer countries (b–k, in descending order) were chosen based on their total production from 1996–2005. r is the Pearson correlation coefficient (Eq. 19), where , , and * denote the correlation as statistically significant at the p=0.001, 0.01, and 0.05 level, respectively. RB is relative bias (Eq. 16), represented in percent (%). SDRep and SDMod denote respectively reported and modeled yield standard deviations (t ha−1 yr−1) from 1981–2016.
3.2.2 N fixation and %Ndfa
The modeled spatial pattern of soybean N fixation showed large spatial variation (Fig. 10a). Modeled BNF rates as high as 250 kg N ha−1 yr−1 were found in western South America and most of Africa, where neither water nor temperature was a critical limitation for N fixation. Moreover, the relatively low fertilizer application in Africa (0–20 kg N ha−1 yr−1, Fig. S4b) leaves a nitrogen deficit that causes enhanced soybean N fixation. In contrast, in arid and semi-arid regions, soil water constrains BNF, while temperature limitation is seen in high latitudes and alpine areas (e.g., Andes in Peru). BNF rates in most regions (South Asia, West Asia, sub-Saharan Africa, and northwestern China) were as low as 50 kg N ha−1 yr−1, particularly in Pakistan and northern India, where simulated BNF is severely constrained by the extreme high temperature over the cropping season. The eastern United States, Europe, southern China, and central-western Brazil showed intermediate fixation rates, which were greater than 150 kg N ha−1 yr−1. Overall, the spatial variation of the modeled legume BNF rate reflects to a large degree the spatial climate patterns, in addition to N fertilizer application. The low modeled %Ndfa of 45±3 % in East Asia may reflect high N uptake from soils in response to substantial fertilizer investment in China (80–180 kg N ha−1 yr−1, Fig. S4b) over the past 40 years. In contrast, the modeled %Ndfa in Africa – with lower N application rates – was as high as 70±3 %, although still lower than the reported mean value of 77 % (Table 3). The spatial response of N fixation rate to climate constraining factors (i.e., soil temperature and water) is shown for pulses in Fig. S6.
At a regional scale, the modeled outputs compare well with N fixation rates from the literature (Fig. 10b–f, Table 3). For example, in South America and North America, both major soybean-producing regions, simulated BNF rates were 156±14 and 127±44 kg N ha−1 yr−1 over the period 1981–2016, respectively, compared with literature-derived values of 136 and 144 kg N ha−1 yr−1 (Peoples et al., 2009). Globally, the modeled soybean N fixation rate of 132±21 kg N ha−1 yr−1 was reasonably consistent with the meta-analysis result of 111–125 kg N ha−1 yr−1 in Salvagiotti et al. (2008) and the FAO-based estimate of 176 kg N ha−1 yr−1 from Herridge et al. (2008). The contribution of N fixation to total N uptake in soybean was somewhat underestimated in several regions. A similar trend to underestimate reported %Ndfa was also found for pulses (Table 3).
Having large soybean-planting areas and high yields, South America and North America contributed 80 % of simulated global soybean N fixation, followed by East Asia, South Asia, and Europe (Table 3). Globally, simulated annual N fixed over the period 1981–2016 was 11.6±2.2 Tg in soybean, which showed good agreement with the estimate of 16.4 Tg N reported by Herridge et al. (2008) and the extrapolated result of 10.4 Tg N estimated by Gelfand and Robertson (2015) based on US field trials. However, we modeled pulses to fix 5.6±1.0 Tg N annually, which is almost 2 times higher than the 2.95 Tg N estimated by Herridge et al. (2008). The difference in the case of pulses is most likely due to the low N fixation rate used by Herridge et al. (2008) ranging from 23–107 kg N ha−1 yr−1, which is lower than the mean value of 119±15 kg N ha−1 yr−1 modeled by LPJ-GUESS (Table 3).
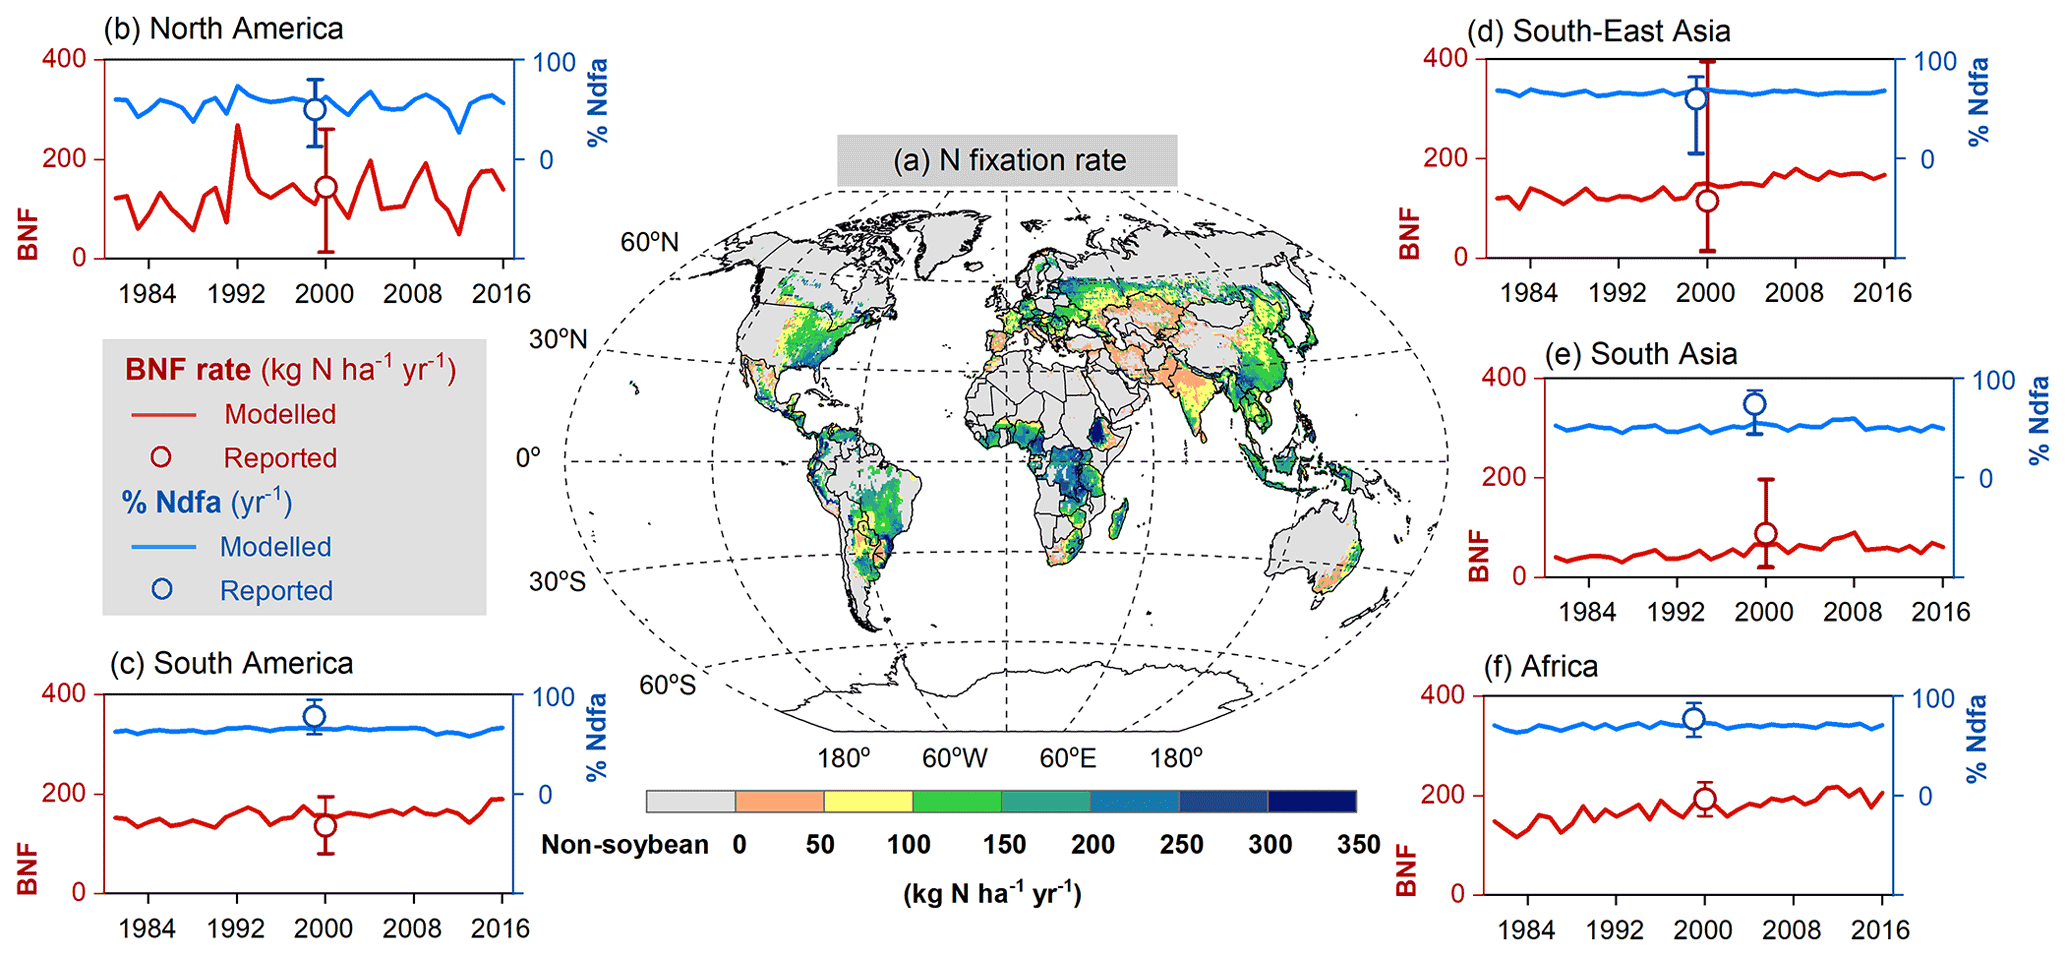
Figure 10Map of soybean N fixation modeled by LPJ-GUESS averaged over 1996–2005 (a) and the comparison of simulated BNF rate (red line) and %Ndfa (blue line) with literature-reviewed data (open circle; Peoples et al., 2009) on a regional level (b–f). Reported data shown in open circles do not represent specific years but the potential over time in Peoples et al. (2009); the vertical bars denote the range of estimations based on the original literature given in Table 1 in Peoples et al. (2009).
Table 3Modeled continent-level biological N fixation rate, the proportion of plant N derived from the atmosphere ( %Ndfa), and total N fixation in soybean and pulses for the time period 1981–2016 compared to estimates from the literature, with the reported range in brackets. The modeled results are represented as mean ±1 standard deviation.
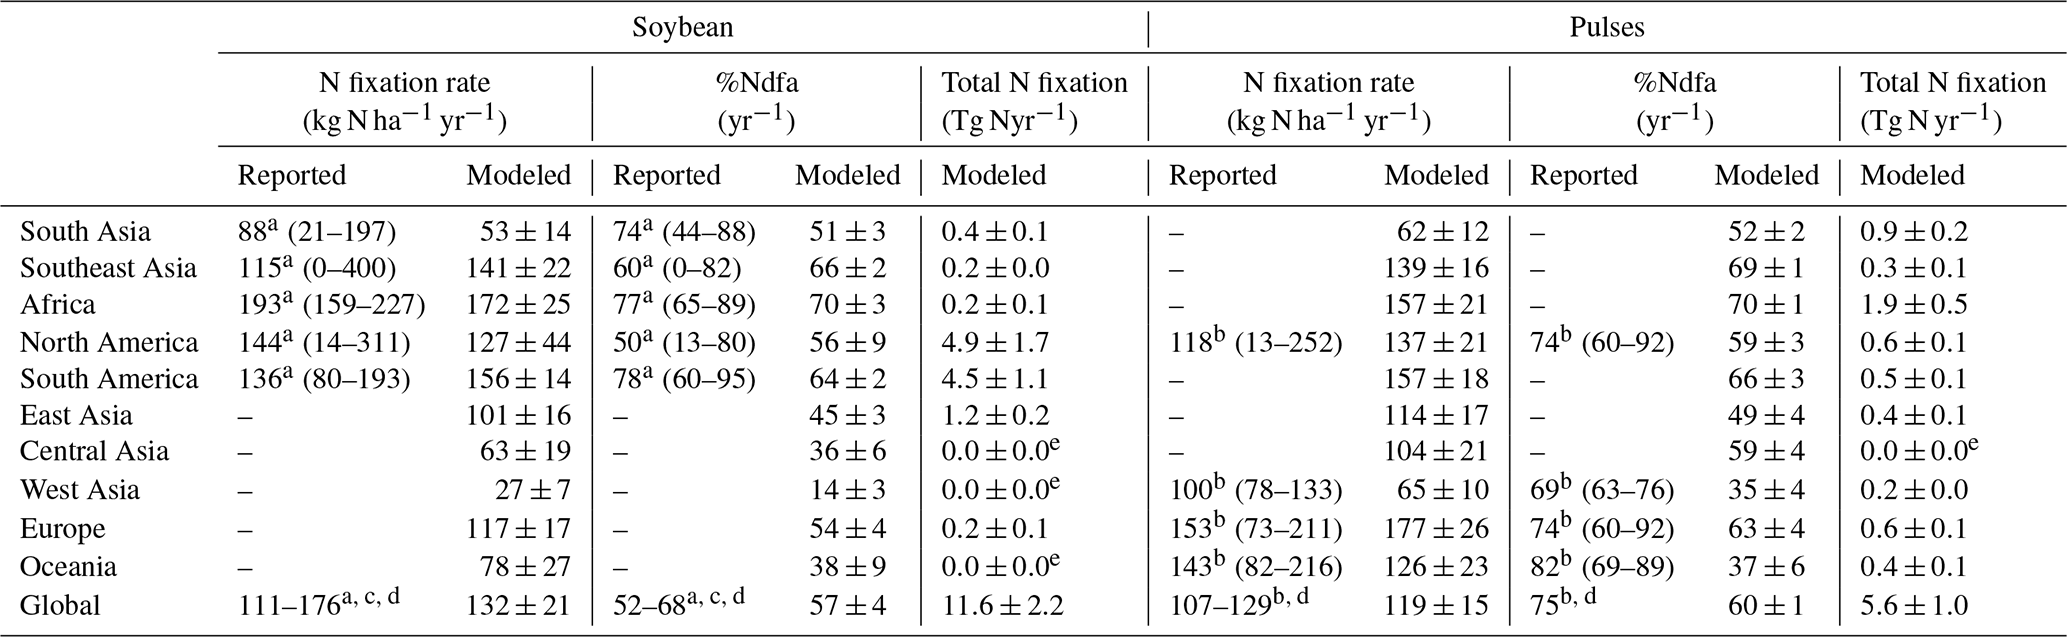
a Soybean data in Peoples et al. (2009). b Faba bean data in Peoples et al. (2009). c Salvagiotti et al. (2008). d Herridge et al. (2008). e The values do not represent zero grain-legume-planting area in that region.
4.1 Model performance at site scale
The overall model agreement with measured legume yield and grain N mass was good across a range of field sites (Fig. 4). Values at harvest were on average about 20–30 % lower than values reported in the measurements (Fig. 4a–b). A similar small underestimation was found in the shoot N mass (Fig. 4c), indicating that the productivity is generally somewhat too low in the model. One factor contributing to the underestimation is that LPJ-GUESS applies a conversion factor of 2.0 from plant C mass to dry matter (Smith et al., 2014), which is ∼10 % lower than a published measurement of 2.24 reported in Osaki (1993). In addition, we found that the model underestimated aboveground biomass while simultaneously overestimating belowground productivity at the three sites where measured root biomass was available. This could be addressed by adjusting the root:shoot allocation (i.e., modifying the daily assimilate partitioning function in grain legumes; Eq. 5), but this is currently prevented by the lack of sufficient observed root biomass information.
Modeled soil N uptake was sensitive to soil mineral N concentration and hence driven by fertilizer application rates (Figs. 7c, S5c). Generally, LPJ-GUESS tended to overestimate soil N uptake in regions where legumes were not fertilized or only lightly fertilized (Fig. S5c). This might be partially due to the selected legume cultivars at the experimental plots, which have been reported to have low mineral N uptake potential (Gan et al., 2002, 2003; Santachiara et al., 2017, 2018). Moreover, the saturation effect of mineral N concentration on N uptake implemented in the model might result in the discontinuation of N uptake when soil-available N is abundant (Zaehle and Friend, 2010; Wårlind et al., 2014). Under high fertilization rates (up to 260–600 kg N ha−1, Fig. S5c), a strong underestimation in soil N uptake was expected because of the modeled saturation response to high soil mineral N, resulting in little change in the level of soil N uptake no matter how much N fertilizer was applied.
Adding mineral N to the soil in LPJ-GUESS can increase soil N uptake, reducing the plant's N deficit and therefore also reducing the upper limit of the daily N fixation rate (Fig. 2). Although the modeled negative relationship between fertilizer application rates and N fixation showed generally good agreement with the observed response across a range of field sites, the simulated BNF rates in the highly fertilized trials (i.e., 260–600 kg N ha−1, Fig. S5b) were about 50 %–80 % higher than the measured values (Figs. 4e, S5b). This might be partially explained by the underestimation in soil N uptake under higher N concentration, resulting in plant N demand remaining very high and substantial N still being fixed. The large discrepancies between modeled and observed N uptake in the highly fertilized treatments suggest that the N uptake representation in LPJ-GUESS should be further improved. A step forward could be to incorporate the inhibitory effects of soil mineral N content on N fixation into the model (Chen et al., 2016; Wu et al., 2020), since experimental evidence indicates that high soil mineral N not only affects plant N uptake in roots, but also depresses legume nodule initiation, nodule size, and specific nodule activity, therefore reducing the amount of N fixation from the atmosphere (Herridge et al., 1984; Purcell and Sinclair, 1990; Thornley and Cannell, 2000).
The percentage of plant N derived from the atmosphere (i.e., %Ndfa) is a key parameter required for quantifying N fixation in the field and varies widely, caused by differences in climate, soil type, and degree of N fertilization (Herridge et al., 2008). LPJ-GUESS captured the range and mean value of %Ndfa well across different field trials, with some disagreements, especially for faba bean (Fig. 4f). An underestimated %Ndfa is likely caused by the combined effects of underestimated N fixation (Fig. 4e) and overestimated soil N uptake (Fig. 4d). Nevertheless, we found modeled %Ndfa to decline with increasing N fertilizer application, which is also the observed response in the field trials. A negative correlation between %Ndfa and fertilizer application rates was also reported by Salvagiotti et al. (2008). These results all suggest that LPJ-GUESS is able to effectively capture the observed overall patterns of soil mineral N uptake and N fixation in grain legumes and their responses.
Since the SLA and C:N ratio of plant organs play a vital role in determining N uptake when modeling vegetation C–N dynamics (Olin et al., 2015), it is to be expected that applying measured values for site-scale modeling resulted in much better agreement when comparing simulation results to measurements (Figs. 4–7). Remaining discrepancies between modeled and observed N-cycle variables may reflect missing processes in the model, such as inoculation effectiveness, phosphorus limitation, and soil acidity, especially in terms of inoculant application. Field experiments have shown that proper inoculation of rhizobia promotes nodulation and results in an efficient increase in N fixation, although there are large variations between strains of rhizobia (Mínguez et al., 1993; Sanginga et al., 1997; Tewari et al., 2004; Denton et al., 2017). Using a fixed parameter (Nmaxfixpot, Eq. 9) to represent all inoculation situations such as in a global uniform calibration cannot reflect this variability. In addition, due to the difficulties in measuring both nodules and roots in the field directly, in many studies the observed BNF rates were determined from plant aboveground biomass. Excluding the root contribution to the whole plant BNF rates most likely results in an underestimation of N fixation (Córdova et al., 2019, 2020): N associated with nodules and roots in soybean and faba bean may account for 20 %–40 % of the total N accumulation at the mid-flowering phase (Unkovich and Pate, 2000; Khan et al., 2003).
Compared to non-BNF (i.e., non-nodulation treatment, see Sect. 3.1.3), BNF in LPJ-GUESS greatly improves simulated soybean yield and aboveground N mass, with an overall increase in both variables of 30 %–50 % (Table 2). Córdova et al. (2019) found a yield increase of 150 % in response to nodulation in an unfertilized treatment, but that increase was reduced to 55 % – similar to our modeled yield increase – when a high N input was applied (i.e., 135 kg N ha−1). N fixation can help grain legumes to dramatically enhance their total N accumulation and to achieve higher N concentration in seeds. However, these benefits are accompanied by an increase in respiration cost amounting to 4 %–16 % of fixed total photosynthetic carbon (Kaschuk et al., 2009, 2010). Such a respiratory photosynthate consumption would reduce productivity if the photosynthesis rate was not increased to compensate for the cost. In LPJ-GUESS, as described in Sect. 2.3, we assumed that up to 50 % of daily NPP can be consumed to fix N. This approach has the advantage that legumes are able to maximize photosynthetic gain due to reduced N limitation in carboxylation capacity (Vmax), but it entails the risk of lower productivity if too much NPP is invested in fixation. Nevertheless, in most cases our modeled NPP cost over the soybean growing season ranged from 1 %–40 % at the site scale (Fig. S7) and 5 %–25 % on a large region (Fig. S8). Such NPP consumption was not only lower than our assumed upper limit of 50 %, but also appropriately consistent with the reported range of 14 %–32 % described by Kaschuk et al. (2009), demonstrating that the C cost scheme implemented for N fixation in our model is reasonable. Taken together, the modeled C profits due to N fixation can be attributed to the positive feedback between BNF and photosynthesis in LPJ-GUESS: C-cost-based N fixation results in a higher rate of photosynthesis because of the enhanced leaf N concentration; in turn, the increased rate compensates for the C cost, allocates more assimilate to roots, and thus enhances N fixation.
4.2 Global yields, N fixation, and %Ndfa
Agreement between FAO-reported and simulated yields at the country level was reasonable for the major soybean-producing countries. However, in some arid and semi-arid countries, the modeled yields were up to 70 % lower than FAO-reported values, probably because of the simulated low N fixation rate caused by severe water constraints (Fig. S5). By contrast, LPJ-GUESS produced an overestimation of 100 %–300 % in yield production among some African countries, with BNF rates of 300–350 kg N ha−1 yr−1 being modeled in these regions (Fig. 10a). More recent studies that report data from African farms have indicated that the soybean N fixation rate can be as low as 0–50 kg N ha−1 yr−1 in most farmers' fields, largely because of the inconsistent effectiveness of inoculation in the acid soils (Ulzen et al., 2016; Muleta et al., 2017; Vanlauwe et al., 2019). The BNF implementation and soil representation in LPJ-GUESS do not account for inoculation effectiveness in response to soil pH.
In our simulations, the annual amount of N fixed by global grain legumes (i.e., soybean and all pulses) of 17.2±2.9 Tg averaged over the period 1981–2016 agreed well with the estimate of 19.4 Tg provided by Herridge et al. (2008), who used crop production statistics from FAOSTAT and legume-specific %Ndfa from farmers' fields for estimating global N fixation. In an earlier study, a total of 10 Tg N (range of 8–12 Tg N) was estimated from legume crop BNF annually (Smil, 1999), which is far lower than our findings. The discrepancy between the estimates in Smil (1999) and Herridge et al. (2008) likely reflects the lower values of %Ndfa for soybean and pulses used for calculations in Smil (1999). Also, Smil (1999) excluded belowground fixed N associated with roots and nodules, which contributes to the low estimate. Our modeled N fixation from grain legumes amounts to ∼12 % of the annual mean of ca. 140 Tg N that was estimated to be fixed in all global terrestrial ecosystems (Cleveland et al., 1999, 2013; Galloway et al., 2004; Wang and Houlton, 2009; Vitousek et al., 2013; Meyerholt et al., 2016; Xu-Ri and Prentice, 2017; Yu and Zhuang, 2020; Davies-Barnard and Friedlingstein, 2020), indicating the importance of BNF input in agricultural systems for the global terrestrial N cycle, although a large proportion of the fixed N is removed in grains from the ecosystems each year.
Currently, three environmental factors, soil temperature, moisture, and soil mineral N concentration, affect modeled N fixation. As discussed in Sect. 4.1, increased soil N availability would depress N fixation as plant total N can be met more “cheaply” via soil mineral N uptake. This effect can also be seen from the spatial pattern of %Ndfa in the northern temperate region, such as the United States, western Europe, and China. Here, anthropogenic N deposition, together with the intensive application of fertilizers, results in soils being N-rich, inhibiting simulated BNF. This could explain why our modeled soybean N fixation rate was not high in East Asia and only contributed 45±3 % of plant total N uptake (Table 3). In comparison, the high rate of N fixation found in tropical regions is primarily due to their high nitrogenase activity under warm and moist soil conditions (Fig. S6), resulting in %Ndfa of ∼70 % being modeled for all grain legumes in the tropics (i.e., Africa and Southeast Asia; Table 3). A similar spatial variation between temperate and tropical regions in N fixation was also reported by other modeling studies in global terrestrial ecosystems (e.g., Wang and Houlton, 2009; Meyerholt et al., 2016; Xu-Ri and Prentice, 2017; Yu and Zhuang, 2020). Taken together, these results reveal that LPJ-GUESS broadly captures how N management practices and climate variation affect soil N uptake and biological N fixation in grain legumes at large spatial scales.
4.3 Modeling challenges and future work
Similar to most ecosystem and crop models, specific leaf area (SLA) in LPJ-GUESS is used to compute leaf area index (LAI) and indirectly affects the amount of photosynthesis. SLA also further impacts plant total N uptake since the N demand in plant organs is always associated with the photosynthetic assimilate in the model. The disagreements between modeled and observed C–N variables in the seasonal pattern (Figs. 6–7) can therefore be partially attributed to the static value of SLA implemented in LPJ-GUESS. Some studies have shown that SLA varies with crop growth development (Boote et al., 2002; Ainsworth et al., 2007) and environmental conditions (Poorter et al., 2009). In addition, low temperature, excess radiation, water deficit, or rising CO2 concentration would also result in reduced SLA through affecting leaf area expansion and internode elongation (Ainsworth and Long, 2005; Yin and Struik, 2010). Applying SLA as a constant in the model (see Sect. 2.4.1) cannot reflect these responses. Incorporation of dynamic SLA over the crop growing season and its response to the environment remains to be taken into account in future model development.
Despite many experimental studies on the limitation of soil water deficit in biological N fixation, the nature of the relationship between legume BNF and soil water content is not well characterized in models. A linear water-limitation function incorporated in LPJ-GUESS (Eq. 11) implies, for instance, that the model has little potential to represent the situation when plants experience stress from excessive water (flooding). The impact of excess soil water on legume N fixation is either omitted or oversimplified in most crop models. For instance, a simple assumption adopted in Sinclair's model is that the N fixation process is stopped forcibly when flooding takes place (Sinclair et al., 1987). In STICS, the N fixation inhibition by water excess is represented as stress from hypoxia in the roots (Brisson et al., 2003). The process of legume BNF restraint by flooding is implemented into CROPGRO (Boote et al., 2008) by calculating the proportion of water-filled pore space. N fixation is assumed to only be restricted when all pore space is filled with water; however, this rule has not been well evaluated so far.
Although high soil mineral N concentration suppresses legume root nodulation and further impacts N fixation (Xia et al., 2017; Mourtzinis et al., 2018; Brar and Lawley, 2020), a moderate level of soil N in the vegetative growth stage is conducive to root growth and nodule formation, stimulating N fixation (Waterer and Vessey, 1993; Salvagiotti et al., 2008). In the field trials a specific threshold of soil N concentration above (below) which N fixation is inhibited (stimulated) is hard to measure. In addition, the timing of N application remains a challenge (Córdova et al., 2020). Some studies reported that applying N fertilizer at planting as starter N can increase yield gains because of sufficient soil-available N to stimulate early season soybean growth (Pikul et al., 2001; Osborne and Riedell, 2011; Gai et al., 2017). However, other studies argued that the best time to apply additional N would be at early reproductive growth stages, during which legumes have the greatest N demand for seed development; also, soil N reserves are depleting and N fixation rate starts slowing down (Mourtzinis et al., 2018; Córdova et al., 2019; Zhou et al., 2019). Unfortunately, as mentioned earlier, there are no consistent results on these measured factors, resulting in the difficulties in incorporating the mechanistic processes or setups into LPJ-GUESS at this point.
Taken together, the challenge of modeling legume N fixation is primarily due to its large variance between species, sites, and managements. Symbiotic nitrogen fixation by rhizobia is an extremely complex natural process, which is associated not only with host plant and soil N status in the macro-environment (see Fig. 2), but also with the process of Rhizobium or Bradyrhizobium bacteria in root nodules in the micro-environment (Rice et al., 2000). It is difficult to incorporate these two different but highly related processes into one model (Liu et al., 2011; Chen et al., 2016). Furthermore, there is an inadequate amount of information available to establish a reliable relationship between BNF and other factors such as soil pH (Rice et al., 2000; Vanlauwe et al., 2019), inoculation effectiveness (Tewari et al., 2004; Denton et al., 2017; Liu et al., 2019), salinity (Zahran, 1999; Bruning and Rozema, 2013), oxygen (Jiang et al., 2021), and other nutrition availability (Le Roux et al., 2009; Singh et al., 2012), which are currently missing from LPJ-GUESS and other crop models despite many field experiments demonstrating their importance.
In this study we implemented a mechanistic process of symbiotic biological N fixation in grain legumes into the crop module of LPJ-GUESS. The modeled C–N variables of soybean and faba bean were extensively evaluated with observed data from the site scale to a larger region. Our results showed that the BNF scheme adopted in LPJ-GUESS realistically responded to water and N managements, as well as to climate variation, and produced N fixation and yields which generally agreed with measurements.
Our model estimated that global biological N fixation in grain legumes (i.e., soybean and all pulses) was 17.2±2.9 Tg N yr−1 during the period 1981–2016 and that the highest fixation rate occurred in tropical and temperate regions with a warm and moist climate. Soil water and temperature were dominant controls on N fixation, in addition to N fertilizer application rate. Processes missing from the model, such as inoculation effectiveness and soil acidity, might have biased our estimates of N fixation and yields at a global scale.
The dynamic process of N fixation with a C–N allocation scheme for crops in LPJ-GUESS provides an opportunity to estimate the changes in global grain legume production and global terrestrial C and N pools under future land-use or climate change scenarios. It can also help to predict and detect the potential contribution of N-fixing plants as “green manure” to reducing or removing the use of N fertilizer in global agricultural systems, considering different climate conditions, management practices, and land-use change scenarios.
Global daily climate data from GSWP3-W5E5 are available at https://doi.org/10.48364/ISIMIP.342217 (Lange et al., 2021). National soybean and pulse yield statistics from FAOSTAT presented in this study can be retrieved from http://www.fao.org/faostat/en/#data/QC (last access: 9 May 2021, FAOSTAT, 2021). The rest of the model input data and measurement results used in this study can be accessed at https://doi.org/10.5281/zenodo.5148255 (Ma et al., 2021).
LPJ-GUESS is tested, refined, and developed by a global research community, but the model code is managed and maintained by the Department of Physical Geography and Ecosystem Science, Lund University, Sweden. The source code can be made available with a collaboration agreement under the acceptance of certain conditions. The code used in this paper is available to the editor and reviewers via a restricted link on the condition that the code is only for review purposes. Additional details and information can be found at the LPJ-GUESS website (https://web.nateko.lu.se/lpj-guess/, last access: 14 July 2021) or by contacting the corresponding author.
The supplement related to this article is available online at: https://doi.org/10.5194/gmd-15-815-2022-supplement.
AA, SO, and JM conceived this study. SO and JM developed the model code. JM, SSR, ADB, PA, and AA designed the experimental protocol runs. JM carried out the analysis and produced the figures. SO, PA, and SSR assisted with data collection and parameter tuning. SSN provided soybean data in Kenya for model evaluation. JM wrote the original draft, with further editing from AA, SSR, ADB, PA, SO, and SSN.
The contact author has declared that neither they nor their co-authors have any competing interests.
Publisher's note: Copernicus Publications remains neutral with regard to jurisdictional claims in published maps and institutional affiliations.
We would like to thank Stijn Hantson for his technical support at the beginning of the model development.
This research has been supported by the German Federal Ministry for Economic
Cooperation and Development (BMZ) and administered through the Deutsche
Gesellschaft für Internationale Zusammenarbeit (GIZ) Fund for
International Agricultural Research (FIA) (grant no. 81206681).
The article processing charges for this open-access publication were covered by the Karlsruhe Institute of Technology (KIT).
This paper was edited by Tomomichi Kato and reviewed by two anonymous referees.
Abu-shakra, S. S., Phillips, D. A., and Huffaker, R. C.: Nitrogen Fixation and Delayed Leaf Senescence in Soybeans, Science, 199, 973–975, 1978.
Ainsworth, E. A. and Long, S. P.: What have we learned from 15 years of free-air CO2 enrichment (FACE)? A meta-analytic review of the responses of photosynthesis, canopy properties and plant production to rising CO2, New Phytol., 165, 351–371, https://doi.org/10.1111/j.1469-8137.2004.01224.x, 2005.
Ainsworth, E. A., Rogers, A., Leakey, A. D. B., Heady, L. E., Gibon, Y., Stitt, M., and Schurr, U.: Does elevated atmospheric [CO2] alter diurnal C uptake and the balance of C and N metabolites in growing and fully expanded soybean leaves?, J. Exp. Bot., 58, 579–591, https://doi.org/10.1093/jxb/erl233, 2007.
Becker, M., Ladha, J. K., and Ali, M.: Green manure technology: Potential, usage, and limitations. A case study for lowland rice, Plant Soil, 174, 181–194, 1995.
Boote, K. J., Mínguez, M. I., and Sau, F.: Adapting the CROPGRO legume model to simulate growth of faba bean, Agron. J., 94, 743–756, https://doi.org/10.2134/agronj2002.7430, 2002.
Boote, K. J., Hoogenboom, G., Jones, J. W., and Ingram, K. T.: Modeling Nitrogen Fixation and Its Relationship to Nitrogen Uptake in the CROPGRO Model, in: Book Quantifying and Understanding Plant Nitrogen Uptake for Systems Modeling, CRC Press, 34 pp., ISBN 9780429140532, 2008.
Bouniols, A., Cabelguenne, M., Jones, C. A., Chalamet, A., Charpenteau, J. L., and Marty, J. R.: Simulation of soybean nitrogen nutrition for a silty clay soil in southern France, Field Crop. Res., 26, 19–34, https://doi.org/10.1016/0378-4290(91)90054-Y, 1991.
Brar, N. and Lawley, Y.: Short-season soybean yield and protein unresponsive to starter nitrogen fertilizer, Agron. J., 112, 5012–5023, https://doi.org/10.1002/agj2.20378, 2020.
Brisson, N., Gary, C., Justes, E., Roche, R., Mary, B., Ripoche, D., Zimmer, D., Sierra, J., Bertuzzi, P., Burger, P., Bussiere, F., Cabidoche, Y. M., Cellier, P., Debaeke, P., Gaudillere, J. P., Henault, C., Maraux, F., Seguin, B., and Sinoquet, H.: An overview of the crop model STICS, Eur. J. Agron., 18, 309–332, 2003.
Bruning, B. and Rozema, J.: Symbiotic nitrogen fixation in legumes: Perspectives for saline agriculture, Environ. Exp. Bot., 92, 134–143, https://doi.org/10.1016/j.envexpbot.2012.09.001, 2013.
Cabelguenne, M., Debaeke, P., and Bouniols, A.: EPICphase, a version of the EPIC model simulating the effects of water and nitrogen stress on biomass and yield, taking account of developmental stages: Validation on maize, sunflower, sorghum, soybean and winter wheat, Agr. Syst., 60, 175–196, https://doi.org/10.1016/S0308-521X(99)00027-X, 1999.
Chen, C., Lawes, R., Fletcher, A., Oliver, Y., Robertson, M., Bell, M., and Wang, E.: How well can APSIM simulate nitrogen uptake and nitrogen fixation of legume crops?, Field Crop. Res., 187, 35–48, https://doi.org/10.1016/j.fcr.2015.12.007, 2016.
Ciampitti, I. A. and Salvagiotti, F.: New insights into soybean biological nitrogen fixation, Agron. J., 110, 1185–1196, https://doi.org/10.2134/agronj2017.06.0348, 2018.
Ciampitti, I. A., de Borja Reis, A. F., Córdova, S. C., Castellano, M. J., Archontoulis, S. V., Correndo, A. A., Antunes De Almeida, L. F., and Moro Rosso, L. H.: Revisiting Biological Nitrogen Fixation Dynamics in Soybeans, Front. Plant Sci., 12, 727021, https://doi.org/10.3389/fpls.2021.727021, 2021.
Cleveland, C. C., Townsend, A. R., Schimel, D. S., Fisher, H., Howarth, R. W., Hedin, L. O., Perakis, S. S., Latty, E. F., Von Fischer, J. C., Hlseroad, A., and Wasson, M. F.: Global patterns of terrestrial biological nitrogen (N2) fixation in natural ecosystems, Global Biogeochem. Cy., 13, 623–645, https://doi.org/10.1029/1999GB900014, 1999.
Cleveland, C. C., Houlton, B. Z., Smith, W. K., Marklein, A. R., Reed, S. C., Parton, W., Del Grosso, S. J., and Running, S. W.: Patterns of new versus recycled primary production in the terrestrial biosphere, P. Natl. Acad. Sci. USA, 110, 12733–12737, https://doi.org/10.1073/pnas.1302768110, 2013.
Córdova, S. C., Castellano, M. J., Dietzel, R., Licht, M. A., Togliatti, K., Martinez-Feria, R., and Archontoulis, S. V.: Soybean nitrogen fixation dynamics in Iowa, USA, Field Crop. Res., 236, 165–176, https://doi.org/10.1016/j.fcr.2019.03.018, 2019.
Córdova, S. C., Archontoulis, S. V., and Licht, M. A.: Soybean profitability and yield component response to nitrogen fertilizer in Iowa, Agrosystems, Geosci. Environ., 3, 1–16, https://doi.org/10.1002/agg2.20092, 2020.
Corre-Hellou, G., Faure, M., Launay, M., Brisson, N., and Crozat, Y.: Adaptation of the STICS intercrop model to simulate crop growth and N accumulation in pea-barley intercrops, Field Crop. Res., 113, 72–81, https://doi.org/10.1016/j.fcr.2009.04.007, 2009.
Cucchi, M., Weedon, G. P., Amici, A., Bellouin, N., Lange, S., Müller Schmied, H., Hersbach, H., and Buontempo, C.: WFDE5: bias-adjusted ERA5 reanalysis data for impact studies, Earth Syst. Sci. Data, 12, 2097–2120, https://doi.org/10.5194/essd-12-2097-2020, 2020.
Davies-Barnard, T. and Friedlingstein, P.: The Global Distribution of Biological Nitrogen Fixation in Terrestrial Natural Ecosystems, Global Biogeochem. Cy., 34, e2019GB006387, https://doi.org/10.1029/2019GB006387, 2020.
Denton, M. D., Phillips, L. A., Peoples, M. B., Pearce, D. J., Swan, A. D., Mele, P. M., and Brockwell, J.: Legume inoculant application methods: effects on nodulation patterns, nitrogen fixation, crop growth and yield in narrow-leaf lupin and faba bean, Plant Soil, 419, 25–39, https://doi.org/10.1007/s11104-017-3317-7, 2017.
DeVries, J. D., Bennett, J. M., Boote, K. J., Albrecht, S. L., and Maliro, C. E.: Nitrogen accumulation and partitioning by three grain legumes in response to soil water deficits, Field Crop. Res., 22, 33–44, https://doi.org/10.1016/0378-4290(89)90087-7, 1989a.
DeVries, J. D., Bennett, J. M., Albrecht, S. L., and Boote, K. J.: Water Relations , Nitrogenase Activity and Root Development of Three Grain Legumes in Response to Soil Water Deficits, Field Crop. Res., 21, 215–226, 1989b.
Dirmeyer, P. A., Gao, X., Zhao, M., Guo, Z., Oki, T., and Hanasaki, N.: GSWP-2: Multimodel analysis and implications for our perception of the land surface, B. Am. Meteorol. Soc., 87, 1381–1397, https://doi.org/10.1175/BAMS-87-10-1381, 2006.
Drewniak, B., Song, J., Prell, J., Kotamarthi, V. R., and Jacob, R.: Modeling agriculture in the Community Land Model, Geosci. Model Dev., 6, 495–515, https://doi.org/10.5194/gmd-6-495-2013, 2013.
Eckersten, H., Geijersstam, L., and Torssell, B.: Modelling nitrogen fixation of pea (Pisum sativum L.), Acta Agr. Scand. B-S. P., 56, 129–137, https://doi.org/10.1080/0906471051003050, 2006.
Elliott, J., Müller, C., Deryng, D., Chryssanthacopoulos, J., Boote, K. J., Büchner, M., Foster, I., Glotter, M., Heinke, J., Iizumi, T., Izaurralde, R. C., Mueller, N. D., Ray, D. K., Rosenzweig, C., Ruane, A. C., and Sheffield, J.: The Global Gridded Crop Model Intercomparison: data and modeling protocols for Phase 1 (v1.0), Geosci. Model Dev., 8, 261–277, https://doi.org/10.5194/gmd-8-261-2015, 2015.
Fageria, N. K.: Green manuring in crop production, J. Plant Nutr., 30, 691–719, https://doi.org/10.1080/01904160701289529, 2007.
FAO: More people, more food, worse water? a global review of water pollution from agriculture, edited by: Mateo-Sagasta, J., Zadeh, S. M., and Turral, H., FAO and IWMI, Rome and Colombo, 10 pp., ISBN 9789251307298, 2018.
FAOSTAT: Production/Crops and livestock products, FAOSTAT [data set], available at: http://www.fao.org/faostat/en/#data/QC, last access: 19 August 2021.
Fehlenberg, V., Baumann, M., Gasparri, N. I., Piquer-Rodriguez, M., Gavier-Pizarro, G., and Kuemmerle, T.: The role of soybean production as an underlying driver of deforestation in the South American Chaco, Global Environ. Chang., 45, 24–34, https://doi.org/10.1016/j.gloenvcha.2017.05.001, 2017.
Fisher, J. B., Sitch, S., Malhi, Y., Fisher, R. A., Huntingford, C., and Tan, S.-Y.: Carbon cost of plant nitrogen acquisition: A mechanistic, globally applicable model of plant nitrogen uptake, retranslocation, and fixation, Global Biogeochem. Cy., 24, GB1014, https://doi.org/10.1029/2009gb003621, 2010.
Gai, Z., Zhang, J., and Li, C.: Effects of starter nitrogen fertilizer on soybean root activity, leaf photosynthesis and grain yield, PLoS ONE, 12, e0174841, https://doi.org/10.1371/journal.pone.0174841, 2017.
Galloway, J. N., Dentener, F. J., Capone, D. G., Boyer, E. W., Howarth, R. W., Seitzinger, S. P., Asner, G. P., Cleveland, C. C., Green, P. A., Holland, E. A., Karl, D. M., Michaels, A. F., Porter, J. H., Townsend, A. R., and Vörösmarty, C. J.: Nitrogen cycles: Past, present, and future, Biogeochemistry, 70, 153–226, https://doi.org/10.1007/s10533-004-0370-0, 2004.
Gan, Y., Stulen, I., Van Keulen, H., and Kuiper, P. J. C.: Physiological changes in soybean (Glycine max) Wuyin9 in response to N and P nutrition, Ann. Appl. Biol., 140, 319–329, https://doi.org/10.1111/j.1744-7348.2002.tb00188.x, 2002.
Gan, Y., Stulen, I., Van Keulen, H., and Kuiper, P. J. C.: Effect of N fertilizer top-dressing at various reproductive stages on growth, N2 fixation and yield of three soybean (Glycine max (L.) Merr.) genotypes, Field Crop. Res., 80, 147–155, https://doi.org/10.1016/S0378-4290(02)00171-5, 2003.
Gelfand, I. and Robertson, G. P.: A reassessment of the contribution of soybean biological nitrogen fixation to reactive N in the environment, Biogeochemistry, 123, 175–184, https://doi.org/10.1007/s10533-014-0061-4, 2015.
Hajduk, E., Właśniewski, S., and Szpunar-Krok, E.: Influence of legume crops on content of organic carbon in sandy soil, Soil Science Annual, 66, 52–56, https://doi.org/10.1515/ssa-2015-0019, 2015.
Harris, D., Pacovsky, R. S., and Paul, E. A.: Carbon Economy of Soybean–Rhizobium–Glomus Associations, New Phytol., 101, 427–440, https://doi.org/10.1111/j.1469-8137.1985.tb02849.x, 1985.
Heilmayr, R., Rausch, L. L., Munger, J., and Gibbs, H. K.: Brazil's Amazon Soy Moratorium reduced deforestation, Nature Food, 1, 801–810, https://doi.org/10.1038/s43016-020-00194-5, 2020.
Herridge, D. F., Roughley, R. J., and Brockwell, J.: Effect of rhizobia and soil nitrate on the establishment and functioning of the soybean symbiosis in the field, Aust. J. Agr. Res., 35, 149–161, https://doi.org/10.1071/AR9840149, 1984.
Herridge, D. F., Peoples, M. B., and Boddey, R. M.: Global inputs of biological nitrogen fixation in agricultural systems, Plant Soil, 311, 1–18, https://doi.org/10.1007/s11104-008-9668-3, 2008.
Houlton, B. Z., Wang, Y. P., Vitousek, P. M., and Field, C. B.: A unifying framework for dinitrogen fixation in the terrestrial biosphere, Nature, 454, 327–330, https://doi.org/10.1038/nature07028, 2008.
Hurtt, G. C., Chini, L., Sahajpal, R., Frolking, S., Bodirsky, B. L., Calvin, K., Doelman, J. C., Fisk, J., Fujimori, S., Klein Goldewijk, K., Hasegawa, T., Havlik, P., Heinimann, A., Humpenöder, F., Jungclaus, J., Kaplan, J. O., Kennedy, J., Krisztin, T., Lawrence, D., Lawrence, P., Ma, L., Mertz, O., Pongratz, J., Popp, A., Poulter, B., Riahi, K., Shevliakova, E., Stehfest, E., Thornton, P., Tubiello, F. N., van Vuuren, D. P., and Zhang, X.: Harmonization of global land use change and management for the period 850–2100 (LUH2) for CMIP6, Geosci. Model Dev., 13, 5425–5464, https://doi.org/10.5194/gmd-13-5425-2020, 2020.
Irmak, S., Odhiambo, L. O., Specht, J. E., and Djaman, K.: Hourly and daily single and basal evapotranspiration crop coefficients as a function of growing degree days, days after emergence, leaf area index, fractional green canopy cover, and plant phenology for soybean, T. ASABE, 56, 1785–1803, https://doi.org/10.13031/trans.56.10219, 2013.
Jensen, E. S., Peoples, M. B., Boddey, R. M., Gresshoff, P. M., Henrik, H. N., Alves, B. J. R., and Morrison, M. J.: Legumes for mitigation of climate change and the provision of feedstock for biofuels and biorefineries. A review, Agron. Sustain. Dev., 32, 329–364, 2012.
Jiang, S., Jardinaud, M., Gao, J., Pecrix, Y., Wen, J., Mysore, K., Xu, P., Sanchez-canizares, C., Ruan, Y., Li, Q., Zhu, M., Li, F., Wang, E., Poole, P. S., Gamas, P., and Murray, J. D.: NIN-like protein transcription factors regulate leghemoglobin genes in legume nodules, Science, 374, 625–628, 2021.
Kaschuk, G., Kuyper, T. W., Leffelaar, P. A., Hungria, M., and Giller, K. E.: Are the rates of photosynthesis stimulated by the carbon sink strength of rhizobial and arbuscular mycorrhizal symbioses?, Soil Biol. Biochem., 41, 1233–1244, https://doi.org/10.1016/j.soilbio.2009.03.005, 2009.
Kaschuk, G., Hungria, M., Leffelaar, P. A., Giller, K. E., and Kuyper, T. W.: Differences in photosynthetic behaviour and leaf senescence of soybean (Glycine max [L.] Merrill) dependent on N2 fixation or nitrate supply, Plant Biol., 12, 60–69, https://doi.org/10.1111/j.1438-8677.2009.00211.x, 2010.
Kattge, J., Bönisch, G., Díaz, S., et al.: TRY plant trait database – enhanced coverage and open access, Glob. Chang. Biol., 26, 119–188, https://doi.org/10.1111/gcb.14904, 2020.
Khan, D. F., Peoples, M. B., Schwenke, G. D., Felton, W. L., Chen, D., and Herridge, D. F.: Effects of below-ground nitrogen on N balances of field-grown fababean, chickpea, and barley, Aust. J. Agr. Res., 54, 333–340, https://doi.org/10.1071/AR02105, 2003.
Kull, O.: Acclimation of photosynthesis in canopies: Models and limitations, Oecologia, 133, 267–279, https://doi.org/10.1007/s00442-002-1042-1, 2002.
Lange, S.: Trend-preserving bias adjustment and statistical downscaling with ISIMIP3BASD (v1.0), Geosci. Model Dev., 12, 3055–3070, https://doi.org/10.5194/gmd-12-3055-2019, 2019.
Lange, S., Menz, C., Gleixner, S., Cucchi, M., Weedon, G. P., Amici, A., Bellouin, N., Müller Schmied, H., Hersbach, H., Buontempo, C., and Cagnazzo, C.: WFDE5 over land merged with ERA5 over the ocean, Version 2.0, ISIMIP Repository [data set], https://doi.org/10.48364/ISIMIP.342217, 2021.
Le Roux, M. R., Khan, S., and Valentine, A. J.: Nitrogen and carbon costs of soybean and lupin root systems during phosphate starvation, Symbiosis, 48, 102–109, https://doi.org/10.1007/BF03179989, 2009.
Lindeskog, M., Arneth, A., Bondeau, A., Waha, K., Seaquist, J., Olin, S., and Smith, B.: Implications of accounting for land use in simulations of ecosystem carbon cycling in Africa, Earth Syst. Dynam., 4, 385–407, https://doi.org/10.5194/esd-4-385-2013, 2013.
Liu, L., Knight, J. D., Lemke, R. L., and Farrell, R. E.: A side-by-side comparison of biological nitrogen fixation and yield of four legume crops, Plant Soil, 442, 169–182, https://doi.org/10.1007/s11104-019-04167-x, 2019.
Liu, Y., Wu, L., Baddeley, J. A., and Watson, C. A.: Models of biological nitrogen fixation of legumes. A review, Agron. Sustain. Dev., 31, 155–172, https://doi.org/10.1051/agro/2010008, 2011.
LPJ-GUESS: LPJ-GUESS Ecosystem Model, Lund University, available at: https://web.nateko.lu.se/lpj-guess/, last access: 14 July 2021.
Lu, C. and Tian, H.: Global nitrogen and phosphorus fertilizer use for agriculture production in the past half century: shifted hot spots and nutrient imbalance, Earth Syst. Sci. Data, 9, 181–192, https://doi.org/10.5194/essd-9-181-2017, 2017.
Ma, J., Olin, S., Anthoni, P., Rabin, S. S., Bayer, A. D., Nyawira, S. S., and Arneth, A.: Jianyong Ma/BNF in grain legumes in LPJ-GUESS, Zenodo [data set], https://doi.org/10.5281/zenodo.5148255, 2021.
Macduff, J. H., Jarvis, S. C., and Davidson, I. A.: Inhibition of N2 fixation by white clover (Trifolium repens L.) at low concentrations of NO in flowing solution culture, Plant Soil, 180, 287–295, https://doi.org/10.1007/BF00015312, 1996.
Marino, D., Frendo, P., Ladrera, R., Zabalza, A., Puppo, A., Arrese-Igor, C., and Gonzalez, E. M.: Nitrogen Fixation Control under Drought Stress. Localized or Systemic?, Plant Physiol., 143, 1968–1974, https://doi.org/10.1104/pp.106.097139, 2007.
Meena, R. S., Das, A., Singh, G., and Lal, R.: Legumes for Soil Health and Sustainable Management, Springer, Singapore, https://doi.org/10.1007/978-981-13-0253-4, 2018.
Meyerholt, J., Zaehle, S., and Smith, M. J.: Variability of projected terrestrial biosphere responses to elevated levels of atmospheric CO2 due to uncertainty in biological nitrogen fixation, Biogeosciences, 13, 1491–1518, https://doi.org/10.5194/bg-13-1491-2016, 2016.
Mínguez, M. I., Ruiz-Nogueira, B., and Sau, F.: Faba bean productivity and optimum canopy development under a Mediterranean climate, Field Crop. Res., 33, 435–447, https://doi.org/10.1016/0378-4290(93)90164-I, 1993.
Moss, B.: Water pollution by agriculture, Philos. T. Roy. Soc. B, 363, 659–666, https://doi.org/10.1098/rstb.2007.2176, 2008.
Mourtzinis, S., Kaur, G., Orlowski, J. M., Shapiro, C. A., Lee, C. D., Wortmann, C., Holshouser, D., Nafziger, E. D., Kandel, H., Niekamp, J., Ross, W. J., Lofton, J., Vonk, J., Roozeboom, K. L., Thelen, K. D., Lindsey, L. E., Staton, M., Naeve, S. L., Casteel, S. N., Wiebold, W. J., and Conley, S. P.: Soybean response to nitrogen application across the United States: A synthesis-analysis, Field Crop. Res., 215, 74–82, https://doi.org/10.1016/j.fcr.2017.09.035, 2018.
Muleta, D., Ryder, M. H., and Denton, M. D.: The potential for rhizobial inoculation to increase soybean grain yields on acid soils in Ethiopia, Soil Sci. Plant Nutr., 63, 441–451, https://doi.org/10.1080/00380768.2017.1370961, 2017.
Northup, B. K. and Rao, S. C.: Effects of legume green manures on forage produced in continuous wheat systems, Agron. J., 108, 101–108, https://doi.org/10.2134/agronj15.0031, 2016.
Olin, S., Schurgers, G., Lindeskog, M., Wårlind, D., Smith, B., Bodin, P., Holmér, J., and Arneth, A.: Modelling the response of yields and tissue C:N to changes in atmospheric CO2 and N management in the main wheat regions of western Europe, Biogeosciences, 12, 2489–2515, https://doi.org/10.5194/bg-12-2489-2015, 2015.
Osaki, M.: Carbon-nitrogen interaction model in field crop production, Plant Soil, 155–156, 203–206, https://doi.org/10.1007/BF00025019, 1993.
Osborne, S. L. and Riedell, W. E.: Impact of low rates of nitrogen applied at planting on soybean nitrogen fixation, J. Plant Nutr., 34, 436–448, https://doi.org/10.1080/01904167.2011.536883, 2011.
Patterson, T. G. and Larue, T. A.: Root Respiration Associated with Nitrogenase Activity (C2H2) of Soybean, and a Comparison of Estimates, Plant Physiol., 72, 701–705, https://doi.org/10.1104/pp.72.3.701, 1983.
Penning de Vries, F. W. T., Jansen, D. M., ten Berge, H. F. M., and Bakema, A.: Simulation of ecophysiological processes of growth in several annual crops, Centre for Agricultural Publishing and Documentation, Wageningen, Wageningen, 1989.
Peoples, M. B., Brockwell, J., Herridge, D. F., Rochester, I. J., Alves, B. J. R., Urquiaga, S., Boddey, R. M., Dakora, F. D., Bhattarai, S., Maskey, S. L., Sampet, C., Rerkasem, B., Khan, D. F., Hauggaard-Nielsen, H., and Jensen, E. S.: The contributions of nitrogen-fixing crop legumes to the productivity of agricultural systems, Symbiosis, 48, 1–17, https://doi.org/10.1007/BF03179980, 2009.
Pikul, J. L., Carpenter-Boggs, L., Vigil, M., Schumacher, T. E., Lindstrom, M. J., and Riedell, W. E.: Crop yield and soil condition under ridge and chisel-plow tillage in the northern Corn Belt, USA, Soil Till. Res., 60, 21–33, https://doi.org/10.1016/S0167-1987(01)00174-X, 2001.
Poorter, H., Niinemets, Ü., Poorter, L., Wright, I. J., and Villar, R.: Causes and consequences of variation in leaf mass per area (LMA): A meta-analysis, New Phytol., 182, 565–588, https://doi.org/10.1111/j.1469-8137.2009.02830.x, 2009.
Portmann, F. T., Siebert, S., and Döll, P.: MIRCA2000-Global monthly irrigated and rainfed crop areas around the year 2000: A new high-resolution data set for agricultural and hydrological modeling, Global Biogeochem. Cy., 24, GB1011, https://doi.org/10.1029/2008gb003435, 2010.
Pugh, T. A. M., Arneth, A., Olin, S., Ahlström, A., Bayer, A. D., Klein Goldewijk, K., Lindeskog, M., and Schurgers, G.: Simulated carbon emissions from land-use change are substantially enhanced by accounting for agricultural management, Environ. Res. Lett., 10 124008, https://doi.org/10.1088/1748-9326/10/12/124008, 2015.
Purcell, L. C. and Sinclair, T. R.: Nitrogenase Activity and Nodule Gas Permeability Response to Rhizospheric NH3 in Soybean, Plant Physiol., 92, 268–272, 1990.
Reay, D. S., Davidson, E. A., Smith, K. A., Smith, P., Melillo, J. M., Dentener, F., and Crutzen, P. J.: Global agriculture and nitrous oxide emissions, Nat. Clim. Change, 2, 410–416, https://doi.org/10.1038/nclimate1458, 2012.
Rice, W. A., Clayton, G. W., Olsen, P. E., and Lupwayi, N. Z.: Rhizobial inoculant formulations and soil ph influence field pea nodulation and nitrogen fixation, Can. J. Soil Sci., 80, 395–400, https://doi.org/10.4141/S99-059, 2000.
Richards, F. J.: A flexible growth function for empirical use, J. Exp. Bot., 10, 290–301, https://doi.org/10.1093/jxb/10.2.290, 1959.
Robertson, M. J., Carberry, P. S., Huth, N. I., Turpin, J. E., Probert, M. E., Poulton, P. L., Bell, M., Wright, G. C., Yeates, S. J., and Brinsmead, R. B.: Simulation of growth and development of diverse legume species in APSIM, Aust. J. Agr. Res., 53, 429–446, 2002.
Ryle, G. J. A., Powell, C. E., and Gordon, A. J.: The respiratory costs of nitrogen fixation in soyabean, cowpea, and white clover: I. Nitrogen fixation and the respiration of the nodulated root, J. Exp. Bot., 30, 135–144, https://doi.org/10.1093/jxb/30.1.135, 1979.
Salvagiotti, F., Cassman, K. G., Specht, J. E., Walters, D. T., Weiss, A., and Dobermann, A.: Nitrogen uptake, fixation and response to fertilizer N in soybeans: A review, Field Crop. Res., 108, 1–13, https://doi.org/10.1016/j.fcr.2008.03.001, 2008.
Sanginga, N., Dashiell, K., Okogun, J. A., and Thottappilly, G.: Nitrogen fixation and N contribution by promiscuous nodulating soybeans in the southern Guinea savanna of Nigeria, Plant Soil, 195, 257–266, https://doi.org/10.1023/A:1004207530131, 1997.
Santachiara, G., Borrás, L., and Rotundo, J. L.: Physiological processes leading to similar yield in contrasting soybean maturity groups, Agron. J., 109, 158–167, https://doi.org/10.2134/agronj2016.04.0198, 2017.
Santachiara, G., Salvagiotti, F., Gerde, J. A., and Rotundo, J. L.: Does biological nitrogen fixation modify soybean nitrogen dilution curves?, Field Crop. Res., 223, 171–178, https://doi.org/10.1016/j.fcr.2018.04.001, 2018.
Serraj, R., Sinclair, T. R., and Purcell, L. C.: Symbiotic N2 fixation response to drought, J. Exp. Bot., 50, 143–155, https://doi.org/10.1093/jxb/50.331.143, 1999.
Sinclair, T. R., Muchow, R. C., Ludlow, M. M., Leach, G. J., Lawn, R. J., and Foale, M. A.: Field and model analysis of the effect of water deficits on carbon and nitrogen accumulation by soybean, cowpea and black gram, Field Crop. Res., 17, 121–140, https://doi.org/10.1016/0378-4290(87)90087-6, 1987.
Singh, M., Wanjari, R. H., Dwivedi, A., and Dalal, R.: Yield response to applied nutrients and estimates of N2 fixation in 33-year-old soybean-wheat experiment on a vertisol, Exp. Agr., 48, 311–325, https://doi.org/10.1017/S0014479712000129, 2012.
Smil, V.: Nitrogen in crop production: An account of global flows adds, Global Biogeochem. Cy., 13, 647–662, 1999.
Smith, B., Wårlind, D., Arneth, A., Hickler, T., Leadley, P., Siltberg, J., and Zaehle, S.: Implications of incorporating N cycling and N limitations on primary production in an individual-based dynamic vegetation model, Biogeosciences, 11, 2027–2054, https://doi.org/10.5194/bg-11-2027-2014, 2014.
Soussana, J. F., Minchin, F. R., Macduff, J. H., Raistrick, N., Abberton, M. T., and Michaelson-Yeates, T. P. T.: A simple model of feedback regulation for nitrate uptake and N2 fixation in contrasting phenotypes of white clover, Annals of Botany, 90, 139–147, https://doi.org/10.1093/aob/mcf161, 2002.
Srivastava, A. K. and Ambasht, R. S.: Soil moisture control of Nitrogen fixation activity in dry tropical casuarina plantation forest, J. Environ. Manage., 42, 49–54, 1994.
Stagnari, F., Maggio, A., Galieni, A., and Pisante, M.: Multiple benefits of legumes for agriculture sustainability: an overview, Chemical and Biological Technologies in Agriculture, 4, 1–13, https://doi.org/10.1186/s40538-016-0085-1, 2017.
Tewari, K., Suganuma, T., Fujikake, H., Ohtake, N., Sueyoshi, K., Takahashi, Y., and Ohyama, T.: Effect of Deep Placement of N Fertilizers and Different Inoculation Methods of Bradyrhizobia on Growth, N2 Fixation Activity and N Absorption Rate of Field-grown Soybean Plants, J. Agron. Crop Sci., 190, 46–58, https://doi.org/10.1046/j.0931-2250.2003.00073.x, 2004.
Thornley, J. H. M. and Cannell, M. G. R.: Modelling the components of plant respiration: Representation and realism, Annals of Botany, 85, 55–67, https://doi.org/10.1006/anbo.1999.0997, 2000.
Tian, H., Yang, J., Lu, C., Xu, R., Canadell, J. G., Jackson, R. B., Arneth, A., Chang, J., Chen, G., Ciais, P., Gerber, S., Ito, A., Huang, Y., Joos, F., Lienert, S., Messina, P., Olin, S., Pan, S., Peng, C., Saikawa, E., Thompson, R. L., Vuichard, N., Winiwarter, W., Zaehle, S., Zhang, B., Zhang, K., and Zhu, Q.: The global N2O model intercomparison project, B. Am. Meteorol. Soc., 99, 1231–1251, https://doi.org/10.1175/BAMS-D-17-0212.1, 2018.
Tian, H., Xu, R., Canadell, J. G., Thompson, R. L., Winiwarter, W., Suntharalingam, P., Davidson, E. A., Ciais, P., Jackson, R. B., Janssens-Maenhout, G., Prather, M. J., Regnier, P., Pan, N., Pan, S., Peters, G. P., Shi, H., Tubiello, F. N., Zaehle, S., Zhou, F., Arneth, A., Battaglia, G., Berthet, S., Bopp, L., Bouwman, A. F., Buitenhuis, E. T., Chang, J., Chipperfield, M. P., Dangal, S. R. S., Dlugokencky, E., Elkins, J. W., Eyre, B. D., Fu, B., Hall, B., Ito, A., Joos, F., Krummel, P. B., Landolfi, A., Laruelle, G. G., Lauerwald, R., Li, W., Lienert, S., Maavara, T., MacLeod, M., Millet, D. B., Olin, S., Patra, P. K., Prinn, R. G., Raymond, P. A., Ruiz, D. J., van der Werf, G. R., Vuichard, N., Wang, J., Weiss, R. F., Wells, K. C., Wilson, C., Yang, J., and Yao, Y.: A comprehensive quantification of global nitrous oxide sources and sinks, Nature, 586, 248–256, https://doi.org/10.1038/s41586-020-2780-0, 2020.
Ulzen, J., Abaidoo, R. C., Mensah, N. E., Masso, C., and AbdelGadir, A. A. H.: Bradyrhizobium inoculants enhance grain yields of soybean and cowpea in Northern Ghana, Front. Plant Sci., 7, 1–9, https://doi.org/10.3389/fpls.2016.01770, 2016.
Unkovich, M. J. and Pate, J. S.: An appraisal of recent field measurements of symbiotic N2 fixation by annual legumes, Field Crop. Res., 65, 211–228, https://doi.org/10.1016/S0378-4290(99)00088-X, 2000.
Unkovich, M. J., Baldock, J., and Peoples, M. B.: Prospects and problems of simple linear models for estimating symbiotic N2 fixation by crop and pasture legumes, Plant Soil, 329, 75–89, https://doi.org/10.1007/s11104-009-0136-5, 2010.
Vanlauwe, B., Hungria, M., Kanampiu, F., and Giller, K. E.: The role of legumes in the sustainable intensification of African smallholder agriculture: Lessons learnt and challenges for the future, Agr. Ecosyst. Environ., 284, 106583, https://doi.org/10.1016/j.agee.2019.106583, 2019.
Vitousek, P. M., Menge, D. N. L., Reed, S. C., and Cleveland, C. C.: Biological nitrogen fixation: Rates, patterns and ecological controls in terrestrial ecosystems, Philos. T. Roy. Soc. B, 368, 20130119, https://doi.org/10.1098/rstb.2013.0119, 2013.
Voisin, A. S., Salon, C., Jeudy, C., and Warembourg, F. R.: Symbiotic N2 fixation activity in relation to C economy of Pisum sativum L. as a function of plant phenology, J. Exp. Bot., 54, 2733–2744, https://doi.org/10.1093/jxb/erg290, 2003.
Voisin, A. S., Bourion, V., Duc, G., and Salon, C.: Using an ecophysiological analysis to dissect genetic variability and to propose an ideotype for nitrogen nutrition in pea, Annals of Botany, 100, 1525–1536, https://doi.org/10.1093/aob/mcm241, 2007.
Voisin, A. S., Guéguen, J., Huyghe, C., Jeuffroy, M. H., Magrini, M. B., Meynard, J. M., Mougel, C., Pellerin, S., and Pelzer, E.: Legumes for feed, food, biomaterials and bioenergy in Europe: A review, Agron. Sustain. Dev., 34, 361–380, https://doi.org/10.1007/s13593-013-0189-y, 2014.
Volkholz, J. and Müller, C.: ISIMIP3 soil input data (v1.0), ISIMIP Repository [data set], https://doi.org/10.48364/ISIMIP.942125, 2020.
von Bloh, W., Schaphoff, S., Müller, C., Rolinski, S., Waha, K., and Zaehle, S.: Implementing the nitrogen cycle into the dynamic global vegetation, hydrology, and crop growth model LPJmL (version 5.0), Geosci. Model Dev., 11, 2789–2812, https://doi.org/10.5194/gmd-11-2789-2018, 2018.
Waha, K., Van Bussel, L. G. J., Müller, C., and Bondeau, A.: Climate-driven simulation of global crop sowing dates, Glob. Ecol. Biogeogr., 21, 247–259, https://doi.org/10.1111/j.1466-8238.2011.00678.x, 2012.
Wang, E. and Engel, T.: Simulation of phenological development of wheat crops, Agr. Syst., 58, 1–24, https://doi.org/10.1016/S0308-521X(98)00028-6, 1998.
Wang, Y. P. and Houlton, B. Z.: Nitrogen constraints on terrestrial carbon uptake: Implications for the global carbon-climate feedback, Geophys. Res. Lett., 36, L24403, https://doi.org/10.1029/2009GL041009, 2009.
Wårlind, D., Smith, B., Hickler, T., and Arneth, A.: Nitrogen feedbacks increase future terrestrial ecosystem carbon uptake in an individual-based dynamic vegetation model, Biogeosciences, 11, 6131–6146, https://doi.org/10.5194/bg-11-6131-2014, 2014.
Waterer, J. G. and Vessey, J. K.: Effect of low static nitrate concentrations on mineral nitrogen uptake, nodulation, and nitrogen fixation in field pea, J. Plant Nutr., 16, 1775–1789, https://doi.org/10.1080/01904169309364649, 1993.
Weisz, P. R., Denison, R. F., and Sinclair, T. R.: Response to drought stress of nitrogen fixation (acetylene reduction) rates by field-grown soybeans, Plant Physiol., 78, 525–530, https://doi.org/10.1104/pp.78.3.525, 1985.
Williams, C. M., King, J. R., Ross, S. M., Olson, M. A., Hoy, C. F., and Lopetinsky, K. J.: Effects of three pulse crops on subsequent barley, canola, and wheat, Agron. J., 106, 343–350, https://doi.org/10.2134/agronj2013.0274, 2014.
Wu, L. and McGechan, M. B.: Simulation of nitrogen uptake, fixation and leaching in a grass/white clover mixture, Grass Forage Sci., 54, 30–41, https://doi.org/10.1046/j.1365-2494.1999.00145.x, 1999.
Wu, L., Misselbrook, T. H., Feng, L., and Wu, L.: Assessment of nitrogen uptake and biological nitrogen fixation responses of soybean to nitrogen fertiliser with SPACSYS, Sustainability, 12, 5921, https://doi.org/10.3390/SU12155921, 2020.
Xia, X., Ma, C., Dong, S., Xu, Y., and Gong, Z.: Effects of nitrogen concentrations on nodulation and nitrogenase activity in dual root systems of soybean plants, Soil Sci. Plant Nutr., 63, 470–482, https://doi.org/10.1080/00380768.2017.1370960, 2017.
Xu-Ri and Prentice, I. C.: Modelling the demand for new nitrogen fixation by terrestrial ecosystems, Biogeosciences, 14, 2003–2017, https://doi.org/10.5194/bg-14-2003-2017, 2017.
Yin, X. and Struik, P. C.: Modelling the crop: From system dynamics to systems biology, J. Exp. Bot., 61, 2171–2183, https://doi.org/10.1093/jxb/erp375, 2010.
Yu, M., Gao, Q., and Shaffer, M. J.: Simulating Interactive Effects of Symbiotic Nitrogen Fixation, Carbon Dioxide Elevation, and Climatic Change on Legume Growth, J. Environ. Qual., 31, 634–641, https://doi.org/10.2134/jeq2002.6340, 2002.
Yu, T. and Zhuang, Q.: Modeling biological nitrogen fixation in global natural terrestrial ecosystems, Biogeosciences, 17, 3643–3657, https://doi.org/10.5194/bg-17-3643-2020, 2020.
Zaehle, S. and Friend, A. D.: Carbon and nitrogen cycle dynamics in the O-CN land surface model: 1. Model description, site-scale evaluation, and sensitivity to parameter estimates, Global Biogeochem. Cy., 24, GB1005, https://doi.org/10.1029/2009GB003521, 2010.
Zahran, H. H.: Rhizobium-Legume Symbiosis and Nitrogen Fixation under Severe Conditions and in an Arid Climate, Microbiol. Mol. Biol. R., 63, 968–989, https://doi.org/10.1128/mmbr.63.4.968-989.1999, 1999.
Zapata, F., Danso, S. K. A., Hardarson, G., and Fried, M.: Time Course of Nitrogen Fixation in Field-Grown Soybean Using Nitrogen-15 Methodology, Agron. J., 79, 172–176, https://doi.org/10.2134/agronj1987.00021962007900010035x, 1987.
Zhang, B., Tian, H., Lu, C., Dangal, S. R. S., Yang, J., and Pan, S.: Global manure nitrogen production and application in cropland during 1860–2014: a 5 arcmin gridded global dataset for Earth system modeling, Earth Syst. Sci. Data, 9, 667–678, https://doi.org/10.5194/essd-9-667-2017, 2017.
Zhou, H., Yao, X., Zhao, Q., Zhang, W., Zhang, B., and Xie, F.: Rapid Effect of Nitrogen Supply for Soybean at the Beginning Flowering Stage on Biomass and Sucrose Metabolism, Scientific Reports, 9, 15530, https://doi.org/10.1038/s41598-019-52043-6, 2019.
green manureto reducing or removing the use of N fertilizer in global agricultural systems, considering different climate conditions, management practices, and land-use change scenarios.