the Creative Commons Attribution 4.0 License.
the Creative Commons Attribution 4.0 License.
 | 04 Aug 2022
Simulations of aerosol pH in China using WRF-Chem (v4.0): sensitivities of aerosol pH and its temporal variations during haze episodes
Xueyin Ruan
Chun Zhao
Rahul A. Zaveri
Pengzhen He
Xinming Wang
Jingyuan Shao
Aerosol pH is a fundamental property of aerosols in terms of atmospheric chemistry and its impact on air quality, climate, and health. Precise estimation of aerosol pH in chemical transport models (CTMs) is critical for aerosol modeling and thus influences policy development that partially relies on results from model simulations. We report the Weather Research and Forecasting Model coupled with Chemistry (WRF-Chem) simulated PM2.5 pH over China during a period with heavy haze episodes in Beijing, and explore the sensitivity of the modeled aerosol pH to factors including emissions of nonvolatile cations (NVCs) and NH3, aerosol phase state assumption, and heterogeneous production of sulfate. We find that default WRF-Chem could predict spatial patterns of PM2.5 pH over China similar to other CTMs, but with generally lower pH values, largely due to the underestimation of alkaline species (NVCs and NH3) and the difference in thermodynamic treatments between different models. Increasing NH3 emissions in the model would improve the modeled pH in comparison with offline thermodynamic model calculations of pH constrained by observations. In addition, we find that the aerosol phase state assumption and heterogeneous sulfate production are important in aerosol pH predictions for regions with low relative humidity (RH) and high anthropogenic SO2 emissions, respectively. These factors should be better constrained in model simulations of aerosol pH in the future. Analysis of the modeled temporal trend of PM2.5 pH in Beijing over a haze episode reveals a clear decrease in pH from 5.2 ± 0.9 in a clean period to 3.6 ± 0.5 in a heavily polluted period. The increased acidity under more polluted conditions is largely due to the formation and accumulation of secondary species including sulfuric acid and nitric acid, even though being modified by alkaline species (NVCs, NH3). Our result suggests that NO2 oxidation is unlikely to be important for heterogeneous sulfate production during the Beijing haze as the effective pH for NO2 oxidation of S(IV) is at a higher pH of ∼ 6.
- Article
(10060 KB) - Full-text XML
-
Supplement
(2528 KB) - BibTeX
- EndNote


The acidity of atmospheric particles plays an essential role in various chemical and environmental processes. Acidified dust particles can largely enhance the solubility of transition metals which may act as nutrients in oceanic ecosystems (Meskhidze et al., 2003), affecting global biogeochemical nutrient cycles (Kanakidou et al., 2018). The dissolved metals can also generate reactive oxygen species, causing aerosol toxicity and adverse health effects (Fang et al., 2017). Particle acidity can strongly affect gas–particle partitioning of volatile and semi-volatile species such as NH3, HNO3, HCl (Keene et al., 2004; Guo et al., 2017a), as well as organic acids and bases (Ahrens et al., 2012). Moreover, particle acidity is linked to aerosol chemical reactivity by altering aqueous-phase reaction rates which are important for secondary aerosol formation. Both laboratory experiments (Gao et al., 2004; Surratt et al., 2007) and field studies (Rengarajan et al., 2011) have demonstrated that higher acidity could facilitate production of secondary organic aerosol (SOA) from the oxidation of volatile organic compounds (VOCs) due to an acid-catalyzed mechanism. In addition, aerosol acidity significantly affects reaction mechanisms and rates of heterogeneous sulfate production (Seinfeld et al., 2016). As one of the most abundant inorganic components in fine particles, sulfate is considered to be a key driver for the severe haze events in China (Cheng et al., 2016; Wang et al., 2016). Therefore, a thoughtful understanding of aerosol pH variability and its precise prediction are important to understand and quantify the formation rates and mechanisms of sulfate in the Chinese haze using models that provide insights into the outbreak of the haze events.
However, aerosol pH is poorly constrained due to difficulties in direct measurement techniques (Freedman et al., 2019; Keene et al., 1998). Instead, thermodynamic models, such as ISORROPIA II (Fountoukis and Nenes, 2007), Model for Simulating Aerosol Interactions and Chemistry (MOSAIC) (Zaveri et al., 2008), and Extended Aerosol Inorganics Model (E-AIM) (Clegg et al., 2003) are commonly used to calculate aerosol pH (Pye et al., 2020). These models typically predict particle deliquescence, gas–particle mass transfer, solid–liquid phase equilibrium, activity coefficients and aerosol water content (AWC) (Zaveri et al., 2008; Jia et al., 2018) under observed or modeled meteorological conditions and atmospheric chemical compositions. Some of these thermodynamic models have also been implemented in 3D chemical transport models (CTMs) for representation of aerosol processes. For example, the ISORROPIA II model is incorporated in many 3D models, such as the Goddard Earth Observing System with Chemistry model (GEOS-Chem), the Community Multiscale Air Quality Modeling System (CMAQ) and the PM-CAMx, while MOSAIC is employed in the Weather Research and Forecasting Model coupled with Chemistry (WRF-Chem) (Grell et al., 2005; Fast et al., 2006).
The CTMs are useful tools to understand relevant physicochemical atmospheric processes and to formulate air quality management strategies. The reliability of particle acidity prediction in CTMs is crucial for aerosol modeling, especially for the modeling of secondary aerosol formations, and therefore has implications for policy development. Vasilakos et al. (2018) demonstrated that pH bias simulated by CMAQ can induce nitrate partitioning bias and thus influences the response of PM2.5 composition to emission changes in the model. Using the GEOS-Chem model with prescribed particle pH values, Shao et al. (2019) investigated the impact of particle pH on heterogeneous sulfate production and found that the model predicts different relative contributions of sulfate formation pathways to total atmospheric sulfate burden under different pH conditions. Furthermore, a recent review paper (Pye et al., 2020) highlighted the critical role of particle pH in model simulations of a variety of atmospheric chemical species and/or processes, as aerosol pH directly influences the chemical composition of aerosols as well as the reactivities of aerosol components.
Given the importance of aerosol acidity in secondary aerosol formation and its implications for the outbreak of the Beijing haze, many studies have assessed the acidity of aerosols in northern China using CTMs or offline thermodynamic models constrained by observed gas and/or aerosol compositions (Cheng et al., 2016; Wang et al., 2016; Liu et al., 2017; Guo et al., 2017b; Song et al., 2018; Tan et al., 2018; Ding et al., 2019; Xie et al., 2020; Shao et al., 2019; Pye et al., 2020; Shi et al., 2019; Tao et al., 2020). Such models predicted a large range of aerosol pH (∼ 3 to ∼ 7) in northern China haze events with no general consensus. For example, Cheng et al. (2016) estimated high aerosol pH values between 5.4 to 6.2 over the North China Plain (NCP) using ISORROPIA II in forward (i.e., gas- plus aerosol phase measurements as inputs) and reverse mode (i.e., only aerosol phase measurements as inputs), and Wang et al. (2016) estimated a near-neutral aerosol pH of ∼ 7 over Beijing using the same model with a stable state assumption. These two studies proposed that the high aerosol pH was driven by the neutralizing effect of high levels of ammonia over northern China, and as a result, NO2 oxidation of dissolved S(IV) was suggested to be the dominant heterogeneous sulfate formation pathway. However, not only the conclusion on the role of NO2 oxidation in sulfate production (e.g., He et al., 2018; Shao et al., 2019), but also the predicted aerosol pH during the haze events was challenged by later studies (Liu et al., 2017; Ding et al., 2019; Tan et al., 2018). In particular, Liu et al. (2017) and Guo et al. (2017b) argued that increasing NH3 does not lead to ambient aerosol pH becoming nearly neutral, and aerosols should be always acidic (pH = 4.2–4.5) over Beijing regardless of the level of ammonia using ISORROPIA II with a metastable state assumption. Furthermore, Song et al. (2018) pointed out that the high pH values estimated by ISORROPIA II in previous studies were in fact caused by code errors when the stable state assumption was applied. For winter in Beijing, Song et al. (2018) further calculated aerosol pH values of ∼ 4.6 and ∼ 4 on average using ISORROPIA II and E-AIM in forward mode, respectively, similar to the results estimated by Liu et al. (2017) and Guo et al. (2017b). Tan et al. (2018) and Ding et al. (2019) also indicated similar acidic aerosols with average pH values between 3 and 4.5 in Beijing using ISORROPIA II. Moreover, Shi et al. (2019) reported an observationally constrained aerosol pH of 3.4 ± 0.5 for Tianjin using ISORROPIA II. Using the GEOS-Chem model, Shao et al. (2019) estimated that the mean aerosol pH was 4.3 (ranged from 3.0 to 5.4) for autumn and winter in Beijing. Using the CAMQ model, Pye et al. (2020) predicted a mean aerosol pH of 4.5 ± 0.8 for February in Beijing, and an annual mean pH of 3.1 ± 1.5 for Tianjin, while Tao et al. (2020) found that the mean aerosol pH was 5.4 in NCP during January of 2013 by using WRF-Chem coupled with ISORROPIA II, which is higher than results from the aforementioned studies, except for that of Cheng et al. (2016) and Wang et al. (2016).
The WRF-Chem configured with MOSAIC is one of the most extensively used regional air quality models, and has provided insights on meteorological and physicochemical processes and mechanisms regarding air pollution issues in China (Huang et al., 2014; Chen et al., 2016; Du et al., 2020; Sha et al., 2019). Pye et al. (2020) indicated that aerosol pH predicted by WRF-Chem with the MOSAIC thermodynamic scheme is in reasonable agreement with observationally constrained pH estimates over the contiguous United States. However, the performance of WRF-Chem configured with MOSAIC on aerosol pH prediction in China remains by far rarely reported and evaluated. In this study, we use WRF-Chem configured with MOSAIC to investigate aerosol pH over China during a few haze episodes (15 October to 2 November 2014, i.e., in the preceding weeks of the Asia-Pacific Economic Cooperation summit period) when extensive observational data are available. We explore the sensitivity of the modeled aerosol pH to aerosol cation composition, aerosol phase state assumption/configuration, heterogeneous sulfate productions, etc., compare the modeled results with that estimated using offline ISORROPIA II constrained by observed and modeled gas–aerosol compositions, and discuss the spatiotemporal variability of the predicted aerosol pH over China during the study period. The results should provide insights into the predictability of aerosol pH using WRF-Chem and improve the understanding of aerosol pH variability in Beijing and other regions of China.
2.1 Model configuration
2.1.1 The WRF-Chem model
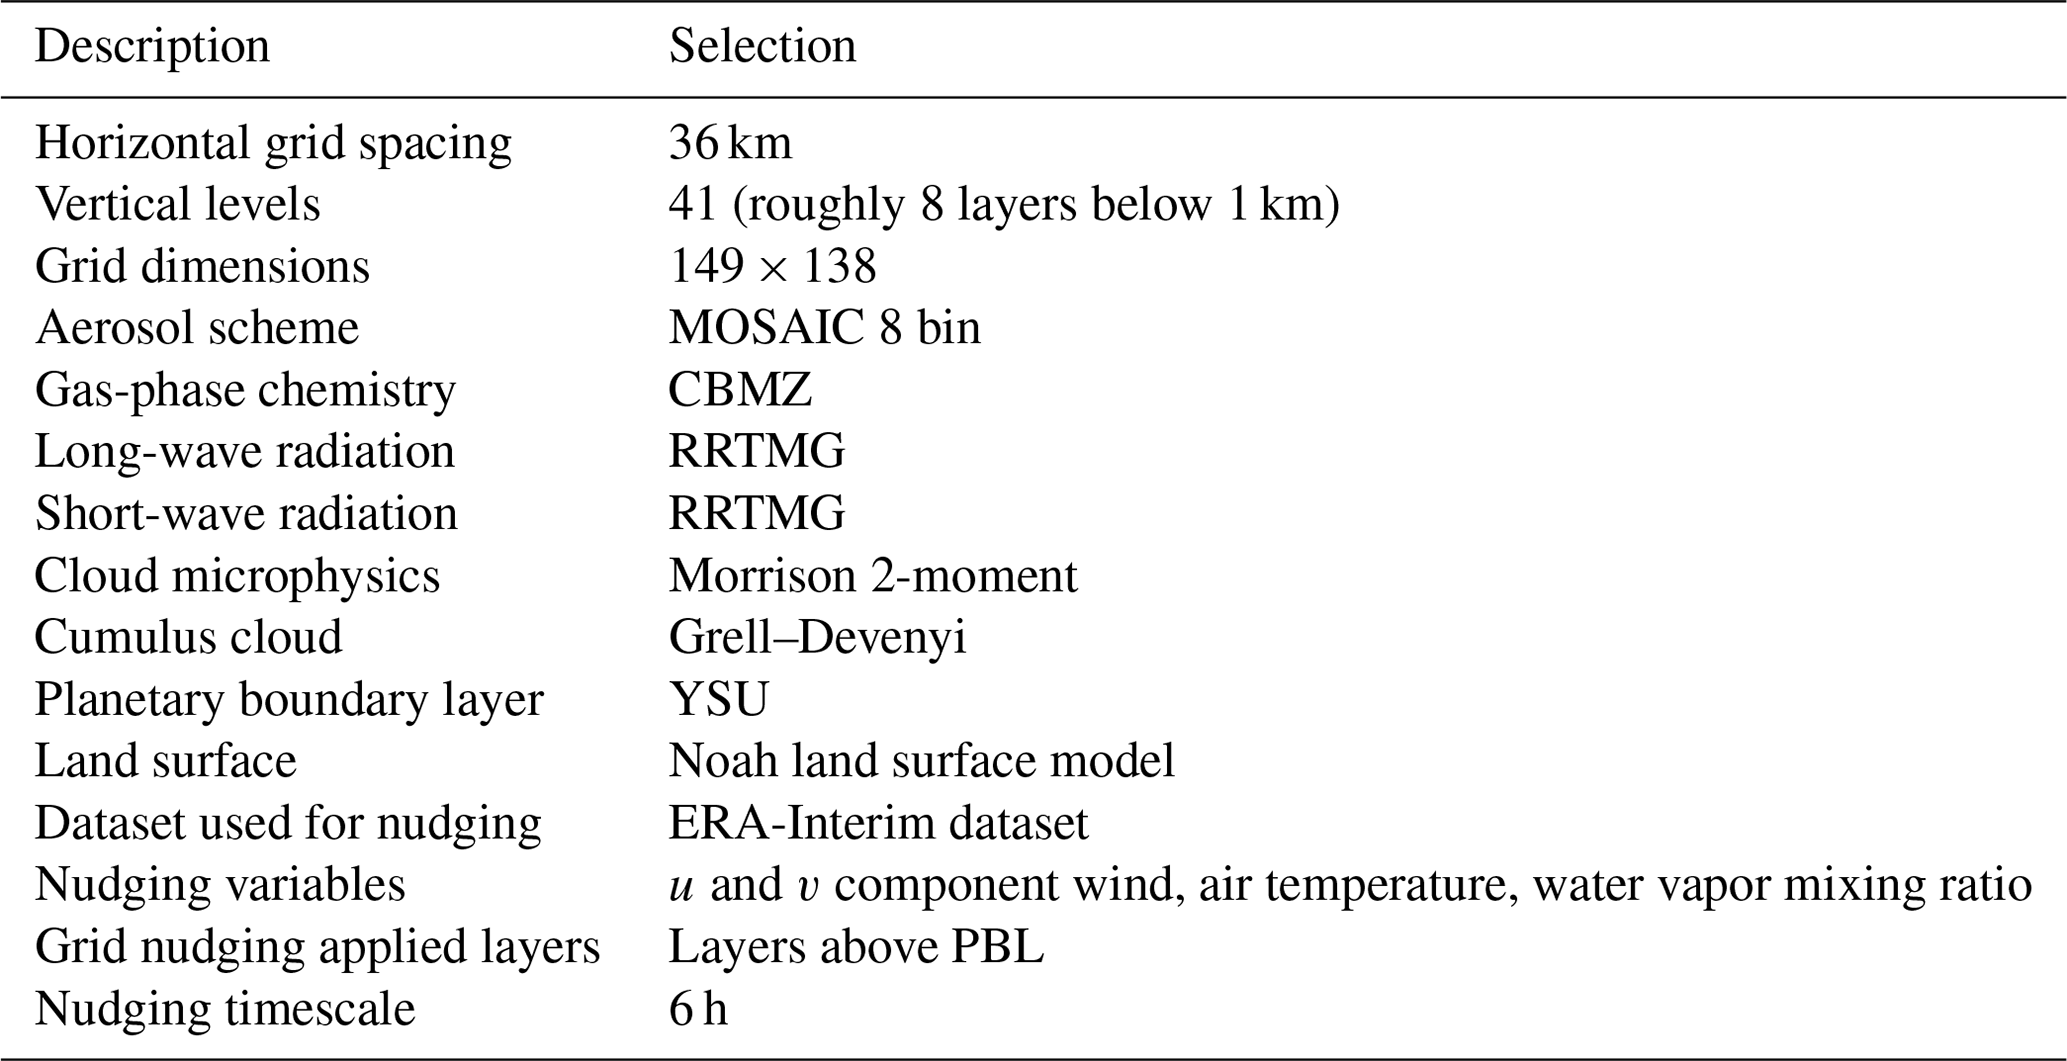
In this study, the version (v4.0) of WRF-Chem, updated by the University of Science and Technology of China (USTC version of WRF-Chem), is used. Compared to the publicly released version of WRF-Chem, the USTC version includes some additional capabilities such as contribution analysis of aerosol-related processes and improved turbulent mixing of aerosols (Zhao et al., 2013a; b; Du et al., 2020). The model configurations used in this study are summarized in Table 1. The Carbon Bond Mechanism version Z (CBMZ; Zaveri and Peters, 1999) and MOSAIC (Zaveri et al., 2008) with eight bins are used as gas-phase and aerosol chemistry modules, respectively. The Noah land surface model (Chen and Dudhia, 2001) and the Yonsei University (YSU) planetary boundary scheme (Hong et al., 2006) are used to represent land surface processes and boundary layer turbulent mixing, respectively. The Rapid Radiative Transfer Model for General Circulation (RRTMG; Iacono et al., 2008) is used to calculate the long-wave and short-wave radiations.
2.1.2 MOSAIC
MOSAIC is an aerosol model with a sectional approach to represent aerosol size distribution. It includes treatments for simulating aerosol physical and chemical processes such as nucleation, coagulation, gas–particle partitioning, and heterogeneous chemistry. The chemical species treated by MOSAIC include sulfate, nitrate, chloride, methanesulfonate, carbonate, ammonium, sodium, calcium, mineral dust, black carbon, organic mass, and liquid water. Potassium and magnesium are represented by equivalent amounts of sodium, while other unidentified inorganic species are gathered as “other inorganic mass” (OIN). The gas-phase species comprising H2SO4, MSA, HNO3, HCl, and NH3 are capable of partitioning into the particulate phase. MOSAIC consists of three submodules pertinent to the calculation of size-resolved aerosol pH as described below.
The Multicomponent Taylor Expansion Method (MTEM) is used to estimate the mean activity coefficients of various inorganic electrolytes in multicomponent solutions based on its values in pure binary solutions of all the individual electrolytes present in the solution (Zaveri et al., 2005b). The Zdanovskii–Stokes–Robinson (ZSR) mixing rule (Zdanovskii, 1948; Stokes and Robinson, 1966) is applied for the calculation of AWC. Most of the MTEM and ZSR parameters are derived from the comprehensive Pitzer–Simonson–Clegg (Pitzer and Simonson, 1986; Clegg et al., 1992) model at 298.15 K for self-consistency.
The Multicomponent Equilibrium Solver for Aerosols (MESA) (Zaveri et al., 2005a) uses a pseudo-transient continuation method to solve the solid–liquid phase equilibrium reactions expressed as pseudo-transient precipitation and dissolution reactions. The equilibrium solution is determined by integrating the resulting stiff nonlinear ordinary differential equations until the system reaches the steady state.
The Adaptive Step Time-split Euler Method (ASTEM) is a gas–particle partitioning module coupled with the thermodynamic module MESA-MTEM to solve the mass transfer equations (Zaveri et al., 2008). To reduce the stiffness, it first separates the non-volatile from semi-volatile gases in the numerical solver. For non-volatile gases (H2SO4 and MSA), ASTEM analytically integrates the condensation for all size bins, while for semi-volatile gases (HNO3, HCl and NH3), it numerically integrates condensation and evaporation for all size bins. Since the gas–particle mass transfer rates are strongly affected by the phase state of particles, different procedures are selected in ASTEM for completely solid, completely liquid, and mixed-phase particles.
In completely liquid or mixed-phase particles, the H+ ion molality (mH+) is needed for mass transfer calculations. In order to determine mH+, two domains, i.e., sulfate-rich and sulfate-poor domains, are defined by the sulfate ratio, Xt:
where C represents species concentration in liquid phase, and . In the sulfate-rich domain (i.e., Xt<2), the liquid phase tends to absorb negligible HNO3 and HCl due to the high acidity, thereby suppressing the oscillation behavior of H+ concentration during numerical integration. In this case, the equilibrium mH+ is calculated by explicitly solving the partial dissociation of the bisulfate ion together with the electroneutrality equation (Zaveri et al., 2005b). In the sulfate-poor domain (i.e., Xt≥2), the use of equilibrium mH+ will cause oscillations in the numerical solution associated with the condensation and/or evaporation of HNO3, HCl, and NH3. Therefore, a new concept of dynamic mH+ was introduced, which is a function of equilibrium constants, mass transfer coefficients, and the gas- and particle-phase concentrations of all the related species (Zaveri et al., 2008). In this approach, the surface equilibrium equations and acid–base coupled condensation approximation are solved simultaneously to determine the dynamic mH+ in each size bin.
2.2 pH calculation
The pH is defined as the negative logarithm of the hydrogen ion activity in an aqueous solution, following the recommendation by the International Union of Pure and Applied Chemistry (IUPAC):
where is the activity of hydrogen ion in aqueous solution on a molality basis, is the hydrogen ion activity coefficient (in this study assumed to be unity), and is the hydrogen ion molality in particle liquid water (mole kg−1, moles of H+ ions per kg of solvent). As MOSAIC outputs size-resolved hydrogen ion molality, the pH of PM2.5 in the model was calculated using the following equation:
where (mole kg−1) is the hydrogen ion molality in size bin i, and Wi (kg m−3) is AWC in that particular size bin. There are six size bins for PM2.5.
2.3 Experimental design
In this study, simulations are performed at 36 km horizontal resolution with 138 (west–east) × 149 (south–north) grid cells covering the entire China as shown in Fig. S1 in the Supplement. The simulation period is from 15 October to 2 November 2014 with the first 3 d used as model spin-up. This period is chosen because severe haze events occurred in Beijing, and extensive observational data are available to constrain the model and evaluate the results. Initial and lateral boundary conditions for meteorological variables are derived from reanalysis data of the European Centre for Medium-Range Weather Forecasts (ECMWF) with a 0.703∘ × ∼ 0.702∘ horizontal resolution that are updated every 6 h (ERA-Interim dataset). The modeled u and v component wind, air temperature, and water vapor mixing ratio at layers above the planetary boundary layer (PBL) are nudged towards the reanalysis data with a 6 h timescale (Stauffer and Seaman, 1990; Seaman et al., 1995). The modeled winds at 850 hPa and temperature at 2 m are compared with the ERA5 reanalysis data (Fig. S2), which show that the model can reproduce these basic meteorological fields with the spatial correlation coefficient of 0.98 and 0.99, respectively. The chemical initial and boundary conditions are provided by a quasi-global WRF-Chem simulation configured as described in Zhao et al. (2013a). Anthropogenic emissions are obtained from the Multi-resolution Emission Inventory for China (MEIC) at a 0.1∘ × 0.1∘ horizontal resolution for the year 2015 (M. Li et al., 2017; R. Li et al., 2017). For emissions outside of China, the Hemispheric Transport of Air Pollution version-2 (HTAPv2) at a 0.1∘ × 0.1∘ horizontal resolution for the year 2010 is used (Janssens-Maenhout et al., 2015). The Goddard Chemistry Aerosol Radiation and Transport (GOCART) dust emission scheme (Ginoux et al., 2001) is used to simulate natural dust emission fluxes, and the emitted dust particles are distributed into MOSAIC aerosol size bins based on the physics of scale-invariant fragmentation of brittle materials derived by Kok (2011). More details about the dust emission scheme coupled with the MOSAIC aerosol scheme in WRF-Chem can be found in Zhao et al. (2010, 2013a). It is worth noting that dust and OIN are treated as two separate aerosol species in the USTC version of WRF-Chem.
All experiments conducted are listed in Table 2. In addition to a default WRF-Chem simulation (referred to as the ORIG scenario), we conduct simulations to investigate the sensitivities of the modeled pH to variables including aerosol concentrations of NVCs (e.g., Na+, K+, Ca2+, and Mg2+), semi-volatile species (e.g., ammonia and chloride), as well as aerosol phase state assumptions and heterogeneous sulfate production. These sensitivity experiments are named CTL1, CTL2, CTL3, CTL3meta, CTL3het_NoIs, and CTL3het_Is, respectively.
Table 2Numerical experiments conducted in this study.
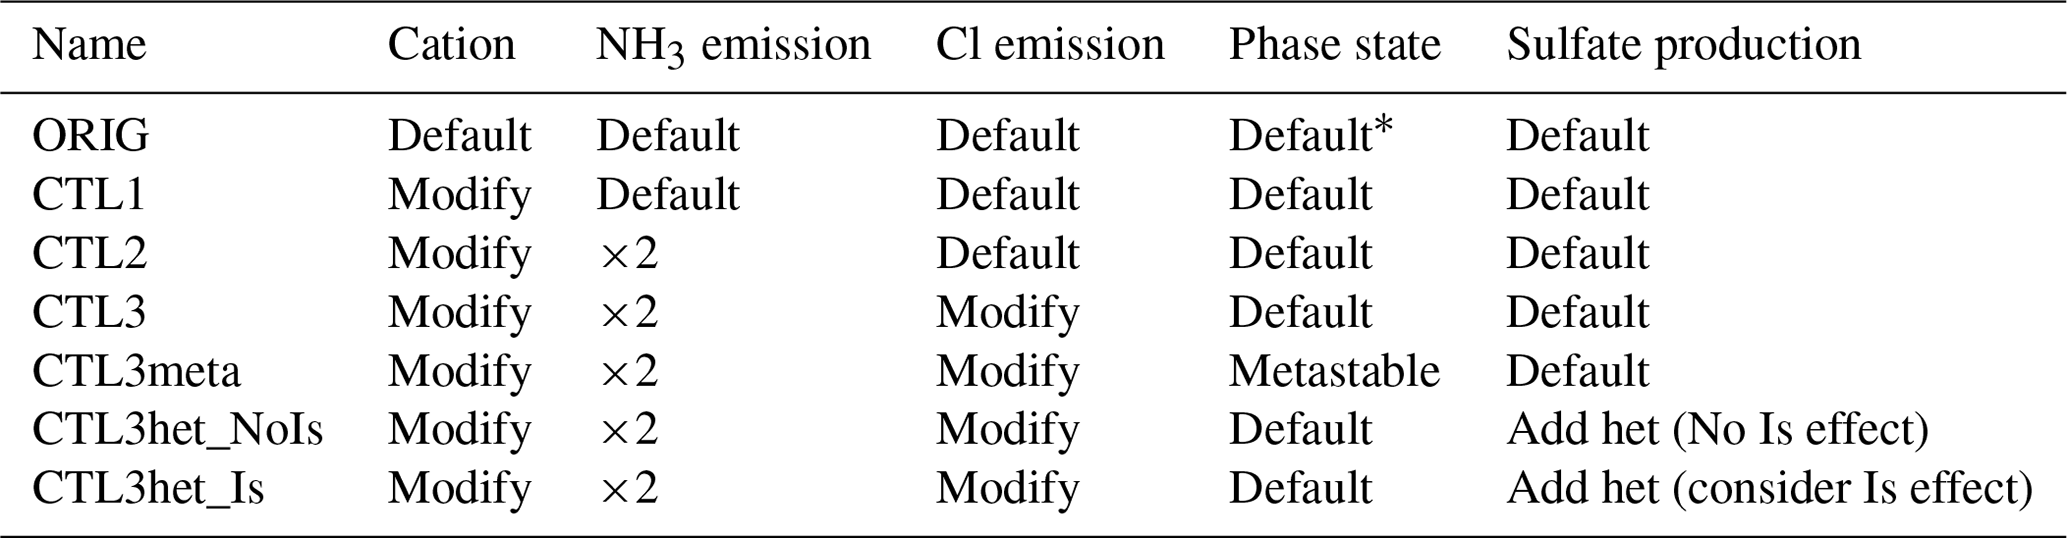
* By default, in MOSAIC a flag called “hysteresis water content” (Whyst) is transported to determine whether the particles are on the stable or metastable branch.
The NVCs can strongly modulate aerosol acidity (Vasilakos et al., 2018; Kakavas et al., 2021). However, the ORIG simulation significantly underestimates NVC concentrations as compared with observations (Fig. S3a–b). Note that Mg2+ and K+ are not included in the model but are regarded as charge-equivalent Na+, therefore the simulated Na+ is compared to the observed sum of Na+, K+, and Mg2+, while simulated Ca2+ is directly compared with the observed Ca2+. As seen in Fig. S3a and b, Ca2+ and Na+ are significantly underestimated in the ORIG simulation by ∼ 96.8 % and ∼ 97.6 %, respectively, because in the ORIG simulation, the only source of Ca2+ is scaled to dust emissions with a mass fraction of 1.2 % and Na+ is only from sea-salt emissions. These results suggest missing cation emission sources in the model, which could lead to an underestimation in pH. The CTL1 experiment is thus conducted with modified cation speciation profiles constrained by observations. To better match the observed NVC concentrations, we set the mass of Ca2+ to 7.5 % of dust and 10 % of OIN, Mg2+ was 0.8 % of dust, and Na+ and K+ from OIN were 13 % and 5 %, respectively. As a result, the simulated NVCs become more consistent with the observations, with a normalized mean bias (NMB) ≤ ± 5 %.
Ammonia is one of the most important atmospheric alkaline species. It is also considered to be a dominant factor causing higher aerosol pH in China than in the United States (Guo et al., 2017b; Ding et al., 2019). Previous studies indicated that NH3 may be underestimated in current bottom-up emission inventories and using MEIC underestimated NH3 emissions by about 40 % for northern China (Zhang et al., 2018; Wang et al., 2018; Kong et al., 2019). In experiment CTL2, the NH3 emissions are multiplied by 2, and the others are the same as CTL1. Figure S3c indicates that the modeled Cl− concentration is almost zero in the ORIG simulation because there is only a sea-salt source of chloride and anthropogenic chloride emissions are not included. In addition to the CTL2 simulation, we conduct a chloride sensitivity simulation (i.e., CTL3) with additional emissions for chloride (assuming a 15 % mass contribution from OIN) to improve the model prediction of aerosol chloride concentrations compared with observations. Spatial distributions of emissions of NVCs, NH3, and Cl− from default configuration and its corresponding sensitivity experiment can be found in Fig. S4.
The ambient aerosol phase state is uncertain and difficult to constrain experimentally or theoretically due to difficulties in obtaining the efflorescence relative humidity (RH) for multicomponent salts. In general, aerosol can be treated as being in a metastable or stable state, where metastable means the aerosol solution is supersaturated and stable means crystallization of salts could occur once the solution reaches saturation. In MOSAIC, a flag called “hysteresis water content” (Whyst) is transported to determine whether the particles at a grid point are on the stable or metastable branch of the hysteresis curve. This is the default phase state determination method in WRF-Chem. To explore the effect of phase state determinations on the predicted aerosol pH, we perform CTL3meta simulation in addition to CTL3 in which the aerosol phase is fixed as metastable.
Aerosol pH can also be influenced by heterogeneous sulfate production which is the main acid component of aerosol (Tilgner et al., 2021). We incorporate heterogeneous S(IV) oxidations of aerosol water into the MOSAIC chemical mechanism using the same reaction parameterizations in Shao et al. (2019). The incorporated heterogeneous reactions include reactions of dissolved S(IV) with H2O2, O3, NO2, and O2 catalyzed by transition metal ions (Table S1). Under this circumstance, we also test the effects of ionic strength on aerosol pH prediction as it influences heterogeneous sulfate production (Cheng et al., 2016; Liu et al., 2020). These two further simulations in addition to CTL3 are denoted as CTL3het_NoIs and CTL3het_Is. The latter explicitly involves the effects of ionic strength on H2O2 and TMI-catalyzed S(IV) oxidations. In particular, for heterogeneous S(IV) oxidations, the first-order rate constant (k, s−1) for the loss of gaseous species on aerosols is calculated by Jacobs (2000) as follows:
where Rp is the radius of aerosol (cm), Dg is the gas-phase molecular diffusion coefficient (cm2 s−1), ν is the mean molecular speed (cm s−1), γ is the uptake coefficient of SO2 on aerosols (dimensionless), and Sp is the aerosol surface area per unit volume of air (cm2 cm−3). The parameter γ is obtained for each heterogeneous pathway using a similar method to that of Shao et al. (2019):
where α is the mass accommodation coefficient (dimensionless), K∗ is the effective Henry's law constant (M atm−1), R is the universal gas constant (L atm mol−1 K−1), T is air temperature (K), Da is the aqueous phase molecular diffusion coefficient (cm2 s−1), Kchem is the first-order chemical loss rate constant in the liquid phase (s−1), and f(q) is given by
2.4 Observations
The ground observations of inorganic components of PM2.5 (SO, NO, NH, Ca2+, K+, Na+, Mg2+, Cl−) as well as the observed temperature and RH data are obtained from the Haze Observation Project Especially for Jing–Jin–Ji Area (HOPE-J3A) field campaign located at the campus of the University of the Chinese Academy of Sciences (40.41∘ N, 116.68∘ E, around 20 m from the ground), which is around 60 km northeast of downtown Beijing (He et al., 2018; Yang et al., 2018; Chen et al., 2015; Zhang et al., 2017). The aerosol composition data are used to evaluate the model's prediction on NVCs and Cl−, and these data along with the observed temperature and RH are further used as inputs to calculate PM2.5 pH using the ISORROPIA II model (in the forward mode and metastable state). As gaseous NH3 and HNO3 observations are not available, we use aerosol NO only as NO3 input and estimated gaseous NH3 values using the empirical equation [NH3] (nmol mol−1) = 0.34 × [NOx] (nmol mol−1) + 0.63 following He et al. (2018). In order to assess the effects of uncertainties in NH3 concentration on aerosol pH predictions, we also run ISORROPIA II with ± 10 % fluctuations in NH3 concentration and find that little changes (i.e., +0.03 and −0.04 pH unit) can be induced. The ISORROPIA II model results are treated as observational constrained PM2.5 pH and are compared with that from the WRF-Chem simulations.
3.1 Spatial variability of simulated PM2.5 pH
Figure 1 shows the spatial distribution of the WRF-Chem predicted surface PM2.5 pH over China averaged from 18 October to 2 November 2014 under the ORIG simulation configuration and a set of sensitivity experiments as listed in Table 2. The PM2.5 pH is calculated by using weighted average AWC as described in Sect. 2.2. The whole area of China is divided into six subregions (Fig. 1a) including the Taklimakan Desert (TD), the Gobi Desert (GD), the Northeast Plain (NEP), the North China Plain (NCP), the Yangtze River plain (YR) and South China (SC) to review the spatial variability of the modeled pH.
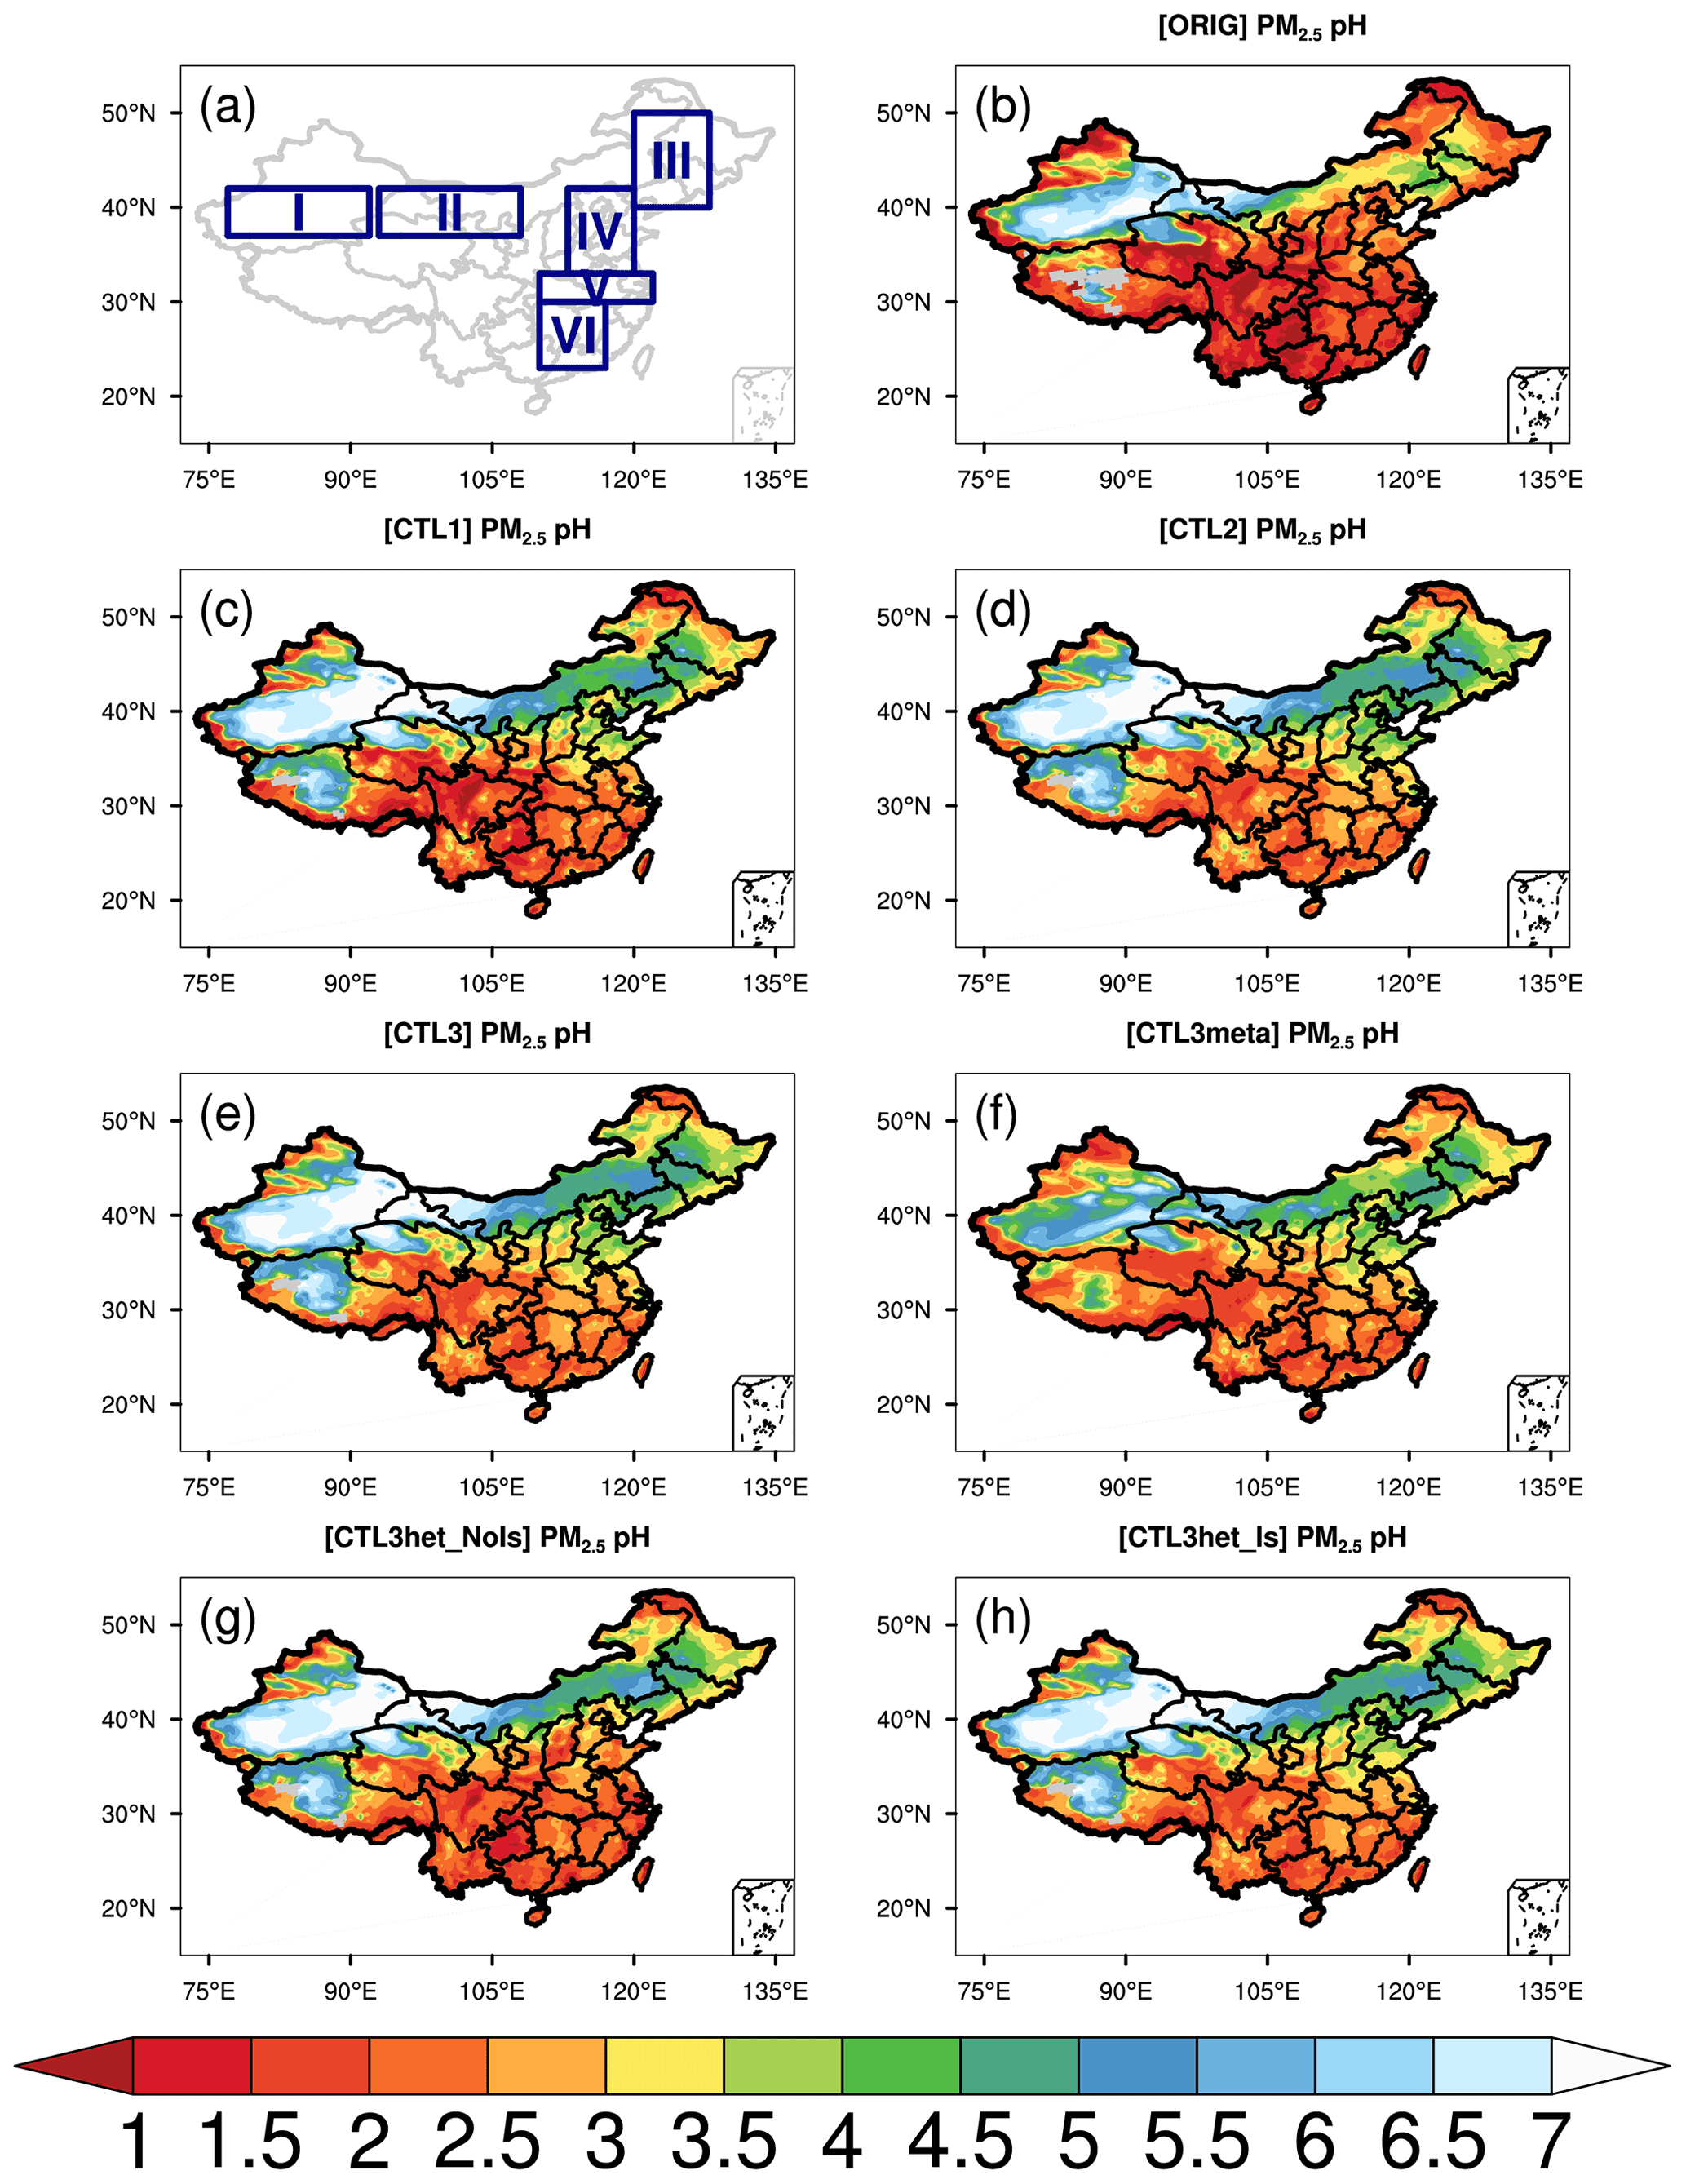
Figure 1(a) Six subregions. (b–h) Spatial distributions of mean surface PM2.5 pH (liquid water content (LWC) weighted average pH) during the study period of 15 October–2 November 2014 predicted by (b) ORIG, (c) CTL1, (d) CTL2, (e) CTL3, (f) CTL3meta, (g) CTL3het_NoIs, and (h) CTL3het_Is. “I” in (a) represents the Taklimakan Desert (TD), “II” represents the Gobi Desert (GD), “III” represents the Northeast Plain (NEP), “IV” represents the North China Plain (NCP), “V” represents the middle and lower reaches of Yangtze River plain (YR), and “VI” represents South China (SC).
In ORIG simulation (Fig. 1b), WRF-Chem predicts PM2.5 pH with distinct spatial patterns, spanning ∼ 0–7 pH units over China. The highest mean PM2.5 pH is predicted over GD (4.2 ± 2.2) and TD (5.7 ± 1.4), where NVCs (e.g., Ca2+) from mineral dust is abundant, and the predicted pH is consistent with CMAQ and GEOS-Chem simulations of fine-mode aerosol pH (approximately 4–6) downwind of the deserts (Pye et al., 2020). Notably, the PM2.5 pH shows a declined trend from the north towards the south, with mean pH values over NEP, NCP, YR, and SC being 3.0 ± 0.8, 2.3 ± 0.4, 1.7 ± 0.4, and 1.7 ± 0.3, respectively. Though the spatial features of PM2.5 pH predicted by the default WRF-Chem model are similar to those from other chemical transport models (e.g., Shao et al., 2019; Pye et al., 2020), WRF-Chem generally tends to predict lower aerosol pH (0.8–3.6) over most regions of southern and central China compared to other studies (1.3–5). For example, WRF-Chem predicts an averaged PM2.5 pH of 2.3 ± 1.3 for Beijing during the modeling period, which is 1–2 pH units lower than those reported by other studies using the offline ISORROPIA II model constrained by observed aerosol and/or gas compositions (∼ 3–4.5) for autumn and winter in Beijing (Tan et al., 2018; Song et al., 2018; He et al., 2018), and ∼ 2 units lower than the GEOS-Chem predictions within the same period (Shao et al., 2019). The WRF-Chem model's predicted PM2.5 pH of ∼ 2.2 in Tianjing is also lower than the values reported by Shi et al. (2019), who estimated the pH of PM2.5 in Tianjing as ∼ 3.4 using ISORROPIA II and ∼ 3.1 using CMAQ. For the southern city, Guangzhou, WRF-Chem predicts the pH of PM2.5 is ∼ 1.2 ± 1.0, lower than the estimate from Jia et al. (2018) (∼ 2.5–2.8), who reported values for July and used different models (ISORROPIA II, E-AIM IV, and AIOMFAC).
To show the effects of the above-mentioned influencing factors on the predicted PM2.5 pH, the differences in PM2.5 pH between sensitivity runs are displayed in Fig. 2. Compared to the ORIG run, the modeled PM2.5 pH in the CTL1 run shows a ubiquitous increase all over China owing to the increased concentrations of NVCs in PM2.5 (Fig. 2a). In particular, the PM2.5 pH changes are more prominent over the NEP and NCP regions, where PM2.5 pH increases by more than 0.9 pH units on average (Fig. S5). For regions near the deserts, i.e., GD and TD, PM2.5 pH are increased by 0.8 and 0.7 pH units, respectively. In comparison, relatively small increases (∼ 0.7 and ∼ 0.5) in PM2.5 pH are noted over YR and SC where aerosol is relatively acidic in the ORIG run (Fig. S5).
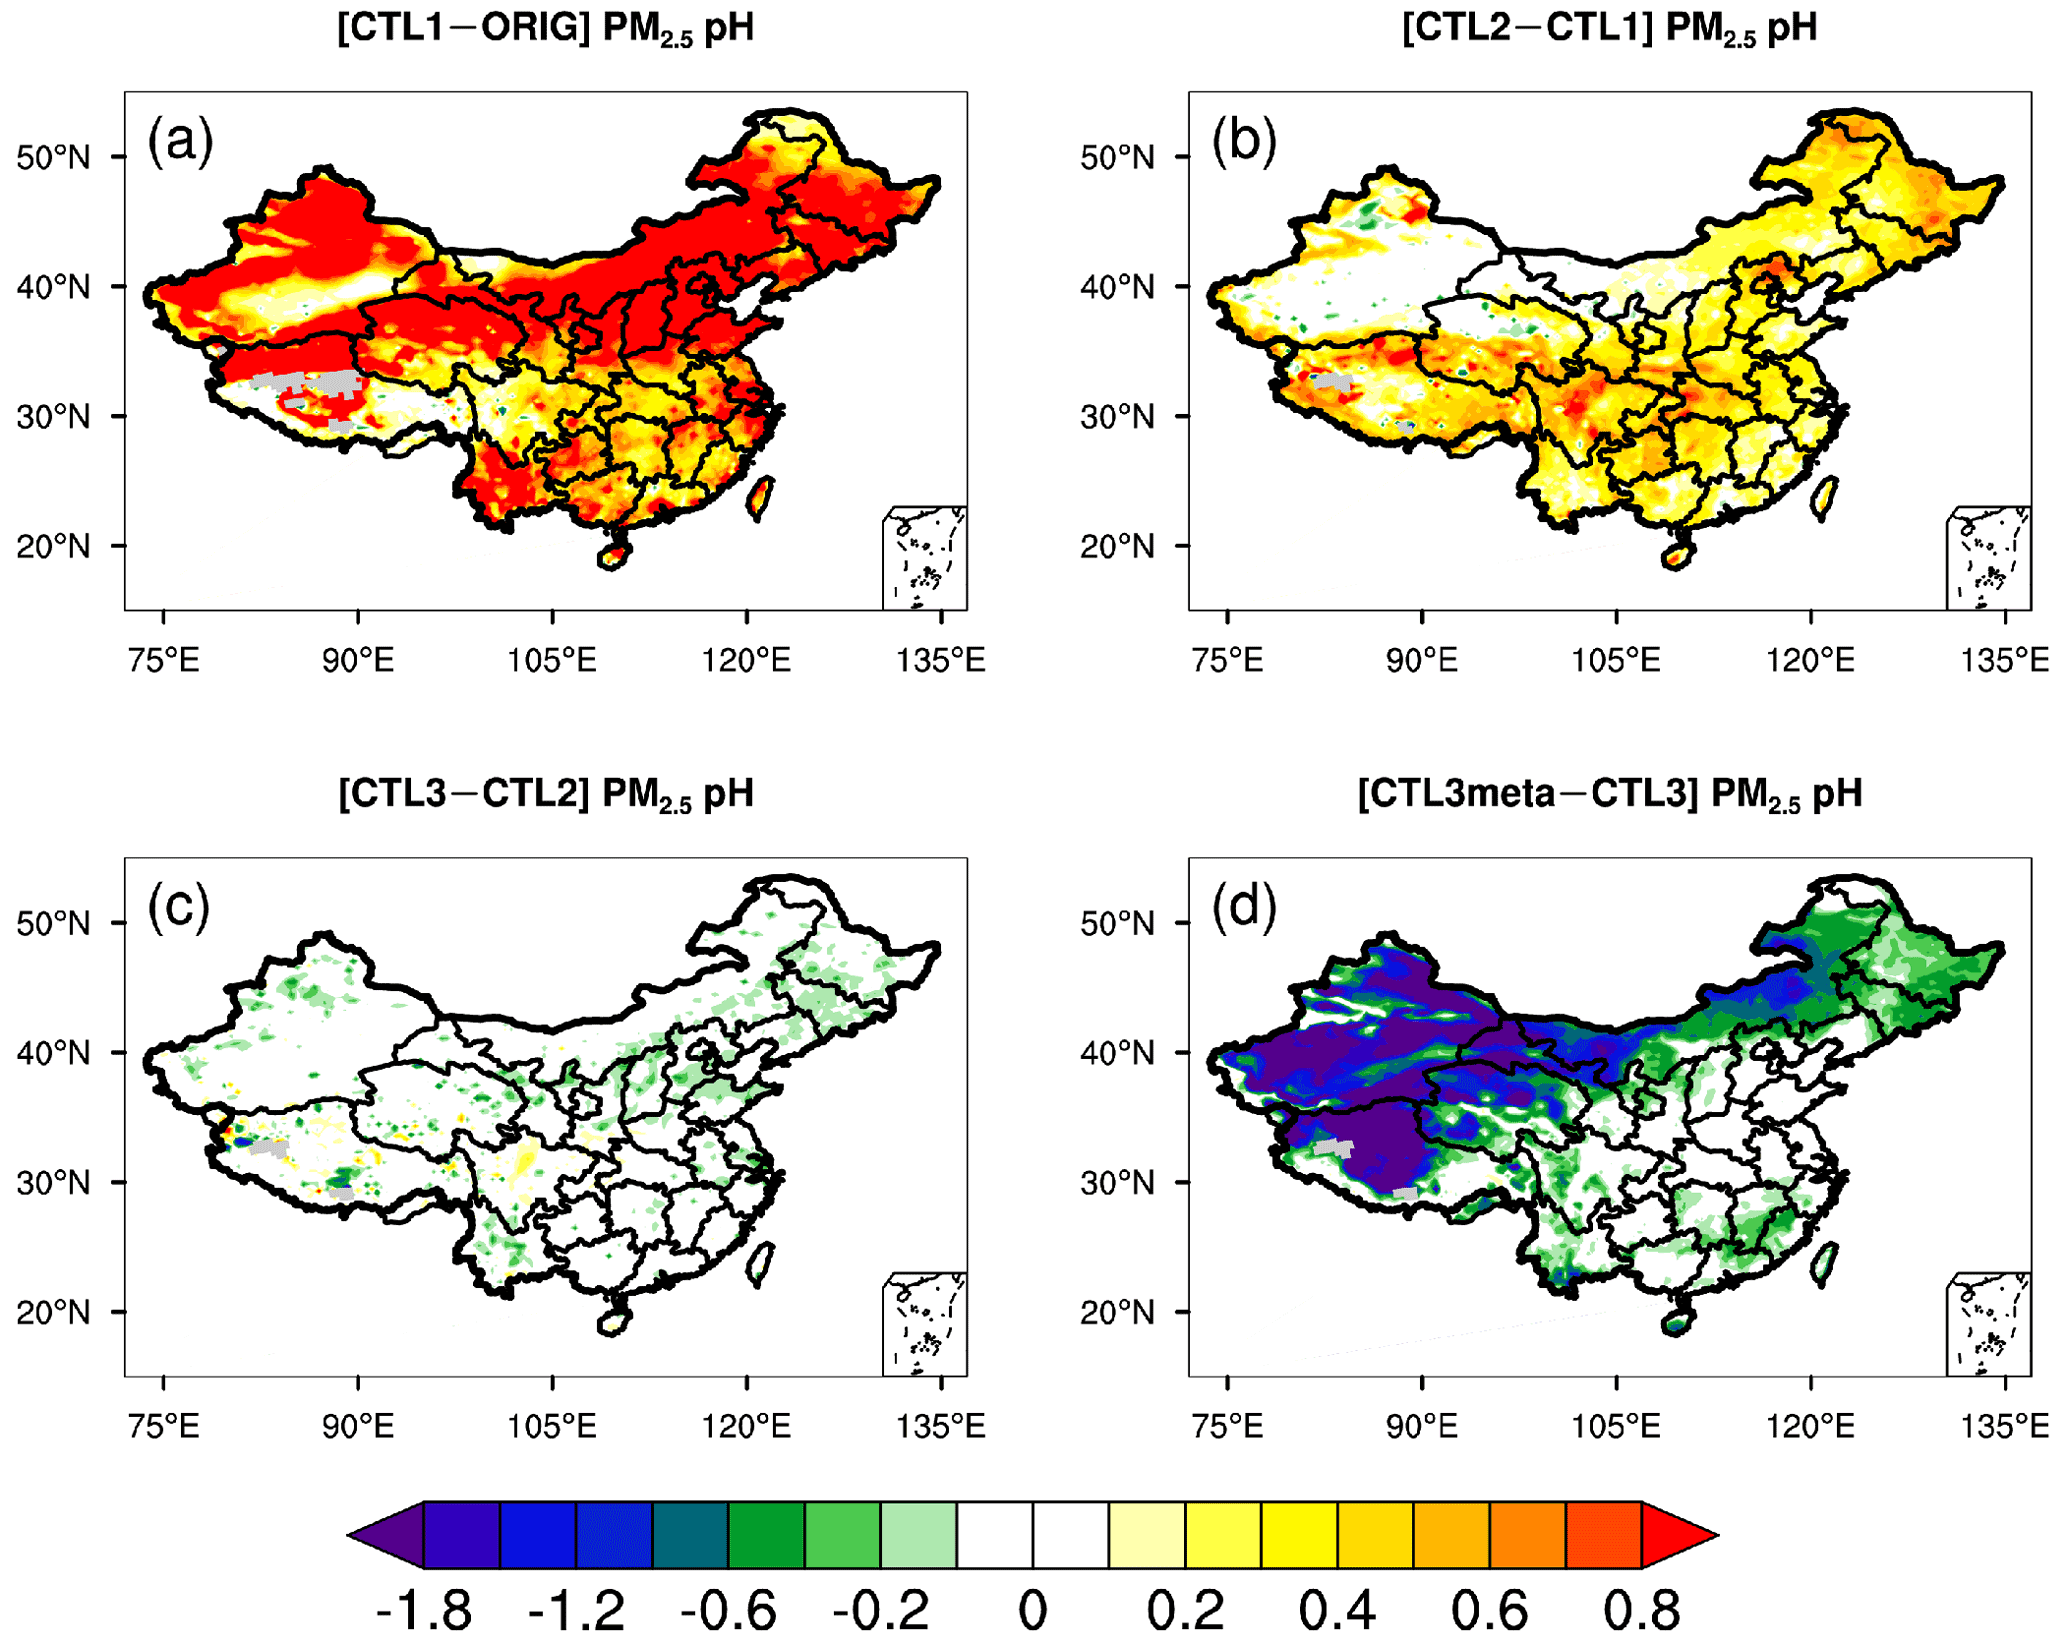
Figure 2Spatial distributions of the difference in mean surface PM2.5 pH during the study period of 15 October–2 November 2014 between (a) CTL1 and ORIG scenarios, (b) CTL2 and CTL1 scenarios, (c) CTL3 and CTL2 scenarios, and (d) CTL3meta and CTL3 scenarios.
When NH3 emissions are doubled (CTL2 scenario), the predicted PM2.5 pH displays diverse degrees of elevation (Fig. 2b), increases by 0.2–0.8 for most areas of China, except for TD and GD where pH stays nearly constant (Figs. 2b and S5). The rise in mean PM2.5 pH is comparable (0.3–0.4) among NEP, NCP, YR, and SC. Additionally, minimal values of PM2.5 pH show slight increases (0.2–0.6) while the maximum values remain almost unchanged (Fig. S5).
For the CTL3 scenario that includes extra chloride emissions, the predicted PM2.5 pH indicates negligible decreases compared to CTL2 (Fig. 2c), similar to the findings of Tao et al. (2020). Due to the low sensitivity of simulated aerosol pH to Cl− concentration, the result of the CTL3 scenario and the potential effect of Cl− is not discussed further. However, it is noteworthy that WRF-Chem underestimates Cl− concentrations compared to the observations (Fig. S3c). In addition, Cl− is the precursor of reactive chloride species (e.g., Cl, ClNO2, HOCl) that are important in atmospheric oxidation capacity (X. Wang et al., 2019, 2020). For example, reactive chloride not only influences ozone and HOx concentrations, but also directly participates in atmospheric nitrate and sulfate production as oxidants (X. Wang et al., 2019, 2020). Recent studies (Gunthe et al., 2021; Chen et al., 2022) found that chloride is also important in the aerosol water uptake, playing an important role in the development of severe haze events. Therefore, future research should be devoted to the development of anthropogenic and natural chloride emissions to improve the prediction.
With regard to the CTL3meta scenario which specifies the aerosol to be in a metastable state indiscriminately, significant decreases (∼ 1.2–1.8) in PM2.5 pH compared to CTL3 are predicted over northwestern China and Tibet while the changes are smaller elsewhere (Fig. 2d). In particular, PM2.5 pH decreases by ∼ 1.9 for TD and ∼ 1.1 for GD, reducing aerosol pH values to 4.8 and 4.0, respectively, whereas the metastable state assumption has little impact on the predicted PM2.5 pH in the NCP, YR, and SC regions.
In the CTL3het_NoIs scenario, more sulfate production (in addition to CTL3) results in a noticeable decrease of PM2.5 pH over eastern and central China (Fig. 3a) where gas precursors (e.g., SO2) from anthropogenic emissions are high (Fig. S6). The largest decrease in the predicted mean PM2.5 pH occurs in NCP, by about 0.9 pH unit, compared with that of 0.7 pH unit in YR, 0.3 pH unit in SC, and 0.2 pH unit in NEP (Fig. S5). However, PM2.5 pH changes become negligible in TD and GD, which may be attributed to their low SO2 emissions and low abundance of AWC that limit the local heterogeneous production of sulfate. The PM2.5 pH changes in the CTL3het_Is scenario display spatial patterns similar to that of the CTL3het_NoIs scenario, but with a smaller degree of decreases in PM2.5 pH (Fig. 3b).
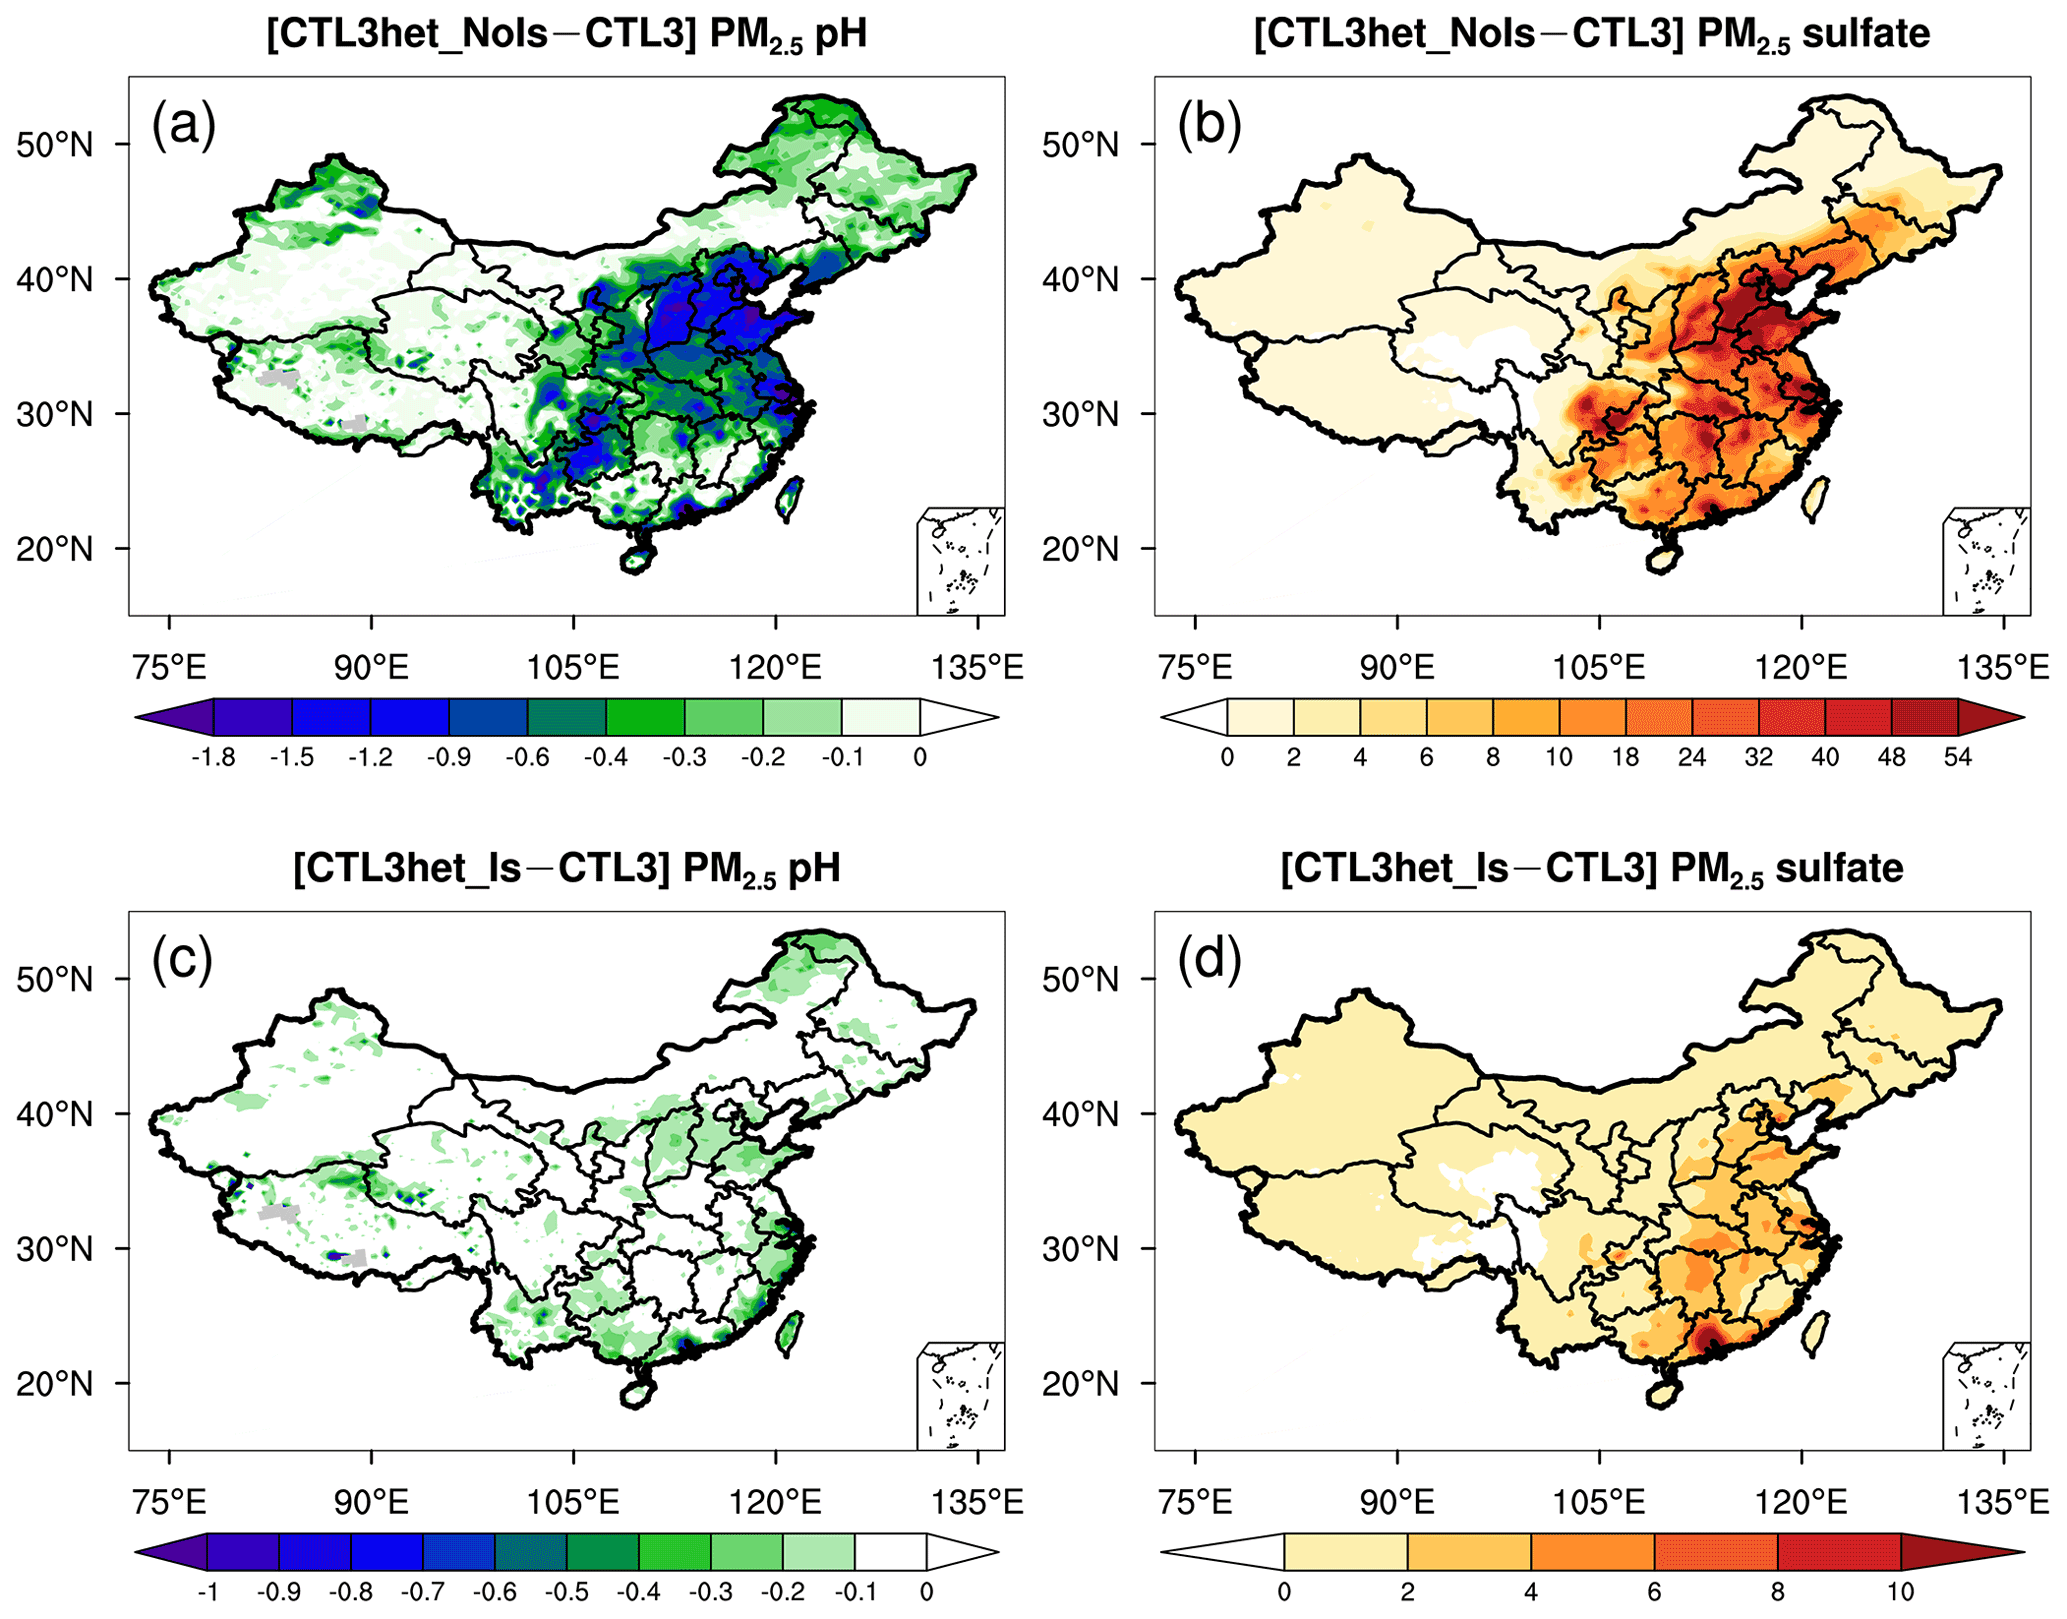
Figure 3Spatial distributions of the difference in mean surface (a, c) PM2.5 pH and (b, d) PM2.5 sulfate (µg m−3) between CTL3het_NoIs and CTL3 scenarios (top panels) and CTL3het_Is and CTL3 scenarios (bottom panels) during the study period of 15 October–2 November 2014. Different scales are used.
3.2 Temporal variation of PM2.5 pH in haze events
During the study period, several haze episodes occurred over Beijing, and there were several complete evolution cycles of pollution levels from very clean to severely polluted conditions. Over this period, time slots are referred to as “clean”, “light pollution”, “moderate pollution”, and “heavy pollution” days, according to different levels of PM2.5 mass concentrations of 0–75, 75–115, 115–150, and > 150 µg m−3, respectively. To further investigate the evolution of PM2.5 pH during a haze cycle, time series of the predicted PM2.5 pH values over Beijing during the study period are shown in Fig. 4. The average values and ranges of PM2.5 pH during the entire period, as well as the pollution levels are also listed in Table S2.
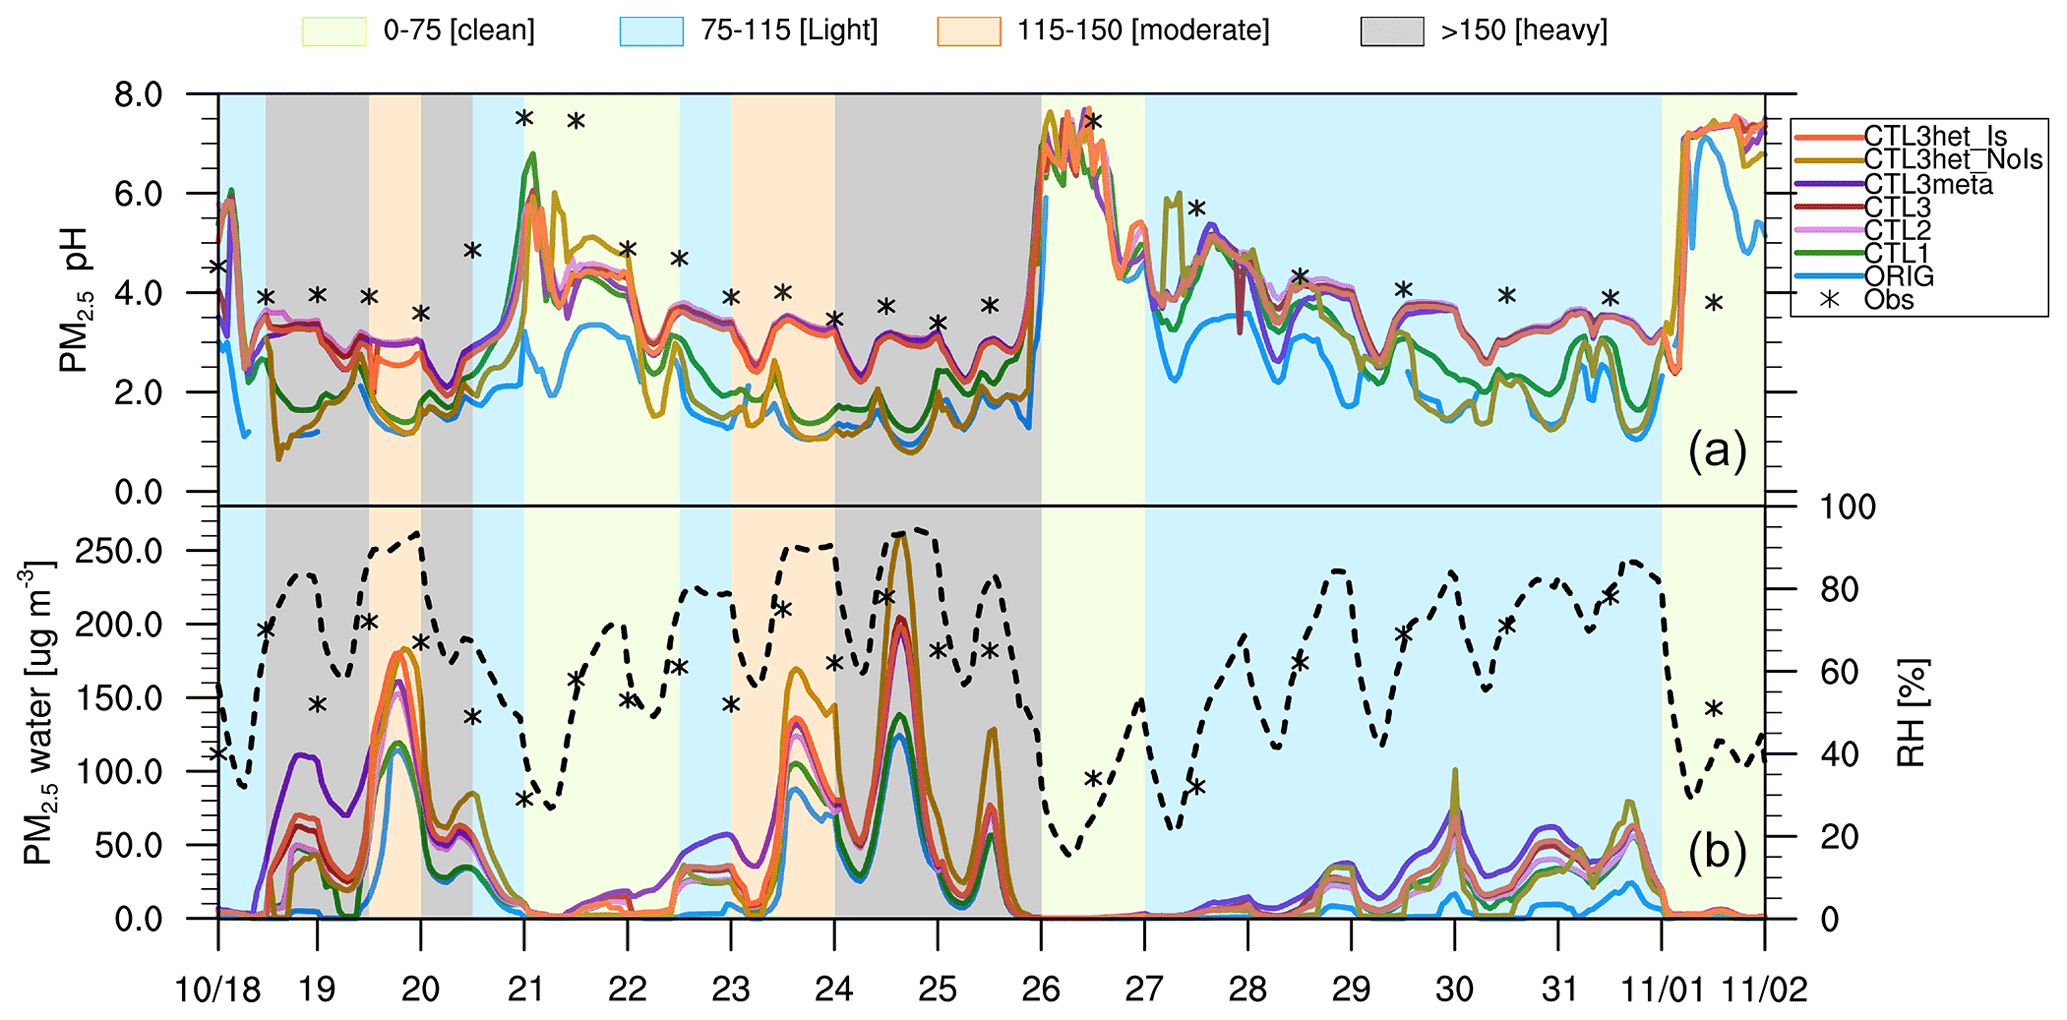
Figure 4Time series of (top panel) surface PM2.5 pH, and (bottom panel) PM2.5 water contents (µg m−3) (left y axis) predicted by all WRF-Chem scenarios at the Beijing site during the study period of 15 October–2 November 2014, and relative humidity (RH, %) (right y axis, dashed black line) are derived from the ORIG scenario. ISORROPIA II-calculated pH values constrained by observations as well as the observed RH are shown as black star markers, with each value corresponding to a PM2.5 sample (12 h or 24 h). Shaded areas represent four different pollution levels (green-clean; blue-light; orange-moderate; gray-heavy).
All the simulation results exhibit large but similar temporal variations in PM2.5 pH during the study period, typically covering extreme acidic (< 2) to alkaline (> 7) pH levels (Fig. 4). As shown in Table S2, the largest pH range (0.6–7.6) is predicted by the CTL3het_NoIs scenario, and the smallest pH range, fluctuating between 2.1 and 7.5, is found in the CTL2 scenario. The simulated pH from other scenarios varies by approximately 6 pH units. The large variations of PM2.5 pH during haze episodes are consistent with the results from other studies. For example, He et al. (2018) utilized ISORROPIA II to estimate PM2.5 pH during the Beijing winter haze and found a similarly large pH range of 3.4–7.6 when assuming a metastable aerosol state. Gao et al. (2020) calculated aerosol pH in Tianjin using ISORROPIA II and reported that the PM2.5 pH ranged from −0.08 to 13.75, in which pH varied more severely.
Similar temporal patterns of PM2.5 pH are found in all scenarios, i.e., aerosols become more acidic at higher PM2.5 levels (Fig. 4 and Table S2). During the clean period, PM2.5 pH spans a wide range, with maximum pH values above 7 and minimum pH values below 2 (for ORIG, CTL1, CTL3het_NoIs) and below 2.5 (but above 2, for CTL2, CTL3, CTL3meta, CTL3het_Is). For the light pollution period, PM2.5 pH exhibits a similar range as in the clean period, but with a lower mean value. However, under moderate and heavy pollution conditions, PM2.5 pH is concentrated in a narrow range, varying within 1.5 pH units and with the most acidic aerosols (with mean pH values mostly between 1.5 and 3). These findings are consistent with those of Ding et al. (2019), who employed ISORROPIA II to calculate PM2.5 pH in Beijing for the four seasons and found that the highest PM2.5 pH appeared on clean days ranging from 2 to 7, followed by polluted and heavily polluted days for all seasons except winter. The analysis in Gao et al. (2020) also showed that the range of pH was more confined with aggravation of air pollution.
In Fig. 4, we also plot the offline model results of PM2.5 pH (termed as pH-obs) from ISORROPIA II (forward mode and metastable state) constrained by observed PM2.5 compositions, temperature, and RH. The observed PM2.5 compositions are in coarse resolution (12 h or 24 h) so that the pH-obs results are also 12 h or 24 h averages. As shown in Fig. 4, pH-obs in general varies similarly to those predicted by WRF-Chem, but with higher absolute values. The ORIG scenario shows the maximum deviation (up to 2.2 pH units on average) from pH-obs. With the modifications of NVCs and NH3 emissions, the CTL2 scenario efficiently improves the discrepancies between WRF-Chem predictions and pH-obs (the mean bias is reduced from 2.2 pH units to 0.6). Similar discrepancies (∼ 0.8 pH units) are found within the CTL3meta and CTL3het_Is scenarios. The differences between other scenarios (i.e., CTL3 and CTL3het_NoIs) and pH-obs are larger than 1.2 pH units.
In addition, the responses of the predicted PM2.5 pH to varying influencing factors at different pollution levels differ. When NVCs are increased, the aerosol pH increases by 0.9 on average with the largest increase occurring during clean periods. This is likely because of the higher fraction of NVCs from primary aerosol in addition to the insufficient neutralization by acid species due to their low concentrations from secondary formation compared to polluted periods. In contrast, when NH3 emissions are doubled, the aerosol pH increase is smaller (0.4 pH units) compared to the CTL1 simulation, which can be explained by the higher original pH and the semi-volatile nature of NH3. With higher NH3 emissions, the simulated pH increases more during more polluted periods. This is because aerosol pH is lower under more polluted conditions, which promotes more NH3 shifting to aerosol phase to consume H+, leading to increases in pH. Both increasing Cl− emission (CTL3 scenario) and changing phase state assumption (CTL3meta scenario) lead to negligible effects on pH in Beijing during all periods. For the two additional scenarios that incorporate heterogeneous S(IV) reactions, when considering ionic strength effects (CTL3het_Is scenario), little changes in the predicted PM2.5 pH are seen, but more pronounced changes are seen when ionic strength effects are not taken into account (CTL3het_NoIs scenario). The latter case leads to the decreases in pH by 0.7 and 1.3 units for moderate and heavy pollution periods, respectively, due to the increased heterogeneous production of sulfate. The AWC generally tracks the pattern of RH, with the lowest water amount appearing during clean periods. Among all scenarios, ORIG predicts the lowest AWC. A high abundance of AWC is seen in CTL3meta since the metastable assumption normally predicts a higher amount of water. The increased concentrations of sulfate in CTL3het_NoIs would enhance aerosol water uptake, resulting in more AWC. A detailed discussion of the correlation of AWC and pH during the haze cycle can be found in Sect. 4.2.
Overall, the modeled PM2.5 pH over China by all experiments displays a clear spatial pattern, being more acidic in southern China but nearly neutral in northwestern China. This spatial pattern is mainly controlled by dust emissions from the desert regions in northwestern China. In addition, the PM2.5 pH appears to be the most sensitive to the abundance of alkaline species (i.e., NVCs and NH3). For NCP, where severe and frequent haze events occur, PM2.5 pH is very sensitive to the magnitude of heterogeneous sulfate production; while for the TD and GD regions, the phase state assumption appears to be important. In the discussions that follow, we first analyze the sensitivity of PM2.5 pH to factors such as NVCs and NH3 emissions, and then focus on the evolution of PM2.5 pH in a haze development cycle in Beijing.
4.1 Sensitivity of the PM2.5 pH spatial variability to influencing factors
4.1.1 The influence of NVCs
Aerosol composition (e.g., shifting in the relative fractions of anions versus cations) is known to influence its pH (Tao and Murphy, 2019; Lawal et al., 2018; Ding et al., 2019). The NVCs are the alkaline components of aerosol which can neutralize sulfuric acid irreversibly and impact aerosol water amount through their effects on aerosol composition and regulate aerosol hygroscopicity, influencing aerosol pH both directly and indirectly (Guo et al., 2018a; Vasilakos et al., 2018; Kakavas et al., 2021).
Compared to the ORIG simulation, CTL1 predicts higher PM2.5 pH almost everywhere with varying degrees as illustrated in Sect. 3.1. This is mainly due to the increased aerosol NVCs. However, in areas with high NVC emissions (e.g., TD, GD; Fig. S4b), the increase in pH is not prominent (Fig. 2a), probably because in such regions the acidic species are already neutralized by NVCs which are alkaline. In Fig. 5a, we plot the changes in PM2.5 pH in response to the changed aerosol NVCs as a function of the pH values from the ORIG simulation. The data are categorized in six subregions as indicated in Fig. 1a. As shown in Fig. 5a, the response of PM2.5 pH to elevated NVCs displays a saddle-shaped curve. In all, for regions with moderate acidic aerosol pH (e.g., in NEP, pH = ∼ 3–4) predicted by ORIG, their pH increase the most in response to elevated NVCs, indicating a large sensitivity of the aerosol pH to NVCs. While for regions with very acidic (e.g., in SC, pH ≤ ∼ 1) or nearly neutral (e.g., in the central part of GD) aerosol pH, the response to elevated NVCs are minimal. This saddle-shaped curve response can be explained as follows: for aerosols with nearly neutral pH, they already contain high abundance of alkaline species (i.e., NVCs and/or ammonium), and the addition of NVCs will not change their NVCs significantly. Moreover, the addition of NVCs may facilitate NH3 partitioning to the gas-phase, lowering pH. Further, carbonate could play a buffering role in preventing aerosol pH values from becoming too high. As a result, few to no changes in pH should be expected. On the other hand, for very acidic aerosols with PM2.5 pH < 2, the amounts of NVC increase cannot reduce H+ effectively due to excessive acids which may partition more to the aerosol phase to neutralize NVCs, and thus only exert a small influence on aerosol pH. However, for aerosols in intermediate pH ranges, there are neither sufficient acidic species to neutralize the elevated alkaline NVCs, nor enough NVCs to buffer the added amount so that the response is large. This effect is the largest for aerosols with pH values around 3.
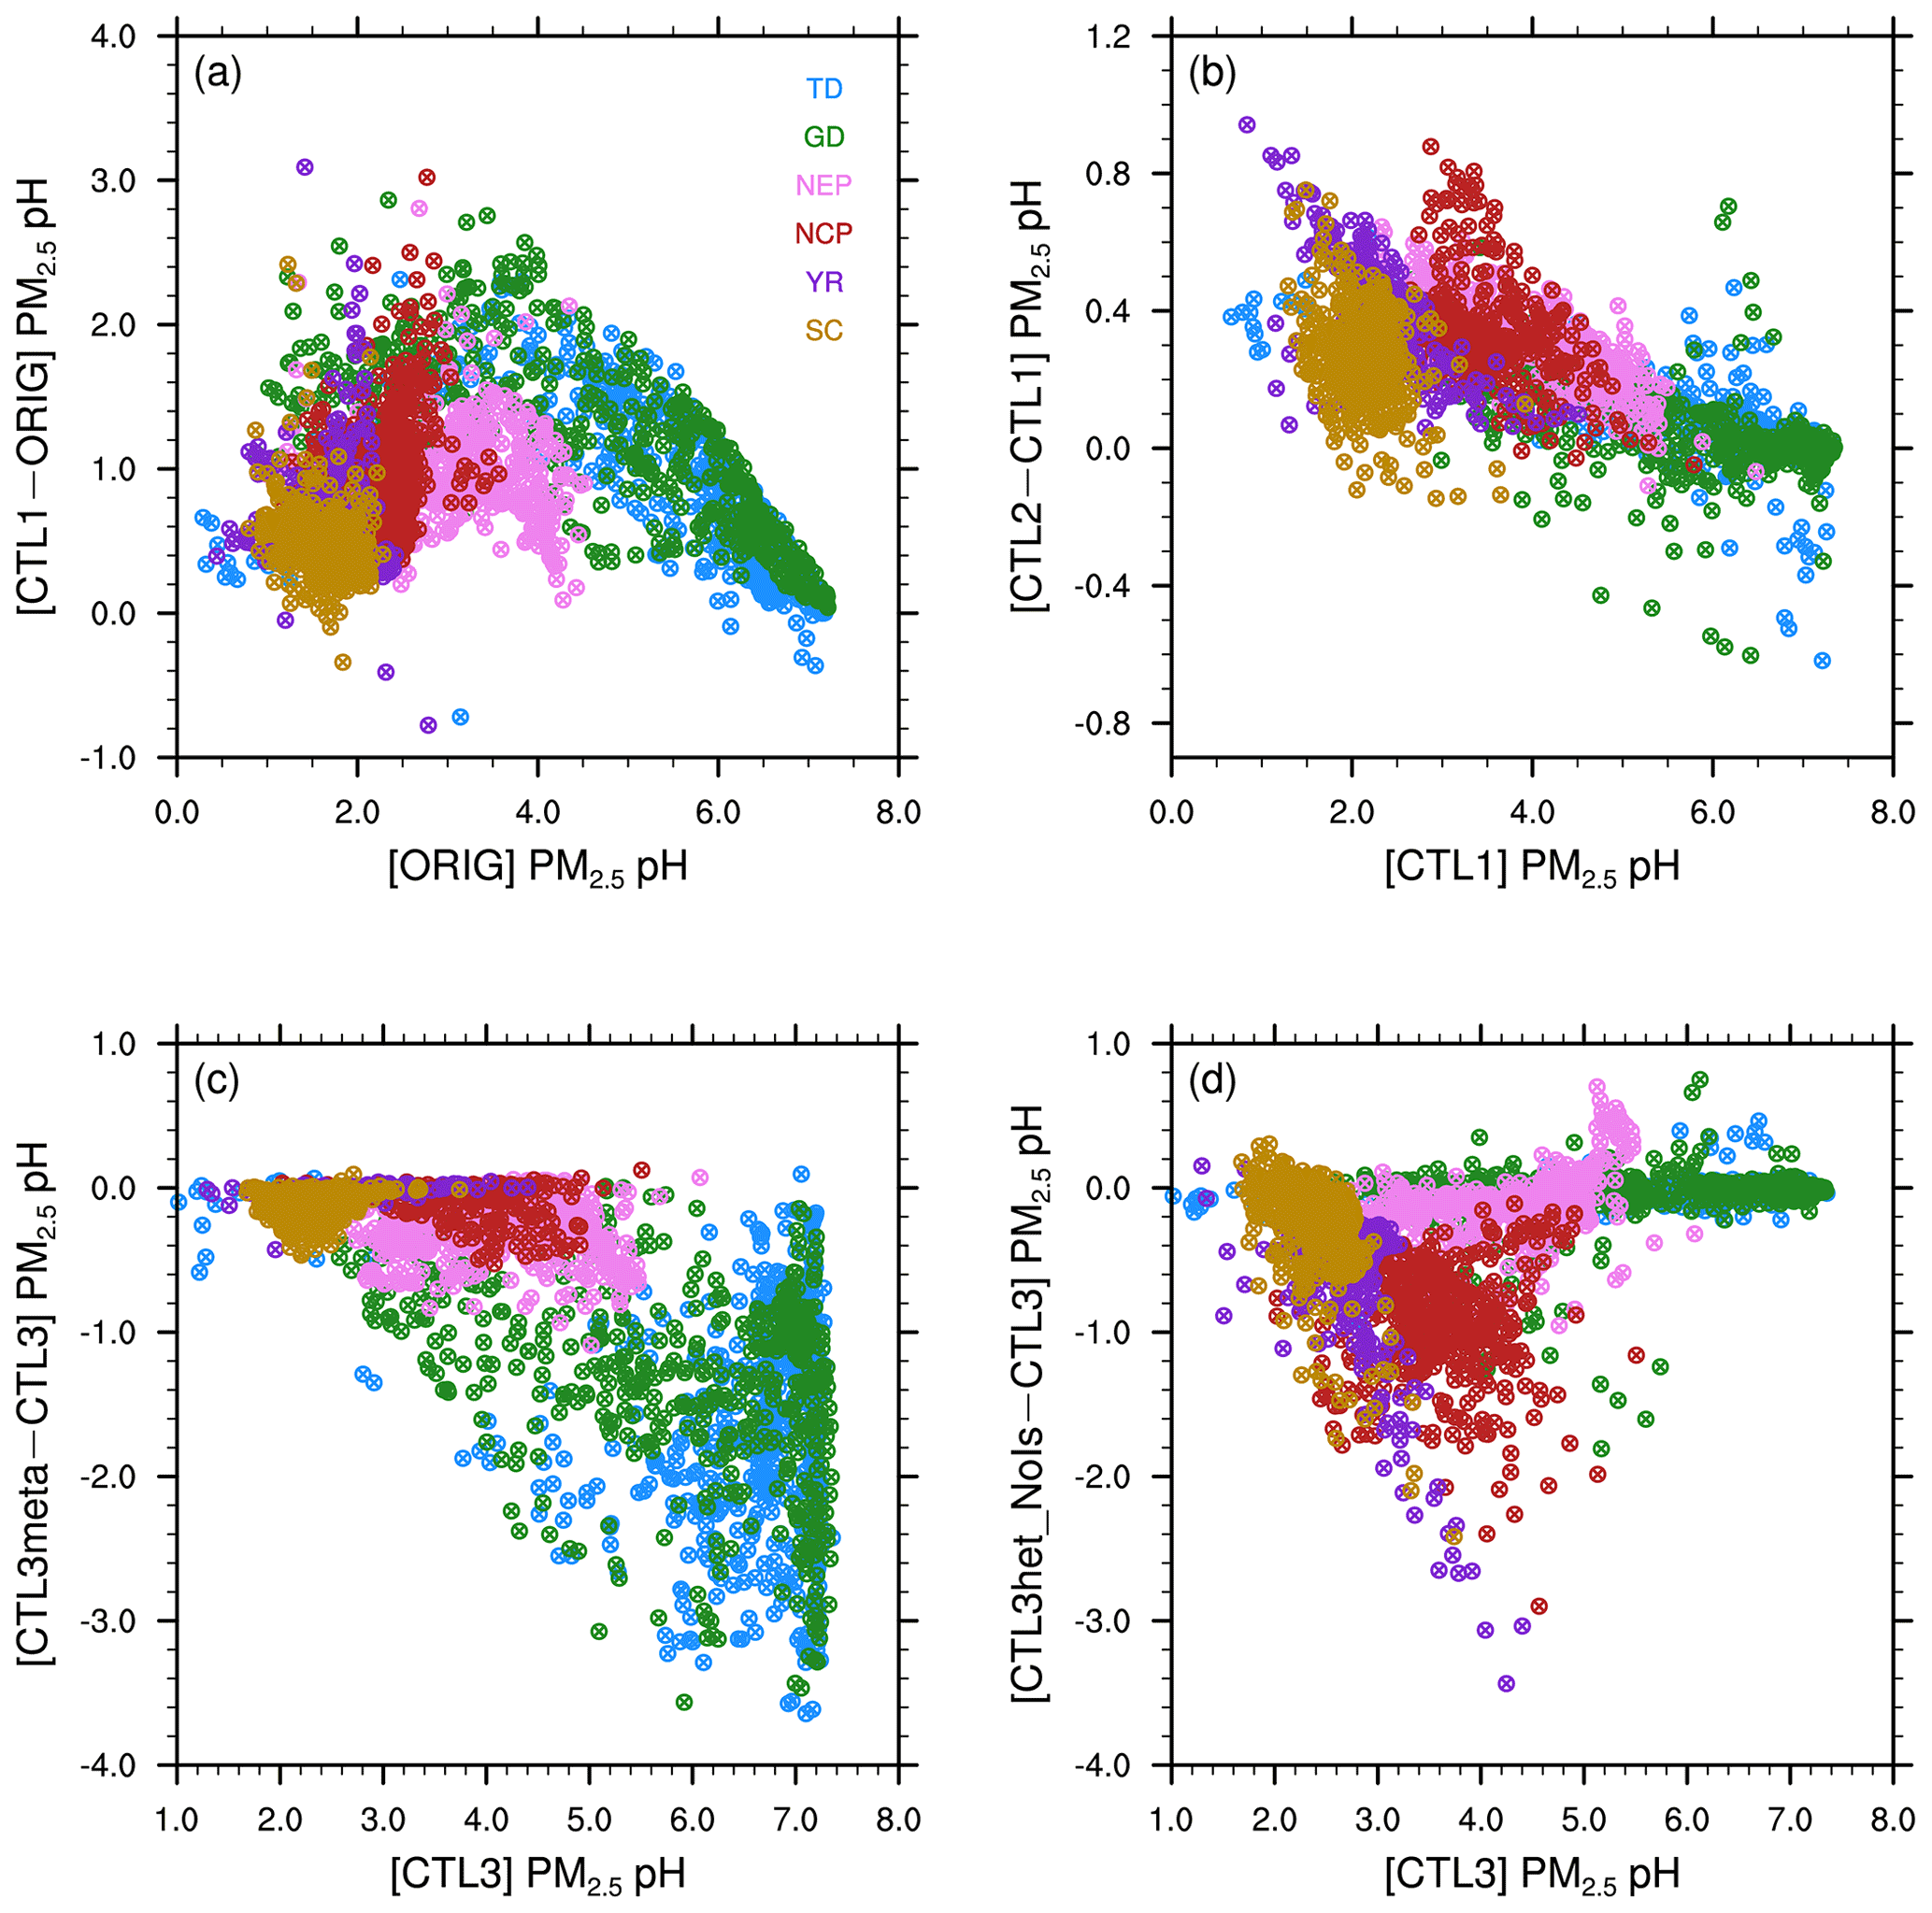
Figure 5Scatterplots of the surface PM2.5 pH differences between (a) CTL1 and ORIG scenarios, (b) CTL2 and CTL1 scenarios, (c) CTL3meta and CTL3 scenarios, (d) CTL3het_NoIs and CTL3 scenarios vs. the corresponding original pH, separated by regions. Different scales are used.
It is also noteworthy that, in this study the modified NVC emission profiles are only constrained by observations in Beijing (located in the center of NCP) for the purpose of a sensitivity test. This may be one of the reasons why the responses of PM2.5 pH to elevated NVCs are the most in NCP and NEP which are closely located and influenced by the same dust emission sources. Nevertheless, a more accurate NVC emission inventory needs to be addressed in future model developments, considering the sensitivity of the modeled pH to the abundance of aerosol NVCs.
4.1.2 Sensitivity to NH3 emissions
In addition to Ca2+ and Na+ (i.e., the NVCs) abundances, NH3 is also an important alkaline component and plays an essential role in aerosol pH by neutralizing acidic components (H2SO4 and HNO3) to form particulate sulfate and nitrate and thus driving NH3 towards to the particle phase (S. Wang et al., 2020; Zheng et al., 2020; Zhang et al., 2021). After doubling NH3 emissions, the response in PM2.5 pH is not as large as that to NVCs. This is somewhat expected. Compared to NH3, NVCs can also neutralize acidic components but with a greater preference due to their low volatility. As a result, in regions close to the dust sources (i.e., in the northwest) or affected by dust outflows, the relatively high pH and sufficient NVCs (Fig. S4b) tend to prevent the partitioning of NH3 to aerosols, leading to limited response in PM2.5 pH to NH3 variation. As shown in Fig. 2b, in TD and GD, PM2.5 pH are increased negligibly and even somewhat decreased; while for regions with relatively low aerosol pH (e.g., NCP, YR), more NH3 can be partitioned to the aerosol phase to consume H+, increasing pH. This is clearly seen in Fig. 5b where increases in PM2.5 pH due to elevated NH3 emissions are larger for more acidic aerosols. These results agree well with previous studies which have shown that pH responds nonlinearly to the changes in NH3 emissions (S. Wang et al., 2020; Ding et al., 2019; Liu et al., 2017).
4.1.3 Sensitivity to aerosol phase state assumption
In chemical transport models, the history of the phase state of atmospheric aerosols cannot be easily tracked as aerosols move and mix quickly between different grid points due to turbulent transport (Zaveri et al., 2008). For this reason, it is challenging for models to determine whether the mixed aerosols follow the efflorescence branch (i.e., metastable state) or the deliquesced branch (i.e., stable state). When aerosols with different hydration histories and phase states mix together, the resulting particles in a given size bin must all be placed on either the stable or metastable branch of the hysteresis curve since the aerosol size distribution at a grid point is represented by a single set of size bins. In MOSAIC, the phase state of particles in different size bins can be different because the model determines whether the particles in a given size bin are on the stable or metastable branch using the Whyst parameter (Zaveri et al., 2008). In comparison, many previous studies investigated aerosol pH during the Beijing haze events by assuming that the aerosols are in metastable states, which is regarded as a reasonable assumption for high RH (> 50 %) conditions (Liu et al., 2017; Guo et al., 2017b, 2018b; Ding et al., 2019). ISORROPIA II, adopted in some CTMs (e.g., GEOS-Chem, CMAQ), also applies the metastable state assumption (Shao et al., 2019).
As shown in Figs. 5c and 2d, after fixing aerosol phase to the metastable state, the response (decrease) of the modeled PM2.5 pH is larger for regions with aerosols that are less acidic, especially for GD, TD, and central Tibet. In general, these are regions with low RH (Fig. 6). The RH is known to affect AWC, and thus the phase state of aerosols. Karydis et al. (2021) reported similar findings in their modeling study, i.e., the metastable assumption caused a pH decrease (∼ 2 pH units on average) over the regions with low RH and high crustal species. To explore the effects of the phase states on the predicted PM2.5 pH, we plot the pH of aerosols in each size bin (bin 01–bin 06 with increasing particle diameters from 0.039 to 2.5 µm) from the CTL3 and CTL3meta runs in Fig. 7. The first impression after reviewing Fig. 7 is that the modeled decreases in PM2.5 pH in CTL3meta are mainly caused by changes in the first four size bins. Notably, in the CTL3 run, aerosols in these bins (01–04) in GD, TD, and central Tibet are determined to be mostly solid (i.e., no liquid water thus no pH exists) due to low RH. However, in the CTL3meta run when the metastable state is assumed, these aerosols are calculated to have a very small amount of water (Fig. S7), and thus the pH values are very low. As shown in Fig. 5c, the small changes in water content could lead to a wide fluctuation in pH. We select one area (denoted by the blue box in Fig. 7) in the pH-decreasing regions to discuss the characteristics in detail. Further analyses of the aerosol components in these size bins in that area (Table S3) indicate that they are high in sulfate but low in NVCs, suggesting sulfate-rich particles that are in general highly acidic (Zaveri et al., 2008).
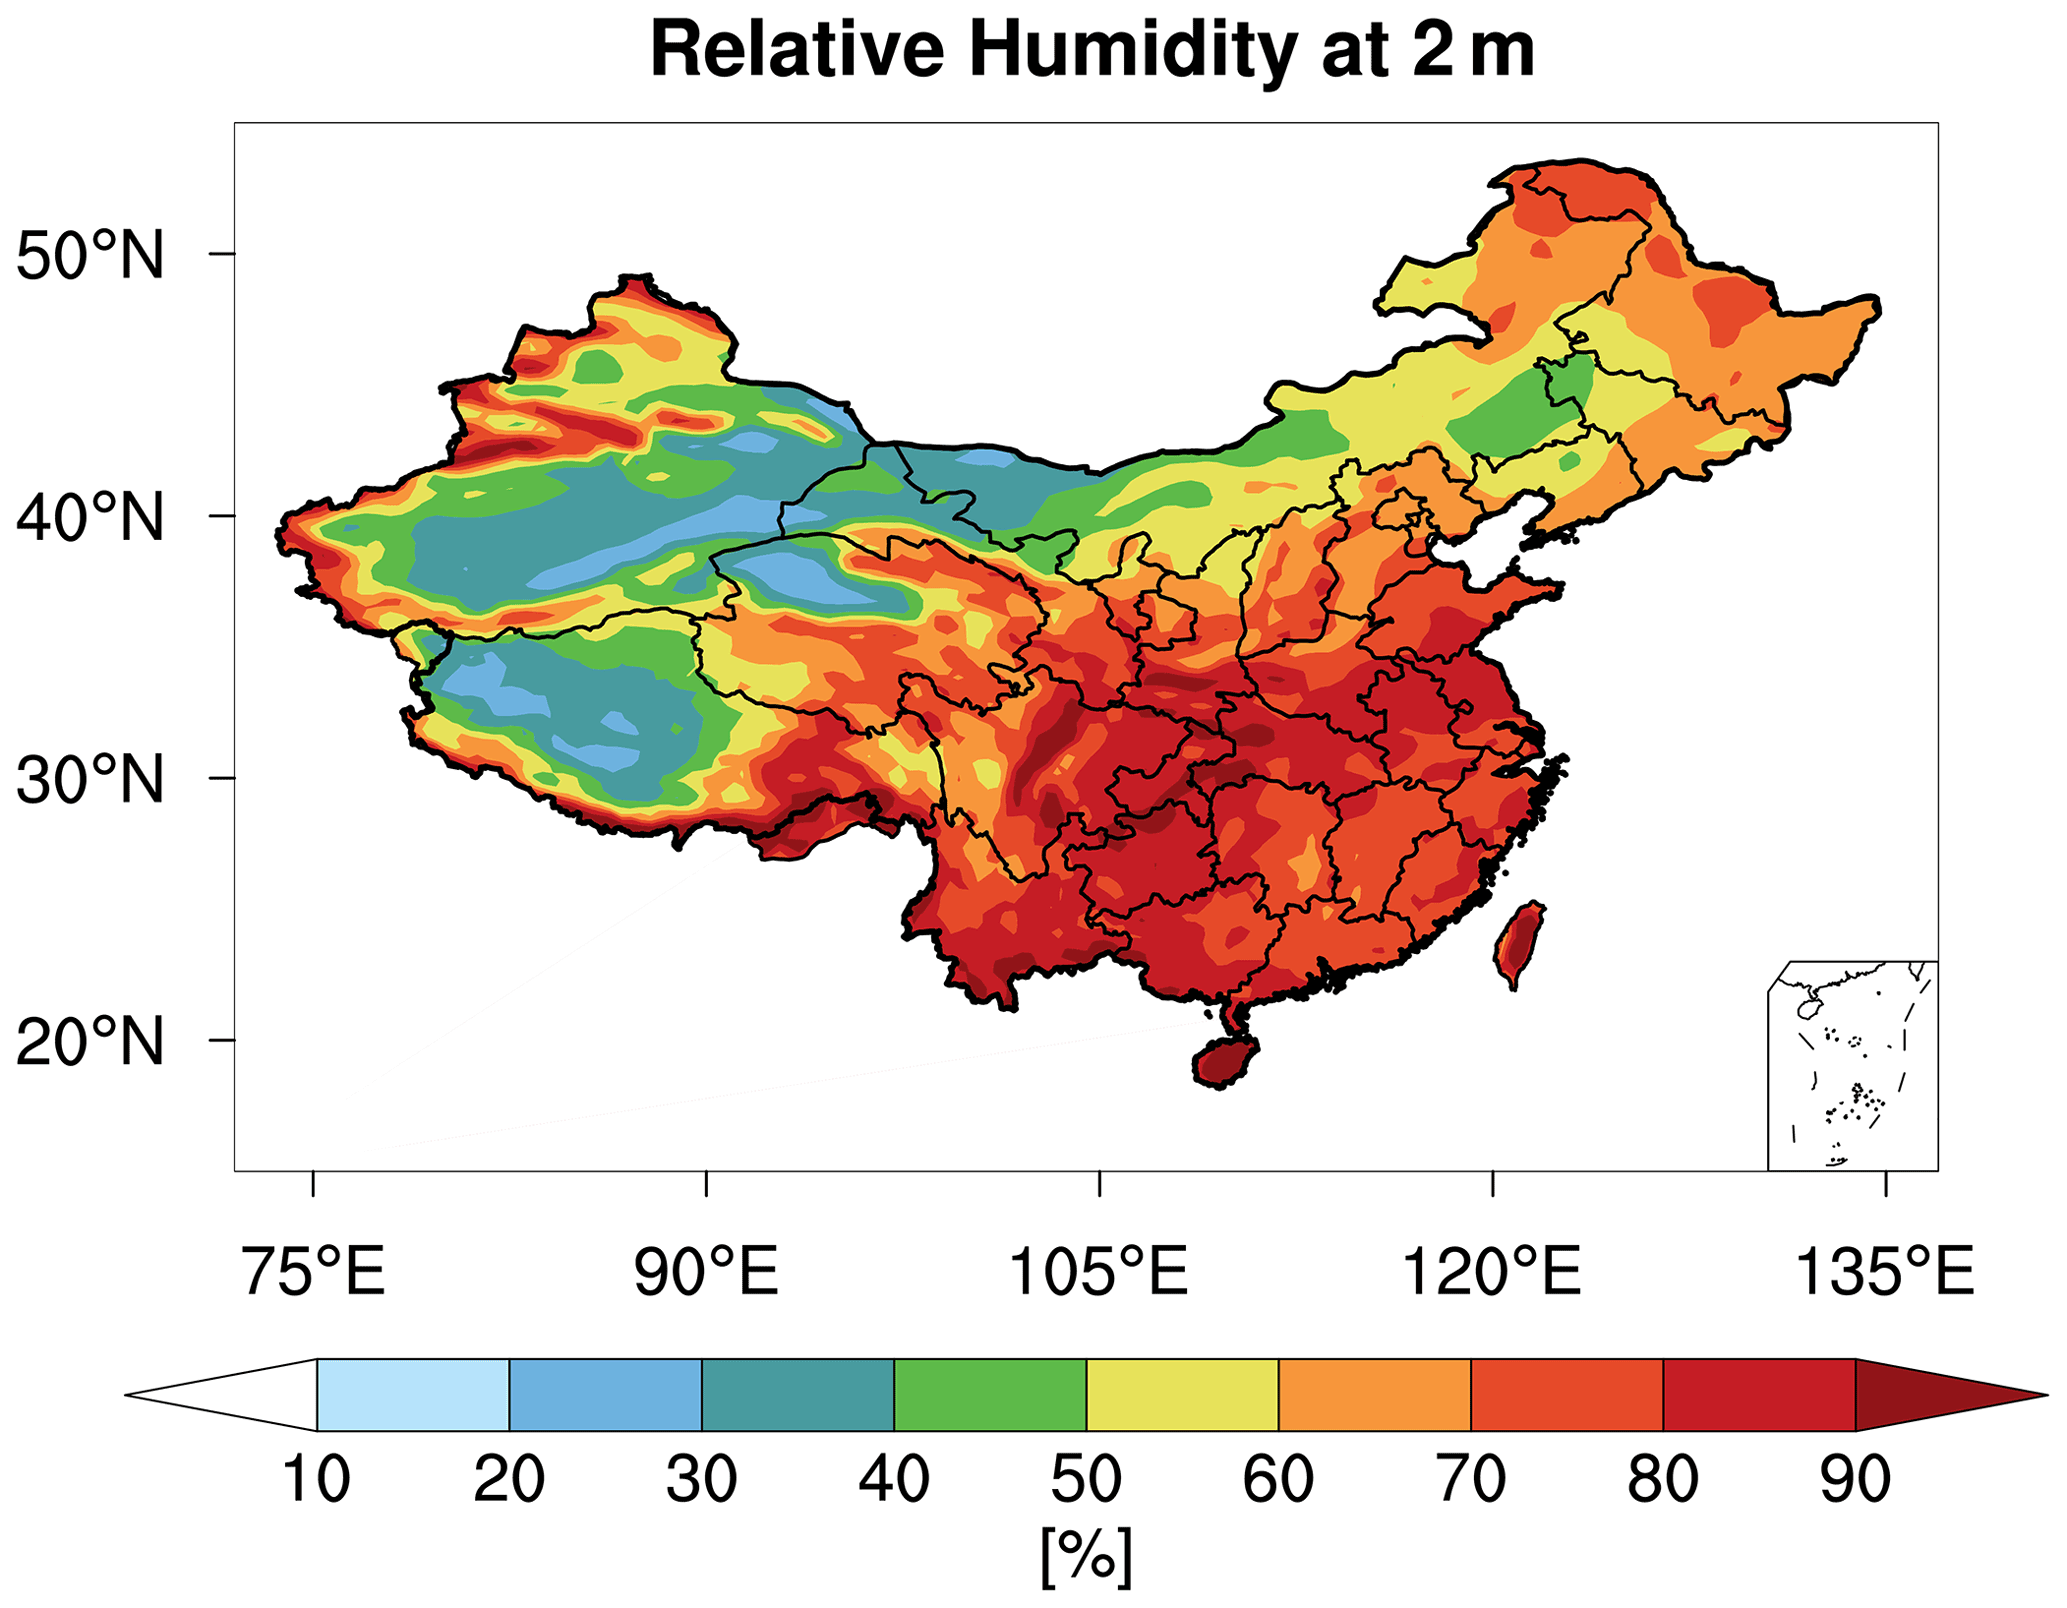
Figure 6Spatial distribution of mean 2 m relative humidity [%] from WRF-Chem during the study period of 15 October–2 November 2014.
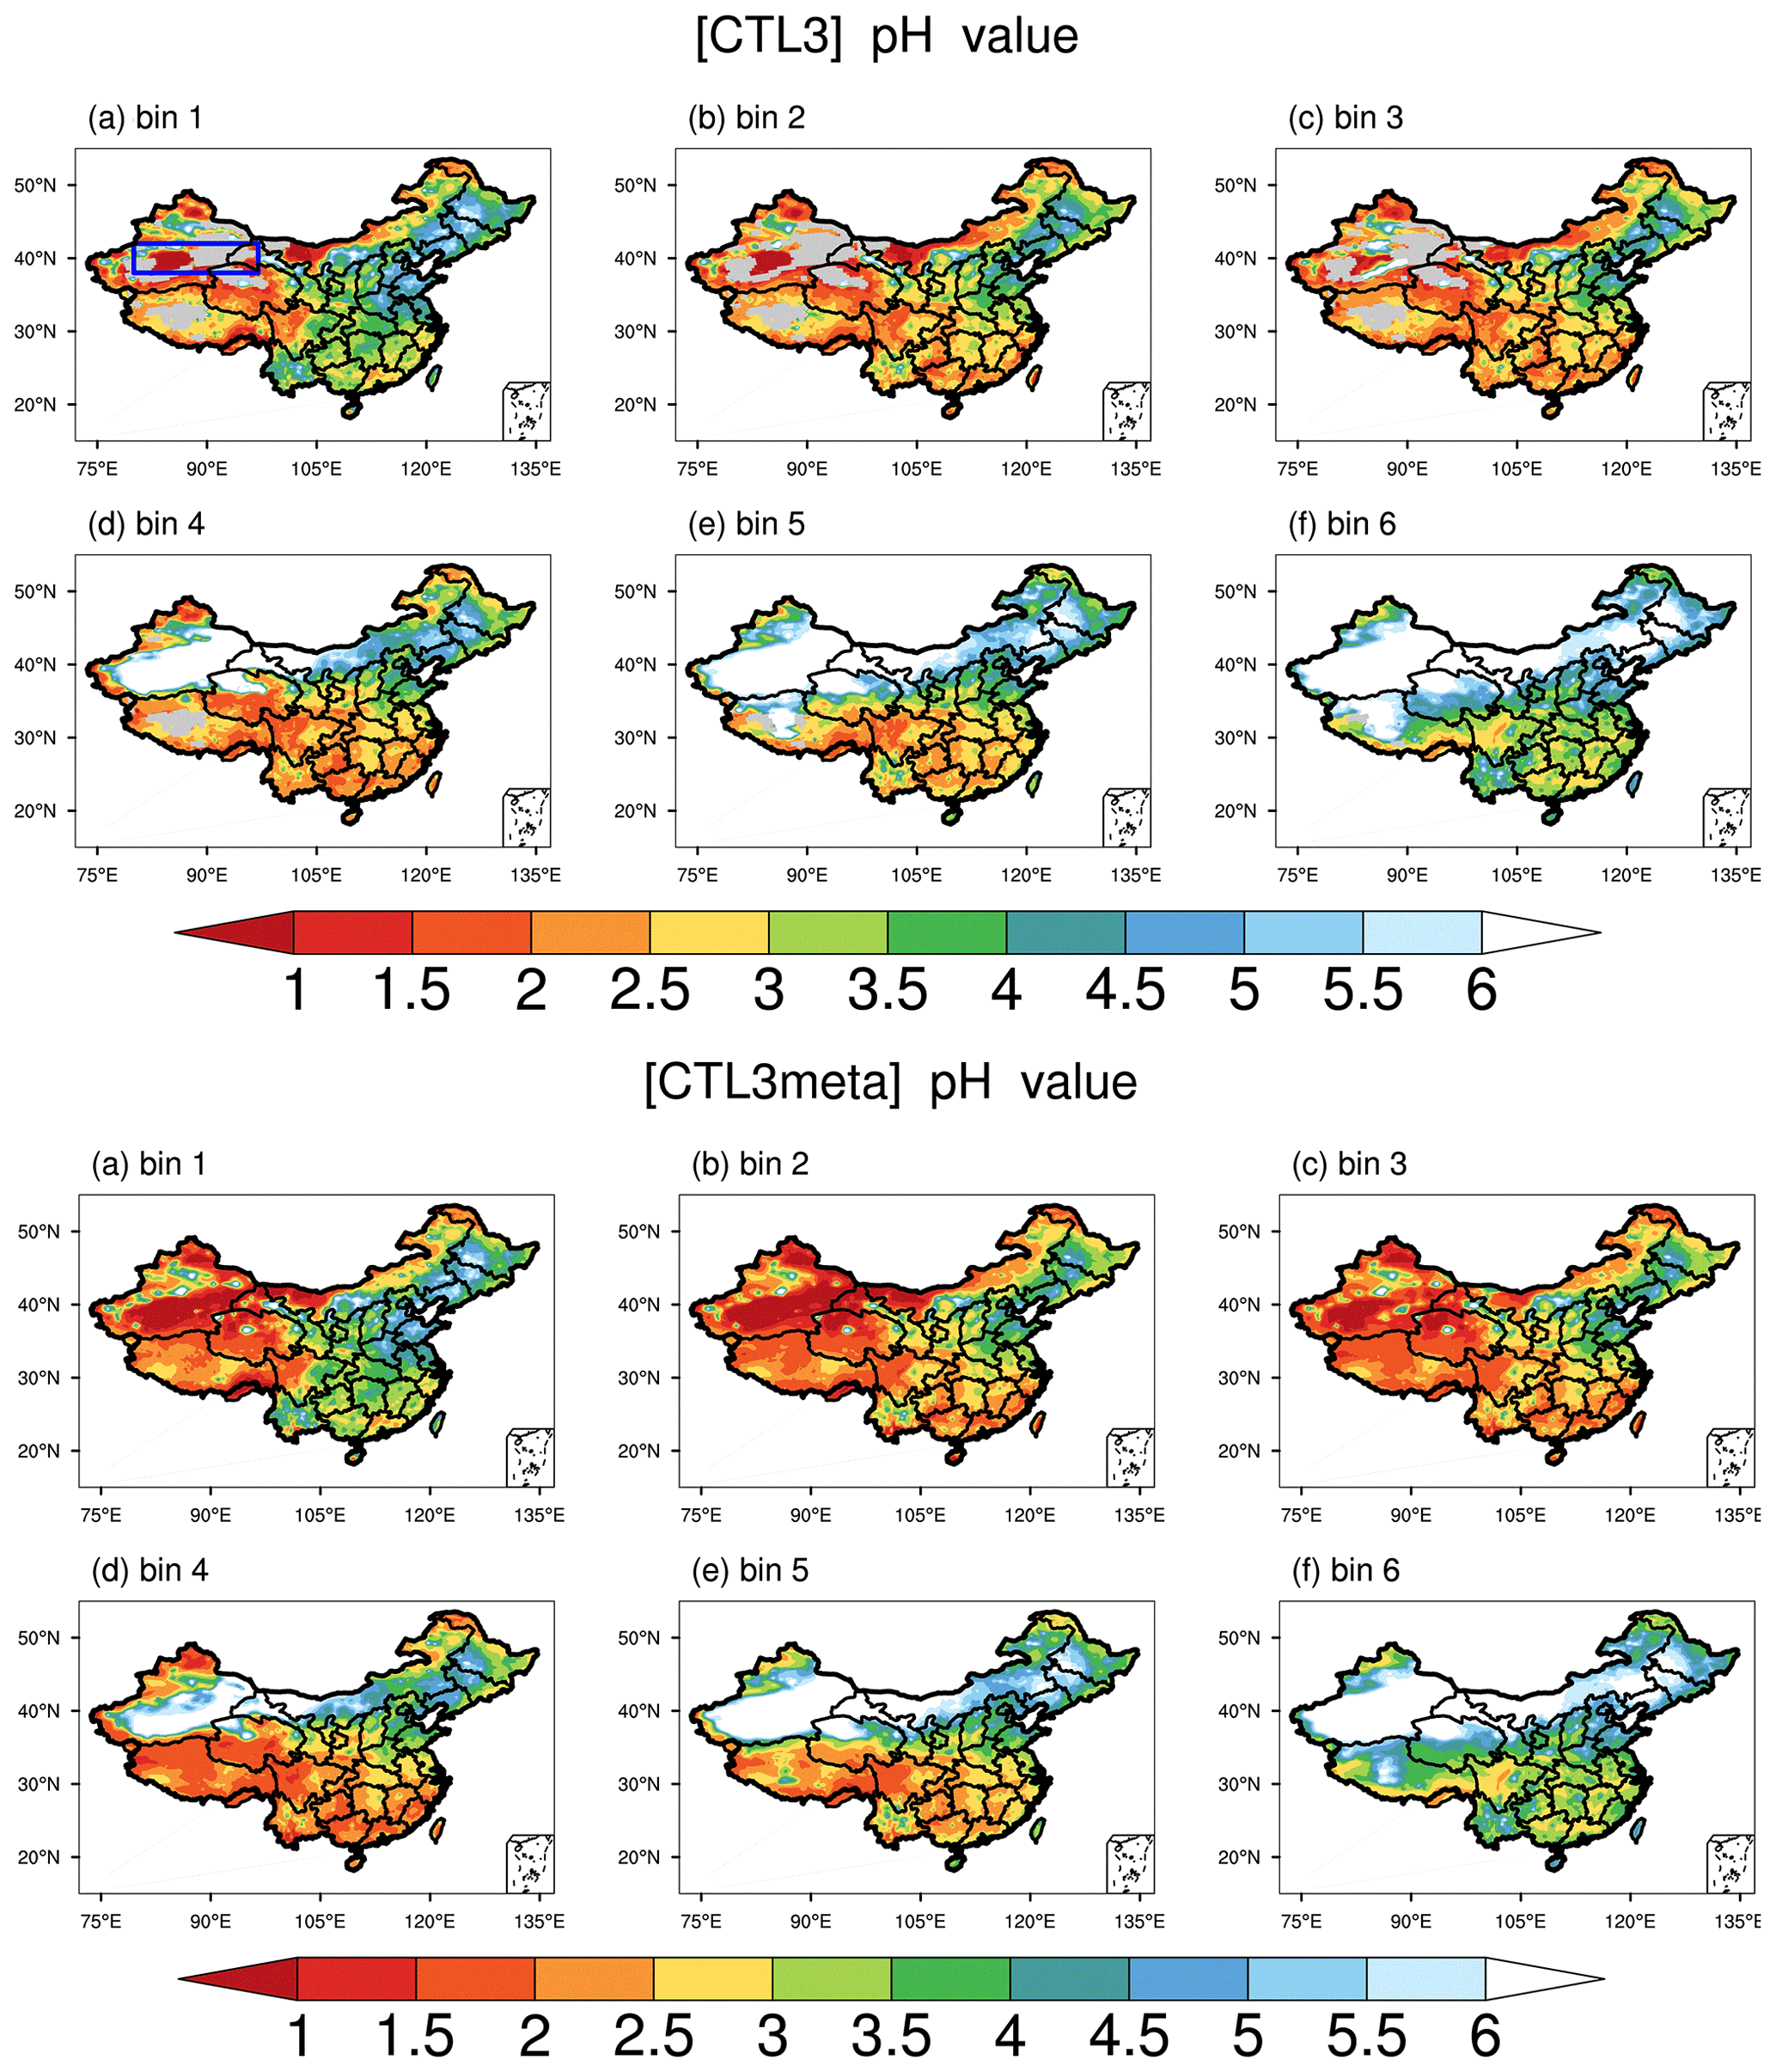
Figure 7Spatial distributions of mean surface aerosol pH during the study period of 15 October–2 November 2014 predicted by the CTL3 scenario (top panel) and CTL3meta scenario (bottom panel) for six size bins: (a) bin 1 for 0.039–0.078 µm diameter, (b) bin 2 for 0.078–0.156 µm diameter, (c) bin 3 for 0.156–0.312 µm diameter, (d) bin 4 for 0.312–0.625 µm diameter, (e) bin 5 for 0.625–1.25 µm diameter, (f) bin 6 for 1.25–2.5 µm diameter. The blue box in the top panel (a) represents the focus area of analysis to follow.
For regions with RH > 70 %, little to no changes in PM2.5 pH are predicted when fixing aerosol phase to the metastable state (Fig. 5c and Fig. 2d). This is because aerosols in all size bins in which RH > 70 %, may already be determined to be in metastable state by Whyst in the default MOSAIC scheme. In addition, since both states predict a liquid aerosol at ambient RH > 70 % which reaches the deliquescence RH for most mixed-salt aerosols, changes in pH between stable and metastable states at higher RH should be insignificant as modeled. Our modeled results are also consistent with that from previous box model and chemical transport modeling studies which found a similarly small effect of phase assumption on pH at high RH conditions (Song et al., 2018; Tao et al., 2020). In all, these results demonstrate that the metastable assumption is inappropriate at low RH conditions and would lead to unrealistic pH predictions. This in turn suggests the rationality and advances of the MOSAIC scheme in phase state determination in WRF-Chem.
4.1.4 Sensitivity to heterogeneous sulfate production
Sulfate is the main acidic component of aerosols and thus largely determines aerosol pH (Weber et al., 2016; Tilgner et al., 2021). In this study, we implement the heterogeneous sulfate formation pathways on aqueous aerosols in WRF-Chem, and explore the effects of ionic strength on the production rates with two additional runs, i.e., CTL3het_Is and CTL3het_NoIs. Overall, after the addition of heterogeneous S(IV) oxidations, modeled sulfate concentrations increase largely over eastern and central China (Fig. 3b), and PM2.5 pH decreases significantly as a consequence (Fig. 3a). This is as expected because sulfate can release free H+. Figure 5d shows that for these regions where PM2.5 pH has an obvious response, the decrease of pH gets larger as original pH increases. On the other hand, the effects of sulfate production on pH can be buffered by the uptake of bases (e.g., ammonia) from the gas phase (Zheng et al., 2020), which could differ by regions depending on the NH3 level. For example, relatively prominent sulfate production occurs in the southern part of Jiangxi Province, whereas the corresponding decrease in pH is less obvious, which may be partially offset by the buffering effect of excess ammonia. The AWC also changes in response to changes in aerosol components, which in turn affects aerosol pH. Therefore, the PM2.5 pH changes in response to additional sulfate production in the system is in fact a result of the combination of these factors.
Notably, for the CTL3het_Is run, PM2.5 pH changes are much smaller (Fig. 3c) compared to those of the CTL3het_NoIs run because of a smaller amount of additional sulfate production (Fig. 3d). As reported by Liu et al. (2020), high ionic strength can largely inhibit the TMI-catalyzed reaction rate and slow it down by a factor of ∼ 85 at an ionic strength of 2.8 M. Although high ionic strength would make the reaction of S(IV) with H2O2 faster in aerosol water (Liu et al., 2020), the modeled low H2O2 concentration hinders the contribution of this reaction to sulfate production despite the effects of high ionic strength. Therefore, when ionic strength is considered, the heterogeneous production of sulfate is inhibited and thus smaller decreases in pH are caused. Note that the inclusion of heterogeneous sulfate production here is only used to test the sensitivity of PM2.5 pH to variations in acidic components. It does not aim to simulate atmospheric sulfate, hence we did not conduct further analyses on the model's ability to capture observed sulfate production. Recent experimental studies suggest that interfacial chemistry at aerosol surfaces rather than in the bulk solutions may also be important for ambient sulfate formation. This includes the newly proposed aerosol phase acceleration for the Mn-catalyzed oxidation of S(IV) (Wang et al., 2021) and water-assisted interfacial reaction of NO2 with SO (Liu and Abbatt, 2021). Inclusion of these additional sulfate formation pathways would presumably increase sulfate production and lower the modeled PM2.5 pH further. However, large uncertainties still remain in atmospheric sulfate formation mechanisms, especially for these newly proposed mechanisms. The kinetic parameters in concentrated solutions (i.e., the surface of aerosols) also need to be accurately constrained by further investigations.
4.2 Driving factors of the temporal PM2.5 pH variation in Beijing haze
As all modeled scenarios display a similar temporal variation for the studied period in Beijing, here we choose the CTL3meta scenario for further discussion on the temporal evolution of PM2.5 pH and driving factors at different pollution levels. The CTL3meta scenario is selected because it shows a better agreement with observations of PM2.5 compositions and allows us to make a fair comparison with ISORROPIA II in which the metastable state is also assumed. Figure 4 shows that the predicted PM2.5 pH values are in general lower (more acidic) at more polluted days for all WRF-Chem simulations as well as for the ISORROPIA II results constrained by observed aerosol composition, temperature, and RH. To reveal this trend more clearly, the corresponding pH values in Beijing at different pollution levels, modeled by the CTL3meta scenario, are illustrated in the box-and-whisker plots in Fig. 8a. In addition to the WRF-Chem predictions (Fig. 8a), the offline ISORROPIA II estimations using WRF-Chem outputs (i.e., aerosol composition, temperature, and RH from the CTL3meta scenario, Fig. 8b) and observations (Fig. 8c) are also displayed. Figure 8 illustrates that PM2.5 pH calculated by ISORROPIA II (both based on WRF-Chem simulated data or observational data) generally shows consistent patterns as in the WRF-Chem simulation, and the PM2.5 pH is higher during relatively clean days while it is lowest during heavy pollution days. Despite their similar trend, overall ISORROPIA II predicts higher absolute pH values than those predicted by MOSAIC with 1.1, 1.0 and 1.0 pH units higher during light, moderate, and heavy pollution days, respectively, possibly due to the different thermodynamic representations such as activity coefficients and solution approach (see “Text S1” in the Supplements for more details). The multiple model average of PM2.5 pH in Beijing during heavy pollution events (> 150 µg m−3) is 3.6 ± 0.5. These results suggest that PM2.5 pH in Beijing under heavy haze conditions is likely in the moderate acidic range (pH remains below 5.0). Thus, the NO2 oxidation pathway most unlikely dominates in heterogeneous sulfate production as NO2 oxidation of dissolved S(IV) only becomes effective in less acidic pH ranges (∼ 6) (Cheng et al., 2016). Most recently, an experimental study (Liu and Abbatt, 2021) proposed a water-assisted interfacial mechanism for SO2 oxidation by NO2 at the aerosol surface that can maintain its atmospheric importance at a lower pH of 5. This value is nevertheless still higher than the predicted pH during the heavy haze period, and thus implies an unlikely importance of NO2 oxidation.
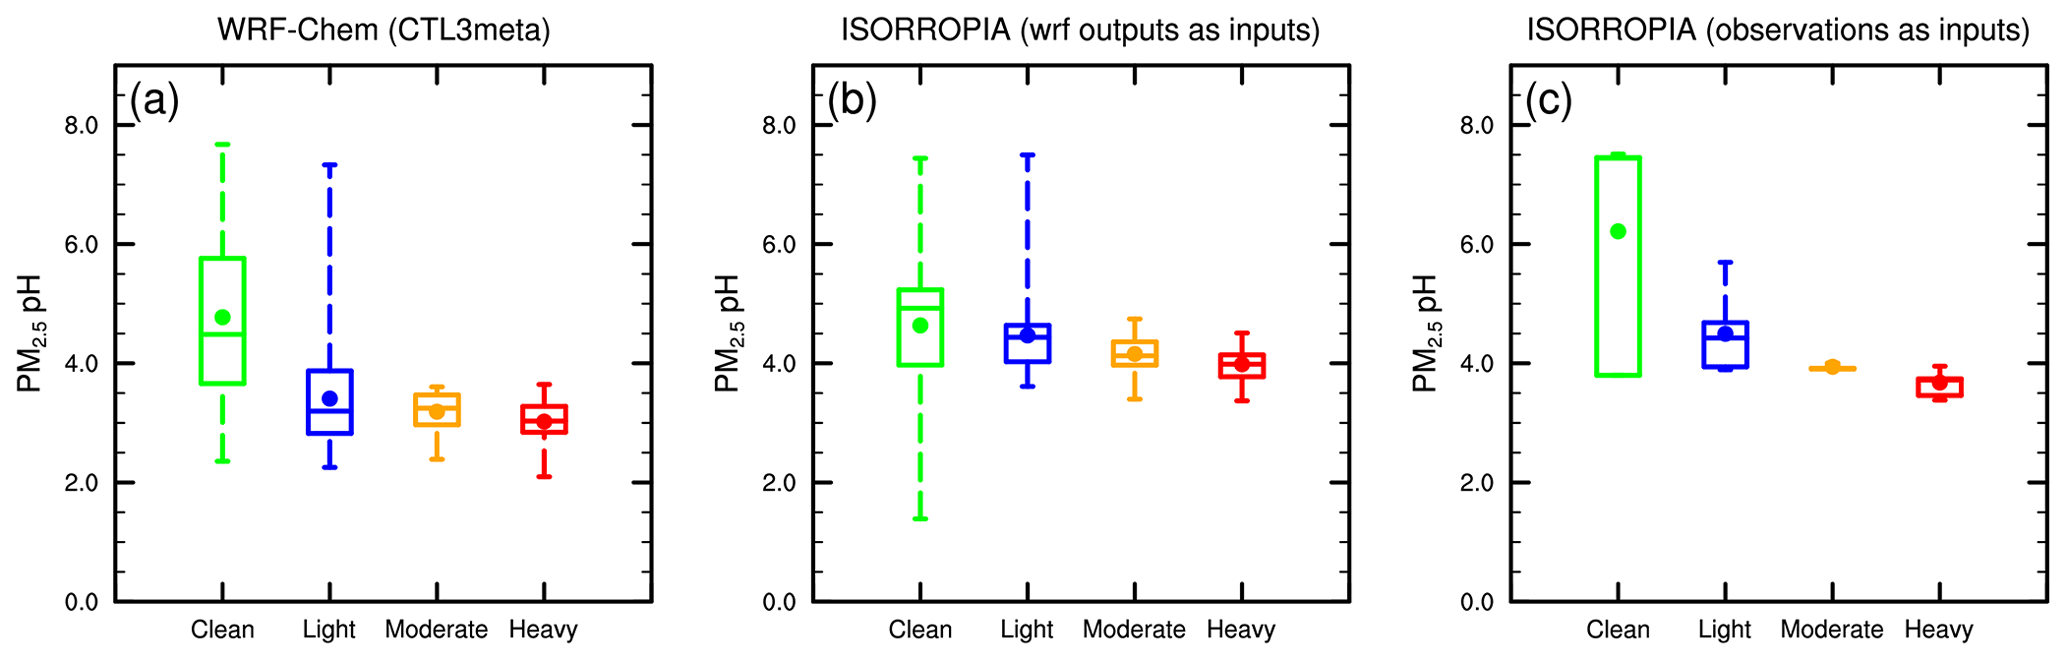
Figure 8The box-and-whisker plots of surface PM2.5 pH during each haze stage in Beijing from (a) WRF-Chem CTL3meta scenario, (b) ISORROPIA predictions with WRF-Chem (CTL3meta) relevant outputs as inputs, and (c) ISORROPIA predictions with observations as inputs. The boxes represent, from top to bottom, the 75th, 50th, and 25th percentiles of statistical data. The whiskers represent, from top to bottom, the minimum and the maximum, and the solid circles represent the mean values.
Additionally, we notice that the high pH values are generally associated with high mass fractions of NVCs and low AWC, whereas low pH values are often accompanied by low mass fractions of NVCs and high AWC (Fig. S8). This suggests the important roles of AWC and aerosol compositions in determining PM2.5 pH. To explore their relationship, mass fractions of PM2.5 ionic species as well as AWC at different pollution levels are shown in Fig. 9. As the pollution deteriorates, AWC increases and the mean value reaches 88.0 µg m−3 during the heavy pollution period (Fig. 9b). Moreover, NVCs have a higher proportion of 0.19 during the clean period, compared to 0.06 in the light pollution period, 0.04 in the moderate pollution period, and 0.03 in the heavy pollution period (Fig. 9a). This is consistent with changes in PM2.5 pH as NVCs tend to increase pH. These results are in line with previous studies (Ding et al., 2019; Shi et al., 2017) that have demonstrated the role of NVCs in aerosol acidity. However, other studies found that NVCs have limited impacts on aerosol pH, which may be due to the relatively minor contribution of crustal ions on aerosol mass in their cases (Liu et al., 2017; Zheng et al., 2020; Zhang et al., 2021). Furthermore, the mass fraction of sulfate declines from clean periods (0.16) to light and moderate pollution periods (0.08), then slightly increases during heavy pollution periods (0.10). Nitrate has the predominant mass fraction, accounting for 0.49 during the clean period and remaining almost constant during other periods (0.65). Sulfate and nitrate formation are apparently enhanced under more polluted conditions. This leads to the release of free H+, which promotes the partitioning of ammonia into the aerosol phase, neutralizing the formed acidic species, and buffering the pH. This also, at least in part, explains why the mass fraction of ammonium increases steadily throughout the haze evolution with 0.10, 0.18, 0.20, and 0.21 for clean, light, moderate, and heavy pollution periods, respectively.
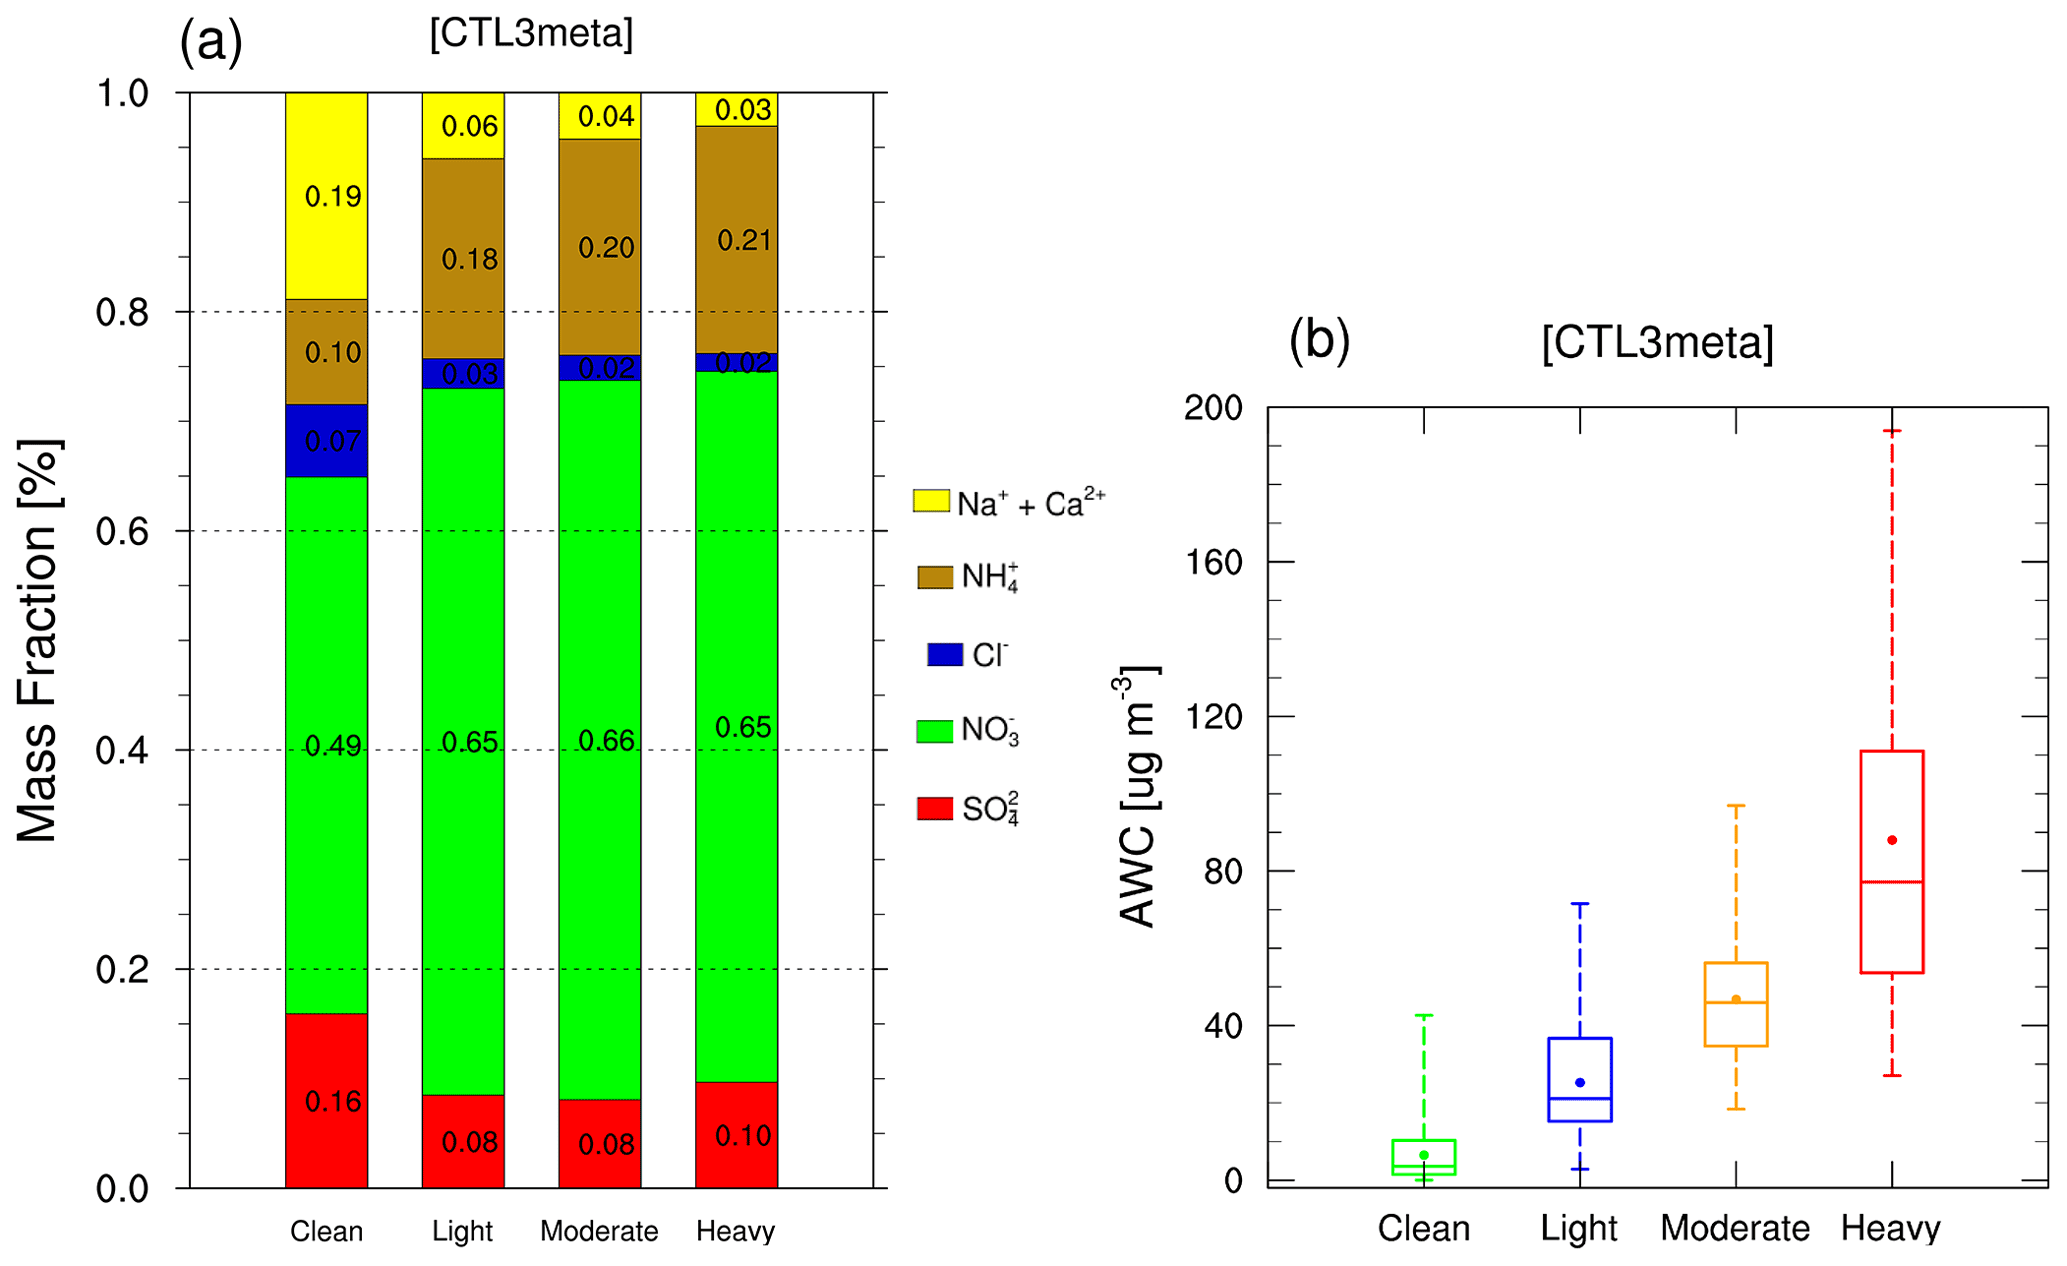
Figure 9Modeled (a) mass fractions [%] of PM2.5 ionic species and (b) AWC (µg m−3) from CTL3meta scenario in each haze stage.
Ambient RH has also been recognized as a key factor in the evolution of winter haze events (Tie et al., 2017; Sun et al., 2013) and aerosol acidity (Tao and Murphy, 2019; Battaglia et al., 2017; Ding et al., 2019; Jia et al., 2020). This can be seen in Fig. 4 where RH is generally high on more polluted days. Here we analyze the correlation of AWC and pH with RH. As shown in Fig. 10, AWC exponentially increases with increasing RH, with a mean value of 0.018 ± 0.006 µg m−3 at 20 % RH and 130 ± 43 µg m−3 at 100 % RH. In contrast, PM2.5 pH shows a general decreasing trend with RH. This is shown in Fig. 11 and can be explained as follows: RH is typically low at the start-up phase of haze events, under conditions in which NVCs from primary aerosols would be rich and gas uptake as well as secondary aerosol formation are restricted due to the limited AWC, thereby leading to a higher pH (clean period). As RH elevates with the deterioration of PM2.5 pollution, greater amounts of AWC are formed, caused by the acceleration of aerosol hygroscopic growth. The AWC then serves as an efficient medium for heterogeneous reactions on the surface of aerosols, thereby substantially enhancing secondary formation of acid species (such as sulfate and nitrate) and resulting in greater acidity. The latter is also facilitated by the accumulation of reactive gas precursors as the haze event evolves under stable boundary layer conditions. Aerosol hygroscopic growth is further enhanced by a positive feedback mechanism, where the production of secondary aerosol species can in turn enhance aerosol hygroscopicity and increase AWC (Wu et al., 2018). It should be noted that more AWC could also exert a dilution effect which would dilute the H+, but the acid effect likely prevails over the dilution effect leading to a net drop of pH. The schematic process of the temporal evolution of PM2.5 pH during the haze cycle in Beijing is represented in Fig. 11.

Figure 10(a) AWC (µg m−3) and (b) PM2.5 pH predicted by the CTL3meta scenario as a function of RH for data at the Beijing site during the study period of 15 October–2 November 2014. Data are grouped in RH bins (10 % increment). The error bars represent the standard deviations.
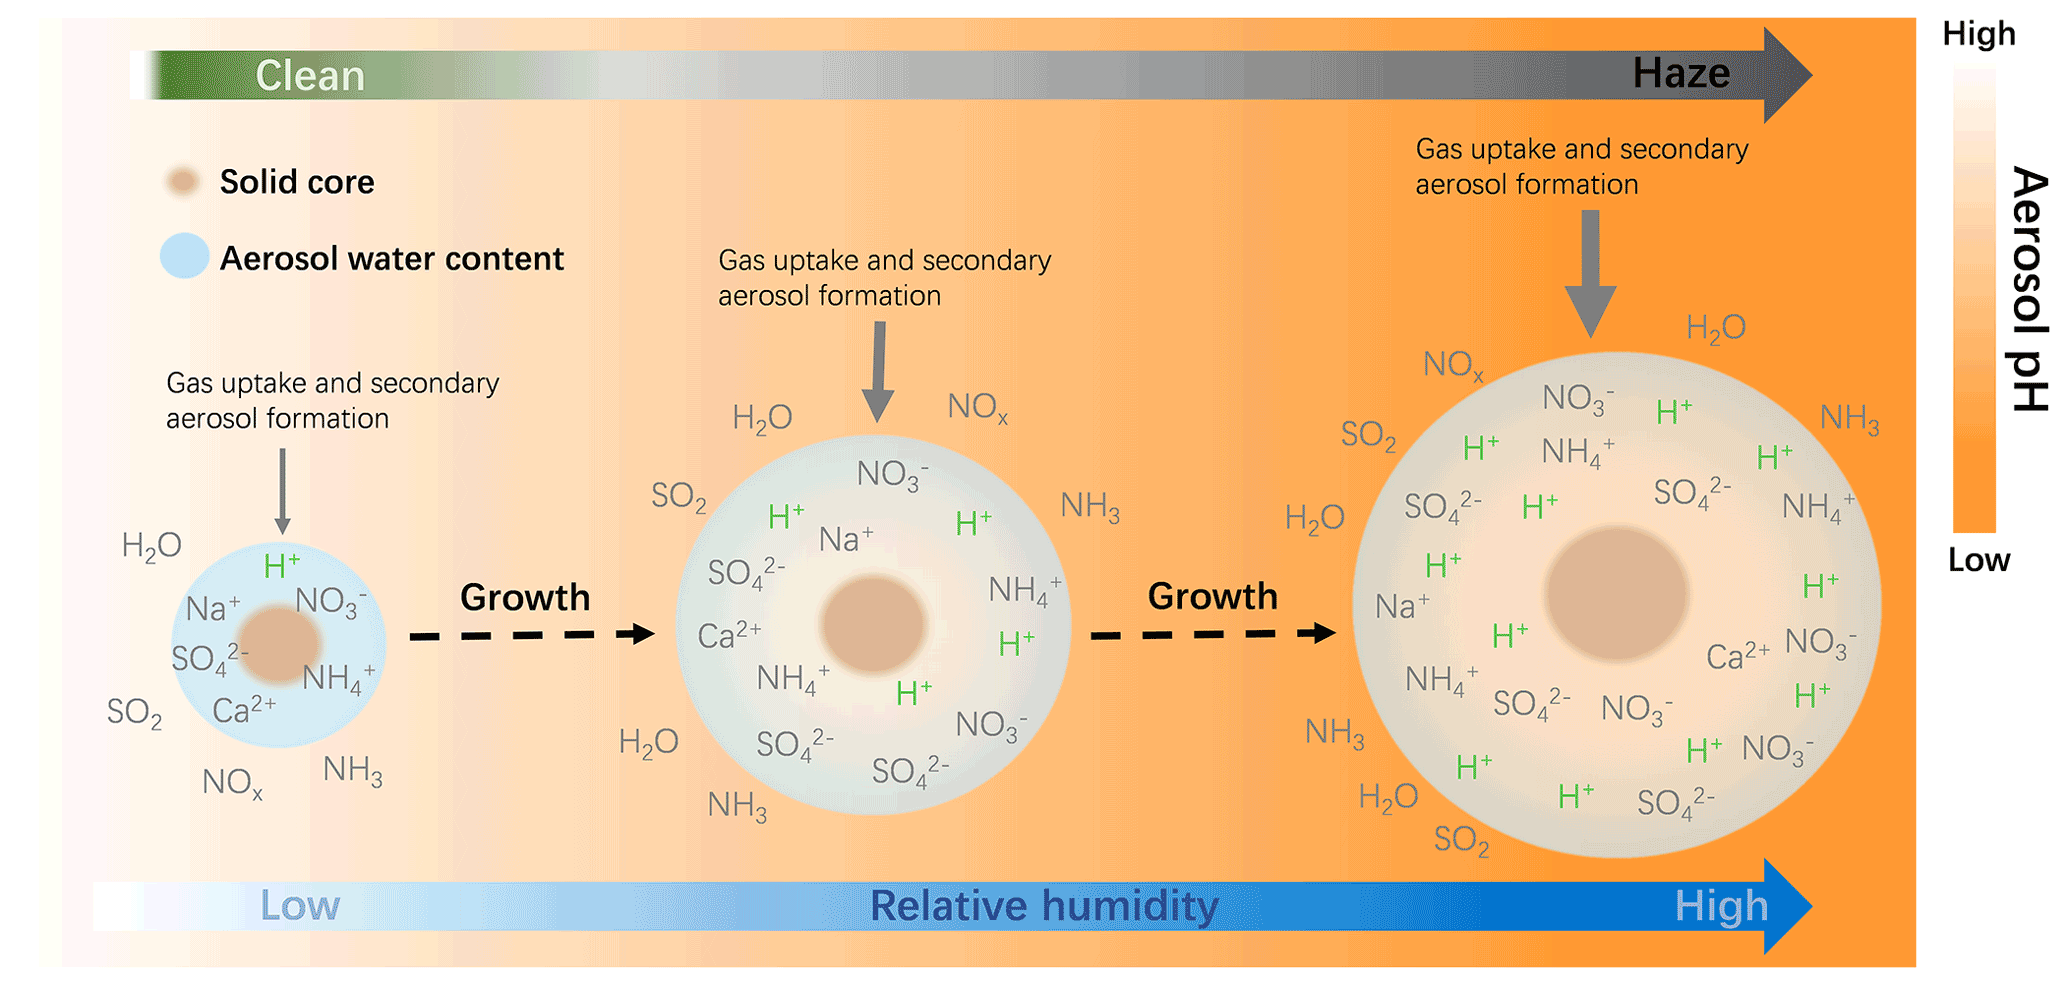
Figure 11The schematic plot of the temporal evolution of PM2.5 pH during the haze cycle in Beijing. The size of blue circles indicates the relative amount of aerosol water, and the thickness of downward arrows indicates the relative strength of the process.
In this study, the performance of WRF-Chem configured with MOSAIC in predicted PM2.5 pH over China is evaluated. In particular, using the model, we assess the evolution of PM2.5 pH over a few haze episodes in Beijing from 18 October to 2 November 2014. The results indicate that the default WRF-Chem could predict a similar spatial gradient of PM2.5 pH across China compared to other CTMs, as reported by previous studies. However, WRF-Chem in general yields low pH (0.8–3.6) over most regions compared to other models (1.3–5). This is mainly due to the model underestimations of NVC concentrations, with additional contributions from low model NH3 emissions as well as inherent differences in thermodynamic representations. The latter is further assessed by comparing it with the corresponding pH predictions from offline ISORROPIA II using WRF-Chem modeled aerosol composition, temperature and RH as inputs. Compared to ISORROPIA II values, MOSAIC-calculated pH values are consistently lower by 0.6 units on average, despite the fact that the pH variation trend matches quite well.
Furthermore, six experiments are conducted to investigate the response in modeled PM2.5 pH to varying NVCs, NH3, phase state assumption, and sulfate production over China. The model results show that pH sensitivity has substantial spatial heterogeneity. Elevated NVC emissions cause ubiquitous increases in PM2.5 pH with higher effects in the NEP and NCP regions where original pH is in the moderate acidic range. For regions with high or low original pH, the effects from NVCs are minor. Doubling NH3 emissions also lead to an increase in PM2.5 pH over most areas of China, except for TD and GD that are characterized by high aerosol pH and sufficient NVCs. The effects of the phase state assumption on pH are found to be minor at high RH conditions, but a large decrease in PM2.5 pH can be induced at low RH conditions due to an unrealistic metastable phase state assumption. Additional formed sulfate in aerosol water tends to effectively decrease PM2.5 pH over eastern and central China in a complex manner. This is due to the buffering effect of semi-volatile ammonia and the accompanied AWC change.
In addition, PM2.5 pH evolution during the haze cycles in Beijing is investigated. The results indicate that aerosols become more acidic as haze pollution accumulates from 5.2 ± 0.9 in a clean period to 3.6 ± 0.5 in a heavily polluted period, due to changes in both aerosol components and meteorological conditions. A large mass fraction of NVCs is found to be responsible for the high aerosol pH during clean periods. The elevated AWC with increasing RH during polluted periods accelerates secondary aerosol formation (e.g., sulfate and nitrate), enhances water uptake, and further lowers pH. The moderately acidic aerosols under heavy haze conditions suggest that it is highly unlikely for S(IV) oxidation by NO2 to contribute significantly to sulfate production during the Beijing haze. Sensitivity experiments were also conducted at finer resolution (12 km) and the results did not differ from those conducted at 36 km resolution.
In all, our study suggests that NVCs and NH3 influence the predicted PM2.5 pH the most, at least in the WRF-Chem model. However, currently the model cannot predict the abundance and variations of these species, especially for Ca2+ and Na+. Future research efforts need to be undertaken to better constrain NVC and NH3 emissions in the model so as to improve aerosol pH predictions. Across China, both stable and metastable states of aerosols exist, thus both states should be represented in regional and global models. Follow-up studies including more accurate and up-to-date heterogeneous sulfate formation pathways in the model would also be necessary. More observational datasets of high temporal resolution (e.g., hourly) are needed to help evaluate and understand the detailed evolution of pH during haze episodes, as well as the diurnal pattern of pH. Since observationally constrained pH is limited in terms of spatial coverage, more measurements need to be devoted to the regions where observations are rare or unavailable. In addition to aerosol composition, concurrent measurements of gas species subject to phase partitioning (e.g., HNO3 and NH3) will provide better constraints on acidity estimates. Measurements of size-resolved aerosol composition will also be useful to further evaluate MOSAIC predictions of aerosol pH from different size bins. Moreover, future measurements can consider monitoring throughout the boundary layer (e.g., from tall towers, mountain-based sites, and aircraft) in order to provide insights into the vertical distribution of aerosol pH. Lastly, in situ measurement techniques of aerosol pH are desired to provide an improved understanding of aerosol pH and its effect on aerosol chemistry. Recent approaches (e.g., Raman spectroscopy method, Cui et al., 2021; Li et al., 2022) show the potential to do so in the future.
The release version of WRF-Chem can be downloaded from http://www2.mmm.ucar.edu/wrf/users/download/get_source.html (last access: 31 July 2022). The modified version of WRF-Chem used in this study is archived on Zenodo at https://doi.org/10.5281/zenodo.6359417 (Ruan et al., 2022). The ERA-Interim reanalysis data from the European Centre for Medium-Range Weather Forecasts (ECMWF) for initial and boundary conditions can be downloaded from https://doi.org/10.5065/D6CR5RD9 (ECMWF, 2009) The ERA5 reanalysis data can be downloaded from https://doi.org/10.5065/BH6N-5N20 (ECMWF, 2019).
The supplement related to this article is available online at: https://doi.org/10.5194/gmd-15-6143-2022-supplement.
XR, LG, and CZ designed the experiments, and conducted and analyzed the simulations. XR, CZ, RZ, PH, XW, JS, and LG contributed to the discussion and final version of the paper.
The contact author has declared that none of the authors has any competing interests.
Publisher's note: Copernicus Publications remains neutral with regard to jurisdictional claims in published maps and institutional affiliations.
Rahul A. Zaveri was supported by the Office of Science of the U.S. Department of Energy (DOE) as part of the Atmospheric System Research program at Pacific Northwest National Laboratory (PNNL). PNNL is operated for DOE by Battelle Memorial Institute under contract DE-AC06-76RLO 1830. The numerical calculations in this paper have been done on the supercomputing system in the Supercomputing Center of University of Science and Technology of China (USTC). Xueyin Ruan is grateful to Qiuyan Du and Mingyue Xu from USTC for help in the use of the WRF-Chem model. We would like to thank the reviewers and the editors of the Cryosphere for their comments and suggestions, which greatly helped in improving the manuscript.
This research has been supported by the National Natural Science Foundation of China (grant nos. 41822605, 41871051, and 41727901), the Fundamental Research Funds for Central Universities, the Strategic Priority Research Program of Chinese Academy of Sciences (grant no. XDB 41000000). Support for Pengzhen He was provided by the Natural Science Foundation of Anhui Province (grant no. 2008085QD184), and the West Anhui University (grant no. WGKQ202001007).
This paper was edited by Fiona O'Connor and reviewed by Mary Barth and Shaojie Song.
Ahrens, L., Harner, T., Shoeib, M., Lane, D. A., and Murphy, J. G.: Improved Characterization of Gas-Particle Partitioning for Per- and Polyfluoroalkyl Substances in the Atmosphere Using Annular Diffusion Denuder Samplers, Environ. Sci. Technol., 46, 7199–7206, https://doi.org/10.1021/es300898s, 2012.
Battaglia Jr., M. A., Douglas, S., and Hennigan, C. J.: Effect of the Urban Heat Island on Aerosol pH, Environ. Sci. Technol., 51, 13095–13103, https://doi.org/10.1021/acs.est.7b02786, 2017.
Chen, D., Liu, Z., Fast, J., and Ban, J.: Simulations of sulfate–nitrate–ammonium (SNA) aerosols during the extreme haze events over northern China in October 2014, Atmos. Chem. Phys., 16, 10707–10724, https://doi.org/10.5194/acp-16-10707-2016, 2016.
Chen, F. and Dudhia, J.: Coupling an Advanced Land Surface–Hydrology Model with the Penn State–NCAR MM5 Modeling System. Part I: Model Implementation and Sensitivity, Mon. Weather Rev., 129, 569–585, https://doi.org/10.1175/1520-0493(2001)129<0569:Caalsh>2.0.Co;2, 2001.
Chen, Y., Wang, Y., Nenes, A., Wild, O., Song, S., Hu, D., Liu, D., He, J., Hildebrandt Ruiz, L., Apte, J. S., Gunthe, S. S., and Liu, P.: Ammonium Chloride Associated Aerosol Liquid Water Enhances Haze in Delhi, India, Environ. Sci. Technol., 56, 7163–7173, https://doi.org/10.1021/acs.est.2c00650, 2022.
Chen, Z., Zhang, J., Zhang, T., Liu, W., and Liu, J.: Haze observations by simultaneous lidar and WPS in Beijing before and during APEC, 2014, Science China Chemistry, 58, 1385–1392, https://doi.org/10.1007/s11426-015-5467-x, 2015.
Cheng, Y., Zheng, G., Wei, C., Mu, Q., Zheng, B., Wang, Z., Gao, M., Zhang, Q., He, K., Carmichael, G., Pöschl, U., and Su, H.: Reactive nitrogen chemistry in aerosol water as a source of sulfate during haze events in China, Sci. Adv., 2, e1601530, https://doi.org/10.1126/sciadv.1601530, 2016.
Clegg, S. L., Pitzer, K. S., and Brimblecombe, P.: Thermodynamics of multicomponent, miscible, ionic solutions. Mixtures including unsymmetrical electrolytes, J. Phys. Chem., 96, 9470–9479, https://doi.org/10.1021/j100202a074, 1992.
Clegg, S. L., Seinfeld, J. H., and Edney, E. O.: Thermodynamic modelling of aqueous aerosols containing electrolytes and dissolved organic compounds. II. An extended Zdanovskii–Stokes–Robinson approach, J. Aerosol Sci., 34, 667–690, https://doi.org/10.1016/S0021-8502(03)00019-3, 2003.
Cui, X., Tang, M., Wang, M., and Zhu, T.: Water as a probe for pH measurement in individual particles using micro-Raman spectroscopy, Anal. Chim. Acta, 1186, 339089, https://doi.org/10.1016/j.aca.2021.339089, 2021.
Ding, J., Zhao, P., Su, J., Dong, Q., Du, X., and Zhang, Y.: Aerosol pH and its driving factors in Beijing, Atmos. Chem. Phys., 19, 7939–7954, https://doi.org/10.5194/acp-19-7939-2019, 2019.
Du, Q., Zhao, C., Zhang, M., Dong, X., Chen, Y., Liu, Z., Hu, Z., Zhang, Q., Li, Y., Yuan, R., and Miao, S.: Modeling diurnal variation of surface PM2.5 concentrations over East China with WRF-Chem: impacts from boundary-layer mixing and anthropogenic emission, Atmos. Chem. Phys., 20, 2839–2863, https://doi.org/10.5194/acp-20-2839-2020, 2020.
European Centre for Medium-Range Weather Forecasts: ERA-Interim Project, Research Data Archive at the National Center for Atmospheric Research, Computational and Information Systems Laboratory [data set], https://doi.org/10.5065/D6CR5RD9, 2009.
European Centre for Medium-Range Weather Forecasts: ERA5 Reanalysis (0.25 Degree Latitude-Longitude Grid), Research Data Archive at the National Center for Atmospheric Research, Computational and Information Systems Laboratory [data set], https://doi.org/10.5065/BH6N-5N20, 2019.
Fang, T., Guo, H. Y., Zeng, L. H., Verma, V., Nenes, A., and Weber, R. J.: Highly Acidic Ambient Particles, Soluble Metals, and Oxidative Potential: A Link between Sulfate and Aerosol Toxicity, Environ. Sci. Technol., 51, 2611–2620, https://doi.org/10.1021/acs.est.6b06151, 2017.
Fast, J. D., Gustafson, W. I., Easter, R. C., Zaveri, R. A., Barnard, J. C., Chapman, E. G., Grell, G. A., and Peckham, S. E.: Evolution of ozone, particulates, and aerosol direct radiative forcing in the vicinity of Houston using a fully coupled meteorology-chemistry-aerosol model, J. Geophys. Res.-Atmos., 111, D21305, https://doi.org/10.1029/2005jd006721, 2006.
Fountoukis, C. and Nenes, A.: ISORROPIA II: a computationally efficient thermodynamic equilibrium model for K+–Ca2+–Mg2+––Na+–––Cl−–H2O aerosols, Atmos. Chem. Phys., 7, 4639–4659, https://doi.org/10.5194/acp-7-4639-2007, 2007.
Freedman, M. A., Ott, E. J. E., and Marak, K. E.: Role of pH in Aerosol Processes and Measurement Challenges, J. Phys. Chem. A, 123, 1275-1284, https://doi.org/10.1021/acs.jpca.8b10676, 2019.
Gao, J., Wei, Y., Shi, G., Yu, H., Zhang, Z., Song, S., Wang, W., Liang, D., and Feng, Y.: Roles of RH, aerosol pH and sources in concentrations of secondary inorganic aerosols, during different pollution periods, Atmos. Environ., 241, 1352–2310, https://doi.org/10.1016/j.atmosenv.2020.117770, 2020.
Gao, S., Ng, N. L., Keywood, M., Varutbangkul, V., Bahreini, R., Nenes, A., He, J. W., Yoo, K. Y., Beauchamp, J. L., Hodyss, R. P., Flagan, R. C., and Seinfeld, J. H.: Particle phase acidity and oligomer formation in secondary organic aerosol, Environ. Sci. Technol., 38, 6582-6589, https://doi.org/10.1021/es049125k, 2004.
Ginoux, P., Chin, M., Tegen, I., Prospero, J. M., Holben, B., Dubovik, O., and Lin, S. J.: Sources and distributions of dust aerosols simulated with the GOCART model, J. Geophys. Res.-Atmos., 106, 20255–20273, https://doi.org/10.1029/2000JD000053, 2001.
Grell, G. A., Peckham, S. E., Schmitz, R., McKeen, S. A., Frost, G., Skamarock, W. C., and Eder, B.: Fully coupled “online” chemistry within the WRF model, Atmos. Environ., 39, 6957–6975, https://doi.org/10.1016/j.atmosenv.2005.04.027, 2005.
Gunthe, S. S., Liu, P., Panda, U., Raj, S. S., Sharma, A., Darbyshire, E., Reyes-Villegas, E., Allan, J., Chen, Y., Wang, X., Song, S., Pöhlker, M. L., Shi, L., Wang, Y., Kommula, S. M., Liu, T., Ravikrishna, R., McFiggans, G., Mickley, L. J., Martin, S. T., Pöschl, U., Andreae, M. O., and Coe, H.: Enhanced aerosol particle growth sustained by high continental chlorine emission in India, Nat. Geosci., 14, 77–84, https://doi.org/10.1038/s41561-020-00677-x, 2021.
Guo, H., Liu, J., Froyd, K. D., Roberts, J. M., Veres, P. R., Hayes, P. L., Jimenez, J. L., Nenes, A., and Weber, R. J.: Fine particle pH and gas–particle phase partitioning of inorganic species in Pasadena, California, during the 2010 CalNex campaign, Atmos. Chem. Phys., 17, 5703–5719, https://doi.org/10.5194/acp-17-5703-2017, 2017a.
Guo, H., Weber, R. J., and Nenes, A.: High levels of ammonia do not raise fine particle pH sufficiently to yield nitrogen oxide-dominated sulfate production, Sci. Rep., 7, 12109, https://doi.org/10.1038/s41598-017-11704-0, 2017b.
Guo, H., Nenes, A., and Weber, R. J.: The underappreciated role of nonvolatile cations in aerosol ammonium-sulfate molar ratios, Atmos. Chem. Phys., 18, 17307–17323, https://doi.org/10.5194/acp-18-17307-2018, 2018a.
Guo, H., Otjes, R., Schlag, P., Kiendler-Scharr, A., Nenes, A., and Weber, R. J.: Effectiveness of ammonia reduction on control of fine particle nitrate, Atmos. Chem. Phys., 18, 12241–12256, https://doi.org/10.5194/acp-18-12241-2018, 2018b.
He, P., Alexander, B., Geng, L., Chi, X., Fan, S., Zhan, H., Kang, H., Zheng, G., Cheng, Y., Su, H., Liu, C., and Xie, Z.: Isotopic constraints on heterogeneous sulfate production in Beijing haze, Atmos. Chem. Phys., 18, 5515–5528, https://doi.org/10.5194/acp-18-5515-2018, 2018.
Hong, S. Y., Noh, Y., and Dudhia, J.: A new vertical diffusion package with an explicit treatment of entrainment processes, Mon. Weather Rev., 134, 2318–2341, https://doi.org/10.1175/Mwr3199.1, 2006.
Huang, X., Song, Y., Zhao, C., Li, M., Zhu, T., Zhang, Q., and Zhang, X.: Pathways of sulfate enhancement by natural and anthropogenic mineral aerosols in China, J. Geophys. Res.-Atmos., 119, 14165–114179, https://doi.org/10.1002/2014jd022301, 2014.
Iacono, M. J., Delamere, J. S., Mlawer, E. J., Shephard, M. W., Clough, S. A., and Collins, W. D.: Radiative forcing by long-lived greenhouse gases: Calculations with the AER radiative transfer models, J. Geophys. Res.-Atmos., 113, D13103, https://doi.org/10.1029/2008jd009944, 2008.
Jacob, D. J.: Heterogeneous chemistry and tropospheric ozone, Atmos. Environ., 34, 2131–2159, https://doi.org/10.1016/S1352-2310(99)00462-8, 2000.
Janssens-Maenhout, G., Crippa, M., Guizzardi, D., Dentener, F., Muntean, M., Pouliot, G., Keating, T., Zhang, Q., Kurokawa, J., Wankmüller, R., Denier van der Gon, H., Kuenen, J. J. P., Klimont, Z., Frost, G., Darras, S., Koffi, B., and Li, M.: HTAP_v2.2: a mosaic of regional and global emission grid maps for 2008 and 2010 to study hemispheric transport of air pollution, Atmos. Chem. Phys., 15, 11411–11432, https://doi.org/10.5194/acp-15-11411-2015, 2015.
Jia, S., Wang, X., Zhang, Q., Sarkar, S., Wu, L., Huang, M., Zhang, J., and Yang, L.: Technical note: Comparison and interconversion of pH based on different standard states for aerosol acidity characterization, Atmos. Chem. Phys., 18, 11125-11133, https://doi.org/10.5194/acp-18-11125-2018, 2018.
Jia, S. G., Chen, W. H., Zhang, Q., Krishnan, P., Mao, J. Y., Zhong, B. Q., Huang, M. J., Fan, Q., Zhang, J. P., Chang, M., Yang, L. M., and Wang, X. M.: A quantitative analysis of the driving factors affecting seasonal variation of aerosol pH in Guangzhou, China, Sci. Total Environ., 725, 138228, https://doi.org/10.1016/j.scitotenv.2020.138228, 2020.
Kakavas, S., Patoulias, D., Zakoura, M., Nenes, A., and Pandis, S. N.: Size-resolved aerosol pH over Europe during summer, Atmos. Chem. Phys., 21, 799–811, https://doi.org/10.5194/acp-21-799-2021, 2021.
Kanakidou, M., Myriokefalitakis, S., and Tsigaridis, K.: Aerosols in atmospheric chemistry and biogeochemical cycles of nutrients, Environ. Res. Lett., 13, 063004, https://doi.org/10.1088/1748-9326/aabcdb, 2018.
Karydis, V. A., Tsimpidi, A. P., Pozzer, A., and Lelieveld, J.: How alkaline compounds control atmospheric aerosol particle acidity, Atmos. Chem. Phys., 21, 14983–15001, https://doi.org/10.5194/acp-21-14983-2021, 2021.
Keene, W. C., Sander, R., Pszenny, A. A. P., Vogt, R., Crutzen, P. J., and Galloway, J. N.: Aerosol pH in the marine boundary layer: A review and model evaluation, J. Aerosol Sci., 29, 339–356, https://doi.org/10.1016/S0021-8502(97)10011-8, 1998.
Keene, W. C., Pszenny, A. A. P., Maben, J. R., Stevenson, E., and Wall, A.: Closure evaluation of size-resolved aerosol pH in the New England coastal atmosphere during summer, J. Geophys. Res.-Atmos., 109, D23307, https://doi.org/10.1029/2004jd004801, 2004.
Kok, J. F.: A scaling theory for the size distribution of emitted dust aerosols suggests climate models underestimate the size of the global dust cycle, P. Natl. Acad. Sci. USA, 108, 1016–1021, https://doi.org/10.1073/pnas.1014798108, 2011.
Kong, L., Tang, X., Zhu, J., Wang, Z., Pan, Y., Wu, H., Wu, L., Wu, Q., He, Y., Tian, S., Xie, Y., Liu, Z., Sui, W., Han, L., and Carmichael, G.: Improved Inversion of Monthly Ammonia Emissions in China Based on the Chinese Ammonia Monitoring Network and Ensemble Kalman Filter, Environ. Sci. Technol., 53, 12529–12538, https://doi.org/10.1021/acs.est.9b02701, 2019.
Lawal, A. S., Guan, X., Liu, C., Henneman, L. R. F., Vasilakos, P., Bhogineni, V., Weber, R. J., Nenes, A., and Russell, A. G.: Linked Response of Aerosol Acidity and Ammonia to SO2 and NOx Emissions Reductions in the United States, Environ. Sci. Technol., 52, 9861–9873, https://doi.org/10.1021/acs.est.8b00711, 2018.
Li, L.-F., Chen, Z., Liu, P., and Zhang, Y.-H.: Direct Measurement of pH Evolution in Aerosol Microdroplets Undergoing Ammonium Depletion: A Surface-Enhanced Raman Spectroscopy Approach, Environ. Sci. Technol., 56, 6274–6281, https://doi.org/10.1021/acs.est.1c08626, 2022.
Li, M., Zhang, Q., Kurokawa, J.-I., Woo, J.-H., He, K., Lu, Z., Ohara, T., Song, Y., Streets, D. G., Carmichael, G. R., Cheng, Y., Hong, C., Huo, H., Jiang, X., Kang, S., Liu, F., Su, H., and Zheng, B.: MIX: a mosaic Asian anthropogenic emission inventory under the international collaboration framework of the MICS-Asia and HTAP, Atmos. Chem. Phys., 17, 935–963, https://doi.org/10.5194/acp-17-935-2017, 2017.
Li, R., Dong, X., Guo, J. C., Fu, Y. F., Zhao, C., Wang, Y., and Min, Q. L.: The implications of dust ice nuclei effect on cloud top temperature in a complex mesoscale convective system, Sci. Rep., 7, 13826, https://doi.org/10.1038/s41598-017-12681-0, 2017.
Liu, M., Song, Y., Zhou, T., Xu, Z., Yan, C., Zheng, M., Wu, Z., Hu, M., Wu, Y., and Zhu, T.: Fine particle pH during severe haze episodes in northern China, Geophys. Res. Lett., 44, 5213–5221, https://doi.org/10.1002/2017gl073210, 2017.
Liu, T. and Abbatt, J. P. D.: Oxidation of sulfur dioxide by nitrogen dioxide accelerated at the interface of deliquesced aerosol particles, Nat. Chem., 13, 1173–1177, https://doi.org/10.1038/s41557-021-00777-0, 2021.
Liu, T., Clegg, S. L., and Abbatt, J. P. D.: Fast oxidation of sulfur dioxide by hydrogen peroxide in deliquesced aerosol particles, P. Natl. Acad. Sci. USA, 117, 1354–1359, https://doi.org/10.1073/pnas.1916401117, 2020.
Meskhidze, N., Chameides, W. L., Nenes, A., and Chen, G.: Iron mobilization in mineral dust: Can anthropogenic SO2 emissions affect ocean productivity?, Geophys. Res. Lett., 30, 2085, https://doi.org/10.1029/2003gl018035, 2003.
Pitzer, K. S. and Simonson, J. M.: Thermodynamics of multicomponent, miscible, ionic systems: theory and equations, J. Phys. Chem., 90, 3005–3009, https://doi.org/10.1021/j100404a042, 1986.
Pye, H. O. T., Nenes, A., Alexander, B., Ault, A. P., Barth, M. C., Clegg, S. L., Collett Jr., J. L., Fahey, K. M., Hennigan, C. J., Herrmann, H., Kanakidou, M., Kelly, J. T., Ku, I.-T., McNeill, V. F., Riemer, N., Schaefer, T., Shi, G., Tilgner, A., Walker, J. T., Wang, T., Weber, R., Xing, J., Zaveri, R. A., and Zuend, A.: The acidity of atmospheric particles and clouds, Atmos. Chem. Phys., 20, 4809–4888, https://doi.org/10.5194/acp-20-4809-2020, 2020.
Rengarajan, R., Sudheer, A. K., and Sarin, M. M.: Aerosol acidity and secondary organic aerosol formation during wintertime over urban environment in western India, Atmos. Environ., 45, 1940–1945, https://doi.org/10.1016/j.atmosenv.2011.01.026, 2011.
Ruan, X., Zhao, C., Zaveri, R. A., He, P., Wang, X., Shao, J., and Geng, L.: xyruan/wrfchem_ustc4.0: wrfchem_ustc 4.0 including heterogeneous sulfate production in aerosol water and modified cation speciation profiles, Zenodo [code], https://doi.org/10.5281/zenodo.6359417, 2022.
Seaman, N. L., Stauffer, D. R., and Lario-Gibbs, A. M.: A Multiscale Four-Dimensional Data Assimilation System Applied in the San Joaquin Valley during SARMAP. Part I: Modeling Design and Basic Performance Characteristics, J. Appl. Meteorol., 34, 1739–1761, https://doi.org/10.1175/1520-0450(1995)034<1739:Amfdda>2.0.Co;2, 1995.
Seinfeld, J. H. and Pandis, S. N.: Atmospheric chemistry and physics: from air pollution to climate change, John Wiley & Sons, 2016.
Sha, T., Ma, X., Jia, H., Tian, R., Chang, Y., Cao, F., and Zhang, Y.: Aerosol chemical component: Simulations with WRF-Chem and comparison with observations in Nanjing, Atmos. Environ., 218, 1352–2310, https://doi.org/10.1016/j.atmosenv.2019.116982, 2019.
Shao, J., Chen, Q., Wang, Y., Lu, X., He, P., Sun, Y., Shah, V., Martin, R. V., Philip, S., Song, S., Zhao, Y., Xie, Z., Zhang, L., and Alexander, B.: Heterogeneous sulfate aerosol formation mechanisms during wintertime Chinese haze events: air quality model assessment using observations of sulfate oxygen isotopes in Beijing, Atmos. Chem. Phys., 19, 6107–6123, https://doi.org/10.5194/acp-19-6107-2019, 2019.
Shi, G., Xu, J., Peng, X., Xiao, Z., Chen, K., Tian, Y., Guan, X., Feng, Y., Yu, H., Nenes, A., and Russell, A. G.: pH of Aerosols in a Polluted Atmosphere: Source Contributions to Highly Acidic Aerosol, Environ. Sci. Technol., 51, 4289–4296, https://doi.org/10.1021/acs.est.6b05736, 2017.
Shi, X. R., Nenes, A., Xiao, Z. M., Song, S. J., Yu, H. F., Shi, G. L., Zhao, Q. Y., Chen, K., Feng, Y. C., and Russell, A. G.: High-Resolution Data Sets Unravel the Effects of Sources and Meteorological Conditions on Nitrate and Its Gas-Particle Partitioning, Environ. Sci. Technol., 53, 3048–3057, https://doi.org/10.1021/acs.est.8b06524, 2019.
Song, S., Gao, M., Xu, W., Shao, J., Shi, G., Wang, S., Wang, Y., Sun, Y., and McElroy, M. B.: Fine-particle pH for Beijing winter haze as inferred from different thermodynamic equilibrium models, Atmos. Chem. Phys., 18, 7423–7438, https://doi.org/10.5194/acp-18-7423-2018, 2018.
Stauffer, D. R. and Seaman, N. L.: Use of Four-Dimensional Data Assimilation in a Limited-Area Mesoscale Model. Part I: Experiments with Synoptic-Scale Data, Mon. Weather Rev., 118, 1250–1277, https://doi.org/10.1175/1520-0493(1990)118<1250:Uofdda>2.0.Co;2, 1990.
Stokes, R. H. and Robinson, R. A.: Interactions in Aqueous Nonelectrolyte Solutions. I. Solute-Solvent Equilibria, J. Phys. Chem., 70, 2126–2131, https://doi.org/10.1021/j100879a010, 1966.
Sun, Y. L., Wang, Z. F., Fu, P. Q., Jiang, Q., Yang, T., Li, J., and Ge, X. L.: The impact of relative humidity on aerosol composition and evolution processes during wintertime in Beijing, China, Atmos. Environ., 77, 927–934, https://doi.org/10.1016/j.atmosenv.2013.06.019, 2013.
Surratt, J. D., Lewandowski, M., Offenberg, J. H., Jaoui, M., Kleindienst, T. E., Edney, E. O., and Seinfeld, J. H.: Effect of acidity on secondary organic aerosol formation from isoprene, Environ. Sci. Technol., 41, 5363–5369, https://doi.org/10.1021/es0704176, 2007.
Tan, T., Hu, M., Li, M., Guo, Q., Wu, Y., Fang, X., Gu, F., Wang, Y., and Wu, Z.: New insight into PM2.5 pollution patterns in Beijing based on one-year measurement of chemical compositions, Sci. Total Environ., 621, 734–743, https://doi.org/10.1016/j.scitotenv.2017.11.208, 2018.
Tao, W., Su, H., Zheng, G., Wang, J., Wei, C., Liu, L., Ma, N., Li, M., Zhang, Q., Pöschl, U., and Cheng, Y.: Aerosol pH and chemical regimes of sulfate formation in aerosol water during winter haze in the North China Plain, Atmos. Chem. Phys., 20, 11729–11746, https://doi.org/10.5194/acp-20-11729-2020, 2020.
Tao, Y. and Murphy, J. G.: The sensitivity of PM2.5 acidity to meteorological parameters and chemical composition changes: 10-year records from six Canadian monitoring sites, Atmos. Chem. Phys., 19, 9309–9320, https://doi.org/10.5194/acp-19-9309-2019, 2019.
Tie, X., Huang, R.-J., Cao, J., Zhang, Q., Cheng, Y., Su, H., Chang, D., Pöschl, U., Hoffmann, T., Dusek, U., Li, G., Worsnop, D. R., and O'Dowd, C. D.: Severe Pollution in China Amplified by Atmospheric Moisture, Sci. Rep., 7, 15760, https://doi.org/10.1038/s41598-017-15909-1, 2017.
Tilgner, A., Schaefer, T., Alexander, B., Barth, M., Collett Jr., J. L., Fahey, K. M., Nenes, A., Pye, H. O. T., Herrmann, H., and McNeill, V. F.: Acidity and the multiphase chemistry of atmospheric aqueous particles and clouds, Atmos. Chem. Phys., 21, 13483–13536, https://doi.org/10.5194/acp-21-13483-2021, 2021.
Vasilakos, P., Russell, A., Weber, R., and Nenes, A.: Understanding nitrate formation in a world with less sulfate, Atmos. Chem. Phys., 18, 12765–12775, https://doi.org/10.5194/acp-18-12765-2018, 2018.
Wang, G., Zhang, R., Gomez, M. E., Yang, L., Levy Zamora, M., Hu, M., Lin, Y., Peng, J., Guo, S., Meng, J., Li, J., Cheng, C., Hu, T., Ren, Y., Wang, Y., Gao, J., Cao, J., An, Z., Zhou, W., Li, G., Wang, J., Tian, P., Marrero-Ortiz, W., Secrest, J., Du, Z., Zheng, J., Shang, D., Zeng, L., Shao, M., Wang, W., Huang, Y., Wang, Y., Zhu, Y., Li, Y., Hu, J., Pan, B., Cai, L., Cheng, Y., Ji, Y., Zhang, F., Rosenfeld, D., Liss, P. S., Duce, R. A., Kolb, C. E., and Molina, M. J.: Persistent sulfate formation from London Fog to Chinese haze, P. Natl. Acad. Sci. USA, 113, 13630–13635, https://doi.org/10.1073/pnas.1616540113, 2016.
Wang, H. Y., Zhang, D., Zhang, Y. T., Zhai, L. M., Yin, B., Zhou, F., Geng, Y. C., Pan, J. T., Luo, J. F., Gu, B. J., and Liu, H. B.: Ammonia emissions from paddy fields are underestimated in China, Environ. Pollut., 235, 482–488, https://doi.org/10.1016/j.envpol.2017.12.103, 2018.
Wang, S., Wang, L., Li, Y., Wang, C., Wang, W., Yin, S., and Zhang, R.: Effect of ammonia on fine-particle pH in agricultural regions of China: comparison between urban and rural sites, Atmos. Chem. Phys., 20, 2719–2734, https://doi.org/10.5194/acp-20-2719-2020, 2020.
Wang, W., Liu, M., Wang, T., Song, Y., Zhou, L., Cao, J., Hu, J., Tang, G., Chen, Z., Li, Z., Xu, Z., Peng, C., Lian, C., Chen, Y., Pan, Y., Zhang, Y., Sun, Y., Li, W., Zhu, T., Tian, H., and Ge, M.: Sulfate formation is dominated by manganese-catalyzed oxidation of SO2 on aerosol surfaces during haze events, Nat. Commun., 12, 1993, https://doi.org/10.1038/s41467-021-22091-6, 2021.
Wang, X., Jacob, D. J., Eastham, S. D., Sulprizio, M. P., Zhu, L., Chen, Q., Alexander, B., Sherwen, T., Evans, M. J., Lee, B. H., Haskins, J. D., Lopez-Hilfiker, F. D., Thornton, J. A., Huey, G. L., and Liao, H.: The role of chlorine in global tropospheric chemistry, Atmos. Chem. Phys., 19, 3981–4003, https://doi.org/10.5194/acp-19-3981-2019, 2019.
Wang, X., Jacob, D. J., Fu, X., Wang, T., Breton, M. L., Hallquist, M., Liu, Z., McDuffie, E. E., and Liao, H.: Effects of Anthropogenic Chlorine on PM2.5 and Ozone Air Quality in China, Environ. Sci. Technol., 54, 9908–9916, https://doi.org/10.1021/acs.est.0c02296, 2020.
Weber, R. J., Guo, H. Y., Russell, A. G., and Nenes, A.: High aerosol acidity despite declining atmospheric sulfate concentrations over the past 15 years, Nat. Geosci., 9, 282–285, https://doi.org/10.1038/Ngeo2665, 2016.
Wu, Z., Wang, Y., Tan, T., Zhu, Y., Li, M., Shang, D., Wang, H., Lu, K., Guo, S., Zeng, L., and Zhang, Y.: Aerosol Liquid Water Driven by Anthropogenic Inorganic Salts: Implying Its Key Role in Haze Formation over the North China Plain, Environ. Sci. Tech. Let., 5, 160–166, https://doi.org/10.1021/acs.estlett.8b00021, 2018.
Xie, Y., Wang, G., Wang, X., Chen, J., Chen, Y., Tang, G., Wang, L., Ge, S., Xue, G., Wang, Y., and Gao, J.: Nitrate-dominated PM2.5 and elevation of particle pH observed in urban Beijing during the winter of 2017, Atmos. Chem. Phys., 20, 5019–5033, https://doi.org/10.5194/acp-20-5019-2020, 2020.
Yang, W., Zhang, Y., Wang, X., Li, S., Zhu, M., Yu, Q., Li, G., Huang, Z., Zhang, H., Wu, Z., Song, W., Tan, J., and Shao, M.: Volatile organic compounds at a rural site in Beijing: influence of temporary emission control and wintertime heating, Atmos. Chem. Phys., 18, 12663–12682, https://doi.org/10.5194/acp-18-12663-2018, 2018.
Zaveri, R. A. and Peters, L. K.: A new lumped structure photochemical mechanism for large-scale applications, J. Geophys. Res.-Atmos., 104, 30387–30415, https://doi.org/10.1029/1999jd900876, 1999.
Zaveri, R. A., Easter, R. C., and Peters, L. K.: A computationally efficient multicomponent equilibrium solver for aerosols (MESA), J. Geophys. Res.-Atmos., 110, D24203, https://doi.org/10.1029/2004JD005618, 2005a.
Zaveri, R. A., Easter, R. C., and Wexler, A. S.: A new method for multicomponent activity coefficients of electrolytes in aqueous atmospheric aerosols, J. Geophys. Res.-Atmos., 110, D02201, https://doi.org/10.1029/2004jd004681, 2005b.
Zaveri, R. A., Easter, R. C., Fast, J. D., and Peters, L. K.: Model for Simulating Aerosol Interactions and Chemistry (MOSAIC), J. Geophys. Res.-Atmos., 113, D13204, https://doi.org/10.1029/2007JD008782, 2008.
Zdanovskii, A.: New methods for calculating solubilities of electrolytes in multicomponent systems, Zh. Fiz. Khim, 22, 1475–1485, 1948.
Zhang, B., Shen, H., Liu, P., Guo, H., Hu, Y., Chen, Y., Xie, S., Xi, Z., Skipper, T. N., and Russell, A. G.: Significant contrasts in aerosol acidity between China and the United States, Atmos. Chem. Phys., 21, 8341–8356, https://doi.org/10.5194/acp-21-8341-2021, 2021.
Zhang, J., Chen, Z., Lu, Y., Gui, H., Liu, J., Liu, W., Wang, J., Yu, T., Cheng, Y., Chen, Y., Ge, B., Fan, Y., and Luo, X.: Characteristics of aerosol size distribution and vertical backscattering coefficient profile during 2014 APEC in Beijing, Atmos. Environ., 148, 30–41, https://doi.org/10.1016/j.atmosenv.2016.10.020, 2017.
Zhang, L., Chen, Y., Zhao, Y., Henze, D. K., Zhu, L., Song, Y., Paulot, F., Liu, X., Pan, Y., Lin, Y., and Huang, B.: Agricultural ammonia emissions in China: reconciling bottom-up and top-down estimates, Atmos. Chem. Phys., 18, 339–355, https://doi.org/10.5194/acp-18-339-2018, 2018.
Zhao, C., Liu, X., Leung, L. R., Johnson, B., McFarlane, S. A., Gustafson Jr., W. I., Fast, J. D., and Easter, R.: The spatial distribution of mineral dust and its shortwave radiative forcing over North Africa: modeling sensitivities to dust emissions and aerosol size treatments, Atmos. Chem. Phys., 10, 8821–8838, https://doi.org/10.5194/acp-10-8821-2010, 2010.
Zhao, C., Chen, S., Leung, L. R., Qian, Y., Kok, J. F., Zaveri, R. A., and Huang, J.: Uncertainty in modeling dust mass balance and radiative forcing from size parameterization, Atmos. Chem. Phys., 13, 10733–10753, https://doi.org/10.5194/acp-13-10733-2013, 2013a.
Zhao, C., Leung, L. R., Easter, R., Hand, J., and Avise, J.: Characterization of speciated aerosol direct radiative forcing over California, J. Geophys. Res.-Atmos., 118, 2372–2388, https://doi.org/10.1029/2012jd018364, 2013b.
Zheng, G., Su, H., Wang, S., Andreae, M. O., Poschl, U., and Cheng, Y.: Multiphase buffer theory explains contrasts in atmospheric aerosol acidity, Science, 369, 1374–1377, https://doi.org/10.1126/science.aba3719, 2020.