the Creative Commons Attribution 4.0 License.
the Creative Commons Attribution 4.0 License.
 | 20 Jul 2022
Improved representation of plant physiology in the JULES-vn5.6 land surface model: photosynthesis, stomatal conductance and thermal acclimation
Lina M. Mercado
Doug B. Clark
Chris Huntingford
Christopher M. Taylor
Pier Luigi Vidale
Patrick C. McGuire
Markus Todt
Sonja Folwell
Valiyaveetil Shamsudheen Semeena
Belinda E. Medlyn
Carbon and water cycle dynamics of vegetation are controlled primarily by photosynthesis and stomatal conductance (gs). Our goal is to improve the representation of these key physiological processes within the JULES land surface model, with a particular focus on refining the temperature sensitivity of photosynthesis, impacting modelled carbon, energy and water fluxes. We test (1) an implementation of the Farquhar et al. (1980) photosynthesis scheme and associated plant functional type-dependent photosynthetic temperature response functions, (2) the optimality-based gs scheme from Medlyn et al. (2011) and (3) the Kattge and Knorr (2007) photosynthetic capacity thermal acclimation scheme. New parameters for each model configuration are adopted from recent large observational datasets that synthesise global experimental data. These developments to JULES incorporate current physiological understanding of vegetation behaviour into the model and enable users to derive direct links between model parameters and ongoing measurement campaigns that refine such parameter values. Replacement of the original Collatz et al. (1991) C3 photosynthesis model with the Farquhar scheme results in large changes in GPP for the current day, with ∼ 10 % reduction in seasonal (June–August, JJA, and December–February, DJF) mean GPP in tropical forests and ∼ 20 % increase in the northern high-latitude forests in JJA. The optimality-based gs model decreases the latent heat flux for the present day (∼ 10 %, with an associated increase in sensible heat flux) across regions dominated by needleleaf evergreen forest in the Northern Hemisphere summer. Thermal acclimation of photosynthesis coupled with the Medlyn gs scheme reduced tropical forest GPP by up to 5 % and increased GPP in the high-northern-latitude forests by between 2 % and 5 %. Evaluation of simulated carbon and water fluxes by each model configuration against global data products shows this latter configuration generates improvements in these key areas. Thermal acclimation of photosynthesis coupled with the Medlyn gs scheme improved modelled carbon fluxes in tropical and high-northern-latitude forests in JJA and improved the simulation of evapotranspiration across much of the Northern Hemisphere in JJA. Having established good model performance for the contemporary period, we force this new version of JULES offline with a future climate scenario corresponding to rising atmospheric greenhouse gases (Shared Socioeconomic Pathway (SSP5), Representative Concentration Pathway 8.5 (RCP8.5)). In particular, these calculations allow for understanding of the effects of long-term warming. We find that the impact of thermal acclimation coupled with the optimality-based gs model on simulated fluxes increases latent heat flux (+50 %) by the year 2050 compared to the JULES model configuration without acclimation. This new JULES configuration also projects increased GPP across tropical (+10 %) and northern-latitude regions (+30 %) by 2050. We conclude that thermal acclimation of photosynthesis with the Farquhar photosynthesis scheme and the new optimality-based gs scheme together improve the simulation of carbon and water fluxes for the current day and have a large impact on modelled future carbon cycle dynamics in a warming world.
- Article
(7932 KB) - Full-text XML
-
Supplement
(10544 KB) - BibTeX
- EndNote


Photosynthesis and stomatal conductance (gs) together exert a strong control over the exchange of carbon, water and energy between the land surface and the atmosphere. The behaviour of stomatal pores on the leaf surface link these processes, controlling the amount of carbon dioxide (CO2) entering and water leaving each leaf. Photosynthesis represents the largest exchange of carbon between the land and atmosphere (Friedlingstein et al., 2020), being more substantial than respiration loss. This imbalance is central to the global carbon cycle because it slows the rate of accumulation of CO2 in the atmosphere caused by fossil fuel burning and therefore also lowers the rate of atmospheric temperature increase. As stomata open to take up CO2 for photosynthesis, plants also lose water through transpiration, and this flux has been estimated to account for 60 %–80 % of evapotranspiration (ET) across the land surface (Jasechko et al., 2013; Schlesinger and Jasechko, 2014). Hence, for vegetated surfaces, transpiration is the primary driver of the latent heat flux (LE), the latter describing the overall transfer of water vapour to the atmosphere. The partitioning of available net radiation between LE and sensible heat (H) is also a key determinant of land surface temperature, therefore having a feedback on photosynthesis and other key metabolic processes that influence the global carbon cycle such as plant respiration.
Land surface models (LSMs) simulate the exchange of carbon, water and energy between the land surface and the atmosphere, providing the lower boundary conditions for the atmospheric component of Earth system models (ESMs) when run in a coupled configuration. ESM projections form the main tool to predict future climate change and underpin much of the regular United Nations Intergovernmental Panel on Climate Change (IPCC) reports that inform policymakers. However, ESM predictions of the global carbon sink are fraught with large uncertainties surrounding projections of future carbon uptake (Friedlingstein et al., 2014), causing uncertainty in any translation from CO2 emissions to atmospheric CO2 trajectory. A lack of knowledge in how the global carbon cycle operates creates uncertainties in translating from emissions to global warming, and these uncertainties are a sizeable fraction of those associated with unknowns of physical climate processes (Huntingford et al., 2009). Therefore, given the critical role of both photosynthesis and gs in determining land–atmosphere exchanges, their accurate representation and parameterisation in LSMs are of paramount importance. Booth et al. (2012) show that a significant uncertainty is the temperature sensitivity of photosynthesis and suggest that thermal acclimation of photosynthesis – where plants adjust their optimum temperature for photosynthesis to growth conditions experienced over the timescale of days to weeks – might reduce the spread in modelled carbon exchange. Yet despite strong evidence of the thermal acclimation capability of plant photosynthesis (Dusenge et al., 2020; Slot et al., 2021; Way et al., 2017; Way and Yamori, 2014; Yamaguchi et al., 2016), incorporation of this process in large-scale LSMs is limited to only a few, for example, TEM (Chen and Zhuang, 2013), CLM4.5 (Lombardozzi et al., 2015), LM3 (Smith et al., 2016), JULES (Mercado et al., 2018), ORCHIDEE (Krinner et al., 2005) and BETHY (Ziehn et al., 2011), and is not yet commonly represented in ESMs. Currently, the majority of LSMs and ESMs use simple fixed (i.e. non-acclimating) temperature response functions for photosynthetic capacity parameters (Smith and Dukes, 2013), which, in general, cause the rate of leaf photosynthesis to increase with temperature to an optimum and then decrease under higher temperatures. These functional forms are either generic for all C3 and C4 species and fixed in time and space or are dependent on a small number of plant functional types (PFTs) but again fixed in time and space. Consequently, climate–carbon feedbacks in ESMs are sensitive to the assumed value of the fixed optimum temperature for photosynthetic capacity (Topt) because the amount of carbon assimilated depends on whether leaf temperature is dominantly above or below Topt. Improved process representation of gs, photosynthesis and its temperature sensitivity in LSMs is necessary to support robust predictions of global climate change via their coupling into ESMs. Modelling studies have shown how photosynthesis and gs impact climate feedbacks, play a critical role in how climate will change, and strongly influence climate-induced impacts such as water resources (Betts et al., 2007; Cruz et al., 2010; De Arellano et al., 2012; Gedney et al., 2006; Kooperman et al., 2018; Zeng et al., 2017).
This study, therefore, updates the plant physiology routines in the Joint UK Land Surface Environment Simulator (JULES-vn5.6) LSM, the land surface component of the UK Hadley Centre ESM (Sellar et al., 2019). To date, JULES has employed the mechanistic C3 photosynthesis scheme of Collatz et al. (1991) (“Collatz”). However, the Farquhar et al. (1980) (“Farquhar”) scheme is more generally adopted by those modelling photosynthetic response and by researchers analysing data from empirical studies. The Farquhar scheme has been recently implemented in JULES by Mercado et al. (2018) for C3 plant types, though a big leaf canopy scaling approach was used, and it was not parameterised and evaluated for global applications. Here we build on that previous study by using a data-driven approach incorporating data from multiple biomes to parameterise the Farquhar model photosynthetic capacity parameters and their temperature sensitivity so it is amenable for use in global studies. Our specific rationale for including the Farquhar photosynthesis scheme is twofold. Firstly, studies by Rogers et al. (2017) and Walker et al. (2021) demonstrate that despite only the Collatz or Farquhar descriptions of leaf photosynthesis being in general use, simulated photosynthesis varies significantly between LSMs. This variation is attributed to several factors, including (1) differences in prescribed Rubisco kinetic constants and their temperature responses (Rogers et al., 2017), (2) structural differences, namely the method used to determine the transition point between the limiting rates of photosynthesis which has a disproportionate impact on estimates (Huntingford and Oliver, 2021; Walker et al., 2021), and (3) the sensitivity of photosynthesis to temperature, in terms of the under-representation of parameters from different biomes to describe the short-term instantaneous response of photosynthesis to temperature (Rogers et al., 2017). In particular, these differences imply that parameter values derived calibrating the Collatz model against data will differ to those derived using Farquhar against the same set of measurements. Parameter values are not transferable between models; hence such differences will lead to inconsistencies and projection errors if parameters are fitted to data but then applied within the alternative model. Building in the capacity of an LSM to run with either photosynthesis scheme greatly enhances flexibility in modelling. Importantly, this flexibility allows for consistency between parameters used by empiricists to derive leaf-level photosynthetic parameters from observations and those used in large-scale modelling. Additionally, our re-parameterisation of the photosynthetic capacity and temperature sensitivity parameters is based on recent global datasets that are more extensive, including species from a range of different biomes, further enhancing the capacity for global modelling applications. Our second rationale is that the Farquhar photosynthesis scheme is required as the underlying model to implement the Kattge and Knorr (2007) thermal acclimation scheme.
Leaf-level gs response to water vapour is commonly represented in LSMs empirically (Jarvis et al., 1976) or with a semi-empirical model (Ball et al., 1987; Damour et al., 2010; Leuning, 1995). Values of gs are subsequently scaled, yielding an estimate of canopy conductance for vegetation in different ecosystems. De Kauwe et al. (2013) showed that 10 of the 11 ecosystem models studied in their inter-comparison used a form of the Ball–Berry–Leuning approximation. This model form links gs to changes in environmental conditions and directly to photosynthetic rate. However, there is increasing interest in using models based on optimisation theory (Franks et al., 2017, 2018), using evidence that stomata may behave to maximise CO2 gain whilst minimising water loss. The major advantage of optimality theory is that the optimisation criterion will apply under any environmental conditions, past or future. Hence the derived equations can replace uncertain mechanistic formulations and may also have more predictive capability corresponding to future climate regimes. JULES traditionally uses the empirically based Jacobs (1994) gs scheme (“Jacobs”), and in this study we compare the behaviour of this scheme against the Medlyn et al. (2011) gs scheme (“Medlyn”), which is based on optimisation theory. The Medlyn gs model has been previously implemented in JULES by Oliver et al. (2018). However, in this study, we advance on that previous work by calibrating for the increased number of plant functional types now in JULES (nine PFTs, as opposed to five in the original study), and we parameterise using data from a global synthesis of experimental observations.
There is increasing evidence that the short-term vegetation temperature responses are themselves sensitive to temperatures experienced over longer timescales (days to weeks to seasons) and, in particular, have the capability to acclimate to growth temperature (Tgrowth) (Kattge and Knorr, 2007). Observational evidence of thermal acclimation of photosynthesis has been widely reported, primarily for temperate and boreal ecosystems (Atkin et al., 2006; Gunderson et al., 2000, 2010; Hikosaka et al., 2007; Way and Yamori, 2014; Yamori et al., 2014). The effect is defined as the fast temporal adjustment of the temperature response of photosynthesis driven by a change in Tgrowth. Thermal acclimation of photosynthesis typically results in a shift in the optimum temperature (Topt) for photosynthesis towards the new growth temperature, which can result in an increase or maintenance of the photosynthetic rate respective to Tgrowth (Yamori et al., 2014). In this study, we implement thermal acclimation of photosynthetic capacity in JULES using the scheme from Kattge and Knorr (2007). The scheme attributes all changes in the photosynthetic response to changing Tgrowth, without specifically separating adaptation from acclimation processes. Of those LSMs that do account for thermal acclimation of photosynthesis (e.g. TEM, CLM4.5, LM3, JULES) (Chen and Zhuang, 2013; Lombardozzi et al., 2015; Mercado et al., 2018; Smith et al., 2016), all similarly use this numerical algorithm from Kattge and Knorr (2007). Mercado et al. (2018) investigated the impacts of thermal acclimation on the future land carbon sink using an implementation of the Kattge and Knorr (2007) in JULES though using a simple big leaf scaling approach. In this study we apply the thermal acclimation scheme in the updated JULES model (i.e. newly parameterised Farquhar scheme, running with a multi-layer canopy and nine PFTs) and updated with the Medlyn gs scheme and related parameters.
This paper therefore brings together these three key recent developments of the JULES plant physiology routines, (1) implementation of the Farquhar photosynthesis scheme, (2) the optimisation-based Medlyn model of stomatal opening and (3) thermal acclimation of photosynthesis, along with updated parameters and an evaluation of model behaviour. We make incremental additions of the different processes to the JULES model in a set of factorial simulations and run the model with current-day (1979 to 2013) near-surface meteorological forcing and CO2 levels. First, we present the different factorial simulations in the context of a thorough evaluation of simulated contemporary carbon and energy fluxes. Such evaluation includes comparison against individual eddy covariance sites and at spatial scales up to the global scale against satellite products. Timescales analysed are both seasonal and annual. Secondly, we apply the new model configurations within a past-to-future climate change simulation based on a high-end emissions scenario (Shared Socioeconomic Pathway (SSP5) Representative Concentration Pathway 8.5 (RCP8.5)). We use output from HadGEM3-GC3.1 spanning the years 1960 to 2050 to explore sensitivity of global vegetation to future climate change. This choice of scenario is to allow for eventual comparison between these offline simulations and the equivalent in the coupled global climate model to investigate land–atmosphere feedbacks resulting from these changes to the plant physiology routines. This is currently work being undertaken. This updated version of the JULES model is now available in official JULES releases for use by the community (see “Code and data availability” section). It is therefore also readily available for full coupling into the UK community ESM (UKESM), a process that is just starting.
2.1 JULES land surface model
Our modelling framework is JULES (https://jules.jchmr.org, last access: 5 April 2022), the land surface component of the Hadley Centre climate models, which includes the new UK community Earth System Model (UKESM1) (Sellar et al., 2019). JULES can be run offline, as in this study, forced with observed meteorology, at different spatial scales (from a single location to global). A full description of JULES is provided in Best et al. (2011), Clark et al. (2011) and Harper et al. (2016). Of particular relevance for this study is the plant physiological representation in JULES. JULES uses a leaf-level coupled model of photosynthesis and gs (Cox et al., 1998) based on Collatz et al. (1991, 1992) (for C3 and C4 plants) and Jacobs (1994) respectively. Photosynthesis and gs are modelled to respond to changes in environmental drivers of temperature, humidity deficit, light, CO2 concentration and water availability. Soil moisture content is modelled using a dimensionless soil water stress factor, which is related to the mean soil water concentration in the root zone, and the soil water contents at the critical and wilting point (Best et al., 2011). The critical and wilting point soil moisture concentrations vary by soil type in these simulations. In this study, JULES uses a multilayer canopy radiation interception and photosynthesis scheme (i.e. 10 layers) that accounts for vertical variation of incoming direct and diffuse radiation, sunfleck penetration through the canopy, change in photosynthetic capacity with depth into the canopy and inhibition of leaf respiration in the light and differentiates calculation of sunlit and shaded photosynthesis at each layer (Clark et al., 2011; Mercado et al., 2009). The implementation of a multilayer canopy for light interception in JULES was shown to improve modelled canopy-scale photosynthetic fluxes at eddy covariance sites compared to the “big leaf approach” (Blyth et al., 2011; Jogireddy et al., 2006; Mercado et al., 2007). Specifically, the multi-layer approach better captured the light response and diurnal cycles of canopy photosynthesis. While light inhibition of leaf respiration and changing photosynthetic capacity with canopy depth are supported by observations (Atkin et al., 2000, 1998; Meir et al., 2002). Sunfleck penetration through the canopy and the differential effects of direct and diffuse beam radiation on modelled carbon and water exchange in JULES were studied by Mercado et al. (2009). This enabled JULES to reproduce the different light-response curves of GPP under diffuse and direct radiation conditions at both a broadleaf and needleleaf temperate forest.
2.2 Physiology developments
2.2.1 Farquhar photosynthesis for C3 plants and parameterisation
We implement the Farquhar photosynthesis scheme (Farquhar et al., 1980) to describe the leaf-level biochemistry of photosynthesis for C3 vegetation following the approach of Mercado et al. (2018). Here the leaf-level photosynthesis is calculated as the minimum (note no smoothing) of two potentially limiting rates (Eq. 1a). These two rates are (i) Rubisco-limited photosynthesis (Eq. 2) and (ii) light-limited photosynthesis with a dependence on the incident photosynthetically active photon flux density and the potential electron transport rate (Eqs. 3 and 4). Note, as in the original Farquhar formulation, we do not include a TPU-limited (triose phosphate utilisation) rate. Further, recent empirical studies suggest that TPU limitation rarely limits photosynthesis under present-day CO2 concentrations and is also unlikely to limit photosynthesis at elevated CO2 (Kumarathunge et al., 2019a). This, and the current uncertainty in the formulation of TPU limitation of photosynthesis, led Rogers et al. (2021) to conclude it is an unnecessary complication in LSMs. Hence,
where Ap is the net potential (i.e. unstressed) leaf photosynthetic carbon uptake (mol m2 s−1), Rd is the rate of leaf respiration in the dark (mol m2 s−1) and An is the net photosynthetic rate (mol m2 s−1), which accounts for the impact of soil moisture stress on photosynthetic rate by multiplying Ap by the soil water stress factor β. Rubisco-limited photosynthesis (Av, mol m2 s−1) is calculated as in Eq. (2). The maximum rate of carboxylation of Rubisco is determined by Vcmax (mol m2 s−1), ci and oa are the intercellular concentrations of CO2 and O2 (both Pa), Kc and Ko (both units of Pa) are the Michaelis Menten coefficients for Rubisco carboxylation and oxygenation respectively, and Γ (Pa) is the CO2 compensation point in the absence of mitochondrial respiration.
The light-limited rate of photosynthesis (Aj, mol m2 s−1) (Eq. 3) is a function of the rate of electron transport J (mol m2 s−1) which is represented in Eq. (4). J depends on the incident photosynthetically active photon flux density Q (mol quanta m2 s−1), the potential rate of electron transport Jmax (mol m2 s−1), the apparent quantum yield of electron transport α (mol electrons mol−1 photon) fixed at 0.3 (mol electrons mol−1 photon) following Medlyn et al. (2002) and θ a non-rectangular hyperbola smoothing parameter, which takes a value of 0.9 (unitless) following Medlyn et al. (2002). The factor of 4 used in the Farquhar model in Eq. (3) accounts for four electrons being required per carboxylation/oxygenation reaction.
JULES currently uses Q10 functions in the Collatz scheme to describe the temperature dependency of Vcmax, Kc, Ko and Γ (see Sect. S1 in the Supplement). In our implementation of the Farquhar scheme, temperature sensitivities for the Kc, Ko and Γ are taken from Bernacchi et al. (2001) as described in Medlyn et al. (2002). These are the same temperature sensitivities used by experimentalist to derive estimates of photosynthetic capacity parameters (Rogers et al., 2017). Of particular importance to our analysis here are the temperature responses of Vcmax and Jmax. Equation (5) describes the temperature response of both parameters:
Here, kT (µmol m2 s−1) is either Vcmax or Jmax at leaf temperature Tl (K), k25 (µmol m2 s−1) is the rate of Vcmax or Jmax at the reference temperature Tref of 25 ∘C (298.15 K), R is the universal gas constant (8.314 J mol−1 K−1), Ha and Hd (J mol−1) are the activation and deactivation energies respectively, and ΔS (J mol−1 K−1) is an entropy term (see Table 1 for PFT-specific parameter values). Broadly, Ha describes the rate of exponential increase in the function below the optimum temperature (Topt), and Hd describes the rate of decrease above the Topt. ΔS and Topt are related by Eq. (6), which is used to calculate the Topt of Vcmax and Jmax (Table 1):
Table 1PFT-specific parameters for the required temperature dependency of Vcmax and Jmax in the Collatz and Farquhar photosynthesis schemes. PFT codes (left column) are BET-tr – broadleaf evergreen tropical tree, BET-te – broadleaf evergreen temperate tree, BDT – broadleaf deciduous tree, NET – needle leaf evergreen tree, NDT – needle leaf deciduous tree, C3 – C3 grass, C4 – C4 grass, ESH – evergreen shrub, DSH – deciduous shrub.
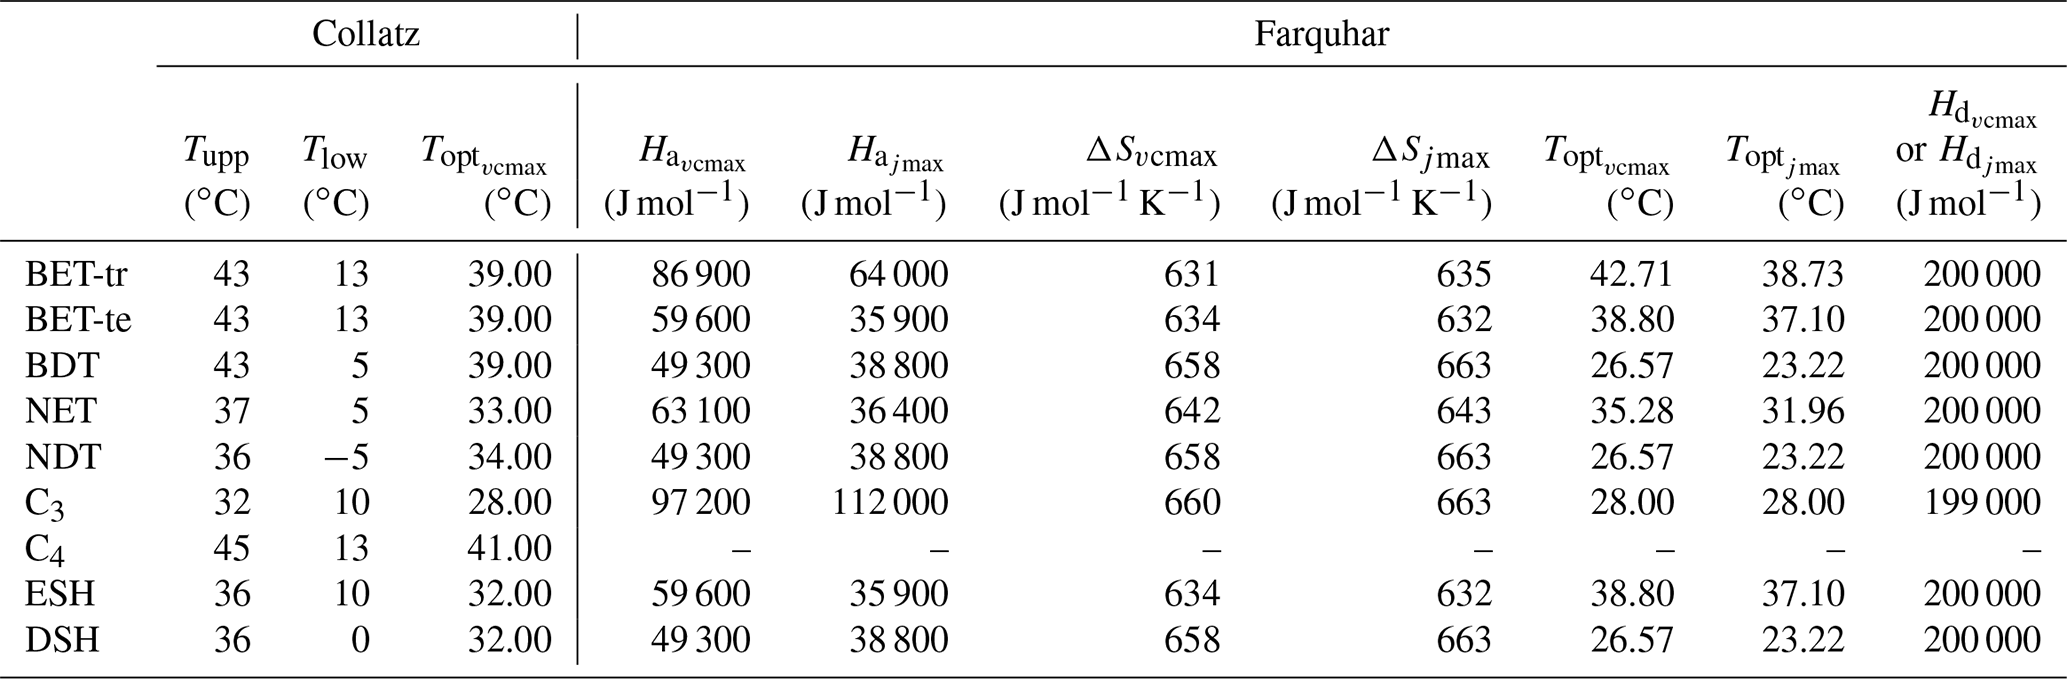
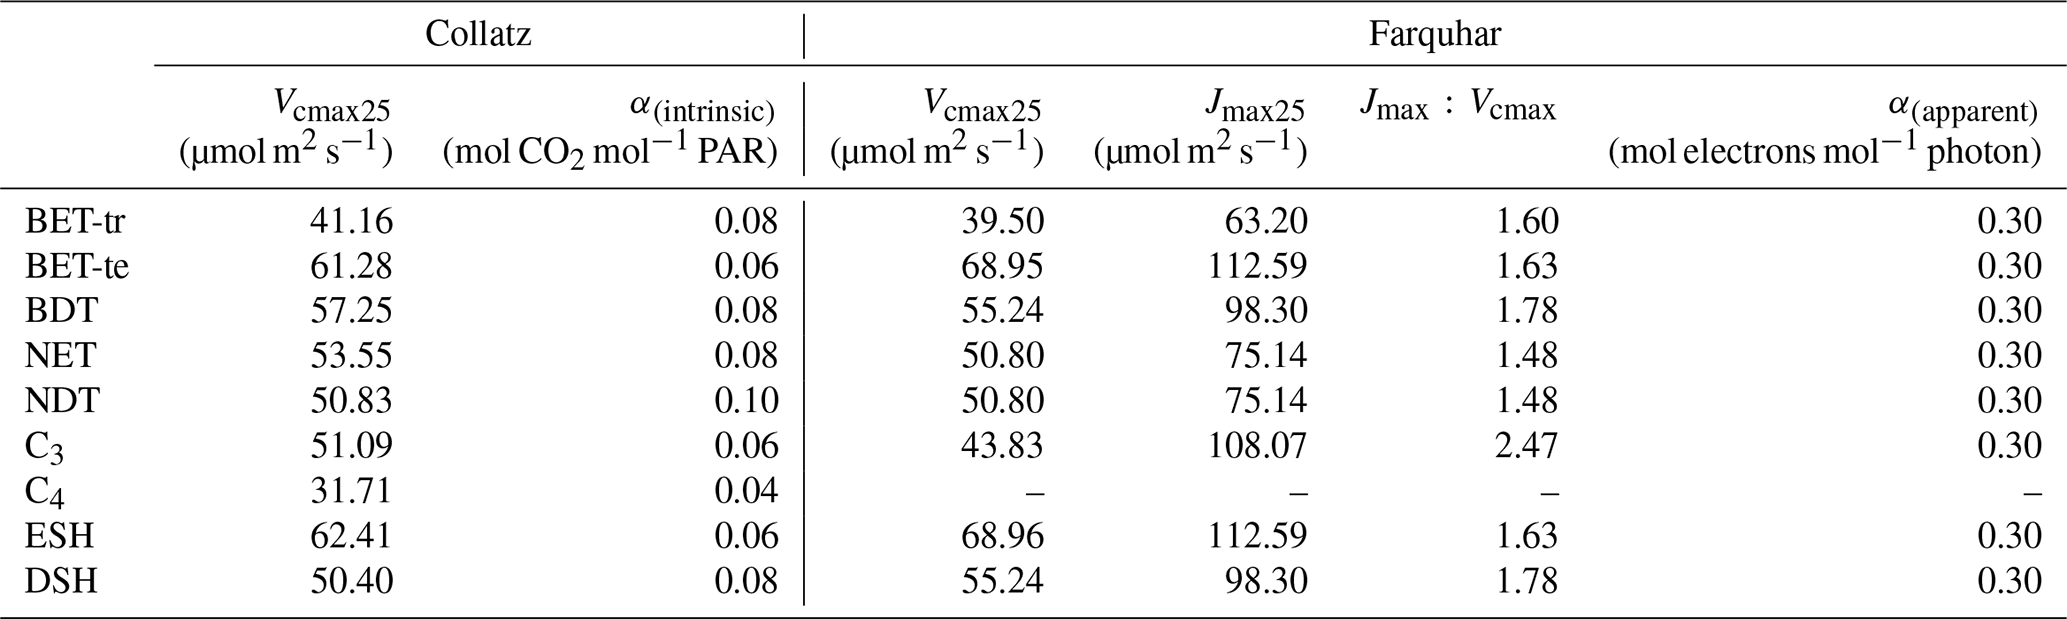
To find new estimates for Vcmax and the ratio at Tref of 25 ∘C for use with the Farquhar model for the nine PFTs in JULES, we used the global dataset from Walker et al. (2014), which includes data from 356 species. For Vcmax and Jmax, Walker et al. (2014) re-analysed the data to remove the variation in these two parameters across studies caused by different parametric assumptions used in their derivation from A−Ci curves (e.g. using a common set of kinetic parameters and reporting values at 25 ∘C). We calculated the mean Vcmax and Jmax across studies conducted at ambient CO2 concentration for each of the JULES PFTs (Table 2). To parameterise the deciduous needleleaf tree (NDT) PFT, we use the values for the evergreen needleleaf tree (NET) PFT because the data for NDT were from a single study on one juvenile (3 years old) species. An exception was the tropical broadleaf evergreen tree (BET-tr) PFT, where we use Vcmax and Jmax from the dataset collated in the more recent compilation by Kumarathunge et al. (2019b), as this study includes many more tropical tree species than any previous meta-analysis.
Parameter values for the temperature response functions for Vcmax and Jmax (Eq. 5) in the Farquhar scheme were taken from a global dataset of photosynthetic CO2 response curves, which entrained data from 141 C3 species, ranging from the tropical rainforest to Arctic tundra (Kumarathunge et al., 2019b). The study provides parameter values for tree PFTs that match those in JULES, for example, tropical broadleaf evergreen trees (BET-tr PFT in JULES), temperate broadleaf evergreen trees (BET-te), broadleaf deciduous trees (BDTs) and needleleaf evergreen trees (NETs). For the remaining JULES PFTs, BDT values are used for NDT and deciduous shrubs (DSH), and BET-te values are used for evergreen shrubs (ESH). Kumarathunge et al. (2019b) do not include data for C3 grasses; therefore to parameterise the temperature dependency of Vcmax and Jmax for this PFT, we fitted both to the existing Vcmaxtemperature response function in the Collatz scheme for C3 grasses because of a scarcity of data in the literature. Figure S1 in the Supplement shows the temperature dependency of Vcmax, Jmax and gross photosynthesis for Collatz and Farquhar using the PFT-specific parameters in Tables 1 and 2.
Table 2PFT-specific parameters for the Collatz and Farquhar photosynthesis schemes.
2.2.2 Medlyn model of gs and parameterisation
In JULES, gs (m s−1) is represented in Eq. (7).
where the factor 1.6 accounts for gs being the conductance for water vapour rather than CO2, R is the universal gas constant (J mol−1 K−1), Tl is the leaf surface temperature (K), ca and ci (both Pa) are the leaf surface and internal CO2 partial pressures respectively, and An is the net photosynthetic rate. Here, ci is unknown and is calculated in JULES using the Jacobs scheme as in Eq. (8) and relates the ratio of ambient (ca) to leaf intercellular (ci) partial pressure of CO2 (), to leaf humidity deficit:
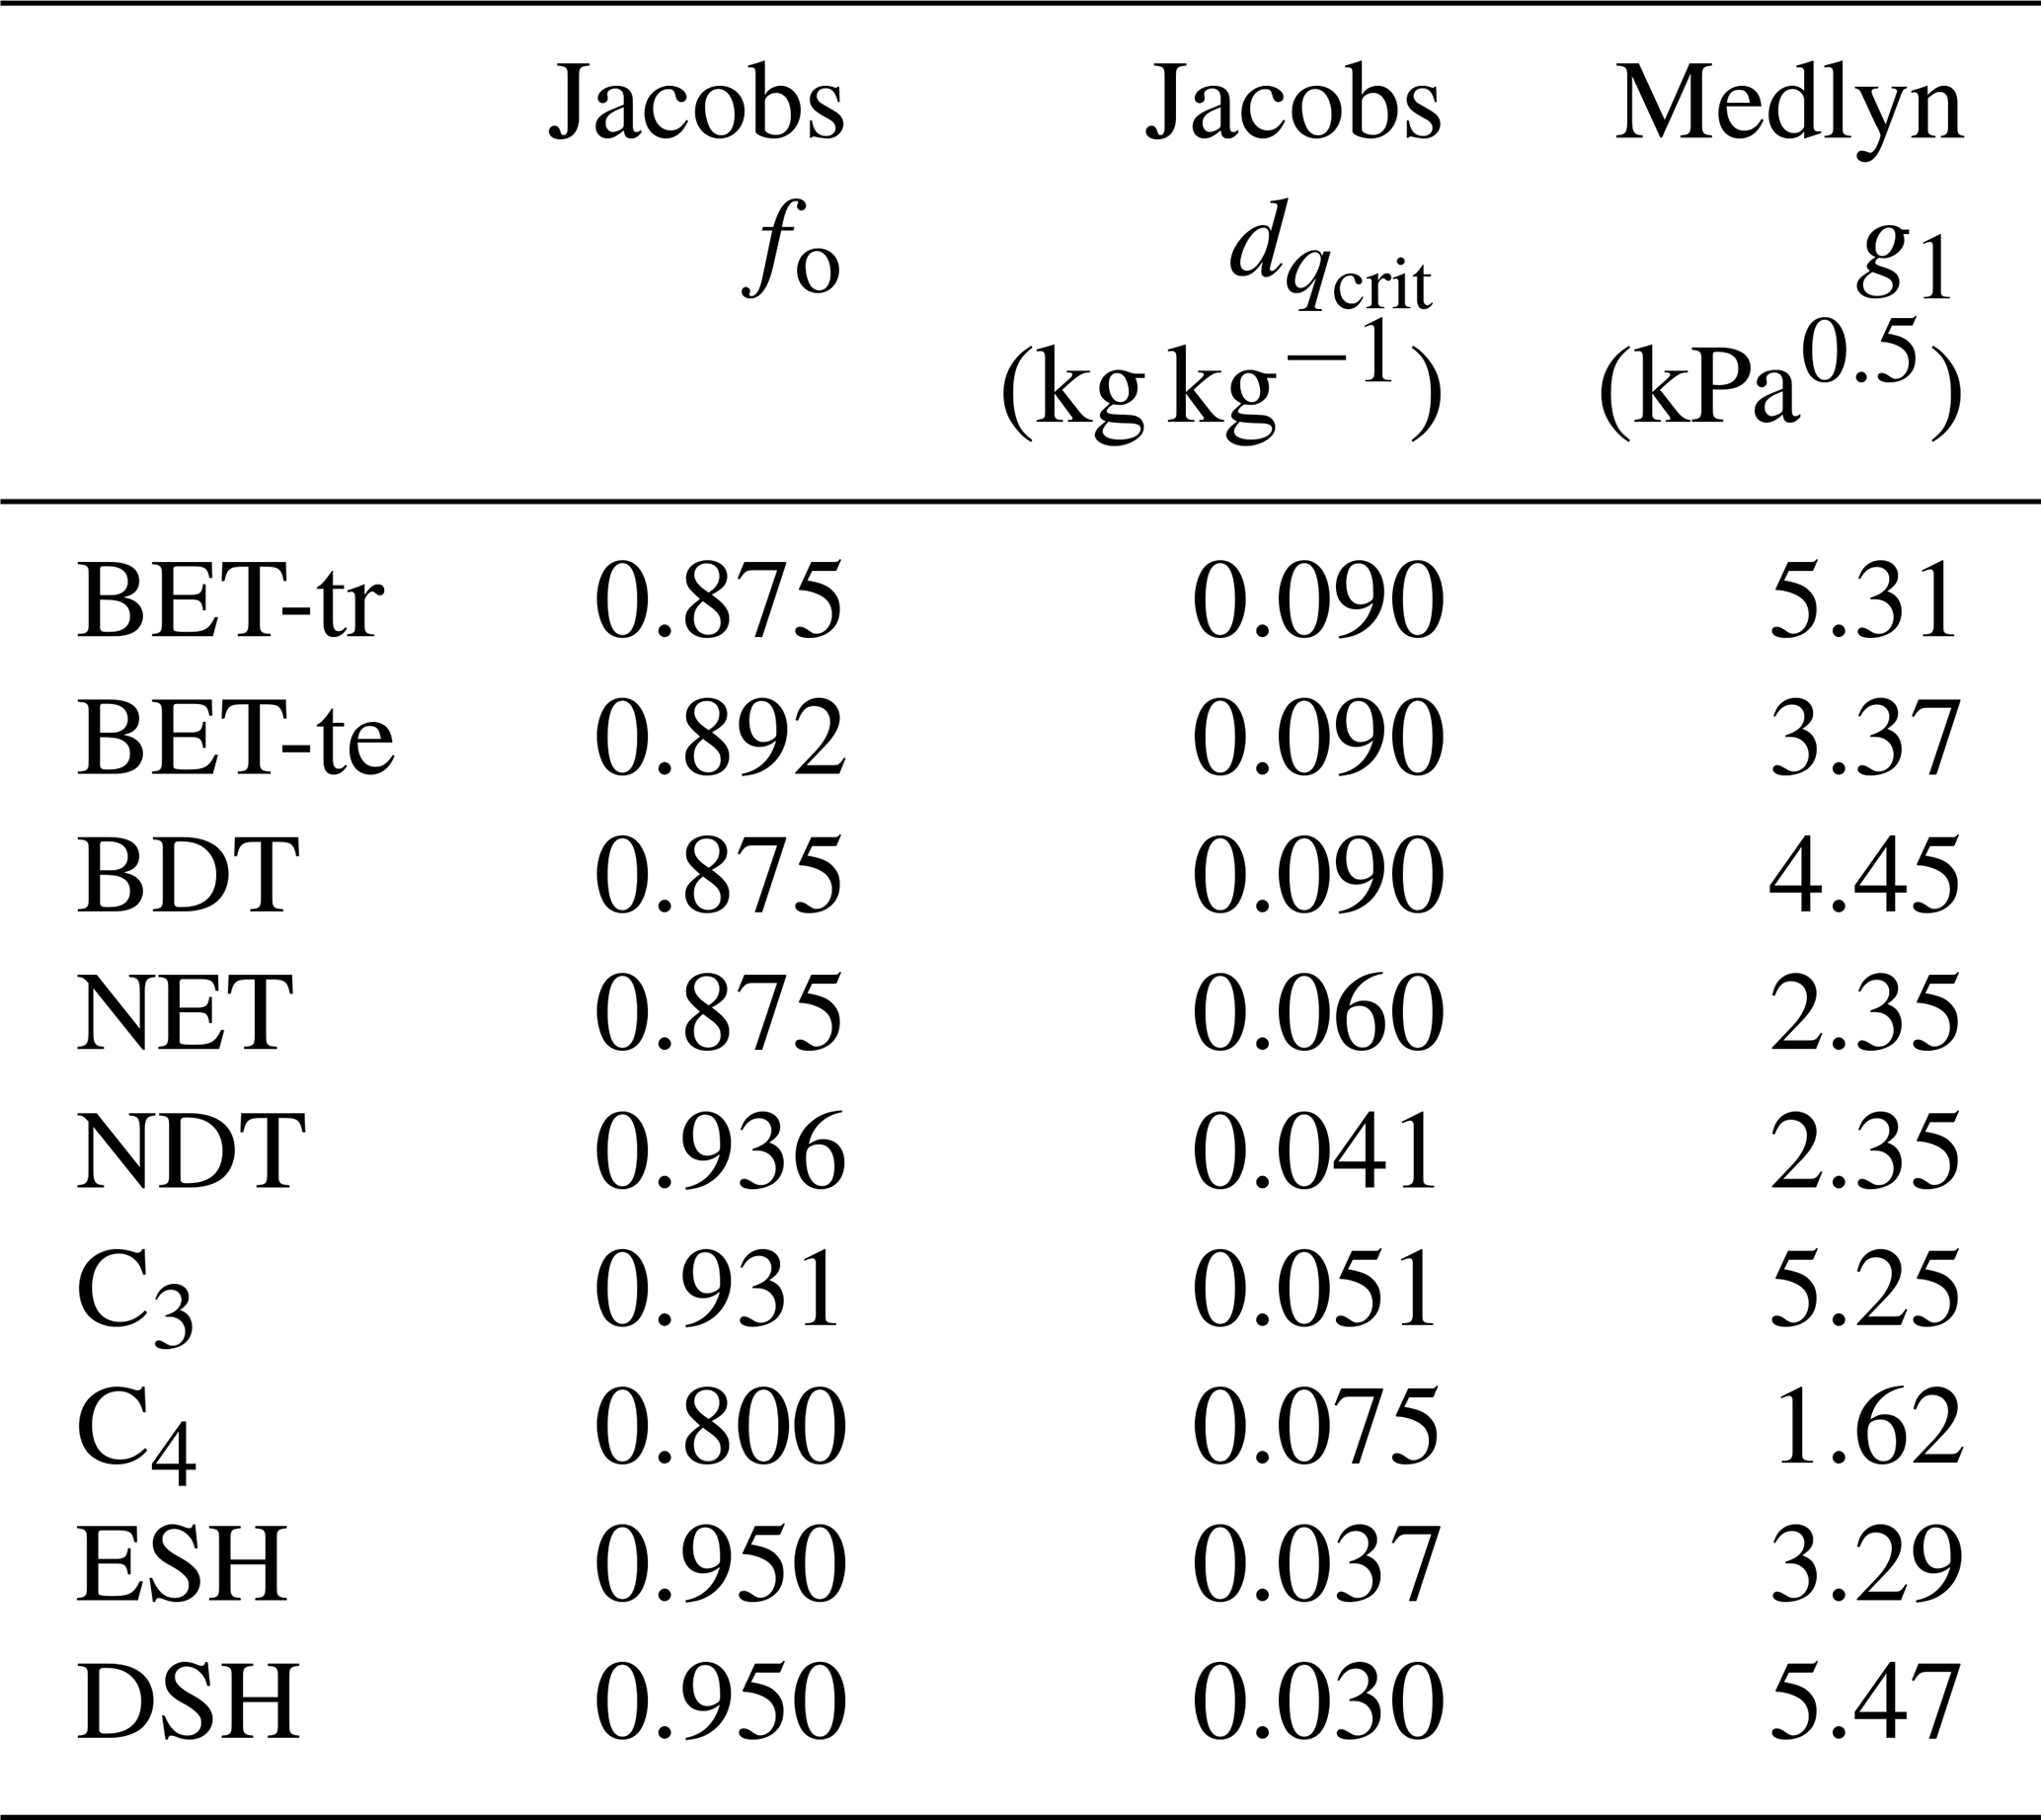
where Γ (Pa) is the CO2 photorespiration compensation point, dq is the specific humidity deficit at the leaf surface (kg kg−1), and (kg kg−1) and f0 are PFT-specific parameters representing the critical humidity deficit at the leaf surface and the leaf internal-to-atmospheric CO2 ratio () at the leaf-specific humidity deficit (Best et al., 2011). To implement the Medlyn model, Eq. (9) is used to calculate ci, retaining Eq. (7) to calculate gs. In Eq. (9), g1 (kPa0.5) is a PFT-specific model parameter, and dq is the vapour pressure deficit at the leaf surface expressed in kilopascals (kPa). The Medlyn scheme is based on optimisation theory and so assumes that stomatal aperture is regulated to maximise carbon gain while simultaneously minimising water loss:
PFT-specific values of the g1 parameter were derived for the nine JULES PFTs from the global database of Lin et al. (2015) (Table 3). The g1 parameter represents the sensitivity of gs to the assimilation rate, i.e. plant water-use efficiency, and was derived as in Lin et al. (2015), by fitting the Medlyn et al. (2011) model to observations of gs, photosynthesis and vapour pressure deficit (VPD), assuming an intercept of zero. A non-linear mixed-effect model was used to estimate the model slope coefficient, g1, for each PFT, where individual species were assumed to be the random effect to account for the differences in the g1 slope among species within the same group, following Lin et al. (2015).
Table 3PFT-specific parameters required for the Jacobs and Medlyn gs schemes.
2.2.3 Thermal acclimation of photosynthetic capacity
The Kattge and Knorr (2007) acclimation algorithm (“AcKK”) is based on the parameters of the Farquhar photosynthesis scheme; hence acclimation is implemented in the Farquhar model. The AcKK algorithm uses empirical relationships to describe the response of Vcmax, Jmax and the ratio to changes in Tgrowth (defined in AcKK as the average temperature (day and night) of the previous 30 d), and importantly it represents combined acclimation and adaptation processes. Kattge and Knorr (2007) found that ΔSv, ΔSj and the ratio decrease linearly with increasing Tgrowth following Eq. (10). This means according to these relationships, the optimum temperatures (Topt) of Vcmax and Jmax ( and ) increase by 0.44 and 0.33 ∘C per degree increase in Tgrowth respectively, and the ratio at 25 ∘C decreases by 0.035 ∘C per degree increase in Tgrowth.
The x is either ΔSv, ΔSj or the ratio, and the sub-index i refers to the parameter values (a and b shown in Table 4) for Vcmax, Jmax or the ratio. Tgrowth is the growth temperature (calculated online as the mean temperature of the previous 30 d).
Table 4Parameter values derived by Kattge and Knorr (2007) and used in this study in Eq. (10) to model thermal acclimation of photosynthesis using the AcKK scheme.

3.1 Site-level simulations
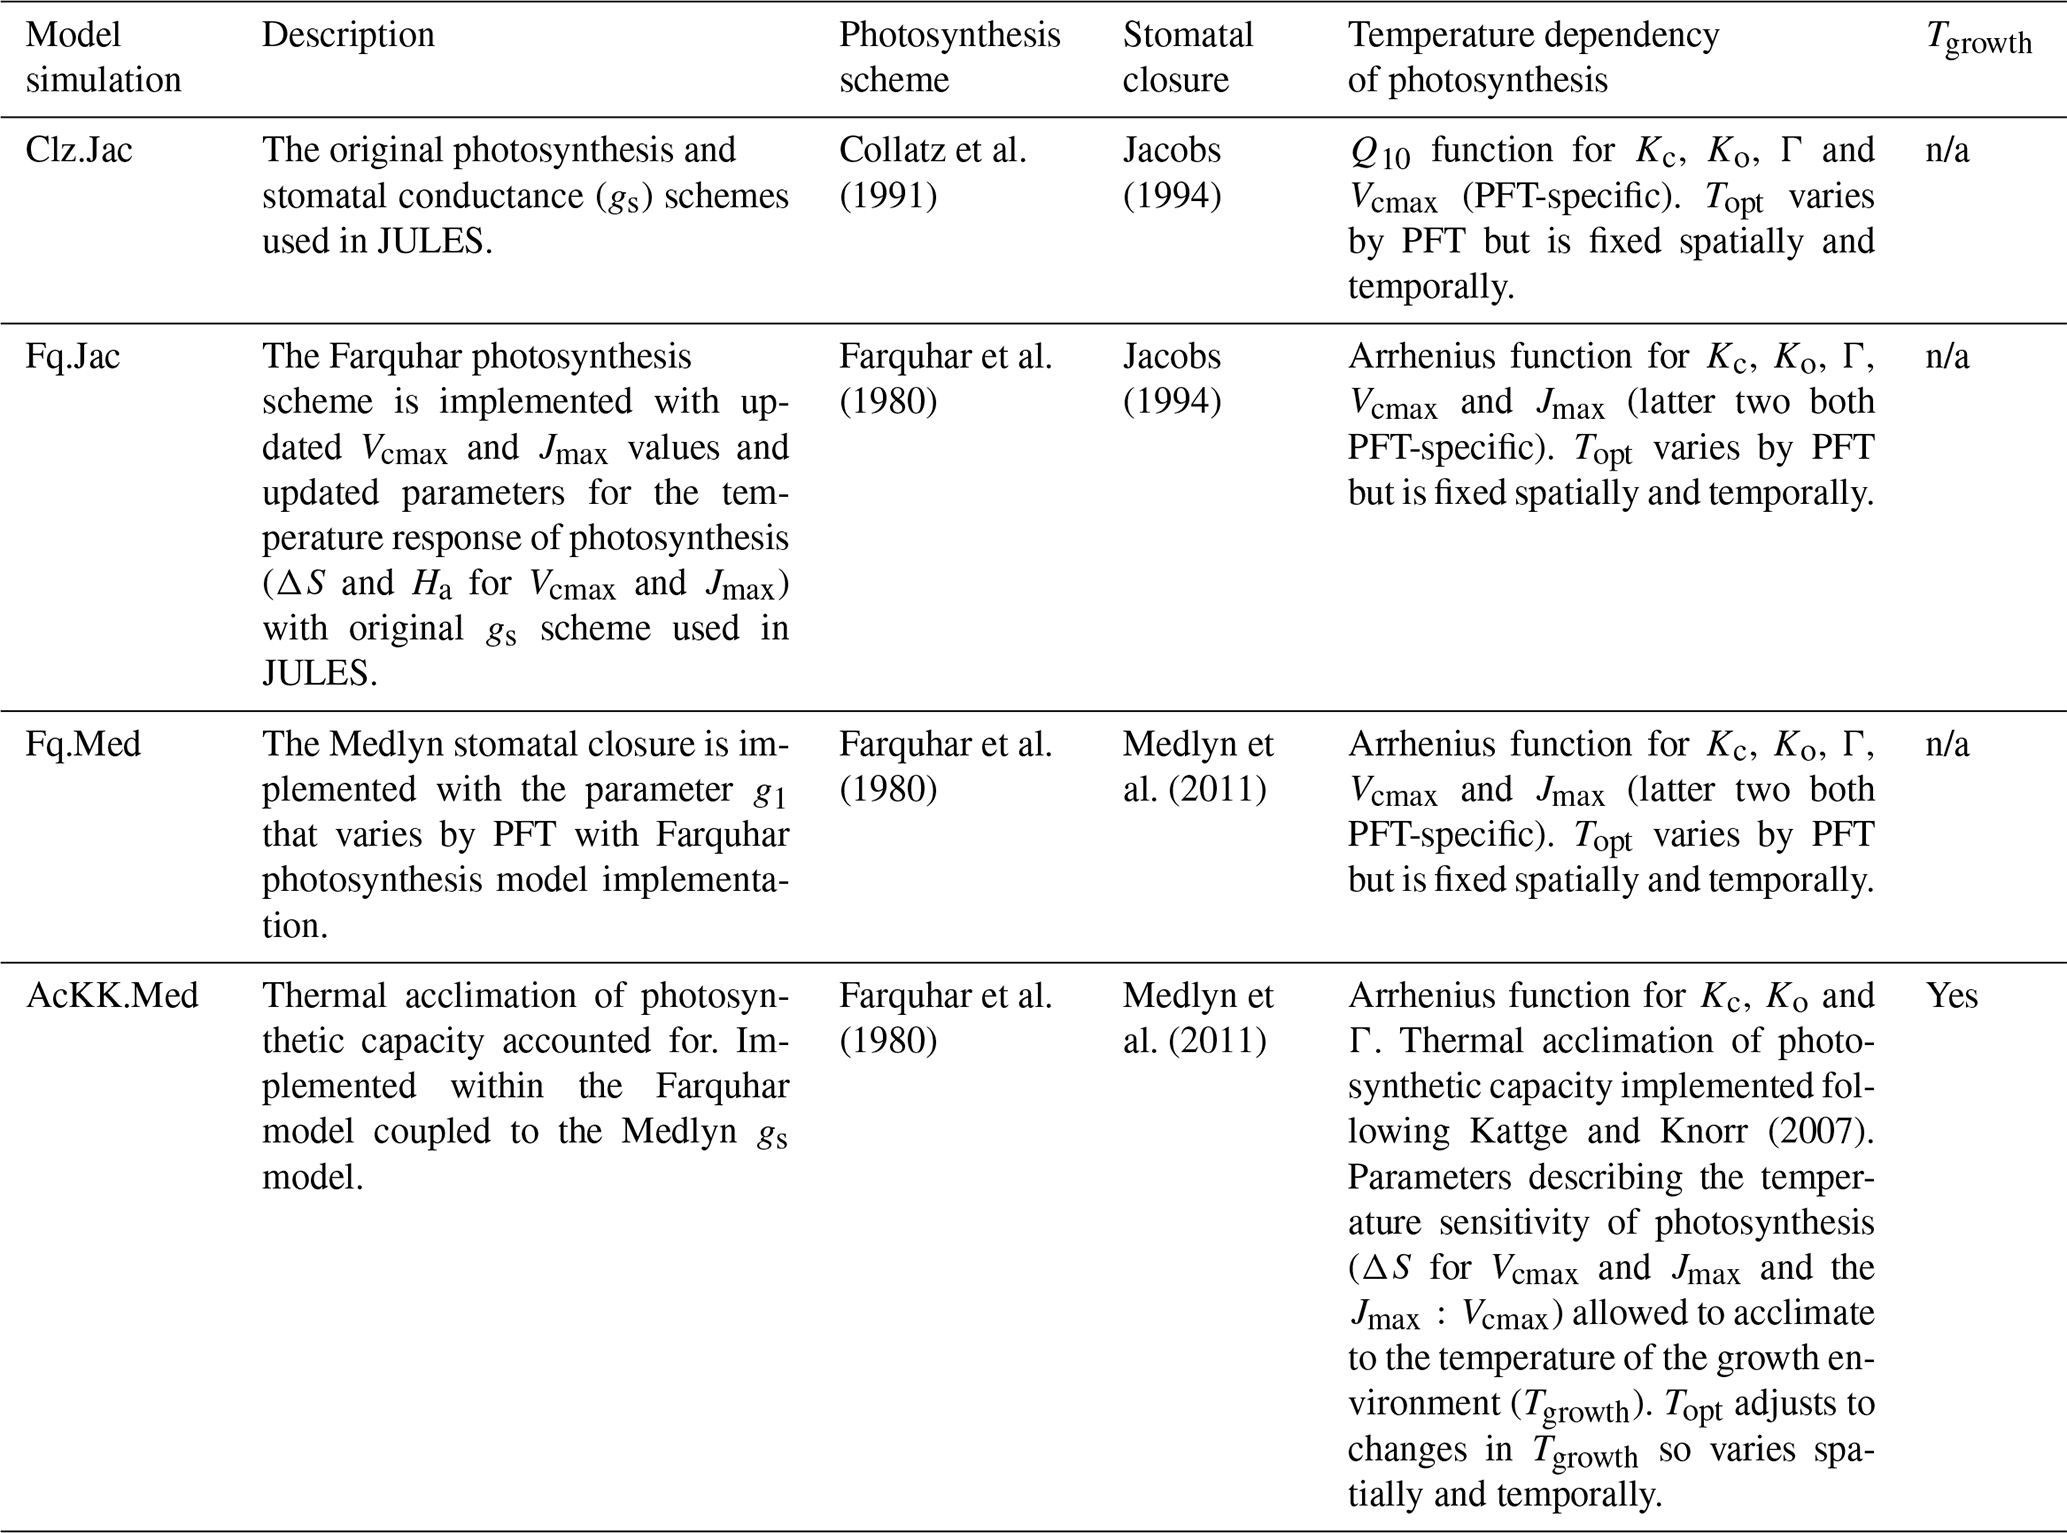
JULES was applied using four model configurations (Table 5) with observed meteorology and evaluated against data from 17 eddy covariance sites (Table S1, Fig. S2). This collection of eddy covariance measurements represents a range of climates and land cover types (Table S1, Fig. S2). In all simulations the vegetation cover was prescribed, removing any biases that the modelled competition may introduce through self-diagnosis of PFT extents. The prescribed leaf area index (LAI) was used where site data were available, otherwise the JULES phenology scheme was switched on, allowing the LAI to evolve in the model. Model output was evaluated against fluxes of gross primary productivity (GPP) and evaporative fraction (EF). We used EF rather than latent heat flux to minimise issues with incomplete closure of the energy balance (that can typically range from 5 % to 30 % at some eddy covariance sites; Liu et al., 2006). For analysis we used daytime values only (i.e. where the shortwave radiation was >10 W m2) from days with no missing data and compare mean seasonal diurnal cycles of modelled GPP and EF against the observed fluxes. The mean seasonal cycle calculated over the entire measurement period is used in order to assess the mean model behaviour.
We evaluate the site-level simulations with RMSE (root mean square error) for the seasonal diurnal cycle of simulated (daytime) fluxes (GPP and EF). For each site, the time period of the simulation and therefore evaluation period is stated in Table S1. We summarise the changes in RMSE using the relative improvement for each model configuration (i) compared to the current standard JULES configuration of Collatz with Jacobs (Clz.Jac). The statistic is calculated so that positive values show an improvement compared to Clz.Jac and therefore a better comparison to the observations:
Table 5Description of the four model experiments performed both at site level and globally, with the JULES land surface model.
n/a – not applicable.
3.2 Global-scale simulations
Four JULES simulations were performed globally for the period 1979–2013 as outlined in Table 5. These global present-day simulations were run at 0.5∘ × 0.5∘ spatial resolution. The WFDEI meteorological dataset was used to drive the model (Weedon et al., 2014). This has a 3 h temporal resolution that JULES interpolated down to an hourly model time step. To focus on the direct effects of the model changes on GPP and surface energy fluxes, the land surface properties of the model were prescribed. We use a static map of land cover (in terms of different PFT extents) derived from the European Space Agency's Land Cover Climate Change Initiative (ESA LC_CCI) global vegetation distribution version 1.6 for the 2010 epoch (Poulter et al., 2015) (Fig. S3) following that used in Harper et al. (2016). Seasonally varying LAI values were derived from the Global LAnd Surface Satellite (GLASS) dataset (Xiao et al., 2016). Prescribed parameters were used for the hydraulic and thermal properties of the soil from a modified version of the H1 lookup table from Zhang and Schaap (2017) that depends upon the soil textural type from SoilGrids (Hengl et al., 2014). We also prescribe transient atmospheric CO2 concentrations based on annual mean observations from Mauna Loa (Tans and Keeling, 2014). A spin-up of 80 years was performed (recycling through the period 1979 to 1999), which is sufficient to equilibrate soil temperature and soil moisture.
The global offline present-day simulations were compared against the global evaluation products, and for both model output and observations, we calculate seasonal means over the period 2002 to 2012. We used the global FluxCom product to evaluate modelled GPP, LE, H and ET (Jung et al., 2020; Tramontana et al., 2016). We compare our simulations against the FluxCom ensemble product (RS + MET) driven with the same forcing (WFDEI), as is recommended by Jung et al. (2019) to minimise deviations due to different climate input data. To convert LE to ET, we assume a constant latent heat of vaporisation of 2.5 MJ mm−1. We also use the model-derived product from GLEAM-v3.3a to evaluate ET and additionally use the MODIS GPP product (Zhao et al., 2005; Zhao and Running, 2010; Zhao et al., 2006) to evaluate simulated global GPP.
Global future climate simulations were performed forced with meteorological output (1960 to 2050) from the HadGEM3-GC3.1 model atmosphere-only simulations at 3 h temporal resolution and N512 spatial resolution (Roberts et al., 2019; Williams et al., 2018). These projections follow the CMIP6 HighResMIP protocol (Haarsma et al., 2016). This choice of forcing to drive JULES is to allow for comparison of the offline runs performed in this study with the equivalent simulations currently being undertaken in the coupled HadGEM3-GC3.1 model to explore land–atmosphere feedbacks arising from changes implemented in the plant physiology routines in this work. The factorial set of offline simulations in this work provide a systematic sensitivity study that is less computationally expensive with which to help understand behaviour seen in the coupled model. The output at N512 was re-gridded to 0.5∘ × 0.5∘ using conservative interpolation, which ensures the physical conservation of each variable. Figure S4 shows the mean temperature and precipitation change by region over the study period and the atmospheric CO2 concentration. Atmospheric CO2 concentrations were prescribed based on observations up to 2014 as described in historical CMIP6 simulations (Eyring et al., 2016). From 2015 onwards, atmospheric CO2 concentrations were based on a high-end emission scenario of the Shared Socioeconomic Pathways (SSP5) with the Representative Concentration Pathway 8.5 (RCP8.5) (Haarsma et al., 2016). As for the current-day simulations, LAI, land cover and soil properties were prescribed using the same datasets. A spin-up period of 80 years (recycling through the period 1960 to 1980) was again used to equilibrate soil temperature and soil moisture.
We analyse the future global simulations using the “difference of difference” approach. This method explicitly targets the change in the variable of interest over the study period resulting from the change in process alone and negates differences that may arise from different initial starting points of each simulation (different initial conditions):
where X represents the simulation with the process of interest, and Y represents the simulation with the alternative representation, and 2050 and 1980 represent the end and start of the simulation analysis period respectively (calculated as the mean over 2040 to 2050 and 1980 to 1990 respectively). For example, to look at the impact of changing photosynthesis schemes, and . In this case, both configurations are using the Jacobs gs scheme; only the photosynthesis scheme changes from Collatz to Farquhar. The impact of changing gs scheme is assessed, where and . The impact of thermal acclimation is assessed where and ; here both simulations use the Farquhar photosynthesis scheme and the Medlyn gs scheme, but X has the addition of thermal acclimation of photosynthesis.
4.1 Site-level evaluation
Results from the FLUXNET sites comparing the mean seasonal diurnal cycles of GPP and EF against observed fluxes are summarised in Fig. 1, where reds and yellows indicate reduced RMSE relative to the “standard” JULES configuration of Collatz with Jacobs (Clz.Jac) and therefore closer agreement to site-level FLUXNET observations. Results are variable by site and season (Figs. 1, S5 and S6), some of which will be due to other site-specific characteristics that are not simulated well by the model, such as LAI for those sites that rely on model-derived estimates. On the other hand, soil properties are prescribed by parameters that describe the thermal and hydraulic characteristics of the soil; uncertainties in these parameterisations have consequences for the simulated soil moisture content at each site, for example, which impacts simulated carbon and water fluxes. We first consider results for the five tropical sites. Results are mixed for the simulated seasonal diurnal cycle of GPP at the tropical (EBF BET-tr) sites; GPP is improved (reduced) with the new JULES model configurations at three out of the five tropical sites in March–April–May (MAM; Figs. 1a, S5), with thermal acclimation leading to the greatest improvements. However in June–July–August (JJA; Figs. 1b, S5), this improvement is only found at two of the tropical sites. At the EBF sites, implementing the Farquhar photosynthesis model means Vcmax is lower (BET-tr, Table 2), and this in addition to the change in temperature sensitivity (Table 1; Fig. S1a–c) and model structural changes from Collatz to Farquhar results in lower simulated GPP compared to Collatz. Thermal acclimation allows for further adjustments of the and the ratio which results in lower simulated photosynthesis and therefore GPP compared to Farquhar (Fig. S5). The change from Jacobs gs model to Medlyn has minimal impact on simulated GPP for the tropical tree PFT because in both schemes the modelled ci has a similar sensitivity to humidity deficit at the leaf surface, with the exception at very low humidity deficit (Figs. S7; S5). The simulated seasonal diurnal cycle of EF is improved (reduced) at four out of the five tropical sites in both MAM and JJA, again with some of the largest improvements seen with thermal acclimation (Figs. 1c, d; S6).
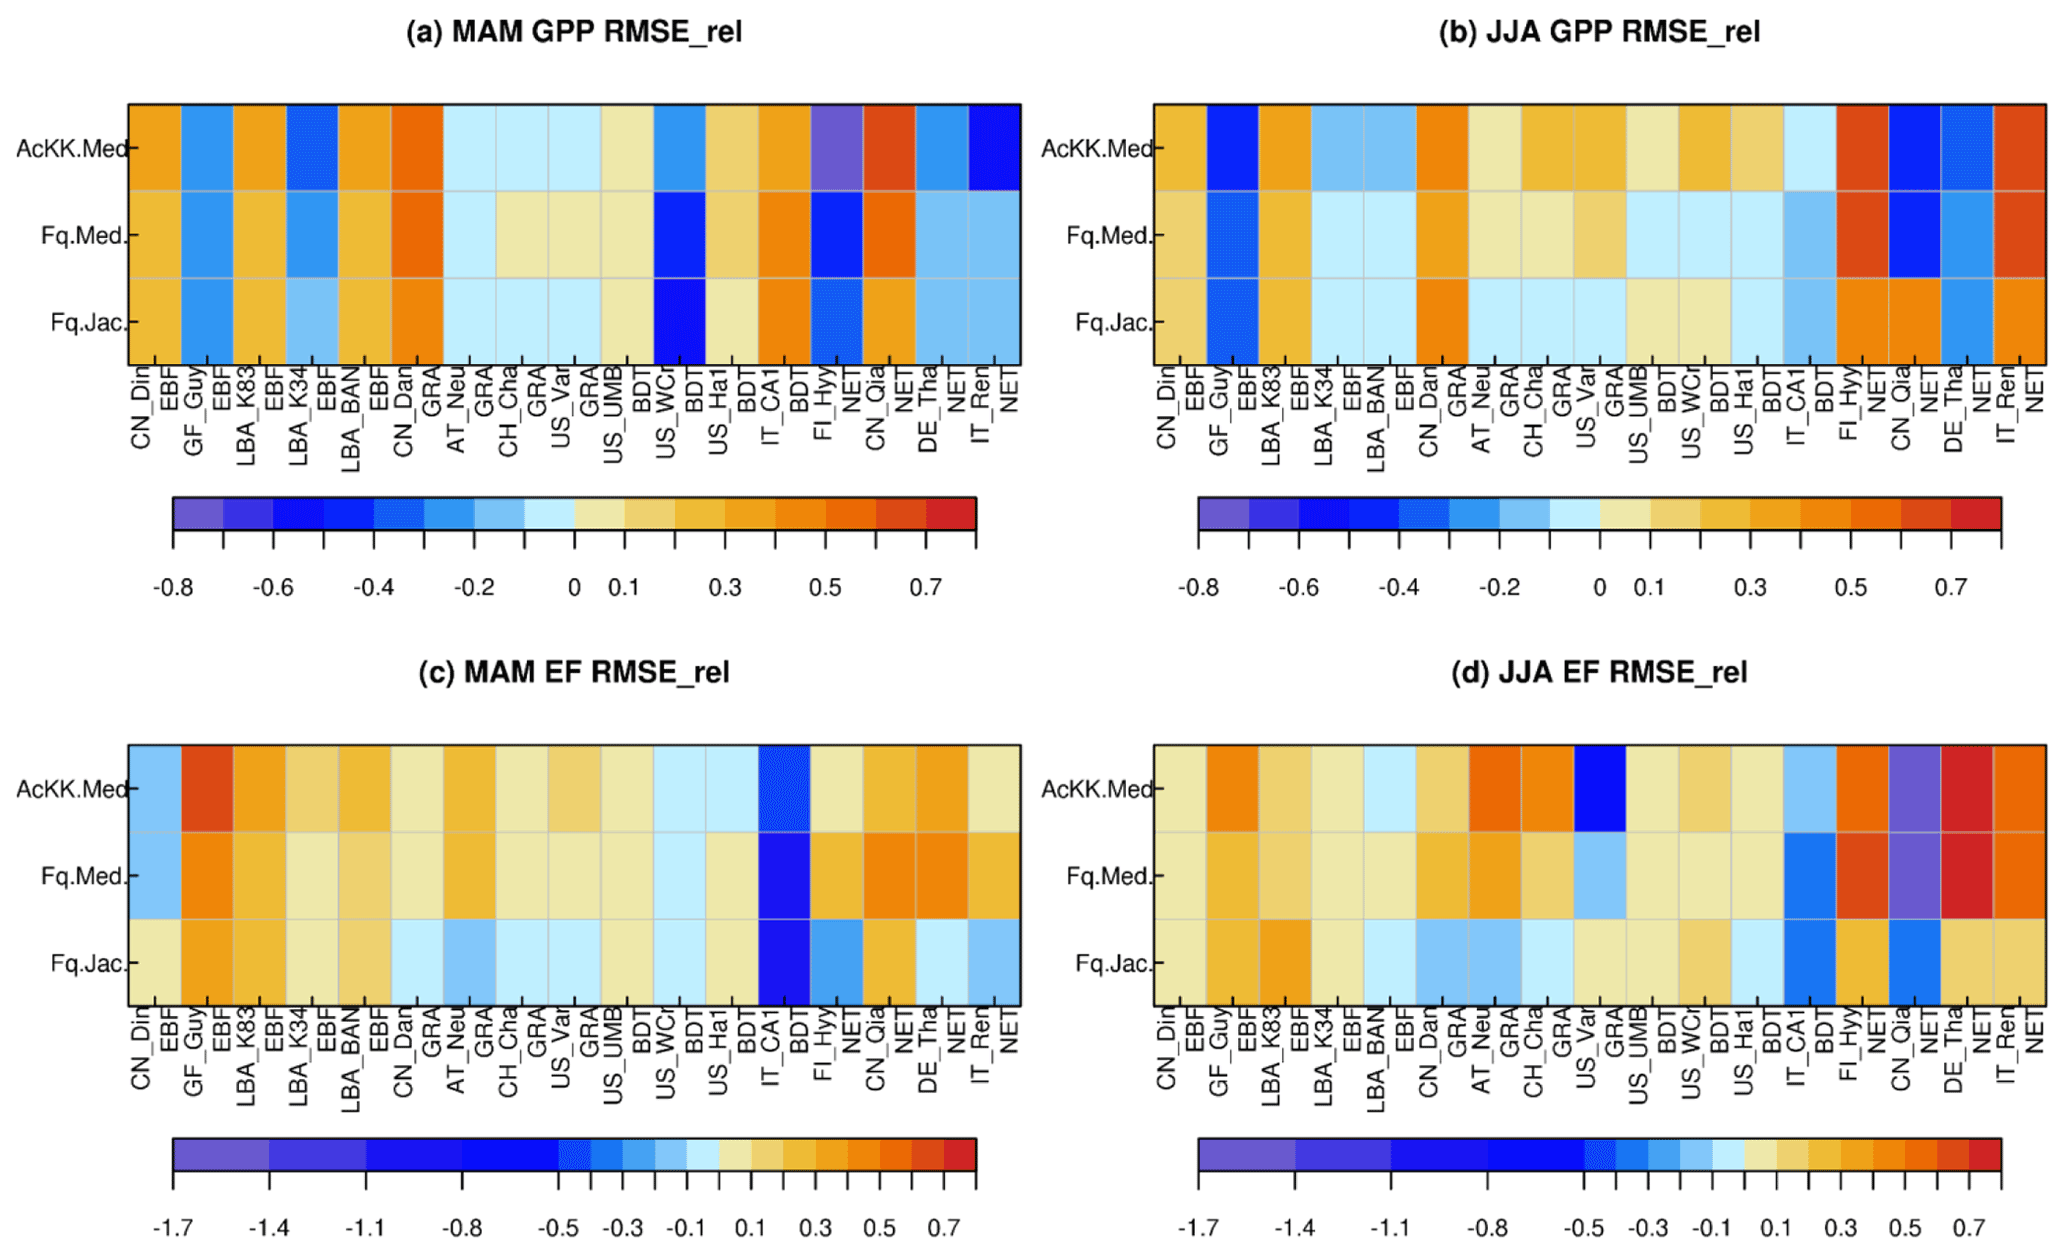
Figure 1Relative changes in RMSE for each JULES model configuration compared to Collatz with Jacobs (Clz.Jac) for hourly daytime (a) GPP (March–April–May), (b) GPP (June–July–August), (c) EF (March–April–May) and (d) EF (June–July–August). Calculated according to Eq. (11), positive values (reds and yellows) are where RMSE is lower compared to the Clz.Jac configuration and therefore indicates an improvement compared to the Clz.Jac baseline, and the FLUXNET observations. EBF – broadleaf evergreen tropical tree, GRA – C3 grassland, BDT – broadleaf deciduous tree, NET – needle leaf evergreen tree. The fit of each model configuration to observations and the RMSE are shown in Fig. S5 (GPP) and Fig. S6 (EF).
At the C3 grassland sites (GRA), improved simulated GPP (higher GPP) is seen across all sites in JJA with the Medlyn gs scheme and thermal acclimation (Figs. 1b, S5). This is matched by improvements in simulated EF (higher EF) across all grassland sites in both seasons, with the exception of US_var in JJA (Figs. 1c, d; S6). The change from Collatz to Farquhar at the GRA sites means a lower Vcmax is used (C3, Table 2), although the temperature sensitivity is similar (Table 1, Fig. S1p, q); this results in lower GPP simulated by Farquhar compared to Collatz, which compares worse to the observations (GPP and EF, Figs. 1, S5). In contrast to using Farquhar with the Jacobs gs scheme, using Farquhar with the Medlyn scheme improves simulated GPP and EF; both are increased because for the C3 grass PFT, as the humidity deficit at the leaf surface increases, ci simulated by Medlyn is less sensitive compared to Jacobs (Figs. S7; S5), leading to higher ci, higher net canopy photosynthesis and GPP, and higher transpiration and LE. These results suggest the Medlyn scheme has a large impact on simulated carbon and water fluxes for the C3 grass PFT in the JULES model. In JJA, the adjustment of the temperature sensitivity of photosynthesis to the Tgrowth by the thermal acclimation scheme tends to increase GPP compared to Farquhar with no acclimation, and this compares better to the observations (Figs. 1, S5).
At the broadleaf deciduous tree (BDT) sites, simulated GPP is improved with all JULES model configurations in MAM (higher GPP) at three out of the four sites (Fig. 1a). However in JJA, improvements are mainly seen with thermal acclimation (lower GPP compared to Fq.Med; Fig. 1b). Medlyn gs performs worse at all sites in JJA, suggesting either the model formulation or parameters are not suitable to correctly capture stomatal behaviour in this season for this PFT (Figs. 1b, S5). Compared to Collatz, the Farquhar model for the BDT PFT uses a lower Vcmax (Table 2) and has a considerably lower (Table 1; Fig. S1h), which means that at leaf temperatures below ∼ 22 ∘C, photosynthesis is higher with the Farquhar model and above this photosynthesis is lower than Collatz (Fig. S1g). Consequently, warmer temperatures in JJA lead to lower GPP simulated by Farquhar compared to Collatz, and cooler temperatures in MAM result in slightly higher GPP with Farquhar compared to Collatz (Fig. S5). Using the Medlyn model means simulated ci is more sensitive to increasing leaf humidity deficit for the BDT PFT (Fig. S7). Medlyn simulates a lower ci as humidity deficit increases compared to Jacobs, which leads to lower GPP and LE, the magnitude of which depends on the local site humidity conditions. In JJA the Medlyn gs model performs worse at all sites for GPP (Fig. 1b), although improvements in simulated EF are seen in JJA, where both Medlyn and thermal acclimation improve model performance at three out of four BDT sites (Figs. 1d, S6).
At the evergreen needleleaf (NET) sites, the most consistent improvements to simulated GPP are seen with the Farquhar model, where simulated GPP in JJA is substantially improved (GPP reduced) at three out of four sites (Figs. 1b, S5); in this season both Medlyn and thermal acclimation generate larger improvements in the simulated GPP (reducing GPP further), but this is just at two out of the four sites. In our implementation of the Farquhar model, the NET PFT has a lower Vcmax compared to Collatz (Table 2) and a slightly higher (Table 1, Fig. S1k). The resulting shape of the temperature response curve for photosynthesis (Fig. S1j) means that at leaf temperatures below ∼ 10 ∘C, Farquhar photosynthesis is higher. However, above 10 ∘C, Farquhar photosynthesis is lower compared to Collatz, resulting in simulated GPP in MAM that tends to be higher with Farquhar than Collatz, and in JJA the opposite occurs (Fig. S5). In MAM and JJA, the Medlyn gs model simulates some large improvements in EF; ci simulated by Medlyn is more sensitive to increasing leaf humidity deficit compared to Jacobs (Fig. S7), which results in lower transpiration and EF, and this compares better to the observations (Figs. 1, S6).
4.2 Global evaluation
4.2.1 Spatial differences between model configurations
The impact of changes in the photosynthesis scheme, gs scheme, adding thermal acclimation of photosynthetic capacity and the overall change on simulated GPP, LE and H, is shown in Fig. 2 by comparing each of the new JULES configurations to the configuration with the alternative process representation. For GPP, the biggest change is moving from the Collatz photosynthesis scheme to the Farquhar photosynthesis scheme (Fig. 2a). Most notably, this change results in decreased GPP in the tropical region in JJA of up to 1.5 g C m2 d−1 (up to 10 % reduction), whilst in the high northern latitudes, GPP is increased by up to 1.5 g C m2 d−1 (up to 20 % increase). This is consistent with results from the site-level simulations where GPP was reduced with implementation of the Farquhar model at tropical sites and increased in cooler months (MAM) at the evergreen needleleaf forest sites (here increased GPP in NET-dominated areas are in the forests of the high northern latitudes, which is consistent with cooler temperatures). Impacts on LE and H resulting from the move from Collatz to Farquhar are not as extensive as those seen with GPP (Fig. 2b and c). The change from Jacobs gs scheme to Medlyn impacts LE and H most, resulting in a pronounced pattern of decreased LE in northern latitudes (up to 10 W m2, equivalent to a 10 % reduction) and corresponding increase in H in JJA (Fig. 2e and f). In these JULES simulations, this region is dominated by NET forest, and the high-latitude changes are consistent with results from the site-level simulations, where using the Medlyn gs scheme at NET sites resulted in some of the biggest improvements in simulated EF (lower LE and therefore lower EF). Including thermal acclimation of photosynthesis has the most extensive impacts on simulated GPP in contrast to LE and H. In the tropical forests, GPP is reduced by up to 1 g C m2 d−1 (between 2 % and 5 % reduction) in JJA (Fig. 2g). The impact of acclimation is spatially variable in the temperate region in JJA, with GPP decreased in Europe (between 2 % and 5 %) but increased in eastern United States (up to 20 %). Some areas of the boreal region see increased GPP (between 2 % to 5 %). This GPP response demonstrates the impact of thermal acclimation, which allows for the parameters of the temperature sensitivity functions for photosynthetic capacity (Vcmax, Jmax and ) to move in response to the temperature of the growth environment, leading to spatially and temporally different values of the Topt for photosynthesis for each C3 PFT. Thermal acclimation impacts LE and H to a lesser extent, but where changes are seen, acclimation increases LE with a corresponding decrease in H (Fig. 2h and i). Figure 2j, k and l show the overall change that results from moving from the traditional JULES set-up of Collatz with Jacobs (Clz.Jac) to Farquhar with thermal acclimation and Medlyn gs (AcKK.Med), and the impacts on simulated GPP, LE and H can clearly be seen as the trade-off between the dominating effects from each model configuration. For LE and H the response of the simulated energy fluxes is dominated by the change in the representation of gs, and for GPP the response of simulated carbon fluxes is dominated by the change in the representation of photosynthesis and its response to temperature (i.e. thermal acclimation).

Figure 2Absolute difference between JULES-modelled GPP, latent (LE) and sensible heat (H) for the different JULES model configurations in June–July–August (JJA) to show the impact of (a, b, c) changing photosynthesis scheme (Fq.Jac–Clz.Jac), (d, e, f) changing gs scheme (Fq.Med–Fq.Jac), (g, h, i) accounting for thermal acclimation of photosynthesis (AcKK.Med–Fq.Med) and (j, k, l) the overall change (AcKK.Med–Clz.Jac), under present-day meteorological conditions. For each variable, the mean over the period 2002 to 2012 is used. The absolute mean value simulated by each model configuration (JJA) is shown in Fig. S8. DJF is shown in Fig. S9 (mean absolute values) and Fig. S10 (absolute difference).
4.2.2 Comparison to global estimates: seasonal mean GPP and ET
Evaluation of simulated global mean GPP by season using FluxCom and MOD17 global GPP products is presented in Fig. 3a and using global ET from both FluxCom and GLEAM is shown in Fig. 3b. The seasonal means show thermal acclimation compares best to observations (FluxCom) in JJA (AcKK.Med underestimates GPP by just 4 %, whereas Clz.Jac underestimates GPP by 6 %; Fig. 3a and Table S2) and MAM (AcKK.Med underestimates GPP by just 5 %, whereas Clz.Jac underestimates GPP by 11 %; Fig. 3a and Table S2) and is in reasonable agreement with FluxCom in DJF (AcKK.Med overestimates GPP by just 2 %, whereas Clz.Jac underestimates GPP by 4 %; Fig. 3a and Table S2). All JULES model configurations have a high GPP bias in SON compared to FluxCom, and in all seasons GPP is overestimated by all model configurations compared to MOD17; similarly this is largest in SON. For simulated ET, seasonally the model performance is very similar between the different JULES configurations but in both SON and DJF Medlyn (Fq.Med) compares better to both FluxCom and GLEAM, but the differences are very small (Fig. 3b and Table S3).
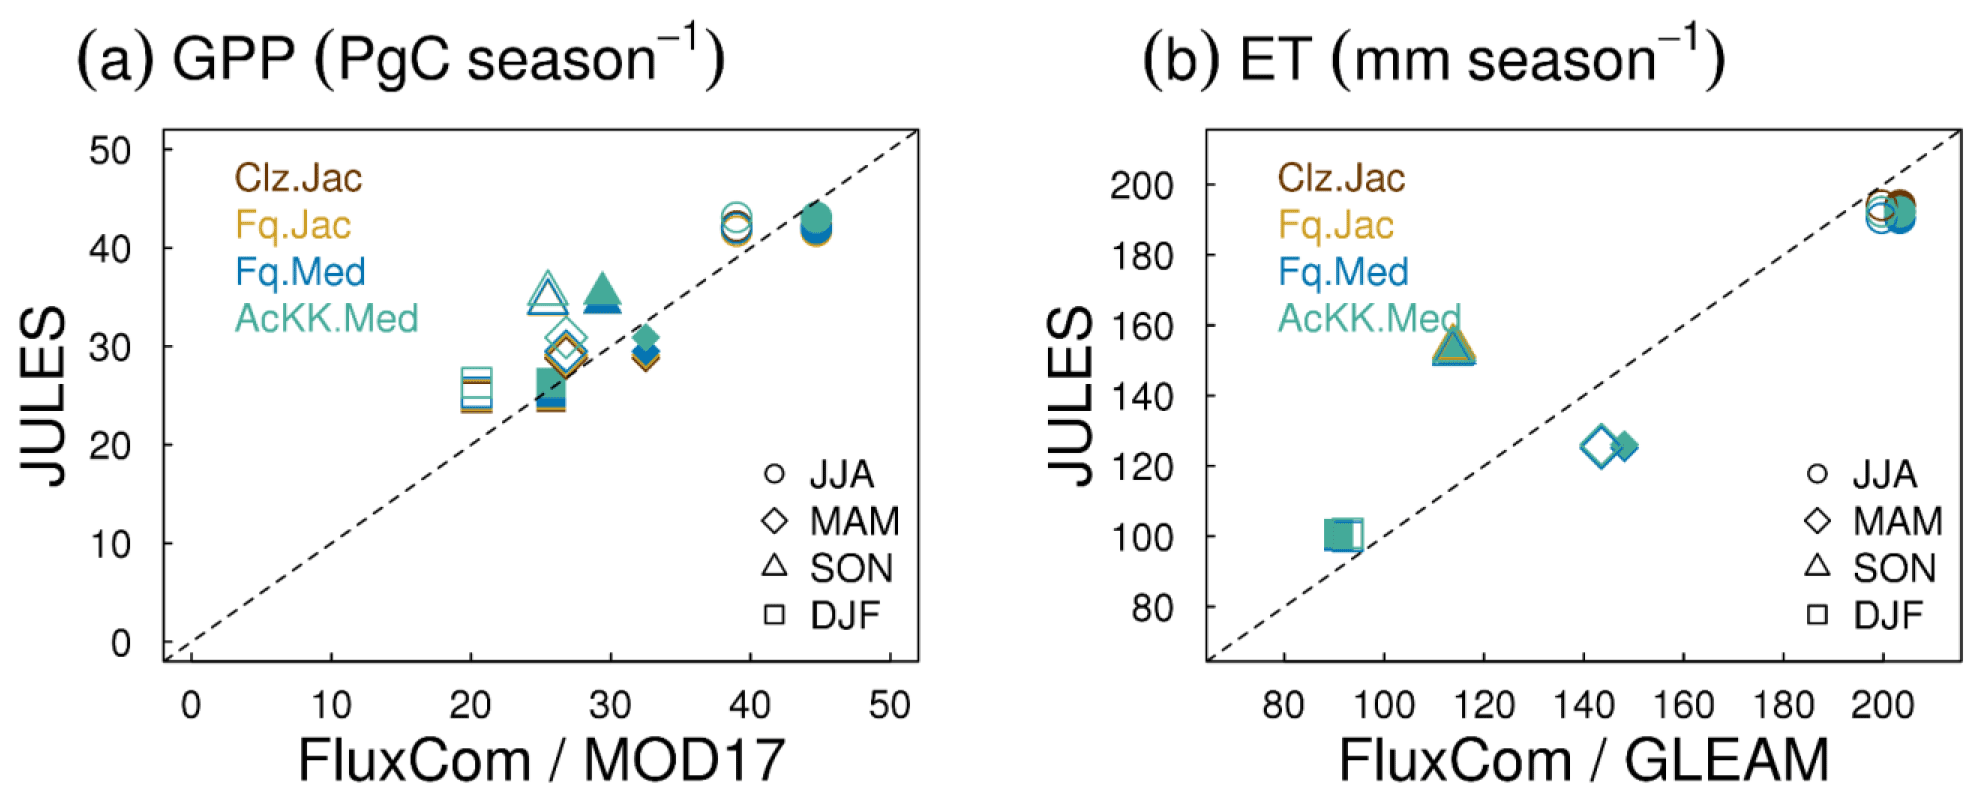
Figure 3Seasonal mean global (a) GPP and (b) ET for each JULES model configuration compared to FluxCom (closed symbols) and MOD17 (GPP) or GLEAM (ET) (open symbols).
4.2.3 Comparison to global estimates: latitudinal mean GPP and ET
Figures 4 and 5 present comparisons of seasonal zonal-mean GPP and ET respectively. Firstly, Figs. 4 and 5 highlight the differences between global products used to evaluate GPP and ET (see, for example, Spafford and MacDougall, 2021). For example, FluxCom generally predicts higher GPP in the tropics compared to MOD17, especially in DJF and MAM, and in JJA the different distribution of GPP by latitude means in the tropics MOD17 GPP is higher than FluxCom in the southern latitudes, and FluxCom GPP is higher in the northern tropics. Comparison of the two ET products shows that GLEAM tends to give higher ET in the tropics, particularly in DJF and MAM. Bearing in mind uncertainties in observation-based estimates of fluxes at this scale, we now consider how the different model configurations compare. Notably, all the JULES model configurations in this study simulate comparable global carbon and water fluxes for the recent contemporary period and are in reasonable agreement with the global products used for evaluation. Differences in RMSE between the different model configurations are small for both GPP and ET. Importantly, the most consistent change is the improvement (lowest RMSE) of modelled GPP in the tropics with the Farquhar model (Fq.Jac). This improvement is evident in all seasons and holds when comparing to both FluxCom and MOD17 (Fig. 4). Similarly, estimates of ET are improved in the tropics (lowest RMSE) with the Farquhar model (Fq.Jac) in DJF and JJA and with the Medlyn model (Fq.Med) in MAM and SON, and again this result is not dependent on the choice of observation-based product (Fig. 5). Another notable change is the improvement of simulated GPP in the temperate north and boreal regions in MAM with thermal acclimation (AcKK.Med). Deficiencies in the model stand out, but these biases are common to all model configurations. For example, all configurations simulate an over-prediction of GPP and ET in SON in the temperate north and boreal regions, overestimated GPP in MAM in tropical southern latitudes (0 to −20∘ S), under-predicted GPP and ET in MAM in temperate north and boreal regions, and an over-prediction of ET in MAM in the temperate and tropical south.

Figure 4Mean (2002 to 2012) GPP (g C m2 d−1) by latitude band and season for each JULES model configuration compared to the FluxCom and MOD17 global GPP products. The bars along the side indicate which model configuration gives the lowest RMSE and therefore better comparison to FluxCom (righthand bar) and MOD17 (left-hand bar) derived GPP for each region. RMSE values are shown in Tables S4 (FluxCom) and S5 (MOD17). The grey shaded area shows the uncertainty in the FluxCom GPP product, provided as the median absolute deviation of ensemble members, this is scaled to a robust estimate of the standard deviation of a normal distribution by multiplying by 1.4826 according to Jung et al. (2019).
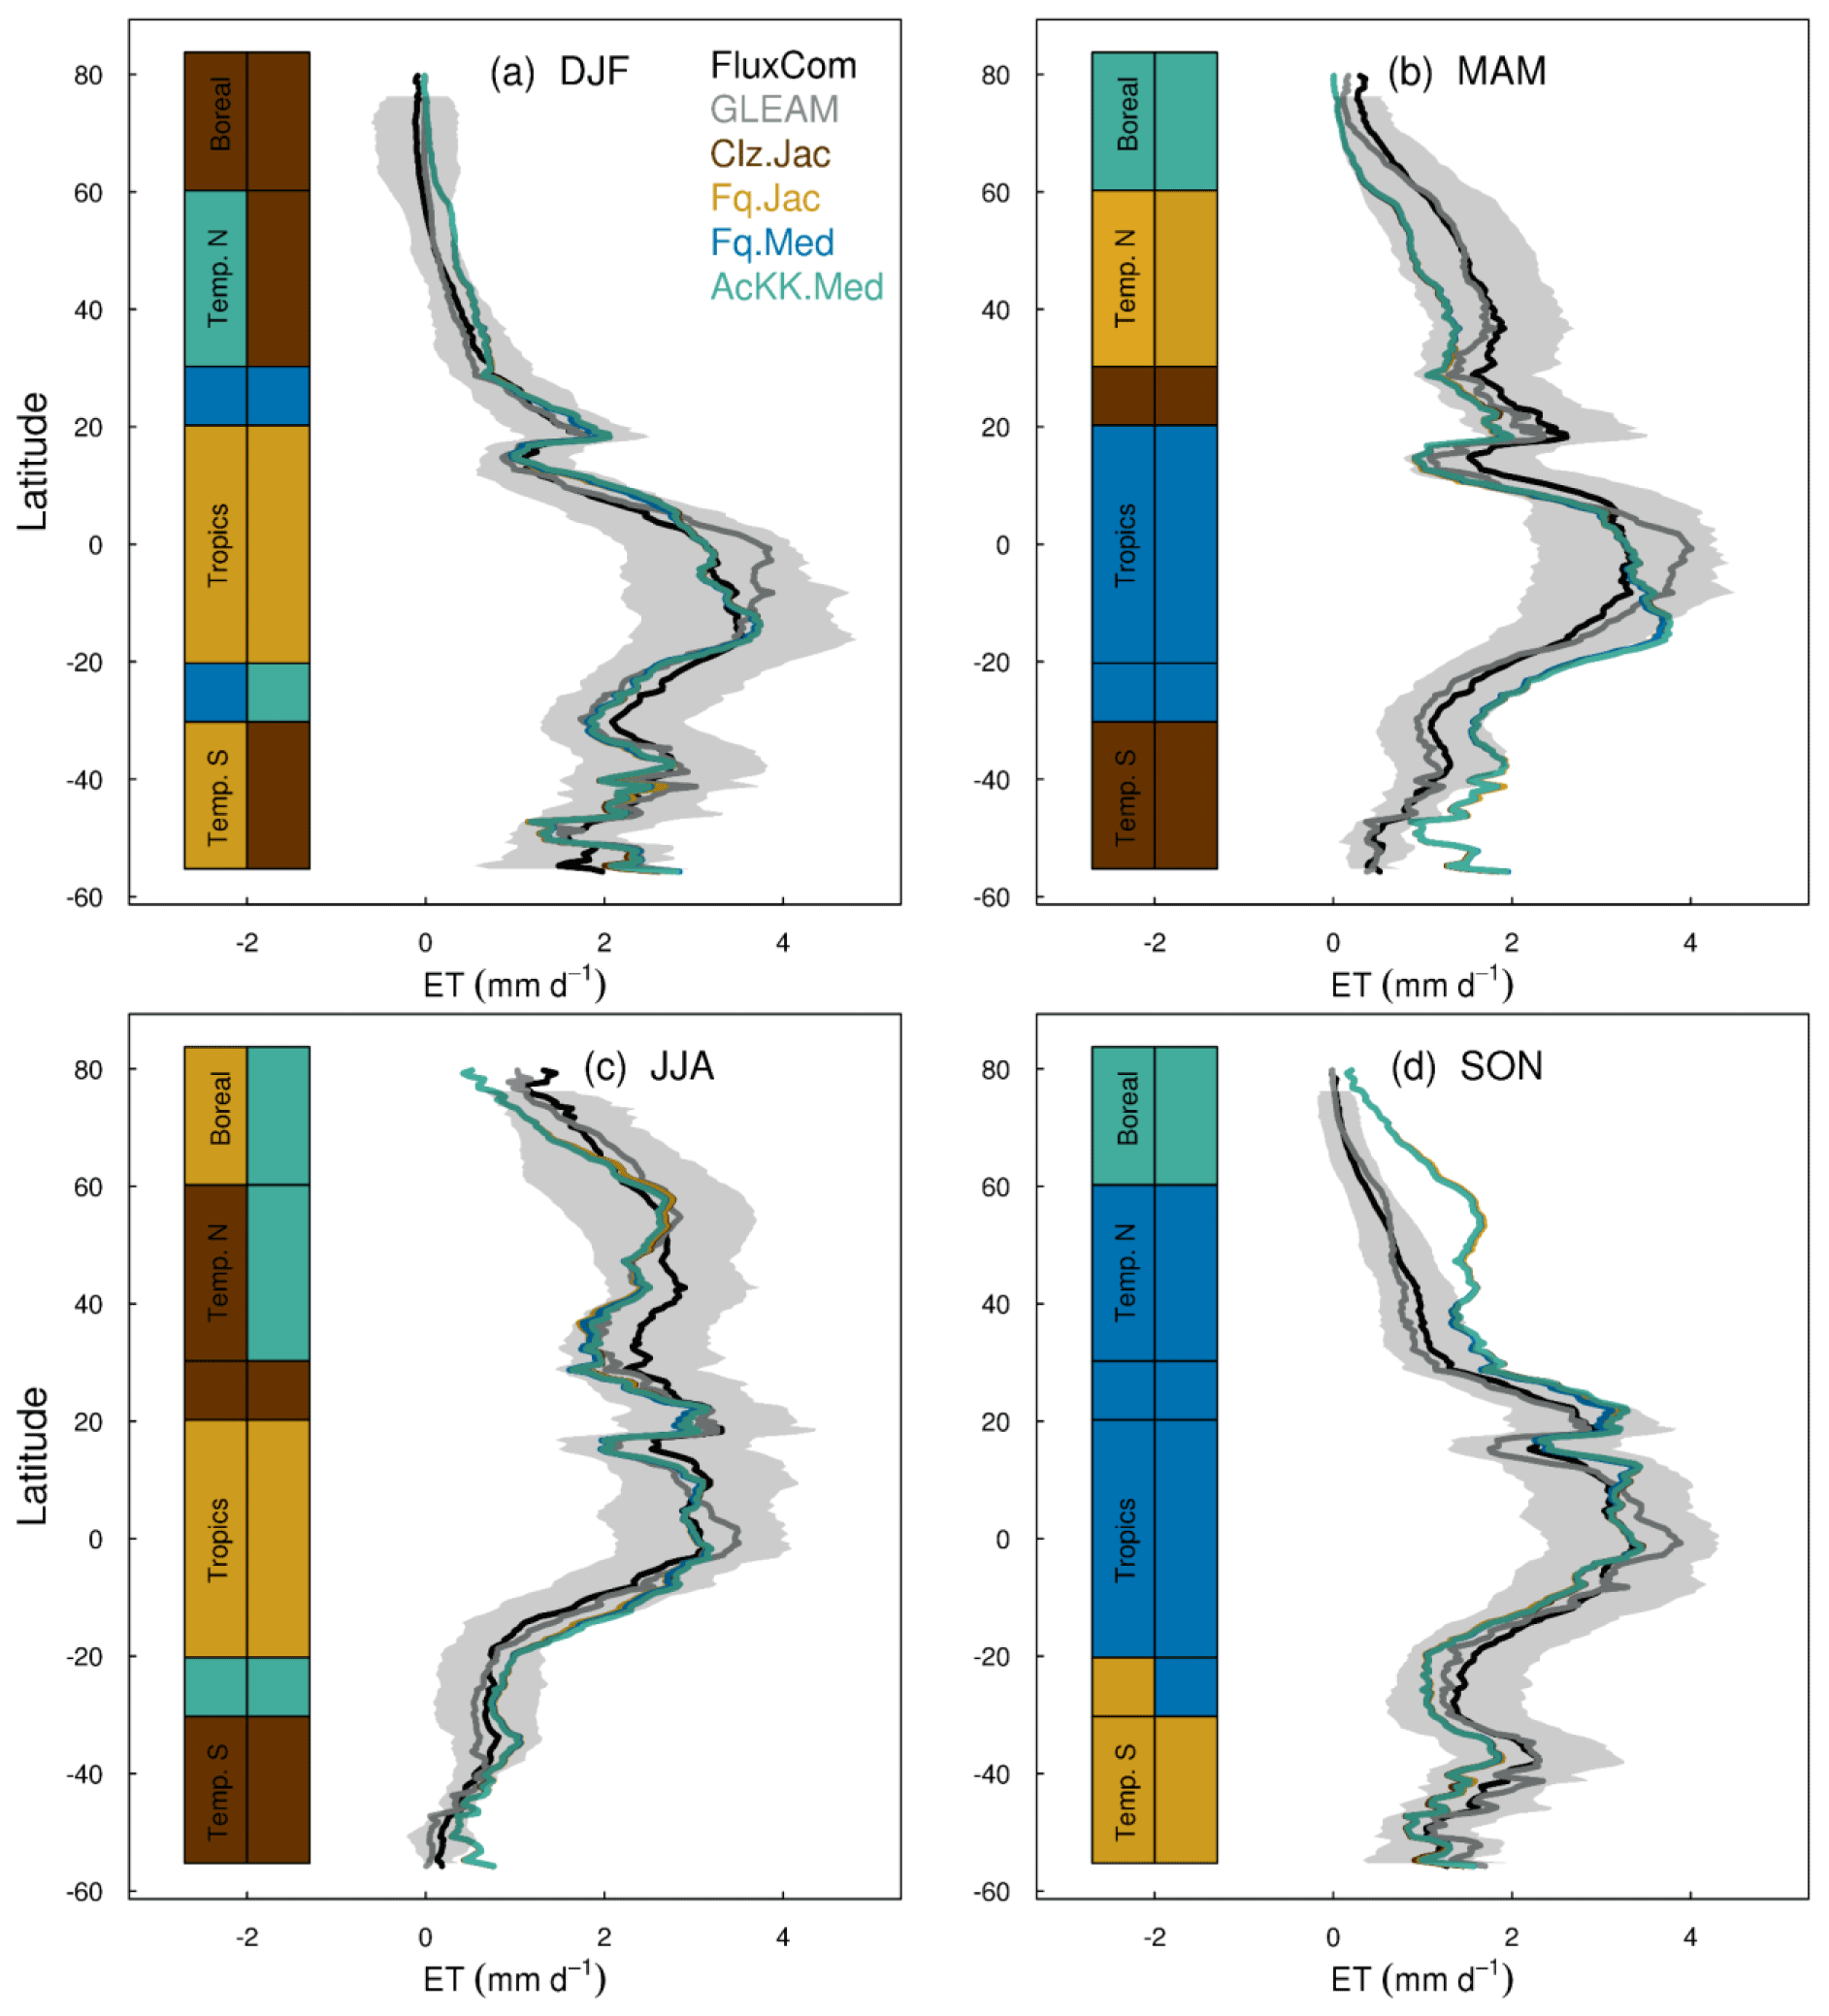
Figure 5Mean (2002 to 2012) evapotranspiration (ET mm d−1) by latitude band and season for each JULES model configuration compared to the FluxCom and GLEAM global ET products. The bars along the side indicate which model configuration gives the lowest RMSE and therefore better comparison to FluxCom (righthand bar) and GLEAM (left-hand bar) derived ET for each region. RMSE values are shown in Table S6 (FluxCom) and Table S7 (GLEAM). The grey shaded area shows the uncertainty in the FluxCom ET product, provided as the median absolute deviation of ensemble members, this is scaled to a robust estimate of the standard deviation of a normal distribution by multiplying by 1.4826 according to Jung et al. (2019).
4.2.4 Comparison to global estimates: spatial variability of mean GPP and ET
The spatial variability of simulated GPP and ET is shown in Fig. 6 during JJA (Fig. S11 for DJF). We show which of the JULES model configurations gives the lowest RMSE compared to observation-based estimates of GPP and ET from FluxCom, MODIS and GLEAM (actual RMSE in Figs. S12 and S13). The differences in RMSE are typically small between the different JULES model configurations; however some clear patterns emerge. Figure 6a and b show that in the tropical forests of the Amazon basin, central Africa and Southeast Asia (Indonesia, Papua New Guinea, Malaysia), in both JJA and DJF (Fig. S11a and b for DJF), GPP simulated including thermal acclimation (AcKK.Med) compares best to both FluxCom and MOD17 across large spatially consistent areas. Outside of these areas, Fq.Jac also improves the simulation of GPP in the tropics, as does the Medlyn gs model (Fq.Med) in JJA in South China and Indo-China. Also, in the high northern latitudes, dominated by evergreen needleleaf forests, inclusion of thermal acclimation more closely aligns simulated GPP with both FluxCom and MOD17 (Fig. 6a and b). Compared to FluxCom, ET in JJA is simulated best by thermal acclimation (AcKK.Med) in the northern temperate and boreal region, although this pattern is not consistent in comparison to GLEAM (Fig. 6c and d). In contrast to GPP, results are more mixed in the tropics for ET. In areas dominated by tropical tree cover, thermal acclimation (AcKK.Med) and Medlyn (Fq.Med) tend to give the lowest RMSE in JJA and DJF, and in tropical areas dominated by C3 and C4 grasses Farquhar (Fq.Jac) performs best (Fig. 6c and d), although in DJF the Medlyn model gives the lowest RMSE in these areas (Fig. S11c and d). In DJF for both GPP and ET, in northern temperate and boreal regions the Collatz with Jacobs (Clz.Jac) configuration performs the best (Fig. S11).
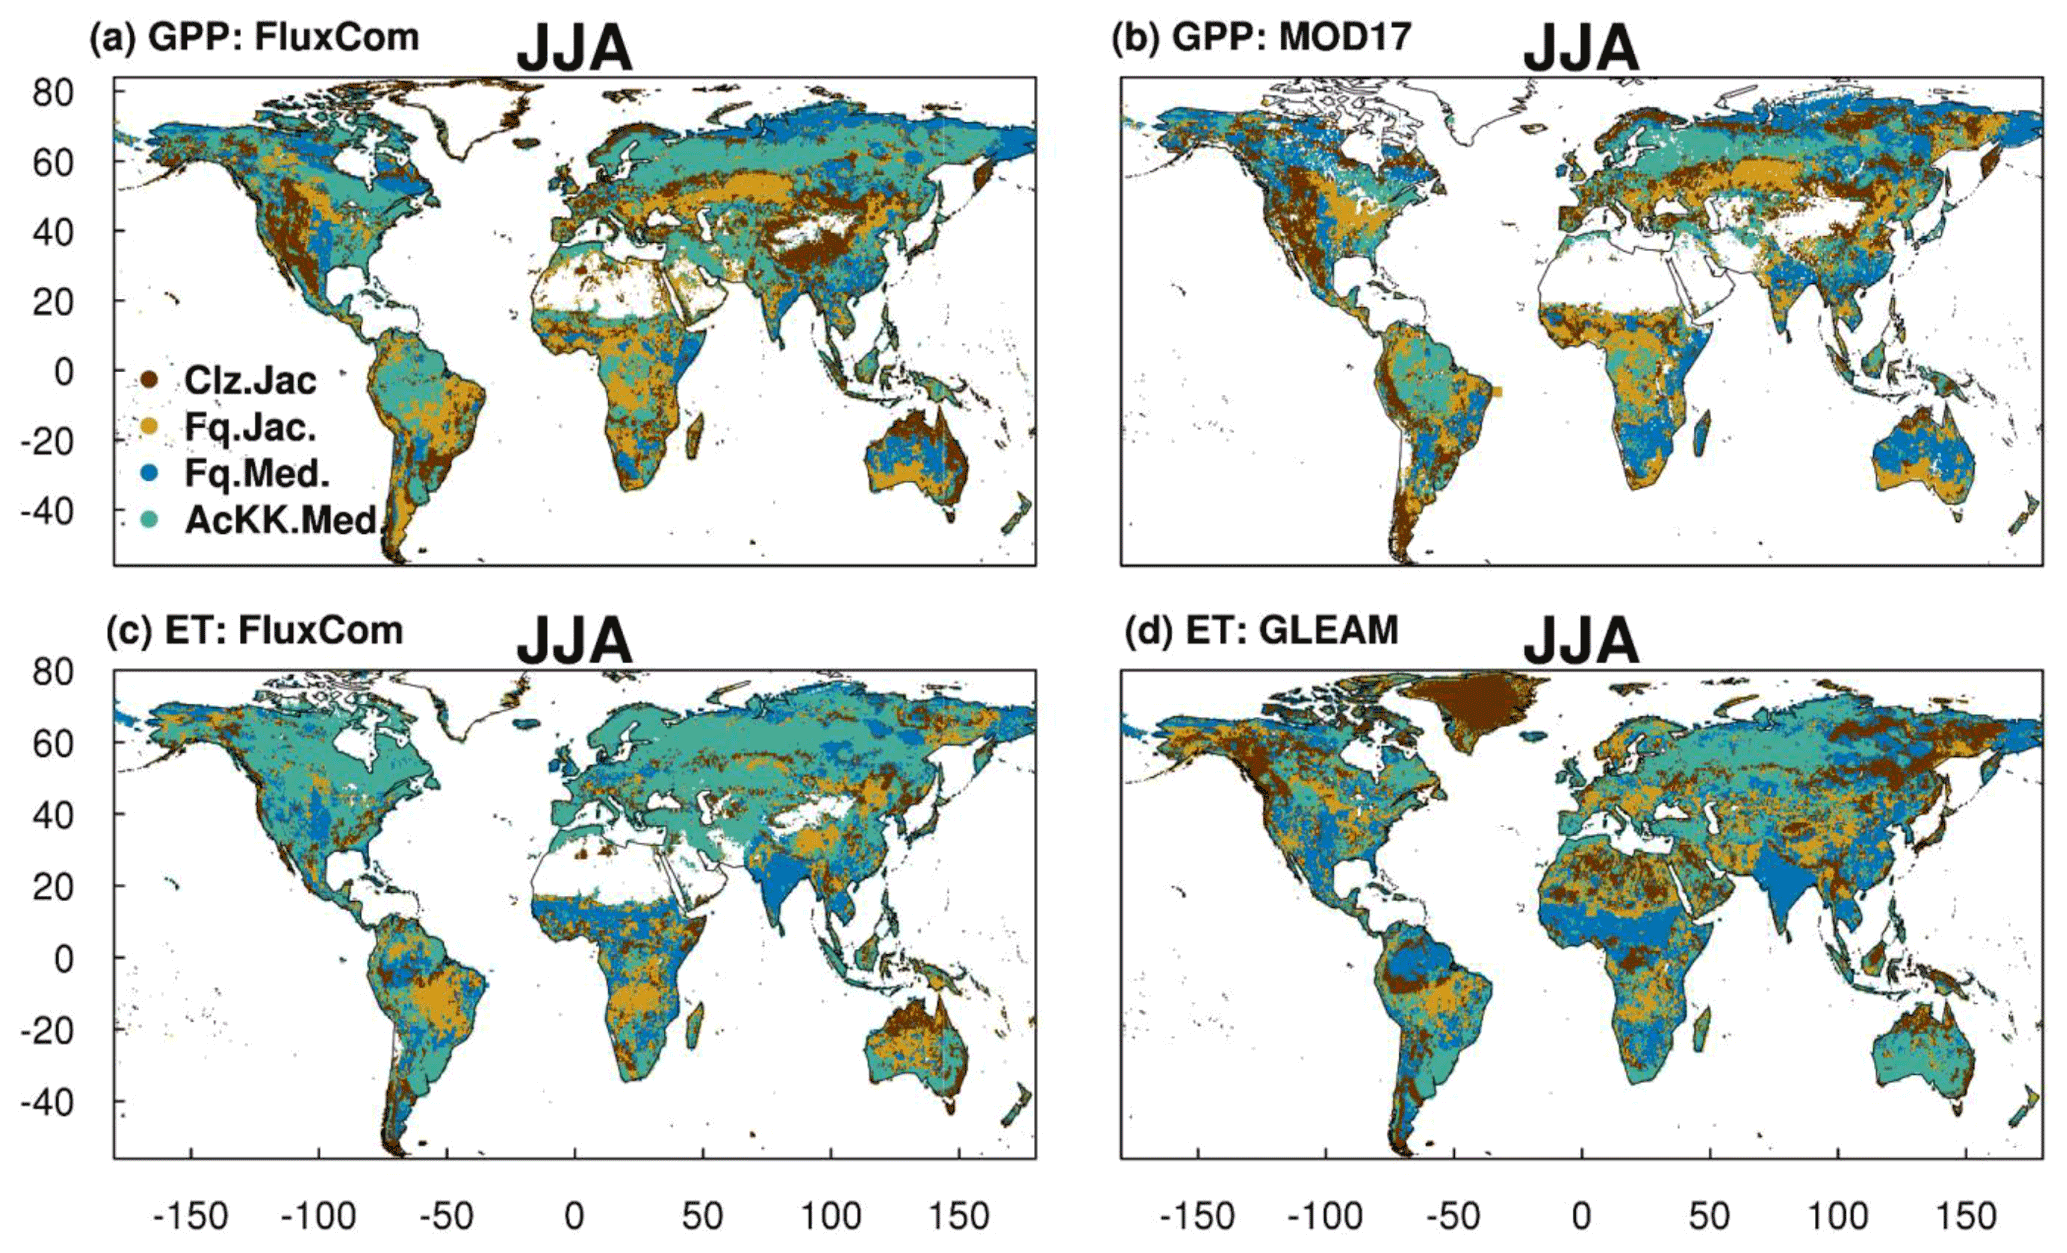
Figure 6Colours indicate the JULES model configuration that gives the lowest RMSE compared to either the (a) FluxCom and (b) MOD17 global GPP (g C m2 d−1) products or (c) FluxCom and (d) GLEAM global ET (mm d−1) products for JJA over the period 2002 to 2012. Actual RMSE values shown in Figs. S12 and S13.
4.3 Application under future climate
We run the new configurations forced by variables from a future climate scenario (HadGEM3-GC3.1 forcing under a high-end emission scenario of the SSPs) to investigate the response of simulated fluxes to long-term warming. Changing the photosynthesis scheme from Collatz to Farquhar results in lower GPP (up to 30 % decrease) by 2050 across the high-northern-latitude forests (Fig. 7a), with the impact on LE (decreased) and H (increase) less extensive (Fig. 7b and c). This area is dominated by NET, NDT and BDT PFTs in JULES. The different temperature sensitivity of photosynthesis parameterised with the Farquhar model compared to Collatz (Fig. S1g, j and m) means at lower leaf temperatures, photosynthesis is higher with Farquhar; however, as leaf temperature increases, photosynthesis falls in Farquhar relative to Collatz. The crossover point at which this occurs is relatively low for these PFTs, particularly NET. This impact of the change in temperature sensitivity was seen in the site-level simulations at FLUXNET NET and BDT sites. There, modelled GPP tended to be higher with Farquhar than Collatz in MAM but lower in the warmer conditions of JJA, and in this climate change scenario, the temperate and boreal region both experience large increases in mean annual air temperature (+5 ∘C from 1980 to 2060; Fig. S4a and c).
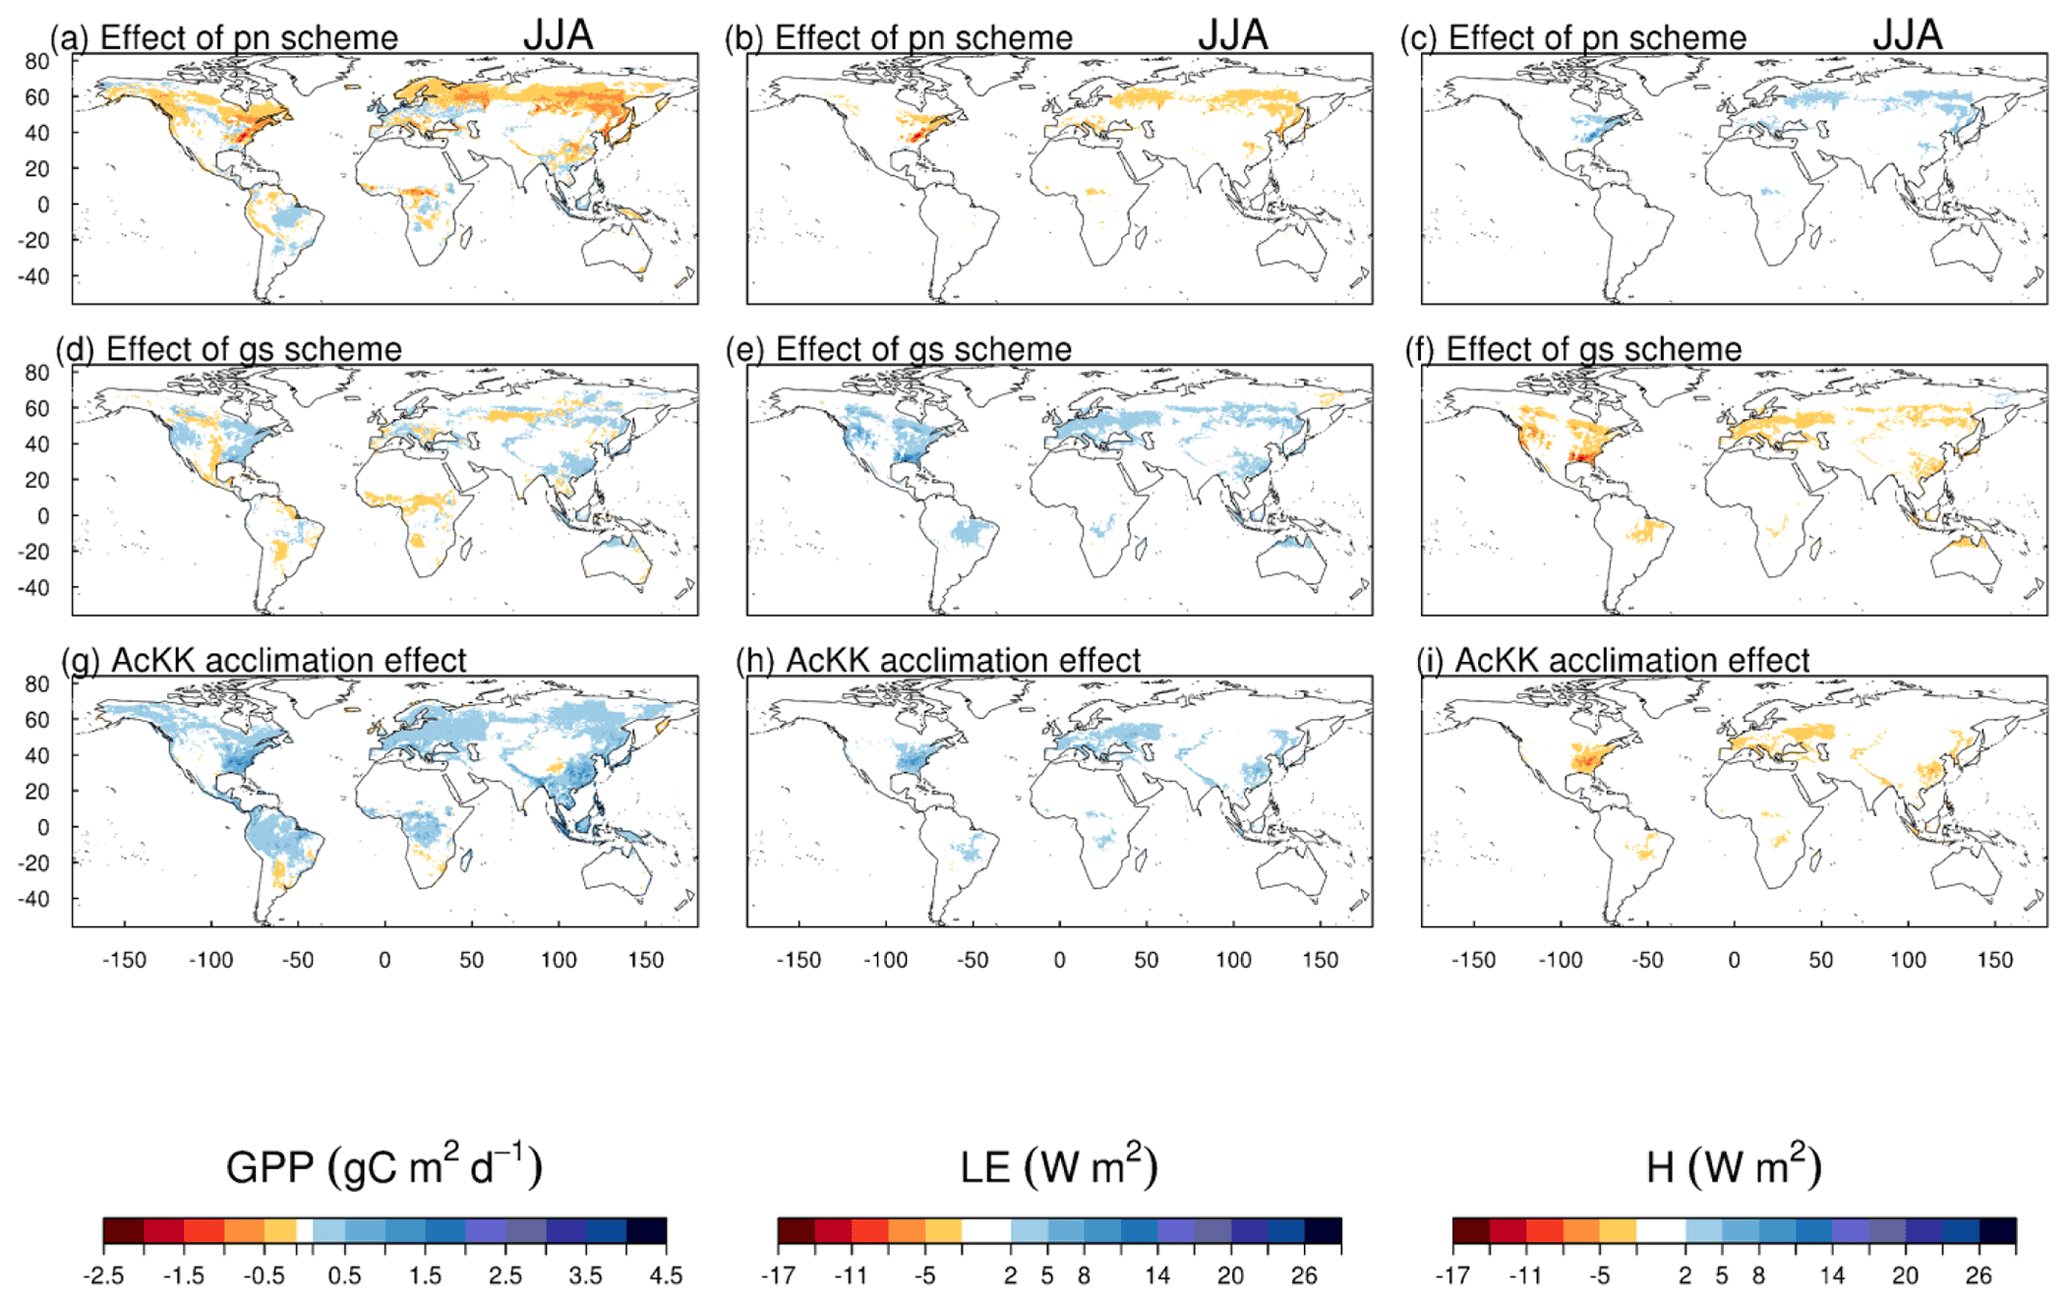
Figure 7The difference of difference approach (Eq. 12) to determine the impact on GPP (g C m2 d−1), LE and H (both W m2) of the individual changes to each JULES model configuration over the course of the future (HadGEMGC3.1) simulation (1980 to 2050) in June–July–August (JJA). The AcKK.Med acclimation effect is calculated from Fig. S16 AcKK.Med–Fq.Med, the effect of the Medlyn gs scheme is calculated from Fig. S16 Fq.Med–Fq.Jac and the effect of the photosynthesis scheme is calculated from Fig. S16 Fq.Jac–Clz.Jac.
Replacing the Jacobs gs scheme with Medlyn has the biggest impact on the surface energy fluxes, with increased LE of up to 30 % and a corresponding decrease in H by 2050 across the temperate region (Fig. 7e and f). This area is dominated by the C3 grass PFT in JULES, which has a less conservative water-use strategy in the Medlyn scheme (high g1) compared to Jacobs. This means in the Medlyn scheme, the C3 grass PFT is less sensitive to increasing humidity deficit at the leaf surface; therefore as humidity deficit increases, Medlyn simulates higher ci, leading to a higher rate of transpiration and LE compared to Jacobs (Fig. S7).
Thermal acclimation of photosynthesis leads to widespread increases in GPP by 2050 (Fig. 7g). This amounts to 10 % in the tropical forests, up to 30 % in northern temperate and boreal regions, and up to 40 % in Southeast Asia. In this long-term climate change scenario, with large increases in mean annual temperature (Fig. S4), the impact of thermal acclimation on GPP can clearly be seen. The flexibility in , and the ratio of photosynthesis that thermal acclimation allows through letting these parameters move with the prevailing Tgrowth allows for higher rates of photosynthesis and therefore GPP as temperatures increase. By contrast, in simulations where photosynthetic rates are controlled by fixed temperature sensitivities, vegetation may have moved past its thermal optimum. Time series of the area-weighted mean annual GPP show that in this simulation, across the tropical region, thermal acclimation enhances GPP by ∼ 7.5 PgC compared to no acclimation (Fig. 8a). In the temperate region and sub-tropics, thermal acclimation increases GPP by ∼ 1 PgC by 2050 (Fig. 8b and d), and in the boreal region, GPP is enhanced by ∼ 0.4 PgC (Fig. 8c). Thermal acclimation of photosynthesis also has a large impact on simulated energy fluxes, most notably in the northern temperate region, where LE is increased by up to 50 % to 60 % (decreased H up to 40 % to 50 %) (Fig. 7h and i).
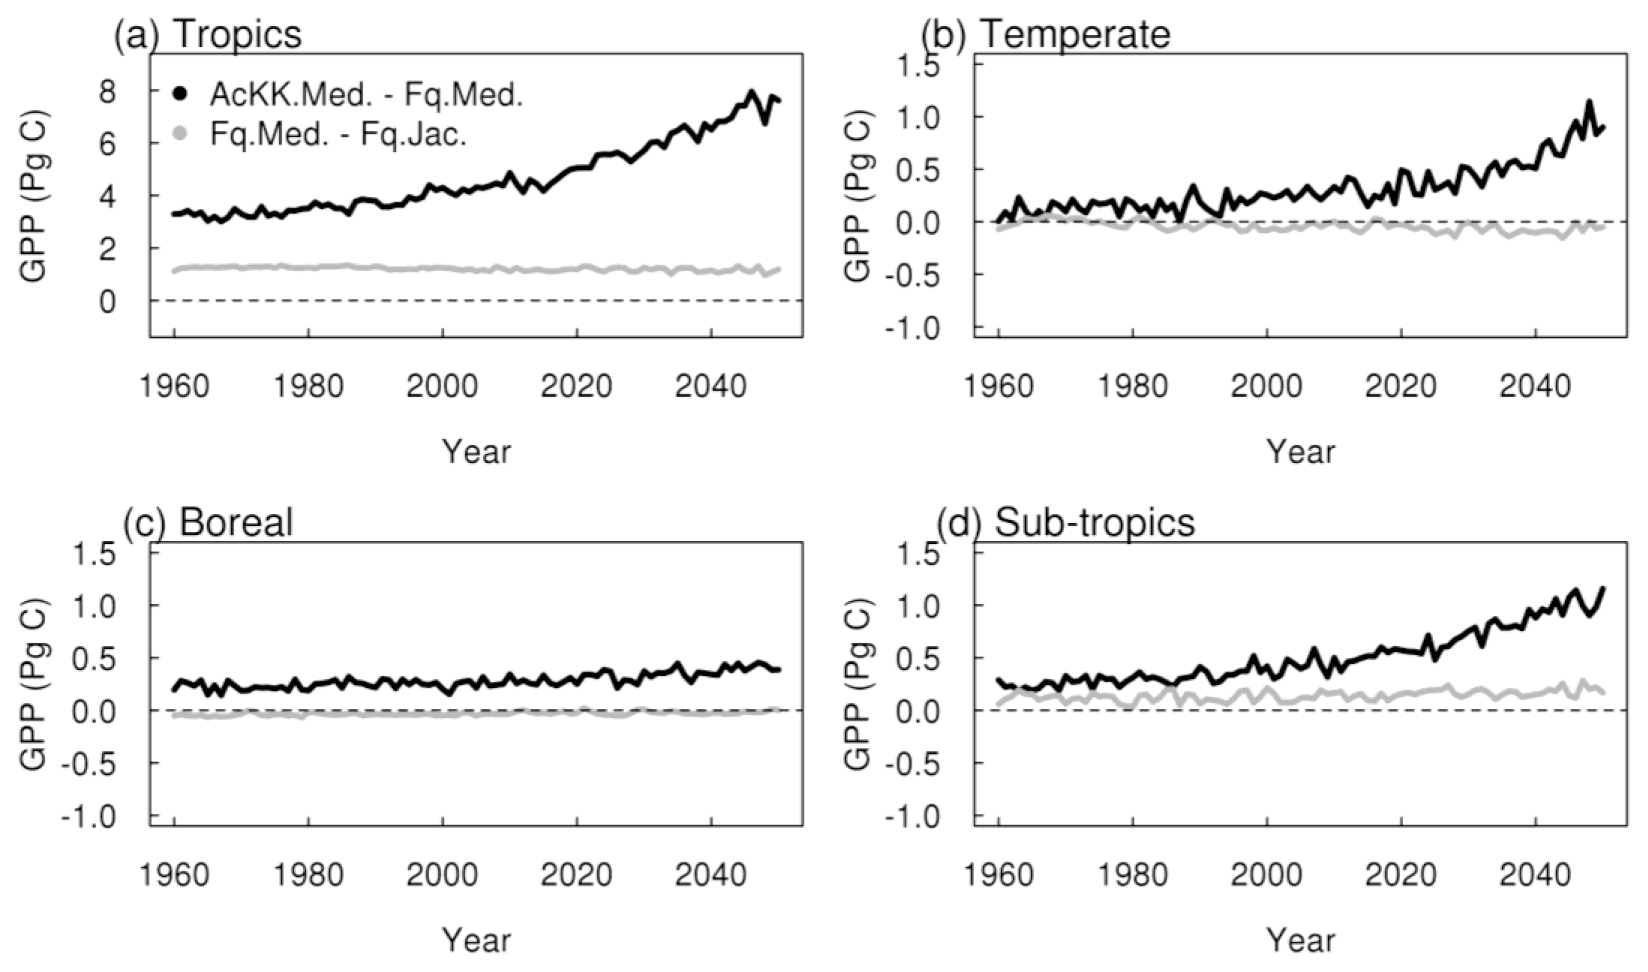
Figure 8Time series of the regional mean acclimation effect, i.e AcKK.Med–Fq.Med (black), and the effect of the Medlyn gs model, i.e. Fq.Med–Fq.Jac (grey).
Photosynthesis and gs are central to the estimate of carbon and water fluxes in LSMs, and, when coupled in ESMs, these processes feedback onto the climate system to influence predictions of future climate change. Therefore improving the representation of these processes in LSMs is important, and previous studies have identified thermal acclimation of photosynthesis as a key missing process (Booth et al., 2012).
5.1 Performance of the new JULES plant physiology model configurations: thermal acclimation
Our results show that including thermal acclimation of photosynthesis in the JULES model improves simulated carbon and water fluxes in several key areas for the recent contemporary period. Firstly, the seasonal mean estimates of global GPP show that in most seasons (JJA, MAM and DJF), thermal acclimation of photosynthesis with Medlyn gs (AcKK.Med) predicts GPP in closer agreement with estimates from FluxCom compared to the traditional “standard” JULES configuration of Collatz photosynthesis with Jacobs gs (Clz.Jac). Secondly, thermal acclimation with Medlyn gs improves the simulation of GPP (reduces GPP) in the tropical forests in JJA and DJF (i.e. the Amazon basin and central African rainforest region) and is in closest agreement with estimates of GPP from both FluxCom and MOD17 for these regions. Thirdly, in the high-northern-latitude forests dominated by evergreen needleleaf trees, thermal acclimation increases GPP in JJA and is again in closest agreement with the observational estimates. Finally, in JJA, AcKK.Med improves the simulation of ET across a large area of the temperate north and boreal regions.
Our evaluation therefore suggests that fixed, PFT-specific temperature dependencies for Vcmax (and Jmax) do not accurately simulate GPP for the tropical tree and evergreen needleleaf tree PFTs for the present day in the JULES model. Thermal acclimation allows the temperature sensitivity of photosynthesis to adjust to the local temperature environment through flexibility in , and the ratio. In the tropical forests, for example, GPP is overestimated by both Clz.Jac and Fq.Jac. The configuration with thermal acclimation reduces GPP compared to both these model configurations. From the leaf-level plots in Fig. S1a, the fixed Topt of photosynthesis in the Collatz scheme is ∼ 33 ∘C and in Farquhar is ∼ 34 ∘C. This is higher than observations from Fig. 1a of Kumarathunge et al. (2019b), where the Topt for net leaf photosynthesis lies between ∼ 29 and 32 ∘C, and other studies also show a lower Topt for photosynthesis of around 30 ∘C for mature tropical trees (Hernández et al., 2020; Mau et al., 2018). This supports our results and suggests the fixed temperature sensitivity of photosynthesis for tropical trees in the JULES model results in a Topt of photosynthesis that is too high for the current day. Thermal acclimation results in a more realistic Topt of photosynthesis for tropical trees because it is influenced by actual growth temperature and so can adjust to local environmental conditions.
Under the climate change scenario used in this study, thermal acclimation shows a sustained positive acclimation effect in all regions, increasing GPP in response to long-term warming (although this is less pronounced in the boreal region). By 2050 GPP was ∼ 10 % higher with thermal acclimation in the tropical forests, up to 30 % to 40 % higher across a large area of the Northern Hemisphere. Our findings broadly agree with Mercado et al. (2018), who implemented the Kattge and Knorr (2007) thermal acclimation scheme into JULES running as part of a coupled climate–carbon model and found that thermal acclimation increased land carbon storage in tropical and temperate regions. This is in contrast to Lombardozzi et al. (2015) and Smith et al. (2016), whose studies both found a negative impact of photosynthetic thermal acclimation in the tropics, again using the Kattge and Knorr (2007) thermal acclimation scheme. Mercado et al. (2018) attribute these differences to the method used to implement acclimation of the ratio at 25 ∘C, that is either reducing Jmax alone as in the case of the latter two studies or by decreasing Jmax and increasing Vcmax simultaneously whilst keeping the total amount of leaf nitrogen the same as used in the present study and in Mercado et al. (2018). The simulated response of thermal acclimation therefore appears to be sensitive to this subtlety in the parameterisation of the acclimation schemes and warrants further investigation. Yet a clear understanding of what drives the change in the ratio in response to Tgrowth is still lacking. More recent results from the analysis by Kumarathunge et al. (2019b) highlight the difficulty in pinning down what drives this process. They found that the ratio responded strongly and consistently to Tgrowth, but whether that was achieved by increasing Vcmax, decreasing Jmax or both was highly variable.
The behaviour of the thermal acclimation scheme in JULES in response to long-term warming implies unlimited thermal resilience of vegetation, but how realistic is this? Observational studies suggest temperate tree species have sufficient capacity to acclimate to rising temperatures (e.g. Drake et al., 2015; Reich et al., 2018; Sendall et al., 2015), although large inter-specific variability in thermal tolerance is identified in co-occurring temperate tree species (Guha et al., 2018). Studies exploring thermal acclimation of photosynthesis for grasslands and C3 herbaceous vegetation are more limited. For boreal tree species, experimental studies suggest high variability between species with respect to photosynthetic acclimation responses to increasing temperatures; for example, there is an increasing body of work suggesting that the evergreen boreal conifer species Picea might be particularly vulnerable to warming (Benomar et al., 2017; Dusenge et al., 2020; Kroner and Way, 2016; Kurepin et al., 2018; Way and Sage, 2008; Zhang et al., 2015). The 3-year open-air warming experiment of Reich et al. (2018) showed that for 11 temperate and boreal tree species studied, warming increased photosynthesis in most species on wet soils but not in drier conditions. Further, under moist soil conditions, all deciduous species showed an acclimation response to increased temperatures; however, the two boreal evergreen species, Abies and Picea, showed no thermal acclimation response at any soil moisture concentration. It is generally thought that evergreen species have a reduced capacity to acclimate growth and photosynthesis to warming compared to deciduous tree species (Dusenge et al., 2020; Way and Yamori, 2014). Therefore, the response of boreal forest ecosystems to warming will depend on species composition given the varied acclimation capacities shown and lower diversity of boreal forests and, as Reich et al. (2018) highlight, also on interaction with other climate changes such as precipitation. In contrast to temperate and boreal forests, tropical forests are thought to be more susceptible to climate change, having evolved under relatively narrow temperature regimes and experiencing less seasonal and day-to-day variation in temperature changes (Cunningham and Read, 2003). As a consequence, an increasing number of studies show that tropical trees have less capacity to physiologically acclimate photosynthesis to increasing temperatures (Carter et al., 2021; Dusenge et al., 2021; Mau et al., 2018; Miller et al., 2021; Vårhammar et al., 2015). Other studies have determined high temperature threshold responses of photosynthesis, indicating an ability of tropical trees to acclimate to moderate warming, but more severe warming decreases carbon gain (Doughty and Goulden, 2008; Pau et al., 2018; Slot and Winter, 2017; Sullivan et al., 2020). In two tropical understorey species, acclimation of the Topt of photosynthesis was observed in the early successional species, whereas no acclimation capacity was shown by the mid-successional species (Carter et al., 2020). Our study demonstrates a large positive impact of thermal acclimation on GPP in tropical forests. However a notable uncertainty in the parameterisation is that the dataset used in the Kattge and Knorr (2007) scheme to construct the empirical relationships is heavily weighted towards temperate species, including only two boreal species and no tropical species (Kattge and Knorr, 2007). There is a significant gap in understanding tropical forest responses to increasing temperature. Observational studies are starting to address this gap, but this increasing knowledge is yet to be incorporated into models. Therefore, whilst results from this study demonstrate the importance of thermal acclimation of photosynthesis on simulation of the future global carbon cycle, they should be interpreted with some caution. The varied results from experimental studies highlight the research needed to further understand thermal acclimation responses in a variety of ecosystems, over different timescales and from leaf level through to the canopy and finally to translate that understanding so it is amenable to incorporation into ESMs.
5.2 Performance of the new JULES plant physiology model configurations: Medlyn gs
In this study, the Medlyn gs model had the biggest impact on surface energy fluxes simulated by the C3 grass PFT and needleleaf evergreen tree PFT in JULES. This reflects a change to the water-use strategy of these PFTs as reported by Lin et al. (2015) that is not currently captured by parameterisations in the JULES Jacobs model. Global simulations with the Medlyn scheme for the recent contemporary period simulated a ∼ 10 % decrease in LE (increased H) across the high northern latitudes dominated by the NET PFT compared to the standard JULES Jacobs gs scheme. The future climate change experiment showed a large response across the temperate region dominated by the C3 PFT, where LE increased by ∼ 30 % (H decreased) with Medlyn. Our study for the current day is in agreement with De Kauwe et al. (2015) who found a large impact of the Medlyn model on transpiration fluxes in needle leaved evergreen trees (∼ 30 % reduction) in the CABLE LSM. Coupled simulations using CABLE within the Australian Community Climate and Earth Systems Simulator (ACCESSv1.3b) showed that the Medlyn gs scheme reduced the LE flux from the land surface over the boreal forests during JJA by 0.5–1.0 mm d−1, leading to warmer daily maximum and minimum temperatures by up to 1.0 ∘C and warmer extreme maximum temperatures by up to 1.5 ∘C (Kala et al., 2015). In future simulations, this new parameterisation of the stomatal scheme in ACCESS1.3 substantially increased the intensity of future heatwaves across northern Eurasia (Kala et al., 2016).
5.3 Implications for land–atmosphere feedbacks
Modifying the leaf-level stomatal behaviour in JULES impacts the simulated surface energy fluxes. In our study, a change in stomatal opening results from either a direct change in the parameterisation of gs or through altered stomatal behaviour in response to temperature. In our offline climate change simulation, thermal acclimation increased stomatal opening in response to long-term warming, and in some regions this increased the rate of transpiration and evaporative cooling and decreased the sensible heat flux. When coupled to an atmospheric model, such behaviours have potential to feedback on the land surface via changes in temperature, cloud cover and precipitation, as, for example, modelled by de Arellano et al. (2012), Kala et al. (2015, 2016), Kooperman et al. (2018) and Zeng et al. (2017). The extent and amplitude of acclimation-induced perturbations to surface energy fluxes in our offline simulation suggest a potential impact on regional-scale circulations, for example, across the East Asian monsoon region. The impact of these changes to the plant physiology routines in JULES on land–atmosphere feedbacks will be investigated in future work through coupled simulations in the HadGEM global climate model.
5.4 Limitations of this study
Across all latitudes, the changes introduced to JULES by the new plant physiology routines did not degrade the performance of JULES. All model configurations compared reasonably well to the FluxCom and MOD17 GPP products and FluxCom and GLEAM ET products, given that there are also uncertainties inherent in estimates from these products. For example, the satellite-based products of GPP have recently been shown to incorrectly capture the response of photosynthesis to CO2, which means they potentially underestimate the response of GPP to rising atmospheric CO2 (Keenan et al., 2021). Nevertheless, some notable biases in the model were identified that were common to all JULES model configurations, for example, the over-prediction of GPP and ET in the temperate and boreal region in SON and the over-prediction of both fluxes in MAM in the southern tropics (0 to −20∘ S). Potential sources of error to consider may be the use of a prescribed climatology of MODIS-based LAI, which some studies have reported to be inaccurate over forested areas (Shabanov et al., 2005). Other processes currently missing in the model may also contribute to these large biases, such as a lack of seasonality in photosynthetic capacity (i.e. Vcmax and Jmax), which has been demonstrated for many different forest species (Croft et al., 2017; Wilson et al., 2001) and without which likely causes overestimation of forest carbon exchange. For example, in SON the high GPP and ET bias occur in the northern temperate and boreal region, which could be linked to a lack of photosynthetic phenology in the model. Towards the end of the growing season, leaves in this region have reduced nitrogen content and therefore lower photosynthetic capacity, but because JULES uses a fixed value for photosynthetic capacity, JULES maintains a high rate of carbon assimilation despite having seasonal LAI.
More generally, this study revealed limited data to inform the temperature sensitivity response functions of different PFTs for implementation into LSMs. We found only a few datasets for C3 grass/herbaceous vegetation (e.g. Wohlfahrt et al., 1999; Joseph et al., 2014), which represents only limited geographical coverage. Consequently, we fitted the temperature response function for this PFT in the Farquhar scheme to that of the existing function in the JULES Collatz photosynthesis scheme. We also encountered an issue regarding uncertainty about the temperature response functions at low temperatures. The data-led functions we implemented for all PFTs (with the exception of the C3 PFT) from Kumarathunge et al. (2019b) showed higher rates of leaf-level photosynthesis at low leaf temperatures compared to the existing functions in the JULES Collatz scheme, where photosynthesis was much lower and goes to zero at 0 ∘C for most PFTs (see PFT leaf-level temperature sensitivity curves for gross photosynthesis in Fig. S1). In our simulations, this led to higher GPP in DJF when using the Farquhar scheme, which increased biases with respect to FluxCom and MOD17 global estimates of GPP. It is desirable to use the temperature response functions from Kumarathunge et al. (2019b) as these are entirely data-led. However for some PFTs, the resulting behaviour of photosynthesis at very low temperatures looks potentially unrealistic, and the question here is how well constrained the temperature sensitivity curves are by observations at low temperatures. For global modelling applications, understanding the response of photosynthesis to temperature over a wide temperature range is essential, including at low temperatures as well as around the Topt of photosynthesis for different species and PFTs. Additionally, increasing the understanding and data availability of the temperature sensitivity of different species from different biomes will allow for greater representation within LSMs of the variation that exists across the globe.
The simulations presented in this work use a prescribed map of vegetation cover which means the extent and location of each PFT does not change over time. The model can alternatively be run with dynamic vegetation enabled, which means the model predicts the extent of each PFT, and therefore vegetation cover can change in space and time as PFTs compete with each other in response to changing climatic conditions. Yet to be explored as part of this work is how changes to the plant physiology routines, as implemented here, might affect the extent of different PFTs over time when vegetation dynamics is enabled. For example, changes to the temperature response of photosynthesis may lead to a competitive advantage of one PFT over another, and therefore the vegetation distribution may be very different as temperatures rise compared to simulations that either use the original Collatz temperature sensitivities or do not include thermal acclimation of photosynthesis. We hypothesise, for example, that allowing for thermal acclimation of the temperature sensitivity of photosynthesis would make the vegetation distribution more stable in a warmer climate as vegetation can adjust its photosynthetic capacity to function more efficiently as temperatures rise. Applied in a coupled ESM, a change in vegetation distribution would impact projections of future climate change.
The treatment of soil moisture stress in JULES is through a linear response function (the β function; Eq. 12 in Best et al., 2011), the use of which in JULES and other LSMs has been identified as a key source of uncertainty (Blyth et al., 2011; Verhoef and Egea, 2014; Vidale et al., 2021). Incorrect representation of soil moisture stress has large impacts for modelled carbon and water fluxes and is of particular importance as droughts are predicted to increase in frequency or intensity in the future. Work is ongoing to improve the representation of soil moisture stress in JULES. Harper et al. (2021) investigated alternative parameterisations for β and found that increasing modelled soil depth and therefore plant access to deep soil moisture improved the simulation of soil moisture stress at eddy covariance flux tower sites. In addition, using soil matric potential instead of volumetric water content in the β function allowed for PFT-specific parameterisation of soil moisture stress responses to further improve modelled fluxes. Vidale et al. (2021) explored combinations of non-linear β function responses applied at different points in the photosynthesis–gs pathway (i.e. carbon assimilation, gs, or mesophyll conductance). They found that treatments allowing β to act on vegetation fluxes via stomatal and mesophyll routes were able to better capture the spatiotemporal variability in water-use efficiency during the growing season. However, in addition to these alternative parameterisations of β, further developments to how the soil–plant hydraulic system is represented in JULES are being made, including an optimality-based plant hydraulic transport model recently implemented in JULES (Eller et al., 2020).
Whilst the development of multi-layer canopy radiation models in LSMs has improved the simulation of radiation and energy within vegetation canopies, the interception of light by plants in JULES, like most LSMs, is not well represented despite being critical to predicting the uptake of carbon by plants (Loew et al., 2014). LSMs generally make the simplifying assumption that leaves are randomly arranged in space, instead of being clustered into tree crowns or around branches, leaving gaps in and around the canopy. Shortwave radiation is used by plants to photosynthesise, and canopy structure has a direct impact on the fraction of this radiation absorbed. Therefore canopy architecture plays an important role in the partitioning of incident solar radiation, photosynthesis, transpiration and momentum fluxes (Braghiere et al., 2019). More recently, alternative approaches are being considered to represent the forest light environment in LSMs to account for the structural effects of vegetation on radiation partitioning, ranging from canopy clumping parameterisations (Braghiere et al., 2019, 2020, 2021) to 3-dimensional models of the canopy light environment (Hogan et al., 2018; Kobayashi et al., 2012), embedded in radiative transfer schemes, although the latter tend to be computationally expensive (Yang et al., 2001). Braghiere et al. (2019) incorporated canopy clumping from satellite data into JULES, which resulted in an increase in carbon uptake by photosynthesis. The greatest effect was in the tropics, where the canopy clumping parameterisation allowed more light to reach the lower layers of the canopy, where photosynthesis tends to be limited by light availability.
5.5 Conclusions
Here we introduce new representations of plant physiological processes into the JULES model, building enhanced capability and allowing for stronger links between model and field studies. This work (a) introduces updated understanding of plant physiological processes into JULES, (b) increases the flexibility of the modelling capacity within JULES by allowing for the use of two alternative photosynthesis and gs schemes, in addition to thermal acclimation of photosynthesis, and (c) provides new parameters that are entirely based on large observational datasets. Testing and evaluation at site level and globally show some key improvements are made to the JULES model. Thermal acclimation of photosynthesis coupled with the optimality-based gs scheme led to improved simulated carbon fluxes across much of the tropics for the present day. With about 40 % of the world's vegetation carbon residing in tropical forests, they play a crucial role in regulating both regional and global climate through water and carbon cycle dynamics (Erb et al., 2018; Pan et al., 2011). Therefore, accurate representation of tropical carbon fluxes within LSMs is important. Thermal acclimation and the optimality-based gs scheme also improved simulated carbon fluxes in the high-northern-latitude forests in the Northern Hemisphere summer, and the same model configuration also improved simulated water fluxes across much of this region in the same season. The optimality-based Medlyn gs scheme reduced the LE flux substantially across the northern boreal forests in JJA. This change reflects a more conservative water-use strategy for the needleleaf evergreen tree PFT that dominates in this region as suggested by the global synthesis of experimental data from Lin et al. (2015). The current JULES Jacobs scheme parameterisation does not accurately capture the water-use strategy of this PFT. Our future climate experiment highlights the impact of thermal acclimation on simulating carbon cycle dynamics and energy fluxes in response to long-term warming. The potential impact of this altered stomatal behaviour on land–atmosphere feedbacks via changes in surface energy fluxes will be examined in future coupled simulations.
JULES-vn5.6 was used for all simulations. The JULES model code and suites used to run the model are available from the Met Office Science Repository Service (MOSRS). Registration is required, and code is freely available to anyone for non-commercial use (for details of licensing, see https://jules.jchmr.org/content/code, last access: 5 April 2022). Visit the JULES website (https://jules.jchmr.org/content/getting-started, last access: 5 April 2022) to register for a MOSRS account. The results presented in this paper were obtained by running JULES from the following branch: https://code.metoffice.gov.uk/trac/jules/browser/main/branches/dev/douglasclark/vn5.6_acclimation@16578 (Clark, 2022). This is a development branch of JULES-vn5.6 to include thermal acclimation of photosynthesis as described in this paper. This branch can be accessed and downloaded from the Met Office Science Repository Service once the user has registered for an account, as outlined above. Documentation for the JULES model is located at https://jules-lsm.github.io/vn5.6/ (last access: 14 July 2022). Output data from the model simulations and R scripts to produce the plots in the paper are provided at https://doi.org/10.5281/zenodo.5825540 (Oliver et al., 2022). Site-level simulations used the rose suite u-br064 (https://code.metoffice.gov.uk/trac/roses-u/browser/b/r/0/6/4/, Oliver, 2022, at revision 146216), which is a copy of the u-al752 JULES suite for FLUXNET 2015 and LBA sites described at https://code.metoffice.gov.uk/trac/jules/wiki/FluxnetandLbaSites (last access: 14 July 2022) and downloaded from https://code.metoffice.gov.uk/trac/roses-u/browser/a/l/7/5/2/ (Harper et al., 2022) at revision 145397. The global simulations used JULES rose suite u-bq898 (https://code.metoffice.gov.uk/trac/roses-u/browser/b/q/8/9/8/, McGuire et al., 2022, at revision 181188), which uses the Global Land configuration 7.1 (Wiltshire et al., 2020). Suites can be downloaded from MOSRS once the user has registered for an account.
The supplement related to this article is available online at: https://doi.org/10.5194/gmd-15-5567-2022-supplement.
RJO performed simulations and analysis and wrote the first version of the manuscript. DBC, LMM and RJO developed the model. PLV, PCM and MT provided data for the future climate runs, help with developing the JULES suites and general expertise. CH assisted with analysis. SF and VSS provided ancillary data for forcing the model. LMM, CMT, CH, PLV, BEM, PCM and MT contributed to editing the manuscript. All authors contributed to discussions throughout to develop the work.
The contact author has declared that none of the authors has any competing interests.
Publisher’s note: Copernicus Publications remains neutral with regard to jurisdictional claims in published maps and institutional affiliations.
This work used eddy covariance data acquired and shared by the FLUXNET community, including these networks: AmeriFlux, AfriFlux, AsiaFlux, CarboAfrica, CarboEuropeIP, CarboItaly, CarboMont, ChinaFlux, FLUXNET Canada, GreenGrass, ICOS, KoFlux, LBA, NECC, OzFlux-TERN, TCOS-Siberia and USCCC. The ERA-Interim reanalysis data are provided by ECMWF and processed by LSCE. The FLUXNET eddy covariance data processing and harmonisation was carried out by the European Fluxes Database Cluster, AmeriFlux Management Project and Fluxdata project of FLUXNET, with the support of CDIAC and ICOS Ecosystem Thematic Center and the OzFlux, ChinaFlux and AsiaFlux offices.
This work and its contributors (Rebecca J. Oliver, Lina M. Mercado, Chris Huntingford, Christopher M. Taylor, Pier Luigi Vidale, Patrick C. McGuire, Markus Todt and Sonja Folwell) were supported by the UK–China Research & Innovation Partnership Fund through the Met Office Climate Science for Service Partnership (CSSP) China as part of the Newton Fund. Rebecca J. Oliver was also supported by the Natural Environment Research Council (grant no. NEC05816 LTS-M-UKESM).
This paper was edited by Christoph Müller and reviewed by Bob Su and two anonymous referees.
Atkin, O. K., Evans, J. R., and Siebke, K.: Relationship between the inhibition of leaf respiration by light and enhancement of leaf dark respiration following light treatment, Funct. Plant Biol., 25, 437–443, https://doi.org/10.1071/PP97159, 1998.
Atkin, O. K., Evans, J. R., Ball, M. C., Lambers, H., and Pons, T. L.: Leaf Respiration of Snow Gum in the Light and Dark. Interactions between Temperature and Irradiance1, Plant Physiol., 122, 915–924, https://doi.org/10.1104/pp.122.3.915, 2000.
Atkin, O. K., Scheurwater, I., and Pons, T. L.: High thermal acclimation potential of both photosynthesis and respiration in two lowland Plantago species in contrast to an alpine congeneric, Glob. Change Biol., 12, 500–515, https://doi.org/10.1111/j.1365-2486.2006.01114.x, 2006.
Ball, M. C., Woodrow, I. E., and Berry, J. A.: A model predicting stomatal conductance and its contribution to the control of photosynthesis under different environmental conditions, in: Progress in Photosynthesis Research, edited by: Biggins, J., Martinus Nijhoff Publishers, Dordrecht, the Netherlands, 221–224, https://doi.org/10.1007/978-94-017-0519-6_48, 1987.
Benomar, L., Lamhamedi, M. S., Pepin, S., Rainville, A., Lambert, M.-C., Margolis, H. A., Bousquet, J., and Beaulieu, J.: Thermal acclimation of photosynthesis and respiration of southern and northern white spruce seed sources tested along a regional climatic gradient indicates limited potential to cope with temperature warming, Ann. Bot.-London, 121, 443–457, https://doi.org/10.1093/aob/mcx174, 2017.
Bernacchi, C. J., Singsaas, E. L., Pimentel, C., Portis Jr., A. R., and Long, S. P.: Improved temperature response functions for models of Rubisco-limited photosynthesis, Plant Cell Environ., 24, 253–259, https://doi.org/10.1111/j.1365-3040.2001.00668.x, 2001.
Best, M. J., Pryor, M., Clark, D. B., Rooney, G. G., Essery, R. L. H., Ménard, C. B., Edwards, J. M., Hendry, M. A., Porson, A., Gedney, N., Mercado, L. M., Sitch, S., Blyth, E., Boucher, O., Cox, P. M., Grimmond, C. S. B., and Harding, R. J.: The Joint UK Land Environment Simulator (JULES), model description – Part 1: Energy and water fluxes, Geosci. Model Dev., 4, 677–699, https://doi.org/10.5194/gmd-4-677-2011, 2011.
Betts, R. A., Boucher, O., Collins, M., Cox, P. M., Falloon, P. D., Gedney, N., Hemming, D. L., Huntingford, C., Jones, C. D., Sexton, D. M. H., and Webb, M. J.: Projected increase in continental runoff due to plant responses to increasing carbon dioxide, Nature, 448, 1037–1041, https://doi.org/10.1038/nature06045, 2007.
Blyth, E., Clark, D. B., Ellis, R., Huntingford, C., Los, S., Pryor, M., Best, M., and Sitch, S.: A comprehensive set of benchmark tests for a land surface model of simultaneous fluxes of water and carbon at both the global and seasonal scale, Geosci. Model Dev., 4, 255–269, https://doi.org/10.5194/gmd-4-255-2011, 2011.
Booth, B. B. B., Jones, C. D., Collins, M., Totterdell, I. J., Cox, P. M., Sitch, S., Huntingford, C., Betts, R. A., Harris, G. R., and Lloyd, J.: High sensitivity of future global warming to land carbon cycle processes, Environ. Res. Lett., 7, 024002, https://doi.org/10.1088/1748-9326/7/2/024002, 2012.
Braghiere, R. K., Quaife, T., Black, E., He, L., and Chen, J.: Underestimation of global photosynthesis in Earth system models due to representation of vegetation structure, Global Biogeochem. Cy., 33, 1358–1369, 2019.
Braghiere, R. K., Quaife, T., Black, E., Ryu, Y., Chen, Q., De Kauwe, M. G., and Baldocchi, D.: Influence of sun zenith angle on canopy clumping and the resulting impacts on photosynthesis, Agr. Forest Meteorol., 291, 108065, https://doi.org/10.1016/j.agrformet.2020.108065, 2020.
Braghiere, R. K., Wang, Y., Doughty, R., Sousa, D., Magney, T., Widlowski, J.-L., Longo, M., Bloom, A. A., Worden, J., Gentine, P., and Frankenberg, C.: Accounting for canopy structure improves hyperspectral radiative transfer and sun-induced chlorophyll fluorescence representations in a new generation Earth System model, Remote Sens. Environ., 261, 112497, https://doi.org/10.1016/j.rse.2021.112497, 2021.
Carter, K. R., Wood, T. E., Reed, S. C., Schwartz, E. C., Reinsel, M. B., Yang, X., and Cavaleri, M. A.: Photosynthetic and Respiratory Acclimation of Understory Shrubs in Response to in situ Experimental Warming of a Wet Tropical Forest, Frontiers in Forests and Global Change, 3, 576320, https://doi.org/10.3389/ffgc.2020.576320, 2020.
Carter, K. R., Wood, T. E., Reed, S. C., Butts, K. M., and Cavaleri, M. A.: Experimental warming across a tropical forest canopy height gradient reveals minimal photosynthetic and respiratory acclimation, Plant Cell Environ., 44, 2879–2897, https://doi.org/10.1111/pce.14134, 2021.
Chen, M. I. N. and Zhuang, Q.: Modelling temperature acclimation effects on the carbon dynamics of forest ecosystems in the conterminous United States, Tellus B, 65, 19156, https://doi.org/10.3402/tellusb.v65i0.19156, 2013.
Clark, D. B.: JULES-VN5.6_acclimation, MetOffice [code], https://code.metoffice.gov.uk/trac/jules/browser/main/branches/dev/douglasclark/vn5.6_acclimation, last access: 14 July 2022.
Clark, D. B., Mercado, L. M., Sitch, S., Jones, C. D., Gedney, N., Best, M. J., Pryor, M., Rooney, G. G., Essery, R. L. H., Blyth, E., Boucher, O., Harding, R. J., Huntingford, C., and Cox, P. M.: The Joint UK Land Environment Simulator (JULES), model description – Part 2: Carbon fluxes and vegetation dynamics, Geosci. Model Dev., 4, 701–722, https://doi.org/10.5194/gmd-4-701-2011, 2011.
Collatz, G., Ribas-Carbo, M., and Berry, J.: Coupled Photosynthesis-Stomatal Conductance Model for Leaves of C4 Plants, Funct. Plant Biol., 19, 519–538, https://doi.org/10.1071/PP9920519, 1992.
Collatz, G. J., Ball, J. T., Grivet, C., and Berry, J. A.: Physiological and environmental regulation of stomatal conductance, photosynthesis and transpiration: a model that includes a laminar boundary layer, Agr. Forest Meteorol., 54, 107–136, https://doi.org/10.1016/0168-1923(91)90002-8, 1991.
Cox, P. M., Huntingford, C., and Harding, R. J.: A canopy conductance and photosynthesis model for use in a GCM land surface scheme, J. Hydrol., 212–213, 79–94, https://doi.org/10.1016/S0022-1694(98)00203-0, 1998.
Croft, H., Chen, J. M., Luo, X., Bartlett, P., Chen, B., and Staebler, R. M.: Leaf chlorophyll content as a proxy for leaf photosynthetic capacity, Glob. Change Biol., 23, 3513–3524, https://doi.org/10.1111/gcb.13599, 2017.
Cruz, F. T., Pitman, A. J., and Wang, Y. P.: Can the stomatal response to higher atmospheric carbon dioxide explain the unusual temperatures during the 2002 Murray-Darling Basin drought?, J. Geophys. Res.-Atmos., 115, D02101, https://doi.org/10.1029/2009JD012767, 2010.
Cunningham, S. C. and Read, J.: Do temperate rainforest trees have a greater ability to acclimate to changing temperatures than tropical rainforest trees?, New Phytol., 157, 55–64, https://doi.org/10.1046/j.1469-8137.2003.00652.x, 2003.
Damour, G., Simonneau, T., Cochard, H., and Urban, L.: An overview of models of stomatal conductance at the leaf level, Plant Cell Environ., 33, 1419–1438, https://doi.org/10.1111/j.1365-3040.2010.02181.x, 2010.
de Arellano, J. V.-G., van Heerwaarden, C. C., and Lelieveld, J.: Modelled suppression of boundary-layer clouds by plants in a CO2-rich atmosphere, Nat. Geosci., 5, 701–704, https://doi.org/10.1038/ngeo1554, 2012.
De Kauwe, M. G., Medlyn, B. E., Zaehle, S., Walker, A. P., Dietze, M. C., Hickler, T., Jain, A. K., Luo, Y., Parton, W. J., Prentice, I. C., Smith, B., Thornton, P. E., Wang, S., Wang, Y.-P., Wårlind, D., Weng, E., Crous, K. Y., Ellsworth, D. S., Hanson, P. J., Seok Kim, H.-S., Warren, J. M., Oren, R., and Norby, R. J.: Forest water use and water use efficiency at elevated CO2: a model-data intercomparison at two contrasting temperate forest FACE sites, Glob. Change Biol., 19, 1759–1779, https://doi.org/10.1111/gcb.12164, 2013.
De Kauwe, M. G., Kala, J., Lin, Y.-S., Pitman, A. J., Medlyn, B. E., Duursma, R. A., Abramowitz, G., Wang, Y.-P., and Miralles, D. G.: A test of an optimal stomatal conductance scheme within the CABLE land surface model, Geosci. Model Dev., 8, 431–452, https://doi.org/10.5194/gmd-8-431-2015, 2015.
Doughty, C. E. and Goulden, M. L.: Are tropical forests near a high temperature threshold?, J. Geophys. Res.-Biogeo., 113, G00B07, https://doi.org/10.1029/2007JG000632, 2008.
Drake, J. E., Aspinwall, M. J., Pfautsch, S., Rymer, P. D., Reich, P. B., Smith, R. A., Crous, K. Y., Tissue, D. T., Ghannoum, O., and Tjoelker, M. G.: The capacity to cope with climate warming declines from temperate to tropical latitudes in two widely distributed Eucalyptus species, Glob. Change Biol., 21, 459–472, https://doi.org/10.1111/gcb.12729, 2015.
Dusenge, M. E., Madhavji, S., and Way, D. A.: Contrasting acclimation responses to elevated CO2 and warming between an evergreen and a deciduous boreal conifer, Glob. Change Biol., 26, 3639–3657, https://doi.org/10.1111/gcb.15084, 2020.
Dusenge, M. E., Wittemann, M., Mujawamariya, M., Ntawuhiganayo, E. B., Zibera, E., Ntirugulirwa, B., Way, D. A., Nsabimana, D., Uddling, J., and Wallin, G.: Limited thermal acclimation of photosynthesis in tropical montane tree species, Glob. Change Biol., 27, 4860–4878, https://doi.org/10.1111/gcb.15790, 2021.
Eller, C. B., Rowland, L., Mencuccini, M., Rosas, T., Williams, K., Harper, A., Medlyn, B. E., Wagner, Y., Klein, T., Teodoro, G. S., Oliveira, R. S., Matos, I. S., Rosado, B. H. P., Fuchs, K., Wohlfahrt, G., Montagnani, L., Meir, P., Sitch, S., and Cox, P. M.: Stomatal optimization based on xylem hydraulics (SOX) improves land surface model simulation of vegetation responses to climate, New Phytol., 226, 1622–1637, https://doi.org/10.1111/nph.16419, 2020.
Erb, K.-H., Kastner, T., Plutzar, C., Bais, A. L. S., Carvalhais, N., Fetzel, T., Gingrich, S., Haberl, H., Lauk, C., Niedertscheider, M., Pongratz, J., Thurner, M., and Luyssaert, S.: Unexpectedly large impact of forest management and grazing on global vegetation biomass, Nature, 553, 73–76, https://doi.org/10.1038/nature25138, 2018.
Eyring, V., Bony, S., Meehl, G. A., Senior, C. A., Stevens, B., Stouffer, R. J., and Taylor, K. E.: Overview of the Coupled Model Intercomparison Project Phase 6 (CMIP6) experimental design and organization, Geosci. Model Dev., 9, 1937–1958, https://doi.org/10.5194/gmd-9-1937-2016, 2016.
Farquhar, G. D., von Caemmerer, S., and Berry, J. A.: A biochemical model of photosynthetic CO2 assimilation in leaves of C3 species, Planta, 149, 78–90, https://doi.org/10.1007/BF00386231, 1980.
Franks, P. J., Berry, J. A., Lombardozzi, D. L., and Bonan, G. B.: Stomatal Function across Temporal and Spatial Scales: Deep-Time Trends, Land-Atmosphere Coupling and Global Models, Plant Physiol., 174, 583–602, https://doi.org/10.1104/pp.17.00287, 2017.
Franks, P. J., Bonan, G. B., Berry, J. A., Lombardozzi, D. L., Holbrook, N. M., Herold, N., and Oleson, K. W.: Comparing optimal and empirical stomatal conductance models for application in Earth system models, Glob. Change Biol., 24, 5708–5723, https://doi.org/10.1111/gcb.14445, 2018.
Friedlingstein, P., Meinshausen, M., Arora, V. K., Jones, C. D., Anav, A., Liddicoat, S. K., and Knutti, R.: Uncertainties in CMIP5 Climate Projections due to Carbon Cycle Feedbacks, J. Climate, 27, 511–526, https://doi.org/10.1175/jcli-d-12-00579.1, 2014.
Friedlingstein, P., O'Sullivan, M., Jones, M. W., Andrew, R. M., Hauck, J., Olsen, A., Peters, G. P., Peters, W., Pongratz, J., Sitch, S., Le Quéré, C., Canadell, J. G., Ciais, P., Jackson, R. B., Alin, S., Aragão, L. E. O. C., Arneth, A., Arora, V., Bates, N. R., Becker, M., Benoit-Cattin, A., Bittig, H. C., Bopp, L., Bultan, S., Chandra, N., Chevallier, F., Chini, L. P., Evans, W., Florentie, L., Forster, P. M., Gasser, T., Gehlen, M., Gilfillan, D., Gkritzalis, T., Gregor, L., Gruber, N., Harris, I., Hartung, K., Haverd, V., Houghton, R. A., Ilyina, T., Jain, A. K., Joetzjer, E., Kadono, K., Kato, E., Kitidis, V., Korsbakken, J. I., Landschützer, P., Lefèvre, N., Lenton, A., Lienert, S., Liu, Z., Lombardozzi, D., Marland, G., Metzl, N., Munro, D. R., Nabel, J. E. M. S., Nakaoka, S.-I., Niwa, Y., O'Brien, K., Ono, T., Palmer, P. I., Pierrot, D., Poulter, B., Resplandy, L., Robertson, E., Rödenbeck, C., Schwinger, J., Séférian, R., Skjelvan, I., Smith, A. J. P., Sutton, A. J., Tanhua, T., Tans, P. P., Tian, H., Tilbrook, B., van der Werf, G., Vuichard, N., Walker, A. P., Wanninkhof, R., Watson, A. J., Willis, D., Wiltshire, A. J., Yuan, W., Yue, X., and Zaehle, S.: Global Carbon Budget 2020, Earth Syst. Sci. Data, 12, 3269–3340, https://doi.org/10.5194/essd-12-3269-2020, 2020.
Gedney, N., Cox, P. M., Betts, R. A., Boucher, O., Huntingford, C., and Stott, P. A.: Detection of a direct carbon dioxide effect in continental river runoff records, Nature, 439, 835–838, https://doi.org/10.1038/nature04504, 2006.
Guha, A., Han, J., Cummings, C., McLennan, D. A., and Warren, J. M.: Differential ecophysiological responses and resilience to heat wave events in four co-occurring temperate tree species, Environ. Res. Lett., 13, 065008, https://doi.org/10.1088/1748-9326/aabcd8, 2018.
Gunderson, C. A., Norby, R. J., and Wullschleger, S. D.: Acclimation of photosynthesis and respiration to simulated climatic warming in northern and southern populations of Acer saccharum: laboratory and field evidence, Tree Physiol., 20, 87–96, https://doi.org/10.1093/treephys/20.2.87, 2000.
Gunderson, C. A., O'Hara, K. H., Campion, C. M., Walker, A. V., and Edwards, N. T.: Thermal plasticity of photosynthesis: the role of acclimation in forest responses to a warming climate, Glob. Change Biol., 16, 2272–2286, https://doi.org/10.1111/j.1365-2486.2009.02090.x, 2010.
Haarsma, R. J., Roberts, M. J., Vidale, P. L., Senior, C. A., Bellucci, A., Bao, Q., Chang, P., Corti, S., Fučkar, N. S., Guemas, V., von Hardenberg, J., Hazeleger, W., Kodama, C., Koenigk, T., Leung, L. R., Lu, J., Luo, J.-J., Mao, J., Mizielinski, M. S., Mizuta, R., Nobre, P., Satoh, M., Scoccimarro, E., Semmler, T., Small, J., and von Storch, J.-S.: High Resolution Model Intercomparison Project (HighResMIP v1.0) for CMIP6, Geosci. Model Dev., 9, 4185–4208, https://doi.org/10.5194/gmd-9-4185-2016, 2016.
Harper, A. B., Cox, P. M., Friedlingstein, P., Wiltshire, A. J., Jones, C. D., Sitch, S., Mercado, L. M., Groenendijk, M., Robertson, E., Kattge, J., Bönisch, G., Atkin, O. K., Bahn, M., Cornelissen, J., Niinemets, Ü., Onipchenko, V., Peñuelas, J., Poorter, L., Reich, P. B., Soudzilovskaia, N. A., and Bodegom, P. V.: Improved representation of plant functional types and physiology in the Joint UK Land Environment Simulator (JULES v4.2) using plant trait information, Geosci. Model Dev., 9, 2415–2440, https://doi.org/10.5194/gmd-9-2415-2016, 2016.
Harper, A. B., Williams, K. E., McGuire, P. C., Duran Rojas, M. C., Hemming, D., Verhoef, A., Huntingford, C., Rowland, L., Marthews, T., Breder Eller, C., Mathison, C., Nobrega, R. L. B., Gedney, N., Vidale, P. L., Otu-Larbi, F., Pandey, D., Garrigues, S., Wright, A., Slevin, D., De Kauwe, M. G., Blyth, E., Ardö, J., Black, A., Bonal, D., Buchmann, N., Burban, B., Fuchs, K., de Grandcourt, A., Mammarella, I., Merbold, L., Montagnani, L., Nouvellon, Y., Restrepo-Coupe, N., and Wohlfahrt, G.: Improvement of modeling plant responses to low soil moisture in JULESvn4.9 and evaluation against flux tower measurements, Geosci. Model Dev., 14, 3269–3294, https://doi.org/10.5194/gmd-14-3269-2021, 2021.
Harper, A., Williams, K., McGuire, P. C., Duran Rojas, C., and Otu-Larbi, F.: Rose suite u-al752, MetOffice [code], https://code.metoffice.gov.uk/trac/roses-u/browser/a/l/7/5/2/trunk, last access: 14 July 2022.
Hengl, T., de Jesus, J. M., MacMillan, R. A., Batjes, N. H., Heuvelink, G. B. M., Ribeiro, E., Samuel-Rosa, A., Kempen, B., Leenaars, J. G. B., Walsh, M. G., and Gonzalez, M. R.: SoilGrids1km – Global Soil Information Based on Automated Mapping, PLOS ONE, 9, e105992, https://doi.org/10.1371/journal.pone.0105992, 2014.
Hernández, G. G., Winter, K., and Slot, M.: Similar temperature dependence of photosynthetic parameters in sun and shade leaves of three tropical tree species, Tree Physiol., 40, 637–651, https://doi.org/10.1093/treephys/tpaa015, 2020.
Hikosaka, K., Nabeshima, E., and Hiura, T.: Seasonal changes in the temperature response of photosynthesis in canopy leaves of Quercus crispula in a cool-temperate forest, Tree Physiol., 27, 1035–1041, https://doi.org/10.1093/treephys/27.7.1035, 2007.
Hogan, R. J., Quaife, T., and Braghiere, R.: Fast matrix treatment of 3-D radiative transfer in vegetation canopies: SPARTACUS-Vegetation 1.1, Geosci. Model Dev., 11, 339–350, https://doi.org/10.5194/gmd-11-339-2018, 2018.
Huntingford, C. and Oliver, R. J.: Converging towards a common representation of large-scale photosynthesis, Glob. Change Biol., 27, 716–718, https://doi.org/10.1111/gcb.15398, 2021.
Huntingford, C., Lowe, J. A., Booth, B. B. B., Jones, C. D., Harris, G. R., Gohar, L. K., and Meir, P.: Contributions of carbon cycle uncertainty to future climate projection spread, Tellus B, 61, 355–360, https://doi.org/10.1111/j.1600-0889.2009.00414.x, 2009.
Jacobs, C.: Direct impact of atmospheric CO2 enrichment on regional transpiration, PhD thesis, Wageningen Agricultural University, 1994.
Jarvis, P. G., Monteith, J. L., and Weatherley, P. E.: The interpretation of the variations in leaf water potential and stomatal conductance found in canopies in the field, Philos. T. Roy. Soc. B, 273, 593–610, https://doi.org/10.1098/rstb.1976.0035, 1976.
Jasechko, S., Sharp, Z. D., Gibson, J. J., Birks, S. J., Yi, Y., and Fawcett, P. J.: Terrestrial water fluxes dominated by transpiration, Nature, 496, 347–350, https://doi.org/10.1038/nature11983, 2013.
Jogireddy, V. R., Cox, P. M., Huntingford, C., Harding, R. J., and Mercado, L. M.: An improved description of canopy light interception for use in a GCM land-surface scheme: calibration and testing against carbon fluxes at a coniferous forest, Hadley Centre Technical Note 63, Hadley Centre, Met Office, Exeter, UK, 2006.
Joseph, T., Whitehead, D., and Turnbull, M. H.: Soil water availability influences the temperature response of photosynthesis and respiration in a grass and a woody shrub, Funct. Plant Biol., 41, 468–481, https://doi.org/10.1071/FP13237, 2014.
Jung, M., Koirala, S., Weber, U., Ichii, K., Gans, F., Camps-Valls, G., Papale, D., Schwalm, C., Tramontana, G., and Reichstein, M.: The FLUXCOM ensemble of global land-atmosphere energy fluxes, Sci. Data, 6, 74, https://doi.org/10.1038/s41597-019-0076-8, 2019.
Jung, M., Schwalm, C., Migliavacca, M., Walther, S., Camps-Valls, G., Koirala, S., Anthoni, P., Besnard, S., Bodesheim, P., Carvalhais, N., Chevallier, F., Gans, F., Goll, D. S., Haverd, V., Köhler, P., Ichii, K., Jain, A. K., Liu, J., Lombardozzi, D., Nabel, J. E. M. S., Nelson, J. A., O'Sullivan, M., Pallandt, M., Papale, D., Peters, W., Pongratz, J., Rödenbeck, C., Sitch, S., Tramontana, G., Walker, A., Weber, U., and Reichstein, M.: Scaling carbon fluxes from eddy covariance sites to globe: synthesis and evaluation of the FLUXCOM approach, Biogeosciences, 17, 1343–1365, https://doi.org/10.5194/bg-17-1343-2020, 2020.
Kala, J., De Kauwe, M. G., Pitman, A. J., Lorenz, R., Medlyn, B. E., Wang, Y.-P., Lin, Y.-S., and Abramowitz, G.: Implementation of an optimal stomatal conductance scheme in the Australian Community Climate Earth Systems Simulator (ACCESS1.3b), Geosci. Model Dev., 8, 3877–3889, https://doi.org/10.5194/gmd-8-3877-2015, 2015.
Kala, J., De Kauwe, M. G., Pitman, A. J., Medlyn, B. E., Wang, Y.-P., Lorenz, R., and Perkins-Kirkpatrick, S. E.: Impact of the representation of stomatal conductance on model projections of heatwave intensity, Sci. Rep.-UK, 6, 23418, https://doi.org/10.1038/srep23418, 2016.
Kattge, J. and Knorr, W.: Temperature acclimation in a biochemical model of photosynthesis: a reanalysis of data from 36 species, Plant Cell Environ., 30, 1176–1190, https://doi.org/10.1111/j.1365-3040.2007.01690.x, 2007.
Keenan, T. F., Luo, X., De Kauwe, M. G., Medlyn, B. E., Prentice, I. C., Stocker, B. D., Smith, N. G., Terrer, C., Wang, H., Zhang, Y., and Zhou, S.: A constraint on historic growth in global photosynthesis due to increasing CO2, Nature, 600, 253–258, https://doi.org/10.1038/s41586-021-04096-9, 2021.
Kobayashi, H., Baldocchi, D. D., Ryu, Y., Chen, Q., Ma, S., Osuna, J. L., and Ustin, S. L.: Modeling energy and carbon fluxes in a heterogeneous oak woodland: A three-dimensional approach, Agr. Forest Meteorol., 152, 83–100, 2012.
Kooperman, G. J., Chen, Y., Hoffman, F. M., Koven, C. D., Lindsay, K., Pritchard, M. S., Swann, A. L. S., and Randerson, J. T.: Forest response to rising CO2 drives zonally asymmetric rainfall change over tropical land, Nat. Clim. Change, 8, 434–440, https://doi.org/10.1038/s41558-018-0144-7, 2018.
Krinner, G., Viovy, N., de Noblet-Ducoudré, N., Ogée, J., Polcher, J., Friedlingstein, P., Ciais, P., Sitch, S., and Prentice, I. C.: A dynamic global vegetation model for studies of the coupled atmosphere-biosphere system, Global Biogeochem. Cy., 19, GB1015, https://doi.org/10.1029/2003GB002199, 2005.
Kroner, Y. and Way, D. A.: Carbon fluxes acclimate more strongly to elevated growth temperatures than to elevated CO2 concentrations in a northern conifer, Glob. Change Biol., 22, 2913–2928, https://doi.org/10.1111/gcb.13215, 2016.
Kumarathunge, D. P., Medlyn, B. E., Drake, J. E., Rogers, A., and Tjoelker, M. G.: No evidence for triose phosphate limitation of light-saturated leaf photosynthesis under current atmospheric CO2 concentration, Plant Cell Environ., 42, 3241–3252, https://doi.org/10.1111/pce.13639, 2019a.
Kumarathunge, D. P., Medlyn, B. E., Drake, J. E., Tjoelker, M. G., Aspinwall, M. J., Battaglia, M., Cano, F. J., Carter, K. R., Cavaleri, M. A., Cernusak, L. A., Chambers, J. Q., Crous, K. Y., De Kauwe, M. G., Dillaway, D. N., Dreyer, E., Ellsworth, D. S., Ghannoum, O., Han, Q., Hikosaka, K., Jensen, A. M., Kelly, J. W. G., Kruger, E. L., Mercado, L. M., Onoda, Y., Reich, P. B., Rogers, A., Slot, M., Smith, N. G., Tarvainen, L., Tissue, D. T., Togashi, H. F., Tribuzy, E. S., Uddling, J., Vårhammar, A., Wallin, G., Warren, J. M., and Way, D. A.: Acclimation and adaptation components of the temperature dependence of plant photosynthesis at the global scale, New Phytol., 222, 768–784, https://doi.org/10.1111/nph.15668, 2019b.
Kurepin, L. V., Stangl, Z. R., Ivanov, A. G., Bui, V., Mema, M., Hüner, N. P. A., Öquist, G., Way, D., and Hurry, V.: Contrasting acclimation abilities of two dominant boreal conifers to elevated CO2 and temperature, Plant Cell Environ., 41, 1331–1345, https://doi.org/10.1111/pce.13158, 2018.
Leuning, R.: A critical appraisal of a combined stomatal-photosynthesis model for C3 plants, Plant Cell Environ., 18, 339–355, https://doi.org/10.1111/j.1365-3040.1995.tb00370.x, 1995.
Lin, Y.-S., Medlyn, B. E., Duursma, R. A., Prentice, I. C., Wang, H., Baig, S., Eamus, D., de Dios, V. R., Mitchell, P., Ellsworth, D. S., de Beeck, M. O., Wallin, G., Uddling, J., Tarvainen, L., Linderson, M.-L., Cernusak, L. A., Nippert, J. B., Ocheltree, T. W., Tissue, D. T., Martin-StPaul, N. K., Rogers, A., Warren, J. M., De Angelis, P., Hikosaka, K., Han, Q., Onoda, Y., Gimeno, T. E., Barton, C. V. M., Bennie, J., Bonal, D., Bosc, A., Löw, M., Macinins-Ng, C., Rey, A., Rowland, L., Setterfield, S. A., Tausz-Posch, S., Zaragoza-Castells, J., Broadmeadow, M. S. J., Drake, J. E., Freeman, M., Ghannoum, O., Hutley, L. B., Kelly, J. W., Kikuzawa, K., Kolari, P., Koyama, K., Limousin, J.-M., Meir, P., Lola da Costa, A. C., Mikkelsen, T. N., Salinas, N., Sun, W., and Wingate, L.: Optimal stomatal behaviour around the world, Nat. Clim. Change, 5, 459–464, https://doi.org/10.1038/nclimate2550, 2015.
Liu, H., Randerson, J. T., Lindfors, J., Massman, W. J., and Foken, T.: Consequences of Incomplete Surface Energy Balance Closure for CO2 Fluxes from Open-Path CO2/H2O Infrared Gas Analysers, Bound.-Lay. Meteorol., 120, 65–85, https://doi.org/10.1007/s10546-005-9047-z, 2006.
Loew, A., van Bodegom, P. M., Widlowski, J.-L., Otto, J., Quaife, T., Pinty, B., and Raddatz, T.: Do we (need to) care about canopy radiation schemes in DGVMs? Caveats and potential impacts, Biogeosciences, 11, 1873–1897, https://doi.org/10.5194/bg-11-1873-2014, 2014.
Lombardozzi, D. L., Bonan, G. B., Smith, N. G., Dukes, J. S., and Fisher, R. A.: Temperature acclimation of photosynthesis and respiration: A key uncertainty in the carbon cycle-climate feedback, Geophys. Res. Lett., 42, 8624–8631, https://doi.org/10.1002/2015GL065934, 2015.
Mau, A. C., Reed, S. C., Wood, T. E., and Cavaleri, M. A.: Temperate and Tropical Forest Canopies are Already Functioning beyond Their Thermal Thresholds for Photosynthesis, Forests, 9, 47, https://doi.org/10.3390/f9010047, 2018.
McGuire, P. C., Vidale, P. L., Oliver, R. J., Lister, G. M. S., Martinez de la Torre, A., Müller, O. V., and Todt, M.: Rose suite u-bq898, MetOffice [code], https://code.metoffice.gov.uk/trac/roses-u/browser/b/q/8/9/8/trunk, last access: 14 July 2022.
Medlyn, B. E., Loustau, D., and Delzon, S.: Temperature response of parameters of a biochemically based model of photosynthesis. I. Seasonal changes in mature maritime pine (Pinus pinaster Ait.), Plant Cell Environ., 25, 1155–1165, https://doi.org/10.1046/j.1365-3040.2002.00890.x, 2002.
Medlyn, B. E., Duursma, R. A., Eamus, D., Ellsworth, D. S., Prentice, I. C., Barton, C. V. M., Crous, K. Y., de Angelis, P., Freeman, M., and Wingate, L.: Reconciling the optimal and empirical approaches to modelling stomatal conductance, Glob. Change Biol., 17, 2134–2144, https://doi.org/10.1111/j.1365-2486.2010.02375.x, 2011.
Meir, P., Kruijt, B., Broadmeadow, M., Barbosa, E., Kull, O., Carswell, F., Nobre, A., and Jarvis, P. G.: Acclimation of photosynthetic capacity to irradiance in tree canopies in relation to leaf nitrogen concentration and leaf mass per unit area, Plant Cell Environ., 25, 343–357, https://doi.org/10.1046/j.0016-8025.2001.00811.x, 2002.
Mercado, L. M., Huntingford, C., Gash, J. H. C., Cox, P. M., and Jogireddy, V. R.: Improving the representation of radiation interception and photosynthesis for climate model applications, Tellus B, 59, 553–565, https://doi.org/10.1111/j.1600-0889.2007.00256.x, 2007.
Mercado, L. M., Bellouin, N., Sitch, S., Boucher, O., Huntingford, C., Wild, M., and Cox, P. M.: Impact of changes in diffuse radiation on the global land carbon sink, Nature, 458, 1014–1017, https://doi.org/10.1038/nature07949, 2009.
Mercado, L. M., Medlyn, B. E., Huntingford, C., Oliver, R. J., Clark, D. B., Sitch, S., Zelazowski, P., Kattge, J., Harper, A. B., and Cox, P. M.: Large sensitivity in land carbon storage due to geographical and temporal variation in the thermal response of photosynthetic capacity, New Phytol., 218, 1462–1477, https://doi.org/10.1111/nph.15100, 2018.
Miller, B. D., Carter, K. R., Reed, S. C., Wood, T. E., and Cavaleri, M. A.: Only sun-lit leaves of the uppermost canopy exceed both air temperature and photosynthetic thermal optima in a wet tropical forest, Agr. Forest Meteorol., 301–302, 108347, https://doi.org/10.1016/j.agrformet.2021.108347, 2021.
Oliver, R. J.: Rose suite u-br064, MetOffice [code], https://code.metoffice.gov.uk/trac/roses-u/browser/b/r/0/6/4/trunk, last access: 14 July 2022.
Oliver, R. J., Mercado, L. M., Sitch, S., Simpson, D., Medlyn, B. E., Lin, Y.-S., and Folberth, G. A.: Large but decreasing effect of ozone on the European carbon sink, Biogeosciences, 15, 4245–4269, https://doi.org/10.5194/bg-15-4245-2018, 2018.
Oliver, R., Mercado, L., Clark, D., Huntingford, C., Taylor, C., Vidale, P. L., McGuire, P., Todt, M., Folwell, S., Shamsudheen, S., and Medlyn, B.: Improved representation of plant physiology in the JULES-vn5.6 land surface model: Photosynthesis, stomatal conductance and thermal acclimation, Zenodo [data set], https://doi.org/10.5281/zenodo.5825540, 2022.
Pan, Y., Birdsey, R. A., Fang, J., Houghton, R., Kauppi, P. E., Kurz, W. A., Phillips, O. L., Shvidenko, A., Lewis, S. L., Canadell, J. G., Ciais, P., Jackson, R. B., Pacala, S. W., McGuire, A. D., Piao, S., Rautiainen, A., Sitch, S., and Hayes, D.: A Large and Persistent Carbon Sink in the World's Forests, Science, 333, 988–993, https://doi.org/10.1126/science.1201609, 2011.
Pau, S., Detto, M., Kim, Y., and Still, C. J.: Tropical forest temperature thresholds for gross primary productivity, Ecosphere, 9, e02311, https://doi.org/10.1002/ecs2.2311, 2018.
Poulter, B., MacBean, N., Hartley, A., Khlystova, I., Arino, O., Betts, R., Bontemps, S., Boettcher, M., Brockmann, C., Defourny, P., Hagemann, S., Herold, M., Kirches, G., Lamarche, C., Lederer, D., Ottlé, C., Peters, M., and Peylin, P.: Plant functional type classification for earth system models: results from the European Space Agency's Land Cover Climate Change Initiative, Geosci. Model Dev., 8, 2315–2328, https://doi.org/10.5194/gmd-8-2315-2015, 2015.
Reich, P. B., Sendall, K. M., Stefanski, A., Rich, R. L., Hobbie, S. E., and Montgomery, R. A.: Effects of climate warming on photosynthesis in boreal tree species depend on soil moisture, Nature, 562, 263–267, https://doi.org/10.1038/s41586-018-0582-4, 2018.
Roberts, M. J., Baker, A., Blockley, E. W., Calvert, D., Coward, A., Hewitt, H. T., Jackson, L. C., Kuhlbrodt, T., Mathiot, P., Roberts, C. D., Schiemann, R., Seddon, J., Vannière, B., and Vidale, P. L.: Description of the resolution hierarchy of the global coupled HadGEM3-GC3.1 model as used in CMIP6 HighResMIP experiments, Geosci. Model Dev., 12, 4999–5028, https://doi.org/10.5194/gmd-12-4999-2019, 2019.
Rogers, A., Medlyn, B. E., Dukes, J. S., Bonan, G., von Caemmerer, S., Dietze, M. C., Kattge, J., Leakey, A. D. B., Mercado, L. M., Niinemets, Ü., Prentice, I. C., Serbin, S. P., Sitch, S., Way, D. A., and Zaehle, S.: A roadmap for improving the representation of photosynthesis in Earth system models, New Phytol., 213, 22–42, https://doi.org/10.1111/nph.14283, 2017.
Rogers, A., Kumarathunge, D. P., Lombardozzi, D. L., Medlyn, B. E., Serbin, S. P., and Walker, A. P.: Triose phosphate utilization limitation: an unnecessary complexity in terrestrial biosphere model representation of photosynthesis, New Phytol., 230, 17–22, https://doi.org/10.1111/nph.17092, 2021.
Schlesinger, W. H. and Jasechko, S.: Transpiration in the global water cycle, Agr. Forest Meteorol., 189–190, 115–117, https://doi.org/10.1016/j.agrformet.2014.01.011, 2014.
Sellar, A. A., Jones, C. G., Mulcahy, J. P., Tang, Y., Yool, A., Wiltshire, A., O'Connor, F. M., Stringer, M., Hill, R., Palmieri, J., Woodward, S., de Mora, L., Kuhlbrodt, T., Rumbold, S. T., Kelley, D. I., Ellis, R., Johnson, C. E., Walton, J., Abraham, N. L., Andrews, M. B., Andrews, T., Archibald, A. T., Berthou, S., Burke, E., Blockley, E., Carslaw, K., Dalvi, M., Edwards, J., Folberth, G. A., Gedney, N., Griffiths, P. T., Harper, A. B., Hendry, M. A., Hewitt, A. J., Johnson, B., Jones, A., Jones, C. D., Keeble, J., Liddicoat, S., Morgenstern, O., Parker, R. J., Predoi, V., Robertson, E., Siahaan, A., Smith, R. S., Swaminathan, R., Woodhouse, M. T., Zeng, G., and Zerroukat, M.: UKESM1: Description and Evaluation of the U.K. Earth System Model, J. Adv. Model. Earth Sy., 11, 4513–4558, https://doi.org/10.1029/2019MS001739, 2019.
Sendall, K. M., Reich, P. B., Zhao, C., Jihua, H., Wei, X., Stefanski, A., Rice, K., Rich, R. L., and Montgomery, R. A.: Acclimation of photosynthetic temperature optima of temperate and boreal tree species in response to experimental forest warming, Glob. Change Biol., 21, 1342–1357, https://doi.org/10.1111/gcb.12781, 2015.
Shabanov, N., Huang, D., Yang, W., Tan, B., Knyazikhin, Y., Myneni, R., Ahl, D., Gower, S., Huete, A., Aragao, L., and Shimabukuro, Y.: Analysis and Optimization of the MODIS Leaf Area Index Algorithm Retrievals Over Broadleaf Forests, IEEE T. Geosci. Remote, 43, 1855–1865, https://doi.org/10.1109/TGRS.2005.852477, 2005.
Slot, M. and Winter, K.: Photosynthetic acclimation to warming in tropical forest tree seedlings, J. Exp. Bot., 68, 2275–2284, https://doi.org/10.1093/jxb/erx071, 2017.
Slot, M., Rifai, S. W., and Winter, K.: Photosynthetic plasticity of a tropical tree species, Tabebuia rosea, in response to elevated temperature and CO2, Plant Cell Environ., 44, 2347–2364, https://doi.org/10.1111/pce.14049, 2021.
Smith, N. G. and Dukes, J. S.: Plant respiration and photosynthesis in global-scale models: incorporating acclimation to temperature and CO2, Glob. Change Biol., 19, 45–63, https://doi.org/10.1111/j.1365-2486.2012.02797.x, 2013.
Smith, N. G., Malyshev, S. L., Shevliakova, E., Kattge, J., and Dukes, J. S.: Foliar temperature acclimation reduces simulated carbon sensitivity to climate, Nat. Clim. Change, 6, 407–411, https://doi.org/10.1038/nclimate2878, 2016.
Spafford, L. and MacDougall, A. H.: Validation of terrestrial biogeochemistry in CMIP6 Earth system models: a review, Geosci. Model Dev., 14, 5863–5889, https://doi.org/10.5194/gmd-14-5863-2021, 2021.
Sullivan, M. J. P., Lewis, S. L., Affum-Baffoe, K., Castilho, C., Costa, F., Sanchez, A. C., Ewango, C. E. N., Hubau, W., Marimon, B., Monteagudo-Mendoza, A., Qie, L., Sonké, B., Martinez, R. V., Baker, T. R., Brienen, R. J. W., Feldpausch, T. R., Galbraith, D., Gloor, M., Malhi, Y., Aiba, S.-I., Alexiades, M. N., Almeida, E. C., de Oliveira, E. A., Dávila, E. Á., Loayza, P. A., Andrade, A., Vieira, S. A., Aragão, L. E. O. C., Araujo-Murakami, A., Arets, E. J. M. M., Arroyo, L., Ashton, P., Aymard C., G., Baccaro, F. B., Banin, L. F., Baraloto, C., Camargo, P. B., Barlow, J., Barroso, J., Bastin, J.-F., Batterman, S. A., Beeckman, H., Begne, S. K., Bennett, A. C., Berenguer, E., Berry, N., Blanc, L., Boeckx, P., Bogaert, J., Bonal, D., Bongers, F., Bradford, M., Brearley, F. Q., Brncic, T., Brown, F., Burban, B., Camargo, J. L., Castro, W., Céron, C., Ribeiro, S. C., Moscoso, V. C., Chave, J., Chezeaux, E., Clark, C. J., de Souza, F. C., Collins, M., Comiskey, J. A., Valverde, F. C., Medina, M. C., da Costa, L., Danèák, M., Dargie, G. C., Davies, S., Cardozo, N. D., de Haulleville, T., de Medeiros, M. B., del Aguila Pasquel, J., Derroire, G., Di Fiore, A., Doucet, J.-L., Dourdain, A., Droissart, V., Duque, L. F., Ekoungoulou, R., Elias, F., Erwin, T., Esquivel-Muelbert, A., Fauset, S., Ferreira, J., Llampazo, G. F., Foli, E., Ford, A., Gilpin, M., Hall, J. S., Hamer, K. C., Hamilton, A. C., Harris, D. J., Hart, T. B., Hédl, R., Herault, B., Herrera, R., Higuchi, N., Hladik, A., Coronado, E. H., Huamantupa-Chuquimaco, I., Huasco, W. H., Jeffery, K. J., Jimenez-Rojas, E., Kalamandeen, M., Djuikouo, M. N. K., Kearsley, E., Umetsu, R. K., Kho, L. K., Killeen, T., Kitayama, K., Klitgaard, B., Koch, A., Labrière, N., Laurance, W., Laurance, S., Leal, M. E., Levesley, A., Lima, A. J. N., Lisingo, J., Lopes, A. P., Lopez-Gonzalez, G., Lovejoy, T., Lovett, J. C., Lowe, R., Magnusson, W. E., Malumbres-Olarte, J., Manzatto, Â. G., Marimon, B. H., Marshall, A. R., Marthews, T., de Almeida Reis, S. M., Maycock, C., Melgaço, K., Mendoza, C., Metali, F., Mihindou, V., Milliken, W., Mitchard, E. T. A., Morandi, P. S., Mossman, H. L., Nagy, L., Nascimento, H., Neill, D., Nilus, R., Vargas, P. N., Palacios, W., Camacho, N. P., Peacock, J., Pendry, C., Peñuela Mora, M. C., Pickavance, G. C., Pipoly, J., Pitman, N., Playfair, M., Poorter, L., Poulsen, J. R., Poulsen, A. D., Preziosi, R., Prieto, A., Primack, R. B., Ramírez-Angulo, H., Reitsma, J., Réjou-Méchain, M., Correa, Z. R., de Sousa, T. R., Bayona, L. R., Roopsind, A., Rudas, A., Rutishauser, E., Abu Salim, K., Salomão, R. P., Schietti, J., Sheil, D., Silva, R. C., Espejo, J. S., Valeria, C. S., Silveira, M., Simo-Droissart, M., Simon, M. F., Singh, J., Soto Shareva, Y. C., Stahl, C., Stropp, J., Sukri, R., Sunderland, T., Svátek, M., Swaine, M. D., Swamy, V., Taedoumg, H., Talbot, J., Taplin, J., Taylor, D., ter Steege, H., Terborgh, J., Thomas, R., Thomas, S. C., Torres-Lezama, A., Umunay, P., Gamarra, L. V., van der Heijden, G., van der Hout, P., van der Meer, P., van Nieuwstadt, M., Verbeeck, H., Vernimmen, R., Vicentini, A., Vieira, I. C. G., Torre, E. V., Vleminckx, J., Vos, V., Wang, O., White, L. J. T., Willcock, S., Woods, J. T., Wortel, V., Young, K., Zagt, R., Zemagho, L., Zuidema, P. A., Zwerts, J. A., and Phillips, O. L.: Long-term thermal sensitivity of Earth's tropical forests, Science, 368, 869–874, https://doi.org/10.1126/science.aaw7578, 2020.
Tans, P. and Keeling, R.: NOAA/ESRL, https://www.esrl.noaa.gov/gmd/ccgg/trends/ (last access: December 2021), 2014.
Tramontana, G., Jung, M., Schwalm, C. R., Ichii, K., Camps-Valls, G., Ráduly, B., Reichstein, M., Arain, M. A., Cescatti, A., Kiely, G., Merbold, L., Serrano-Ortiz, P., Sickert, S., Wolf, S., and Papale, D.: Predicting carbon dioxide and energy fluxes across global FLUXNET sites with regression algorithms, Biogeosciences, 13, 4291–4313, https://doi.org/10.5194/bg-13-4291-2016, 2016.
Vårhammar, A., Wallin, G., McLean, C. M., Dusenge, M. E., Medlyn, B. E., Hasper, T. B., Nsabimana, D., and Uddling, J.: Photosynthetic temperature responses of tree species in Rwanda: evidence of pronounced negative effects of high temperature in montane rainforest climax species, New Phytol., 206, 1000–1012, https://doi.org/10.1111/nph.13291, 2015.
Verhoef, A. and Egea, G.: Modeling plant transpiration under limited soil water: Comparison of different plant and soil hydraulic parameterizations and preliminary implications for their use in land surface models, Agr. Forest Meteorol., 191, 22–32, https://doi.org/10.1016/j.agrformet.2014.02.009, 2014.
Vidale, P. L., Egea, G., McGuire, P. C., Todt, M., Peters, W., Müller, O., Balan-Sarojini, B., and Verhoef, A.: On the Treatment of Soil Water Stress in GCM Simulations of Vegetation Physiology, Front. Environ. Sci., 9, 689301, https://doi.org/10.3389/fenvs.2021.689301, 2021.
Walker, A. P., Beckerman, A. P., Gu, L., Kattge, J., Cernusak, L. A., Domingues, T. F., Scales, J. C., Wohlfahrt, G., Wullschleger, S. D., and Woodward, F. I.: The relationship of leaf photosynthetic traits – Vcmax and Jmax – to leaf nitrogen, leaf phosphorus, and specific leaf area: a meta-analysis and modeling study, Ecol. Evol., 4, 3218–3235, https://doi.org/10.1002/ece3.1173, 2014.
Walker, A. P., Johnson, A. L., Rogers, A., Anderson, J., Bridges, R. A., Fisher, R. A., Lu, D., Ricciuto, D. M., Serbin, S. P., and Ye, M.: Multi-hypothesis comparison of Farquhar and Collatz photosynthesis models reveals the unexpected influence of empirical assumptions at leaf and global scales, Glob. Change Biol., 27, 804–822, https://doi.org/10.1111/gcb.15366, 2021.
Way, D. A. and Sage, R. F.: Elevated growth temperatures reduce the carbon gain of black spruce [Picea mariana (Mill.) B.S.P.], Glob. Change Biol., 14, 624–636, https://doi.org/10.1111/j.1365-2486.2007.01513.x, 2008.
Way, D. A. and Yamori, W.: Thermal acclimation of photosynthesis: on the importance of adjusting our definitions and accounting for thermal acclimation of respiration, Photosynth. Res., 119, 89–100, https://doi.org/10.1007/s11120-013-9873-7, 2014.
Way, D. A., Stinziano, J. R., Berghoff, H., and Oren, R.: How well do growing season dynamics of photosynthetic capacity correlate with leaf biochemistry and climate fluctuations?, Tree Physiol., 37, 879–888, https://doi.org/10.1093/treephys/tpx086, 2017.
Weedon, G. P., Balsamo, G., Bellouin, N., Gomes, S., Best, M. J., and Viterbo, P.: The WFDEI meteorological forcing data set: WATCH Forcing Data methodology applied to ERA-Interim reanalysis data, Water Resour. Res., 50, 7505–7514, https://doi.org/10.1002/2014WR015638, 2014.
Williams, K. D., Copsey, D., Blockley, E. W., Bodas-Salcedo, A., Calvert, D., Comer, R., Davis, P., Graham, T., Hewitt, H. T., Hill, R., Hyder, P., Ineson, S., Johns, T. C., Keen, A. B., Lee, R. W., Megann, A., Milton, S. F., Rae, J. G. L., Roberts, M. J., Scaife, A. A., Schiemann, R., Storkey, D., Thorpe, L., Watterson, I. G., Walters, D. N., West, A., Wood, R. A., Woollings, T., and Xavier, P. K.: The Met Office Global Coupled Model 3.0 and 3.1 (GC3.0 and GC3.1) Configurations, J. Adv. Model. Earth Sy., 10, 357–380, https://doi.org/10.1002/2017MS001115, 2018.
Wilson, K. B., Baldocchi, D. D., and Hanson, P. J.: Leaf age affects the seasonal pattern of photosynthetic capacityand net ecosystem exchange of carbon in a deciduous forest, Plant Cell Environ., 24, 571–583, 2001.
Wiltshire, A. J., Duran Rojas, M. C., Edwards, J. M., Gedney, N., Harper, A. B., Hartley, A. J., Hendry, M. A., Robertson, E., and Smout-Day, K.: JULES-GL7: the Global Land configuration of the Joint UK Land Environment Simulator version 7.0 and 7.2, Geosci. Model Dev., 13, 483–505, https://doi.org/10.5194/gmd-13-483-2020, 2020.
Wohlfahrt, G., Bahn, M., Haubner, E., Horak, I., Michaeler, W., Rottmar, K., Tappeiner, U., and Cernusca, A.: Inter-specific variation of the biochemical limitation to photosynthesis and related leaf traits of 30 species from mountain grassland ecosystems under different land use, Plant Cell Environ., 22, 1281–1296, https://doi.org/10.1046/j.1365-3040.1999.00479.x, 1999.
Xiao, Z., Liang, S., Wang, J., Xiang, Y., Zhao, X., and Song, J.: Long-Time-Series Global Land Surface Satellite Leaf Area Index Product Derived From MODIS and AVHRR Surface Reflectance, IEEE T. Geosci. Remote Sens., 54, 5301–5318, https://doi.org/10.1109/TGRS.2016.2560522, 2016.
Yamaguchi, D. P., Nakaji, T., Hiura, T., and Hikosaka, K.: Effects of seasonal change and experimental warming on the temperature dependence of photosynthesis in the canopy leaves of Quercus serrata, Tree Physiol., 36, 1283–1295, https://doi.org/10.1093/treephys/tpw021, 2016.
Yamori, W., Hikosaka, K., and Way, D. A.: Temperature response of photosynthesis in C3, C4, and CAM plants: temperature acclimation and temperature adaptation, Photosynth. Res., 119, 101–117, https://doi.org/10.1007/s11120-013-9874-6, 2014.
Yang, R., Friedl, M. A., and Ni, W.: Parameterization of shortwave radiation fluxes for nonuniform vegetation canopies in land surface models, J. Geophys. Res.-Atmos., 106, 14275–14286, 2001.
Zeng, Z., Piao, S., Li, L. Z. X., Zhou, L., Ciais, P., Wang, T., Li, Y., Lian, X., Wood, E. F., Friedlingstein, P., Mao, J., Estes, L. D., Myneni, R. B., Peng, S., Shi, X., Seneviratne, S. I., and Wang, Y.: Climate mitigation from vegetation biophysical feedbacks during the past three decades, Nat. Clim. Change, 7, 432–436, https://doi.org/10.1038/nclimate3299, 2017.
Zhang, X. W., Wang, J. R., Ji, M. F., Milne, R. I., Wang, M. H., Liu, J.-Q., Shi, S., Yang, S.-L., and Zhao, C.-M.: Higher Thermal Acclimation Potential of Respiration but Not Photosynthesis in Two Alpine Picea Taxa in Contrast to Two Lowland Congeners, PLOS ONE, 10, e0123248, https://doi.org/10.1371/journal.pone.0123248, 2015.
Zhang, Y. and Schaap, M. G.: Weighted recalibration of the Rosetta pedotransfer model with improved estimates of hydraulic parameter distributions and summary statistics (Rosetta3), J. Hydrol., 547, 39–53, https://doi.org/10.1016/j.jhydrol.2017.01.004, 2017.
Zhao, M. and Running, S. W.: Drought-Induced Reduction in Global Terrestrial Net Primary Production from 2000 Through 2009, Science, 329, 940–943, https://doi.org/10.1126/science.1192666, 2010.
Zhao, M., Heinsch, F. A., Nemani, R. R., and Running, S. W.: Improvements of the MODIS terrestrial gross and net primary production global data set, Remote Sens. Environ., 95, 164–176, https://doi.org/10.1016/j.rse.2004.12.011, 2005.
Zhao, M., Running, S. W., and Nemani, R. R.: Sensitivity of Moderate Resolution Imaging Spectroradiometer (MODIS) terrestrial primary production to the accuracy of meteorological reanalyses, J. Geophys. Res.-Biogeo., 111, G01002, https://doi.org/10.1029/2004JG000004, 2006.
Ziehn, T., Kattge, J., Knorr, W., and Scholze, M.: Improving the predictability of global CO2 assimilation rates under climate change, Geophys. Res. Lett., 38, L10404, https://doi.org/10.1029/2011GL047182, 2011.