the Creative Commons Attribution 4.0 License.
the Creative Commons Attribution 4.0 License.
 | 13 Jul 2022
Development and evaluation of the Aerosol Forecast Member in the National Center for Environment Prediction (NCEP)'s Global Ensemble Forecast System (GEFS-Aerosols v1)
Raffaele Montuoro
Stuart A. McKeen
Barry Baker
Partha S. Bhattacharjee
Georg A. Grell
Judy Henderson
Gregory J. Frost
Jeff McQueen
Rick Saylor
Haiqin Li
Ravan Ahmadov
Jun Wang
Ivanka Stajner
Shobha Kondragunta
Xiaoyang Zhang
Fangjun Li
The National Oceanic and Atmospheric Administration (NOAA)'s National Weather Service (NWS) is on its way to deploying various operational prediction applications using the Unified Forecast System (https://ufscommunity.org/, last access: 18 June 2022), a community-based coupled, comprehensive Earth modeling system. An aerosol model component developed in collaboration between the Global Systems Laboratory, Chemical Science Laboratory, Air Resources Laboratory, and Environmental Modeling Center (GSL, CSL, ARL, EMC) was coupled online with the FV3 Global Forecast System (FV3GFS) using the National Unified Operational Prediction Capability (NUOPC)-based NOAA Environmental Modeling System (NEMS) software framework. This aerosol prediction system replaced the NEMS GFS Aerosol Component version 2 (NGACv2) system in the National Center for Environment Prediction (NCEP) production suite in September 2020 as one of the ensemble members of the Global Ensemble Forecast System (GEFS), dubbed GEFS-Aerosols v1. The aerosol component of atmospheric composition in the GEFS is based on the Weather Research and Forecasting model coupled with Chemistry (WRF-Chem). GEFS-Aerosols includes bulk modules from the Goddard Chemistry Aerosol Radiation and Transport model (GOCART). Additionally, the biomass burning plume rise module from High-Resolution Rapid Refresh (HRRR)-Smoke based on WRF-Chem was implemented. The GOCART dust scheme was replaced by the FENGSHA dust scheme (developed by ARL). The Blended Global Biomass Burning Emissions Product (GBBEPx version 3) provides biomass burning emission and fire radiative power (FRP) data. The global anthropogenic emission inventories are derived from the Community Emissions Data System (CEDS). All sub-grid-scale transport and deposition are handled inside the atmospheric physics routines, which required consistent implementation of positive definite tracer transport and wet scavenging in the physics parameterizations used by the NCEP's operational FV3GFS. This paper describes the details of GEFS-Aerosols model development and evaluation of real-time and retrospective runs using different observations from in situ measurement and satellite and aircraft data. GEFS-Aerosols predictions demonstrate substantial improvements for both composition and variability of aerosol distributions over those from the former operational NGACv2 system with the fundamental updates (e.g., dust and fire emission) in the atmospheric and chemical transport model.
- Article
(15937 KB) - Full-text XML
- BibTeX
- EndNote


The operational air quality predictions in the National Oceanic and Atmospheric Administration (NOAA)'s National Weather Service (NWS) contribute to the protection of lives and health in the US (https://airquality.weather.gov, last access: 18 June 2022). These predictions are used by state and local air quality forecasters to issue official air quality forecasts for their respective areas. The US Environmental Protection Agency (EPA) and the Centers for Disease Control and Prevention (CDC) also use the NOAA forecasts for applications with wildfire, health, and smoke vulnerability assessments. Exposure to fine particulate matter, i.e., aerosol particles with diameters of 2.5 µm and smaller (PM2.5), is recognized as a major health concern, and the associated mortality rate is estimated to be higher than the five specific causes of death examined by the global burden of disease (GBD, Burnett et al., 2018).
It is well known that the role of aerosols in numerical weather prediction (NWP), through interaction with atmospheric radiation and precipitation physics (direct, semidirect, and indirect effects), and their impact on meteorological fields at both weather and climate scales have been widely recognized in many studies (e.g., Fast et al., 2006; Chen et al., 2011; Grell et al., 2011; Forkel et al., 2012; Muhlbauer et al., 2013; Xie et al., 2013; Yang et al., 2014; H. Wang et al., 2014; Q. Wang et al., 2014). Additional studies at operational weather centers indicate the importance of including aerosol feedback in NWP for operational forecasting (Rodwell and Jung, 2008; Reale et al., 2011; Mulcahy et al., 2014; Bozzo et al., 2020). At the National Center for Environmental Prediction (NCEP), the operational RAPid refresh (RAP) and High-Resolution Rapid Refresh (HRRR) storm-scale modeling systems now include the impact of aerosols from biomass burning emissions on radiation. Due to the importance of aerosol feedback in NWP, the performance of predicted aerosols and their optical properties is critical before implementing the aerosol direct and semi-direct effects in NWP.
In the last decade, global aerosol modeling has grown rapidly to provide operational prediction and air quality alerts in NWP. More than 15 years ago, the National Aeronautics and Space Administration (NASA) implemented an aerosol transport module, the Goddard Chemistry Aerosol Radiation and Transport model (GOCART), online within the its Global Modeling and Assimilation Office (GMAO) Goddard Earth Observing System version 4 (GEOS-4) atmospheric general circulation model (AGCM) (Bloom et al., 2005), which is able to run in climate, data assimilation, and replay modes (Colarco et al., 2010). Later on, it switched to the next version of GEOS-5 to provide near-real-time forecast of aerosols and atmospheric compositions (Rienecker et al., 2008; Molod et al., 2015). Since 2008, as part of the Global and regional Earth-system Monitoring using Satellite and in situ data (GEMS) project, the European Centre for Medium-Range Weather Forecasts (ECMWF) began to provide aerosol forecast (Hollingsworth et al., 2008; Morcrette et al., 2009; Benedetti et al., 2009). In 2010, the International Cooperative for Aerosol Prediction (ICAP) was founded, with one of its goals being the development of a global multi-model aerosol forecasting ensemble (ICAP-MME) for basic research and eventual operational use (Benedetti et al., 2011; Reid et al., 2011; Colarco et al., 2014b). In the ICAP, the complete aerosol forecast models are originals from the European Centre for Medium-Range Weather Forecasts Copernicus Atmosphere Monitoring Service (ECMWF-CAMS), the Japan Meteorological Agency Model of Aerosol species in the Global Atmosphere (JMA-MASINGAR), the NASA Goddard Earth Observing System Version 5 (NASA-GEOS-5), and the Naval Research Lab Navy Aerosol Analysis and Prediction System (NRL-NAAPS) modeling systems. There is also the dust-only model from the Barcelona Supercomputer Center Chemical Transport Model (NMMB/BSC-CTM), the United Kingdom Met Office Unified Model (UKMO-UM), and the NOAA NCEP Environmental Modeling System (NEMS) Global Forecast System (GFS) Aerosol Component (NGAC) (Sessions et al., 2015). Xian et al. (2019) summarized and compared the current states and performances of this global operational aerosol model in the ICAP. The aerosol feedback is not included in these operational models, and it is mostly driven by independent operational/quasi-operational meteorological models developed at different NWP/research centers with different vertical and horizontal resolutions. All these models include the major aerosol species of black carbon (BC), organic carbon (OC), sulfate, sea salt and dust, and GEOS-5 as an extra trace of nitrate. The aerosol optical depth (AOD) root mean square error (RMSE) between ICAP-MME and 21 representative sites of the Aerosol Robotic Network (AERONET) from 2012 to 2017 indicates improvements for find-mode AOD, while it shows small signals of potential model improvement over the regions where is impacted by the biomass burning emission and dust (Xian et al., 2019). The NCEP, in collaboration with the NASA/Goddard Space Flight Center (GSFC), developed the NEMS GFS Aerosol Component version 1 (NGACv1) for predicting the distribution of global atmospheric aerosols (Lu et al., 2010). NGAC is an interactive atmospheric aerosol forecast system with the NEMS global spectral model (NEMS GSM) as the atmosphere model and GOCART as the aerosol model (Wang et al., 2018). NGACv1 was implemented in 2012 and provided the first operational global dust aerosol forecasting capability at the NCEP (Lu et al., 2016). In NGACv1 an in-line aerosol module based on the GOCART model from GEOS-5 (Chin et al., 2000) but limited to dust only was used. NGACv1 used the Earth System Modeling Framework (ESMF) to couple the aerosol module with the GFS. Later, NCEP implemented a multispecies aerosol forecast capability NGACv2, based on NGACv1 through collaborations among NCEP, NASA/GSFC, the NESDIS Center for Satellite Applications and Research (STAR), and the State University of New York at Albany (Wang et al., 2018).
In July 2016, the NOAA took a significant step toward developing a state-of-the-art global weather forecasting model by announcing the selection of a new dynamic core developed at the NOAA Geophysical Fluid Dynamics Laboratory (GFDL) to upgrade the GFS. The GFDL Finite-Volume Cubed-Sphere Dynamical Core (FV3) replaced the spectral GFS core in June of 2019 to drive global NWP systems with improved forecasts of severe weather, winter storms, and tropical cyclone intensity and track. The NOAA is now on the way to integrating various operational applications into the Unified Forecast System (UFS), a comprehensive, community-based coupled Earth modeling system, designed as both a research tool and the basis for NOAA operational forecasting applications.
Here we describe a new aerosol model component developed through collaborative efforts among the Global Systems Laboratory (GSL), the Chemical Science Laboratory (CSL), the Air Resources Laboratory (ARL), and the Environmental Modeling Center (EMC). This aerosol component was implemented operationally in September 2020 to provide 5 d global aerosol forecasts with ∼ 25 km horizontal resolution and 64 vertical layers from the surface to 0.2 hPa as one member of the Global Ensemble Forecast System of version 12 (GEFSv12): GEFS-Aerosols v1. The aerosol component is designed as an independent model component for the NOAA Environmental Modeling System framework and includes a coupling interface based on the National Unified Operational Prediction Capability (NUOPC) layer for model interoperability. All chemistry, aerosol, and emission modeling processes reside and run within this model component. There is no aerosol feedback on the atmospheric model of GEFS, and the aerosols are not in any way interactive with the radiation and clouds. GEFS-Aerosols shows a substantial improvement for both composition and variability of aerosol distributions over those from the previous global aerosol prediction system, NGACv2. The model-predicted global aerosol products from GEFS-Aerosols are also used for other applications, such as to provide lateral boundary conditions for the NOAA's regional National Air Quality Forecast Capability (NAQFC), satellite sea surface temperature (SST) physical retrievals, and the global solar insolation estimation (Wang et al., 2018).
The current study presents the development of GEFS-Aerosols and evaluations of its performance in real time and retrospective experiments. Section 2 describes the coupling components of the GEFS-Aerosols member, including the atmospheric component of the FV3GFS model, the aerosol component, and the observation, reanalysis, and model data used for evaluation and comparison. The emission inventories of both anthropogenic emission and biomass burning emissions and other chemical input data are presented in Sect. 3. Sections 4 and 5 are the evaluations of Day-1 real-time forecasts since July 2019 and the Day-1 retrospective forecast for the Atmospheric Tomography Mission (ATom-1) periods of the 2016 summer, respectively. The conclusions and future plans are summarized in Sect. 6.
2.1 Descriptions of GEFS-Aerosols
2.1.1 FV3GFS and GEFS-Aerosols
The global FV3 developed by the GFDL was chosen by the NOAA as the non-hydrostatic dynamical core to be the Next Generation Global Prediction System (NGGPS) of the National Weather Service in the US (Black et al., 2021). Currently, the FV3 was successfully implemented within the physical scheme of GFS version 15 (named FV3GFS v15), which became operational in June 2019. It has the capability to provide the metrological basis for coupling with the aerosol prediction component. The GEFS is a weather forecast modeling system made up of 31 separate forecasts, or ensemble members, which have the same horizontal (∼ 25 km) and vertical resolution (64 layers from the surface to 0.2 hPa). The GEFS-Aerosols model only uses one of the same weather models as the other GEFS members, except that it includes the prognostic aerosols from the coupling aerosol component. The NCEP started the GEFS addressing the nature of uncertainty in weather observations that are used to initialize weather forecast models and uncertainties in model representations of atmospheric dynamics and physics. The aerosol component coupled with FV3GFS v15 has been merged into the GEFS, as a single ensemble member named GEFS-Aerosols, for real-time and retrospective forecast that preceded operational implementation, which occurred in September 2020.
In GFS v15, all sub-grid-scale transport and convective deposition related to aerosol are handled inside the atmospheric physics routines of the simplified Arakawa–Schubert (SAS) scheme. It requires consistent implementation of positive definite tracer transport and wet scavenging in the physics parameterizations, which was implemented subsequent to the forecast system of GEFSv12.
2.1.2 Aerosol component
The current aerosol component in the GEFS-Aerosols model is based on the simple bulk aerosol modules from the Weather Research and Forecasting model coupled with Chemistry (WRF-Chem) (Grell et al., 2005; Powers et al., 2017), and the first to be used in the global model is the Flow-following finite-volume Icosahedral Model (FIM) as FIM-Chem (Zhang et al., 2022), including aerosol modules from GOCART. The metrological fields (such as land use and other climatological surface fields and vegetation type) are imported from the FV3 atmospheric model to the chemical model to drive the aerosol components. They are consistent in the FV3 atmospheric model and chemical model. Other than the aerosol convective wet scavenging, all the chemically related processes of source and sink, such as emission, dry deposition, settling, large-scale wet deposition, and chemical reactions, are handled by the chemical model. The large-scale wet deposition and dry deposition modules are from WRF-Chem for the GOCART aerosol scheme, which are column-model-driven by meteorological input from the atmospheric model. Large-scale wet removal of aerosols includes below-cloud removal (washout) following Easter et al. (2004), and the details of below-cloud wet scavenging via interception and impaction can be found in Slinn (1984). The dry deposition is the same as in Chin et al. (2002). After updating the chemical tracers in the chemical model, they are passed back to the FV3 atmospheric model for transport and advection.
The GOCART aerosol modules use simplified sulfur chemistry for sulfate simulation and bulk aerosols of BC, OC, and sectional dust and sea salt (Chin et al., 2000). For OC and BC, the hydrophilic and hydrophobic components are considered, and the chemical reactions for gaseous sulfur oxidations are calculated using prescribed OH, H2O2, and NO3 fields for gaseous sulfur oxidations (Chin et al., 2000). The GOCART model background fields of prescribed OH, H2O2, and NO3 have been replaced with the newer version of 2015 from the NASA GEOS Global Modeling Initiative (GMI) chemical transport model (https://acd-ext.gsfc.nasa.gov/Projects/GEOSCCM/MERRA2GMI/, last access: 18 June 2022). These are monthly mean data, and these prescribed OH, H2O2, and NO3 fields would not be transported and changed in space. The marine dimethyl sulfide (DMS) emission is calculated as a product of seawater DMS concentration and sea-to-air transfer velocity as described by Chin et al. (2000). Recently, some modifications and updates have been implemented, including the biomass burning plume rise module adapted from High-Resolution Rapid Refresh (HRRR) Smoke based on WRF-Chem, the capabilities of using the version-3 biomass burning emission calculations based on the Blended Global Biomass Burning Emissions Product (GBBEPx, Zhang et al., 2014) and fire radiative power (FRP) data provided by NESDIS (GBBEPx v3) as well as the application of the global anthropogenic emission inventories from the Community Emissions Data System (CEDS).
The sea-salt scheme was updated to the most recent version with five size bins based on NASA's second-generation GOCART model (Colarco et al., 2010). The model has the capability of handling volcanic eruptions, which need the estimate of injection height and SO2 and volcanic ash emissions, while for the predicted results in the paper, the volcanic emission has not been included.
A new dust emission scheme, referred to as FENGSHA, was implemented in GEFS-Aerosols. The scheme, which is also used in the NOAA's National Air Quality Forecast Capability, is modified from the original Owen equation (Tong et al., 2017, Owen, 1964; Shao et al., 1993),
where N is the number of soil types in a particular grid cell, K is the ratio of vertical to horizontal emission flux, A represents particle supply limitation (availability), ρ is air density, g is gravitational acceleration, S is the soil erodibility potential, u* is friction velocity, and is the threshold friction velocity for soil type j (Shao et al., 1993). Dust emission is calculated only when friction velocity exceeds the designated threshold value for the land use type and soil texture. The threshold friction velocities are based on wind tunnel measurements done in both the laboratory and the field (Gillette et al., 1980).
What makes FENGSHA unique is the way in which the threshold values are determined. Unlike models based on Marticorena and Bergametti (1995) or Shao et al. (2011), threshold values are based on surface and wind tunnel flux measurements of saltation (Gillette, 1988). The drag partition in the FENSGHA scheme is described by the MacKinnon et al. (2004) parametrization using the model surface roughness (z0) or derived from the surface roughness estimates using the Advanced Scatterometer (ASCAT) as described by Prigent et al. (2012). The Fécan et al. (1998) soil moisture correction is used to adjust the dry threshold friction velocity. Once the total windblown dust emission flux is computed, the total flux is distributed into the modeled dust bins using the Kok (2011) distribution.
A new sediment supply map, the Baker–Schepanski map (BSM), which was developed from the ideas of Chappell and Webb (2016), is currently used within the GEFS-Aerosols FENGSHA implementation. Chappell and Webb (2016) created an approach similar to that of the Raupach (1992) model for lateral cover but instead used a top–down view to describe the area of the turbulent wake using an analogous shadow instead of a 2-D view. The shadow approach is sensitive to the configuration of the roughness elements, meaning that it is sensitive to the placement of the roughness elements in relation to each other. The BSM describes the probability of momentum mixing directly to the soil surface through the canopy. For the application to GEFS-Aerosols, a monthly 3-year climatology of the BSM was created which refers to a monthly average over 3 observation years, in this case 2016, 2017, and 2018, as these were the latest full years at the time of model development.
2.1.3 GEFS-Aerosols coupled architecture, running sequence, and forecasting workflow
The aerosol component of GEFS-Aerosols couples directly with the FV3-based atmospheric component via the NUOPC layer (Theurich et al., 2016), which is the foundation of the NOAA's modeling framework (Fig. 1). Figure 2a shows the model-coupled structure that the aerosol component imports meteorological fields from the atmospheric model and exchanges aerosol mixing ratios at each coupling time step via standard NUOPC connectors. Each aerosol species is simulated as a prognostic atmospheric tracer, which is advected by the FV3 dynamical core and undergoes convective mixing and PBL diffusion within the atmospheric physics. All aerosol composition and emission-related processes are computed in GEFS-Aerosols after the atmospheric physics has been advanced and passed to the chemical model following the sequences as emission, settling of dust and sea salt, plume rise of fire emission, dry deposition, large-scale wet deposition, chemical reactions, and carbonaceous aerosol updating. Tracer mixing ratios are then updated and exported back to the atmospheric model.

Bundling all aerosol composition processes in a single model component led to the implementation of a sequential coupling scheme with the atmospheric component. At each coupling time step, the atmospheric dynamical core and physics processes (including radiation) are computed first. The aerosol component is then executed to perform all air composition processes and transfer the updated tracers back to the atmospheric component. Finally, control returns to the atmospheric model, which updates the atmospheric state with new meteorology and aerosol concentrations. To minimize overhead associated with data exchange between model components, GEFS-Aerosols is run on the atmospheric grid, which is imported from the atmospheric component through the NUOPC. Additionally, the coupling run sequence assigns to the aerosol component the identical set of persistent execution threads (PETs) used by the atmospheric model's forecast component. This allows the model to leverage the NUOPC's ability to access coupling fields by memory reference, minimizing the memory footprint for the coupled system.
The sequence of steps involved in moving from the beginning to the end of a forecast process is controlled by the workflow. In a retrospective or real-time forecast, the chemical tracers are cycled from the output of a previous forecast as the initial condition. In operation, the computational cost with an aerosol component would take 129 min for a 120 h forecast. Therefore, the efficiency is about 2.53 times the computational cost by including the aerosol component compared to the one without an aerosol component in the forecast. In the operation, there is no execution time by including the aerosol component as one of the ensemble members since this member only performs a 120 h forecast by including the aerosol component, which is shorter than other members without the aerosol component that perform a 384 h forecast.
The workflow shown in Fig. 2b describes the steps including pre-processing (prepare input data) and post-processing (process output data) before and after forecast for GEFS-Aerosols in the forecast system. This initial implementation of GEFS-Aerosols does not include aerosol data assimilation, so the chemical tracers in the restart files are used as the chemical initial condition for the next forecast. The yellow box includes the tasks/steps for the atmospheric mode, while the green box includes the tasks/steps for chemical model. The AOD is calculated in the post-processing part of the workflow, using a look-up table (LUT) of aerosol optical properties from the NASA GOCART model (Colarco et al., 2010, 2014a), which was implemented in the Unified Post Processor (UPP, https://dtcenter.org/community-code/unified-post-processor-upp, last access: 18 June 2022). It should be noted that the LUT reflects the impacts of a larger number of aerosol species in the atmosphere than the simple GOCART module treats. Also, considering the bulk aerosol scheme in GOCART, there is no size distribution for OC, BC, and sulfate, and the LUT may have uncertainties in the AOD calculation. Based on observational validation, some adjustments have been applied in LUT calculation to compensate for the contributions for the absence of nitrate, ammonium, and secondary organic aerosol in GOCART.
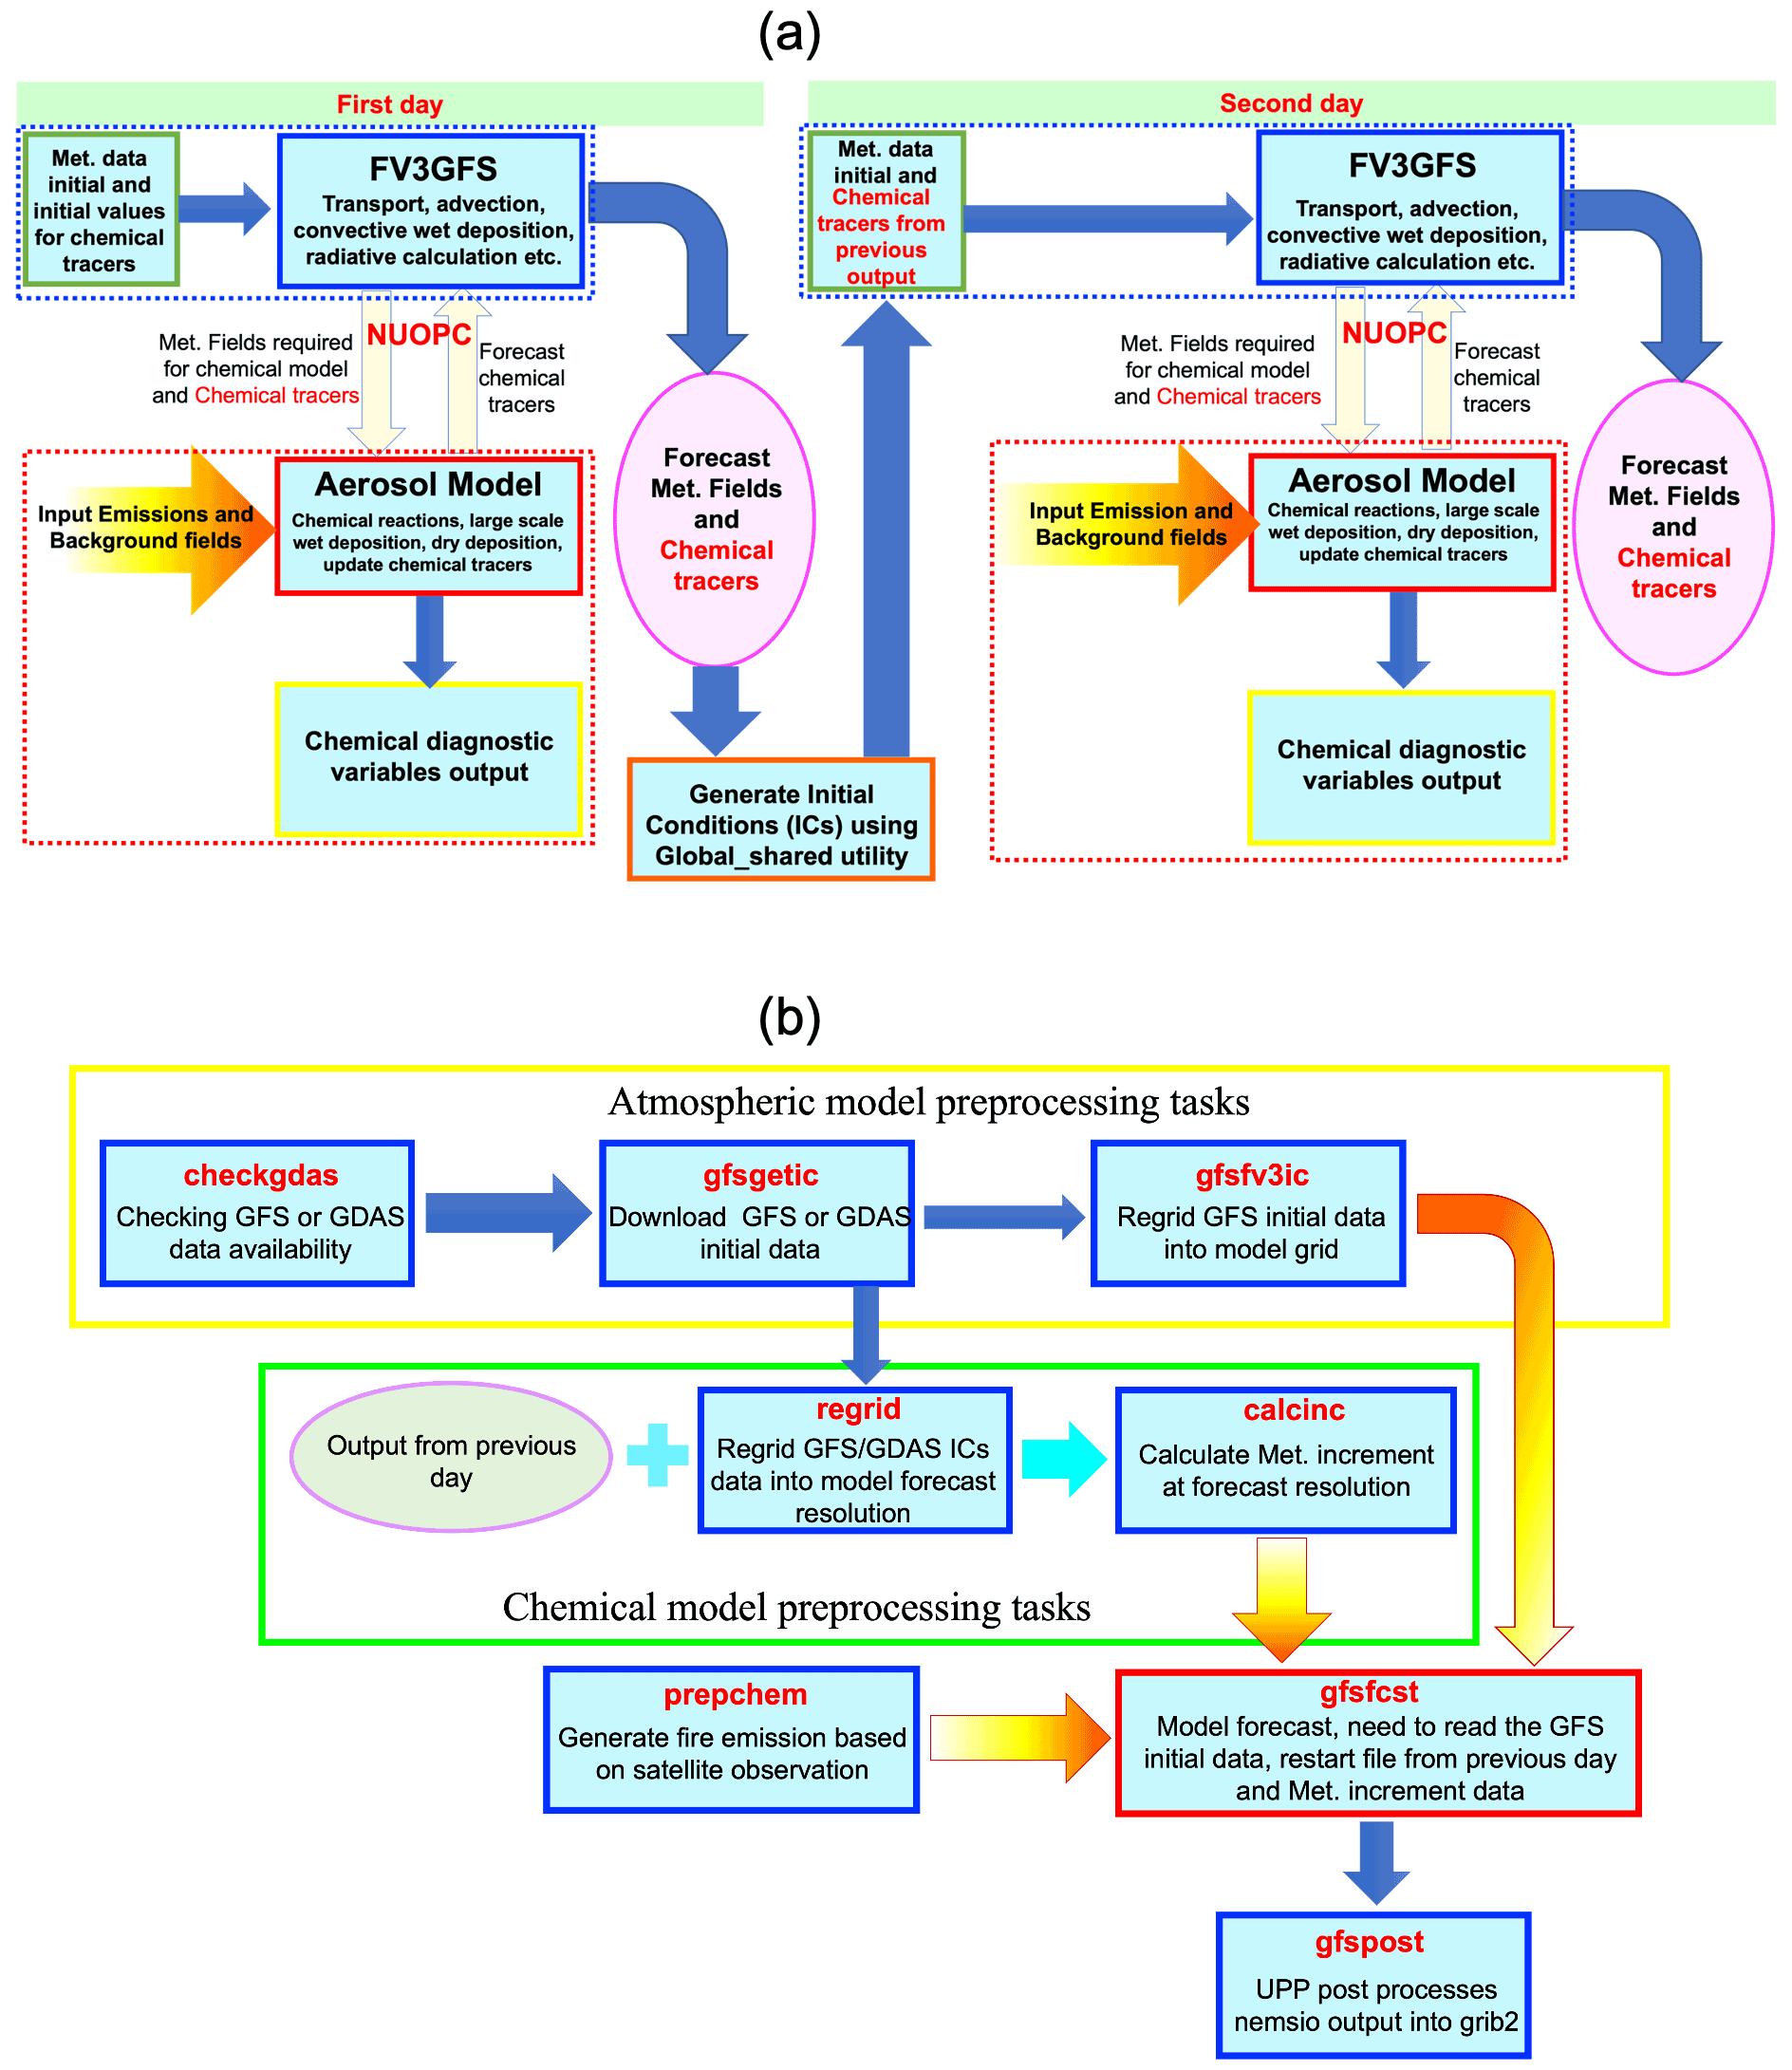
Figure 2(a) Diagram of the GEFS-Aerosols coupled structure. (b) Flowchart of steps/tasks for GEFS-Aerosols in the global workflow forecast system.
2.2 Observation, reanalysis data, and other model data
The real-time forecast experiments were evaluated using the following ensemble analysis, reanalysis data, satellite and in situ observational data, aircraft measurements, and model predictions. We compare each day's model forecast hours with the same day's reanalysis or analysis data and compute the AOD statistics (bias, RMSE, correlation, etc.) for each grid for each pair of model and reanalysis or analysis data for that model forecast hour. We then calculate that for the entire 4 months of the study period and average it over the entire 4 months for each grid point. This method gives an overall estimate of the systematic bias of the model at spatial and temporal scales.
2.2.1 Reanalysis data of AOD
-
Total AOD instantaneous reanalysis dataset from the second Modern-Era Retrospective analysis for Research and Application (MERRA-2, Gelaro et al., 2017). The MERRA-2 reanalysis provides various AOD products at 0.625 × 0.5∘ horizontal resolution and at 72 vertical levels. MERRA-2 reanalysis data are not synchronous in real time and normally have 1–2 months' time lag.
2.2.2 Observation data of satellite AOD, AERONET AOD, and ATom-1 concentrations
-
MODIS provides near-global coverage of aerosol measurements in space and time. We have used a MODIS Level-3 (daily and monthly at 1∘ horizontal resolution) AOD dataset in this study (https://ladsweb.nascom.nasa.gov/, last access: 18 June 2022). The dataset belongs to Collection 6.1 combined land and ocean from the Aqua satellite (Levy et al., 2013). This latest collection of MODIS data includes AOD data based on refined retrieval algorithms, in particular the expanded Deep Blue algorithm (Hsu et al., 2013; Sayer et al., 2013). It introduces a merged AOD product, combining retrievals from the Dark Target (DT) and Deep Blue (DB) algorithms to produce a consistent dataset covering a multitude of surface types ranging from oceans to bright deserts (Sayer et al., 2014). In this work, the aerosol product Dark_Target_Deep_Blue_Combined_Mean was used for quantitative evaluation of model results. We have used Collection 6.1 MODIS AOD at 550 nm, which has expected errors (EEs) of ±(0.05 + 15 % AOD) and ±(0.03 + 5 % AOD) for Dark Target retrievals at a 10 km resolution over land and ocean, respectively. The EEs are approximately ±0.03 + 21 % AOD for “arid” and ±0.03 + 18 % AOD for “vegetated” path Deep Blue retrievals at a 10 km resolution over land (Levy et al., 2013).
-
The Visible Infrared Imaging Radiometer Suite (VIIRS) sensor on board the Suomi National Polar Orbiting (S-NPP) satellite provides sets of aerosol environmental data records (EDRs) based on daily global observations from space (Jackson et al., 2013; Liu et al., 2013). Beginning in 2012, the VIIRS has provided AOT at 550 nm at a global 0.25∘ horizontal resolution. Daily gridded Enterprise Processing System (EPS) VIIRS data used are from the NOAA STAR ftp site at ftp://ftp.star.nesdis.noaa.gov/pub/smcd/VIIRS_Aerosol/npp.viirs.aerosol.data/epsaot550/ (last access: 5 May 2021).
-
AERONET, which is a global ground-based network of automated sun-photometer measurements, provides AOT, surface solar flux, and other radiometric products (Holben et al., 1998). It is a well-established network of over 700 stations globally, and its data are widely used for aerosol-related studies (Zhao et al., 2002). AERONET employs the CIMEL Sun–sky spectral radiometer, which measures direct Sun radiances at eight spectral channels centered at 340, 380, 440, 500, 675, 870, 940, and 1020 nm. AOT uncertainties in the direct Sun measurements are within ±0.01 for longer wavelengths (longer than 440 nm) and ±0.02 for shorter wavelengths (Eck et al., 1999). Table 1 lists the number of stations and their locations in terms of latitude and longitude. The stations are selected based on years in service and geographic location near the aerosol source regions. The stations covered major aerosol sources: African dust, southern Africa and South America (major forest fire stations), mixed aerosol regimes (urban areas in Europe, Asia, and North America), and high-latitude stations (capturing major transport of forest fires from Siberia and Canada).
-
The Atmospheric Tomography Mission (ATom) studies the impact of human-produced air pollution on greenhouse gases and on chemically reactive gases in the atmosphere (Wofsy et al., 2018). ATom deploys instrumentation to sample atmospheric composition, profiling the atmosphere in the 0.2 to 12 km altitude range. Flights took place in each of the four seasons over a 22-month period in 2016 through 2018. They originated from the Armstrong Flight Research Center in Palmdale, California, flew north to the western Arctic, south to the South Pacific, east to the Atlantic, north to Greenland, and returned to California across central North America over the Pacific and Atlantic oceans from ∼ 80∘ N to ∼ 65∘ S. In August 2016, PALMS sampled on the NASA DC-8 aircraft as part of the ATom program (https://espo.nasa.gov/missions/atom/content/ATom, last access: 18 June 2022). Aerosol composition determinations using the PALMS instrument during ATom-1 have been described and interpreted previously (Murphy et al., 2018, 2019; Schill et al., 2020; Bourgeois et al., 2020). The PALMS mass concentrations for various species are derived by normalizing the fractions of particles of each size and type to size distributions measured by optical particle counters (Froyd et al., 2019).
Table 1AERONET site information, the correlation coefficients, and the root mean square error (RMSE) of GEFS-Aerosols, ICAP, and NGACv2 AOD with respect to that of AERONET observation for the period 5 July–30 November 2019. Correlation coefficients are at the 95 % confidence interval.

2.2.3 Model ensemble analysis AOD and other model forecasts
-
The International Centers for Aerosol Prediction – Multi-Model Ensemble (ICAP-MME) provides daily 6-hourly forecasts of total and dust AOD globally out to 120 h at 1∘ horizontal resolution (Reid et al., 2011; Sessions et al., 2015; Xian et al., 2019). Total AOD in ICAP-MME is provided by the four core multispecies models: the ECMWF-CAMS, JMA-MASINGAR, NASA-GEOS-5, and NRL-NAAPS modeling systems. Dust-only AOD is provided by the aforementioned four models plus the Barcelona Supercomputer Center Chemical Transport Model (NMMB/BSC-CTM), the United Kingdom Met Office Unified Model (UKMO-UM), and NGACv2. However, NGACv2 is only used for dust AOD in ICAP-MME and is not used to compute the ensemble mean in ICAP-MME for total AOD. All four of the multispecies models incorporate aerosol data assimilation (DA) and satellite-based smoke emissions. ICAP-MME is able to provide real-time comparison for synchronous evaluation of operational forecast. The correlation and RMSE between ICAP-MME and AERONET indicated in Table 1 shows that ICAP analysis is quite close to observations, which is good to use as the global evaluated data, especially when the MERRA-2 data are not available in the real-time or operational forecast.
-
The NEMS GFS Aerosol Component Version 2.0 (NGACv2) for global multispecies aerosol forecast developed by NCEP and collaborators was previously used to provide operational global multispecies aerosol forecasts at the NCEP (Wang et al., 2018). The anthropogenic emissions are based on EDGAR V4.1 (Janssens-Maenhout, 2010) and AeroCom Phase II (Diehl et al., 2012). The fire emissions of carbonaceous aerosols and SO2 are from Global Biomass Burning Emission Product-extended (GBBEPx, Zhang et al., 2014). GBBEPx emissions are blended from NESDIS's Global Biomass Burning Emission Product from a constellation of geostationary satellites (GBBEP; X. Zhang et al., 2012) and GMAO's Quick Fire Emissions Data Version 2 from polar-orbiting satellites (QFED2; Darmenov and da Silva, 2015).
-
NGACv2 uses the same physics package as the 2015 version of the operational GFS.
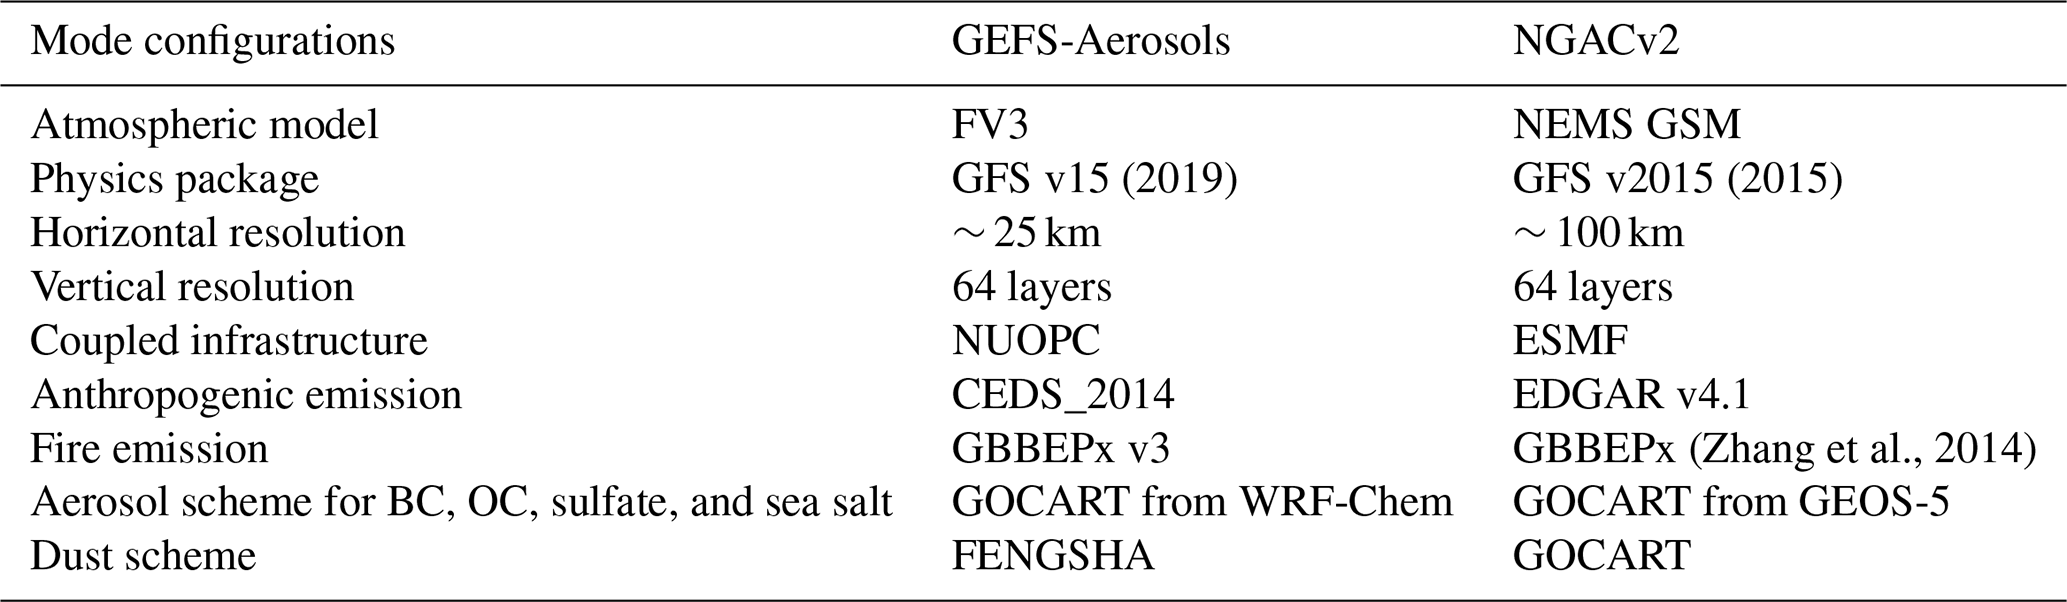
NGACv2 included additional aerosol species of sea salt, sulfate, organic carbon, and black carbon from the updated GOCART modules. Both science and software upgrades in the global forecast system were updated and implemented in NGACv2 in March 2017 to provide 5 d multispecies aerosol forecast products at the T126 L64 resolution at approximately 100 km. The comparison of model configurations for GEFS-Aerosols and NGACv2 has been shown in Table 2 based on the model information from Wang et al. (2018).
Table 2Comparison of model configurations between GEFS-Aerosols and NGACv2.
3.1 Anthropogenic emissions and background fields
The preprocessor, PREP-CHEM-SRC version 1.7 (Freitas et al., 2011), a comprehensive tool that prepares emission fields of trace gases and aerosols for use in atmospheric chemistry transport models, was used to generate the anthropogenic emissions, background fields of OH, H2O2, and NO3, and DMS and the dust scheme input of clay and sand at the FV3 grid resolution for GEFS-Aerosols. Two global anthropogenic emission inventories were chosen as input to drive the model, both providing monthly emissions. One is from CEDS, which provides the emissions of BC, OC, and SO2 in 2014 with 0.5∘ horizontal resolution (Hoesly et al., 2018). The CEDS inventory improves upon existing inventories with a more consistent and reproducible methodology applied to all emission species, updated emission factors, and more recent estimates in 2014. The data system relies on existing energy consumption datasets and regional and country-specific inventories to produce trends over recent decades (Hoesly et al., 2018). The Hemispheric Transport of Air Pollution (HTAP) version 2 (Janssens-Maenhout et al., 2015) inventory provides the emissions of BC, OC, SO2, PM2.5, and PM10 in 2010.
Figure 3 shows the comparisons of anthropogenic emissions between CEDS and HTAP for SO2, BC, and OC in July. Aside from the shipping lanes showing up in CEDS, there is generally broader spatial coverage in CEDS. For SO2, the CEDS emissions are much larger over the eastern US, eastern China, and Europe. Much higher values of BC and OC are seen in CEDS over East Asia, South Asia, and Europe. Similarly, much larger values for BC and OC are seen in the Southern Hemisphere in CEDS. We performed experiments by comparing model predictions using these two different anthropogenic emissions datasets with ATom-1 observations (figures not shown here). Slight improvements in SO2 correlations and bias are seen, and the sulfate, OC, and BC biases improve over the Atlantic Ocean when using the CEDS emissions in comparison to the HTAP dataset. It should be noted that these anthropogenic emissions data are not impossible to catch up to the date of real-time forecast, and they normally have time lag and represent the emissions of a different previous year. The inconsistency may have some impact on the predictions in 2019, but that is the most recently available version of anthropogenic emissions. It is well known that strong actions have been taken to improve the worsening atmospheric environment and decrease the emissions over China in the last 10 years (Chen et al., 2017; Q. Zhang et al., 2012; Liu et al., 2016). Considering the decreasing emission trend over China, the CEDS 2014 anthropogenic emission inventory would result in some overprediction after 2014.
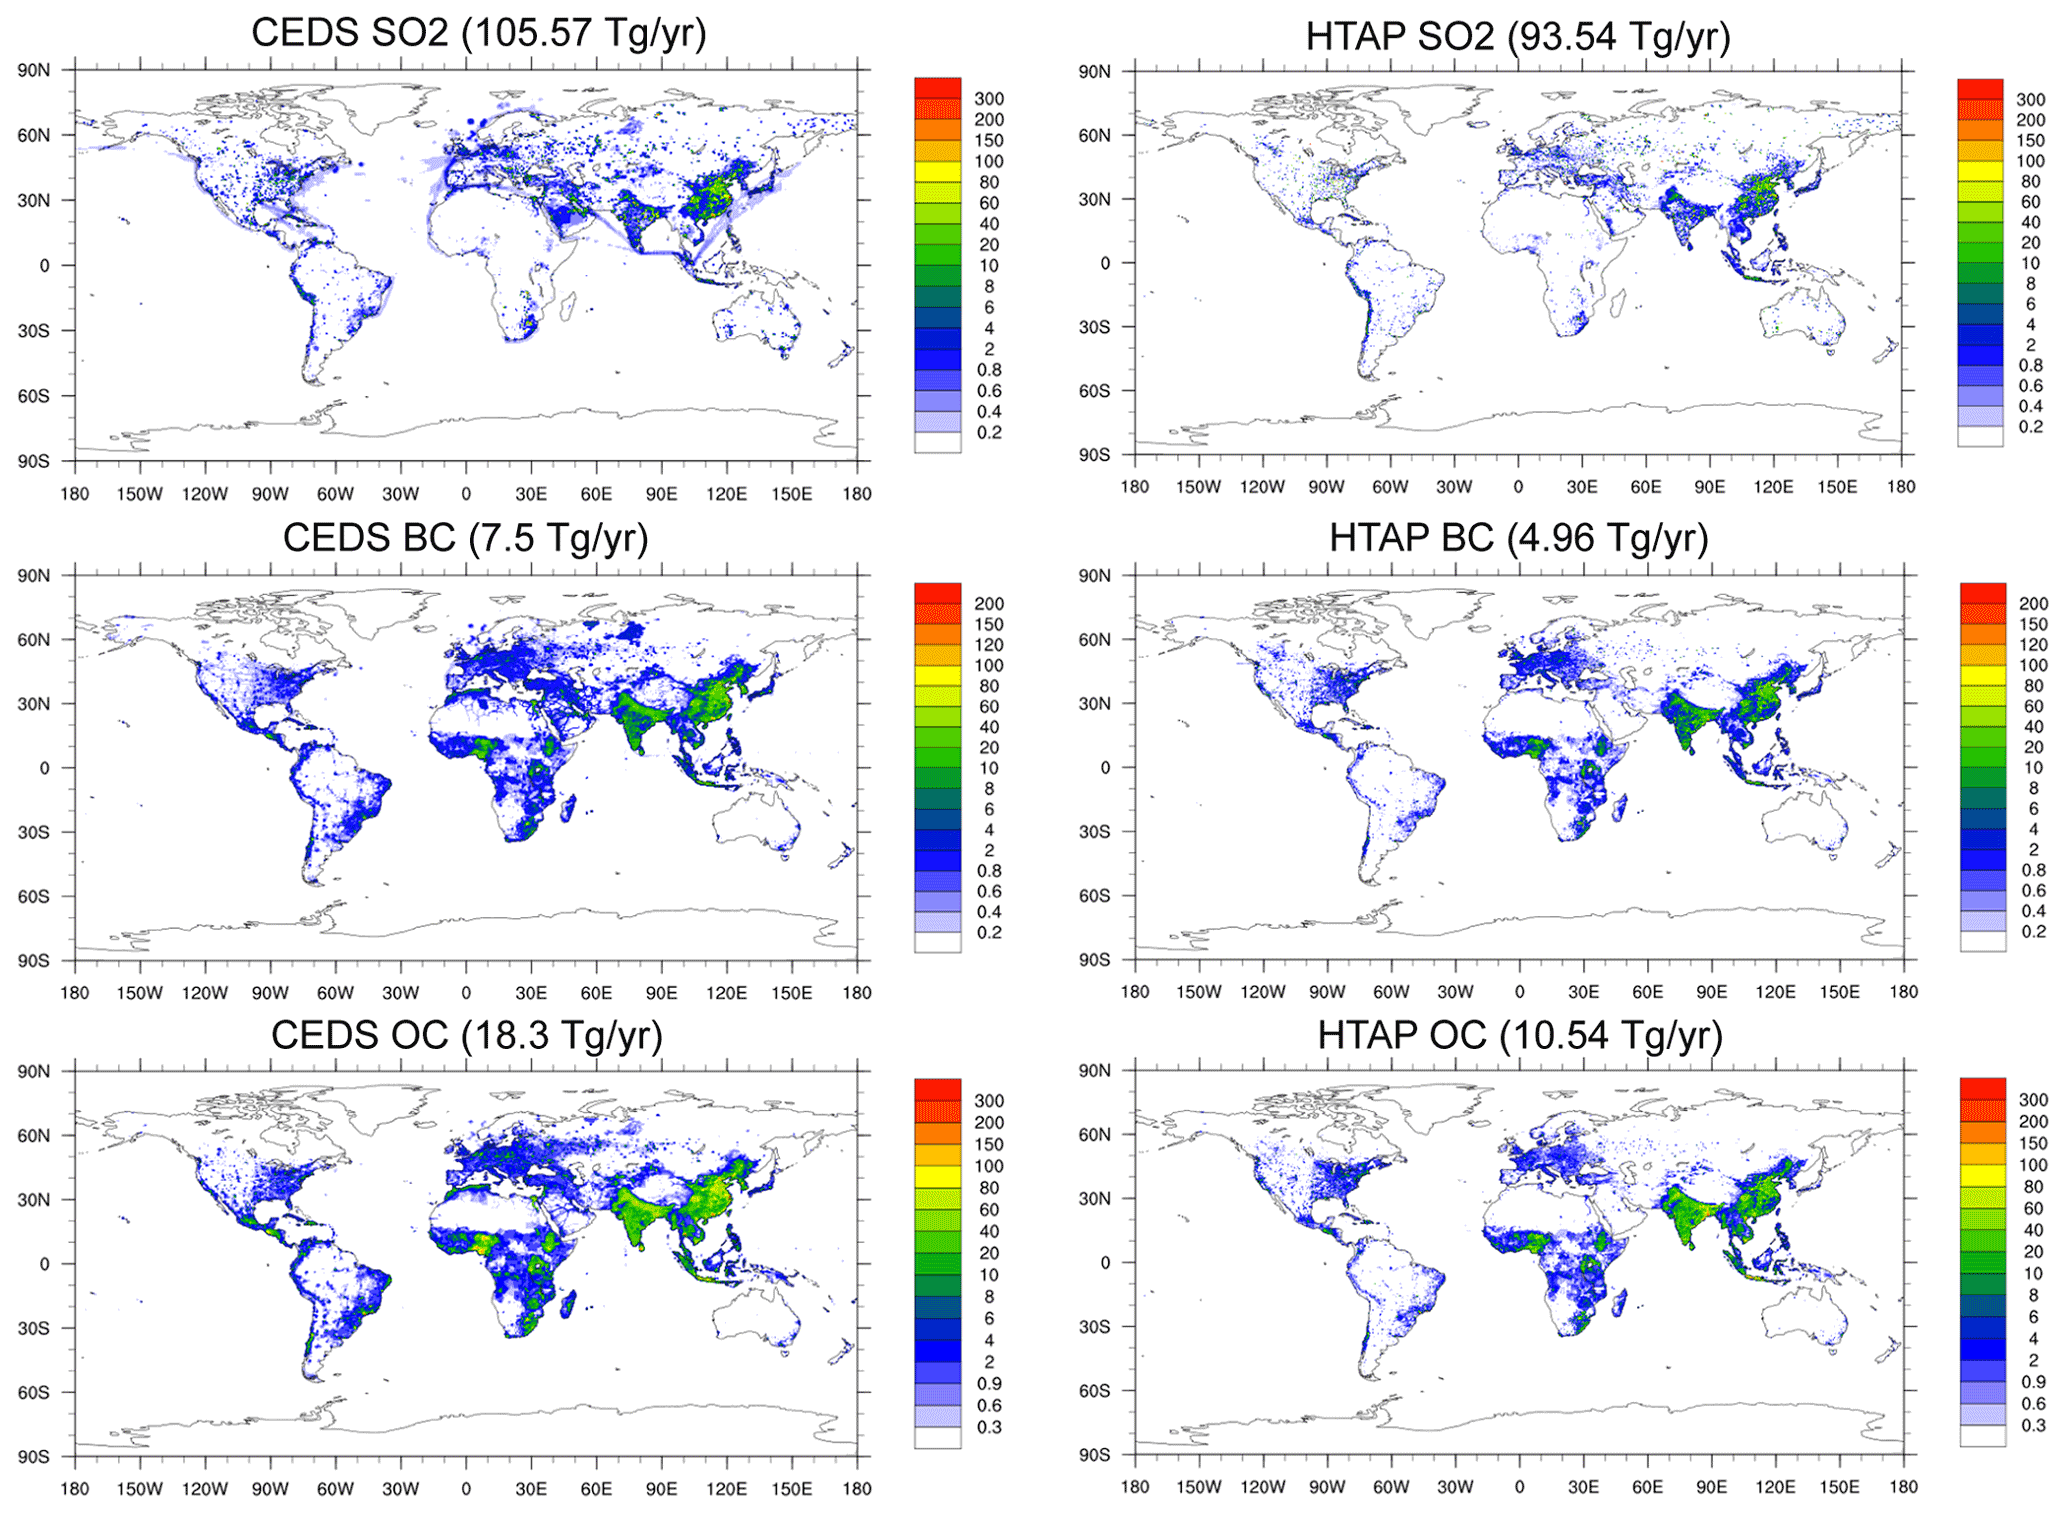
Figure 3Anthropogenic emissions of CEDS (2014) and HTAP (2010) for SO2 (molec. km−2 h−1), BC, and OC (ng m−2 s−1) in summer in July.
We validated the GOCART background fields of OH and H2O2 against the ATom-1 observations. Even though these background fields are model-derived climatologies, they both compare very well to the ATom-1 measurements. The newer NASA GEOS/GMI fields show improvement in the model–measurement biases for both OH and H2O2.
3.2 Biomass burning emission
The operation of GEFS-Aerosols uses the GBBEPx v3 emission with FRP. The GBBEPx v3 system produces daily global biomass burning emissions of PM2.5, BC, CO, CO2, OC, and SO2) by blending fire observations from the MODIS Quick Fire Emission Dataset (QFED), VIIRS (NPP and JPSS-1) fire emissions, and the Global Biomass Burning Emission Product from Geostationary satellites (GBBEP-Geo). GBBEP-Geo also produces hourly emissions from geostationary satellites at individual fire pixels. In the results shown here, GBBEPx v3 daily biomass burning emissions on the FV3 C384 global grid are used for GEFS-Aerosols. The details of the GBBEPx v3 algorithm can be found in https://www.ospo.noaa.gov/Products/land/gbbepx/docs/GBBEPx_ATBD.pdf (last access: 18 June 2022).
A one-dimensional (1-D) time-dependent cloud module from the High-Resolution Rapid Refresh (HRRR)-Smoke model has been implemented in GEFS-Aerosols to calculate injection heights and emission rates online (Freitas et al., 2007). The new scheme in HRRR-Smoke is a modified version of the 1-D plume rise scheme used in WRF-Chem (Freitas et al., 2007). The new plume rise scheme uses the FRP data instead of the look-up table to estimate the fire heat fluxes (Ahmadov et al., 2017). The 1-D cloud module is able to be applied to GBBEPx v3 fire emission datasets to account for plume rise that distributes the fire emissions vertically and to better simulate the fire events and pollution transport of smoke plumes.
To validate model performance when using the GBBEPx v3 fire emissions with a plume rise module based on real-time FRP data, we compare the real-time GEFS-Aerosols AOD with other reanalysis data, satellite observations, and the NGACv2 model for the big fire event in August 2019. Smoke from large fires burning in the Amazon rainforest, primarily in Brazil, Bolivia, Paraguay, and Peru, stretched over northern South America in mid-August. Figure 4 shows the total AOD forecast on 25 August compared against the NGACv2 model, MERRA-2 reanalysis data, and satellite observations of VIIRS and MODIS. For both satellites, daily gridded AOD is used to compare against the model forecast at 18:00. The GEFS-Aerosols AOD is able to reproduce the enhanced AOD due to several fire events over South America near the border of Bolivia, Paraguay, and Brazil, which were also observed by the VIIRS and MODIS satellite instruments and captured by the MERRA-2 analysis. Although there are a lot of missing data downwind from the fires in the satellite observations of VIIRS and MODIS, especially over the South Pacific, GEFS-Aerosols and MERRA-2 results are consistent in showing the transport of fire plumes into the tropical Pacific and South Atlantic. In contrast, the NGACv2 model does not capture these fire events and exhibits only a very slight AOD enhancement. NGACv2 AOD is more than 80 % smaller than the observations over the fire source region and produces little or no transported smoke over the surrounding areas.
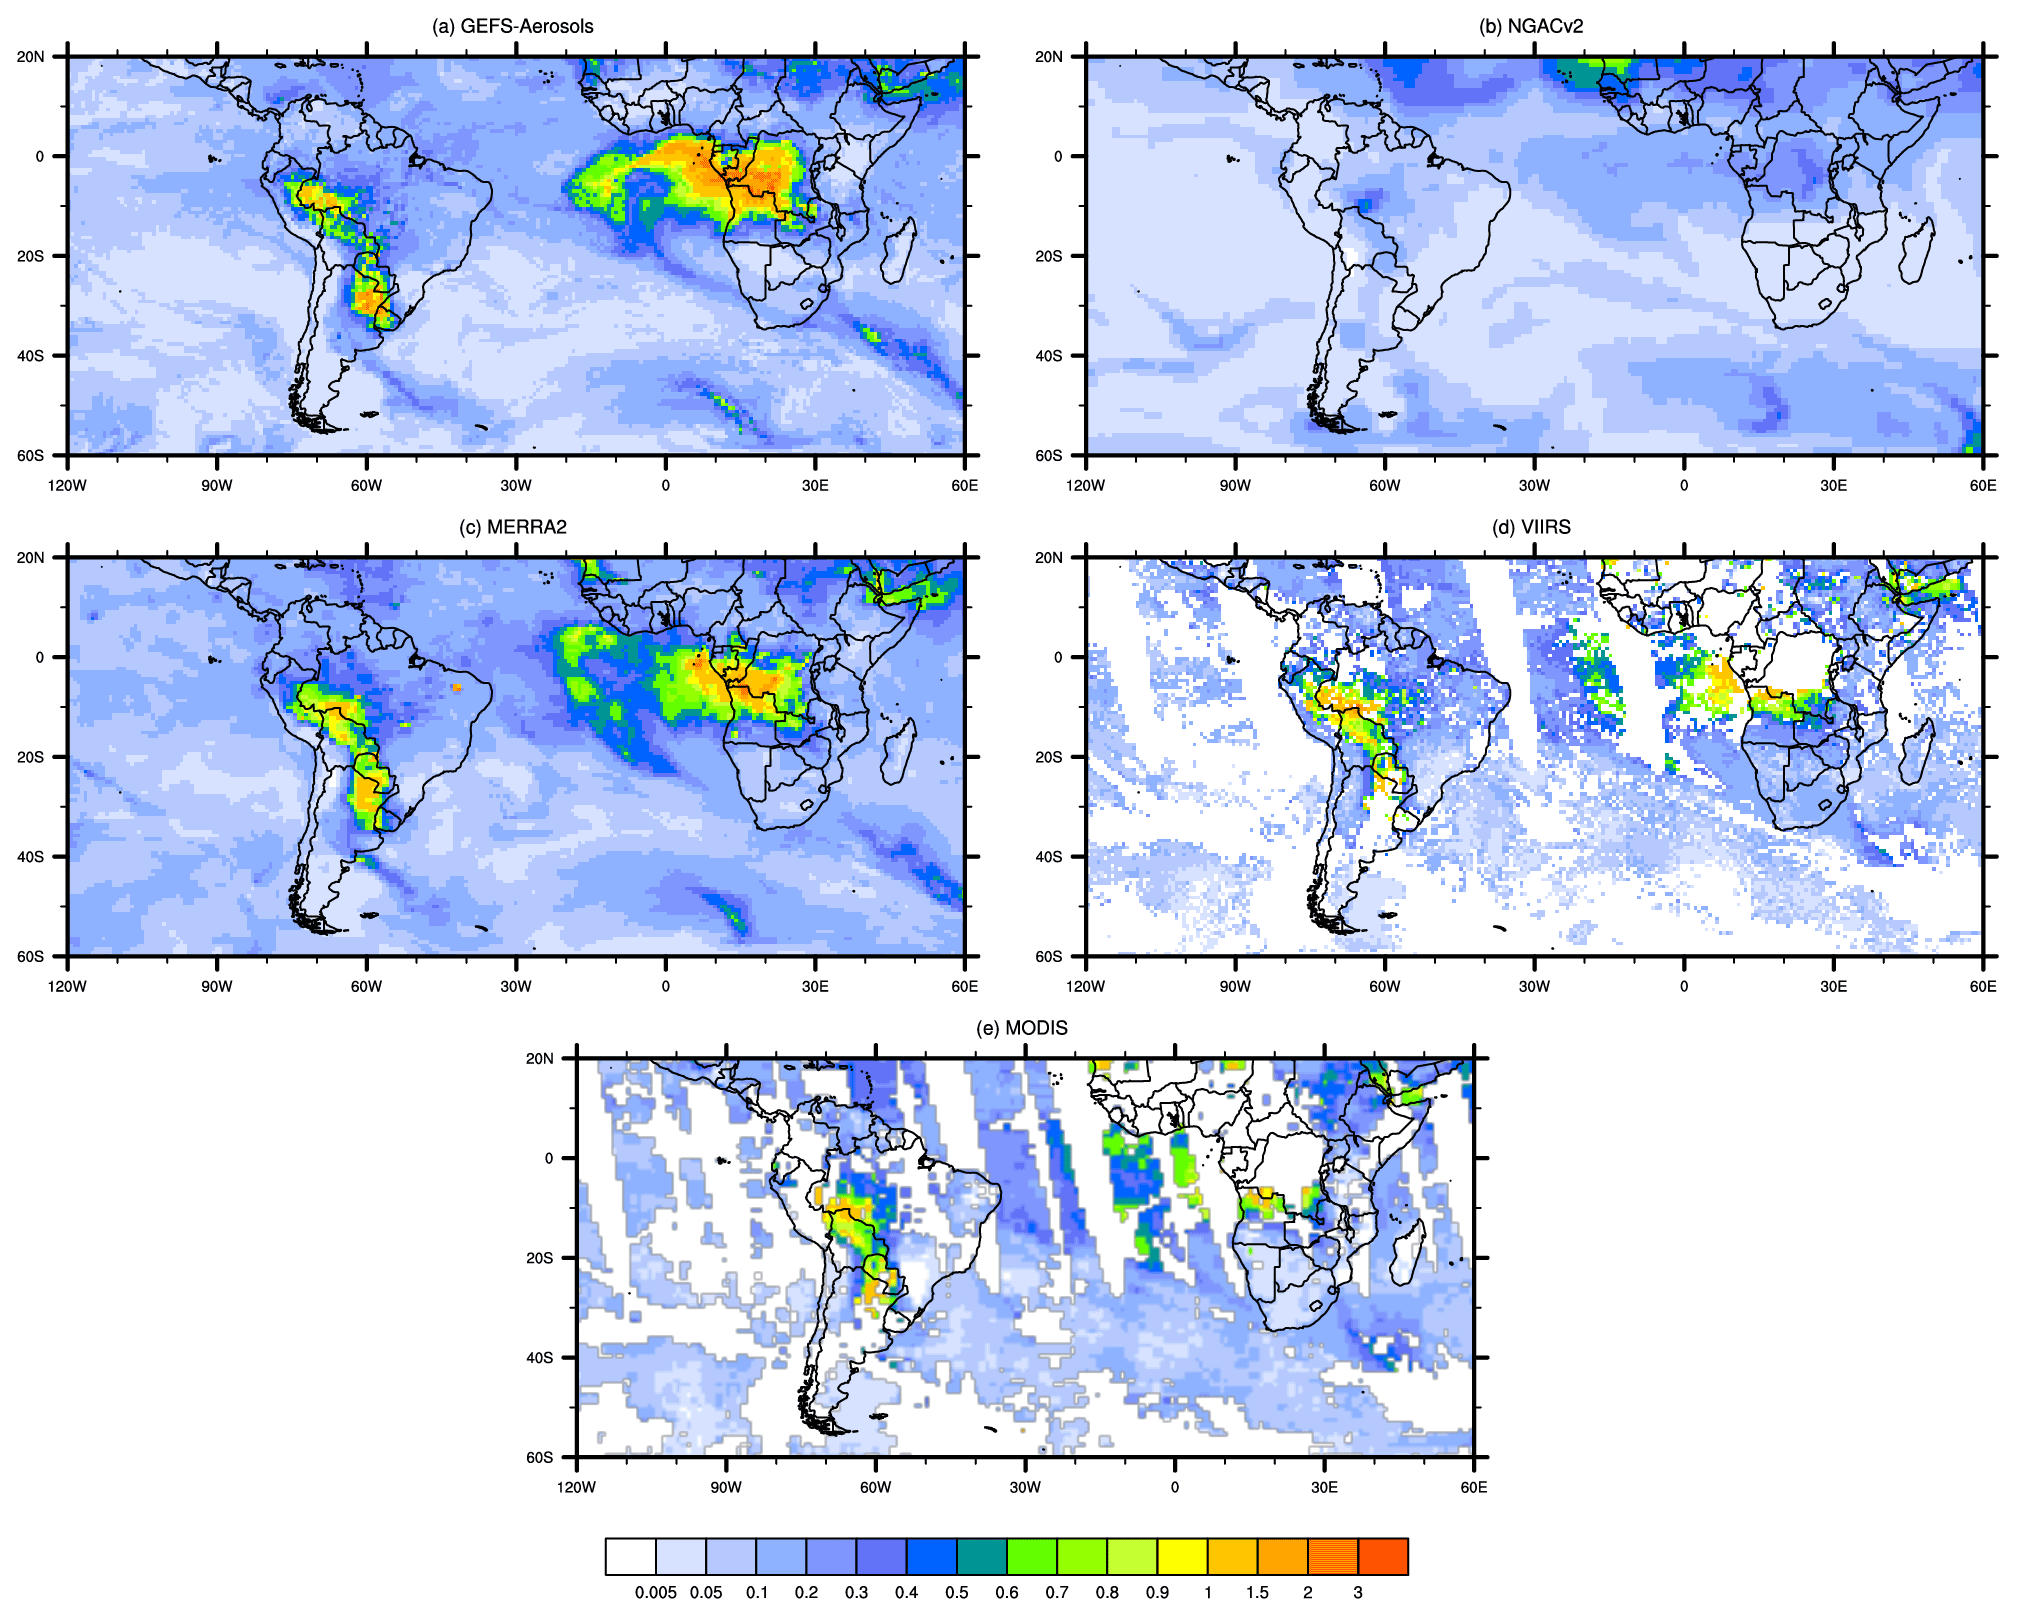
Figure 4Total AOD forecast on 25 August compared to the NGACv2 model, MERRA-2 reanalysis data, and satellite observations of VIIRS and MODIS. The 18:00 forecasts from both models for that day and daily satellite data are used in the figure. Satellite data gaps are in white.
Beyond the fires burning in South America, an even greater number of blazes on the African continent are observed by the satellite images at almost the same time in August 2019. Angola experienced almost 3 times more fires than Brazil in mid-August 2019. There were around 6000 fires in Angola, more than 3000 in Congo, and just over 2000 in Brazil, according to NASA satellite imagery (https://earthobservatory.nasa.gov/images/145421/building-a-long-term-record-of-fire, last access: 18 June 2022). One of the main large-scale aerosol features of Sub-Saharan Africa is the June-to-September biomass burning season in Angola, Congo, and Zambia (Bauer et al., 2019). Overall, the GEFS-Aerosols model reasonably simulates the major burning event on 25 August 2019 over southern Africa (Fig. 4) but overestimates the central African plume when compared to the MERRA-2 analysis. The satellite AOD retrievals of VIIRS and MODIS off the coast of central Africa are challenging due to screening by the stable stratiform cloud deck over the ocean that occurs during the fire season, creating less reliable coverage from these observational data. Nevertheless, we can still see consistent AOD enhancements over the fire source regions and surrounding areas for both GEFS-Aerosols and the observations. NGACv2, however, is quite different from the satellite observations and MERRA-2 analysis, underestimating the AOD by more than 50 %–90 % over the southern Africa fire source region and showing little obvious enhancement. Obviously, the updates in fire emission using the GBBEPx v3 emission and FRP by applying the 1-D plume rise scheme in the GEFS-Aerosols model show great improvements in the AOD forecast during the fire events compared to NGACv2 (Table 2).
Future work will explore the use of diurnal fire profiles based on historic Geostationary Operational Environmental Satellites-R Series (GOES-R) fire products applied to estimate biomass burning emissions to enhance forecast behavior. Additionally, a parameterization based on the fire weather index (FWI) to estimate biomass burning emissions on longer temporal scales may help to improve and extend the forecast of fire impacts.
4.1 Evaluation of global AOD
A real-time forecast was performed starting on 1 July 2019 at ∼ 25 km resolution and continuing to the present day using the GBBEPx v3 fire emissions with the plume rise module based on real-time FRP data.
We evaluated the GEFS-Aerosols model performance with the daily AERONET data globally. The locations of the 60 selected AERONET sites where these comparisons were made are listed in Table 1. It also indicates the correlation and RMSE of GEFS-Aerosols, ICAP, and NGACv2 AOD with respect to that of AERONET observation. The GEFS-Aerosols, NGACv2, and ICAP predictions are sampled at the same locations as the AERONET sites for these comparisons. Figure 5a and b show the correlation coefficients between daily total AOD observed by AERONET and the Day-1 forecast of model AOD from GEFS-Aerosols and NGACv2 for the period between 5 July and 30 November 2019. The correlation coefficients range from 0.5 to 0.9 for GEFS-Aerosols at most sites, except for several sites in South America, Africa, and East Asia near fire source regions, which are slightly lower than those of the ICAP. In contrast, the correlation coefficients of daily total AOD between the NGACv2 and AERONET observations are lower than 0.5 globally, even ranging from 0.1 to 0.3 at most sites. A more quantitative display of correlation coefficients for a selection of 60 AERONET sites for GEFS-Aerosols and NGACv2 is presented in Table 1. This comparison strongly indicates the improved performance of total AOD daily variation in GEFS-Aerosols prediction when compared to NGACv2. There are 20 sites (about 30 % of the site total) displaying highly correlated total AOD for the AERONET data and GEFS-Aerosols, with the correlation coefficients exceeding 0.7. In contrast, there is only 1 site with a correlation coefficient larger than 0.7 for NGACv2 model vs. AERONET, and 19 sites have correlation coefficients that are less than 0.2 for AERONET and NGACv2. Figure 5c shows the RMSE of GEFS-Aerosols and NGACv2 with respect to AERONET observation. Most of the RMSE values are below 0.25 in GEFS-Aerosols over North America, Europe, and Africa. However, the RMSE values in a lot of sites over Africa and Asia are above 0.3 in NGACv2. From Table 1, the ICAP results show the best performance in both the correlation and RMSE.
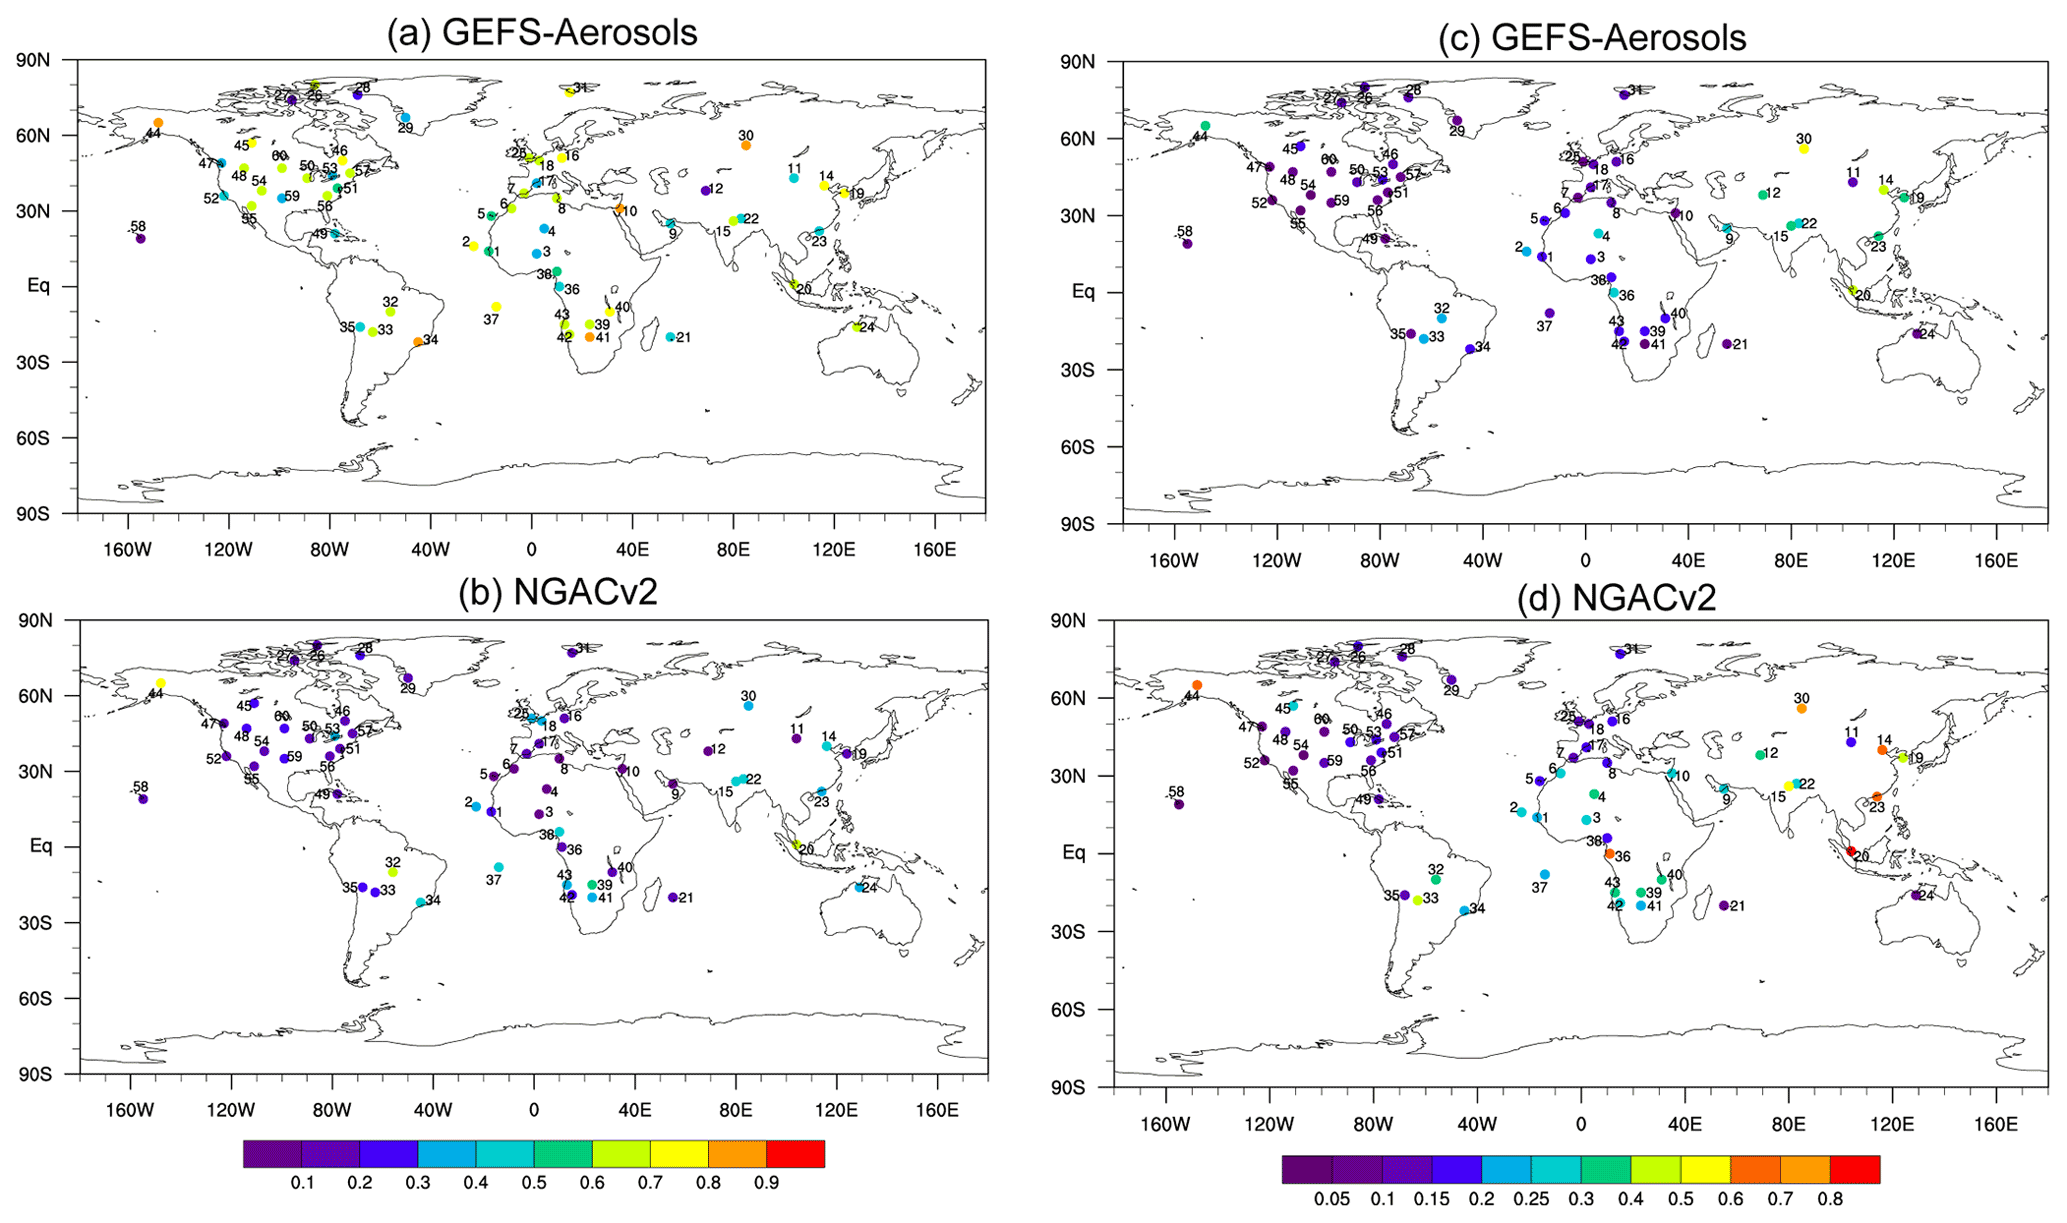
Figure 5Correlation coefficients and RMSE between AERONET daily total AOD observations and GEFS-Aerosols, ICAP, and NGACv2 for the period 5 July–30 November 2019. Correlation coefficients are at the 95 % confidence interval.
In addition to comparing to the AERONET data, Fig. 6 shows the Day-1 AOD prediction of GEFS-Aerosols and NGACv2 compared to the MERRA-2 reanalysis and MODIS observations averaged from July to November 2019. The GEFS-Aerosols prediction is able to capture the geographical features of AOD as represented by the MERRA-2 reanalysis data and MODIS satellite observations, such as the dust plumes over northern Africa and the Arabian Peninsula, biomass burning plumes in southern Africa, South America, northwestern North America and eastern Europe, polluted air over East and South Asia, and high-latitude sea-salt bands over the Southern Hemisphere. The high AOD over southern Africa and northern India is more comparable to the MODIS observation than that of NGACv2. As pointed out by Bhattacharjee et al. (2018), the NGACv2 predictions exhibit widespread underestimates over most of these high AOD regions, such as East Asia, and fire source regions of southern Africa, eastern Europe, and Southeast Asia.

Figure 6Day-1 AOD prediction averaged during 5 July–30 November 2019 for GEFS-Aerosols and NGACv2 compared to MERRA-2 reanalysis and MODIS.
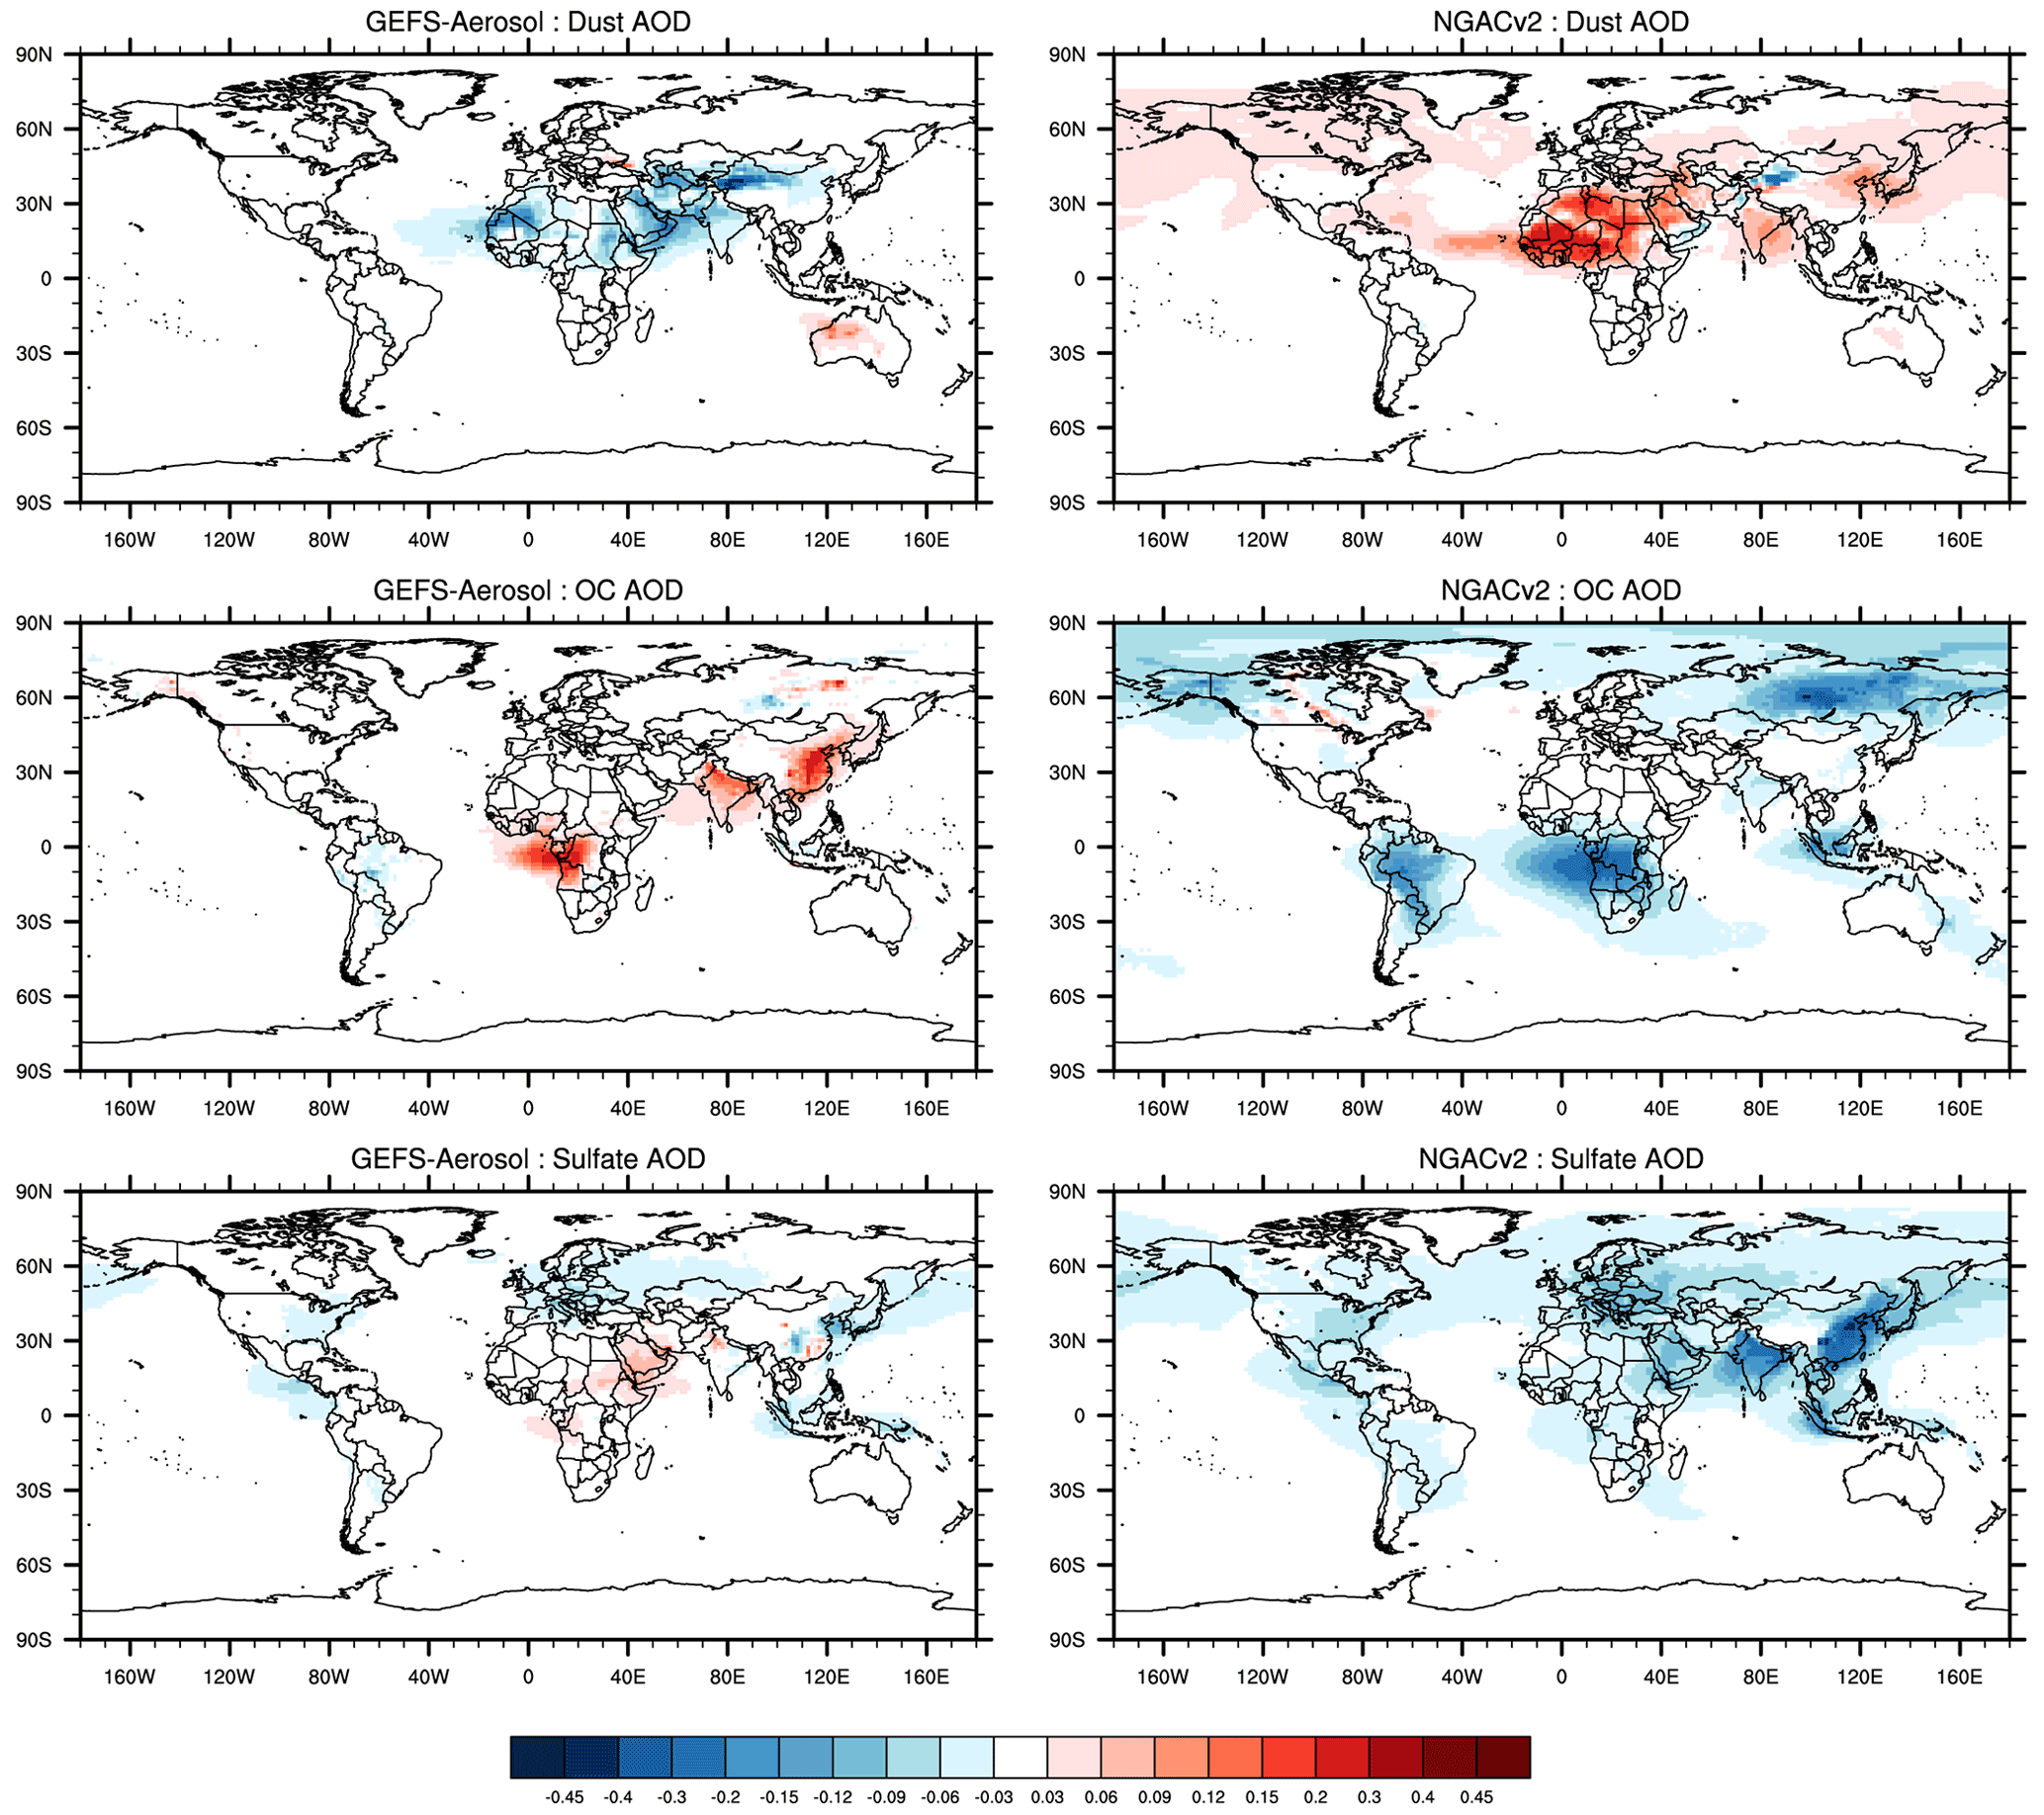
Figure 7Day-1 AOD forecast biases of GEFS-Aerosols and NGACv2 compared to MERRA-2 averaged during 5 July–30 November 2019 for dust, OC, and sulfate.
Figure 7 indicates the Day-1 AOD forecast biases of GEFS-Aerosols and NGACv2 with respect to MERRA-2 reanalysis between 5 July and 30 November 2019 for dust, OC, and sulfate. The predicted dust AOD in GEFS-Aerosols is quite comparable to that of MERRA-2 results, with only small negative biases of ∼ 0.08 over Asia and the downwind areas of African dust source regions of the Atlantic and South Asia (Fig. 8a). GEFS-Aerosols has some small positive biases relative to MERRA-2 of ∼ 0.1 over Australia (in red). In contrast, dust AOD in NGACv2 (Fig. 8b) shows large overpredictions of MERRA-2 over Africa with a maximum value of ∼ 0.45 and about 0.02–0.05 over large areas of Asia and the North Pacific and North America. Wang et al. (2018) also showed that the predicted dust AOD in NGACv2 over northwestern Africa is much larger than GEFS-Aerosols, MERRA-2, and MODIS observations.
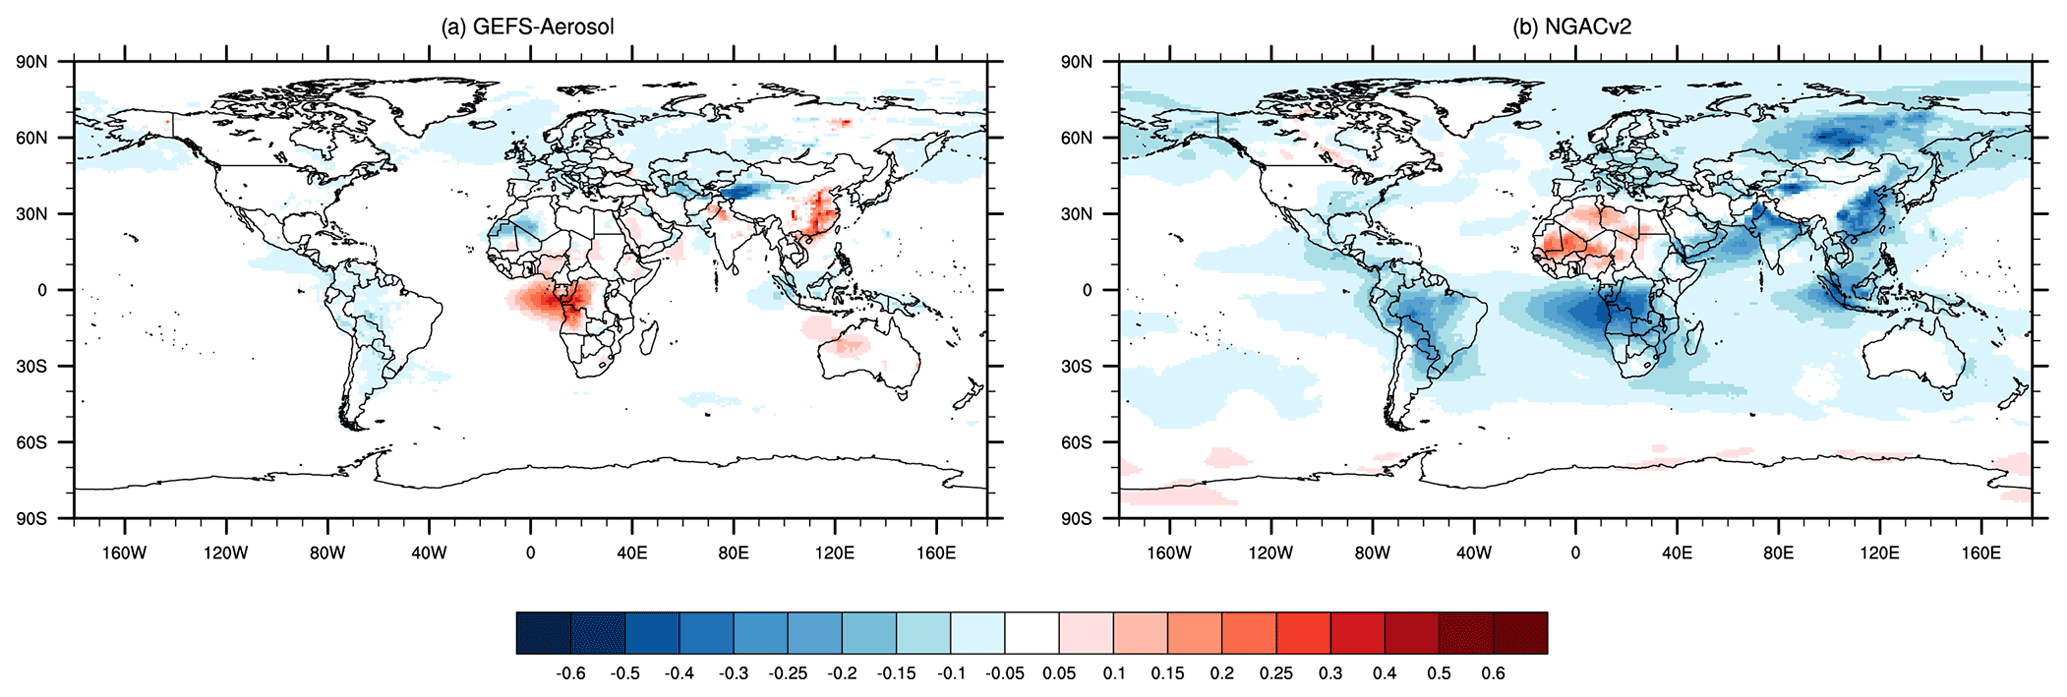
Figure 8Differences of GEFS-Aerosols and NGACv2 Day-1 predictions of total AOD compared to MERRA-2 reanalysis averaged during 5 July–30 November 2019.
OC is a major component emitted from wildfires, and OC AOD is a good indicator of the performance of fire impacts. GEFS-Aerosols OC AOD shows smaller biases compared to the MERRA-2 reanalysis than those of NGACv2 (Fig. 7c and d). Positive biases in GEFS-Aerosols OC AOD of less than 0.2 occur mainly over southern Africa, East Asia, South Asia, and the Middle East. The GEFS-Aerosols overprediction of OC AOD compared to MERRA-2 over eastern China may be associated with the overestimate of anthropogenic emissions by using CEDS 2014, since this is not a major fire source region. GEFS-Aerosols shows small negative biases, of less than 0.1, over South America and central and eastern Europe. Overall, the biases of OC AOD in NGACv2 relative to MERRA-2 are dominated by underprediction globally, with the largest biases of more than 0.3 over major fire source regions of southern Africa, the Amazon region of South America, Southeast Asia, and Siberia (Fig. 7d).
For sulfate AOD, the GEFS-Aerosols forecast overpredicts MERRA-2 by ∼ 0.08 over eastern Africa, the Middle East, and southeastern China, where SO2 anthropogenic emissions are dominant. Small GEFS-Aerosols underpredictions of less than 0.1 AOD are seen over broad areas of the Northern Hemisphere, such as eastern North America and its downwind areas over the North Atlantic and western Europe as well as East Asia and its downwind areas (Fig. 7e). As in the case of OC AOD, the global sulfate AOD in MERRA-2 is underpredicted significantly by NGACv2 (Fig. 7f). The areas with the largest NGACv2 vs. MERRA-2 sulfate bias are mainly over the major anthropogenic source regions, such as India and eastern China, where the underestimates exceed 0.18, and in the eastern US and western Europe, where they exceed 0.1.
The summary comparison of the GEFS-Aerosols and NGACv2 Day-1 total AOD prediction biases with respect to MERRA-2 reanalysis between 5 July and 30 November 2019 is shown in Fig. 8. Generally, the GEFS-Aerosols model is able to reproduce the total AOD very well, much better than NGACv2 (see Fig. 8a and b). The GEFS-Aerosols overpredictions over eastern China and the Southern Hemisphere (∼ 0.2–0.3) are mainly due to anthropogenic OC and SO2 for the former and fire emissions of OC for the latter, respectively. Both GEFS-Aerosols and NGACv2 total AOD have small negative biases (∼ 0.3–0.5) relative to MERRA-2 over the northwestern China dust source region. Negative biases of GEFS-Aerosols vs. MERRA-2 in South America may be caused by inadequate fire emissions, and in Europe that may be related to anthropogenic SO2 emissions. The spatial locations of biases in GEFS-Aerosols with respect to MERRA-2 reanalysis total AOD (Fig. 8a) are similar to the comparisons to the individual aerosol species from MERRA-2 discussed above (Fig. 7a, c, and e). The NGACv2 total AOD is biased low relative to MERRA-2 almost globally, except for the overprediction over northern Africa due to dust (Fig. 8b). The largest NGACv2 total AOD biases are mainly caused by the underpredictions of fires over the fire source regions of South America, southern Africa, Southeast Asia and central and eastern Europe and the anthropogenic source regions over eastern China, India, and eastern North America, with maximum total AOD biases reaching more than 0.5.
4.2 Evaluation of AOD associated with fire events
We choose some sites near the major fire source region, which have available observation data for the duration of this study and hold long records based on various previous studies. Figure 9 indicates the total AOD time series of AERONET observations compared against ICAP, NGACv2, and GEFS-Aerosols model predictions at the four AERONET sites near the fire source regions of South America during the period of 1 July–30 November 2019. At the Alta Floresta site, which is in the middle of the Amazon fire source region, the daily AOD variations of both the ICAP and GEFS-Aerosols Day-1 predictions are quite consistent with those of the AERONET data, especially as they are able to reproduce two peaks in AOD enhancements in late August and late September caused by fire plumes (Fig. 9a). The correlation (RMSE) is 0.66 (0.23), 0.9 (0.12), and 0.68 (0.31) for GEFS-Aerosols, ICAP, and NGACv2. Obviously, NGACv2 results underpredict AERONET observations almost throughout the whole period, with a significantly larger bias than GEFS-Aerosols or ICAP, and the two August–September peaks in total AOD enhancements are essentially missed in the NGACv2 prediction.
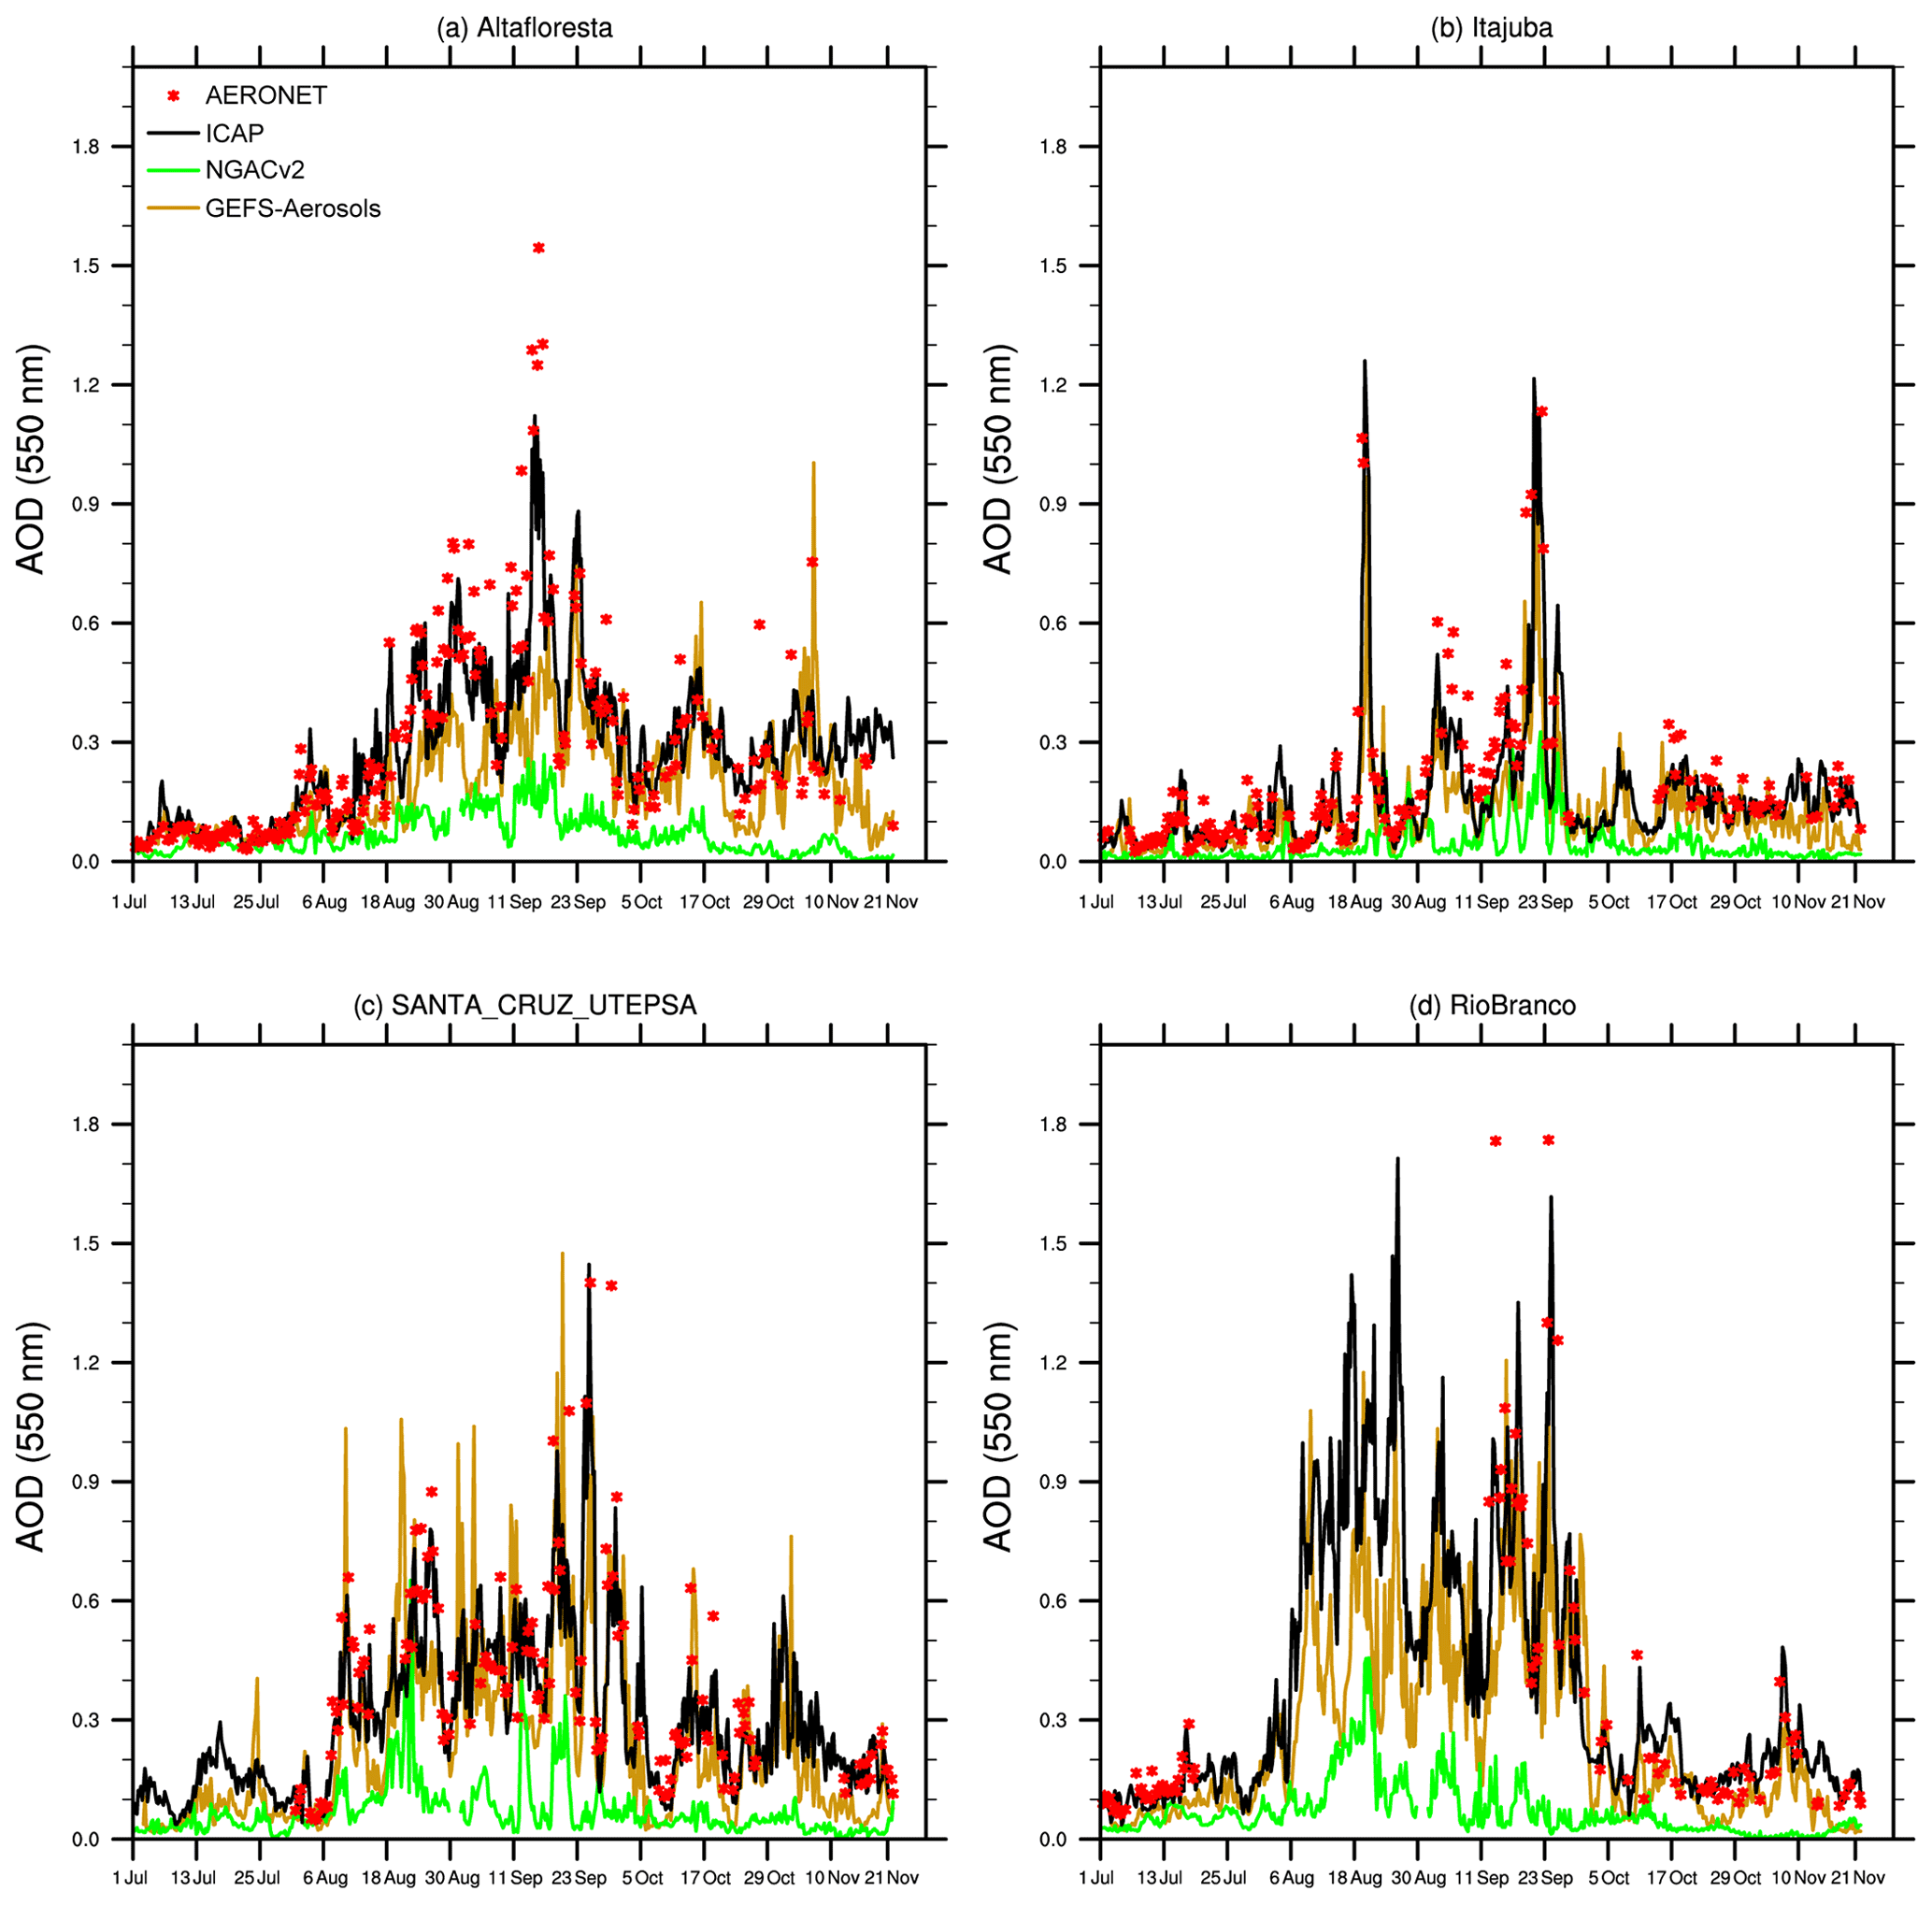
Figure 9Day-1 AOD forecasts of GEFS-Aerosols, ICAP, and NGACv2 verified against AERONET sites in South America during 5 July–30 November 2019.
The Itajuba site is located southeast of the Alta Floresta site and in the downwind areas of the Amazon fire source region. The total AOD time series of GEFS-Aerosols prediction match closely those of ICAP and AERONET during most of the time period, though there are some discrepancies from the end of August to mid-September, when GEFS-Aerosols underpredicts the high AOD episode (Fig. 9b). GEFS-Aerosols is able to predict the two AOD enhancements in mid-October and early November, which is quite comparable as ICAP. The correlation (RMSE) is 0.856 (0.15) and 0.936 (0.09) for GEFS-Aerosols and ICAP with respect to AERONET at the site of Itajuba and only 0.451 (0.22) for NGACv2. The NGACv2 prediction also generally underestimates the observations at this site too (Fig. 9b). The NGACv2 results are closer to ICAP, GEFS-Aerosols, and AERONET before August, and NGACv2 shows a slight increase in total AOD in early September, but the NGACv2 AOD magnitude is much lower than the AERONET magnitude by about a factor of 5–7 from mid-August onward.
Located in the southern part of the Amazon fire region, the site of Santa Cruz Utepsa is south of the Alta Floresta site. The correlation (RMSE) values of GEFSA-Aerosols and ICAP with respect to AERONET are 0.8 (0.18) and 0.88 (0.13), respectively, which shows better performance than those of NGACv2, with 0.3 (0.39) at this site in predicting the total AOD through the 5 months from July to November (Fig. 9c). The model not only reproduces the total AOD temporal variation of the AERONET results, but also captures several fluctuations of high AOD in August and September caused by Amazon fire events. Again, some of the fluctuations in total AOD were captured by the NGACv2 prediction, but the modeled AOD magnitudes are 2–4 times lower than the observations.
The last site of Rio Branco is also located in the Amazon fire source region, but to the west of the Alta Floresta site. There are some missing data at this site for the AERONET total AOD from mid-July to mid-September (Fig. 9d). During this period, the GEFS-Aerosols prediction is slightly lower than ICAP, by about 5 %–10 %. Both ICAP and GEFS-Aerosols total AOD matches the AERONET variations well when the AERONET data are available again from mid-September. Several peaks of total AOD are also captured by GEFS-Aerosols in mid-September and early November. The NGACv2 prediction shows enhanced total AOD in mid-August, with low biases by more than 2–3 times compared to ICAP and GEFS-Aerosols. For other enhancements of total AOD after October, the NGACv2 results completely miss the fire events and do not show any fluctuations. The correlation (RMSE) is 0.80 (0.24) and 0.90 (0.17) for GEFS-Aerosols and ICAP with respect to AERONET at the site of Rio Branco and only 0.51 (0.44) for NGACv2.
We also evaluate the total AOD time series of AERONET against ICAP, NGACv2, and GEFS-Aerosols for fire regions of central and southern Africa. The comparisons at seven AERONET sites from July to November are shown in Fig. 10. Generally, the GEFS-Aerosols predictions are able to capture the daily total AOD variation measured by AERONET. At the site of Misampfu, the GEFS-Aerosols mode is somewhat better than that of ICAP in predicting the peaks of high AOD. The correlation coefficients at the sites of Ascension Island and Lubango are much higher than those of ICAP (see Table 1). While both GEFS-Aerosols and ICAP overpredicted the total AOD most of the time throughout the 3 months at the Bamenda station located north of the major African fire source region, the NGACv2 total AOD forecast shows underprediction at most of the AERONET sites in this region. Meanwhile, NGACv2 and ICAP predictions are not consistent with AERONET either, especially for several observed high peaks which are not reproduced by the model results (e.g., Gabon). At the remote site of Ascension Island located west of the African fire source region, GEFS-Aerosols and ICAP are able to capture the AOD enhancements in mid-August and show the best performances of the three different models (see Table 1). For other sites that are located in the fire source region, such as Monguinn, Misamptu, Maun Tower, and Lubango, the prediction of the GEFS-Aerosols model shows higher correlations of 0.68, 0.79, 0.84, and 0.71 than those of NGACv2 at 0.51, 0.26, 0.29, and 0.35. The RMSE values of GEFS-Aerosols are 0.18, 0.15, 0.10, and 0.15, which are much lower than the NGACv2 values of 0.32, 0.34, 0.23, and 0.32. This suggests that GEFS-Aerosols better matches the observed temporal variation of total AOD than NGACv2. One peak in early August at the Monguinn site, one peak in mid-September at the Misampfu site, two peaks in early August and early September at the Maun Tower site, and one enhancement in August at Lubango are all predicted by the GEFS-Aerosols model. The ICAP forecasts show lower biases against the AERONET total AOD for predicting these peaks, while none of these peaks is captured by NGACv2. GEFS-Aerosols shows slight overpredictions in mid-July and late August for Gabon and early August for Lubango.
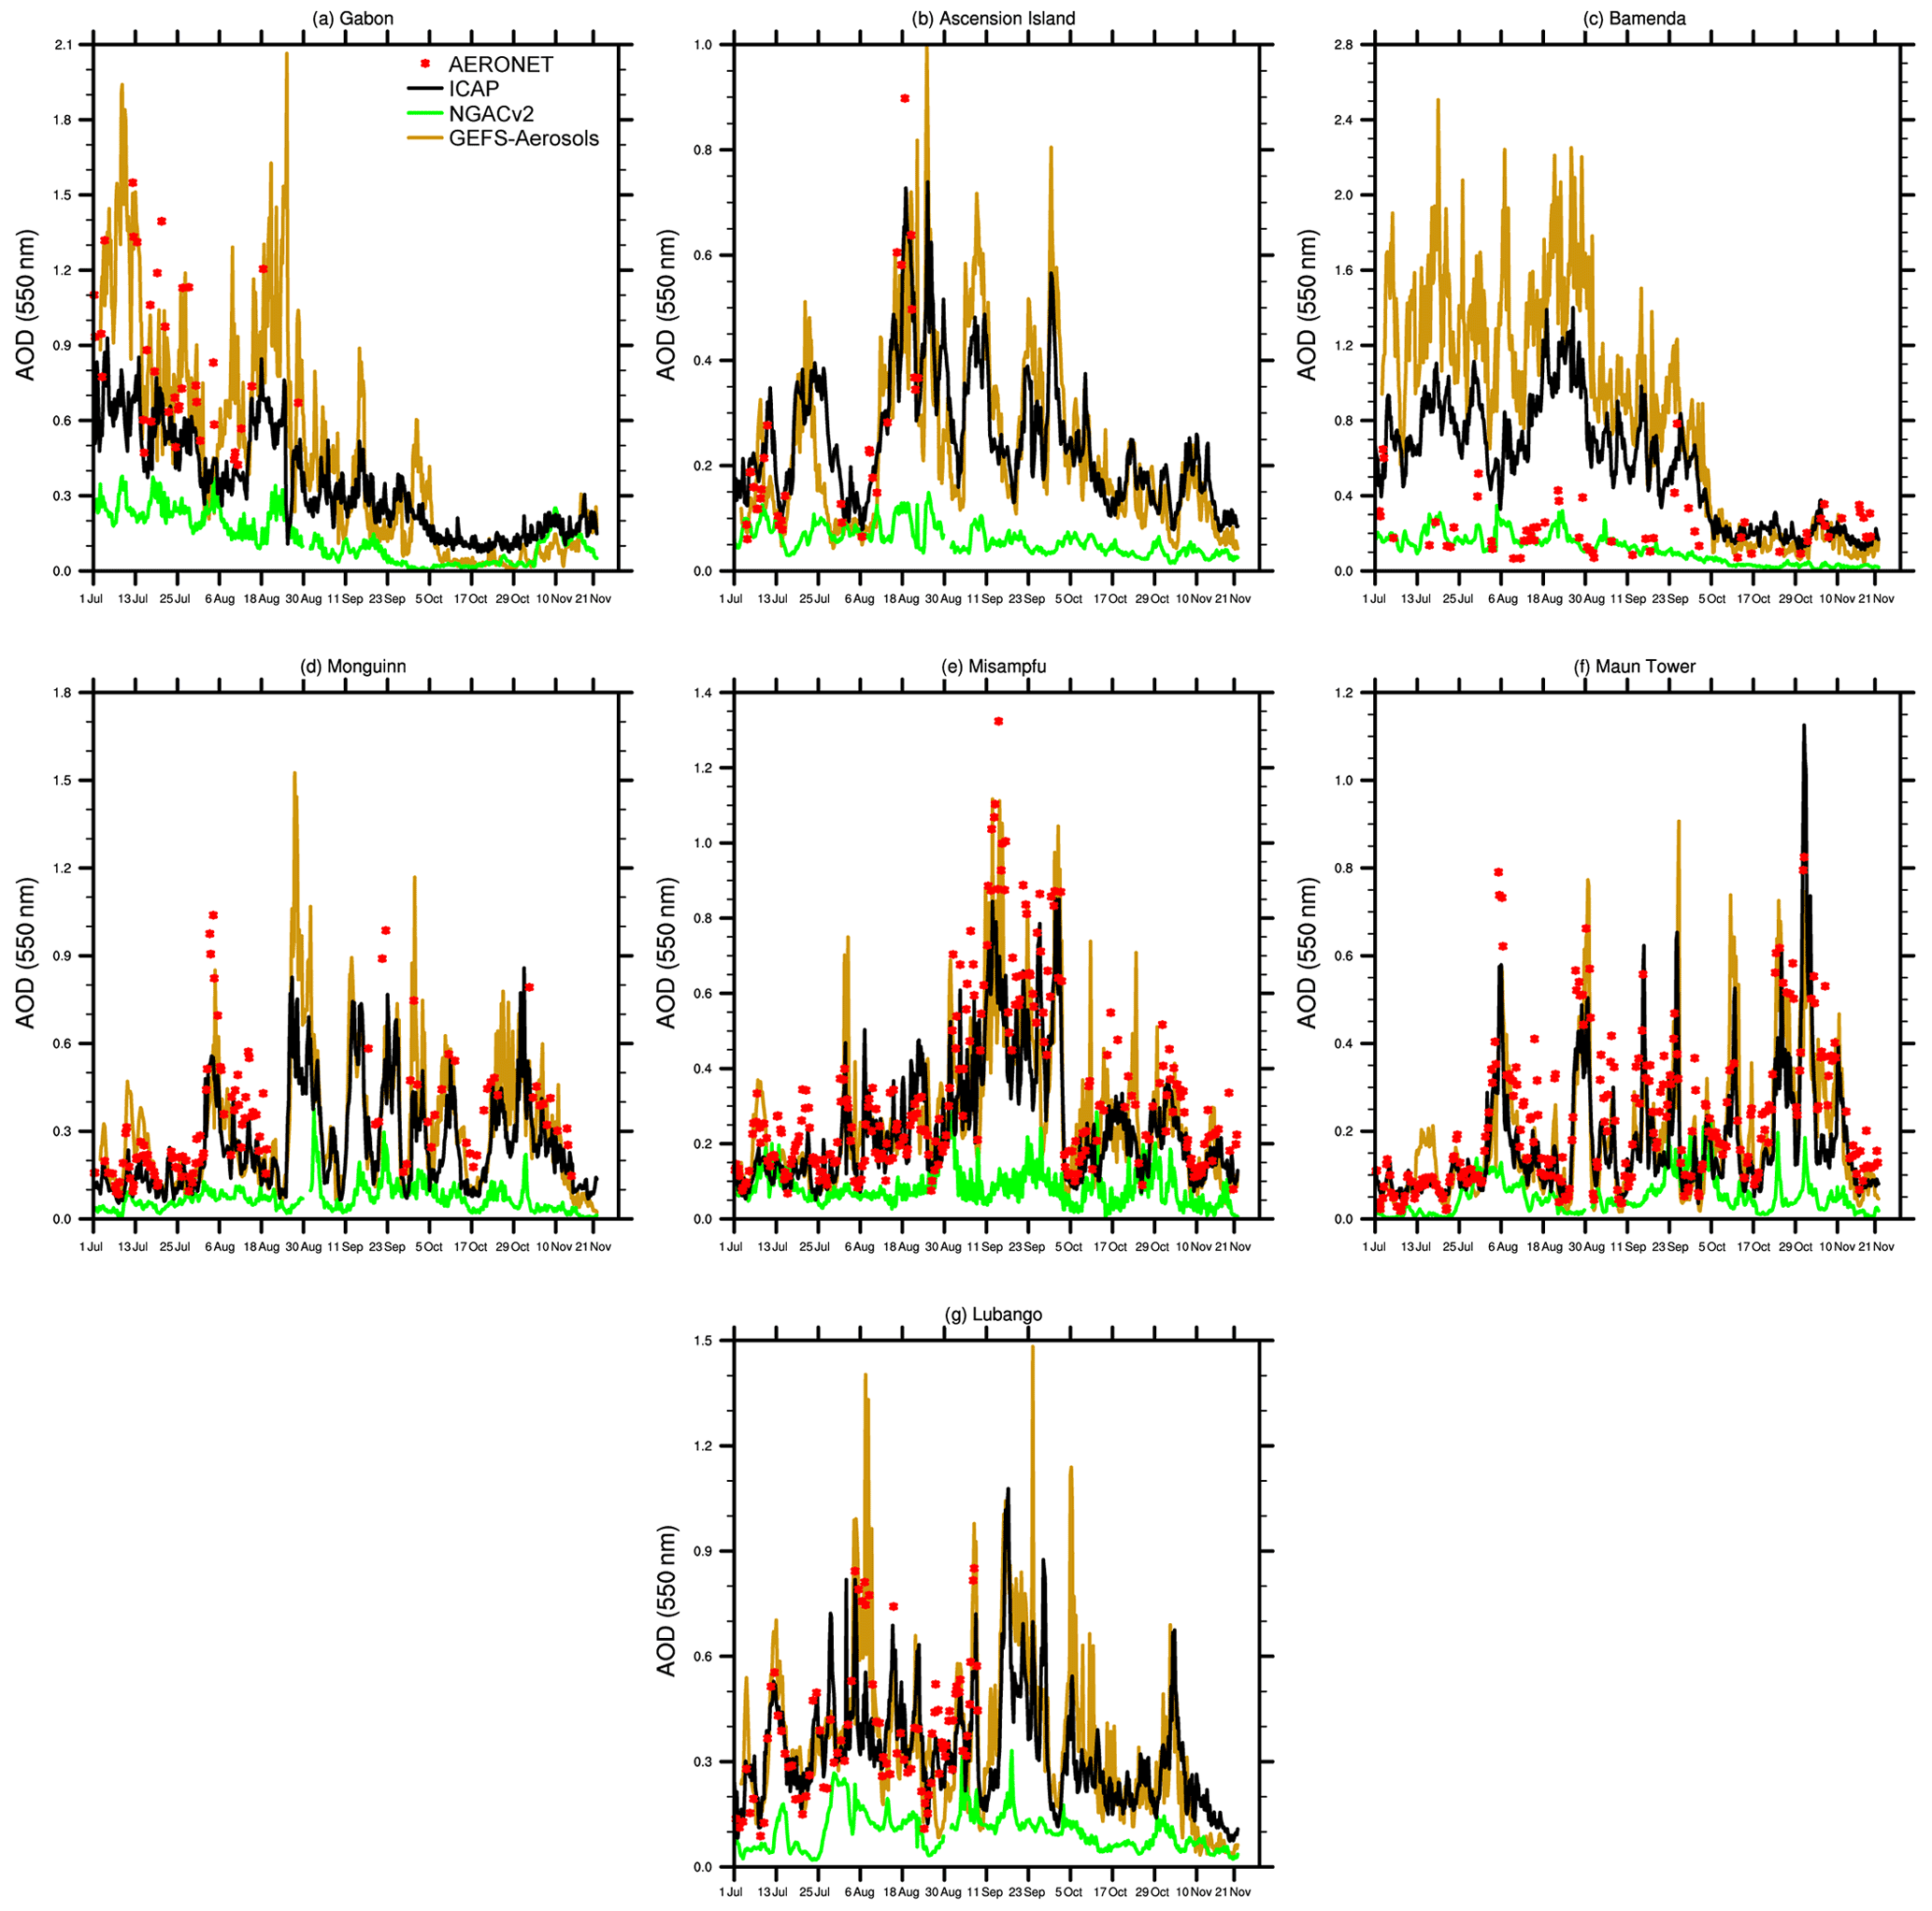
Figure 10Day-1 AOD forecasts of GEFS-Aerosols, ICAP, and NGACv2 verified against AERONET sites in Africa during 5 July–30 November 2019.
4.3 Evaluation of AOD associated with dust events
Thirteen AERONET sites inside the major dust source regions of western northern Africa, Asia, and the Middle East and surrounding areas have available data from July to November 2019. The total AOD time series of GEFS-Aerosols, ICAP, and NGACv2 at six of these sites are shown in Fig. 11. Overall, the GEFS-Aerosols model is able to closely predict the observed total AOD variation, especially at the sites of Banizoumbu, Tenerife, Saada, Ben Salem, Granada, and Sede Boker, with much better performance than those of NGACv2 according to the correlation (RMSE) values in Table 1 of GEFS-Aerosols at 0.74 (0.15), 0.77 (0.07), 0.76 (0.14), 0.82 (0.07), 0.85 (0.09), and 0.73 (0.08) vs. NGACv2 at 0.33 (0.24), 0.25 (0.18), 0.25 (0.26), 0.25 (0.23), 0.21 (0.16), and 0.19 (0.14). In addition to NGACv2's overprediction at the sites of Ben Salem and Granada, it does not accurately capture observed temporal variations of total AOD at these sites.
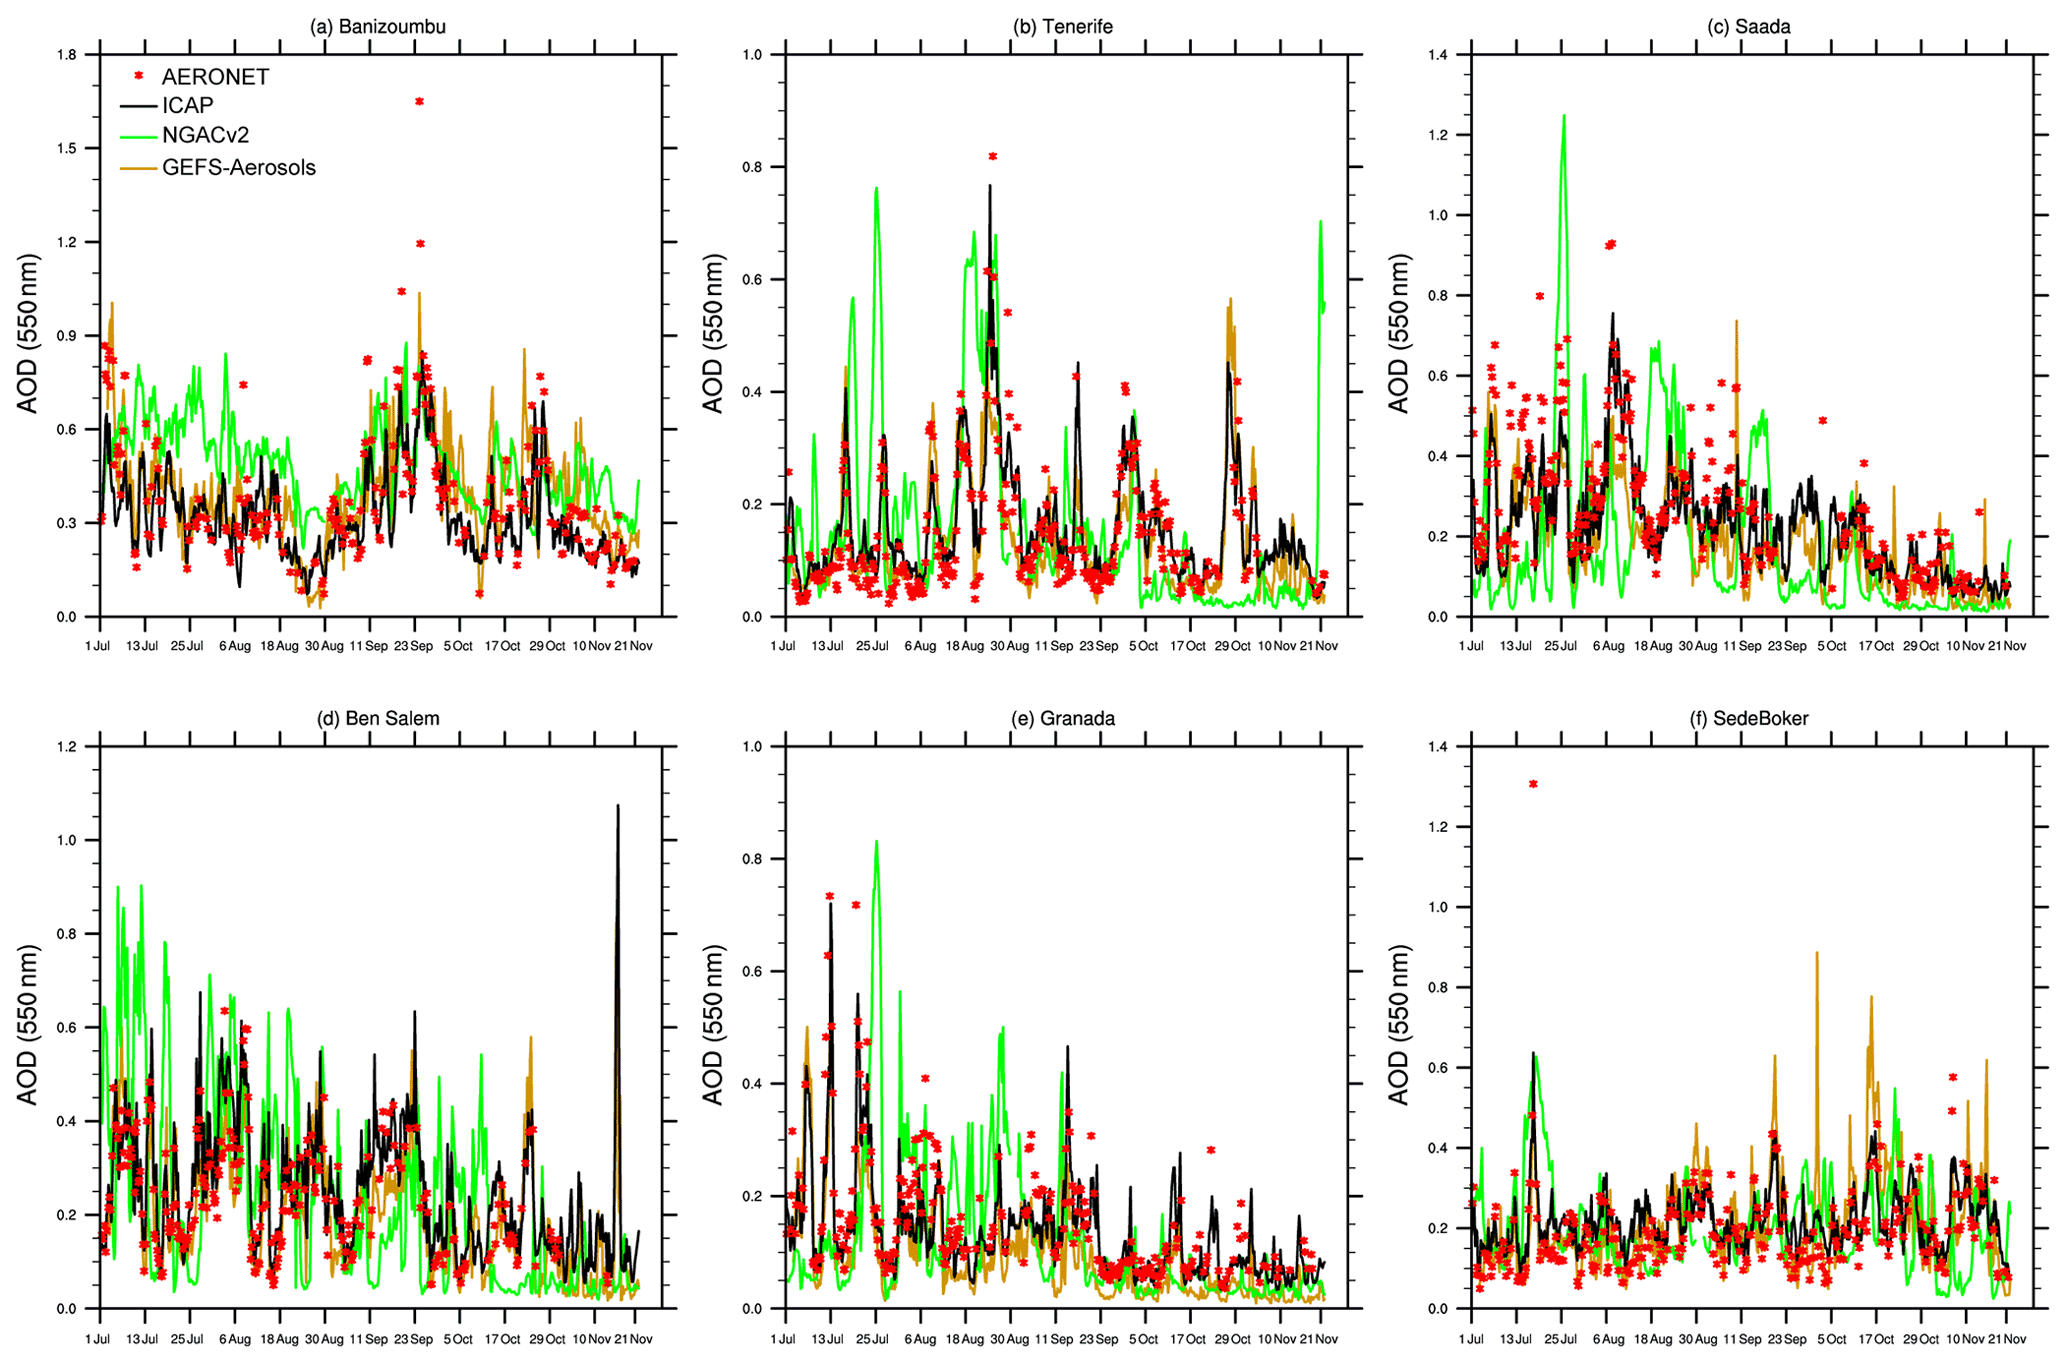
Figure 11Day-1 AOD forecasts of GEFS-Aerosols, ICAP, and NGACv2 verified against AERONET sites in dust source regions and surrounding downwind areas during 5 July–30 November 2019.
We compare the daily AERONET total AOD to the 1 d forecasts of total AOD from GEFS-Aerosols and NGACv2 at the AERONET sites of Cape Verde, Tamanrassett, and Tenerife located in the dust source region over northern Africa in Fig. 12. The slope of the linear regression of AERONET total AOD vs. GEFS-Aerosols is quite different from that of NGACv2 at the site of Tamanrassett, which is located in southern Algeria and in the middle of the Saharan dust source region. The GEFS-Aerosols linear regression slope is much closer to 1 than that of NGACv2, and the R2 in the NGACv2 model is lower by a factor of 4 than that of the GEFS-Aerosols model at this site. At the other two sites of Cape Verde and Tenerife, which are in the downwind area west of the African dust source region, the slopes of the linear regressions for GEFS-Aerosols are also much closer to 1 than those of the NGACv2 model. The NGACv2 model, as evidenced by the R2 values, is more poorly correlated with AERONET than the GEFS-Aerosols prediction. The R2 values of GEFS-Aerosols are 0.50, 0.33, and 0.59 at these sites, which better captures the dust transport in the downwind areas west of the African dust source region than the NGACv2 model at 0.19, 0.08, and 0.06. The GEFS-Aerosols model uses the FENGSHA dust scheme, which is quite different to the GOCART dust scheme used in NGACv2, which shows significant improvements in the dust AOD predictions.
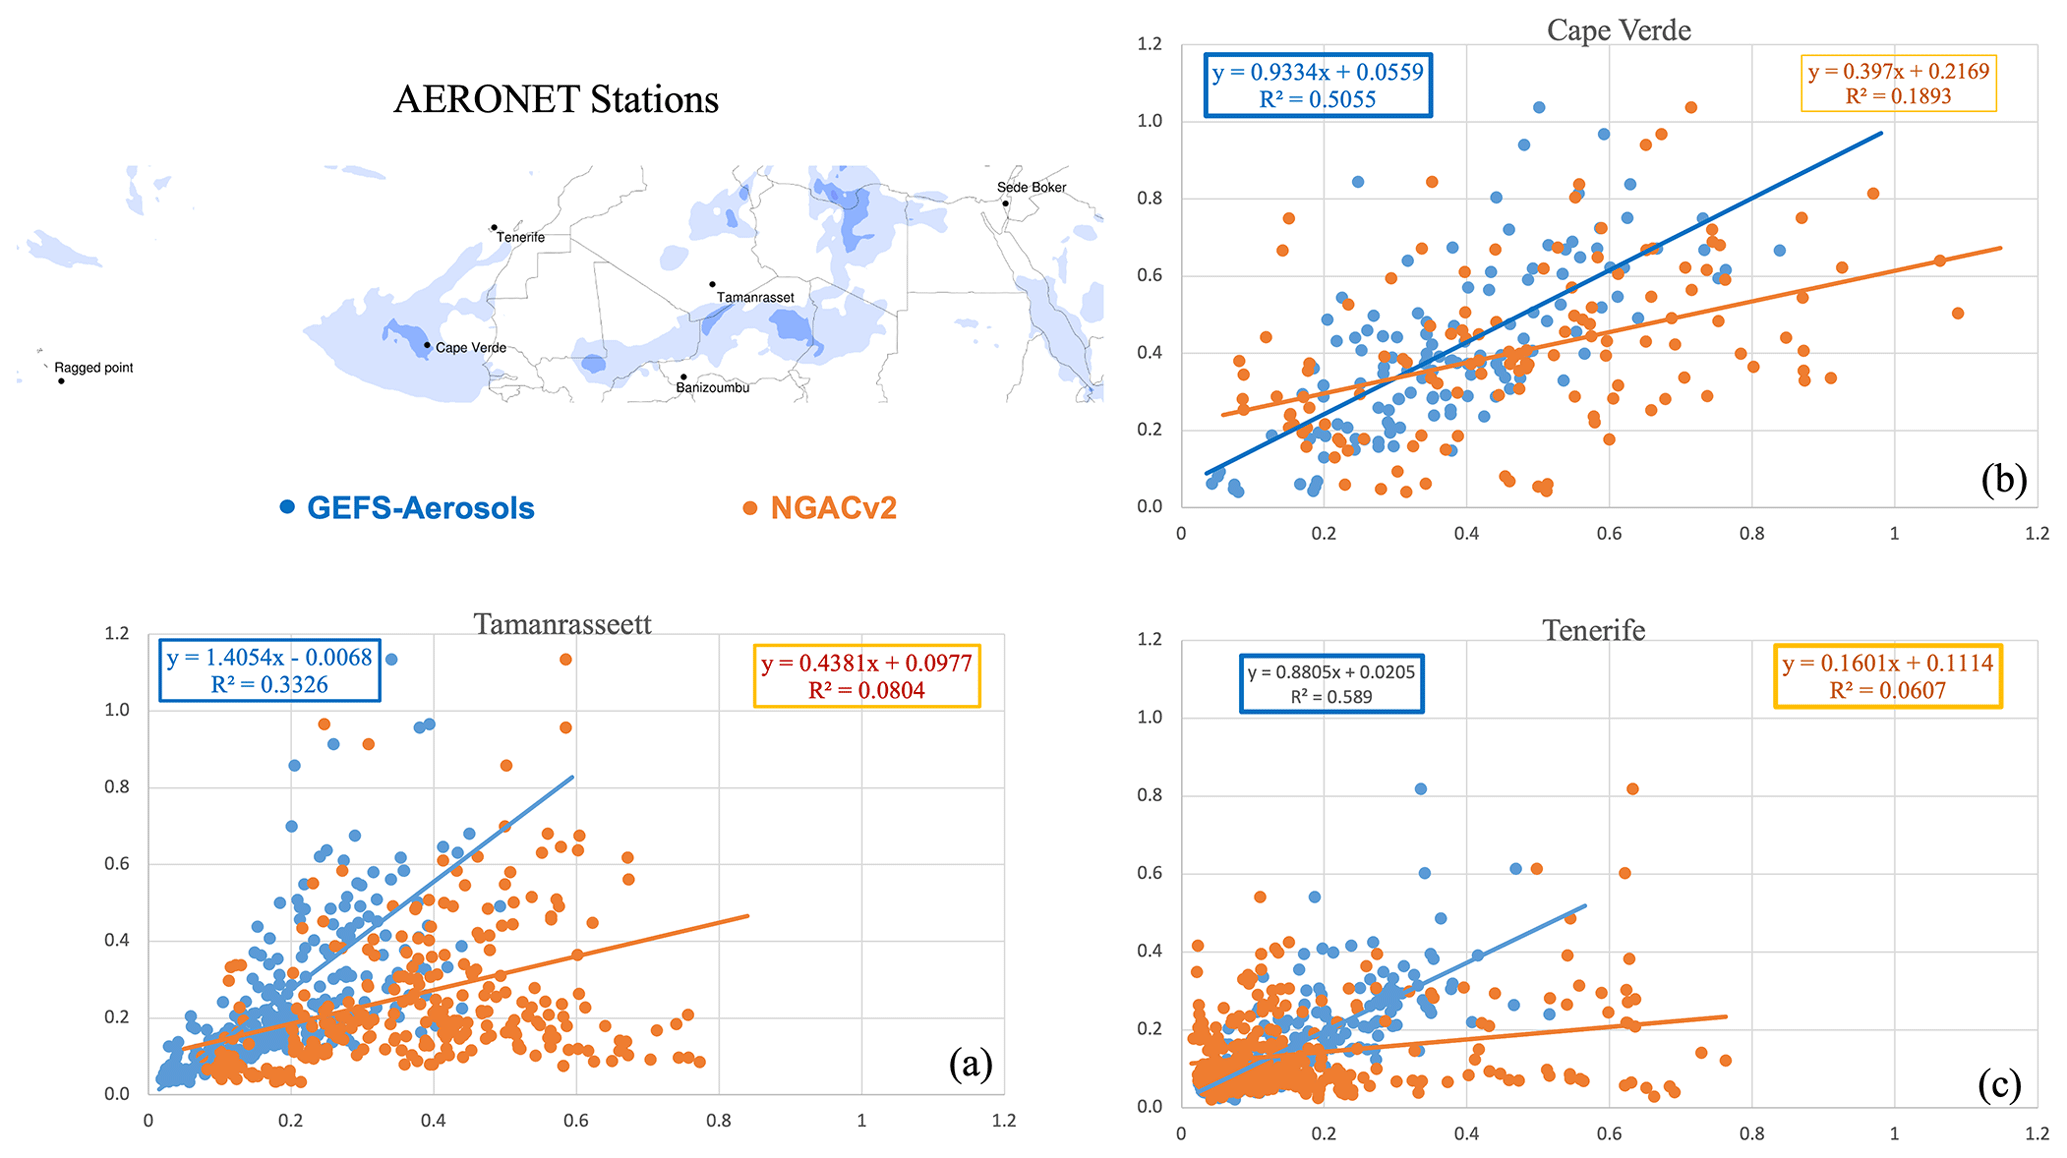
Figure 12Daily AERONET total AOD vs. modeled total AOD from GEFS-Aerosols (blue) and NGACv2 (orange) at the AERONET sites of (a) Tamanrassett, (b) Cape Verde, and (c) Tenerife with linear regression fits.
4.4 Evaluation of major regional averages
Figure 13 shows Day-1 predictions of total AOD time series by GEFS-Aerosols and NGACv2 compared against the MERRA-2 reanalysis averaged over nine major global regions from August 2019 to March 2020. The comparison clearly shows the consistency between GEFS-Aerosols and the MERRA-2 reanalysis over most of these nine regions, especially northern Africa, the North Atlantic, southern Africa, and the South Atlantic, with only minor discrepancies during these 8 months. The total AOD is dominated by dust in northern Africa and fire emissions in southern Africa. The aerosols emitted from dust and fire regions and their long-range transport play important roles in impacting the total AOD over the North and South Atlantic oceans. The good agreement with MERRA-2 shows that GEFS-Aerosols captures the emissions and transport of dust and fire emissions in these regions.
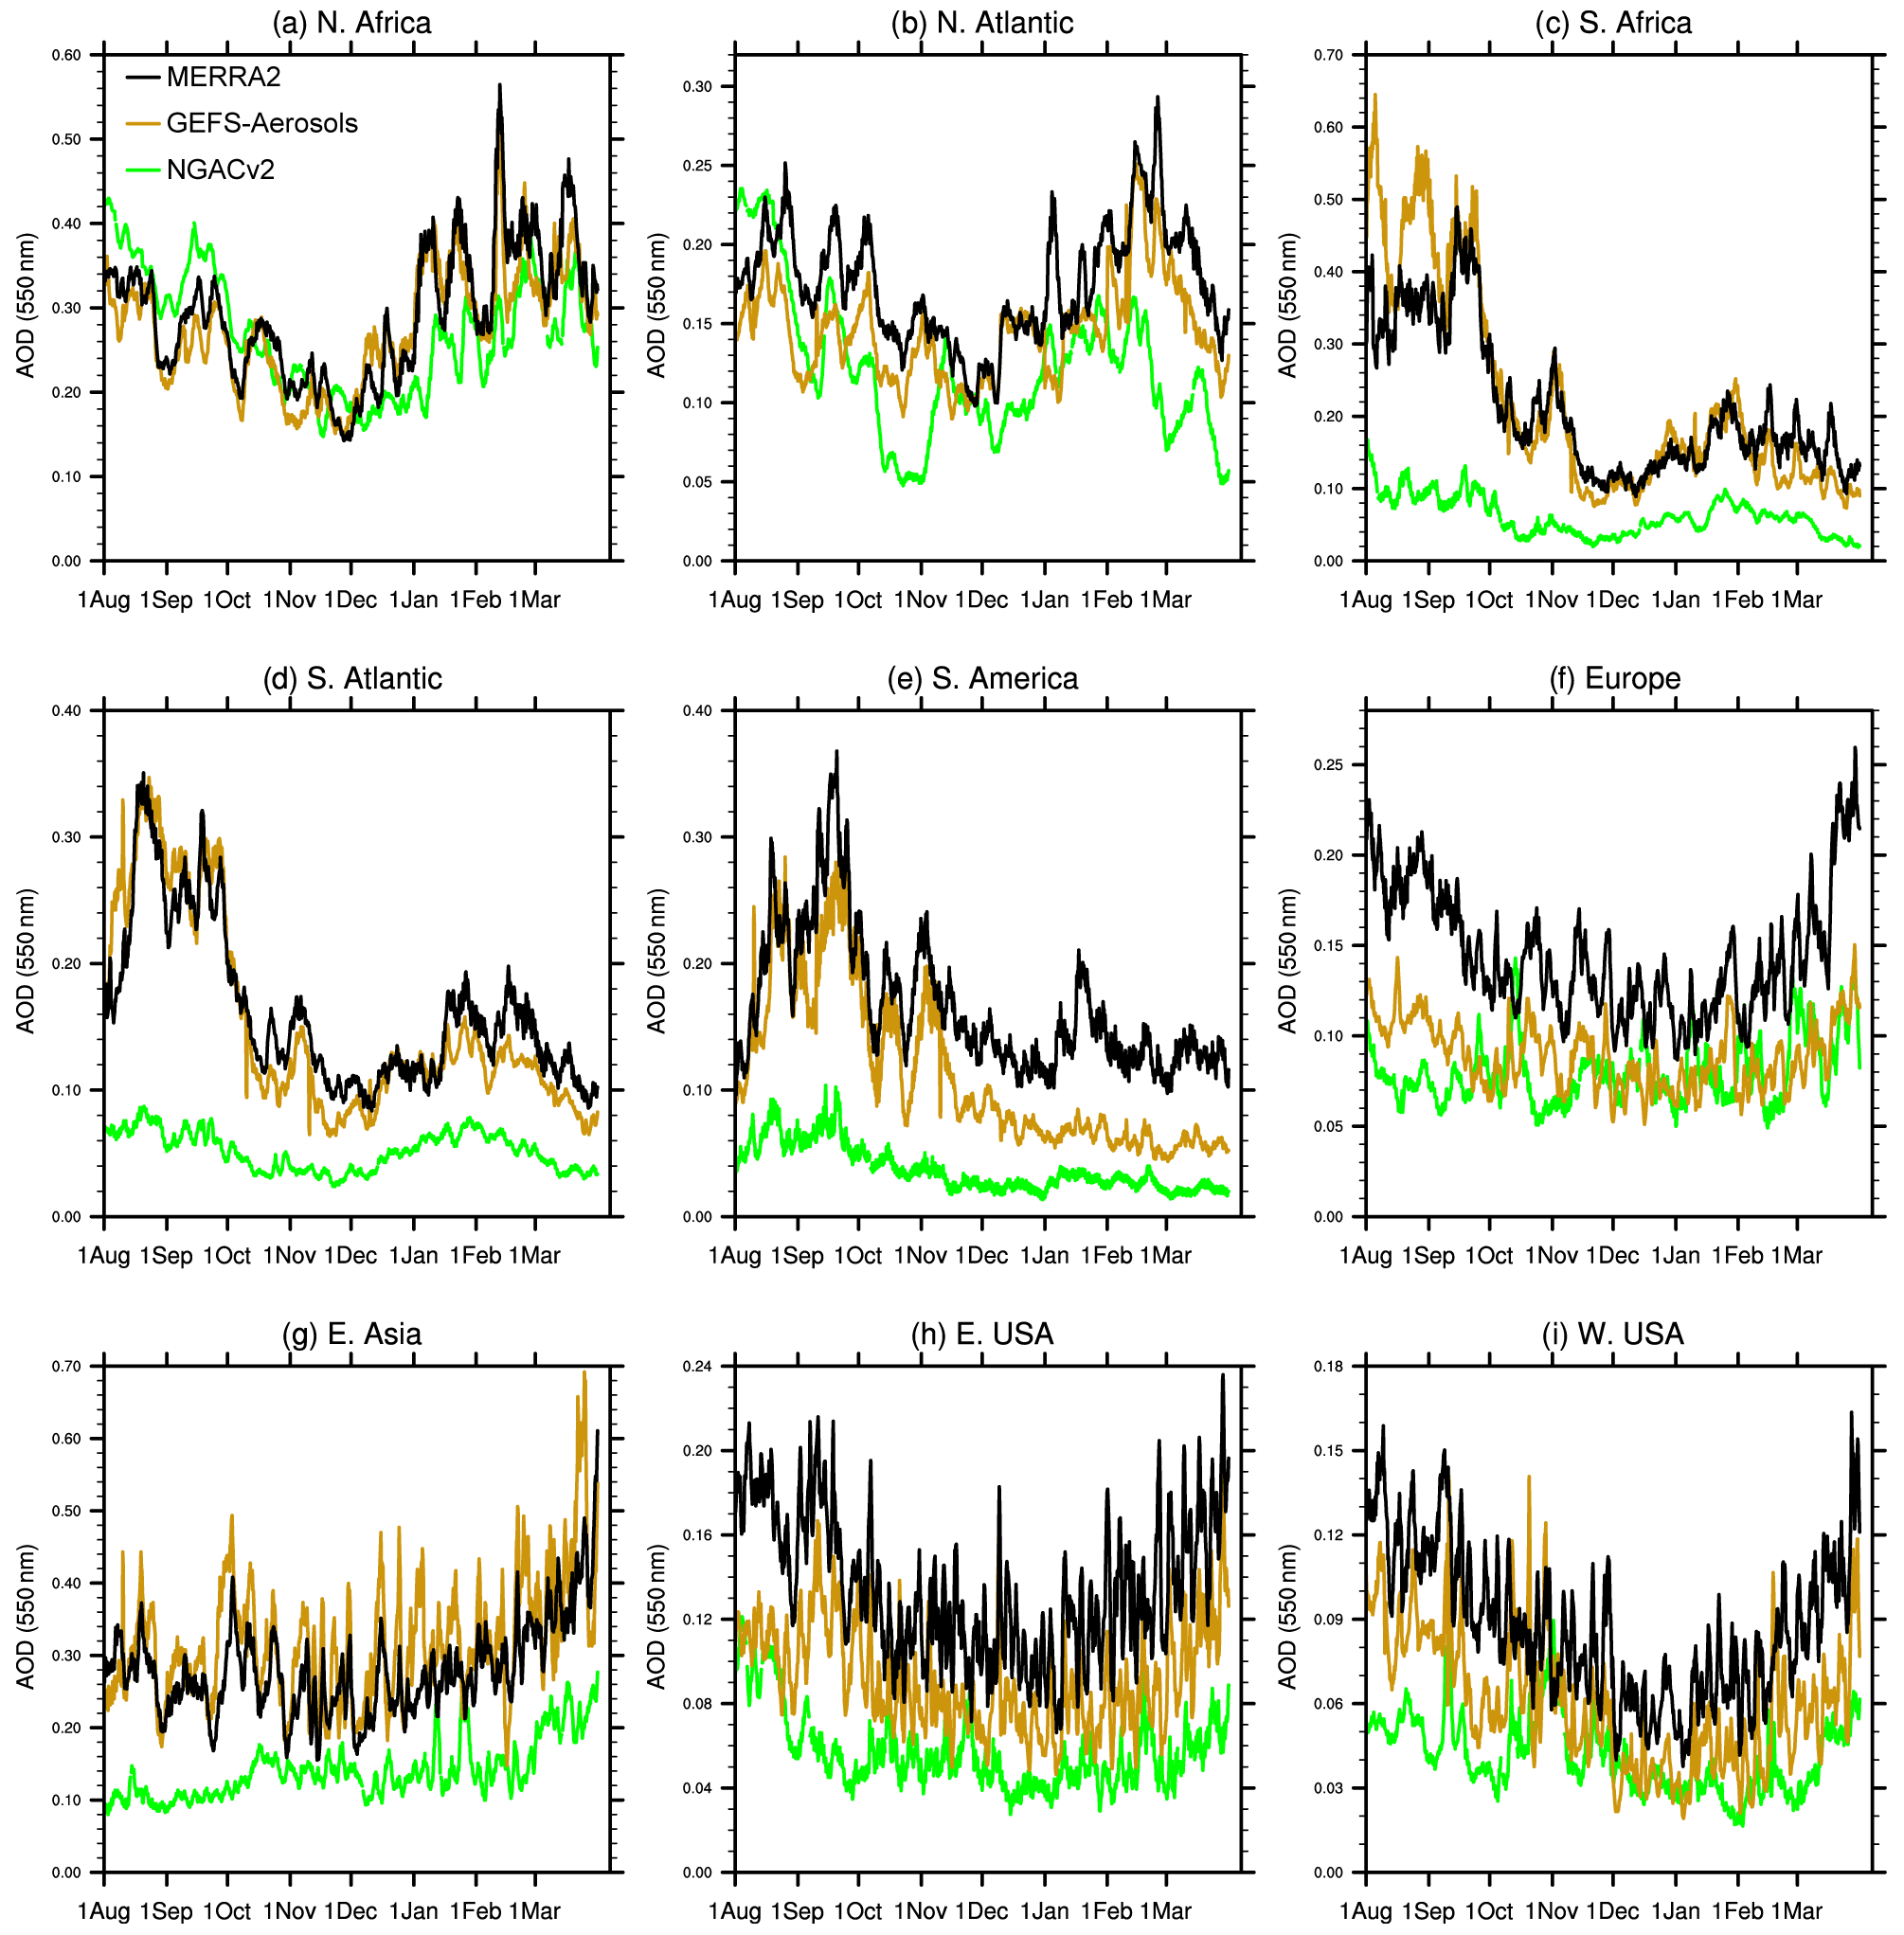
Figure 13GEFS-Aerosols and NGACv2 Day-1 total AOD forecast time series against MERRA-2 reanalysis data averaged over major global regions of northern Africa (0–35∘ N, 18∘ W–30∘ E), North Atlantic Ocean, (0–40∘ N, 10–80∘ W), southern Africa (0–35∘ S, 8–35∘ E), South Atlantic (0–35∘ S, 40∘ W–20∘ E), South America (0–35∘ S, 35∘ W–80∘ W), Europe (35–65∘ N, 10∘ W–50∘ E), East Asia (20–48∘ N, 100–140∘ E), eastern USA (25–48∘ N, 68–95∘ W), and western USA (25–48∘ N, 95–125∘ W).
Total AOD variation in South America is mainly related to biomass burning emissions. GEFS-Aerosols has some slight low biases relative to MERRA-2 from mid-September to early October 2019 that are associated with the Amazon fire event. GEFS-Aerosols underpredicts MERRA-2 in this region from mid-November 2019 to March 2020, outside the main biomass burning season, which suggests that the GEFS-Aerosols AOD low biases in this region are mostly associated with sources other than fires.
The European region has the largest differences between GEFS-Aerosols and MERRA-2 reanalysis total AOD among the nine regions. Although their temporal variations are similar, GEFS-Aerosols underpredicts the MERRA-2 total AOD throughout the whole period by a factor of 0.5. The large absolute low biases from August to early October 2019 and March 2020 in Europe are associated with GEFS-Aerosols underestimates of sulfate AOD (Fig. 8). From August to early December 2019, the GEFS-Aerosols total AOD looks quite consistent with the MERRA-2 reanalysis on average across East Asia. GEFS-Aerosols high biases starting in mid-December 2019 and increasing from January to March 2020 may be associated with the lockdown in China during the Coronavirus disease 2019 (COVID-19) pandemic. Anthropogenic emissions of NO2, SO2, VOC, and primary PM2.5 over the North China Plain during this period were reduced by 51 %, 28 %, 67 %, and 63 %, respectively, compared to the previous year, resulting in lower surface aerosol and ozone levels and improvements to air quality (Shi and Brasseur, 2020; Wang and Su, 2020; Xing et al., 2020). Since the anthropogenic emissions used in GEFS-Aerosols are based on the CEDS 2014 inventory, they definitely overestimate the anthropogenic aerosol emissions during the 2019–2020 lockdown periods.
Both the eastern and western US regions exhibit GEFS-Aerosols low biases of about 5 %–30 %, with the largest differences in the eastern US occurring in August 2019. However, the trends of total AOD temporal variations, low in summer and high in winter, in the GEFS-Aerosols prediction and the MERRA-2 reanalysis are quite consistent over the eastern and western US. The minor underpredictions by GEFS-Aerosols need further investigation.
In comparison, the NGACv2 predictions show significant underprediction of MERRA-2 total AOD for almost all of these nine regions throughout this 8-month period. The one exception is northern Africa, where the NGACv2 results are close to the MERRA-2 reanalysis, with overprediction in August 2019 and low biases from December 2019 to March 2020. In addition to its general underprediction of MERRA-2 total AOD, NGACv2 is not able to capture the temporal variations of total AOD in some regions, such as the enhanced AOD due to fire emissions in southern Africa, the South Atlantic, and South America. Though NGACv2 shows similar temporal variations to MERRA-2 total AOD in Europe, East Asia, and the US, the magnitudes of NGACv2 predictions are too low, by a factor of 1 to 3. This analysis is consistent with a 1-year evaluation of GEFS-Aerosols AOD that shows improvements over NGACv2 (Bhattacharjee et al., 2022).
Retrospective simulations of GEFS-Aerosols and NGACv2 were performed for the summer of 2016 and evaluated using aircraft measurements from the first deployment of ATom-1 in July and August 2021. During ATom-1, plumes from dust storms and large biomass burning events and low-level sea-salt aerosols were observed over the South and central Atlantic, and anthropogenic pollution was observed over the United States on the last flight from Minnesota to southern California.
In this section, we evaluate the 24 h forecast skill of GEFS-Aerosols and NGACv2 by comparing to ATom-1 observations. The GEFS-Aerosols and NGACv2 model results are sampled at the same latitude, longitude, and altitude as the ATom-1 measurements. The model output is hourly with ∼ 25 km horizontal resolution on the FV3 native grid. The ATom-1 measurements collected on a 1 s time base were compared to the nearest hour's model forecast. Model data are interpolated vertically (according to log-Z above ground level) but sampled within the nearest horizontal grid as the observations (with no horizontal interpolation). Thus, the inherent differences between temporal (differences of up to 0.5 h) and spatial scales of the observations (∼ 200 m resolution) and model results (25–100 km resolution) must be kept in mind with the model–measurement comparisons.
5.1 Global flight track column sum comparisons
Figure 14 shows the tropospheric column sums of OC along the flight tracks of the NASA DC-8 for the ATom-1 observations and GEFS-Aerosols model experiments. The OC column sums using GBBEPx v3 fire emissions at ∼ 25 km resolution. Figure 14b is quite consistent and comparable to the observations. The modeled OC column sums are somewhat smaller than those of observations over the North Atlantic, Greenland, and southeastern Canada.
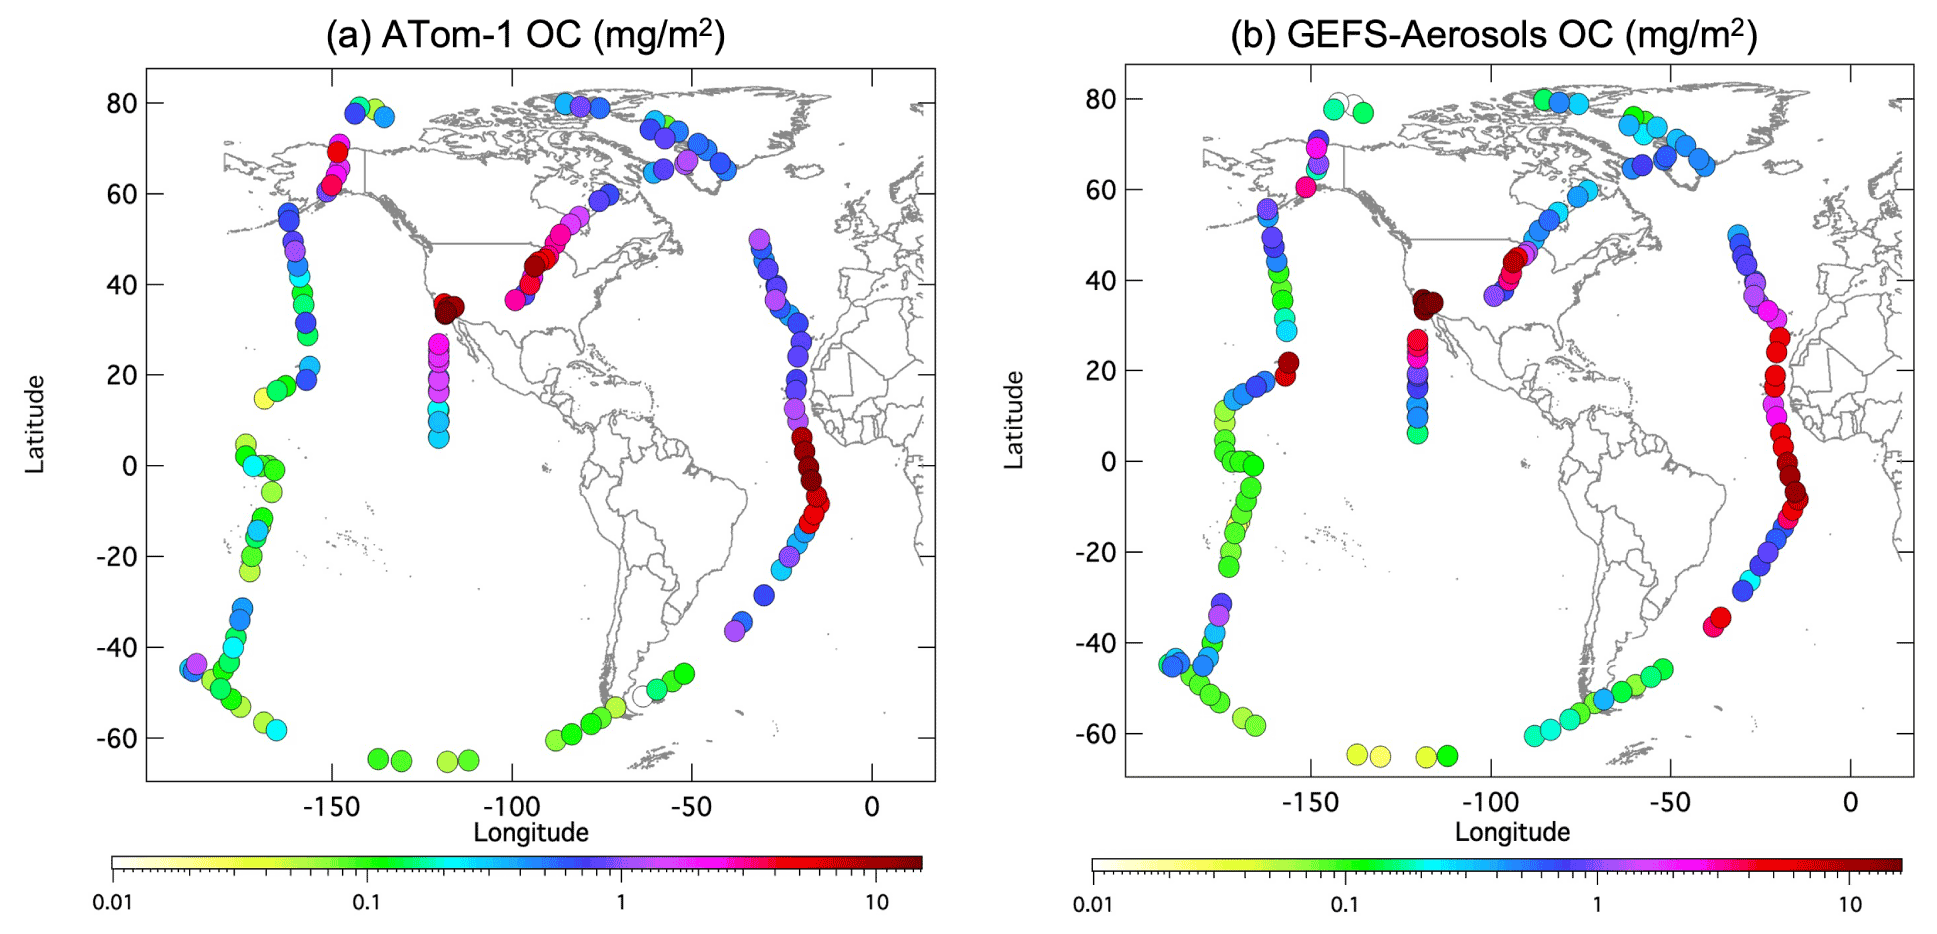
Figure 14Tropospheric column sums of OC (< 1.0 µm diameter) for (a) ATom-1 DC-8 observations and (b) GEFS-Aerosols.
Results of the model–measurement comparisons for dust are shown in Fig. 15. GEFS-Aerosols simulations show good agreement with ATom-1 observations over the tropical North Atlantic and downwind of the western Africa dust source region. However, the model underestimates the dust columns over the tropical South Atlantic, Greenland, and southeastern Canada while underestimating dust over the US, Alaska, and broad areas of the Pacific Ocean. The GEFS-Aerosols model shows a clear enhancement of the dust event sampled on 17 August 2016 east of the African coastline near 22∘ N, though the model column maxima tend to be more than a factor of 5 lower than that of the observations.
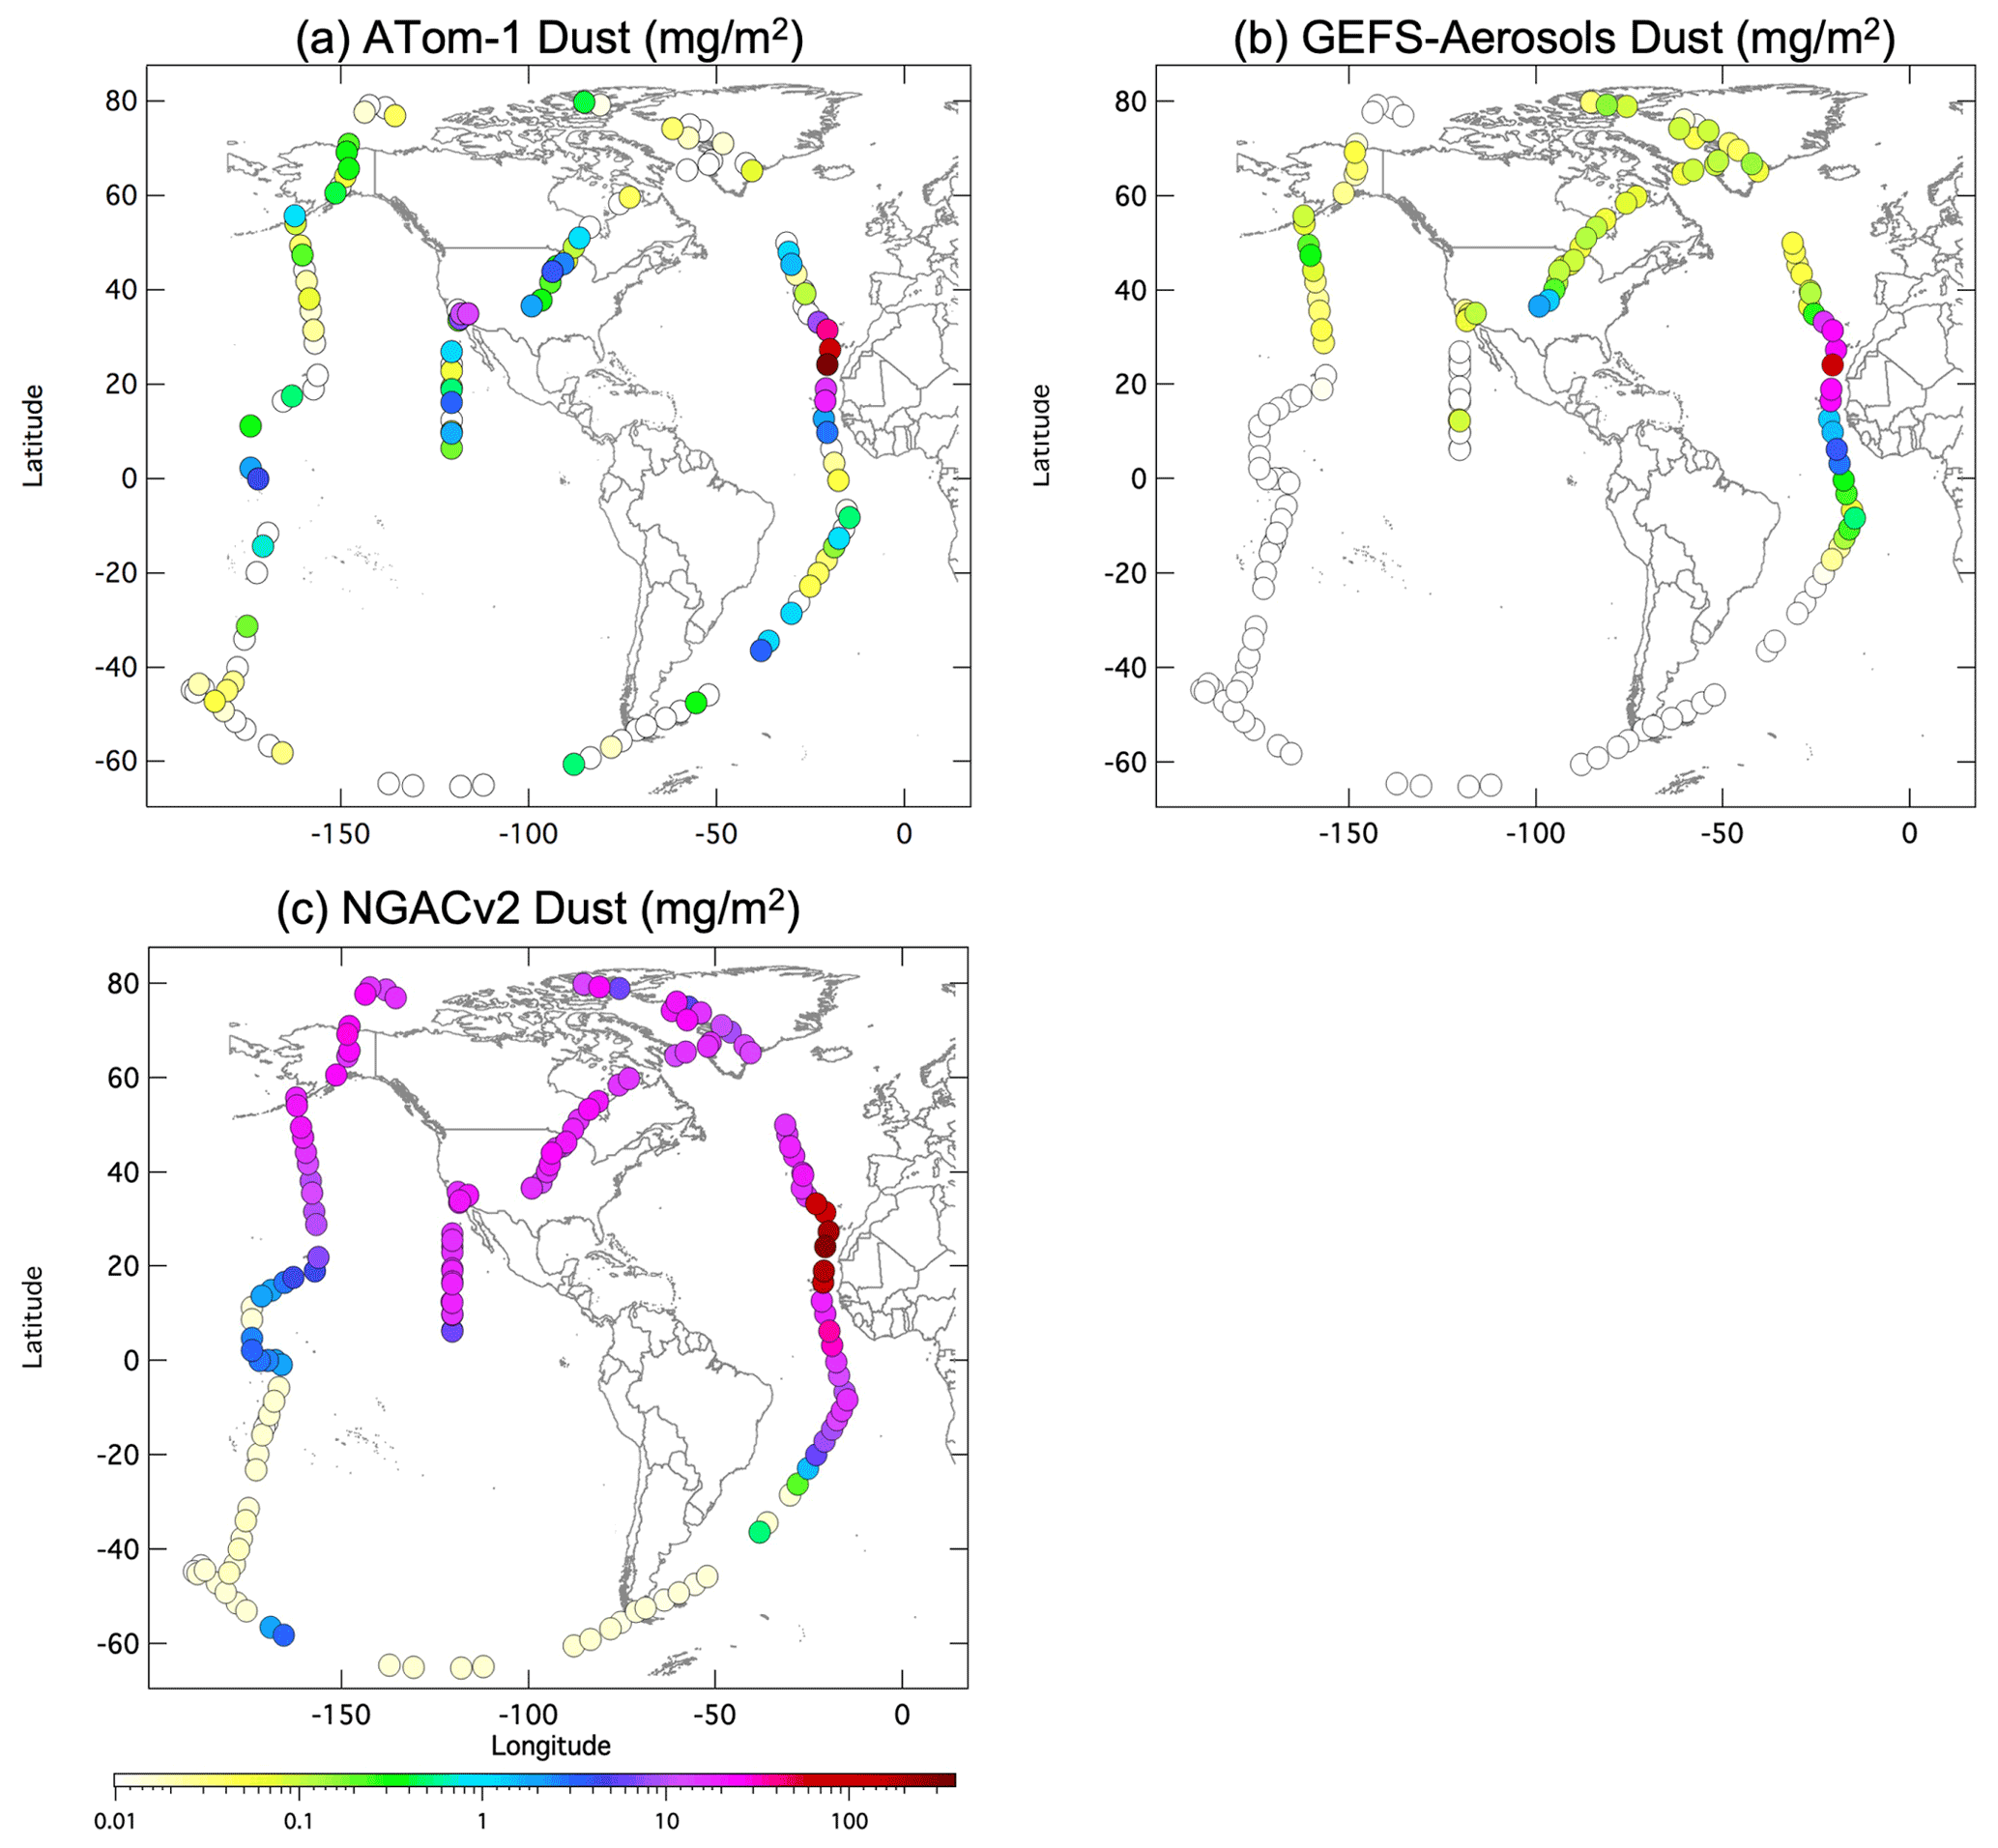
Figure 15 Tropospheric column sums of dust (< 3.0 µm diameter) for (a) ATom-1 DC-8 observations, (b) GEFS-Aerosols, and (c) NGACv2.
Table 3 gives median bias and correlation statistics for column sums of all GEFS-Aerosols model cases as well as the NGACv2 dust forecasts for ∼ 130 profiles illustrated in Figs. 14 and 15. Correlations (r – Pearson correlation coefficients) are typically above 0.7 for all species except dust. The OC differences noted above for GBBEPx v3 are apparent in the bias statistics of OC (a factor of 2.5) and BC (a factor of 50 %), although R correlations are not significantly affected. Differences in the fire inventories also affect sulfate biases slightly (12 %). For all species except for dust, decreases in median model / observed ratios are seen for the model results.
Table 3ATom-1 and GEFS-Aerosols column sum statistics of mean bias and correlation for sulfate, OC, BC, and dust.
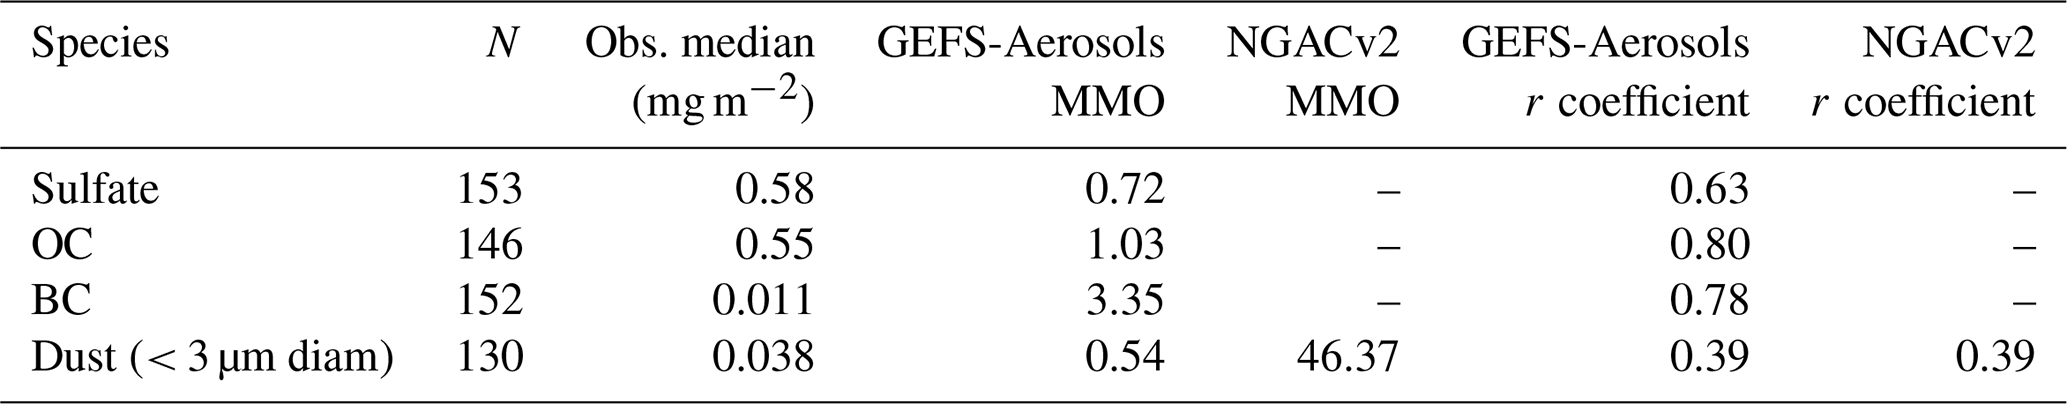
N is the sample number, MMO stands for the median model to observed ratio, and r coefficient is the Pearson correlation r coefficient.
Dust, on the other hand, shows a slight underprediction in column amount in the model results. Dust sources depend critically on surface wind speed, have very little overlap with the anthropogenic and biomass burning sources of the other species, and are associated with areas of weather and surface conditions, all which may contribute to the different responses of dust emissions. Correlations of dust are also much lower than for other species, and there is a very obvious difference between GEFS-Aerosols and NGACv2 model forecast statistics, as discussed further below. We note that sea-salt columns are not calculated or compared to ATom-1 observations, due to the large number of observations below the detection limit, especially above 2 km altitude.
5.2 Vertical profile statistics comparisons
ATom-1 flight tracks are separated into two sections and labeled the “Pacific” side for 29 July to 8 August 2016 flights and the “Atlantic” side for 15 to 23 August 2016 flights. For this analysis the 1 s model and observed data are binned into 10 equally spaced vertical intervals (∼ 1 km) covering the vertical extent of the ATom-1 profiles. Figure 16 shows median, ratio, and correlation statistics of OC, BC, and sulfate for the two geographic regions and the two model cases. For OC over the Pacific, the median values are lower than that of the observation by more than 50 %. Their correlations with observation are quite similar above ∼ 3 km height. The vertical profile of the ratio also suggests that the OC concentrations are underpredicted over the Pacific. Statistics for the Atlantic flight tracks of ATom-1 show similar trends and behavior. The median values of model prediction OC are quite comparable to observations, which show very consistent vertical variation similar to the observations. The correlations with observations improve below 4 km height compared to those of the Pacific, with the maximum close to 0.80. While the correlation decreases significantly at 3–6 km height, it increases by almost 50 % above 6 km height. The model results are biased too low below ∼ 3 km. The BC vertical profile statistics are quite different to OC, with the model forecasts much larger than observations as one goes higher in altitude over both the Pacific and Atlantic sections. Correlation coefficients with observations are about 0.6–0.8 from near surface to ∼ 6 km over the Pacific and about 0.7–0.9 below ∼ 4 km over the Atlantic. The correlations of both OC and BC decrease significantly above ∼ 4 km over the Atlantic. For sulfate, the median biases of the model are biased too low from near surface to ∼ 8 km over the Pacific, and their correlation coefficients with observations are about 0.4–0.6 below 6 km. For the Atlantic, median values are quite comparable to the observation below ∼ 7 km, and their correlations are about 0.3–0.9 and consistently decreasing with altitude. By contrast, the Pacific comparisons for sulfate show a significant underprediction (60 %–70 %) from 0.5 to 7.0 km altitude for both model cases, which suggests a significant underprediction of oceanic gas-phase sulfur sources such as DMS.
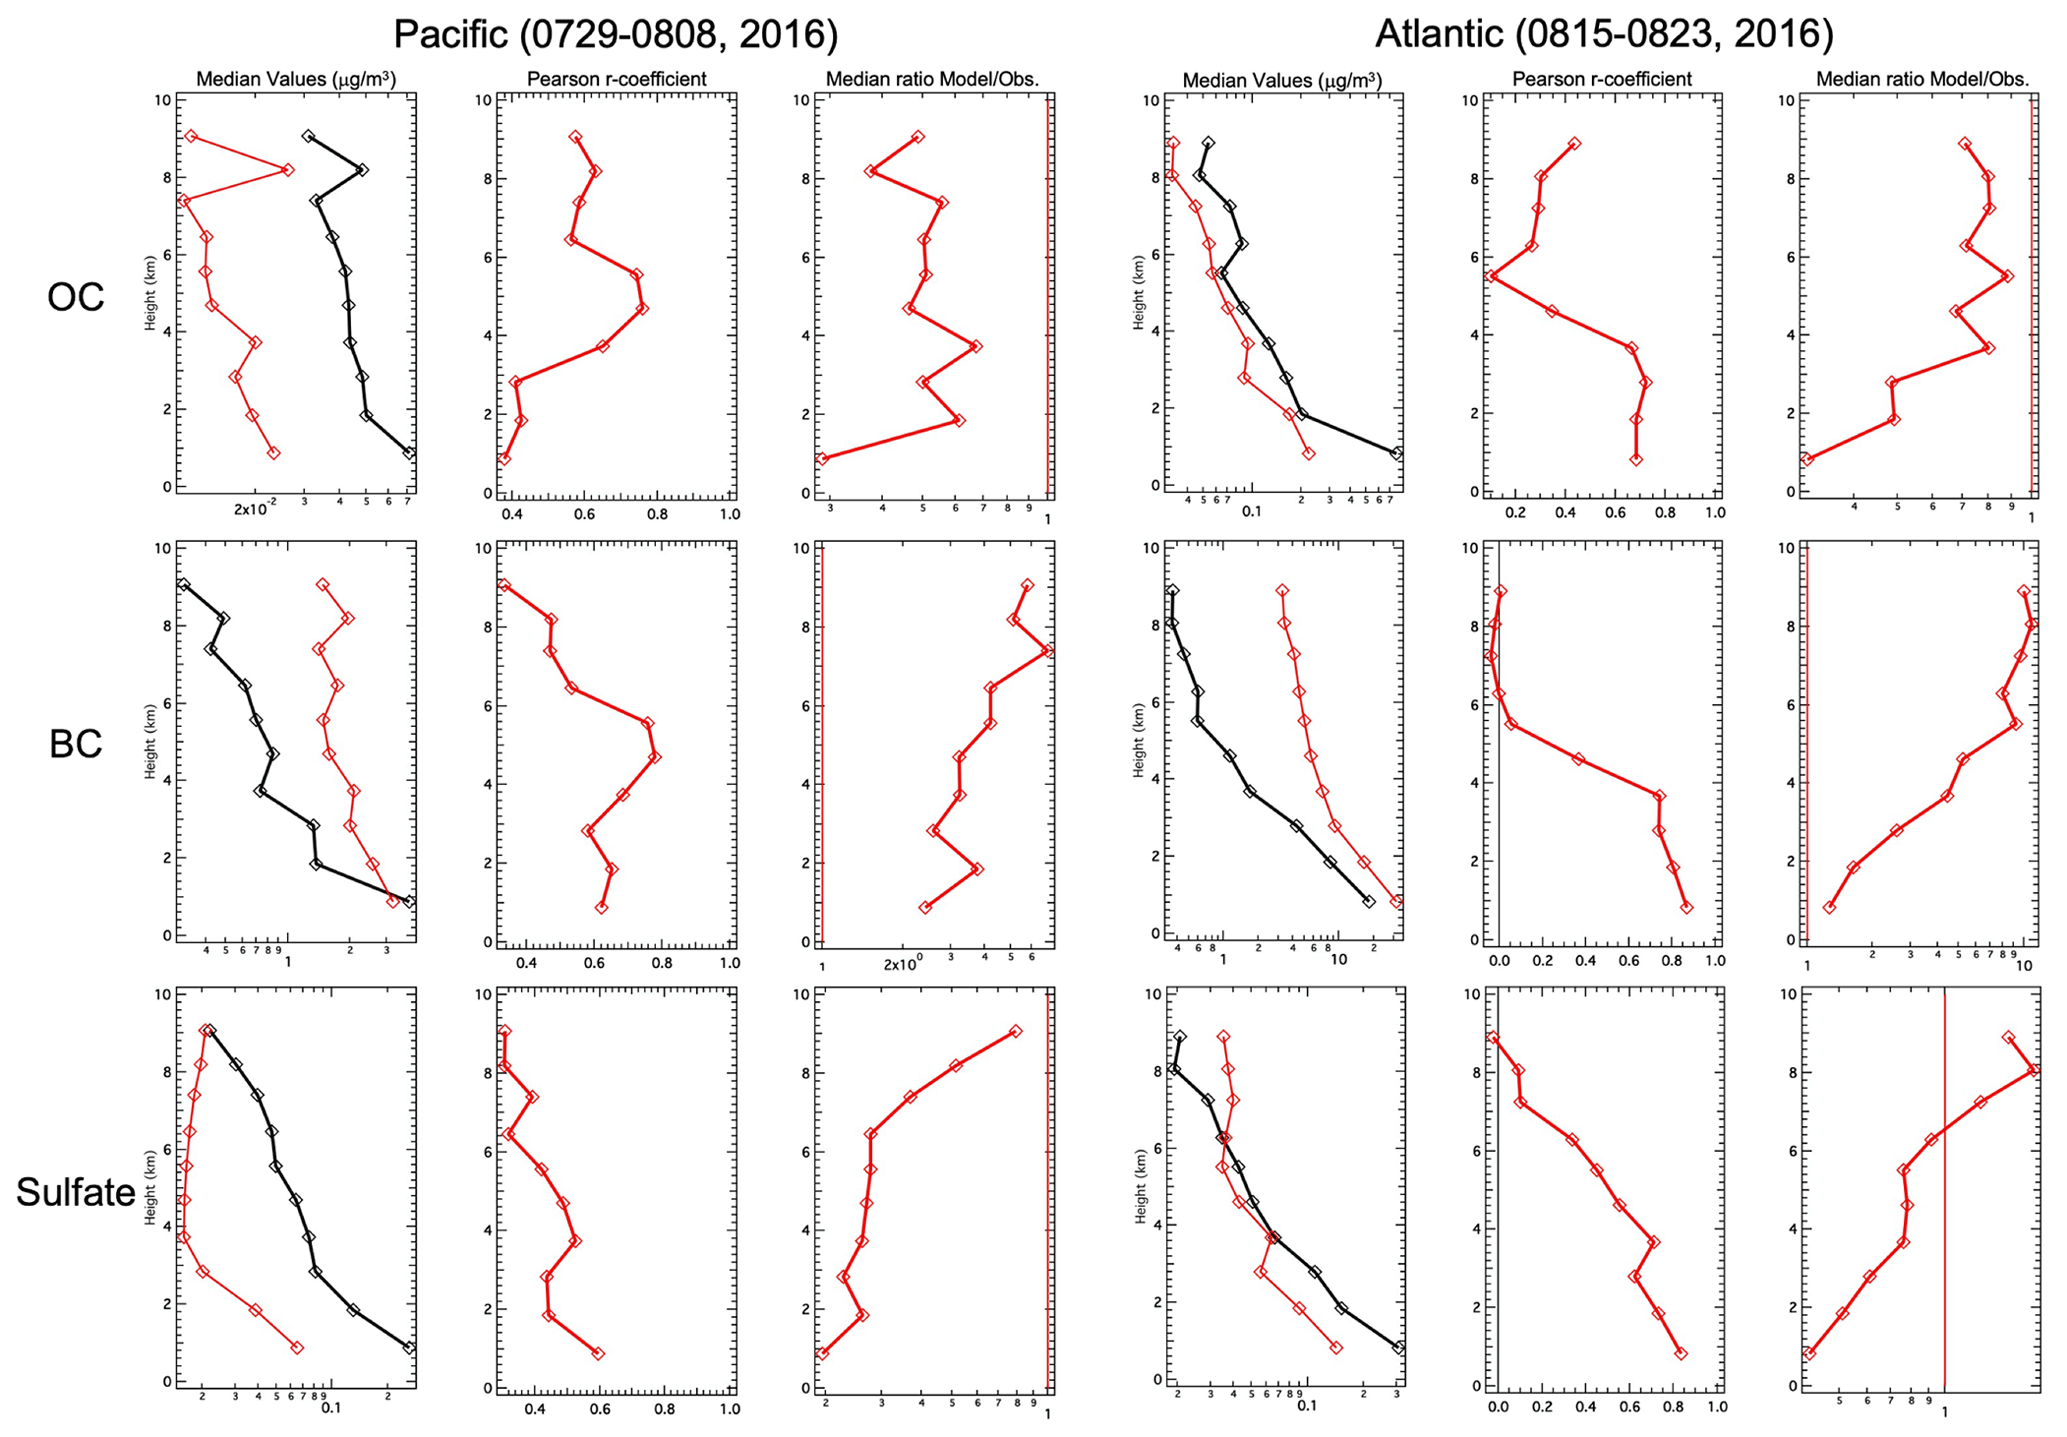
Figure 16Vertically resolved statistical comparisons of median values (black line is ATom-1 observation, red line is GEFS-Aerosols), r coefficient, and median ratio (model/observation) for OC, BC, and sulfate along the ATom-1 DC-8 flight tracks over the Pacific (29 July–8 August) and Atlantic (15–23 August).
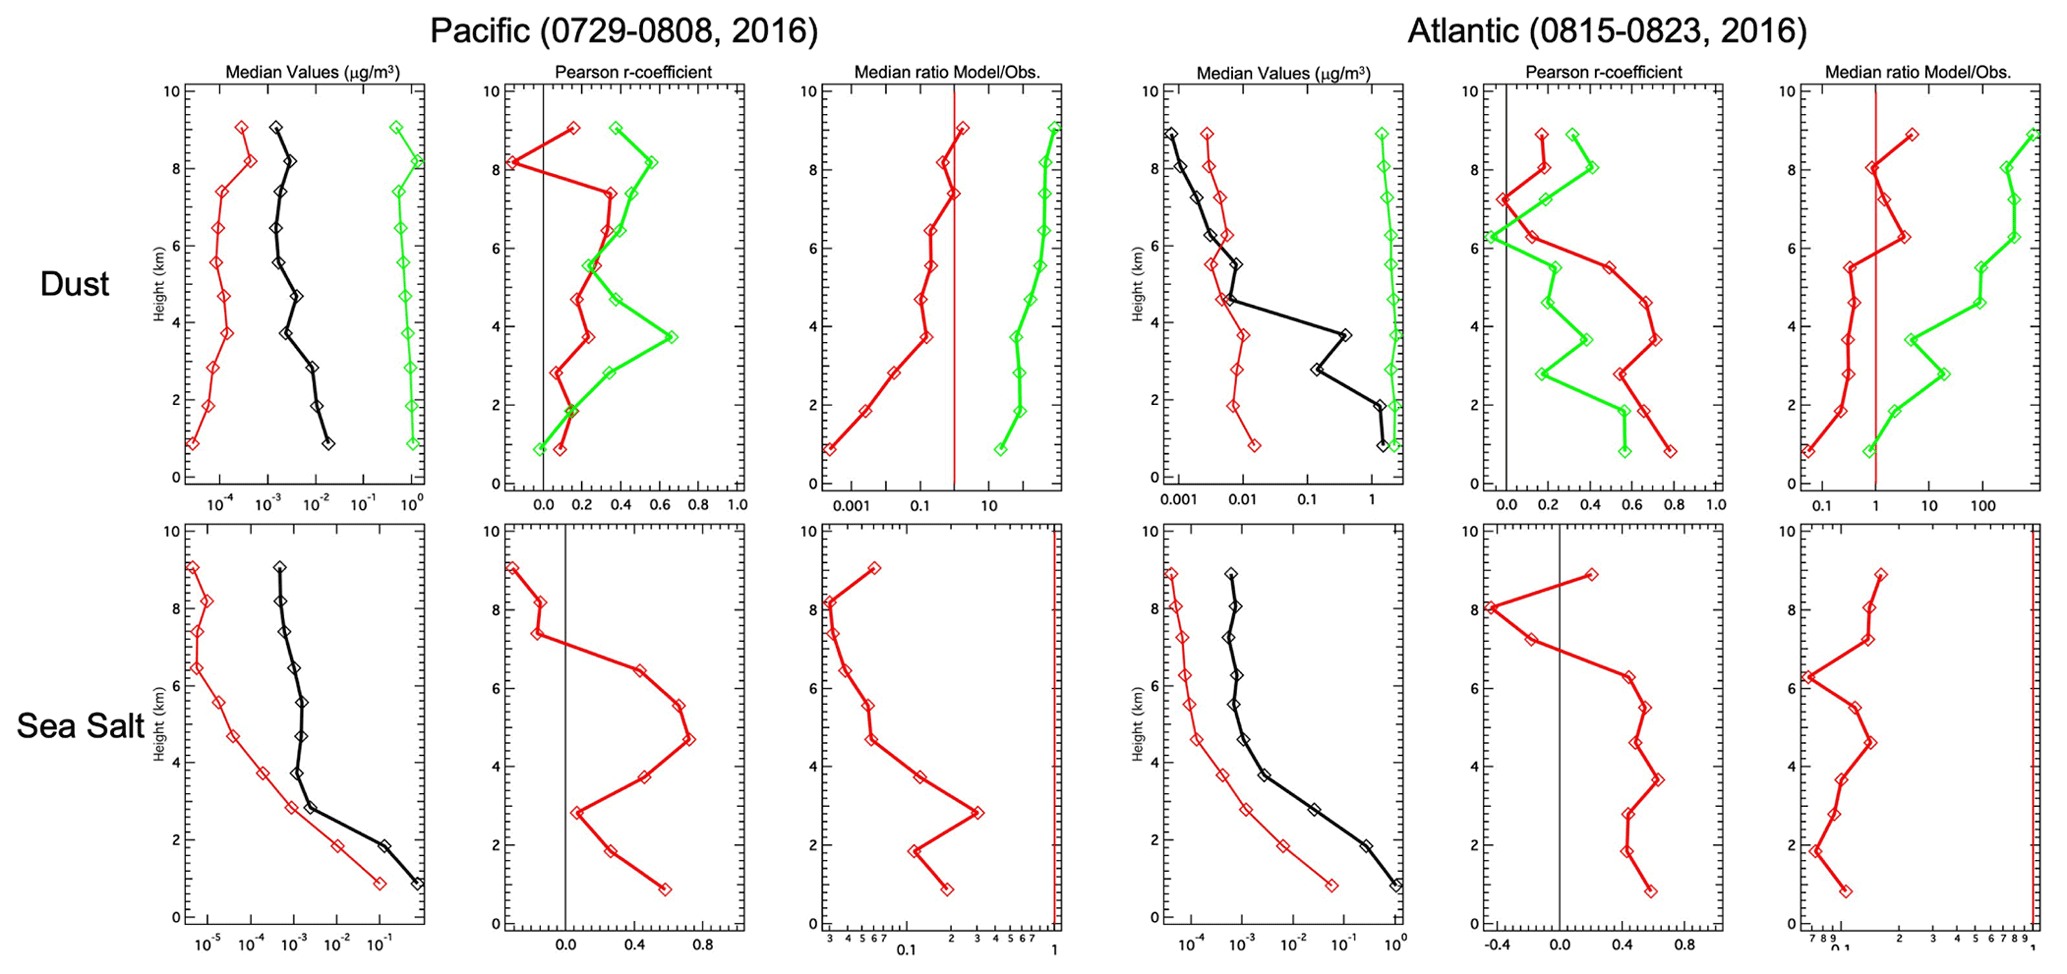
Figure 17Vertically resolved statistical comparisons of median values (black line is ATom-1 observation, red line is GEFS-Aerosols, green line is NGACv2), r coefficient, and median ratio (model / observation) for dust and sea salt along the ATom-1 DC-8 flight tracks over the Pacific (29 July–8 August) and Atlantic (15–23 August).
Vertically resolved statistics of naturally occurring dust and sea salt are shown in Fig. 17. For dust over the Pacific, median values of GEFS-Aerosols are too low, while the NGACv2 results are too high compared to the observations and the correlations are almost less than 0.5. The performance of GEFS-Aerosols improves over the Atlantic, with median values comparable to observations above ∼ 4 km and the correlation coefficients increasing to 0.5–0.8 below ∼ 5 km, while it still shows a significant high bias for the NGACv2 model over the Atlantic. For sea salt, the median value biases are all biased too low over both the Pacific and Atlantic. Generally, the correlations are much better below ∼ 6 km.
5.3 Height–latitude profile comparisons over the Atlantic during ATom-1
The ATom-1 flight profiles allow a more detailed comparison of aerosol spatial patterns from different aerosol sources with the model. High values of OC and BC from fires were observed on 15 and 17 August 2016 over the Atlantic, as were high values of dust and sea salt. The flight track of height–latitude profiles of OC, BC, and sulfate for these combined days are shown in Fig. 18 for the ATom-1 measurements and the model results. The model results show similar patterns to ATom-1 in reproducing the profiles of OC even using a log scale, especially the biomass burning plumes near the tropics, though the model results show slightly low biases. However, they also show some bias for OC at levels above 4–5 km over the North Atlantic, where model results show high biases. Overall, predicted BC (middle column of Fig. 18) is able to capture the decreasing trend with increasing altitude in the latitude–height profiles; however, they are underpredicted in the biomass burning plumes near the tropics from the surface to 5 km height in both model experiments, which has been seen in other models due to insufficient wet scavenging (Wang et al., 2014; Choi et al., 2020). Similar to the OC profiles, the model results overpredict above the 4–5 km height levels. It appears that the model does not reproduce the enhancements of BC at 1–4 km height very well over this area. This may be possibly due to relative weak convection or a low modeled injection height where the fire emission has not been lifted enough to this altitude, which needs further studies. For sulfate (right column), the model experiments show high concentrations at low altitude, similar to the observations, though there are still some differences for the plume location at 2–4 km height that shift the plume from near the Equator to near 20∘ N in the model experiments. Over the equatorial areas at about 2–4 km height, the observed sulfate concentration is underestimated by about 30 % by the modeled results, which may also relate to the injection height of biomass burning that results in much lower SO2 at this altitude since SO2 is one of the most important precursors for sulfate production. Meanwhile, the sulfate concentration above 6 km is overestimated over the tropics but underestimated near the surface.

Figure 18Height–latitude profiles of OC, BC, and sulfate over the Atlantic on 15 and 17 August 2016 for (a) the ATom-1 DC-8 observations and (b) GEFS-Aerosols.
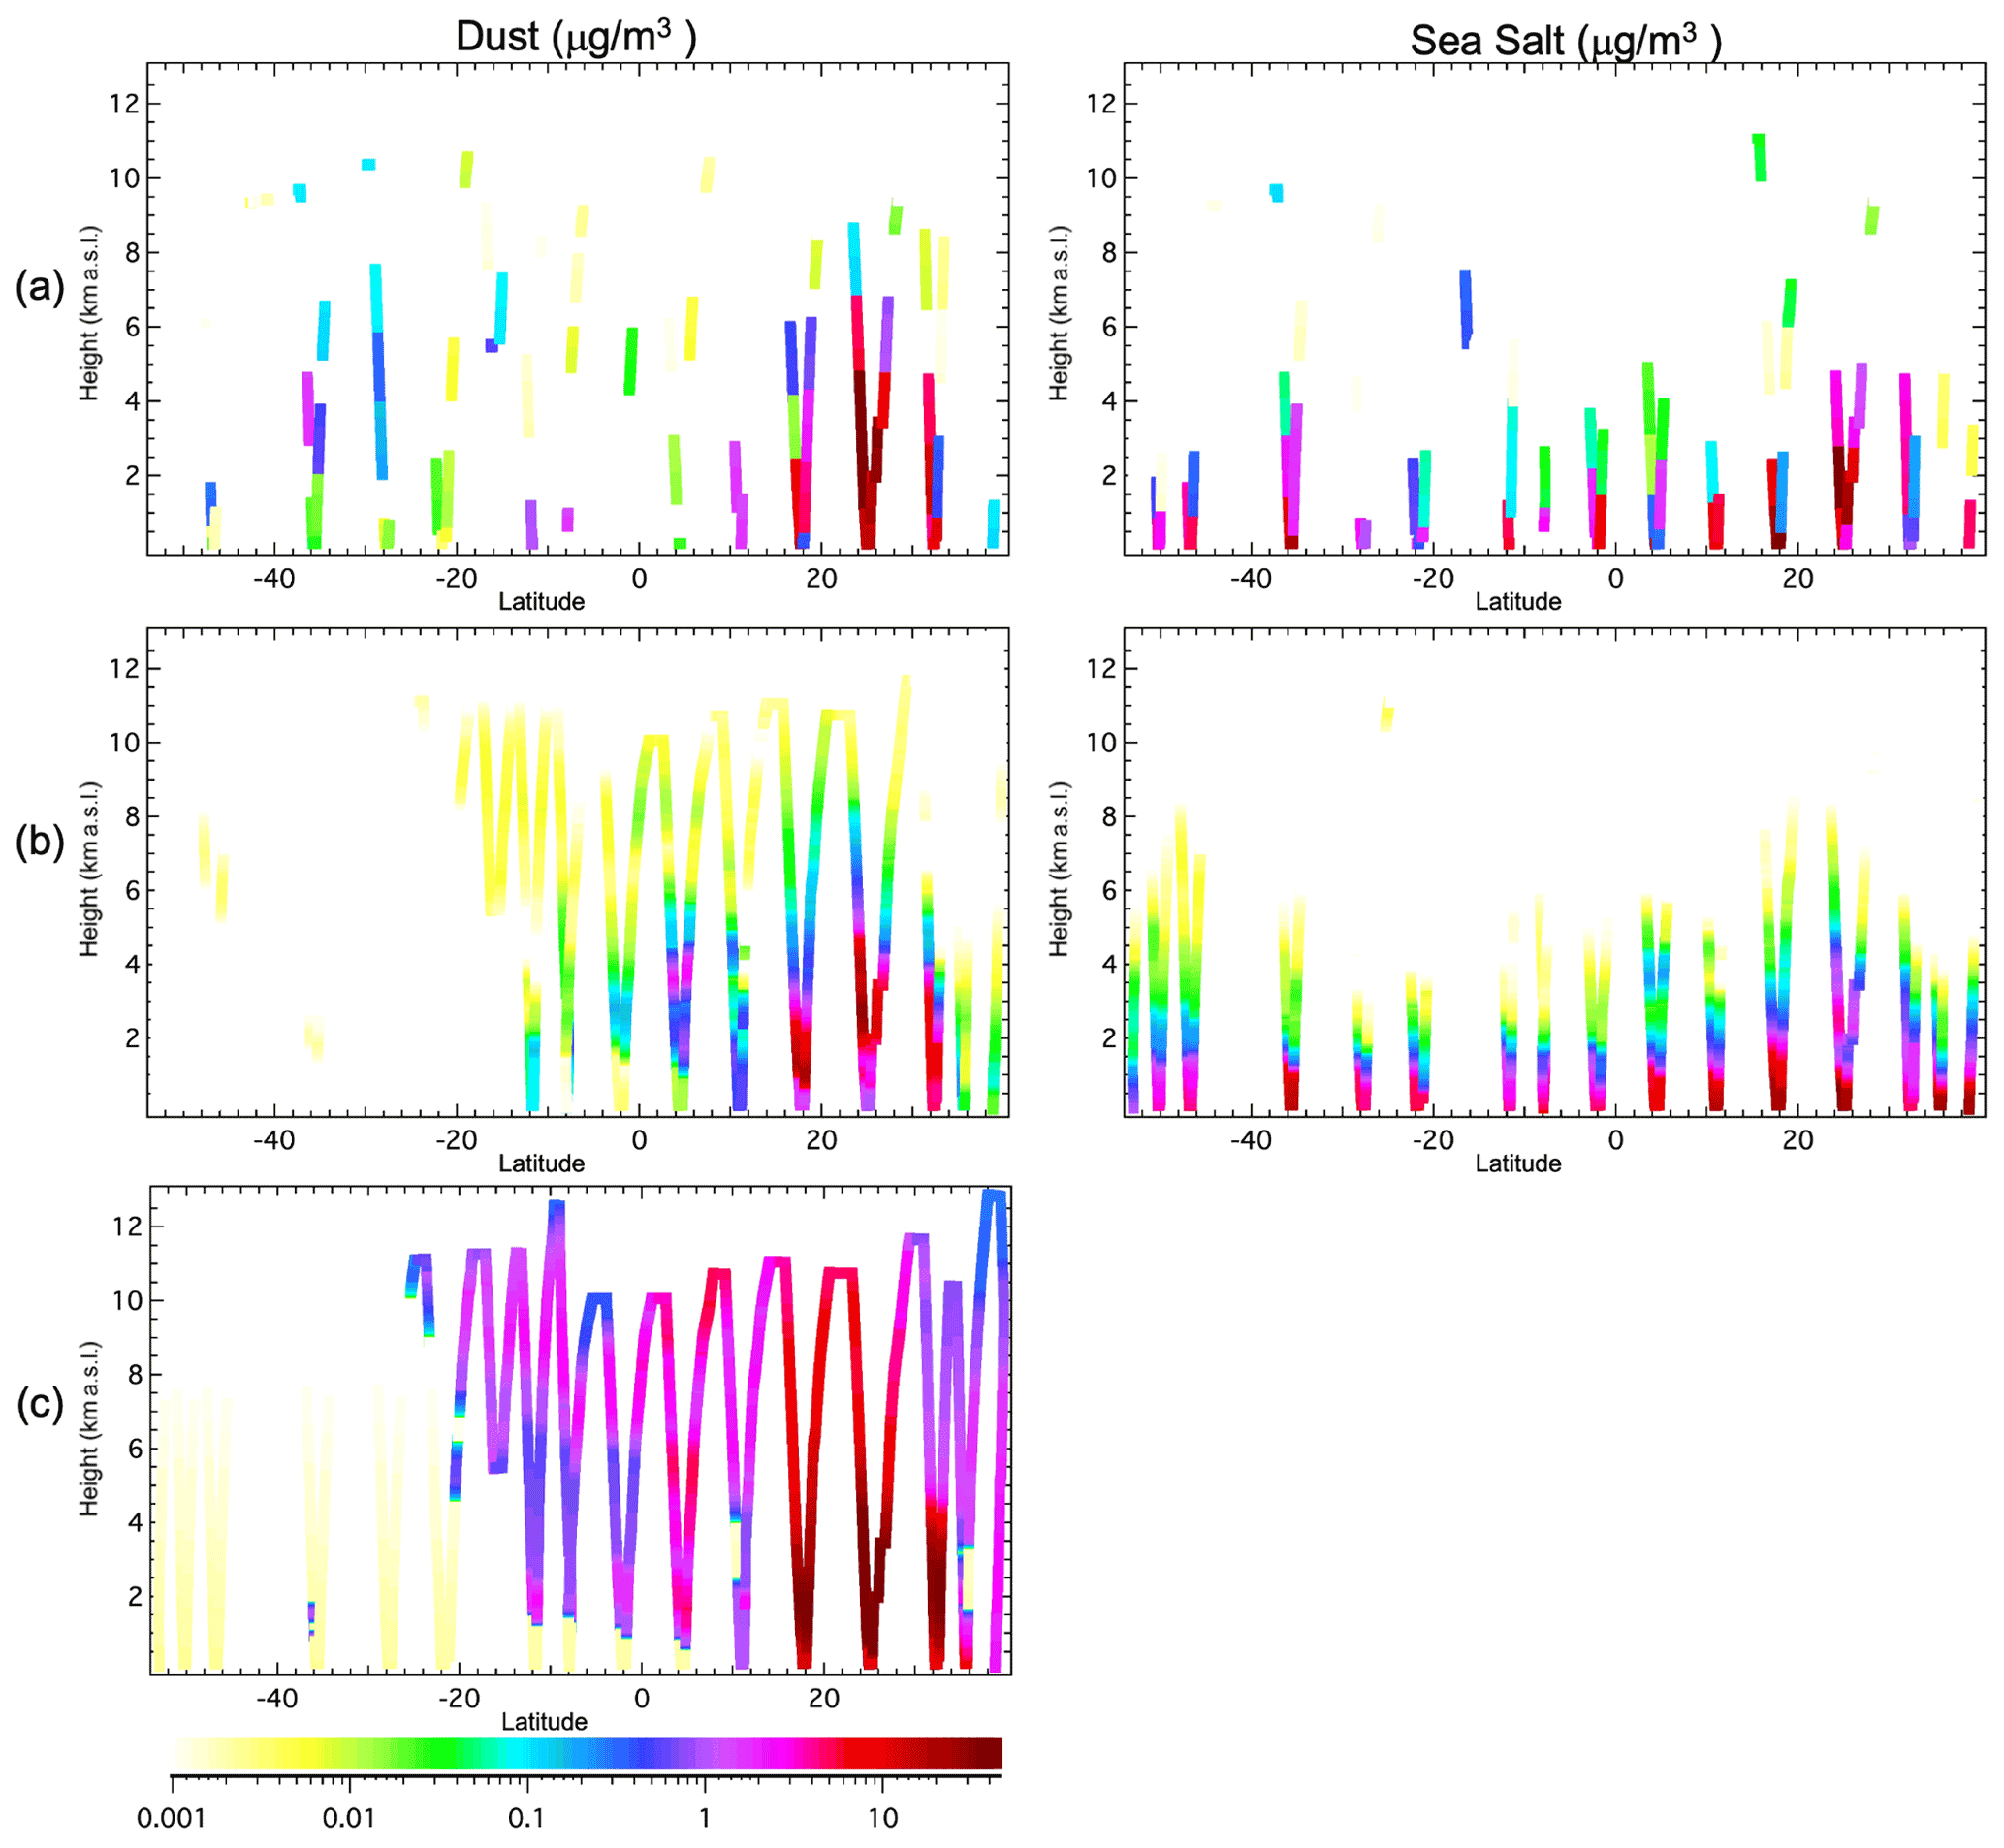
Figure 19Height–latitude profiles of dust (< 3.0 µm diameter) and sea salt (< 3.0 µm diameter) over the Atlantic on 15 and 17 August 2016 for (a) the ATom-1 DC-8 observations and (b) GEFS-Aerosols and (c) NGACv2.
Figure 19 shows the comparisons of the naturally occurring dust and sea-salt aerosols for the same time period. In the left column of dust, we also include the NGACv2 results. For more consistent comparisons, here the modeled dust results are summed up by the first two bins to match the observation particle size range (less than 3 µm). The GEFS-Aerosols predictions show agreement in the dust height–latitude profiles with the observations and exhibit similar patterns. The observed dust plumes are reproduced by the model over 15–35∘ N, but the model appears to underestimate wet removal in the upper levels that results in the overestimation of dust above 7–8 km height in the North Atlantic and above 5 km height in the tropical South Atlantic. On the other hand, the NGACv2 prediction shows a very large bias over broad areas of the North Atlantic and the tropical South Atlantic. A high dust plume near 35∘ S has not been captured well by the model from the surface to the upper levels, which may be caused by missing dust events over South America. For sea salt, the model results are able to predict patterns consistent with the observation, especially from the surface to about 4–6 km height.
Since the dynamical core of FV3 developed by the GFDL has been selected by the NOAA to be the dynamical core for the Next Generation Global Prediction System (NGGPS), development of a coupled weather and atmospheric chemical composition model for chemical weather and air quality forecasting based on the FV3 framework began a couple of years ago. The development as a single ensemble member of the Global Ensemble Forecast System (GEFS) has been completed. This new model, referred to as GEFS-Aerosols, was implemented as one member of the GEFS in operations as part of the NOAA's first coupled UFS model in September 2020 and replaced the previous operational global aerosol prediction system (NGACv2) at the NCEP.
The chemical component of atmospheric composition in GEFS-Aerosols is based on WRF-Chem, which is a community modeling system used by thousands of users worldwide. The aerosol modules are based on modules from the GOCART model. Features of the new model include (1) the biomass burning plume rise module added from WRF-Chem, (2) the FENGSHA dust scheme implemented and developed by the NOAA Air Resources Laboratory (ARL), (3) all sub-grid-scale tracer transport and deposition handled inside the physics routines requiring consistent implementation of positive definite tracer transport and wet scavenging in the SAS scheme, (4) the updated background fields of OH, H2O2, and NO3 from the GMI model, and (5) biomass burning emission calculations based on the GBBEPx v3 emission and FRP provided by NESDIS, and (6) global anthropogenic emission inventories derived from CEDS and HTAP. These fundamental updates in GEFS-Aerosols indicate quite different features compared to NGACv2 (see Table 2), including dynamical core, physics package, coupling infrastructure, horizontal resolution, and emission. These may play important roles in affecting the aerosol transport, wet and dry deposition, and emission, etc., which would help to improve the model performance. This new model is able to forecast the higher-resolution distribution of primary air pollutants of aerosols: black carbon, organic carbon, sulfate, and dust and sea salt, each with five size bins. Meanwhile, it is also capable of handling volcanic eruptions, which can inject vast quantities of particulates into the atmosphere. While for the predicted results in the paper we have not included the volcanic emission in the model for the June 2019 Raikoke eruption, it may partially impact the underprediction over high northern latitudes.
The updates in anthropogenic and fire emission indicate that GEFS-Aerosols shows much better performance in matching the AOD observations when configured to use the CEDS anthropogenic emission and GBBEPx v3 fire emissions with plume rise module compared to NGACv2, especially over the fire source regions. For more extensive evaluation, we performed 9 months of Day-1 real-time forecast of GEFS-Aerosols starting in July 2019, and the predicted AOD was used to compare to the satellite observations from MODIS and VIIRS, reanalysis data of ICAP-MME and MERRA-2, AERONET observations, and the model predictions from MERRA-2 and NGACv2. Overall, GEFS-Aerosols indicates substantial improvement for both composition and variability of aerosol distributions over those from the currently operational global aerosol prediction system of NGACv2. Globally, GEFS-Aerosols-predicted biases with respect to MERRA-2 forecast for dust, OC, and sulfate AOD were improved compared to those from NGACv2. Substantial improvements were seen for the total AOD prediction when compared to MERRA-2 reanalysis during the period of July to November 2019. Though there are still some high biases over the southern African fire region and East Asia and low biases over South America and dust source regions, GEFS-Aerosols reproduces the prominent temporal and geographical features of AOD as represented by satellite observations and reanalysis data, like dust plumes over northern Africa and the Arabian Peninsula, biomass burning plumes in the Southern Hemisphere, South America, northwestern America and eastern Europe, polluted air over East and South Asia, and high-altitude sea-salt bands. We also sampled the forecast total AOD of GEFS-Aerosols and NGACv2 at the same location as 60 AERONET sites, which are spread globally and represent different aerosol regimes, and compared their variations for 5 July–30 November 2019. Much higher correlation coefficients against AERONET data are indicated for GEFS-Aerosols than those for NGACv2 globally and are quite comparable to those of the ICAP-MME.
During the biomass burning events, GEFS-Aerosols captured major fires over southern Africa, Siberia, the central Amazon, and central South America much better than NGACv2. Part of the improvement may be due to the vertical transport by the plume rise module. Generally, the total AOD time series of GEFS-Aerosols predictions matches closely to those of ICAP and AERONET during most of the time from July to November 2019 at the AERONET sites over South America, except that there are some minor underpredictions of several of the highest AOD episodes. In contrast, NGACv2 substantially underpredicted almost throughout the whole period and almost entirely missed many high AOD events. For the southern African event, the GEFS-Aerosols predictions are able to capture the daily total AOD variations seen in the AERONET observations, even better than that of the ICAP total AOD at the sites near the fire source regions, though there are overpredictions at the sites in downwind areas, which may be due to the lack of removal processes or uncertainties in fire emission in central and southern Africa. In contrast, the NGACv2 results show underprediction in total AOD forecast at most of the AERONET sites in this region.
Overall, the model-predicted total AOD variation by GEFS-Aerosols indicates much better performance than that of NGACv2 over western northern Africa. Although GEFS-Aerosols shows reductions in dust emissions over the Saharan dust source, the correlations with observations from downwind AERONET sites in western Africa are improved over those for NGACv2. The largest biases and discrepancies of GEFS-Aerosols and NGACv2 are both indicated in the sites in Tajikistan, which may be associated with a missing dust source near this site for both models. Obviously, other than the updates in anthropogenic and fire emissions, the implementation of the FENGSHA dust scheme in GEFS-Aerosols also shows great improvements in the dust concentration and AOD predictions over the dust regions compared to that of NGACv2, which used the original GOCART dust scheme.
We also evaluated predicted aerosol concentrations with different resolutions against the ATom-1 aircraft measurements from July to August 2016. Overall, predicted aerosol concentrations are quite comparable to the ATom-1 measurements along the flight tracks globally with ∼ 25 km model resolution. The model shows good performance in reproducing vertical profiles of OC, BC, sulfate, dust, and sea salt, and the locations of fire plumes were captured well overall. Sulfate over the Pacific and South and tropical Atlantic is significantly underpredicted, suggesting an underestimation in the oceanic sulfur sources such as DMS. A clear trend in increased overprediction with altitude for BC suggests that further refinements in characterizing precipitation scavenging of aerosol in GEFS-Aerosols is needed, since this is the only loss process for BC other than surface deposition. Compared to NGACv2, the much better performance of the dust vertical profile at high latitude over the Atlantic may suggest that the dust removal processes (either dry or wet deposition) may be more accurate in GEFS-Aerosols. That may be partly associated with different atmospheric models and physical scheme versions used in GEFS-Aerosols. The differences in large-scale wet deposition and convective wet scavenging schemes between GEFS-Aerosols and NGACv2 may also contribute to the substantial improvements shown in GEFS-Aerosols prediction for both AOD and concentrations.
This paper provides an overview of advances and challenges in model development for operational atmospheric aerosol predictions at the NOAA. This implementation advanced the global aerosol forecast capability for NOAA and made a step forward toward developing a global aerosol data assimilation system. Currently, the assimilation of AOD based on satellite observations is under development to constrain aerosol distributions in the GEFS-Aerosols model. Initial testing shows promise for improvement of predictions as well as limitations, indicating the need for refinements in quality control, data assimilation impacts on aerosol composition and vertical distribution, as well as bias correction of satellite observations, with bias and other errors substantially reduced in GEFS-Aerosols, especially when it is equipped with an aerosol data assimilation system. Currently, though the aerosol feedback from the aerosol components has not yet been included in the atmospheric model for direct and indirect radiative feedback, the model provides a good starting point from which to investigate at the impact on weather predictions out to sub-seasonal and seasonal scales when including the aerosol feedbacks in the atmospheric system in the future plan.
The GEFS-Aerosols v1 code and model configuration for aerosol forecast here are available at https://doi.org/10.5281/zenodo.5655290 (Zhang et al., 2021). ATom-1 data are publicly available at the Oak Ridge National Laboratory Distributed Active Archive Center: https://daac.ornl.gov/ATOM/guides/ATom_merge.html (last access: 18 June 2022) (DOI: https://doi.org/10.3334/ornldaac/1581, Wofsy et al., 2018).
LZ and RM were the major developers of the GEFS-Aerosols model, including implementing and coupling the aerosol components to the FV3GFSv15 meteorological model. SAM helped to process the anthropogenic emission and background input data, provided suggestions during the development of GEFS-Aerosols, and evaluated the model performance with ATom-1 observations. SAM retired at the end of 2021. BB developed and implemented the FENGSHA dust scheme in GEFS-Aerosols. PSB helped to evaluate the GEFS-Aerosols real-time and operational predictions. GAG provided oversight of the model development. LZ and JH developed the workflow for GEFS-Aerosols prediction and worked with LP to perform and manage the real-time and retrospective forecasts. RA provided guidance on the implementation of the fire plume rise scheme. SK, XZ, and FL provided the GBBEPx v3 data. The other co-authors provided help, suggestions, and project management throughout the GEFS-Aerosols modeling system development. LZ prepared the manuscript with contributions from all the co-authors.
The contact author has declared that none of the authors has any competing interests.
The scientific results and conclusions as well as any views or opinions expressed herein are those of the authors and do not necessarily reflect
the views of the NOAA or the Department of Commerce.
Publisher's note: Copernicus Publications remains neutral with regard to jurisdictional claims in published maps and institutional affiliations.
Li Zhang, Raffaele Montuoro, Haiqin Li, and Ravan Ahmadov were supported by funding from NOAA GSL award no. NA17OAR4320101. This work was also supported by the UFS Research to Operations Medium Range Weather/Seasonal to Subseasonal Atmospheric Composition sub-project.
This research has been supported by the National Oceanic and Atmospheric Administration (grant no. NA17OAR4320101).
This paper was edited by Samuel Remy and reviewed by two anonymous referees.
Ahmadov, R., Grell, G., James, E., Csiszar, I., Tsidulko, M., Pierce, B., McKeen, S., Benjamin, S., Alexander, C., Pereira, G., Freitas, S., and Goldberg, M.: Using VIIRS Fire Radiative Power data to simulate biomass burning emissions, plume rise and smoke transport in a real-time air quality modeling system, 2017 Ieee International Geoscience and Remote Sensing Symposium, IEEE International Geoscience and Remote Sensing Symposium (IGARSS), 2806–2808, https://doi.org/10.1109/IGARSS.2017.8127581, 2017.
Bauer, S. E., Im, U., Mezuman, K., and Gao, C. Y.: Desert dust, industrialization, and agricultural fires: Health impacts of outdoor air pollution in Africa, J. Geophys. Res.-Atmos., 124, 4104–4120, https://doi.org/10.1029/2018JD029336, 2019.
Benedetti, A., Morcrette, J.-J., Boucher, O., Dethof, A., Engelen, R. J., Fisher, M., Flentje, H., Huneeus, N., Jones, L., Kaiser, J. W., Kinne, S., Mangold, A., Razinger, M., Simmons, A. J., and Suttie, M.: Aerosol analysis and forecast in the European Centre for Medium-Range Weather Forecasts Integrated Forecast System: 2. Data assimilation, J. Geophys. Res., 114, D13205, https://doi.org/10.1029/2008JD011115, 2009.
Benedetti, A., Reid, J. S., and Colarco, P. R.: International cooperative for aerosol prediction workshop on aerosol forecast verification, B. Am. Meteorol. Soc., 92, ES48–ES53, https://doi.org/10.1175/BAMS-D-11-00105.1, 2011.
Bhattacharjee, P. S., Wang, J., Lu, C.-H., and Tallapragada, V.: The implementation of NEMS GFS Aerosol Component (NGAC) Version 2.0 for global multispecies forecasting at NOAA/NCEP – Part 2: Evaluation of aerosol optical thickness, Geosci. Model Dev., 11, 2333–2351, https://doi.org/10.5194/gmd-11-2333-2018, 2018.
Bhattacharjee, P. S., Zhang, L., Baker, B., Pan, L., Montuoro, R., Grell, A. G., and McQueen, J.: Evaluation of Aerosol Optical Depth forecast from NOAA's Global Aerosol Forecast Model (GEFS-Aerosols), Weather Forecast., submitted, 2022.
Black, T. L., Abeles, J. A., Blake, B. T., Jovic, D., Rogers, E., Zhang, X., Aligo, E. A., Dawson, L. C., Lin, Y., Strobach, E., Shafran, P. C., and Carley, J. R.: A limited area modeling capability for the Finite-Volume Cubed-Sphere (FV3) dynamical core and comparison with a global two-way nest, J. Adv. Model. Earth Sy., 13, e2021MS002483, https://doi.org/10.1029/2021MS002483, 2021.
Bloom, S., da Silva, A., and Dee, D.: Documentation and validation of the Goddard Earth Observing System (GEOS) data assimilation system-version 4, 1–187, https://ntrs.nasa.gov/citations/20050175690 (last access: 5 July 2022), 2005.
Bourgeois, I., Peischl, J., Thompson, C. R., Aikin, K. C., Campos, T., Clark, H., Commane, R., Daube, B., Diskin, G. W., Elkins, J. W., Gao, R.-S., Gaudel, A., Hintsa, E. J., Johnson, B. J., Kivi, R., McKain, K., Moore, F. L., Parrish, D. D., Querel, R., Ray, E., Sánchez, R., Sweeney, C., Tarasick, D. W., Thompson, A. M., Thouret, V., Witte, J. C., Wofsy, S. C., and Ryerson, T. B.: Global-scale distribution of ozone in the remote troposphere from the ATom and HIPPO airborne field missions, Atmos. Chem. Phys., 20, 10611–10635, https://doi.org/10.5194/acp-20-10611-2020, 2020.
Bozzo, A., Benedetti, A., Flemming, J., Kipling, Z., and Rémy, S.: An aerosol climatology for global models based on the tropospheric aerosol scheme in the Integrated Forecasting System of ECMWF, Geosci. Model Dev., 13, 1007–1034, https://doi.org/10.5194/gmd-13-1007-2020, 2020.
Burnett, R., Chen, H., Szyszkowicz, M., Fann, N., Hubbell, B., Pope, C. A., Spte, J. S., Brauer, M., Cohen, A., Weichenthal, S., Coggins, J., Di, Q., Brunekreef, B., Frostad, F., Lim, S. S., Kan, H., Walker, K. D., Thurston, G. D., Hayes, R. B., Lim, C. C., Turner, M. C., Jerrett, M., Krewski, D., Gapstur, S. M., Diver, W. R., Ostro, B., Goldberg, D., Crouse, D. L., Martin, R. V., Peters, P., Pinault, L., Tjepkema, M., Donkelaar, A., Villeneuve, P. J., Miller, A. B., Yin, P., Zhou, M., Wang, L., Janssen N. A. H., Marra, M., Atkinson, R. W., Tsang, H., Thach, T. Q., Cannon, J. B., Allen, R. T., Hart, J. E., Laden, F., Cesaroni, G., Forastisere, F., Weinmayr, G., Jaensch, A., Nagel, G., Concin, H., and Spadaro, J. V.: Global estimates of mortality associated with longterm exposure to outdoor fine particulate matter, P. Natl. Acad. Sci. USA, 115, 9592–9597, https://doi.org/10.1073/pnas.1803222115, 2018.
Chappell, A. and Webb, N. P.: Using albedo to reform wind erosion modelling, mapping and monitoring, Aeolian Res., 23, 63–78, https://doi.org/10.1016/j.aeolia.2016.09.006, 2016.
Chen, J. M., Li, C. L., Ristovski, Z., Milic, A., Gu, Y. T., Islam, M. S., Wang, S. X., Hao, J. M., Zhang, H. F., He, C. R., Guo, H., Fu, H. B., Miljevic, B., Morawska, L., Thai, P., Fat, L., Pereira, G., Ding, A. J., Huang, X., and Dumka, U. C.: A review of biomass burning: Emissions and impacts on air quality, health and climate in China, Sci. Total Environ., 579, 1000–1034, https://doi.org/10.1016/j.scitotenv.2016.11.025, 2017.
Chen, Q., Yin, Y., Jin, L.-J., Xiao, H., Zhu, S.-Ch.: The effect of aerosol layers on convective cloud microphysics and precipitation, Atmos. Res., 101, 327–340, https://doi.org/10.1016/j.atmosres.2011.03.007, 2011.
Chin, M., Rood, B. R., Lin, S.-J., Muller, F. J., and Thomspon, M. A.: Atmospheric sulfur cycle in the global model GOCART: Model description and global properties, J. Geophys. Res., 105, 24671–24687, 2000.
Chin, M., Ginoux, P., Kinne, S., Torres, O., Holben, B., Duncan, B., Martin, R., Logan, J., Higurashi, A., and Nakajima, T.: Tropospheric aerosol optical thickness from the GOCART model and comparisons with satellite and Sun photometer measurements, J. Atmos. Sci., 59, 461–483, 2002.
Choi, Y., Kanaya, Y., Takigawa, M., Zhu, C., Park, S.-M., Matsuki, A., Sadanaga, Y., Kim, S.-W., Pan, X., and Pisso, I.: Investigation of the wet removal rate of black carbon in East Asia: validation of a below- and in-cloud wet removal scheme in FLEXible PARTicle (FLEXPART) model v10.4, Atmos. Chem. Phys., 20, 13655–13670, https://doi.org/10.5194/acp-20-13655-2020, 2020.
Colarco, P., da Silva, A., Chin, M., and Diehl, T.: Online simulations of global aerosol distributions in the NASA GEOS-4 model and comparisons to satellite and ground-based aerosol optical depth, J. Geophys. Res., 115, D14207, https://doi.org/10.1029/2009JD012820, 2010.
Colarco, P., Benedetti, A., Reid, J., and Tanaka, T.: Using EOS data to improve aerosol forecasting: the International Cooperative for Aerosol Research (ICAP), Earth Observ., 26, 14–19, 2014a.
Colarco, P. R., Kahn, R. A., Remer, L. A., and Levy, R. C.: Impact of satellite viewing-swath width on global and regional aerosol optical thickness statistics and trends, Atmos. Meas. Tech., 7, 2313–2335, https://doi.org/10.5194/amt-7-2313-2014, 2014b.
Darmenov, A. and da Silva, A.: The Quick Fire Emissions Dataset (QFED) – Documentation of versions 2.1, 2.2 and 2.4, NASA Technical Report Series on Global Modeling and Data Assimilation, NASA/TM-2015–104606, Vol. 38, 211 pp., http://citeseerx.ist.psu.edu/viewdoc/download?doi=10.1.1.406.7724&rep=rep1&type=pdf (last access: 5 July 2022), 2015.
Diehl, T., Heil, A., Chin, M., Pan, X., Streets, D., Schultz, M., and Kinne, S.: Anthropogenic, biomass burning, and volcanic emissions of black carbon, organic carbon, and SO2 from 1980 to 2010 for hindcast model experiments, Atmos. Chem. Phys. Discuss., 12, 24895–24954, https://doi.org/10.5194/acpd-12-24895-2012, 2012.
Easter, R. C., Ghan, S. J., Zhang, Y., Saylor, R. D., Chapman, E. G., Laulainen, N. S., Abdul-Razzak, H., Leung, L. R., Bian, X., and Zaveri, R. A.: MIRAGE: Model Description and Evaluation of Aerosols and Trace Gases, J. Geophys. Res., 109, D20210, https://doi.org/10.1029/2004JD004571, 2004.
Eck, T. F., Holben, B. N., Reid, J. S., Dubovik, O., Smirnov, A., O'Neill, N. T., Slutsker, I., and Kinne, S.: The wavelength dependence of the optical depth of biomass burning, urban and desert dust aerosols, J. Geophys. Res., 104, 31333–31350, 1999.
Fast, J. D., Gustafson Jr., I. W., Easter, C. R., Zaveri, A. R., Barnard, C. J., Chapman, G. E., Grell, A. G., and Peckham, E. S.: Evolution of ozone, particulates, and aerosol direct radiative forcing in the vicinity of Houston using a fully coupled meteorology-chemistry-aerosol model, J. Geophys. Res., 111, D21305, https://doi.org/10.1029/2005JD006721, 2006.
Fécan, F., Marticorena, B., and Bergametti, G.: Parametrization of the increase of the aeolian erosion threshold wind friction velocity due to soil moisture for arid and semi-arid areas, Ann. Geophys., 17, 149–157, https://doi.org/10.1007/s00585-999-0149-7, 1998.
Forkel, R., Werhahn, J., Buus Hansen, A., McKeen, S., Peckham, S., Grell, G., and Suppan, P.: Effect of aerosol-radiation feedback on regional air qualityeacase study with WFR/Chem, Atmos. Environ., 53, 202e211, https://doi.org/10.1016/j.atmosenv.2011.10.009, 2012.
Freitas, S. R., Longo, K. M., Chatfield, R., Latham, D., Silva Dias, M. A. F., Andreae, M. O., Prins, E., Santos, J. C., Gielow, R., and Carvalho Jr., J. A.: Including the sub-grid scale plume rise of vegetation fires in low resolution atmospheric transport models, Atmos. Chem. Phys., 7, 3385–3398, https://doi.org/10.5194/acp-7-3385-2007, 2007.
Freitas, S. R., Longo, K. M., Alonso, M. F., Pirre, M., Marecal, V., Grell, G., Stockler, R., Mello, R. F., and Sánchez Gácita, M.: PREP-CHEM-SRC – 1.0: a preprocessor of trace gas and aerosol emission fields for regional and global atmospheric chemistry models, Geosci. Model Dev., 4, 419–433, https://doi.org/10.5194/gmd-4-419-2011, 2011.
Froyd, K. D., Murphy, D. M., Brock, C. A., Campuzano-Jost, P., Dibb, J. E., Jimenez, J.-L., Kupc, A., Middlebrook, A. M., Schill, G. P., Thornhill, K. L., Williamson, C. J., Wilson, J. C., and Ziemba, L. D.: A new method to quantify mineral dust and other aerosol species from aircraft platforms using single-particle mass spectrometry, Atmos. Meas. Tech., 12, 6209–6239, https://doi.org/10.5194/amt-12-6209-2019, 2019.
Gelaro, R., McCarty, W., Suárez, M. J., Todling, R., Molod, A., Takacs, L., Randles, C. A., Darmenov, A., Bosilovich, M. G., Reichle, R., Wargan, K., Coy, L., Cullather, R., Draper, C., Akella, S., Buchard, V., Conaty, A., da Silva, A. M., Gu, W., Kim, G., Koster, R., Lucchesi, D. Merkova, J. E., Nielsen, G., Partyka, G., Pawson, S., Putman, W., Rienecker, M., Schubert, S. D., Sienkiewicz, M., and Zhao, B.: The Modern-Era Retrospective Analysis for Research and Applications, Version 2 (MERRA-2), J. Climate, 30, 5419–5454, https://doi.org/10.1175/JCLI-D-16-0758.1, 2017.
Gillette, D. A.: Threshold friction velocities for dust production for agricultural soils, J. Geophys. Res., 93, 12645–12662, https://doi.org/10.1029/jd093id10p12645, 1988.
Gillette, D. A., Adams, J., Endo, A., Smith, D., and Kihl, R.: Threshold velocities for input of soil particles into the air by desert soils, J. Geophys. Res., 85, 5621–5630, https://doi.org/10.1029/JC085iC10p05621, 1980.
Grell, G., Freitas, S. R., Stuefer, M., and Fast, J.: Inclusion of biomass burning in WRF-Chem: impact of wildfires on weather forecasts, Atmos. Chem. Phys., 11, 5289–5303, https://doi.org/10.5194/acp-11-5289-2011, 2011.
Grell, G. A., Peckham, E. S., Schmitz, R., McKeen, A. S., Frost, G., Skamarock, W., and Eder, B.: Fully-coupled online chemistry within the WRF model, Atmos. Environ., 39, 6957–6975, https://doi.org/10.1016/j.atmosenv.2005.04.027, 2005.
Hoesly, R. M., Smith, S. J., Feng, L., Klimont, Z., Janssens-Maenhout, G., Pitkanen, T., Seibert, J. J., Vu, L., Andres, R. J., Bolt, R. M., Bond, T. C., Dawidowski, L., Kholod, N., Kurokawa, J.-I., Li, M., Liu, L., Lu, Z., Moura, M. C. P., O'Rourke, P. R., and Zhang, Q.: Historical (1750–2014) anthropogenic emissions of reactive gases and aerosols from the Community Emissions Data System (CEDS), Geosci. Model Dev., 11, 369–408, https://doi.org/10.5194/gmd-11-369-2018, 2018.
Holben, B. N., Eck, T. F., Slutsker, I., Tanré, D., Buis, J. P., Setzer, A., Vermote, E., Reagan, J. A., Kaufman, Y. J., Nakajima, T., Lavenu, F., Jankowiak, I., and Smirnov, A.: AERONET – A Federated instrument network and data archive for aerosol characterization, Remote Sens. Environ., 66, 1–16, 1998.
Hollingsworth, A., Engelen, R. J., Textor, C., Benedetti, A., Boucher, O., Chevallier, F., Dethof, A., Elbern, H., Eskes, H., Flemming, J., Granier, C., Kaiser, J. W., Morcrette, J.-J., Rayner, P., Peuch, V.-H., Rouil, L., Schultz, M. G., and Simmons, A. J.: Toward a Monitoring and Forecasting System For Atmospheric Composition: The GEMS Project, B. Am. Meteorol. Soc., 89, 1147–1164, 2008.
Hsu, N. C., Jeong, M.-J., Bettenhausen, C., Sayer, A. M., Hansell, R., Seftor, C. S., Huang, J., and Tsay, S.-C.: Enhanced Deep Blue aerosol retrieval algorithm: The second generation, J. Geophys. Res.-Atmos., 118, 9296–9315, https://doi.org/10.1002/jgrd.50712, 2013.
Jackson, J., Liu, H., Laszlo, I., Kondragunta, S., Remer, L. A., Huang, J., and Huang, H.-C.: Suomi-NPP VIIRS Aerosol Algorithms and Data Products, J. Geophys. Res., 118, 12673–12689, https://doi.org/10.1002/2013jd020449, 2013.
Janssens-Maenhout, G.: EDGARv4.1 Emission Time Series, European Commission, Joint Research Centre (JRC) (Dataset) PID, a http://data.europa.eu/89h/jrc-edgar-emissiontimeseriesv41 (last access: 12 June 2018), 2010.
Janssens-Maenhout, G., Crippa, M., Guizzardi, D., Dentener, F., Muntean, M., Pouliot, G., Keating, T., Zhang, Q., Kurokawa, J., Wankmüller, R., Denier van der Gon, H., Kuenen, J. J. P., Klimont, Z., Frost, G., Darras, S., Koffi, B., and Li, M.: HTAP_v2.2: a mosaic of regional and global emission grid maps for 2008 and 2010 to study hemispheric transport of air pollution, Atmos. Chem. Phys., 15, 11411–11432, https://doi.org/10.5194/acp-15-11411-2015, 2015.
Kok, J. F.: A scaling theory for the size distribution of emitted dust aerosols suggests climate models underestimate the size of the global dust cycle, P. Natl. Acad. Sci. USA, 108, 1016–1021, https://doi.org/10.1073/pnas.1014798108, 2011.
Levy, R. C., Mattoo, S., Munchak, L. A., Remer, L. A., Sayer, A. M., Patadia, F., and Hsu, N. C.: The Collection 6 MODIS aerosol products over land and ocean, Atmos. Meas. Tech., 6, 2989–3034, https://doi.org/10.5194/amt-6-2989-2013, 2013.
Liu, F., Zhang, Q., van der A, R. J., Zheng, B., Tong, D., Yan, L., Zheng, Y., and He, K.: Recent reduction in NOx emissions over China: synthesis of satellite observations and emission inventories, Environ. Res. Lett., 11, 114002, https://doi.org/10.1088/1748-9326/11/11/114002, 2016.
Liu, H., Remer, L. A., Huang, J., Huang, H.-C., Kondragunta, S., Laszlo, I., Oo, M., and Jackson, J. M.: Preliminary Evaluation of Suomi-NPP VIIRS Aerosol Optical Thickness, J. Geophys. Res., 119, 3942–3962, https://doi.org/10.1002/2013jd020360, 2013.
Lu, C.-H., da Silva, A., Wang, J., Moorthi, S., Chin, M., Colarco, P., Tang, Y., Bhattacharjee, P. S., Chen, S.-P., Chuang, H.-Y., Juang, H.-M. H., McQueen, J., and Iredell, M.: The implementation of NEMS GFS Aerosol Component (NGAC) Version 1.0 for global dust forecasting at NOAA/NCEP, Geosci. Model Dev., 9, 1905–1919, https://doi.org/10.5194/gmd-9-1905-2016, 2016.
Lu, S., Huang, H.-C., Hou, Y.-T., Tang, Y., McQueen, J., da Silva, A., Chin, M., Joseph, E., and Stockwell, W.: Development of NCEP Global Aerosol Forecasting System: an overview and its application for improving weather and air quality forecasts, in: NATO Science for Peace and Security Series: Air Pollution Modelling and Its Application XX, Springer Publications, Dordrecht, the Netherlands, 451–454, https://doi.org/10.1007/978-90-481-3812-8, 2010.
MacKinnon, D. J., Clow, G. D., Tigges, R. K., Reynolds, R. L., and Chaves Jr., P. S.: Comparison of aerodynamically and model-derived roughness lengths (z0) over diverse surfaces, central Mojave Desert, California, USA, Geomorphology, 63, 103–113, https://doi.org/10.1016/j.geomorph.2004.03.009, 2004
Marticorena, B. and Bergametti, G.: Modeling the atmospheric dust cycle: 1-Design of a soil derived dust production scheme, J. Geophys. Res., 100, 16415–16430, 1995.
Molod, A., Takacs, L., Suarez, M., and Bacmeister, J.: Development of the GEOS-5 atmospheric general circulation model: evolution from MERRA to MERRA2, Geosci. Model Dev., 8, 1339–1356, https://doi.org/10.5194/gmd-8-1339-2015, 2015.
Morcrette, J.-J., Boucher, O., Jones, L., Salmond, D., Bechtold, P., Beljaars, A., Benedetti, A., Bonet, A., Kaiser, J. W., Razinger, M., Schulz, M., Serrar, S., Simmons, A. J., Sofiev, M., Suttie, M., Tompkins, A. M., and Untch, A.: Aerosol analysis and forecast in the European Centre for Medium-Range Weather Forecasts Integrated Forecast System: forward modelling, J. Geophys. Res., 114, D06206, https://doi.org/10.1029/2008JD011235, 2009.
Muhlbauer, A., Grabowski, W. W., Malinowski, P. S., Ackerman, P. T., Bryan, H. G., Lebo, J. Z., Milbrandt, A. J., Morrison, H., Ovchinnikov, M., Tessendorf, S., and Thériault, G. J. M.: Thompson Reexamination of the state of the art of cloud modelling shows real improvements, B. Am. Meteorol. Soc., 94, ES45–ES48, https://doi.org/10.1175/BAMS-D-12-00188.1, 2013.
Mulcahy, J. P., Walters, D. N., Bellouin, N., and Milton, S. F.: Impacts of increasing the aerosol complexity in the Met Office global numerical weather prediction model, Atmos. Chem. Phys., 14, 4749–4778, https://doi.org/10.5194/acp-14-4749-2014, 2014.
Murphy, D., Froyd, K., Apel, E.,Blake, R. D., Blake, J. N., Evangeliou, N., Hornbrook, S. R., Peischl, J., Ray, E., Ryerson,B. T., Thompson, C., and Stohl, A.: An aerosol particle containing enriched uranium encountered in the remote T upper troposphere, J. Environ. Radioactiv., 184–185, 95-100, https://doi.org/10.1016/j.jenvrad.2018.01.006, 2018.
Murphy, D. M., Froyd, K. D., Bian, H., Brock, C. A., Dibb, J. E., DiGangi, J. P., Diskin, G., Dollner, M., Kupc, A., Scheuer, E. M., Schill, G. P., Weinzierl, B., Williamson, C. J., and Yu, P.: The distribution of sea-salt aerosol in the global troposphere, Atmos. Chem. Phys., 19, 4093–4104, https://doi.org/10.5194/acp-19-4093-2019, 2019.
Owen, P. R.: Saltation of uniform grains in air, J. Fluid Mech., 20, 225–242, https://doi.org/10.1017/S0022112064001173, 1964.
Powers, J. G., Klemp, J. B., Skamarock, W. C., Davis, C. A., Dudhia, J., Gill, D. O., Coen, J. L., Gochis, D. J., Ahmadov, R., Peckham, S. E., Grell, G. A., Michalakes, J., Trahan, S., Benjamin, S. G., Alexander, C. R., Dimego, G. J., Wang, W., Schwartz, C. S., Romine, G. S., Liu, Z., Snyder, C., Chen, F., Barlage, M. J., Yu, W., and Duda, M. G.: The Weather Research and Forecasting Model: Overview, System Efforts, and Future Directions, B. Am. Meteorol. Soc., 98, 1717–1737, 2017.
Prigent, C., Jiménez, C., and Catherinot, J.: Comparison of satellite microwave backscattering (ASCAT) and visible/near-infrared reflectances (PARASOL) for the estimation of aeolian aerodynamic roughness length in arid and semi-arid regions, Atmos. Meas. Tech., 5, 2703–2712, https://doi.org/10.5194/amt-5-2703-2012, 2012.
Raupach, M. R.: Drag and drag partition on rough surfaces. Bound.-Lay. Meteorol., 60, 374–396, https://doi.org/10.1007/BF00155203, 1992.
Reale, O., Lau, K. M., and da Silva, A.: Impact of interactive aerosol on the African easterly jet in the NASA GEOS-5 Global Forecasting System, Weather Forecast., 26, 504–519, 2011.
Reid, J., Benedetti, A., Colarco, P. R., and Hansen, J. A.: International operational aerosol observability work-shop, B. Am. Meteorol. Soc., 92, ES21–ES24, https://doi.org/10.1175/2010BAMS3183.1, 2011.
Rienecker, M. M., Suarez, M. J., Todling, R., Bacmeister, J., Takacs, L., Liu, H.-C., Gu, W., Sienkiewicz, M., Koster, R. D., Gelaro, R., Stajner, I., and Nielsen, J. E.: The GEOS-5 data assimilation system: documentation of versions 5.0.1, 5.1.0, and 5.2.0., NASA Tech. Memo. 2008-104606, 2008.
Rodwell, M. J. and Jung, T.: Understanding the local and global impacts of model physics changes: an aerosol example, Q. J. Roy. Meteor. Soc., 134, 1479–1497, https://doi.org/10.1002/qj.298, 2008.
Sayer, A. M., Hsu, N. C., Bettenhausen, C., and Jeong, M.-J.: Validation and uncertainty estimates for MODIS Collection 6 “Deep Blue” aerosol data, J. Geophys. Res.-Atmos., 118, 7864–7872, https://doi.org/10.1002/jgrd.50600, 2013.
Sayer, A. M., Munchak, L. A., Hsu, N. C., Levy, R. C., Bettenhausen, C., and Jeong M.-J.: MODIS Collection 6 aerosol products: Comparison between Aqua's e-Deep blue, dark target and “merged” data sets and usage recommendations, J. Geophys. Res.-Atmos., 119, 13965–989, 2014.
Schill, G. P., Froyd, K. D., Bian, H., Kupc, A., Williamson, C., Brock, C. A., Ray, E., Hornbrook, R. S., Hills, A. J., Apel, E. C., Chin, M., Colarco, P. R., and Murphy, D. M.: Widespread biomass burning smoke throughout the remote troposphere, Nat. Geosci., 13, 422–424, https://doi.org/10.1038/s41561-020-0586-1, 2020.
Sessions, W. R., Reid, J. S., Benedetti, A., Colarco, P. R., da Silva, A., Lu, S., Sekiyama, T., Tanaka, T. Y., Baldasano, J. M., Basart, S., Brooks, M. E., Eck, T. F., Iredell, M., Hansen, J. A., Jorba, O. C., Juang, H.-M. H., Lynch, P., Morcrette, J.-J., Moorthi, S., Mulcahy, J., Pradhan, Y., Razinger, M., Sampson, C. B., Wang, J., and Westphal, D. L.: Development towards a global operational aerosol consensus: basic climatological characteristics of the International Cooperative for Aerosol Prediction Multi-Model Ensemble (ICAP-MME), Atmos. Chem. Phys., 15, 335–362, https://doi.org/10.5194/acp-15-335-2015, 2015.
Shao, Y., Raupach, M. R., and Findlater, P. A.: Effect of saltation bombardment on the entrainment of dust by wind, J. Geophys. Res., 98, 12719–12726, https://doi.org/10.1029/93jd00396, 1993.
Shao, Y., Ishizuka, M., Mikami, M., and Leys, J. F.: Parameterization of size-resolved dust emission and validation with measurements, J. Geophys. Res.-Atmos., 116, D08203, https://doi.org/10.1029/2010JD014527, 2011.
Shi, X. and Brasseur, G. P.: The response in air quality to the reduction of Chinese economic activities during the COVID-19 outbreak, Geophys. Res. Lett., 47, e2020GL088070, https://doi.org/10.1029/2020GL088070, 2020.
Slinn, W. G. N.: Precipitation scavenging, in: Atmospheric Science and Power Production, edited by: Randerson, D., U.S. Dept. of Energy, Washington D. C., 472–477, 1984.
Theurich, G., DeLuca, C., Campbell, T., Liu, F., Saint, K., Vertenstein, M., Chen, J., Oehmke, R., Doyle, J., Whitcomb, T., Wallcraft, A., Iredell, M., Black, T., da Silva, A. M., Clune, T., Ferraro, R., Li, P., Kelley, M., Aleinov, I., Balaji, V., Zadeh, N., Jacob, R., Kirtman, B., Giraldo, F., McCarren, D., Sandgathe, S., Peckham, S., and Dunlap IV, R.: The Earth System Prediction Suite: Toward a coordinated U.S. modeling capability, B. Am. Meteorol. Soc., 97, 1229–1247, https://doi.org/10.1175/BAMS-D-14-00164.1, 2016.
Tong, D. Q., Wang, J. X. L., Gill, T. E., Lei, H., and Wang, B.: Intensified dust storm activity and Valley fever infection in the southwestern United States, Geophys. Res. Lett., 44, 4304–4312, https://doi.org/10.1002/2017GL073524, 2017.
Wang, H., Rasch, J. P., Easter, C. R., Singh, B., Zhang, R., Ma, P.-L., Qian, Y., Ghan, J. S., and Beagley, N.: Using an explicit emission tagging method in global modeling of source receptor relationships for black carbon in the Arctic: Variations, sources, and transport pathways, J. Geophys. Res.-Atmos., 119, 12888–12909, https://doi.org/10.1002/2014JD022297, 2014.
Wang, J., Bhattacharjee, P. S., Tallapragada, V., Lu, C.-H., Kondragunta, S., da Silva, A., Zhang, X., Chen, S.-P., Wei, S.-W., Darmenov, A. S., McQueen, J., Lee, P., Koner, P., and Harris, A.: The implementation of NEMS GFS Aerosol Component (NGAC) Version 2.0 for global multispecies forecasting at NOAA/NCEP – Part 1: Model descriptions, Geosci. Model Dev., 11, 2315–2332, https://doi.org/10.5194/gmd-11-2315-2018, 2018.
Wang, Q. and Su, M.: A preliminary assessment of the impact of COVID-19 on environment–a case study of China, Sci. Total Environ., 728, 138915, https://doi.org/10.1016/j.scitotenv.2020.138915, 2020.
Wang, Q., Jacob, J. D., Spackman, R. J., Perring, E. A., Schwarz, P. J., Moteki, N., Marais, A. E., Ge, C., Wang, J., and Barrett, R. H. S.: Global budget and radiative forcing of black carbon aerosol: Constraints from pole-to-pole (HIPPO) observations across the Pacific, J. Geophys. Res.-Atmos., 119, 195–206, https://doi.org/10.1002/2013JD020824, 2014.
Wofsy, S. C., Afshar, S., Allen, H. M., Apel, E., Asher, E. C., Barletta, B., Bent, J., Bian, H., Biggs, B. C., Blake, D. R., Blake, N., Bourgeois, I., Brock, C. A., Brune, W. H., Budney, J. W., Bui, T. P., Butler, A., Campuzano-Jost, P., Chang, C. S., Chin, M., Commane, R., Correa, G., Crounse, J. D., Cullis, P. D., Daube, B. C., Day, D. A., Dean-Day, J. M., Dibb, J. E., Di- Gangi, J. P., Diskin, G. S., Dollner, M., Elkins, J. W., Erdesz, F., Fiore, A. M., Flynn, C. M., Froyd, K., Gesler, D. W., Hall, S. R., Hanisco, T. F., Hannun, R. A., Hills, A. J., Hintsa, E. J., Hoffman, A., Hornbrook, R. S., Huey, L. G., Hughes, S., Jimenez, J. L., Johnson, B. J., Katich, J. M., Keeling, R. F., Kim, M. J., Kupc, A., Lait, L. R., Lamarque, J.-F., Liu, J., McKain, K., Mclaughlin, R. J., Meinardi, S., Miller, D. O., Montzka, S. A., Moore, F. L., Morgan, E. J., Murphy, D. M., Murray, L. T., Nault, B. A., Neuman, J. A., Newman, P. A., Nicely, J. M., Pan, X., Paplawsky, W., Peischl, J., Prather, M. J., Price, D. J., Ray, E., Reeves, J. M., Richardson, M., Rollins, A. W., Rosenlof, K. H., Ryerson, T. B., Scheuer, E., Schill, G. P., Schroder, J. C., Schwarz, J. P., St.Clair, J. M., Steenrod, S. D., Stephens, B. B., Strode, S. A., Sweeney, C., Tanner, D., Teng, A. P., Thames, A. B., Thompson, C. R., Ullmann, K., Veres, P. R., Vieznor, N., Wagner, N. L., Watt, A., Weber, R., Weinzierl, B., Wennberg, P., Williamson, C. J., Wilson, J. C., Wolfe, G. M., Woods, C. T., and Zeng, L. H.: ATom: Merged Atmospheric Chemistry, Trace Gases, and Aerosols, ORNL DAAC [data set], Oak Ridge, Tennessee, https://doi.org/10.3334/ornldaac/1581, 2018.
Xian, P., Reid, J. S., Hyer, E. J., Sampson, C. R., Rubin, J. I., Ades, M., Asencio, N., Basart, S., Benedetti, A., Bhattacharjee, P. S., Brooks, M. E., Colarco, P. R., da Silva, A. M., Eck, T. F., Guth, J., Jorba, O.l., Kouznetsov, R., Kipling, Z., Sofiev, M., Garcia-Pando, C. P., Pradhan, Y., Tanaka, T., Wang, J., Westphal, D. L., Yumimoto, K., and Zhang J.: Current state of the global operational aerosol multi-model ensemble: An update from the International Cooperative for Aerosol Prediction (ICAP), Q. J. Roy. Meteor. Soc., 145, 176–209, https://doi.org/10.1002/qj.3497, 2019.
Xie, S. P., Lu, B., and Xiang, Q. B.: Similar spatial patterns of climate responses to aerosol and greenhouse gas changes, Nat. Geosci., 6, 828–832, https://doi.org/10.1038/ngeo1931, 2013.
Xing, J., Li, S., Jiang, Y., Wang, S., Ding, D., Dong, Z., Zhu, Y., and Hao, J.: Quantifying the emission changes and associated air quality impacts during the COVID-19 pandemic on the North China Plain: a response modeling study, Atmos. Chem. Phys., 20, 14347–14359, https://doi.org/10.5194/acp-20-14347-2020, 2020.
Yang, Q., Bitz, C. M., and Doherty, S. J.: Offsetting effects of aerosols on Arctic and global climate in the late 20th century, Atmos. Chem. Phys., 14, 3969–3975, https://doi.org/10.5194/acp-14-3969-2014, 2014.
Zhang, L., Montuoro, R., McKeen, S., Baker, B., Bhattacharjee, P., Grell, G., Henderson, J., Pan, L., Frost, G., McQueen, J., Saylor, R., Li, H., Ahmadov, R., Wang, J., Stajner, I., Kondragunta, S., Zhang, X., and Li, F.: Development and Evaluation of the Aerosol Forecast Member in NCEP's Global Ensemble Forecast System (GEFS-Aerosols v1), Zenodo [data set], https://doi.org/10.5281/zenodo.5655290, 2021.
Zhang, L., Grell, G. A., McKeen, S. A., Ahmadov, R., Froyd, K. D., and Murphy, D.: Inline coupling of simple and complex chemistry modules within the global weather forecast model FIM (FIM-Chem v1), Geosci. Model Dev., 15, 467–491, https://doi.org/10.5194/gmd-15-467-2022, 2022.
Zhang, Q., He, K., and Huo, H.: Cleaning China's air, Nature, 484, 161–162, https://doi.org/10.1038/484161a, 2012.
Zhang, X., Kondragunta, S., Ram, J., Schmidt, C., and Huang, H.-C.: Near-real-time global biomass burning emissions product from geostationary satellite constellation, J. Geophys. Res., 117, D14201, https://doi.org/10.1029/2012JD017459, 2012.
Zhang, X., Kondragunta, S., da Silva, A., Lu, S., Ding, H., Li, F., and Zhu, Y.: The blended global biomass burning emissions product from MODIS and geostationary satellites (GBBEPx), http://www.ospo.noaa.gov/Products/land/gbbepx/docs/GBBEPx_ATBD.pdf (last access: 1 June 2018), 2014.
Zhao, T. X., Stowe, L. L., Smirnov, A., Crosby, D., Sapper, J., and McClain, C. R.: Development of a global validation package for satellite oceanic aerosol optical thickness retrieval based on AERONET observations and its application to NOAA/NESDIS operational aerosol retrievals, J. Atmos. Sci., 59, 294–312, 2002.