the Creative Commons Attribution 4.0 License.
the Creative Commons Attribution 4.0 License.
 | 07 Jul 2022
Representation of the phosphorus cycle in the Joint UK Land Environment Simulator (vn5.5_JULES-CNP)
Mahdi André Nakhavali
Lina M. Mercado
Iain P. Hartley
Stephen Sitch
Fernanda V. Cunha
Raffaello di Ponzio
Laynara F. Lugli
Carlos A. Quesada
Kelly M. Andersen
Sarah E. Chadburn
Andy J. Wiltshire
Douglas B. Clark
Gyovanni Ribeiro
Lara Siebert
Anna C. M. Moraes
Jéssica Schmeisk Rosa
Rafael Assis
José L. Camargo
Most land surface models (LSMs), i.e. the land components of Earth system models (ESMs), include representation of nitrogen (N) limitation on ecosystem productivity. However, only a few of these models have incorporated phosphorus (P) cycling. In tropical ecosystems, this is likely to be important as N tends to be abundant, whereas the availability of rock-derived elements, such as P, can be very low. Thus, without a representation of P cycling, tropical forest response in areas such as Amazonia to rising atmospheric CO2 conditions remain highly uncertain. In this study, we introduced P dynamics and its interactions with the N and carbon (C) cycles into the Joint UK Land Environment Simulator (JULES). The new model (JULES-CNP) includes the representation of P stocks in vegetation and soil pools, as well as key processes controlling fluxes between these pools. We develop and evaluate JULES-CNP using in situ data collected at a low-fertility site in the central Amazon, with a soil P content representative of 60 % of soils across the Amazon basin, to parameterize, calibrate, and evaluate JULES-CNP. Novel soil and plant P pool observations are used for parameterization and calibration, and the model is evaluated against C fluxes and stocks and those soil P pools not used for parameterization or calibration. We then evaluate the model at additional P-limited test sites across the Amazon and in Panama and Hawaii, showing a significant improvement over the C- and CN-only versions of the model. The model is then applied under elevated CO2 (600 ppm) at our study site in the central Amazon to quantify the impact of P limitation on CO2 fertilization. We compare our results against the current state-of-the-art CNP models using the same methodology that was used in the AmazonFACE model intercomparison study. The model is able to reproduce the observed plant and soil P pools and fluxes used for evaluation under ambient CO2. We estimate P to limit net primary productivity (NPP) by 24 % under current CO2 and by 46 % under elevated CO2. Under elevated CO2, biomass in simulations accounting for CNP increase by 10 % relative to contemporary CO2 conditions, although it is 5 % lower compared to CN- and C-only simulations. Our results highlight the potential for high P limitation and therefore lower CO2 fertilization capacity in the Amazon rainforest with low-fertility soils.
- Article
(2193 KB) - Full-text XML
-
Supplement
(1928 KB) - BibTeX
- EndNote


Land ecosystems currently take up about 30 % of anthropogenic CO2 emissions (Friedlingstein et al., 2020), thus buffering the anthropogenic increase in atmospheric CO2. Tropical forests play a major role in the land C cycle, account for about half of global net primary production (NPP) (Schimel et al., 2015), and store the highest above-ground carbon among all biomes (Pan et al., 2011; Mitchard, 2018).
The C sink capacity of tropical forests may be constrained by nutrient availability for plant photosynthesis and growth (Vitousek and Howarth, 1991; Elser et al., 2007; LeBauer and Treseder, 2008) via P-related (Nordin et al., 2001; Shen et al., 2011) and/or N-related processes (DeLuca et al., 1992; Perakis and Hedin, 2002). Global process-based models of vegetation dynamics and function suggest a continued land C sink in the tropical forests, largely attributed to the CO2 fertilization effect (Sitch et al., 2008; Schimel et al., 2015; Koch et al., 2021). However, many of these models typically do not consider P constraints on plant growth (Fleischer et al., 2019), which is likely to be an important limiting nutrient in tropical ecosystems, characterized by old and heavily weathered soils. The importance of nutrient cycling representation in Earth system models (ESMs) (and the lack thereof) was highlighted by Hungate et al. (2003) and Zaehle and Dalmonech (2011), showing the significance of nitrogen inclusion in ESMs for generating more realistic estimations of the future evolution of the terrestrial C sink. However, in the Coupled Climate C Cycle Model Inter-comparison Project (C4MIP), none of the participating ESMs included N dynamics (Friedlingstein et al., 2006). Following this, for the update of CMIP5 7 years later (Anav et al., 2013), 3 models out of the 18 used included N dynamics (Ji et al., 2014; Long et al., 2013; Bentsen et al., 2013). Although much progress has been made in the inclusion of an N cycle in ESMs so far, none of the CMIP5 models included P cycling, and in the most recent CMIP6 only one model includes P (ACCESSESM1.5 model) (Arora et al., 2020).
The long history of soil development in tropical regions, which involves the loss of rock-derived nutrients through weathering and leaching on geologic timescales (Vitousek et al., 1997, 2010), results in highly weathered soils. Soil P is hypothesized to be among the key limiting nutrients to plant growth in tropical forests (Hou et al., 2020; Vitousek et al., 1997, 2010), which is unlike temperate forest, where N is hypothesized to be the main constraint (Aerts and Chapin, 1999; Luo et al., 2004). Low P availability in tropical soils is related to the limited amount of unweathered parent material and organic compounds (Walker and Syers, 1976), active sorption (Sanchez, 1977), and high occlusion (Yang and Post, 2011), which all contribute to further reduce plant-available P. Although N limitation can impact the terrestrial C sink response to increasing atmospheric CO2 by changing plant C fixation capacity (Luo et al., 2004), this can be partially ameliorated over time by input of N into the biosphere via the continuous input of N into ecosystems from atmospheric deposition and biological N fixation (Vitousek et al., 2010). P limitation is pervasive in natural ecosystems (Hou et al., 2020), and the lack of large P inputs into ecosystems, especially those growing on highly weathered soil, may make P limitation a stronger constraint on ecosystem response to elevated CO2 (eCO2) than N (Sardans et al., 2012; Gentile et al., 2012). This causes considerable uncertainty in predicting the future of the Amazon forest C sink (Yang et al., 2014).
There is evidence to suggest P limitation on plant productivity in the Amazon rainforest (Malhi, 2012), where it has been shown that the younger, more fertile western and southwestern Amazonian soils have higher tree turnover (Phillips et al., 2004; Stephenson and Van Mantgem, 2005) and stem growth rates (Malhi et al., 2004) and lower above-ground biomass (Malhi et al., 2006; Baker et al., 2004) compared to their central and eastern counterparts. Total soil P has been found to be the best predictor of stem growth (Quesada et al., 2010) and total NPP (Aragão et al., 2009) across this fertility gradient, and foliar P is positively related to plant photosynthetic capacity (Vcmax and Jcmax) in these forests (Mercado et al., 2011).
However, modelling studies are unable to reproduce observed spatial patterns of NPP and biomass in the Amazon, with one possible reason being the lack of inclusion of soil P constraints on plant productivity and function (Wang et al., 2010; Vicca et al., 2012a; Yang et al., 2014). Nevertheless, some modelling studies have focused on improving process and parameter representation using the observational data of spatial variation in woody biomass residence time (Johnson et al., 2016), soil texture, and soil P to parameterize the maximum carboxylation capacity (Vcmax) (Castanho et al., 2013). Results from these studies successfully represent observed patterns of Amazon forest biomass growth increases with increasing soil fertility. However, the full representation of these interactions and the impact of the soil nutrient availability on biomass productivity is still missing in most of ESMs.
So far, several dynamic global vegetation models have been developed to represent P cycling within the soil (Yang et al., 2013; Haverd et al., 2018) and between plant and soils for tropical forests in particular (Yang et al., 2014; Zhu et al., 2016; Goll et al., 2017). Furthermore, a comprehensive study included several models with C–N–P cycling and their feedbacks on the atmospheric C fixation and biomass growth in Amazon forests under ambient and elevated CO2 conditions (eCO2) (Fleischer et al., 2019). Despite these developments, data to underpin them and their projections, particularly for the tropics, is sparse and remains challenging, especially for the Amazon forest (Reed et al., 2015; Jiang et al., 2019). Moreover, due to the lack of detailed measurements, the P-related processes such as adsorption, desorption, and uptake represented in these models are under-constrained and likely oversimplified, and thus the future predictions of Amazon rainforest responses to eCO2 and climate change are uncertain. To fill this gap, in this study we use data collected as part of the Amazon Fertilization Experiment (AFEX), the first project that focuses on experimental soil nutrient manipulation in the Amazon, with a comprehensive data collection programme covering plant ecophysiology, C stocks and fluxes, and soil processes (including P stocks). Thus, as opposed to previous P modelling studies, our model parameterization includes detailed P process representation using site measurements.
Here, we describe the development and implementation of the terrestrial P cycle in the Joint UK Land Environment Simulator (JULES) (Clark et al., 2011), the land component of the UK Earth System Model (UKESM), following the structure of the prior N cycle development (Wiltshire et al., 2021) and utilizing already tested and implemented state-of-the-art descriptions of P cycling of other land surface models (Wang et al., 2007; Zhu et al., 2016; Goll et al., 2017).
The model (JULES-CNP) is parameterized and calibrated using novel in situ P soil and plant data from a well-studied forest site in the central Amazon near Manaus, Brazil, with soil P content representative of 60 % of soils across the Amazon basin. The newly developed P component estimates the sorption of the soil organic and inorganic P based on the saturation status of the adsorbed P pools, which is unique compared to the other existing P models, and enables more realistic estimation of P adsorption and desorption processes. We first evaluate the model at our study site and at additional five test sites across the Amazon and in Panama and Hawaii. We then apply the model under ambient and eCO2 following the protocol of Fleischer et al. (2019) to predict nutrient limitations on land biogeochemistry under these conditions. Predictions of the CO2 fertilization effect in JULES-CNP are compared to those in current versions of the model with coupled C and N cycles (JULES-CN) and with the C cycle only (JULES-C).
2.1 JULES
JULES is a process-based model that integrates water, energy, C cycling (JULES-C) (Clark et al., 2011), and N cycling (JULES-CN) (Wiltshire et al., 2021) between the atmosphere, vegetation, and soil (Best et al., 2011; Clark et al., 2011). Vegetation dynamics are represented in JULES using the TRIFFID model, with nine distinct plant functional types (PFTs) (tropical and temperate broadleaf evergreen trees, broadleaf deciduous trees, needle-leaf evergreen and deciduous trees, C3 and C4 grasses, and evergreen and deciduous shrubs), as well as height competition (Harper et al., 2016). Leaf-level photosynthesis (Collatz et al., 1991, 1992) is scaled to estimate canopy-level gross primary productivity (GPP) using a multilayer approach that accounts for vertical variation of radiation interception and partition of sunlit and shaded leaves and associated vertical variation of leaf N and P exponential decrease through the canopy (Clark et al., 2011; Mercado et al., 2007, 2009), while the C:P and N:P ratios remain the same. NPP is estimated as the difference between GPP and autotrophic respiration for each living tissue (leaf, wood, root). NPP is then allocated to increase tissue C stocks and to spread, i.e. expand the fractional coverage of the PFT. The resultant PFT fractional coverages also depend on competition across PFTs for resources, e.g. light. Tissue turnover and vegetation mortality add C into the litter pools. Representation of soil organic C (SOC) follows the Rothamsted carbon model (RothC) equations (Jenkinson et al., 1990; Jenkinson and Coleman, 2008) defining four C pools: decomposable plant material (DPM) and resistant plant material (RPM), which receive direct input from litterfall, and microbial biomass (BIO) and humified material (HUM), which receive a fraction of decomposed C from DPM and RPM that is not released to the atmosphere. The limitation of N on SOC is applied to the vegetation and soil components using a dynamic C:N ratio to modify the mineralization and immobilization processes as described in Wiltshire et al. (2021). Note that the soil component of JULES-CN can either be run as a single box model or vertically resolved over soil depth (JULES-CN layered), and in this paper we build upon the vertically resolved version described in Wiltshire et al. (2021).
2.2 JULES-CNP
JULES-CNP includes the representation of the P cycle in JULES version (vn5.5), and it is built on existing and well-tested representations of P cycling in other global land surface models (Yang et al., 2014; Sun et al., 2021; Wang et al., 2007; Goll et al., 2017). It includes P fluxes within the vegetation and soil components and the specification of P pools and processes related to P cycling within the soil column (Fig. 1). A parent material pool is introduced to consider the input of weathered P. The adsorbed, desorbed, and occluded fractions of P for both organic and inorganic P are also represented. However, except for parent material and occluded P pools, all other pools are estimated at each soil layer. The description of changes in pools and associated relative fluxes are explained in detail in the next sections. Although JULES-CN includes N leaching and deposition, P leaching and deposition are not included in the current version of JULES-CNP.
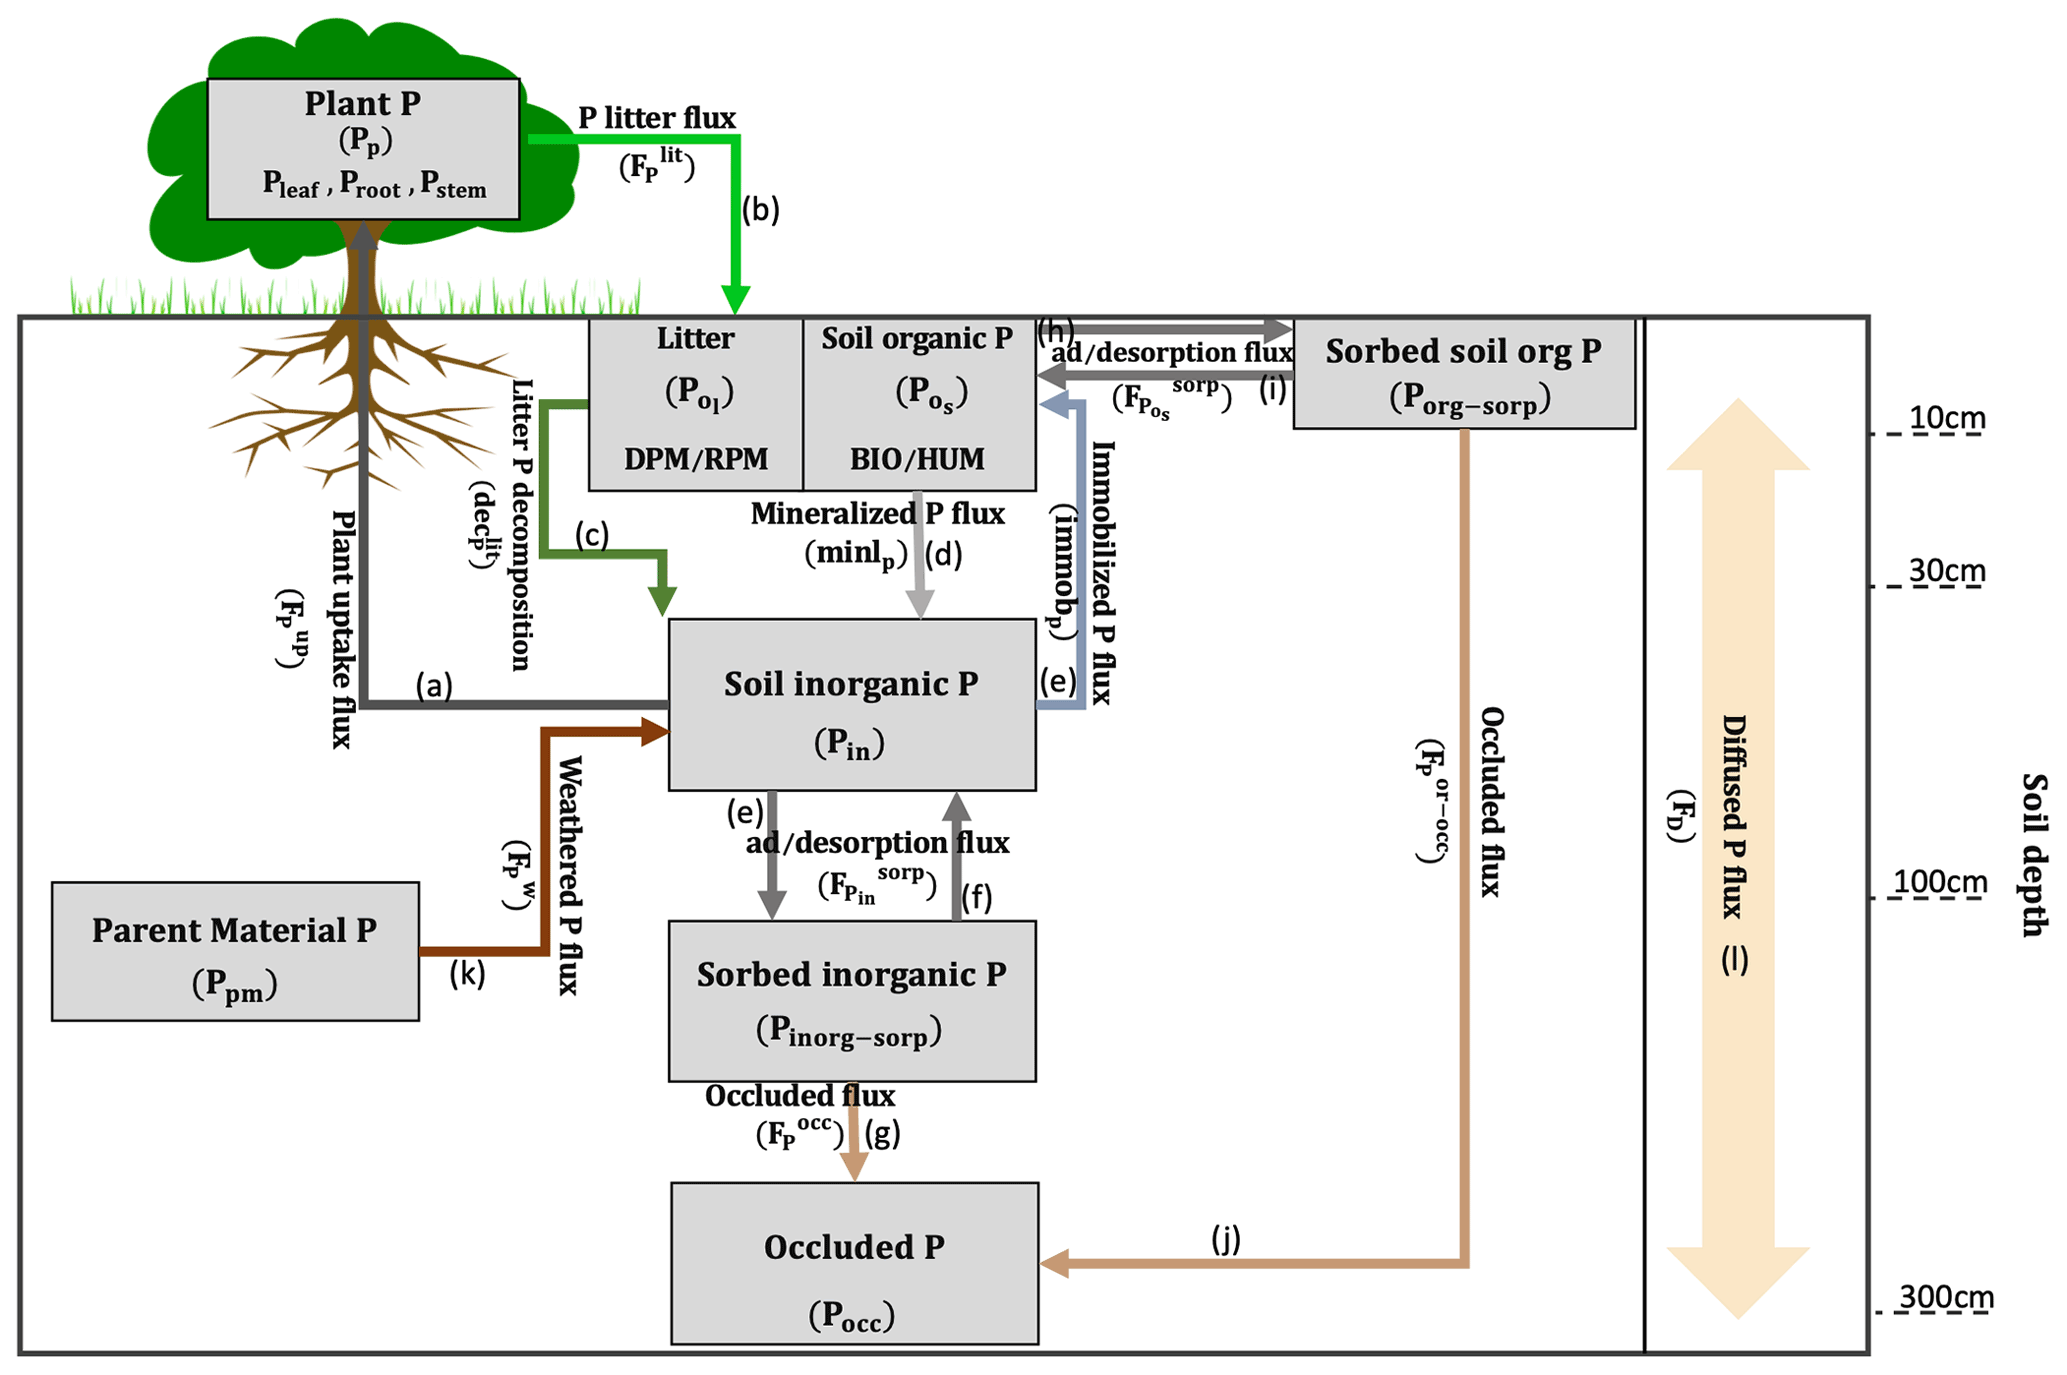
2.2.1 P pools
JULES represents eight P pools comprising organic and inorganic P: plant P (Pp) and soil P pools (in each soil layer (n)), litter P (), soil organic P (), soil inorganic P (Pin), organic sorbed P (Porg-sorp), inorganic sorbed P (Pinorg-sorp), parent material (Ppm), and occluded (Pocc) P comprised of both organic and inorganic P (all pools are in units of kg P m−2; see Fig. 1 and Tables 1 and 2).
Plant P pool is composed of leaf (Pleaf), fine root (Proot), and stem together with coarse root (Pstem), which are related to their associated C pools (Cleaf,Croot, Cstem, in units of kg C m−2) and fixed C to P ratios () as follows:
Therefore, the plant P pool (Pp) is the sum of all vegetation P pools as follows:
Description of the plant P pool (Pp) follows Zhu et al. (2016) and is estimated as the difference between the input, plant uptake (Eq. 26) and output of this pool, and plant litter flux (Eq. 28) with both fluxes expressed as follows (in units of kg P m−2 yr−1):
The litter P pool () is estimated as a sum of PDPM and PRPM pools over soil layers (n). Each pool is formed by the fluxes of plant litter input ) and the outgoing decomposed P (), which expressed in Eqs. 28 and 29, respectively (in kg P m−2 yr−1). Furthermore, the plant litter input is modified based on the plant type material ratio α (in order to distribute the litter input based on the DPM RPM fraction) as follows:
The soil organic pool () is represented as the sum of PBIO and PHUM. These pools are estimated from the difference between P inputs from total immobilized P distributed between BIO and HUM based on a fixed fraction (0.46 for BIO, 0.54 for HUM) (Jenkinson et al., 1990; Jenkinson and Coleman, 2008), desorbed P , and P outputs from mineralized ), and adsorbed P fluxes ) (adsorption is shown in Eq. 40, and desorption is shown in Eq. 41) with the fluxes expressed (in kg P m−2 yr−1) as follows:
The description of the inorganic sorbed P pool (Pinorg-sorp) follows Wang et al. (2007) and is represented as the difference between the input flux of inorganic sorption () (Eq. 37) and output fluxes of inorganic desorption ) (Eq. 38) and occluded P) (Eq. 39), with the fluxes expressed (in kg P m−2 yr−1) as follows:
The description of the occluded (Pocc) P pool follows Wang et al. (2007) and Hou et al. (2019) and is represented as the sum of input fluxes of occluded P from both organic ) (Eq. 42) and inorganic P pools ) expressed (in kg P m−2 yr−1) as follows:
The description of the organic sorbed P pool (Porg-sorp) follows Wang et al. (2007) and is represented as the difference between the input flux of organic sorption ) and output fluxes of organic desorption ) and occluded P) with the fluxes expressed (in kg P m−2 yr−1) as follows:
P from the parent material (Ppm) pool follows Wang et al. (2007) and depends on the weathering flux () (Eq. 43) expressed (in kg P m−2 yr−1) as follows:
2.2.2 C and P fluxes
NPP in JULES is calculated as the difference between GPP and autotrophic respiration. In JULES-CNP, potential NPP represents the amount of C available for tissue growth (C density increase) on a unit area and the associated spreading (vegetation cover increase as a result of reproduction and recruitment), i.e. increase to the area covered by the vegetation type, assuming no nutrient limitation. The reported NPP in the literature often includes other C fluxes related to the exudates, production of volatiles, and non-structural carbohydrates (Walker et al., 2021; Chapin et al., 2011; Malhi et al., 2009), which are challenging to measure (Malhi et al., 2011). Therefore, actual NPP is for our purposes equal to biomass production (BP) and is calculated as potential NPP minus excess C (lost to the plant through autotrophic respiration), with the latter being the C that cannot be used to grow new plant tissue due to insufficient plant nutrient supply. Hence, if the system is limited by the availability of N and/or P, NPP will be adjusted to match the growth that can be supported with the limited N or P supply, with any excess carbohydrate lost through excess C.
The total excess C term (ψt) (kg C m−2 yr−1) is calculated as follows:
where ψg and ψs are the excess C fluxes due to growth (g) and spread (s) and are assumed to be rapidly respired by plants.
Therefore, BP is calculated as the difference between potential NPP (Πc) and total excess C:
The litter production in JULES before limitation is estimated as follows:
where γ is a temperature-dependent turnover rate representing the phenological state (Clark et al., 2011). P limitation is applied to the C litter production similar to the N scheme of JULES (JULES-CN) (Wiltshire et al., 2021). In JULES-CN the N limitation effect on the litter production is captured by estimating the available C for litter production as a difference between the NPP and excess C (Wiltshire et al., 2021).
Similar to other P-enabled models (Goll et al., 2017; Yang et al., 2014), JULES-CNP follows the same structure as its N model component. Descriptions of the plant P and N demand follow Wang et al. (2007) and are represented by the sum of demand (∅t) to sustained growth (P-related: (); N-related: and to sustain vegetation spreading (to increment PFT fractional coverage) (P-related: ); N-related: and are expressed in different units (P-related values are expressed in kg P m−2 yr−1, while N-related values are expressed in kg N m−2 yr−1). The total demand for growth (∅g) and spreading (∅s) is controlled by the dominant demand between P () and N as follows:
where is the inverse of whole plant C:P ratio, is inverse plant C:N ratio, is rate of change in plant C (see Clark et al., 2011, for more detail), Πc is nutrient-unlimited (or potential) NPP (kg C m−2 yr−1), ψg is excess C due to either P or N limitation for plant growth (kg C m−2 yr−1), and ψs is excess C due to either P or N limitation for vegetation spreading (kg C m−2 yr−1).
Equations 20 and 22 are solved by first setting ψg=0.0 to find the total plant P (Eq. 20) and N demand (Eq. 22). If the P and N demand for growth are less than the available P and N and fractional coverage (λ) (NPP fraction used for fractional cover increment; for more details, see Wiltshire et al., 2021) at the considered time step Δt, there is no limitation to growth (i.e. ). Where there is limited P and/or N availability, the uptake is equal to the available P and N, i.e. , and the plant growth that cannot be achieved due to nutrient constraints will be deducted from potential NPP, here termed excess C term (ψg), to give an actual NPP value. Following Wiltshire et al. (2021), we assume that excess C is respired by the plant.
Similarly, in order to estimate the P and N demand for spreading (Eq. 21 and 23), initially the excess C from spreading is set to 0.0 (0), i.e. under the assumption that there is no nutrient limitation. If the P and N demand for spreading are lower than the available P and N and fractional coverage (λ) , then there is no limitation on spreading, and in cases of limited P and N availability, the uptake is equal to the available P and N, i.e. , and the excess C for spread (ψs) is subtracted from potential NPP.
Plant P uptake () (arrow a in Fig. 1) is estimated based on the P demand for growth and spreading (∅t) and the root uptake capacity (umax) (kg P kg−1 C yr−1) as follows:
Plant P uptake () varies spatially depending on the root uptake capacity (umax), following the method of Goll et al. (2017). Therefore, in regions with limited P supply, the plant P uptake is limited to the umax and consequently impacts the excess C and BP.
The root uptake capacity depends on the maximum root uptake capacity (vmax) (kg P kg−1 C yr−1), root depth (droot), the concentration of inorganic P at different soil depths (Pin), and a half-saturation term at which half of the maximum uptake capacity is reached using inorganic P at different soil depths (Pin), a scaling uptake ratio (Kp) (µmol P L−1), unit conversion (Cf) (1 kg P−1), and soil moisture (θ) (L m−2) as follows:
Description of the litter production of P ) (arrow b in Fig. 1) follows JULES-CN, as in Wiltshire et al. (2021), and is calculated based on the litter flux of C (kg C m−2 yr−1) using leaf, root, and wood turnovers (yr−1) and through the vegetation dynamics due to large-scale disturbance and litter production density as follows:
where λ is the leaf, root, and stem re-translocation (at daily time step) coefficient (Zaehle and Friend, 2010; Clark et al., 2011) and the related C:P ratios for P fraction and γ are a temperature-dependent turnover rate representing the phenological state (Clark et al., 2011).
The decomposition of litter (declit) (arrow c in Fig. 1) depends on soil respiration (R) (kg C m−2 yr−1) and the litter C:P ratio (C:Plit) at each soil layer (n) as follows:
where the C:Plit is calculated based on the litter C pool (DPM and RPM) (litC) (kg C m−2 yr−1) and litter P pool () as follows:
The mineralized () (arrow d in Fig. 1) and immobilized () (arrow e in Fig. 1) P fluxes are calculated based on C mineralization and immobilization, C:P ratios of plant (i) (DPM RPM) (C:Pplant) and soil (HUM BIO) (C:Psoil), soil pool potential respiration () (kg C m−2 yr−1), and the respiration partitioning fraction (resp_frac) as follows:
The soil respiration from each soil layer (Ri,n) is estimated from potential soil respiration () for the DPM and RPM pools and the litter decomposition rate modifier () as follows:
where the description of for P pools () follows Wang et al. (2007) and is estimated based on the soil pool (BIO HUM) mineralization (, ) and immobilization (, ) (in kg P m−2 yr−1), soil inorganic P () (in kg P m−2), and litter pool (DPM RPM) demand (in kg P m−2 yr−1) as follows:
The net demand associated with decomposition of litter pools (DEMk,n) represents the P required by microbes that convert DPM and RPM into BIO and HUM. The limitation due to insufficient P availability is estimated based on the potential mineralization (minlp-pot) and immobilization (immobp-pot) (in kg P m−2 yr−1) of pools (k) as follows:
The estimated for N pools () follows the same formulation as P (see Wiltshire et al., 2021, for further details), and the is estimated based on a higher-rate modifier between N and P as follows:
Description of the fluxes of adsorption () (arrow e in Fig. 1) and desorption () (arrow f in Fig. 1) of inorganic P (in kg P m−2 yr1) follow Wang et al. (2010) and are calculated based on soil inorganic () and sorbed inorganic () P pools, inorganic adsorption (Ksorp-in) and desorption (Kdesorp-in) coefficients (kg P m−2 yr−1), and maximum sorbed inorganic (Pin-max) (kg P m−2) as follows:
Description of the occluded inorganic P flux () (arrow g in Fig. 1) follows Wang et al. (2007) and Hou et al. (2019) and is calculated based on sorbed inorganic P pool and P occlusion rate (Kocc) (kg P m−2 yr−1) as follows:
Description of the fluxes of adsorption () (arrow h in Fig. 1) and desorption () (arrow i in Fig. 1) of organic P follow Wang et al. (2010) and are calculated based on soil organic and sorbed organic P pools and organic adsorption (Ksorp-or) (kg P m−2 yr−1), desorption (Kdesorp-or) coefficients (kg P m−2 yr−1), and maximum sorbed organic (Porg-max) (which corresponds to the sorbed soil P saturation, thus modifying the sorption rate) (kg P m−2) as follows:
Description of the occluded organic P flux () (kg P m−2 yr−1) (arrow j in Fig. 1) follows Wang et al. (2007) and Hou et al. (2019) and is calculated based on sorbed organic P pool () and P occlusion rate (Kocc) (kg P m−2 yr−1) as follows:
Description of the P flux from weathered parent material () (arrow k in Fig. 1) follows Wang et al. (2007) and is calculated based on amount of P in the parent material (Ppm) and P weathering rate (Kw) (kg P m−2 yr−1) as follows:
Description of P diffusion between soil layers () (expressed in kg P m−2 yr−1) (arrow l in Fig. 1) follows Goll et al. (2017) and is calculated following Fick's second law as a function of the diffusion coefficient (Dz) in m2 s−1, the concentration of inorganic P at different soil depths (Pin) in kg P m−2, the distance (z) between the midpoints of soil layers in metres, and a seconds to years unit conversion (Yr):
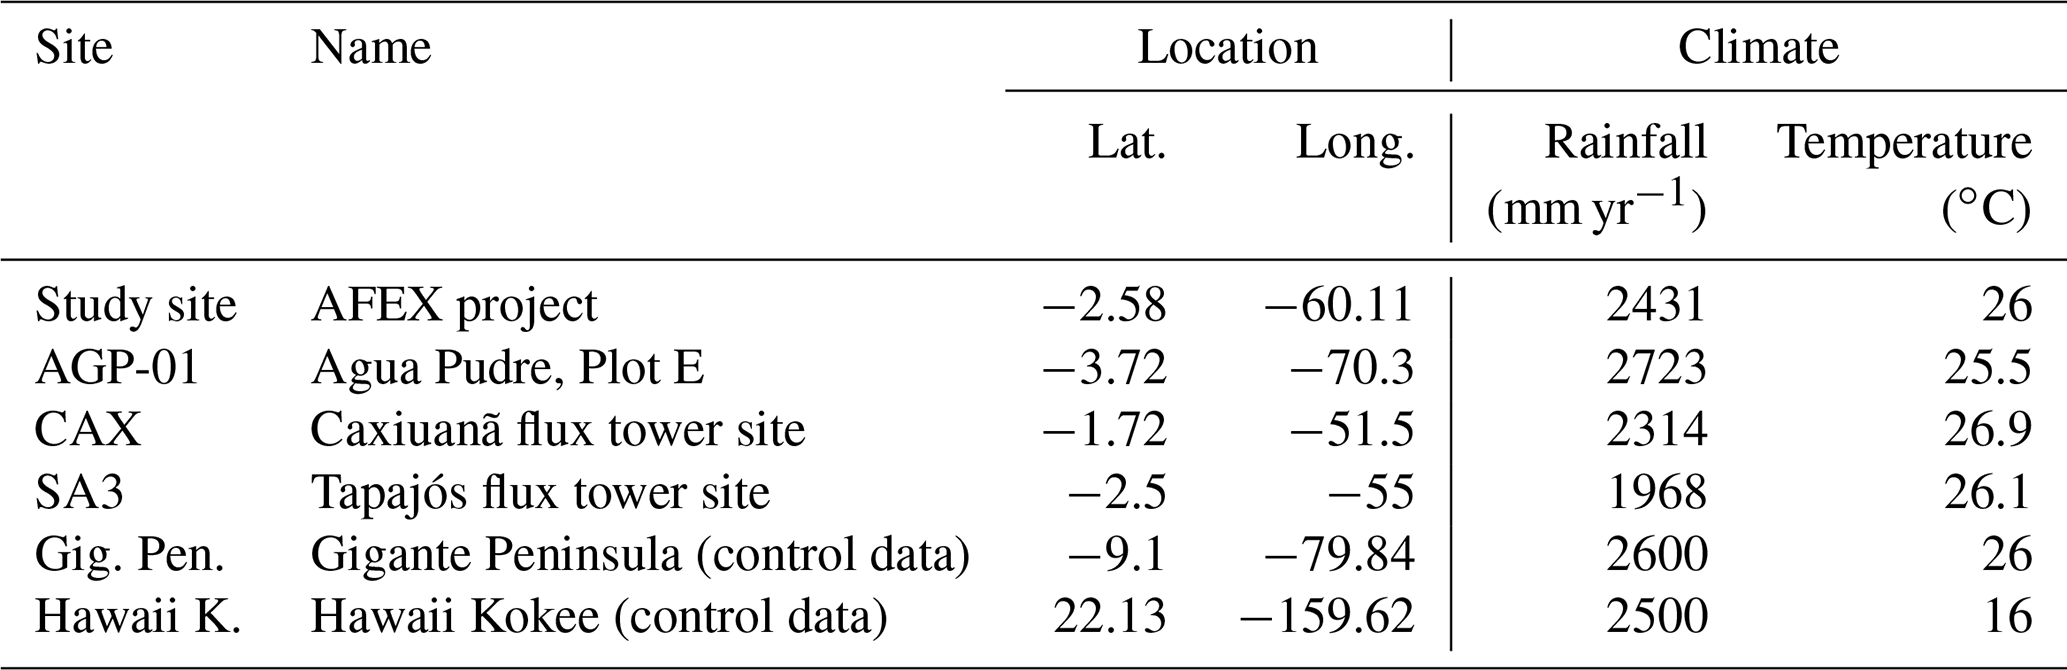
This study primarily uses data from two close together sites in the central Amazon rainforest in Manaus, Brazil. The main site, from here on termed “study site” ( S, W) (Lugli et al., 2020), is for model development and evaluation. The second site is the Manaus K34 flux site ( S, W), which provides meteorological station data for running the model but also provides data for model evaluation. Our study site is the main lowland tropical forest site maintained by the National Institute for Amazon Research (INPA). Research at this site focuses on projects combining experimental approaches (Keller et al., 2004; Malhi et al., 2009) with modelling (Lapola and Norby, 2014). We use detailed novel soil and plant P pool data from the study site (Lugli et al., 2021, 2020) for model parameterization and calibration and carbon stock data for model validation. The study site has a very similar forest, geomorphology, soil chemistry, and species composition to the well-known and well-studied K34 flux site (Araújo et al., 2002). The average reported annual precipitation is 2431 mm yr−1, with a monthly range of 95 to 304 mm per month, and the average temperature is 26 ∘C (Araújo et al., 2002). The soil type at this site is Geric ferralsol with high clay content and weathering activities (Malhi et al., 2004).
In addition to the study site, we use data from other P-limited locations from the Amazon, Panama, and Hawaii (Table 3) for model evaluation. Old-growth forest sites in the Amazon are located across a fertility gradient from west to east (AGP-01, SA3, CAX) where detailed C cycle measurements are available (Aragão et al., 2009). The site in Panama is located on the Gigante Peninsula in the Barro Colorado Nature Reserve and is a 200-year-old semi-deciduous rainforest (Wright et al., 2011) growing on Oxisols developed on Miocene basalt (Dieter et al., 2010) with a topsoil that has a dominant clay texture (Turner and Condron, 2013). It has been the location of a long-term running nutrient fertilization experiment since 1998 (Mirabello et al., 2013). The site in Hawaii (Hawaii Kokee) is a P-limited chronosequence that developed on the 4-million-year-old Oxisols soil (Vitousek, 2004) and has a long-term fertilization experiment. Site information is provided in Table 3.
3.1 Model parameterization, calibration, and evaluation at study site
We use observations from the four control plots of the study site to parameterize, calibrate, and evaluate different processes in JULES (Table 4). The observations were collected at four soil depths and processed using the Hedley sequential fractionation (Hedley et al., 1982; Quesada et al., 2010). Observed leaf mass per area (LMA) and leaf N and leaf P estimated from fresh leaves were used as input parameters to JULES to estimate photosynthetic capacity and respiration parameters. JULES vn5.5 (JULES-CN in this study) estimates Vcmax (µmol m−2 s−2) based on Kattge et al. (2009) using foliar N concentrations in area basis (nleaf), as follows:
where vint is the estimated intercept and vsl is the slope of the linear regression derived for the Vcmax estimation. We incorporated an additional P dependency on the estimation of Vcmax following Walker et al. (2014) as follows:
where N and P are foliar concentrations on an area basis.
Implementation of Eq. (46) resulted in higher Vcmax than in the original version of JULES. A higher Vcmax predicted higher leaf and plant respiration (Eq. 47). Constrained by observations of NPP and plant respiration at the study site, we modified one of the most uncertain parameters in the description of plant respiration (fdr) (Eq. 47), namely the scale factor for leaf dark respiration (Rd), as follows:
The default value is 0.01 (Clark et al., 2011), and for JULES-CNP simulations at our study site it was modified to 0.005.
Observations of above-ground biomass were used to calibrate the non-PFT-dependent allometric relationships in JULES (Clark et al., 2011) (Eqs. 48–50) for leaf, root, and wood C. Specifically, the awl parameter (Eq. 50) was modified from 0.65 to 1.204 to better match tropical forest allometry:
where Lb is the balanced (or seasonal maximum) leaf area index (LAI, m2 m−2), σl is the specific leaf density (kg C m−2 per unit LAI), awl is the allometric coefficient (kg C m−2), and bwl is the allometric exponent.
Note that JULES-CNP uses the C3 and C4 photosynthesis model from Collatz et al. (1991, 1992), which does not include estimation of Jmax.
JULES-CNP has fixed stoichiometry and C:P ratios of leaf and root (measured) and wood (estimated from fresh coarse wood, Lugli, 2013), which were taken from the study site and prescribed in JULES to simulate P dynamics in the plant. The following belowground data were used to represent various soil P pools: resin and bicarbonate inorganic P (inorganic P: Pin), organic bicarbonate P (organic P: ), NaOH organic P (sorbed organic P: Porg-sorp), NaOH inorganic P (sorbed inorganic P: Pinorg-sorp), residual P (occluded P: Pocc), and HCL P (parent material P: Ppm) (Table 4). The measurements were collected between 2017 and 2018 in control plots. All measurements were conducted in four soil layers (0–5, 5–10, 10–20, 20–30 cm). However, to be consistent with the JULES model soil layer discretization scheme, we defined four soil layers (0–10, 10–30, 30–100 and 100–300 cm) and used the average between 0 and 30 cm to compare against the measurement from the same depth for model evaluation.
Vegetation C stocks were derived based on tree diameter measurements at breast height, which are linked to allometric equations and wood density databases to estimate the C stored in each individual tree and then scaled to the plot (Chave et al., 2014).
The organic and inorganic soil P was assumed to be always at equilibrium with the relative sorbed pools (Wang et al., 2010). Thus, in order to cap P sorption and uptake capacity, the maximum sorption capacities (, Eqs. 37 and 39) (adopted from Wang et al., 2007) were prescribed using maximum observed sorbed inorganic and organic P. Hence, the maximum sorption capacity defines the equilibrium state of sorbed and free-soil P. Moreover, despite the initial representation of the parent material pool in JULES and its depletion through weathering (Eq. 43), as the magnitude of changes in the occluded and parent material pools are insignificant over a short-term (20 years) simulation period (Vitousek et al., 1997), these two pools were prescribed using observations. The remaining parameters used to describe soil P fluxes (Eqs. 27–44) were prescribed using values from the literature (Table 4).
We used a combination of data from the study site and the nearby K34 site for model evaluation of C fluxes (GPP, NPP) and C pools (soil and vegetation C, leaf, root and wood C) with no calibration of plant and soil organic P pools and soil inorganic P pools included (Table 4).
Table 4Observations from the study site (taken during 2017–2018) and from the Manaus site K34 used for model parameterization and evaluation.

3.2 Model parameterization and evaluation at test sites
JULES-CNP was parameterized using reported C:P ratios and maximum sorbed organic and inorganic P for each test site (Table 5) as follows.
Table 5Additional test site data used for model parameterization.
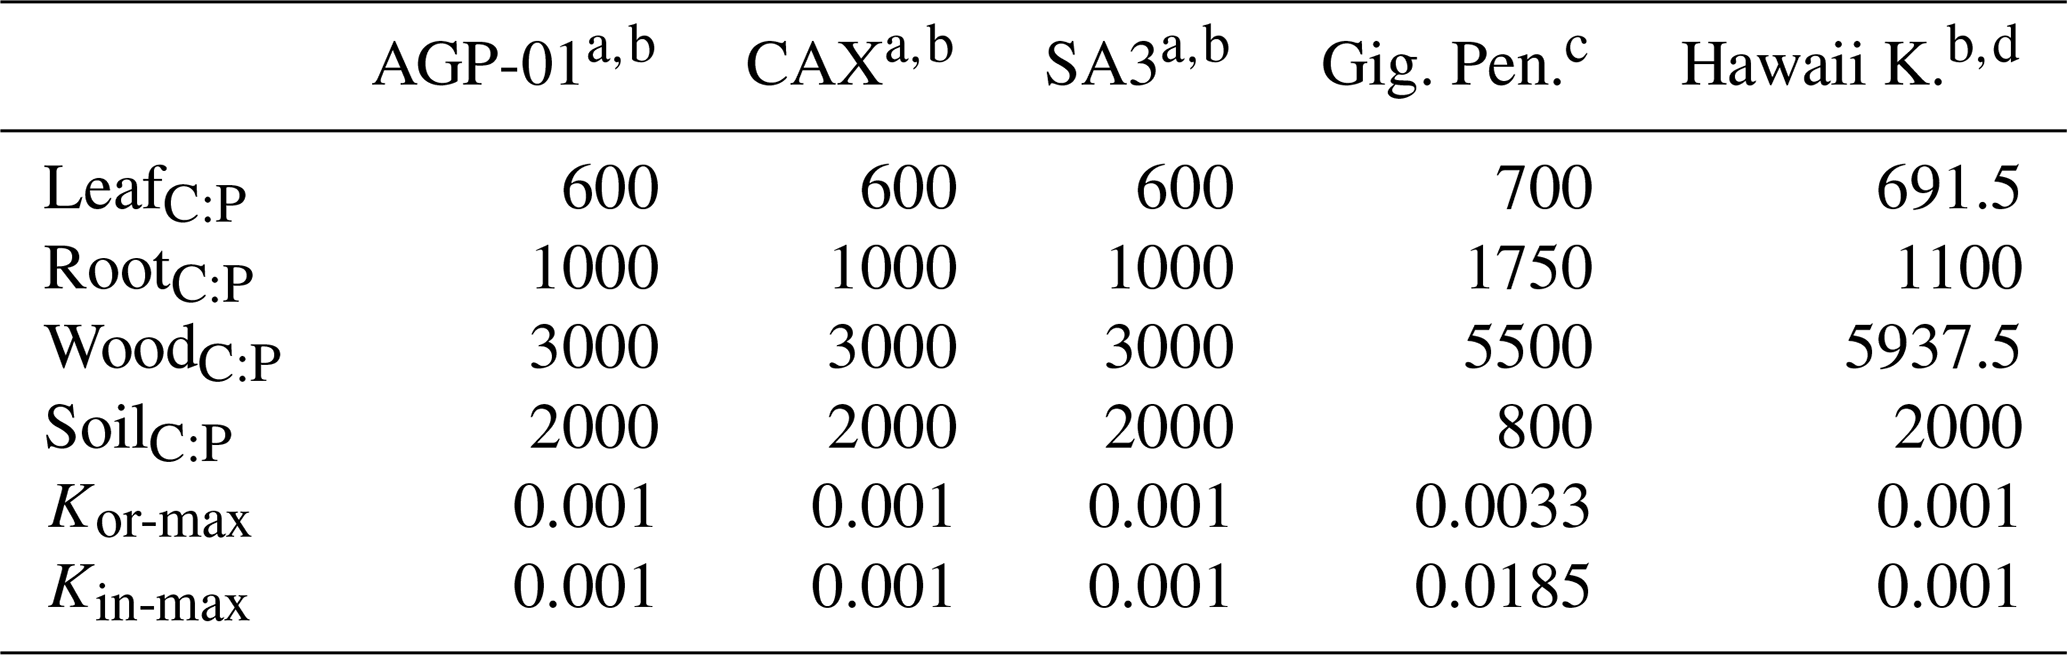
a C:P ratios from Wang et al. (2010). b Maximum sorbed P capacities from Yang et al. (2014). c Mirabello et al. (2013). d C:P ratios from Vitousek (2004).
Model evaluation at test sites was performed using observed NPP, litterfall, autotrophic respiration, biomass, and soil C pools taken from different sources. We used NPP and litterfall for the Amazon sites from Aragão et al. (2009) and for Gigante Peninsula from Chave et al. (2003), Hawaii Kokee NPP as reported in Goll et al. (2017), and litterfall as reported in Yang et al. (2014). Plant respiration was only available at two of Amazon sites (AGP and CAX) (Malhi et al., 2009). The biomass and soil C pools for two of the Amazon sites (CAX and SA3) are taken from Malhi et al. (2009), and biomass from AGP is taken from Jiménez et al. (2009). The Gigante Peninsula biomass is taken from Chave et al. (2003), soil C is taken from Turner et al. (2015), and the Hawaii Kokee C pools are taken as reported in Yang et al. (2014).
3.3 JULES simulations
JULES was first applied at the K34 flux tower site using observed meteorological forcing data from 1999–2019 (Fleischer et al., 2019) at half-hourly resolution. The following meteorological variables are needed to drive JULES (model inputs) (Best et al., 2011): atmospheric specific humidity (kg kg−1), atmospheric temperature (K), air pressure at the surface (Pa), short and longwave radiation at the surface (W m−2), wind speed (m s−1), and total precipitation (kg m−2 s−1). Furthermore, the averaged measured LAI from the study site was used to initialize the vegetation phenology module but was allowed to vary in subsequent prognostic calculations. Soil organic and inorganic sorbed P pools were initialized with study site observations. The JULES-CNP simulations were initialized following the same methodology as in Fleischer et al. (2019), and the spin-up from 1850 CE resulted in an equilibrium state (Fig. S1 in the Supplement). The spin-up was performed separately for three versions of JULES (C/CN/CNP) following the same procedure. Furthermore, the transient run was performed for the period 1851–1998 using time-varying CO2 and N deposition fields. Finally, for the extended simulation period (1999–2019) two runs were performed, the first with ambient CO2 concentrations and the second with elevated CO2 concentrations.
We evaluate the impact of including a P cycle in JULES using three model configurations (JULES-C, JULES-CN, and JULES-CNP). We apply JULES in all three configurations using present-day climate under both ambient CO2 and eCO2. Ambient and eCO2 were prescribed following Fleischer et al. (2019), with present-day CO2 based on global monitoring stations and an abrupt (step) increase in atmospheric CO2 of +200 ppm on the onset of the transient period (i.e. 1999). However, the comparison period is limited to the 2017–2018 period for which the P measurements are available.
We compare simulated C fluxes (GPP, NPP, litterfall C), C stocks (total vegetation, fine root, leaf, wood, soil), and the CO2 fertilization effect across model configurations. The CO2 fertilization effect (Eq. 51) is calculated based on simulated vegetation C under ambient (VegC (aCO2)) and eCO2 (VegC (eCO2)) as follows:
Furthermore, the net biomass increases due to the CO2 fertilization effect (ΔCveg) is estimated as follows:
We studied the water use efficiency (WUE) (Eq. 53) at half-hourly time steps, which was then aggregated per month as one of the main indicators of GPP changes (Xiao et al., 2013), and soil moisture content (SMCL), as one of the main controllers of maximum uptake capacity (Eq. 27), in order to gain a better understanding of the changes in GPP, P demand and uptake, and excess C fluxes.
Moreover, we also estimated the carbon use efficiency (CUE) as an indicator of the required C for the growth (Bradford and Crowther, 2013) as follows:
We use JULES-CNP to evaluate the extent of P limitation under ambient and eCO2 at this rainforest site in the central Amazon. P limitation is represented by the amount of C that is not used to grow new plant tissue due to insufficient P in the system (excess C) (Eq. 27). The excess C flux is highly dependent on the plant P and the overall P availability to satisfy demand. We also explore the distribution of the inorganic and organic soil P and their sorbed fraction within the soil layers and under ambient and eCO2.
3.3.1 Model sensitivity
To test the sensitivity of the P- and C-related processes to individual model P parameters, six sets of simulations were conducted independently with modified plant C:P stoichiometry (Plant C:P: SENS1), P uptake scaling factor (KP) (Kp: SENS2), inorganic (KP_ sorb_in: SENS3) and organic (KP_sorb_or: SENS4) P adsorption coefficients (Ksorp−or, Ksorp-in), and maximum inorganic (KP_sorb_in_max: SENS5) and organic (KP_sorb_or_max: SENS6) sorbed P (Kor-max, Kin-max). These values were prescribed to vary between ±50 % of the observed values, and their effect on C pools (plant and soil C) and fluxes (NPP and excess C) and P pools (plant, soil, and soil sorbed P) was assessed. As the derived model parameters from measurements have their own level of uncertainty, we took 50 % change to test these parameters at a reasonable degree. However, the occluded and weathered P pools are prescribed for this model application, and the occluded and weather P coefficients (the other two P-related model parameters) were not part of sensitivity tests.
Our model evaluation period is limited to the years 2017–2018 due to the P measurement availability. However, in order to compare it with 15 models studied by Fleischer et al. (2019), we also studied the response of GPP, NPP, and BP to eCO2 for both initial (1999) and 15-year periods (between 1999 and 2013).
3.3.2 Simulations at test sites
To perform JULES (C, CN, CNP) simulations at test sites we extracted the meteorological input data to drive the model from a global dataset (CRU-NCEP) (Harris et al., 2014) by selecting the closest grid cell to each site when data were not available for a given site (Table 3). Soil texture ancillaries for each site were extracted from a global soil database (HWSD) (Nachtergaele et al., 2010). All simulations were initialized from a global JULES-CN run (Wiltshire et al., 2021) extracted for each site and further spun up for 2000 years over the 1980–2000 period for the three versions of JULES (C/CN/CNP). Finally, the transient (2000–2013) run was performed using the output of the spin-up for each site.
4.1 Model application under ambient CO2
4.1.1 Calibration of simulated soil P pools at study site
The maximum sorption capacities (, , Eqs. 37 and 40, respectively) were calibrated to the observed P pools. As a result, JULES-CNP could reproduce the measured soil P pools (Fig. 2 and Table 6). Simulated inorganic soil P and sorbed organic and inorganic soil P closely matched the observations (Table 7 and Fig. 2). However, simulated organic soil P overestimates the observations by 60 %.
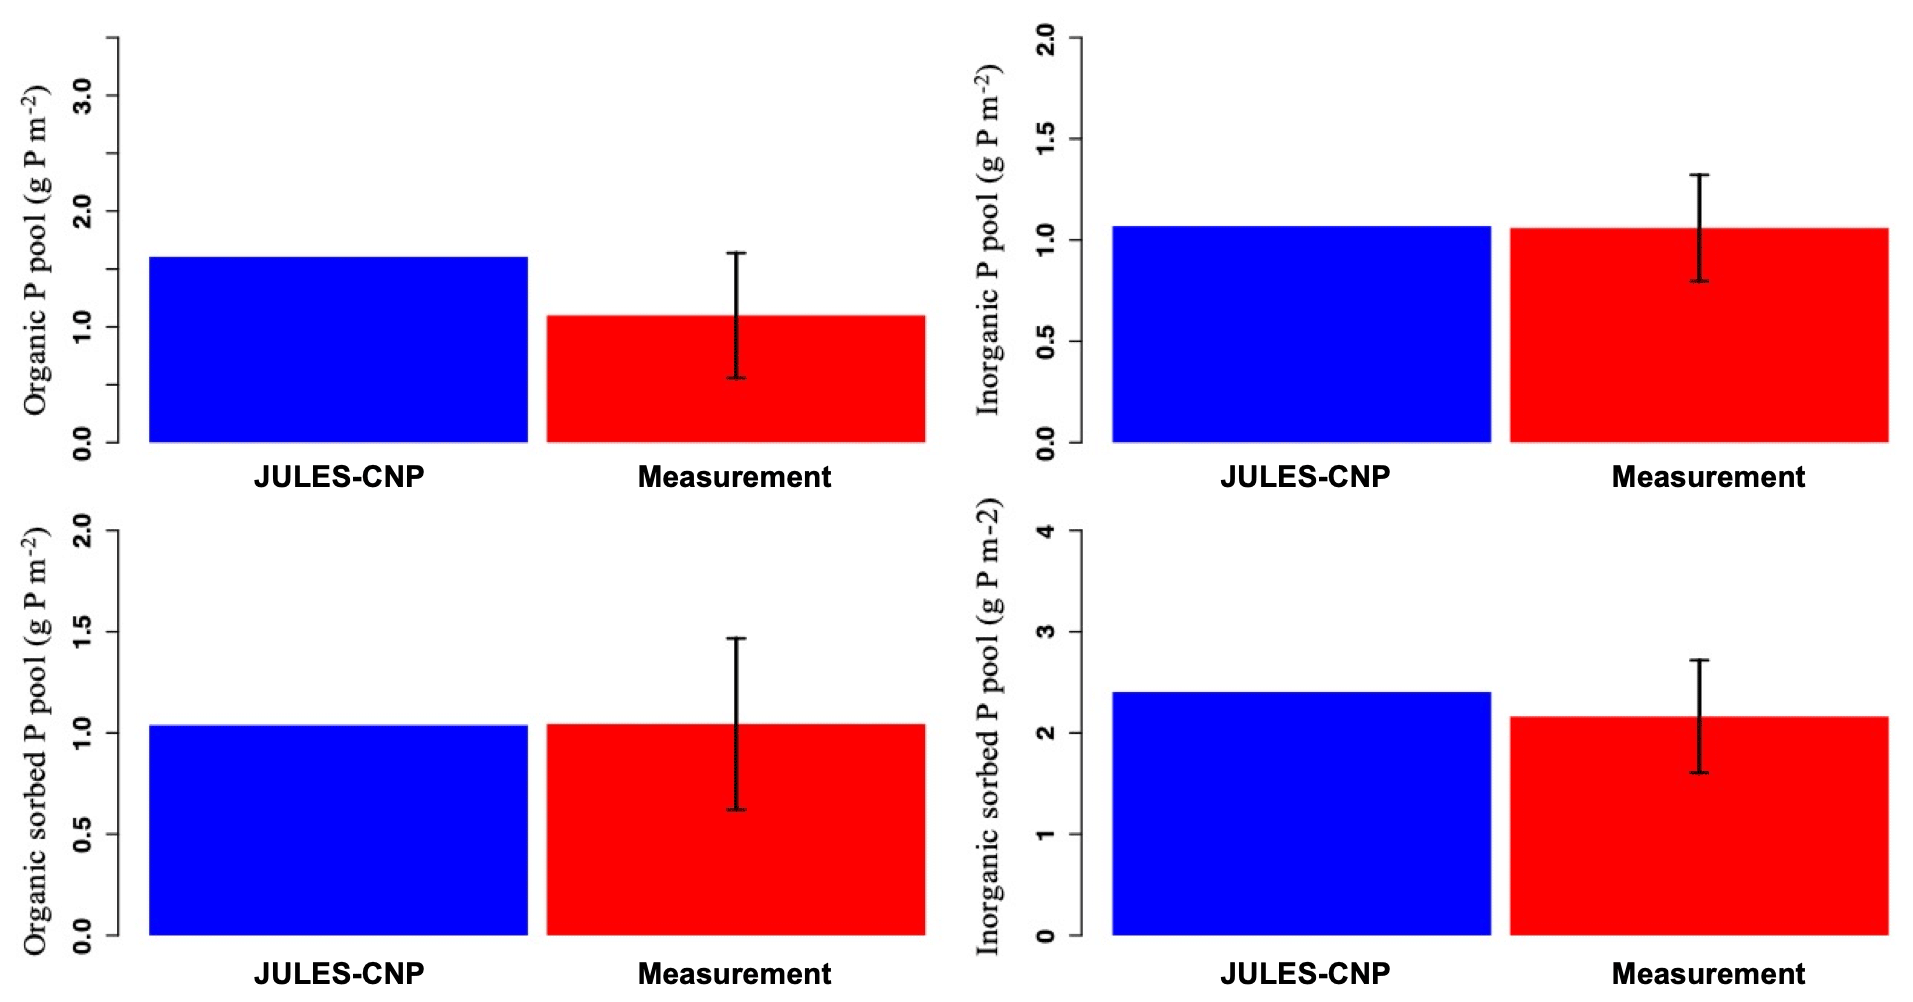
Figure 2Modelled vs. measured soil phosphorus pools under ambient CO2 (for the soil depth of 0–30 cm). The black line represents the standard deviation.
Table 6Observed and simulated phosphorus pools and fluxes. Occluded and weathered P pools were prescribed using the observed values (for 2017–2018).

4.1.2 Model evaluation
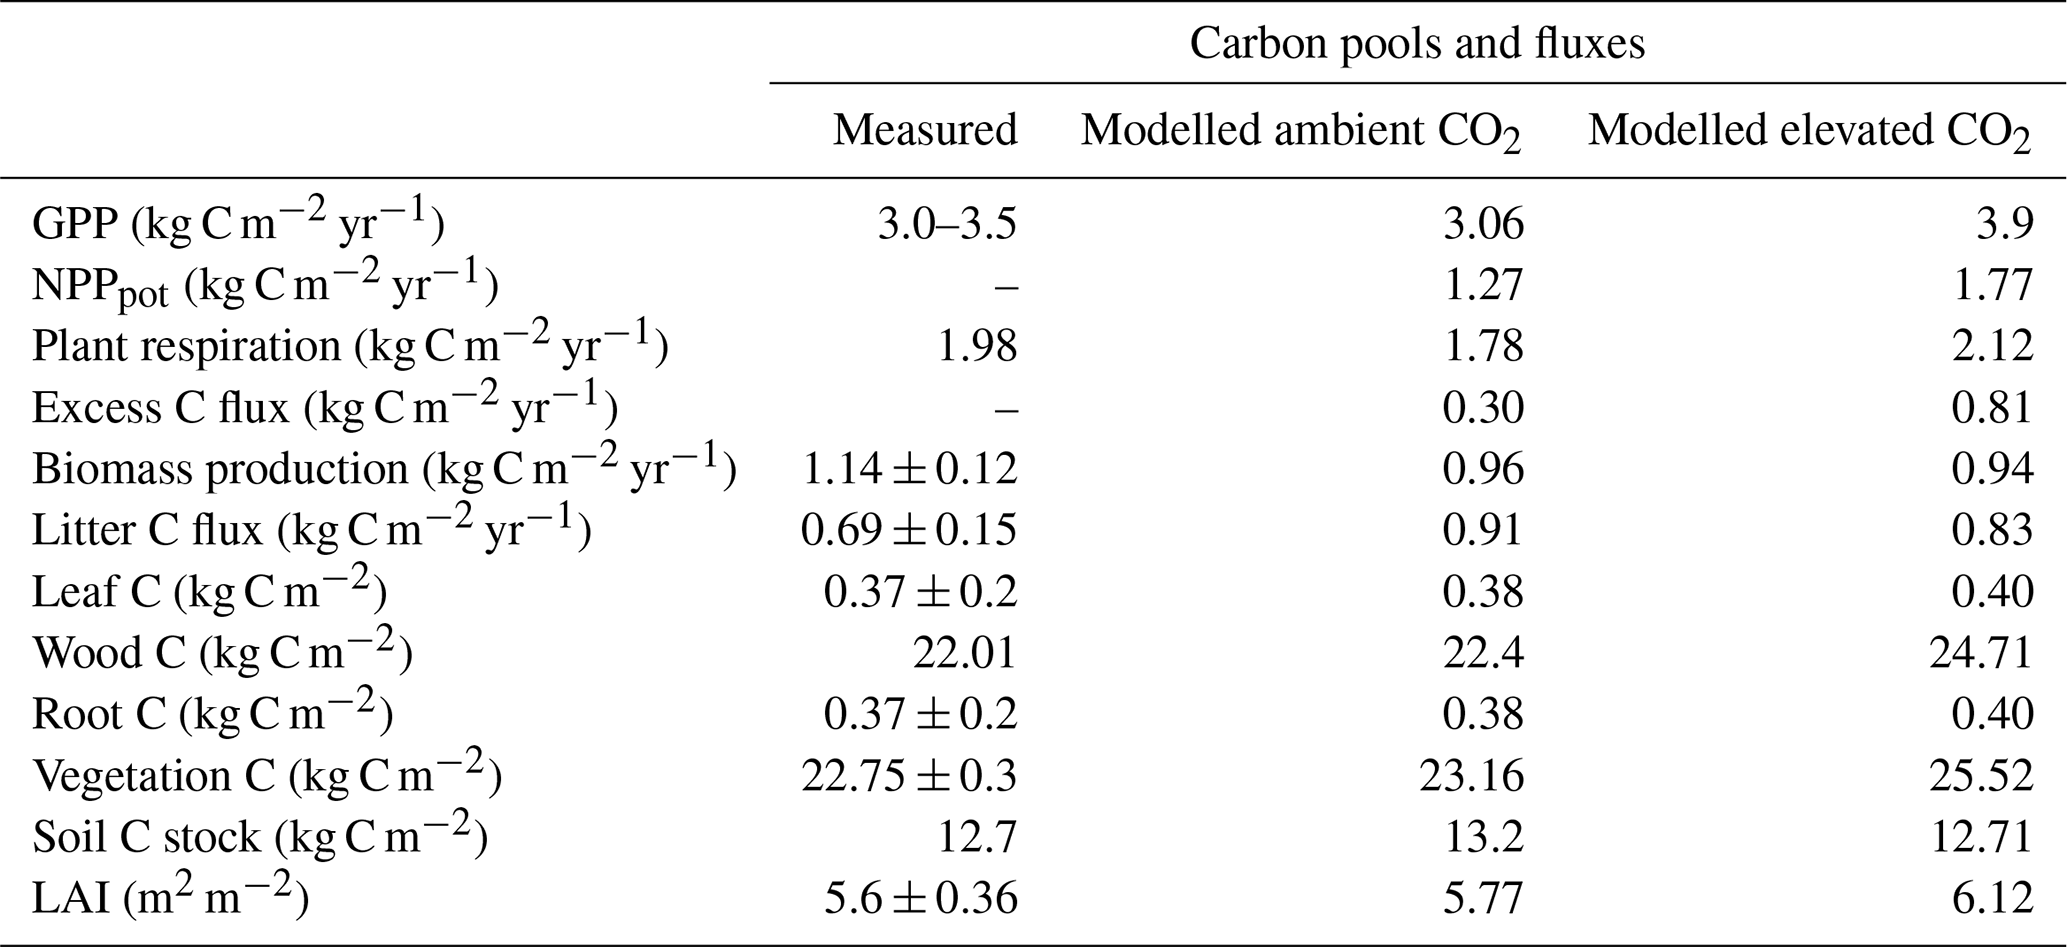
JULES-CNP could reproduce the plant and soil C (Fig. 2 and Table 7) and N pools and fluxes (Fig. S6 and Table 8) under ambient CO2. Our results show that simulated GPP is within the range of measurement (3.02 kg C m−2 yr−1 modelled vs. 3–3.5 kg C m−2 yr−1 observed, Table 7).
Simulated NPP is close to the measured values (NPP: 1.14–1.31 kg C m−2 yr−1 observed vs. 1.26 kg C m−2 yr−1 modelled) with autotrophic respiration (RESP) also closely following the observations (1.98 kg C m−2 yr−1 observed vs. 1.81 kg C m−2 yr−1 modelled). Biomass production is estimated as the difference between NPP and the amount of C that is not fixed by plants due to the insufficient P in the system (excess C) (Eq. 27). The excess C flux depends on the plant P and the overall P availability to satisfy demand (Table 7). The simulated flux of excess C is 0.3 kg C m−2 yr−1 under ambient CO2. In JULES-CNP this flux is subtracted from NPP in order to give the BP (Eq. 17) (Table 7). Our simulated litterfall overestimates the observations by 32 %; however, simulated vegetation and its components (fine root, leaf, and wood) and soil C stocks match the observations well (Table 7).
Table 7Observed and simulated carbon pools and fluxes with JULES-CNP (between period 2017–2018).
4.1.3 Comparison of JULES-C, JULES-CN, and JULES-CNP under ambient CO2 at the study site
We compare simulated C pools and fluxes from JULES-C, JULES-CN, and JULES-CNP (Fig. 3). There is no difference between C stocks and fluxes in simulations from JULES-C and JULES-CN, indicating that there is no N limitation at this tropical site in the CN simulations. However, simulated BP and litter flux of C by JULES-C and JULES-CN are higher than in JULES-CNP but also overestimate the observations: the litter flux of JULES-C and JULES-CN is 1.18 kg C m−2 yr1 and that of JULES-CNP is 0.91 kg C m−2 yr1, while the observations show a value of 0.69 kg C m−2 yr1. The BP of JULES-C and JULES-CN is 1.24 and that of JULES-CNP is 0.96, while the observations show values of 1.14–1.31 kg C m−2 yr−1. By including P cycling in JULES, an excess C flux of 0.3 kg C m−2 yr−1 is simulated, indicating a 24 % P limitation to BP at this site according to JULES-CNP, which represents a 29 % decrease in BP compared to JULES-C and JULES-CN. Consequently, the total vegetation C stock for models without P inclusion is higher than the CNP version (+3 % difference) due to the lack of representation of P limitation. The simulated soil C stock in JULES-C and JULES-CN is also higher than in the CNP version (JULES-C and JULES-CN at 13.93 kg C m−2 yr−1 vs. JULES-CNP at 13.18 kg C m−2 yr−1) and higher than the observations. Moreover, CUE in JULES-C and JULES-CN (Eq. 54) is higher than observations and JULES-CNP (JULES-C and JULES-CN: 0.38; JULES-CNP: 0.31; obs: 0.34 ± 0.1; note that this value is dimensionless).
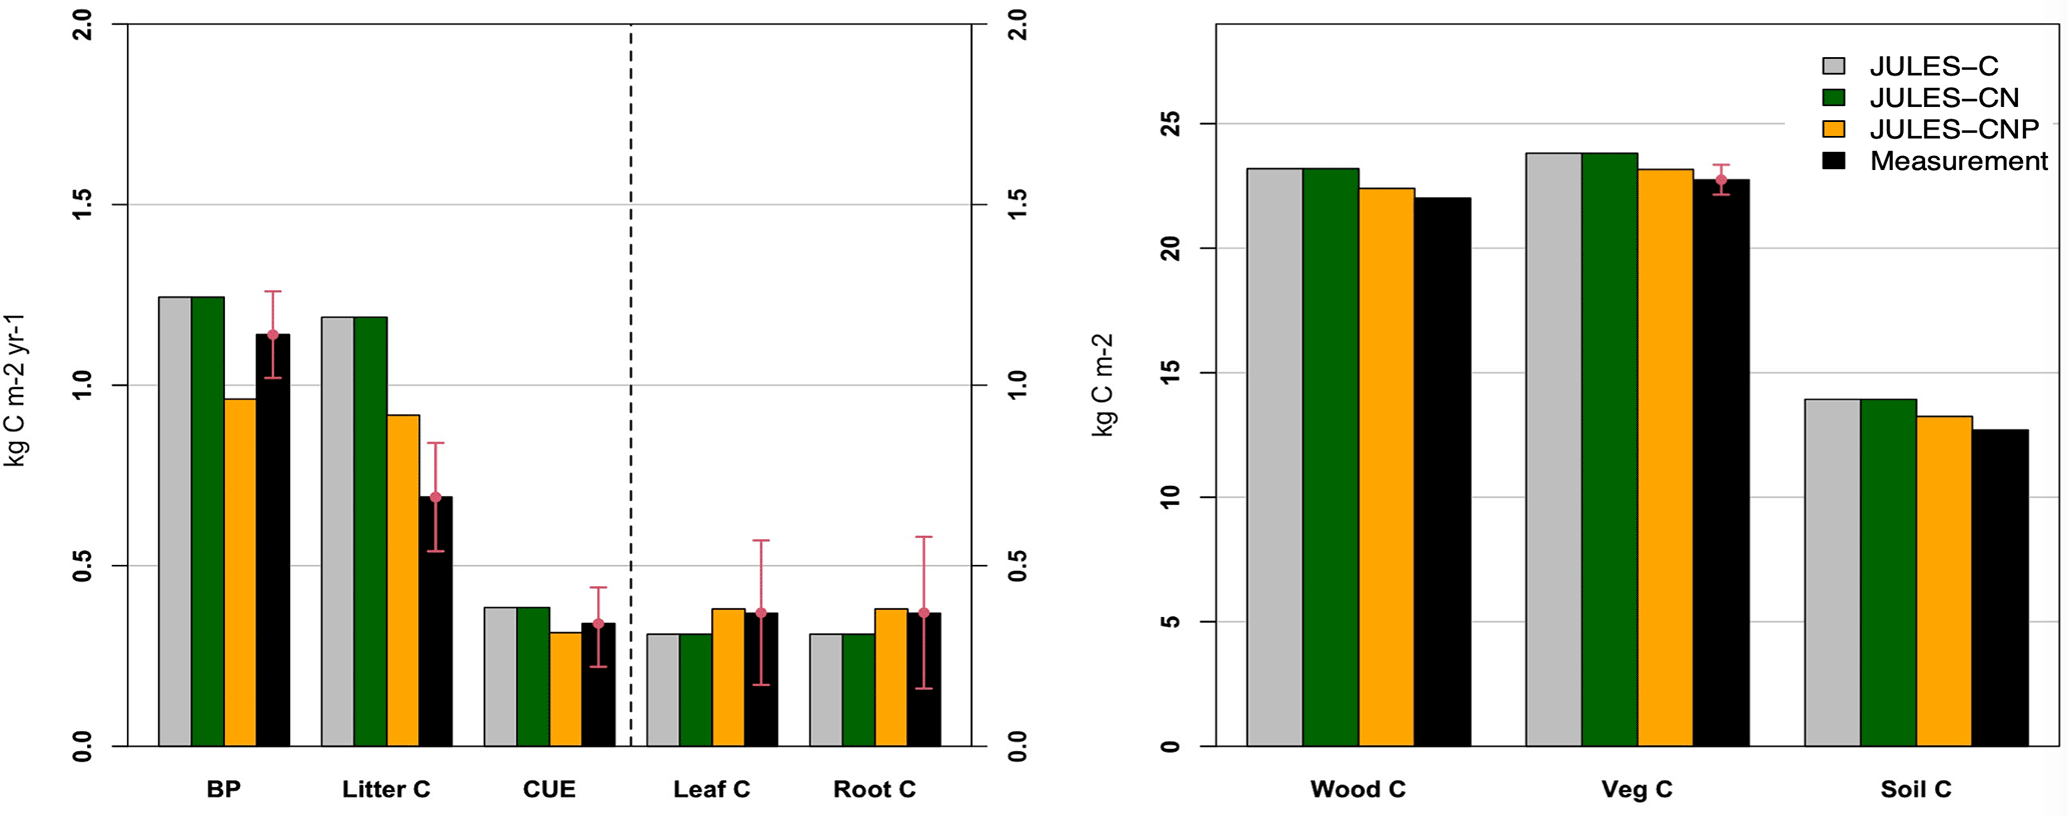
Figure 3JULES-C, JULES-CN, and JULES-CNP modelled vs. measured C pools (leaf, root, wood, vegetation, and soil C) (in kg C m−2) and fluxes (BP and litter C) (in kg C m−2 yr−1) and CUE under ambient CO2. Note that CUE is unitless.
4.1.4 Model evaluation at test sites under ambient CO2
Evaluation of JULES-C, JULES-CN, and JULES-CNP at five test sites against the observed C pools and fluxes demonstrates that the inclusion of P processes improved the simulation of C pools and fluxes across all test sites (Fig. 4). At all Amazon sites, JULES-C and JULES-CN overestimated BP compared to JULES-CNP, which estimated lower BP values that were closer to the measurements for AGP (JULES-C: +35 %; JULES-CN: +33 %; JULES-CNP: +21 %), CAX (JULES-C: +45 %; JULES-CN: +44 %; JULES-CNP: +7 %), and SA3 (JULES-C: +27 %; JULES-CN: +26 %; JULES-CNP: −23 %). Moreover, at Gigante Peninsula JULES-C and JULES-CN overestimated BP (+42 % and +40 %, respectively) and CNP slightly underestimated BP (−15 %). Furthermore, at the Hawaii Kokee site, all three versions of JULES underestimated the BP (JULES-C: −8 %; JULES-CN: −8 %; JULES-CNP: −32 %). The litterfall and respiration fluxes in JULES-CNP have decreased compared to JULES-C and JULES-CN, which overestimated both fluxes at all the test sites compared to the measurements. The litterfall flux comparisons show a significant overestimation using JULES-C and JULES-CN across all the tested sites. For the Amazon sites inclusion of P limitation reduced the litterfall flux but still overestimated it (AGP: +50 %; CAX: +24 %; SA3: +16 %), and at Gigante Peninsula and Hawaii Kokee litterfall flux was slightly underestimated (Gigante Peninsula: −9 %; Hawaii Kokee −19 %).
The respiration measurements were only available at two Amazon sites (CAX and SA3) at which inclusion of P limitation resulted in a well-estimated flux at both sites compared to JULES-C and JULES-CN (CAX: +38 %, +38 %, and −1 % for C, CN, and CNP, respectively; SA3: +38 %, +38 %, and −2 % for C, CN, and CNP, respectively).
The total vegetation biomass also reduced using JULES-CNP compared to the other versions and yielded closer values to the measurements across all the sites. However, except at the AGP site in which all three versions of JULES slightly underestimated the biomass (C: −1 %; CN: −1 %; CNP: −6 %), at the other test sites JULES-CNP estimated lower biomass pools compared to the other versions, which also overestimated total vegetation biomass.
Similarly, the soil C pool was overestimated prior to inclusion of P limitation in JULES at the test sites, and JULES-CNP estimated a closer value compared to the measurements (slight underestimation at CAX and SA3 sites of −5 % and −18 %, respectively, and close values at Gigante Peninsula and Hawaii Kokee of +3 % and +4 %, respectively).
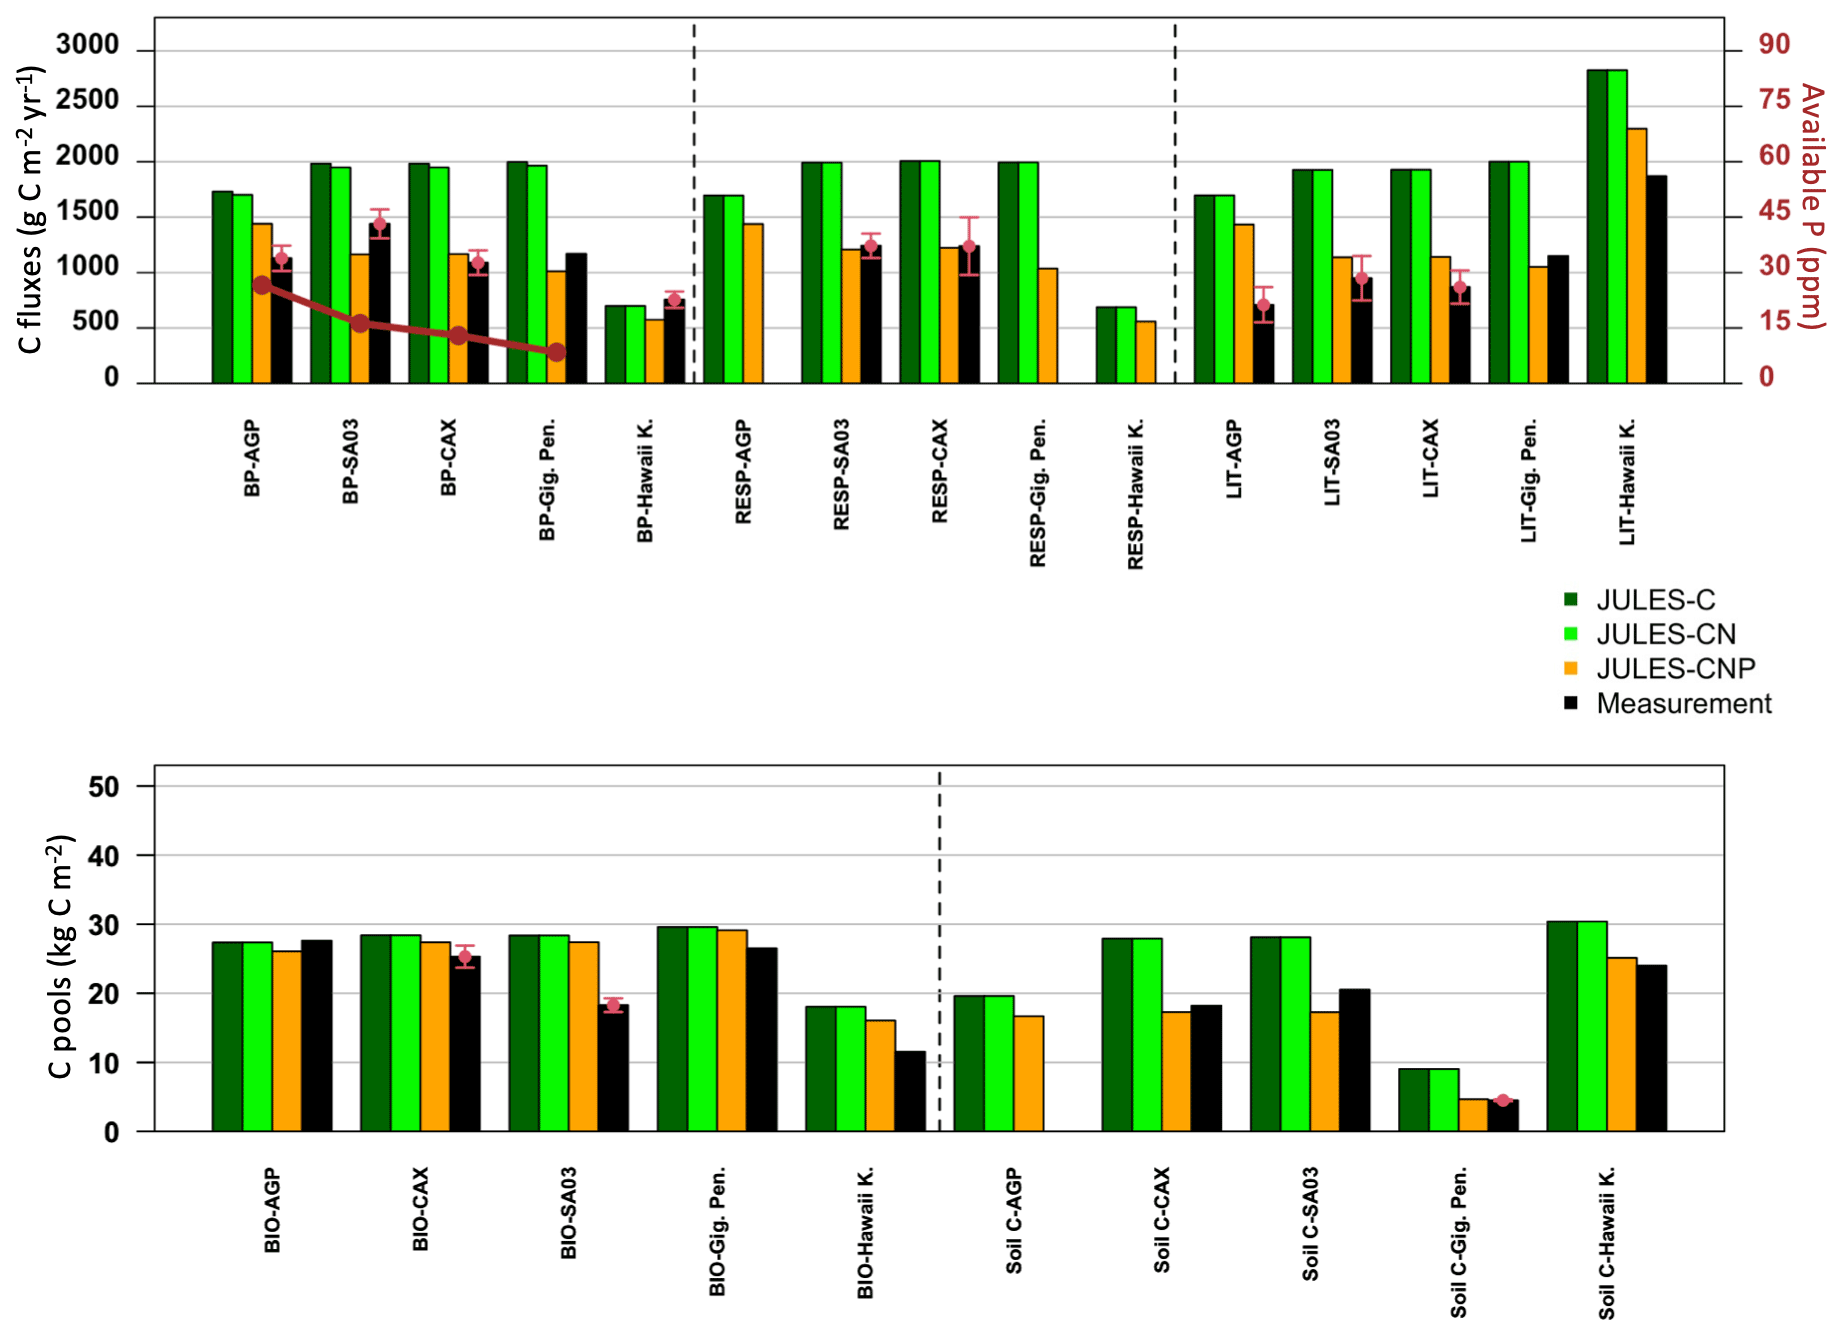
Figure 4Observed and simulated (JULES-C, JULES-CN, JULES-CNP) C fluxes and pools (averaged measurements: red points; SD: red arrows) and available observed P (dark red points and lines, reported in ppm) at test sites across the Amazon (AGP, SA03, CAX), Gigante Peninsula (Gig. Pen.), and Hawaii Kokee (Hawaii K.).
4.1.5 Model sensitivity
The results indicate that among all the corresponding C and P pools and fluxes, the excess C flux – which demonstrates P limitation to growth – shows the highest sensitivity to changes in C:P ratios (Fig. 5a), KP (Fig. 5b), Kor-max (Fig. 5c), and Kin-max (Fig. 5d). A decrease in plant C:P results in a large increase in excess C. This is due to the higher plant P demand as a result of lower plant C:P ratios. An increase in the uptake factor and maximum sorbed organic and inorganic P also results in an increase in excess C. This is due to the higher uptake demand through higher uptake capacity (due to higher KP) and lower available P for uptake due to higher organic and inorganic sorbed P (due to higher Kor-max, Kin-max). Since the total P in the system is lower than the plant demand, the uptake capacity, and sorbed P, higher P limitation is placed on growth (decreasing BP), which results in an increase in excess C and decrease in plant C, and soil C also decreases as a result of lower litter input (Fig. 5). Total soil P shows low sensitivity to changes in plant C:P and uptake factor but high sensitivity to maximum inorganic sorbed P. Moreover, sorbed P shows medium and high sensitivity to maximum organic and inorganic sorbed P, respectively (Fig. S5). Nevertheless, organic and inorganic P adsorption coefficients (Ksorp-or, Ksorp-in) show no sensitivity to C and P pools and fluxes. This is due to limiting the organic and inorganic P sorption terms so that they are only controlled by maximum sorption capacity, meaning that they are not affected by organic and inorganic adsorption coefficients.
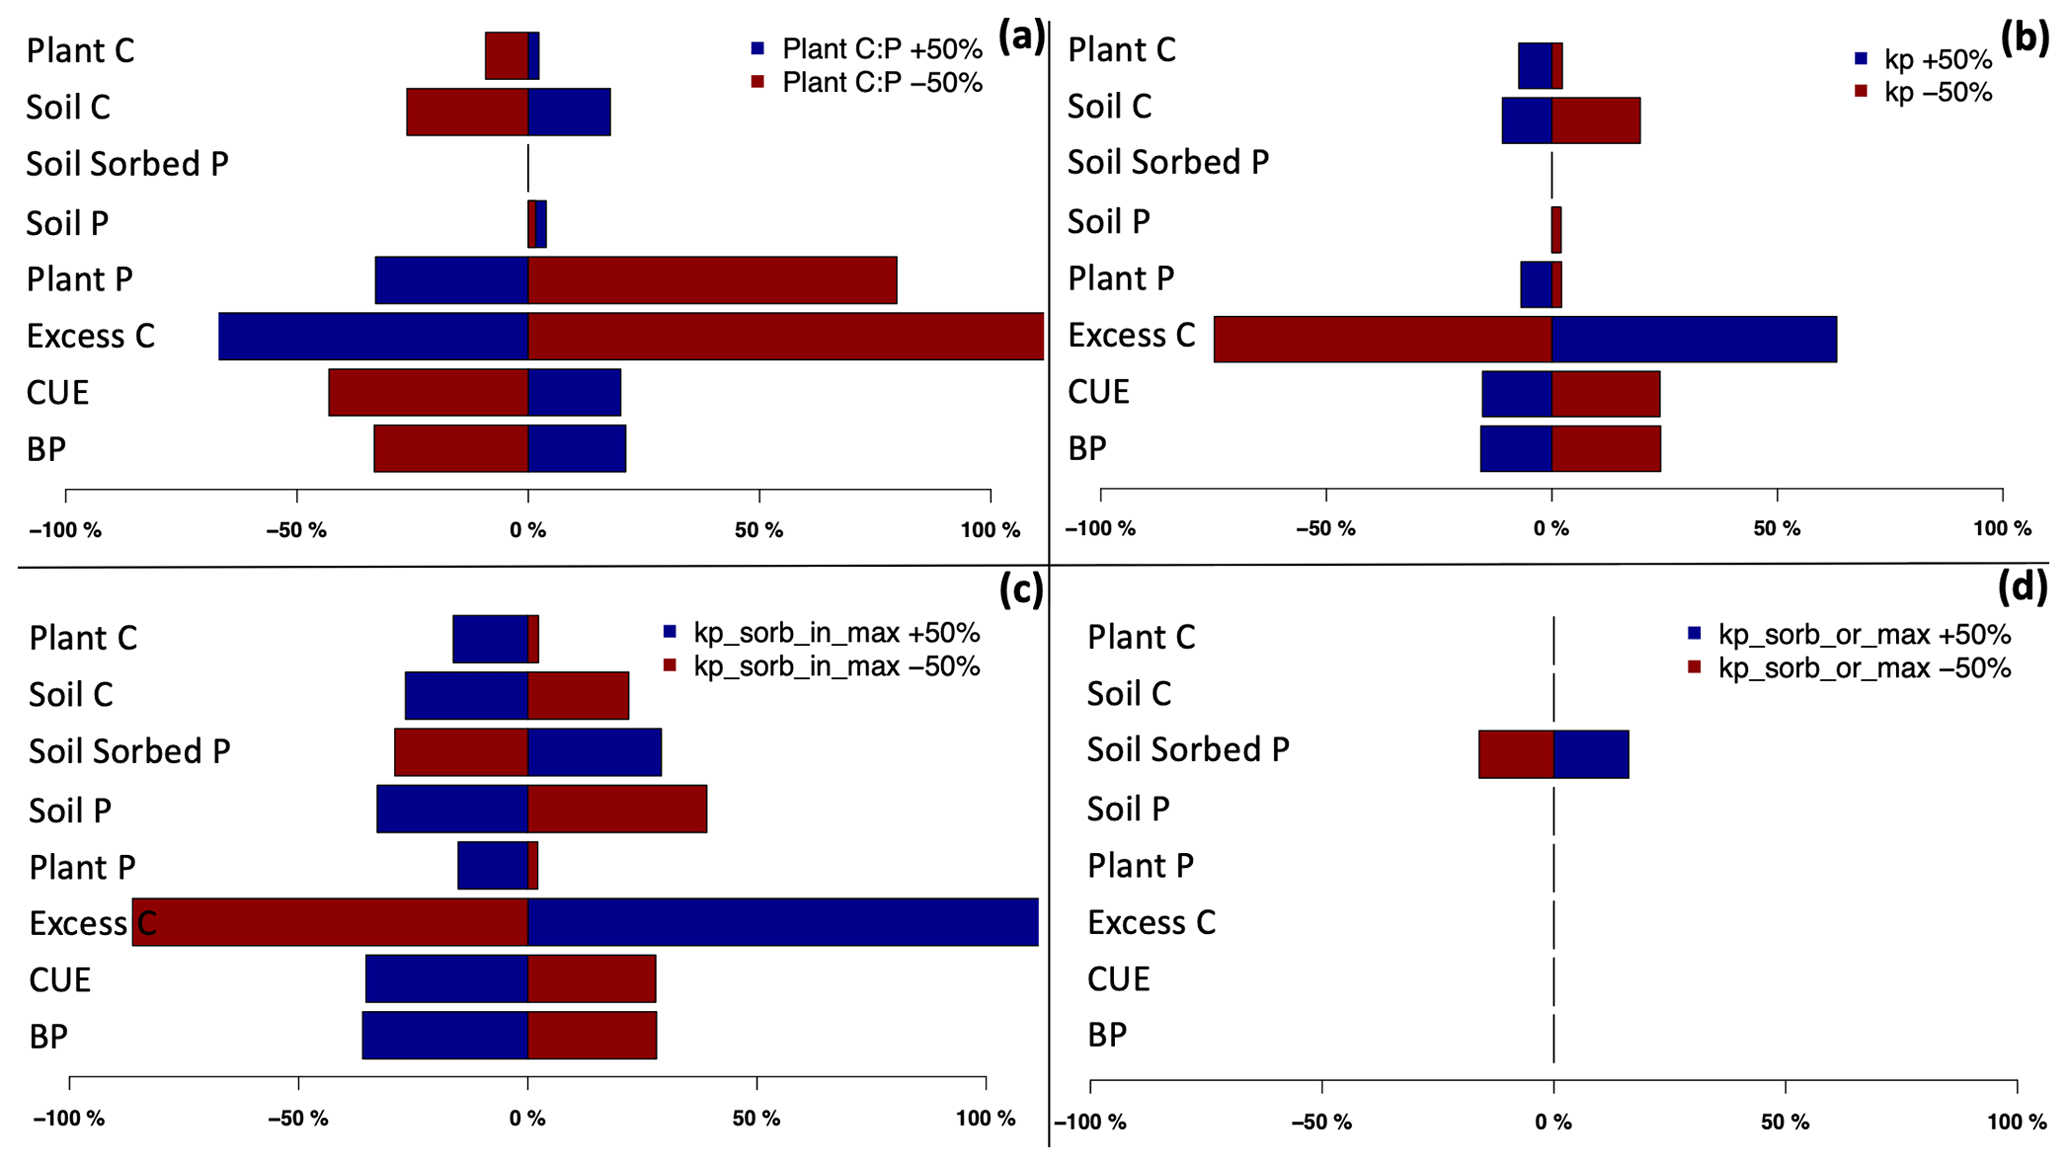
Figure 5Sensitivity of C and P pools to variation in key model parameters: prescribed tissue C:P (a), Kp (b), Kp_sorb_in (c), and Kp_sorb_or (d) under ambient CO2.
4.2 Model application under elevated CO2
4.2.1 Simulated plant and soil C and P pools and fluxes in JULES-CNP: eCO2 vs. ambient CO2
The eCO2 simulation using JULES-CNP yields a higher GPP compared to the ambient CO2 (0.83 kg C m−2 yr−1 increase) as a result of CO2 fertilization. Moreover, due to the GPP increase, NPP and RESP also increased compared to ambient CO2 (NPP: 0.49 kg C m−2 yr−1 increase; RESP: 0.3 kg C m−2 yr−1 increase) (Table 7). The total simulated vegetation C pool increases under eCO2 compared to ambient CO2 (0.41 kg C m−2), and thus the estimated plant P (estimated as a fraction of C:P ratios) increases as well (+0.45 g P m−2) (Fig. 6, Table 6). Thus, the simulated plant P demand is higher, and as the total available soil P for uptake is limited, the simulated excess C flux increases to 0.51 kg C m−2 yr−1. Moreover, despite the higher NPP under eCO2 compared to simulated NPP under ambient CO2, the BP is similar to the ambient CO2 (2 % difference) due to the substantial increase in simulated excess C.
The simulated organic soil P values under eCO2 were close to those under ambient CO2 (1.6 g P m−2) (Table 7). This is due to the same parameterization of the output fluxes from this pool being used for eCO2 and ambient CO2. The simulated pool of inorganic P under eCO2 decreases compared to the ambient CO2 by 0.11 g P m-2 due to the increased plant P pools and slight increase in uptake (+0.13 %).
However, the simulated sorbed organic and inorganic soil P values from eCO2 are similar to those simulated under the ambient CO2, which is due to the same parameterization of the sorption function (maximum sorption capacity) from the ambient CO2 run, as explained in Sect. 3.1. Moreover, the modelled occluded and weathered soil P values were similar to those in the ambient CO2 simulation (Table 7), which is due to the same prescribed observational data being used for this simulation.
4.2.2 Comparison of JULES-C, JULES-CN, and JULES-CNP under elevated CO2
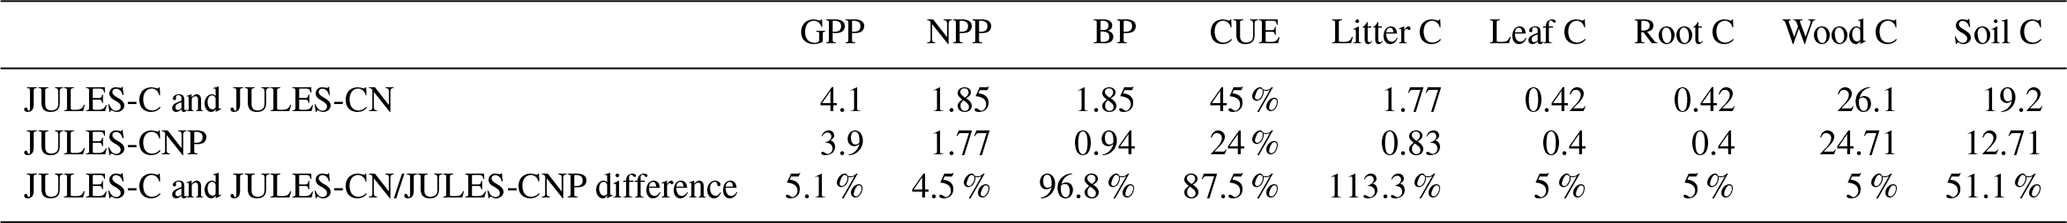
JULES-C and JULES-CN show higher vegetation and soil C pools, BP, and litter flux compared to JULES-CNP (Table 8, Fig. S2). Under eCO2, simulated NPP using JULES-C and JULES-CN is 4.5 % higher than JULES-CNP and BP is 96.8 % higher in JULES-C and JULES-CN than in JULES-CNP, which simulates an excess C flux of 0.81 kg C m−2 yr−1, equivalent to 46 % P limitation under eCO2. As a result of P limitation and eCO2, the simulated CO2 fertilization effect estimated based on changes in biomass under ambient and eCO2 was reduced from 13 % in JULES-C and JULES-CN to 10 % in JULES-CNP. Moreover, the CUE from JULES-C and JULES-CN is 87.5 % higher than in JULES-CNP as a result of high P limitation over biomass production.
Table 8Simulated C pools and fluxes with JULES-C and JULES-CN and the difference between them and JULES-CNP (in percent) under eCO2. A positive percentage means larger respective values simulated with JULES C and JULES CN than with JULES-CNP (between period 2017–2018).
Inter-model comparisons under elevated CO2
Following Fleischer et al. (2019), we report the simulated response to eCO2 for the year 1999 (initial: CO2 effect) and from 1999 to 2013 (15 years: final effect), which are both different from our evaluation period (2017–2018). Using JULES-C and JULES-CN under eCO2, simulated GPP and NPP during the first year increase by 30 % and 61 % and by 28 % and 52 % after 15 years, respectively (Fig. 6). However, using JULES-CNP, eCO2 increases simulated GPP, NPP, and BP responses during the first year by 29 %, 51 %, and 20 % and by 28 %, 43 %,and 7 % after 15 years, respectively.
Corresponding simulated CUE values during the first year and over 15 years show an increase of 24 % and 20 % in response to eCO2 using JULES-C and JULES-CN, respectively. However, using JULES-CNP, simulated CUE values for the first year and after 15 years are reduced by 7 % and 17 %, respectively, in response to eCO2.
Simulated total biomass (leaf, fine root, and wood C) (ΔCveg) using JULES-C and JULES-CN for the first year and after 15 years of eCO2 increased by 9 % and 13 %, respectively. However, using JULES-CNP ΔCveg only increases this value by 0.5 % and 9 % for first year and after 15 years of eCO2, respectively.
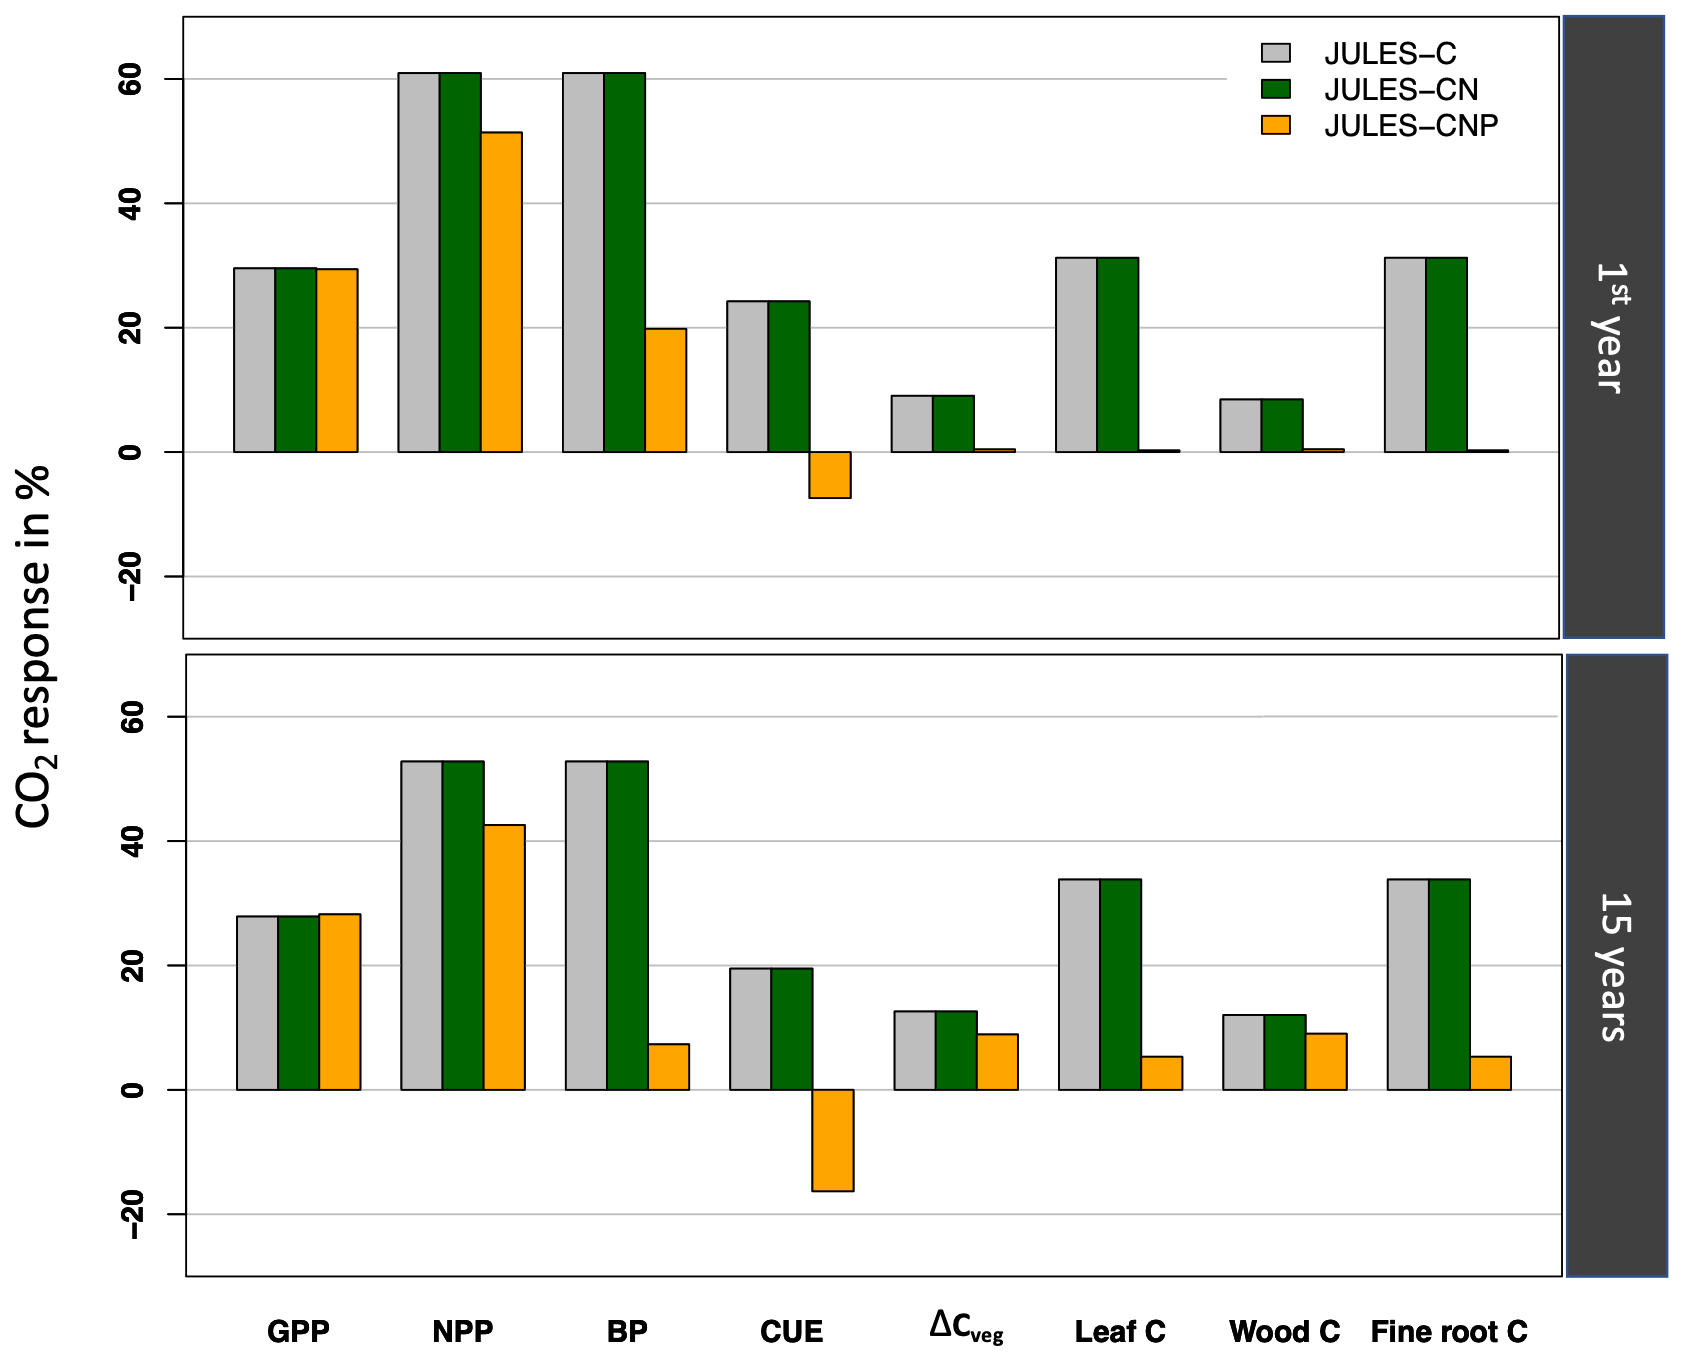
Figure 6Relative effect of eCO2 on simulated GPP, NPP, BP, CUE, ΔCveg, leaf C, wood C, and fine root C using three versions of the JULES model over the first year (initial response) and after 15 years (final response).
4.3 Plant P demand, uptake, and excess C under ambient and elevated CO2
To further understand the CP cycle dynamics, we studied the monthly averaged plant P demand and the relative (limited) P uptake (Eq. 26) under both ambient and elevated CO2 conditions (Fig. 7).
Under ambient CO2 conditions, the highest GPP is estimated at 0.29 ± 0.016 kg C m−2 per month in July and the lowest value is 0.17 ± 0.051kg C m−2 per month in October (Fig. 7a). The estimated WUE and SMCL in October is among the lowest estimated monthly values at 2.3 ± 0.51 kg CO2 kg−1 H2O and 526.2 ± 31 kg m−2, respectively (Fig. 7c). The highest P demand is estimated at 0.4 ± 0.02 g P m−2 per month in July and the lowest demand is estimated at 0.2 ± 0.08 g P m−2 per month in October. Consequently, the highest and lowest uptake are 0.32 ± 0.01 and 0.19 ± 0.07 g P m−2 per month, respectively. The excess C for the highest and lowest GPP and demand periods are estimated at 0.4 ± 15 and 0.04 ± 0.07 kg C m−2 per month, respectively.
However, similar to ambient CO2, under eCO2 conditions the highest estimated GPP is in July at 0.36 ± 0.017 kg C m−2 per month and the lowest value is in October at 0.25 ± 0.062 kg C m−2 per month (Fig. 7b). The estimated WUE and soil moisture content (SMCL) for the lowest GPP period are among the lowest monthly estimated values at 3.5 ± 0.74 kg CO2 kg−1 H2O and 552 ± 33 kg m−2 for October, respectively (Fig. 7d). The highest P demand is estimated for July at 0.51 ± 0.02 g P m−2 per month, with an uptake flux of 0.31 ± 0.02 g P m−2 per month, and the lowest P demand is estimated for October at 0.32 ± 0.1 g P m−2 per month, with an estimated uptake flux of 0.26 ± 0.06 g P m−2 per month. The highest excess C flux is also for July at 1.01 ± 0.17 kg C m−2 per month and the lowest is for October at 0.27 ± 0.29 kg C m−2 per month.
However, despite the P limitation in both eCO2 and ambient CO2 conditions, the P uptake flux under eCO2 is higher than the ambient CO2 condition. This is due to the higher WUE and increased SMCL (controlling uptake capacity, Eq. 27) under eCO2 conditions, and thus more water availability during the dry season to maintain productivity and critically transport P to the plant (see Eq. 27), compared to ambient CO2 condition (Fig. 7c and d). Additionally, in JULES both the vertical discretization (Burke et al., 2017) and mineralization terms (Wiltshire et al., 2021) depend on the soil moisture and temperature. Thus, higher P concentration and uptake are found under eCO2 conditions.
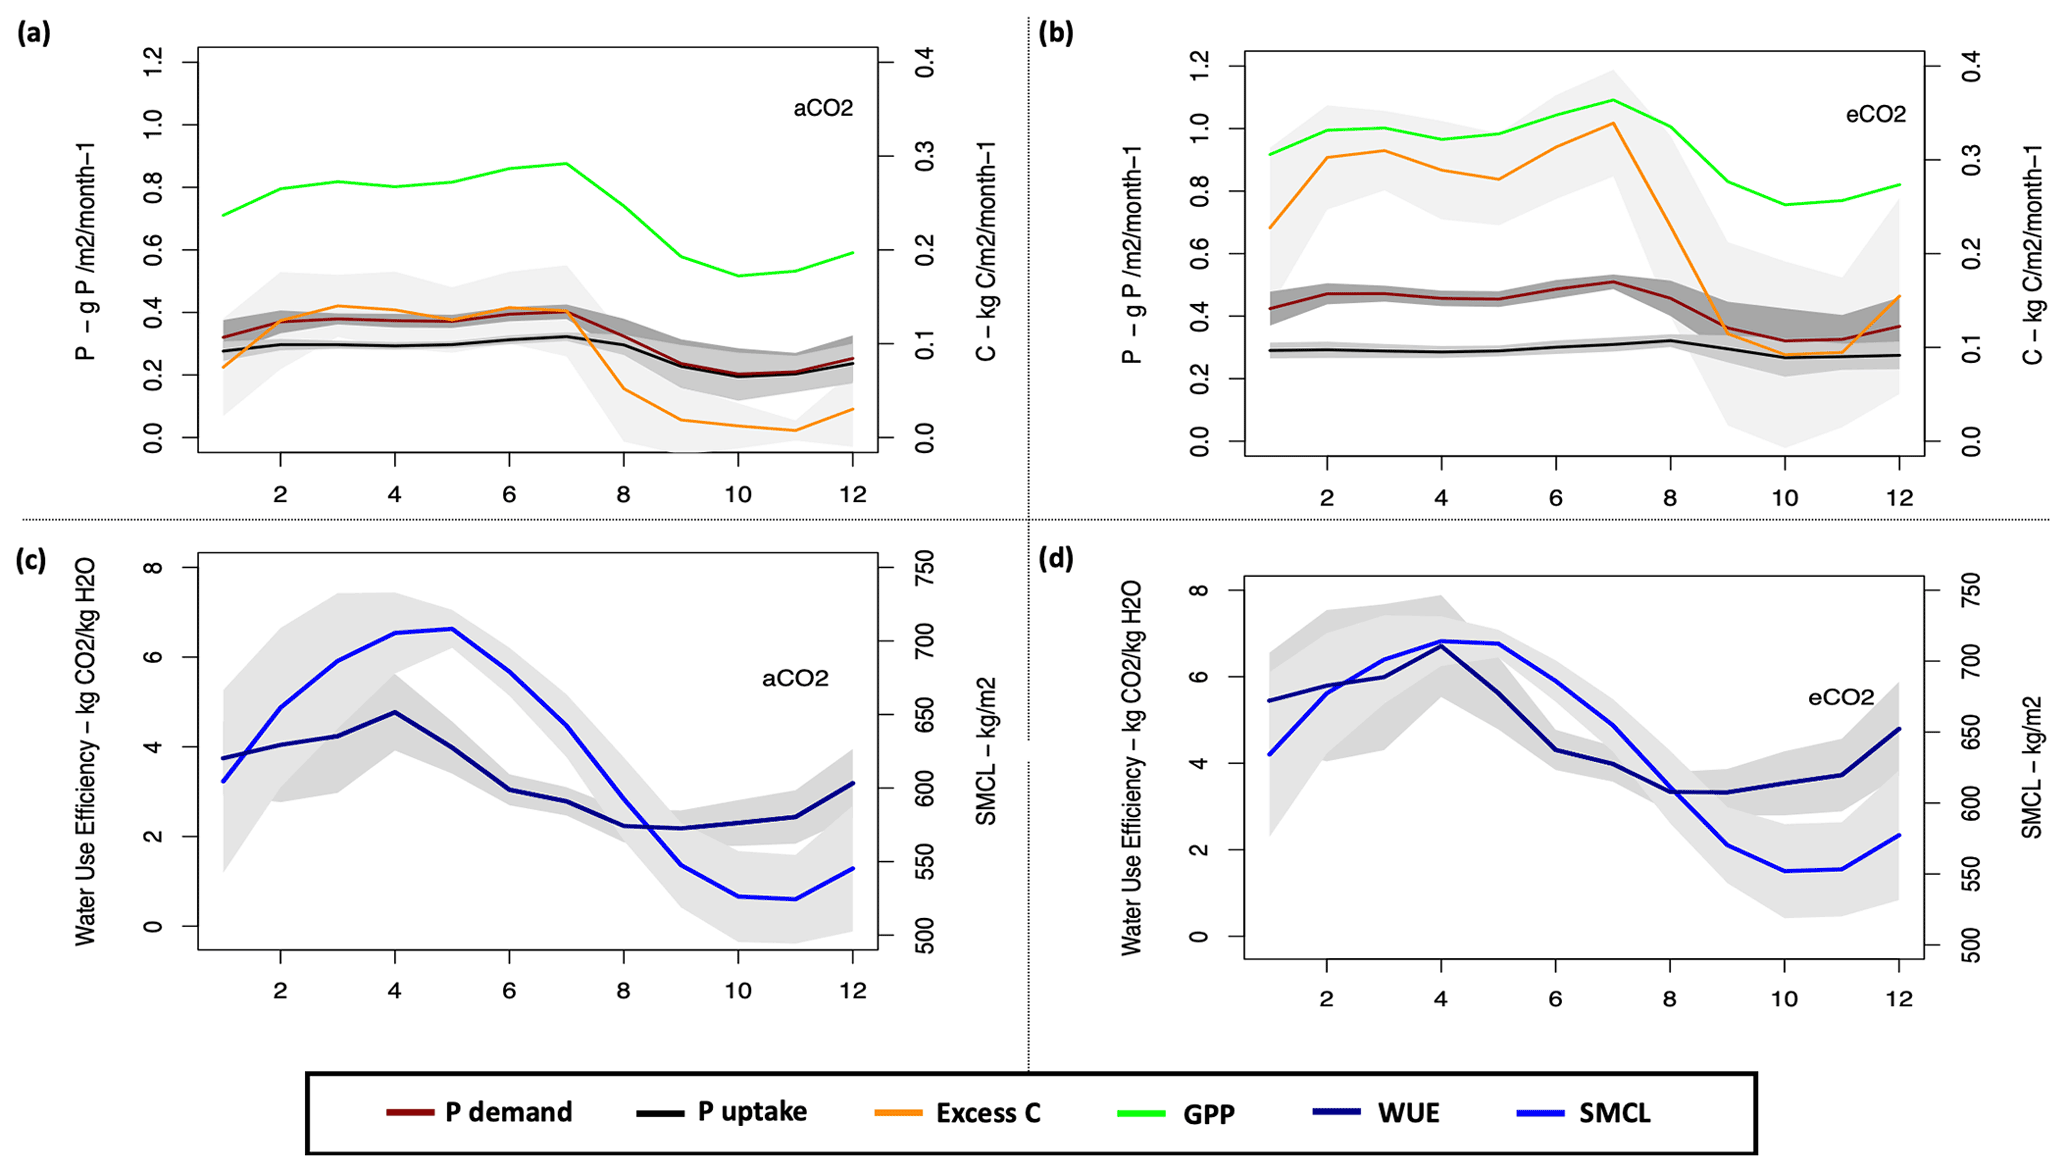
Figure 7Simulated monthly plant P demand and uptake (g P m−2 per month), excess C, and GPP (kg C m−2 per month) under (a) aCO2 and (b) eCO2 conditions. Water use efficiency (g m−2 per month) under (c) ambient CO2 (aCO2) and (d) eCO2 conditions. The grey area represents the standard deviation.
4.4 Soil P pool profiles under ambient CO2 and elevated CO2
We explored the distribution of the inorganic and organic soil P and their sorbed fraction within the soil layers and under different CO2 conditions (Fig. S3). Both the ambient and eCO2 simulations have a close inorganic soil P distribution at the topsoil layer (0–30 cm) (0.85 vs. 0.9 g P m−2, respectively) and similar organic soil P distribution (0.85 vs. 0.9 g P m−2, respectively).
However, the organic soil P and sorbed forms of inorganic and organic soil P profiles do not change significantly between different sets due to the similar parameterization of the processes that control these pools (processes that are related to the physical aspects of soils, and thus do not change under eCO2 conditions) and the same parameter values being used for both ambient and eCO2 runs.
Moreover, the soil P within 30 cm soil depth for ambient and eCO2 conditions is at 14.7 and 14.56 g P m−2, respectively, and the total ecosystem P for both ambient and eCO2 conditions is at 35.97 g P m−2. However, the slightly lower soil P in the eCO2 conditions is due to the higher plant P demand compared to the ambient condition, which explains the higher allocated P vegetation (10 %) under eCO2 conditions.
Studies show the significant role of the tropical forests, and Amazonia in particular, in C uptake and regulating atmospheric CO2 (Brienen et al., 2015; Phillips et al., 2017). As soil P availability is low in the majority of Amazonia (Quesada et al., 2012), the competition for nutrients by both plant and soil communities is high (Lloyd et al., 2001). The responses of these communities to eCO2 under P-limited conditions remains uncertain (Fleischer et al., 2019). These responses in P-enabled models are represented in different ways regarding the excess C, which is not used for plant growth due to P limitation. Either growth is directly downregulated by taking the minimum labile plant C, N, and P (Goll et al., 2017), and photosynthesis is downregulated via Vcmax and Jmax (Zhu et al., 2016; Yang et al., 2014; Comins and McMurtrie, 1993). Models like JULES-CNP downregulate NPP via respiration of excess carbon that cannot be used for growth due to plant nutrient constraints (Haverd et al., 2018). The estimated CUE depends on the modelling approach. Models that downregulate the photosynthetic capacity and GPP consequently (Zhu et al., 2016; Yang et al., 2014; Comins and McMurtrie, 1993) simulate a positive CUE response to CO2 fertilization, while models that downregulate the NPP and respire the excess C (Haverd et al., 2018) simulate a negative CUE response (Fleischer et al., 2019), which is in line with field studies showing lower CUE when nutrient availability declines (Vicca et al., 2012b). However, this remains a major uncertainty in understanding the implication of P limitation on terrestrial biogeochemical cycles.
The JULES-CNP structure represents key P processes in both plant and soil pools and can be applied to the Amazon region using existing soil (Quesada et al., 2011) and foliar structural and nutrient (Fyllas et al., 2009) data for parameterization. The model can be applied globally and under future climate projections using global soil P data (Sun et al., 2021) for model initialization and PFT-specific plant (Zechmeister-Boltenstern et al., 2015) and soil stoichiometries (Zechmeister-Boltenstern et al., 2015; Tipping et al. (2016), sorption, and weathering ratios (based on lithological class-specific data from the GliM lithological map, Hartmann and Moosdorf, 2012, and soil shielding from Hartmann et al., 2014).
5.1 Evaluation of model performance
At the study site, JULES-CNP could reproduce the magnitude of soil organic and inorganic P pools and fluxes. The relative distribution of total organic P, total inorganic P and residue P fractions of total P in soils under Brazilian eucalyptus plantations (Costa et al., 2016) shows an inorganic P fraction of 28 % from total soil P, which is close to our estimation of 24 %, and organic P fraction of 30 % from total soil P, which is higher than our estimated fraction of 18 %. Thus, we may need to improve the process representation or the parameters that control the organic P concentration, such as litter flux and decomposition, soil organic P mineralization, and immobilization in the future.
Our estimated maximum P uptake, which represents the actual available P for plant uptake (Goll et al., 2017) for both ambient and eCO2 is highly correlated with the plant P demand (R2=0.96 and 0.52, respectively). The plant P demand depends on the GPP changes, which are reflected by the WUE (Hatfield and Dold, 2019). Hence, under ambient CO2, JULES-CNP simulates lower GPP and plant P demand during the dry season than during the wet season. Sufficient P uptake during these periods results in the lowest P limitation and thus the lowest simulated excess C. Nevertheless, under eCO2 the same pattern is simulated, but a higher availability of soil P is simulated due to the stomatal closure in the dry season. Hence, due to the plant's more efficient water usage, the soil moisture in the dry season is higher (Xu et al., 2016), which impacts our capped P uptake flux (Eq. 27) and increases the uptake capacity.
Overall, JULES-CNP reproduced observed C pools and fluxes in acceptable ranges compared to the measurements. However, when using the JULES default Vcmax estimation method (Eq. 40), the model slightly underestimates the total GPP (2.9 vs. 3–3.5 kg C m−2 yr−1). Therefore, in this version of the model we used the improved Vcmax estimation method based on N and P (Eq. 46), which resulted in a final estimated GPP closer to the measurements (3.06 kg C m−2 yr−1).
Our results show an increase in GPP (21 %) in response to eCO2 that is higher than the average increase of GPP reported in mature eucalyptus forests (11 %) that are also growing under low P soils at the free-air CO2 enrichment experiment (EucFACE) facility in Australia (Jiang et al., 2020). This can be attributed to the lower decrease of biomass growth response estimated by JULES-CNP (−3 %) compared to the measurements from mature eucalyptus forests (−8 %) (Ellsworth et al., 2017) due to P limitation, which has been shown to impact the above-ground biomass growth response in mature forests (Körner et al., 2005; Ryan, 2013; Klein et al., 2016).
In order to estimate the biomass production (BP), we deducted the excess C fluxes from NPP. Using JULES-C and JULES-CN, the simulated biomass productivity enhancement due to eCO2 (49 %) is in the middle range of the reported for the different biomes defined by Walker et al. (2021). Moreover, our estimated difference in BP between ambient and eCO2 conditions (2 %) is close to the estimated difference for mature forests (3 %) (Jiang et al., 2020).
A global estimation for tropical forests using the CASA-CNP model, which includes N and P limitations on terrestrial C cycling, shows that NPP is reduced by 20 % on average due to the insufficient P availability (Wang et al., 2010), which is close to our estimated P limitation of 24 %. This finding is in line with a field study that shows a strong correlation between the total NPP and the soil-available P (Aragão et al., 2009).
The estimated decrease in NPP in response to eCO2 as a result of P limitation is in line with the findings from the CLM-CNP model at five tropical forests (Yang et al., 2014), which indicates a dependency of CO2 fertilization on the processes that affect P availability or uptake.
Our estimated CUE (0.31) is close to that of Jiang et al. (2020) for mature eucalyptus forests (0.31 ± 0.03) and to the measurements from our study site (0.34 ± 0.1). There is currently a lack of representation of stand age in JULES-CNP, a variable that can significantly affect CUE (e.g. mature trees are less responsive to the nutrient limitations) (De Lucia et al., 2007; Norby et al., 2016). However, the recent development of the Robust Ecosystem Demography (RED) model in JULES (Argles et al., 2020) and its integration into JULES-CNP in the future can address this issue.
Under low P availability, all available P is considered to be adsorbed or taken by plant and microbes for further consumption, with leaching considered to be minor within the timescales of our study period (Went and Stark, 1968; Bruijnzeel, 1991; Neff et al., 2000). Despite studies that show the possibility of P fixation as a source of available P for plants (Van Langenhove et al., 2020; Gross et al., 2021) due to the strong fixation of P in the soil (Aerts and Chapin, 2000; Goodale et al., 2002), the P deposited is unlikely to be available to plants in the short term (de Vries and Butterbach-Bahl, 2014); for this reason this version of JULES-CNP did not include P deposition. However, both P deposition and leaching are likely to have a very important role in sustaining the productivity of tropical forests in the Amazon over longer timescales (Van Langenhove et al., 2020) and need to be considered in future studies. Moreover, biochemical mineralization is also not included in the current version of JULES-CNP, which only accounts for total mineralization. However, models that include this process show no significant difference between total and biochemical mineralized P, which could be due to complexity of identifying the inclination of mineralization vs. uptake (Martins et al., 2021). Lastly, in order to capture the plant internal nutrient impact on the C storage, future work should focus on implementing recent developments, such as the non-structural carbohydrate (NSC) pools (Jones et al., 2020), in JULES-CNP.
5.1.1 Evaluation of model performance at test sites
Overall, inclusion of P processes in JULES-CNP improved the previously overestimated C fluxes and pools using JULES-C and JULES-CN. Generally, the biomass productivity tends to follow the observed P availability (Fig. 4), where the sites with higher available P for uptake simulated higher productivity, which is in line with observations of P availability in the Amazon (Aragão et al., 2009). Nevertheless, this tendency could be altered if the natural conditions in these forests are perturbated. For instance, in cases of high-mortality events in these P-limited sites (Malhi et al., 2009; Pyle et al., 2009), regrowing forests developing over the highly weathered Oxisols with limited available P (Davidson et al., 2004) results in the limitation shifting from P to N (Herbert et al., 2003). Hence, the controlling processes under N limitation will be N related, and thus processes such as N leaching or outgassing (Yang et al., 2014) will define the productivity. This shift in limitation conditions is not represented by JULES-CNP; therefore, at a few tested sites the model overestimated the P limitation and underestimated the productivity to the point that it was below the measured values. Moreover, the higher (than other sites) BP in JULES-C and JULES-CN at the Gigante Peninsula is related to the higher solar radiation in the forcing data at that site (Fig. S8).
The estimated litterfall and respiration fluxes were considerably lower with JULES-CNP than JULES-C and JULES-CN due to the lower simulated NPP with the former, which is in closer agreement with the observations at all sites. Consequently, the total vegetation and soil C pools have lower values under the P limitation (Malhi et al., 2009), which could not be captured by JULES-C and JULES-CN and successfully represented by JULES-CNP.
As shown in Fig. 5, JULES-CNP is highly sensitive to the five parameters needed to run JULES-CNP in addition to JULES-C and JULES-CN, and these were all prescribed for simulations at test sites. The successful model performance at these sites demonstrates the importance of these parameters in JULES-CNP, with implications for global-scale simulations.
5.2 Inter-model comparison of JULES-C, JULES-CN, and JULES-CNP
The comparison of simulated GPP enhancement across JULES versions for the first year is within the middle range of the first-year CO2 responses of the C and CN models studied by Fleischer et al. (2019) evaluating simulated eCO2 effects at a site in Manaus using the same meteorological forcing and methodology used in this study for a range of dynamic global vegetation models. However, comparison for 15 years of eCO2 data shows that the simulated response with JULES-CNP is on the higher end of Fleischer et al. (2019) study, which is due to the higher estimated biomass growth by JULES-CNP (Table S1 in the Supplement). Similarly, when using JULES-CNP our estimated GPP enhancement is on the higher end of model estimations in Fleischer et al. (2019). Moreover, comparing the GPP responses between different versions of (JULES-C, JULES-CN, and JULES-CNP), JULES-CNP shows a slightly higher response to CO2 fertilization associated with the higher WUE changes (Xiao et al., 2013) (Fig. S4). This is due to the higher sensitivity of the plant to water availability than P availability in the P-limited system (He and Dijkstra, 2014). Hence, under eCO2, simulated transpiration is decreased (Sampaio et al., 2021) and photosynthesis is enhanced compared to ambient CO2 due to the water-saving strategies of the plants and stomatal closure (Medlyn et al., 2016).
To that end, the monthly changes in WUE in JULES-CNP are highly correlated with the GPP, and thus the lowest and highest WUE values are found in the same periods as corresponding GPP values, which is similar to responses captured with the models studied by Fleischer et al. (2019) (Table S1).
Our estimated NPP enhancement using JULES-C and JULES-CN for both the first year and the 15-year period is within the middle range of the models in Fleischer et al. (2019). Nevertheless, the JULES-CNP response of BP is in the lower band of the CNP models in Fleischer et al. (2019) and close to the estimations from the CABLE (Haverd et al., 2018) and ORCHIDEE (Goll et al., 2017) models, which may be due to the similar representation of P processes and limitations between these models. However, our results show a 29 % decrease in NPP using JULES-CNP compared to JULES-C and JULES-CN, which is smaller than the differences between CLM-CNP and CLM-CN (51 % decrease) (Yang et al., 2014). The lower estimated decrease in JULES highlights the need for further study of the responses of corresponding plant C pools and fluxes to the changes in soil and plant P. Therefore, future work should be focused on the improvement of the total P availability and the plant C feedbacks. Moreover, there are other environmental factors (such as temperature) that show a possible impact on the CO2 elevation and the changes of NPP (Baig et al., 2015) and need further examination in our model.
The CUE estimations of first-year and 15-year responses to CO2 elevation from JULES-C and JULES-CN are in the middle range of C and CN models in Fleischer et al. (2019). However, the estimated CUE using JULES-CNP for first year and after 15 years are in the low range of CNP models reported by Fleischer et al. (2019), which is due to the same reason discussed for NPP comparison.
Finally, our estimated total biomass enhancement (ΔCveg) using JULES-C and JULES-CN for the first-year and 15-year data are in the middle range of C and CN models from Fleischer et al. (2019) and are in lower range of CNP models from Fleischer et al. (2019) when using JULES-CNP. Nevertheless, while JULES-CNP includes the trait-based parameters (Harper et al., 2016), other functions such as flexible C allocation and spatial variation of biomass turnover are still missing, and future model improvement should be focused on their inclusion.
Land ecosystems are a significant sink of atmospheric CO2 and thus buffer the anthropogenic increase of this flux. While tropical forests contribute substantially to the global land C sink, observational studies show a stalled increase in carbon gains over the last decade (Hubau et al., 2020; Brienen et al., 2015). However, modelling studies that lack representation of P cycling processes predict an increasing sink (Fleischer et al., 2019; Fernández-Martínez et al., 2019). This is particularly relevant for efforts to mitigate dangerous climate change and assumptions about the future efficacy of the land C sink. Therefore, in this study we presented the full terrestrial P cycling and its feedback on the C cycle within the JULES framework. Our results show that the model is capable of representing plant and soil P pools and fluxes at a site in the central Amazon and across the extended P-limited test sites in the Amazon, Gigante Peninsula (Panama), and Hawaii chronosequences provided using site-level data for model parameterization. Moreover, the model estimated a significant NPP limitation under ambient CO2 due to the high P deficiency at these sites, which is representative of the central Amazon and tropical P-limited sites, and elevated CO2 resulted in a further subsequent decrease in the land C sink capacity relative to the model without P limitation. While our study is a step toward the full nutrient cycling representation in ESMs, it can also help the empirical community to test different hypotheses (i.e. dynamic allocation and stoichiometry) and generate targeted experimental measurements (Medlyn et al., 2015).
The modified version of JULES vn5_5 and the P extension developed for this paper are freely available on Met Office Science Repository Service: https://code.metoffice.gov.uk/svn/jules/main/branches/dev/mahdinakhavali/vn5.5_JULES PM_NAKHAVALI/ (Nakhavali, 2022) after registration (http://jules-lsm.github.io/access_req/JULES_access.html, last access: 28 June 2022) and completion of the software license form. Codes for compiling the model are available at https://doi.org/10.5281/zenodo.5711160 (Nakhavali, 2021a). Simulations were conducted using two sets of model configurations (namelists), i.e. one each for ambient CO2 conditions (https://doi.org/10.5281/zenodo.5711144, Nakhavali, 2021b) and for elevated CO2 conditions (https://doi.org/10.5281/zenodo.5711150, Nakhavali, 2021c).
The model outputs related to the results in this paper are provided in a Zenodo repository (https://doi.org/10.5281/zenodo.5710898, Nakhavali, 2021d). All of the R scripts used for processing the model outputs and producing results as table or figures are provided in a Zenodo repository (https://doi.org/10.5281/zenodo.5710896, Nakhavali et al., 2021).
The supplement related to this article is available online at: https://doi.org/10.5194/gmd-15-5241-2022-supplement.
MAN, LMM, SS, SEC, CAQ, AJW, IAP, KMA, and DBC developed the model and performed simulations and analysis. CAQ, FVC, RP, LFL, KMA, GR, LS, ACMM, JSR, RA, and JLC provided the measurements for the model parameterization and evaluation. MAN, LMM, SS, IAP, SEC, FVC, RP, LFL, KMA, and DBC contributed to writing the manuscript.
The contact author has declared that none of the authors has any competing interests.
Publisher's note: Copernicus Publications remains neutral with regard to jurisdictional claims in published maps and institutional affiliations.
This work and its contributors (Mahdi André Nakhavali, Lina M. Mercado, Kelly M. Andersen, and Iain P. Hartley) were supported by the UK Natural Environment Research Council (NERC, grant no. NE/LE007223/1). Mahdi André Nakhavali, Lina M. Mercado, Stephen Sitch, and Iain P. Hartley were also supported by the Newton Fund through the Met Office Climate Science for Service Partnership Brazil (CSSP Brazil). Lina M. Mercado acknowledges support from the Natural Environment Research Council (grant no. NEC05816 LTS-M-UKESM). Laynara F. Lugli was also supported by AmazonFACE programme (CAPES) and the National Institute of Amazonian Research (grant no. 88887.154643/2017-00). The authors acknowledge contributions from Celso Von Randow towards data curation of the meteorological forcing used in this study and Daniel Goll for modelling insight. We would like to thank Alessandro C. de Araújo and the Large-Scale Biosphere–Atmosphere Program (LBA), coordinated by the National Institute for Amazon Research (INPA), for the use and availability of data. We thank Jefferson Goncalves de Souza for processing the data required for additional site simulations.
This research has been supported by the Natural Environment Research Council (grant no. NE/LE007223/1) and the Newton Fund (Met Office Climate Science for Service Partnership Brazil (CSSP Brazil) grant).
This paper was edited by Hans Verbeeck and reviewed by Mingkai Jiang and two anonymous referees.
Aerts, R. and Chapin, F. S.: The Mineral Nutrition of Wild Plants Revisited: A Re-evaluation of Processes and Patterns, Adv. Ecol. Res., 30, 1–67, https://doi.org/10.1016/S0065-2504(08)60016-1, 1999.
Anav, A., Friedlingstein, P., Kidston, M., Bopp, L., Ciais, P., Cox, P., Jones, C., Jung, M., Myneni, R., and Zhu, Z.: Evaluating the land and ocean components of the global carbon cycle in the CMIP5 earth system models, J. Climate, 26, 6801–6843, https://doi.org/10.1175/JCLI-D-12-00417.1, 2013.
Aragão, L. E. O. C., Malhi, Y., Metcalfe, D. B., Silva-Espejo, J. E., Jiménez, E., Navarrete, D., Almeida, S., Costa, A. C. L., Salinas, N., Phillips, O. L., Anderson, L. O., Alvarez, E., Baker, T. R., Goncalvez, P. H., Huamán-Ovalle, J., Mamani-Solórzano, M., Meir, P., Monteagudo, A., Patiño, S., Peñuela, M. C., Prieto, A., Quesada, C. A., Rozas-Dávila, A., Rudas, A., Silva Jr., J. A., and Vásquez, R.: Above- and below-ground net primary productivity across ten Amazonian forests on contrasting soils, Biogeosciences, 6, 2759–2778, https://doi.org/10.5194/bg-6-2759-2009, 2009.
Araújo, A. C., Nobre, A. D., Kruijt, B., Elbers, J. A., Dallarosa, R., Stefani, P., Randow, C. von, Manzi, A. O., Culf, A. D., Gash, J. H. C., Valentini, R., and Kabat, P.: Comparative measurements of carbon dioxide fluxes from two nearby towers in a central Amazonian rainforest: The Manaus LBA site, J. Geophys. Res., 107, 8090, https://doi.org/10.1029/2001JD000676, 2002.
Argles, A. P. K., Moore, J. R., Huntingford, C., Wiltshire, A. J., Harper, A. B., Jones, C. D., and Cox, P. M.: Robust Ecosystem Demography (RED version 1.0): a parsimonious approach to modelling vegetation dynamics in Earth system models, Geosci. Model Dev., 13, 4067–4089, https://doi.org/10.5194/gmd-13-4067-2020, 2020.
Arora, V. K., Katavouta, A., Williams, R. G., Jones, C. D., Brovkin, V., Friedlingstein, P., Schwinger, J., Bopp, L., Boucher, O., Cadule, P., Chamberlain, M. A., Christian, J. R., Delire, C., Fisher, R. A., Hajima, T., Ilyina, T., Joetzjer, E., Kawamiya, M., Koven, C. D., Krasting, J. P., Law, R. M., Lawrence, D. M., Lenton, A., Lindsay, K., Pongratz, J., Raddatz, T., Séférian, R., Tachiiri, K., Tjiputra, J. F., Wiltshire, A., Wu, T., and Ziehn, T.: Carbon–concentration and carbon–climate feedbacks in CMIP6 models and their comparison to CMIP5 models, Biogeosciences, 17, 4173–4222, https://doi.org/10.5194/bg-17-4173-2020, 2020.
Baig, S., Medlyn, B. E., Mercado, L. M., and Zaehle, S.: Does the growth response of woody plants to elevated CO2 increase with temperature? A model-oriented meta-analysis, Glob. Change Biol., 21, 4303–4319, https://doi.org/10.1111/gcb.12962, 2015.
Baker, T. R., Phillips, O. L., Malhi, Y., Almeida, S., Arroyo, L., Di Fiore, A., Erwin, T., Killeen, T. J., Laurance, S. G., Laurance, W. F., Lewis, S. L., Lloyd, J., Monteagudo, A., Neill, D. A., Patino, S., Pitman, N. C. A., Silva, J. N. M., and Martínez, R. V.: Variation in wood density determines spatial patterns in Amazonian forest biomass, Glob. Change Biol., 10, 545–562, https://doi.org/10.1111/j.1365-2486.2004.00751.x, 2004.
Bentsen, M., Bethke, I., Debernard, J. B., Iversen, T., Kirkevåg, A., Seland, Ø., Drange, H., Roelandt, C., Seierstad, I. A., Hoose, C., and Kristjánsson, J. E.: The Norwegian Earth System Model, NorESM1-M – Part 1: Description and basic evaluation of the physical climate, Geosci. Model Dev., 6, 687–720, https://doi.org/10.5194/gmd-6-687-2013, 2013.
Best, M. J., Clark, D. B., Mercado, L. M., Sitch, S., Jones, C. D., Gedney, N., Pryor, M., Rooney, G. G., Essery, R. L. H., Blyth, E., Boucher, O., Harding, R. J., Huntingford, C., and Cox, P. M.: The Joint UK Land Environment Simulator (JULES), model description – Part 1: Carbon fluxes and vegetation dynamics, Geosci. Model Dev., 4, 701–722, https://doi.org/10.5194/gmd-4-701-2011, 2011.
Bradford, M. A. and Crowther, T. W.: Carbon use efficiency and storage in terrestrial ecosystems, New Phytol., 199, 7–9, https://doi.org/10.1111/nph.12334, 2013.
Brienen, R. J. W., Phillips, O. L., Feldpausch, T. R., Gloor, E., Baker, T. R., Lloyd, J., Lopez-Gonzalez, G., Monteagudo-Mendoza, A., Malhi, Y., Lewis, S. L., Vásquez Martinez, R., Alexiades, M., Álvarez Dávila, E., Alvarez-Loayza, P., Andrade, A., Aragaõ, L. E. O. C., Araujo-Murakami, A., Arets, E. J. M. M., Arroyo, L., Aymard C., G. A., Bánki, O. S., Baraloto, C., Barroso, J., Bonal, D., Boot, R. G. A., Camargo, J. L. C., Castilho, C. V., Chama, V., Chao, K. J., Chave, J., Comiskey, J. A., Cornejo Valverde, F., Da Costa, L., De Oliveira, E. A., Di Fiore, A., Erwin, T. L., Fauset, S., Forsthofer, M., Galbraith, D. R., Grahame, E. S., Groot, N., Hérault, B., Higuchi, N., Honorio Coronado, E. N., Keeling, H., Killeen, T. J., Laurance, W. F., Laurance, S., Licona, J., Magnussen, W. E., Marimon, B. S., Marimon-Junior, B. H., Mendoza, C., Neill, D. A., Nogueira, E. M., Núñez, P., Pallqui Camacho, N. C., Parada, A., Pardo-Molina, G., Peacock, J., Penã-Claros, M., Pickavance, G. C., Pitman, N. C. A., Poorter, L., Prieto, A., Quesada, C. A., Ramírez, F., Ramírez-Angulo, H., Restrepo, Z., Roopsind, A., Rudas, A., Salomaõ, R. P., Schwarz, M., Silva, N., Silva-Espejo, J. E., Silveira, M., Stropp, J., Talbot, J., Ter Steege, H., Teran-Aguilar, J., Terborgh, J., Thomas-Caesar, R., Toledo, M., Torello-Raventos, M., Umetsu, R. K., Van Der Heijden, G. M. F., Van Der Hout, P., Guimarães Vieira, I. C., Vieira, S. A., Vilanova, E., Vos, V. A., and Zagt, R. J.: Long-term decline of the Amazon carbon sink, Nature, 519, 344–348, https://doi.org/10.1038/nature14283, 2015.
Bruijnzeel, L. A.: Nutrient input—output budgets of tropical forest ecosystems: A review, J. Trop. Ecol., 7, 1–24, https://doi.org/10.1017/S0266467400005010, 1991.
Burke, E. J., Chadburn, S. E., and Ekici, A.: A vertical representation of soil carbon in the JULES land surface scheme (vn4.3_permafrost) with a focus on permafrost regions, Geosci. Model Dev., 10, 959–975, https://doi.org/10.5194/gmd-10-959-2017, 2017.
Castanho, A. D. A., Coe, M. T., Costa, M. H., Malhi, Y., Galbraith, D., and Quesada, C. A.: Improving simulated Amazon forest biomass and productivity by including spatial variation in biophysical parameters, Biogeosciences, 10, 2255–2272, https://doi.org/10.5194/bg-10-2255-2013, 2013.
Chapin, F. S., Chapin, M. C., Matson, P. A., and Vitousek, P.: Principles of Terrestrial Ecosystem Ecology, Springer New York, New York, NY, https://doi.org/10.1007/978-1-4419-9504-9, 2011.
Chave, J., Condit, R., Lao, S., Caspersen, J. P., Foster, R. B., and Hubbell, S. P.: Spatial and temporal variation of biomass in a tropical forest: Results from a large census plot in Panama, J. Ecol., 91, 240–252, https://doi.org/10.1046/j.1365-2745.2003.00757.x, 2003.
Chave, J., Réjou-Méchain, M., Búrquez, A., Chidumayo, E., Colgan, M. S., Delitti, W. B. C., Duque, A., Eid, T., Fearnside, P. M., Goodman, R. C., Henry, M., Martínez-Yrízar, A., Mugasha, W. A., Muller-Landau, H. C., Mencuccini, M., Nelson, B. W., Ngomanda, A., Nogueira, E. M., Ortiz-Malavassi, E., Pélissier, R., Ploton, P., Ryan, C. M., Saldarriaga, J. G., and Vieilledent, G.: Improved allometric models to estimate the aboveground biomass of tropical trees, Glob. Change Biol., 20, 3177–3190, https://doi.org/10.1111/gcb.12629, 2014.
Clark, D. B., Mercado, L. M., Sitch, S., Jones, C. D., Gedney, N., Best, M. J., Pryor, M., Rooney, G. G., Essery, R. L. H., Blyth, E., Boucher, O., Harding, R. J., Huntingford, C., and Cox, P. M.: The Joint UK Land Environment Simulator (JULES), model description – Part 2: Carbon fluxes and vegetation dynamics, Geosci. Model Dev., 4, 701–722, https://doi.org/10.5194/gmd-4-701-2011, 2011.
Collatz, G., Ribas-Carbo, M., and Berry, J.: Coupled Photosynthesis-Stomatal Conductance Model for Leaves of C4 Plants, Funct. Plant Biol., 19, 519, https://doi.org/10.1071/pp9920519, 1992.
Collatz, G. J., Ball, J. T., Grivet, C., and Berry, J. A.: Physiological and environmental regulation of stomatal conductance, photosynthesis and transpiration: a model that includes a laminar boundary layer, Agr. Forest Meteorol., 54, 107–136, https://doi.org/10.1016/0168-1923(91)90002-8, 1991.
Comins, H. N. and McMurtrie, R. E.: Long-Term Response of Nutrient-Limited Forests to CO2 Enrichment; Equilibrium Behavior of Plant-Soil Models, Ecol. Appl., 3, 666–681, https://doi.org/10.2307/1942099, 1993.
Costa, M. G., Gama-rodrigues, A. C., Leonardo, J., Gonçalves, D. M., and Gama-rodrigues, E. F.: Labile and Non-Labile Fractions of Phosphorus and Its Transformations in Soil under Eucalyptus Plantations, Brazil, Forests, 7, 15, https://doi.org/10.3390/f7010015, 2016.
Davidson, E. A., Reis De Carvalho, C. J., Vieira, I. C. G., Figueiredo, R. D. O., Moutinho, P., Ishida, F. Y., Dos Santos, M. T. P., Guerrero, J. B., Kalif, K., and Sabá, R. T.: Nitrogen and phosphorus limitation of biomass growth in a tropical secondary forest, Ecol. Appl., 14, 150–163, https://doi.org/10.1890/01-6006, 2004.
DeLuca, T. H., Keeney, D. R., and McCarty, G. W.: Effect of freeze-thaw-events on mineralization of soil nitrogen, Biol. Fertil. Soils, 14, 116–120, https://doi.org/10.1007/BF00336260, 1992.
De Lucia, E. H., Drake, J. E., Thomas, R. B., and Gonzalez-Meler, M.: Forest carbon use efficiency: Is respiration a constant fraction of gross primary production?, Glob. Change Biol., 13, 1157–1167, https://doi.org/10.1111/j.1365-2486.2007.01365.x, 2007.
De Vries, W. and Butterbach-Bahl, K.: Short and long-term impacts of nitrogen deposition on carbon sequestration by forest ecosystems, Curr. Opin. Environ. Sustain., 9–10, 90–104, https://doi.org/10.1016/j.cosust.2014.09.001, 2014.
Dieter, D., Elsenbeer, H., and Turner, B. L.: Phosphorus fractionation in lowland tropical rainforest soils in central Panama, Catena, 82, 118–125, https://doi.org/10.1016/j.catena.2010.05.010, 2010.
Ellsworth, D. S., Anderson, I. C., Crous, K. Y., Cooke, J., Drake, J. E., Gherlenda, A. N., Gimeno, T. E., Macdonald, C. A., Medlyn, B. E., Powell, J. R., Tjoelker, M. G., and Reich, P. B.: Elevated CO2 does not increase eucalypt forest productivity on a low-phosphorus soil, Nat. Clim. Change, 7, 279–282, https://doi.org/10.1038/nclimate3235, 2017.
Elser, J. J., Bracken, M. E. S., Cleland, E. E., Gruner, D. S., Harpole, W. S., Hillebrand, H., Ngai, J. T., Seabloom, E. W., Shurin, J. B., and Smith, J. E.: Global analysis of nitrogen and phosphorus limitation of primary producers in freshwater, marine and terrestrial ecosystems, Ecol. Lett., 10, 1135–1142, https://doi.org/10.1111/j.1461-0248.2007.01113.x, 2007.
Fernández-Martínez, M., Sardans, J., Chevallier, F., Ciais, P., Obersteiner, M., Vicca, S., Canadell, J. G., Bastos, A., Friedlingstein, P., Sitch, S., Piao, S. L., Janssens, I. A., and Peñuelas, J.: Global trends in carbon sinks and their relationships with CO2 and temperature, Nat. Clim. Change, 9, 73–79, https://doi.org/10.1038/s41558-018-0367-7, 2019.
Fleischer, K., Rammig, A., Kauwe, M. G. De, Walker, A. P., Domingues, T. F., Fuchslueger, L., Garcia, S., Goll, D. S., Grandis, A., Jiang, M., Haverd, V., Hofhansl, F., Holm, J. A., Kruijt, B., Leung, F., Medlyn, B. E., Mercado, L. M., Norby, R. J., Pak, B., Randow, C. Von, Quesada, C. A., and Schaap, K. J.: Amazon forest response to CO2 fertilization dependent on plant phosphorus acquisition, Nat. Geosci., 12, 736–741, https://doi.org/10.1038/s41561-019-0404-9, 2019.
Friedlingstein, P., Cox, P., Betts, R., Bopp, L., von Bloh, W., Brovkin, V., Cadule, P., Doney, S., Eby, M., Fung, I., Bala, G., John, J., Jones, C., Joos, F., Kato, T., Kawamiya, M., Knorr, W., Lindsay, K., Matthews, H. D., Raddatz, T., Rayner, P., Reick, C., Roeckner, E., Schnitzler, K. G., Schnur, R., Strassmann, K., Weaver, A. J., Yoshikawa, C., and Zeng, N.: Climate-carbon cycle feedback analysis: Results from the C4MIP model intercomparison, J. Climate, 19, 3337–3353, https://doi.org/10.1175/JCLI3800.1, 2006.
Friedlingstein, P., O’Sullivan, M., Jones, M. W., Andrew, R. M., Hauck, J., Olsen, A., Peters, G. P., Peters, W., Pongratz, J., Sitch, S., Le Quéré, C., Canadell, J. G., Ciais, P., Jackson, R. B., Alin, S., Aragão, L. E. O. C., Arneth, A., Arora, V., Bates, N. R., Becker, M., Benoit-Cattin, A., Bittig, H. C., Bopp, L., Bultan, S., Chandra, N., Chevallier, F., Chini, L. P., Evans, W., Florentie, L., Forster, P. M., Gasser, T., Gehlen, M., Gilfillan, D., Gkritzalis, T., Gregor, L., Gruber, N., Harris, I., Hartung, K., Haverd, V., Houghton, R. A., Ilyina, T., Jain, A. K., Joetzjer, E., Kadono, K., Kato, E., Kitidis, V., Korsbakken, J. I., Landschützer, P., Lefèvre, N., Lenton, A., Lienert, S., Liu, Z., Lombardozzi, D., Marland, G., Metzl, N., Munro, D. R., Nabel, J. E. M. S., Nakaoka, S.-I., Niwa, Y., O’Brien, K., Ono, T., Palmer, P. I., Pierrot, D., Poulter, B., Resplandy, L., Robertson, E., Rödenbeck, C., Schwinger, J., Séférian, R., Skjelvan, I., Smith, A. J. P., Sutton, A. J., Tanhua, T., Tans, P. P., Tian, H., Tilbrook, B., van der Werf, G., Vuichard, N., Walker, A. P., Wanninkhof, R., Watson, A. J., Willis, D., Wiltshire, A. J., Yuan, W., Yue, X., and Zaehle, S.: Global Carbon Budget 2020, Earth Syst. Sci. Data, 12, 3269–3340, https://doi.org/10.5194/essd-12-3269-2020, 2020.
Fyllas, N. M., Patiño, S., Baker, T. R., Bielefeld Nardoto, G., Martinelli, L. A., Quesada, C. A., Paiva, R., Schwarz, M., Horna, V., Mercado, L. M., Santos, A., Arroyo, L., Jiménez, E. M., Luizão, F. J., Neill, D. A., Silva, N., Prieto, A., Rudas, A., Silviera, M., Vieira, I. C. G., Lopez-Gonzalez, G., Malhi, Y., Phillips, O. L., and Lloyd, J.: Basin-wide variations in foliar properties of Amazonian forest: phylogeny, soils and climate, Biogeosciences, 6, 2677–2708, https://doi.org/10.5194/bg-6-2677-2009, 2009.
Gentile, R., Dodd, M., Lieffering, M., Brock, S. C., Theobald, P. W., and Newton, P. C. D.: Effects of long-term exposure to enriched CO2 on the nutrient-supplying capacity of a grassland soil, Biol. Fert. Soils, 48, 357–362, https://doi.org/10.1007/s00374-011-0616-7, 2012.
Goll, D. S., Vuichard, N., Maignan, F., Jornet-Puig, A., Sardans, J., Violette, A., Peng, S., Sun, Y., Kvakic, M., Guimberteau, M., Guenet, B., Zaehle, S., Penuelas, J., Janssens, I., and Ciais, P.: A representation of the phosphorus cycle for ORCHIDEE (revision 4520), Geosci. Model Dev., 10, 3745–3770, https://doi.org/10.5194/gmd-10-3745-2017, 2017.
Goodale, C. L., Apps, M. J., Birdsey, R. A., Field, C. B., Heath, L. S., Houghton, R. A., Jenkins, J. C., Kohlmaier, G. H., Kurz, W., Liu, S., Nabuurs, G. J., Nilsson, S., and Shvidenko, A. Z.: Forest carbon sinks in the Northern Hemisphere, Ecol. Appl., 12, 891–899, 2002.
Gross, A., Tiwari, S., Shtein, I., and Erel, R.: Direct foliar uptake of phosphorus from desert dust, New Phytol., 230, 2213–2225, https://doi.org/10.1111/nph.17344, 2021.
Harper, A. B., Cox, P. M., Friedlingstein, P., Wiltshire, A. J., Jones, C. D., Sitch, S., Mercado, L. M., Groenendijk, M., Robertson, E., Kattge, J., Bönisch, G., Atkin, O. K., Bahn, M., Cornelissen, J., Niinemets, Ü., Onipchenko, V., Peñuelas, J., Poorter, L., Reich, P. B., Soudzilovskaia, N. A., and Bodegom, P. V.: Improved representation of plant functional types and physiology in the Joint UK Land Environment Simulator (JULES v4.2) using plant trait information, Geosci. Model Dev., 9, 2415–2440, https://doi.org/10.5194/gmd-9-2415-2016, 2016.
Harris, I., Jones, P. D., Osborn, T. J., and Lister, D. H.: Updated high-resolution grids of monthly climatic observations – the CRU TS3.10 Dataset, Int. J. Climatol., 34, 623–642, https://doi.org/10.1002/joc.3711, 2014.
Hartmann, J. and Moosdorf, N.: The new global lithological map database GLiM: A representation of rock properties at the Earth surface, Geochem. Geophy. Geosy., 13, Q12004, https://doi.org/10.1029/2012GC004370, 2012.
Hartmann, J., Moosdorf, N., Lauerwald, R., Hinderer, M., and West, A. J.: Global chemical weathering and associated P-release – The role of lithology, temperature and soil properties, Chem. Geol., 363, 145–163, https://doi.org/10.1016/j.chemgeo.2013.10.025, 2014.
Hatfield, J. L. and Dold, C.: Water-use efficiency: Advances and challenges in a changing climate, Front. Plant Sci., 10, 1–14, https://doi.org/10.3389/fpls.2019.00103, 2019.
Haverd, V., Smith, B., Nieradzik, L., Briggs, P. R., Woodgate, W., Trudinger, C. M., Canadell, J. G., and Cuntz, M.: A new version of the CABLE land surface model (Subversion revision r4601) incorporating land use and land cover change, woody vegetation demography, and a novel optimisation-based approach to plant coordination of photosynthesis, Geosci. Model Dev., 11, 2995–3026, https://doi.org/10.5194/gmd-11-2995-2018, 2018.
He, M. and Dijkstra, F. A.: Drought effect on plant nitrogen and phosphorus: A meta-analysis, New Phytol., 204, 924–931, https://doi.org/10.1111/nph.12952, 2014.
Hedley, M. J., Stewart, J. W. B., and Chauhan, B. S.: Changes in Inorganic and Organic Soil Phosphorus Fractions Induced by Cultivation Practices and by Laboratory Incubations, Soil Sci. Soc. Am. J., 46, 970–976, https://doi.org/10.2136/sssaj1982.03615995004600050017x, 1982.
Herbert, D. A., Williams, M., and Rastetter, E. B.: A model analysis of N and P limitation on carbon accumulation in Amazonian secondary forest after alternate land-use abandonment, Biogeochemistry, 65, 121–150, https://doi.org/10.1023/A:1026020210887, 2003.
Hou, E., Lu, X., Jiang, L., Wen, D., and Luo, Y.: Quantifying Soil Phosphorus Dynamics: A Data Assimilation Approach, J. Geophys. Res.-Biogeosci., 124, 2159–2173, https://doi.org/10.1029/2018JG004903, 2019.
Hou, E., Luo, Y., Kuang, Y., Chen, C., Lu, X., Jiang, L., Luo, X., and Wen, D.: Global meta-analysis shows pervasive phosphorus limitation of aboveground plant production in natural terrestrial ecosystems, Nat. Commun., 11, 1–9, https://doi.org/10.1038/s41467-020-14492-w, 2020.
Hubau, W., Lewis, S. L., Phillips, O. L., Affum-Baffoe, K., Beeckman, H., Cuní-Sanchez, A., Daniels, A. K., Ewango, C. E. N., Fauset, S., Mukinzi, J. M., Sheil, D., Sonké, B., Sullivan, M. J. P., Sunderland, T. C. H., Taedoumg, H., Thomas, S. C., White, L. J. T., Abernethy, K. A., Adu-Bredu, S., Amani, C. A., Baker, T. R., Banin, L. F., Baya, F., Begne, S. K., Bennett, A. C., Benedet, F., Bitariho, R., Bocko, Y. E., Boeckx, P., Boundja, P., Brienen, R. J. W., Brncic, T., Chezeaux, E., Chuyong, G. B., Clark, C. J., Collins, M., Comiskey, J. A., Coomes, D. A., Dargie, G. C., de Haulleville, T., Kamdem, M. N. D., Doucet, J.-L., Esquivel-Muelbert, A., Feldpausch, T. R., Fofanah, A., Foli, E. G., Gilpin, M., Gloor, E., Gonmadje, C., Gourlet-Fleury, S., Hall, J. S., Hamilton, A. C., Harris, D. J., Hart, T. B., Hockemba, M. B. N., Hladik, A., Ifo, S. A., Jeffery, K. J., Jucker, T., Yakusu, E. K., Kearsley, E., Kenfack, D., Koch, A., Leal, M. E., Levesley, A., Lindsell, J. A., Lisingo, J., Lopez-Gonzalez, G., Lovett, J. C., Makana, J.-R., Malhi, Y., Marshall, A. R., Martin, J., Martin, E. H., Mbayu, F. M., Medjibe, V. P., Mihindou, V., Mitchard, E. T. A., Moore, S., Munishi, P. K. T., Bengone, N. N., Ojo, L., Ondo, F. E., Peh, K. S.-H., Pickavance, G. C., Poulsen, A. D., Poulsen, J. R., Qie, L., Reitsma, J., Rovero, F., Swaine, M. D., Talbot, J., Taplin, J., Taylor, D. M., Thomas, D. W., Toirambe, B., Mukendi, J. T., Tuagben, D., Umunay, P. M., can der Heijden, G. M. F., Verbeeck, H., Vleminckx, J., Willcock, S., Wöll, H., Woods, J. T., and Zemagho, L.: Asynchronous carbon sink saturation in African and Amazonian tropical forests, Nature, 579, 80–87, https://doi.org/10.1038/s41586-020-2035-0, 2020.
Hungate, B., Dukes, J. S., Shaw, M. R., Luo, Y., and Field, C. B.: Nitrogen and Climate Change, Science, 302, 1512–1513, 2003.
Jenkinson, D. S. and Coleman, K.: The turnover of organic carbon in subsoils. Part 2. Modelling carbon turnover, Eur. J. Soil Sci., 59, 400–413, https://doi.org/10.1111/j.1365-2389.2008.01026.x, 2008.
Jenkinson, D. S., Andrew, S. P. S., Lynch, J. M., and Tinker, M. J. G. and P. B.: The turnover of organic carbon and nitrogen in soil, Philos. T. R. Soc. B, 329, 361–368, https://doi.org/10.1098/rstb.1990.0177, 1990.
Ji, D., Wang, L., Feng, J., Wu, Q., Cheng, H., Zhang, Q., Yang, J., Dong, W., Dai, Y., Gong, D., Zhang, R.-H., Wang, X., Liu, J., Moore, J. C., Chen, D., and Zhou, M.: Description and basic evaluation of Beijing Normal University Earth System Model (BNU-ESM) version 1, Geosci. Model Dev., 7, 2039–2064, https://doi.org/10.5194/gmd-7-2039-2014, 2014.
Jiang, M., Caldararu, S., Zaehle, S., Ellsworth, D. S., and Medlyn, B. E.: Towards a more physiological representation of vegetation phosphorus processes in land surface models, New Phytol., 222, 1223–1229, https://doi.org/10.1111/nph.15688, 2019.
Jiang, M., Medlyn, B. E., Drake, J. E., Duursma, R. A., Anderson, I. C., Barton, C. V. M., Boer, M. M., Carrillo, Y., Castañeda-Gómez, L., Collins, L., Crous, K. Y., De Kauwe, M. G., dos Santos, B. M., Emmerson, K. M., Facey, S. L., Gherlenda, A. N., Gimeno, T. E., Hasegawa, S., Johnson, S. N., Kännaste, A., Macdonald, C. A., Mahmud, K., Moore, B. D., Nazaries, L., Neilson, E. H. J., Nielsen, U. N., Niinemets, Ü., Noh, N. J., Ochoa-Hueso, R., Pathare, V. S., Pendall, E., Pihlblad, J., Piñeiro, J., Powell, J. R., Power, S. A., Reich, P. B., Renchon, A. A., Riegler, M., Rinnan, R., Rymer, P. D., Salomón, R. L., Singh, B. K., Smith, B., Tjoelker, M. G., Walker, J. K. M., Wujeska-Klause, A., Yang, J., Zaehle, S., and Ellsworth, D. S.: The fate of carbon in a mature forest under carbon dioxide enrichment, Nature, 580, 227–231, https://doi.org/10.1038/s41586-020-2128-9, 2020.
Jiménez, E. M., Moreno, F. H., Peñuela, M. C., Patiño, S., and Lloyd, J.: Fine root dynamics for forests on contrasting soils in the Colombian Amazon, Biogeosciences, 6, 2809–2827, https://doi.org/10.5194/bg-6-2809-2009, 2009.
Johnson, M. O., Galbraith, D., Gloor, M., De Deurwaerder, H., Guimberteau, M., Rammig, A., Thonicke, K., Verbeeck, H., von Randow, C., Monteagudo, A., Phillips, O. L., Brienen, R. J. W., Feldpausch, T. R., Lopez Gonzalez, G., Fauset, S., Quesada, C. A., Christoffersen, B., Ciais, P., Sampaio, G., Kruijt, B., Meir, P., Moorcroft, P., Zhang, K., Alvarez-Davila, E., Alves de Oliveira, A., Amaral, I., Andrade, A., Aragao, L. E. O. C., Araujo-Murakami, A., Arets, E. J. M. M., Arroyo, L., Aymard, G. A., Baraloto, C., Barroso, J., Bonal, D., Boot, R., Camargo, J., Chave, J., Cogollo, A., Cornejo Valverde, F., Lola da Costa, A. C., Di Fiore, A., Ferreira, L., Higuchi, N., Honorio, E. N., Killeen, T. J., Laurance, S. G., Laurance, W. F., Licona, J., Lovejoy, T., Malhi, Y., Marimon, B., Marimon, B. H., Matos, D. C. L., Mendoza, C., Neill, D. A., Pardo, G., Peña-Claros, M., Pitman, N. C. A., Poorter, L., Prieto, A., Ramirez-Angulo, H., Roopsind, A., Rudas, A., Salomao, R. P., Silveira, M., Stropp, J., ter Steege, H., Terborgh, J., Thomas, R., Toledo, M., Torres-Lezama, A., van der Heijden, G. M. F., Vasquez, R., Guimarães Vieira, I. C., Vilanova, E., Vos, V. A., and Baker, T. R.: Variation in stem mortality rates determines patterns of above-ground biomass in Amazonian forests: implications for dynamic global vegetation models, Glob. Change Biol., 22, 3996–4013, https://doi.org/10.1111/gcb.13315, 2016.
Jones, S., Rowland, L., Cox, P., Hemming, D., Wiltshire, A., Williams, K., Parazoo, N. C., Liu, J., da Costa, A. C. L., Meir, P., Mencuccini, M., and Harper, A. B.: The impact of a simple representation of non-structural carbohydrates on the simulated response of tropical forests to drought, Biogeosciences, 17, 3589–3612, https://doi.org/10.5194/bg-17-3589-2020, 2020.
Kattge, J., Knorr, W., Raddatz, T., and Wirth, C.: Quantifying photosynthetic capacity and its relationship to leaf nitrogen content for global-scale terrestrial biosphere models, Glob. Change Biol., 15, 976–991, https://doi.org/10.1111/j.1365-2486.2008.01744.x, 2009.
Keller, M., Alencar, A., Asner, G. P., Braswell, B., Bustamante, M., Davidson, E., Feldpausch, T., Fernandes, E., Goulden, M., Kabat, P., Kruijt, B., Luizão, F., Miller, S., Markewitz, D., Nobre, A. D., Nobre, C. A., Priante Filho, N., Da Rocha, H., Dias, P. S., Von Randow, C., and Vourlitis, G. L.: Ecological research in the Large-scale Biosphere-Atmosphere Experiment in Amazonia: Early results, Ecol. Appl., 14, 3–16, https://doi.org/10.1890/03-6003, 2004.
Klein, T., Bader, M. K. F., Leuzinger, S., Mildner, M., Schleppi, P., Siegwolf, R. T. W., and Körner, C.: Growth and carbon relations of mature Picea abies trees under 5 years of free-air CO2 enrichment, J. Ecol., 104, 1720–1733, https://doi.org/10.1111/1365-2745.12621, 2016.
Koch, A., Hubau, W., and Lewis, S. L.: Earth System Models Are Not Capturing Present-Day Tropical Forest Carbon Dynamics, Earth's Future, 9, 1–19, https://doi.org/10.1029/2020EF001874, 2021.
Körner, C., Asshoff, R., Bignucolo, O., Hättenschwiler, S., Keel, S. G., Peláez-Riedl, S., Pepin, S., Siegwolf, R. T. W., and Zotz, G.: Ecology: Carbon flux and growth in mature deciduous forest trees exposed to elevated CO2, Science, 309, 1360–1362, https://doi.org/10.1126/science.1113977, 2005.
Lapola, D. M. and Norby, R.: A: Amazon-FACE: Assessing the effects of increased atmospheric CO2 on the ecology and resilience of the Amazon forest – Science Plan and Implementation Strategy, https://amazonface.inpa.gov.br/pdf/AmazonFACE_Science_Plan_&_Implementation_Strategy.pdf (last access: 28 June 2022), 2014.
LeBauer, D. and Treseder, K.: Nitrogen Limitation of Net Primary Productivity, Ecology, 89, 371–379, 2008.
Lloyd, J., Bird, M. I., Veenendaal, E. M., and Kruijt, B.: Should Phosphorus Availability Be Constraining Moist Tropical Forest Responses to Increasing CO2 Concentrations?, in: Global Biogeochemical Cycles in the Climate System, Elsevier, 95–114, https://doi.org/10.1016/B978-012631260-7/50010-8, 2001.
Long, M. C., Lindsay, K., Peacock, S., Moore, J. K., and Doney, S. C.: Twentieth-century oceanic carbon uptake and storage in CESM1(BGC), J. Climate, 26, 6775–6800, https://doi.org/10.1175/JCLI-D-12-00184.1, 2013.
Lugli, L. F.: Estoque de nutrientes na serrapilheira fina e grossa em função de fatores edáficos em florestas do Amazonas, Brasil, Instituto Nacional de Pesquisas da Amazônia – INPA, https://repositorio.inpa.gov.br/handle/1/5028, 2013.
Lugli, L. F., Andersen, K. M., Aragão, L. E. O. C., Cordeiro, A. L., Cunha, H. F. V., Fuchslueger, L., Meir, P., Mercado, L. M., Oblitas, E., Quesada, C. A., Rosa, J. S., Schaap, K. J., Valverde-Barrantes, O., and Hartley, I. P.: Multiple phosphorus acquisition strategies adopted by fine roots in low-fertility soils in Central Amazonia, Plant Soil, 450, 49–63, https://doi.org/10.1007/s11104-019-03963-9, 2020.
Lugli, L. F., Rosa, J. S., Andersen, K. M., Di Ponzio, R., Almeida, R. V., Pires, M., Cordeiro, A. L., Cunha, H. F. V., Martins, N. P., Assis, R. L., Moraes, A. C. M., Souza, S. T., Aragão, L. E. O. C., Camargo, J. L., Fuchslueger, L., Schaap, K. J., Valverde-Barrantes, O. J., Meir, P., Quesada, C. A., Mercado, L. M., and Hartley, I. P.: Rapid responses of root traits and productivity to phosphorus and cation additions in a tropical lowland forest in Amazonia, New Phytol., 230, 116–128, https://doi.org/10.1111/nph.17154, 2021.
Luo, Y., Su, B., Currie, W. S., Dukes, J. S., Finzi, A., Hartwig, U., Hungate, B., McMurtrie, R. E., Oren, R., Parton, W. J., Pataki, D. E., Shaw, M. R., Zak, D. R., and Field, C. B.: Progressive nitrogen limitation of ecosystem responses to rising atmospheric carbon dioxide, Bioscience, 54, 731–739, https://doi.org/10.1641/0006-3568(2004)054[0731:PNLOER]2.0.CO;2, 2004.
Malhi, Y.: The productivity, metabolism and carbon cycle of tropical forest vegetation, J. Ecol., 100, 65–75, https://doi.org/10.1111/j.1365-2745.2011.01916.x, 2012.
Malhi, Y., Baker, T. R., Phillips, O. L., Almeida, S., Alvarez, E., Arroyo, L., Chave, J., Czimczik, C. I., Di Fiore, A., Higuchi, N., Killeen, T. J., Laurance, S. G., Laurance, W. F., Lewis, S. L., Montoya, L. M. M., Monteagudo, A., Neill, D. A., Vargas, P. N., Patino, S., Pitman, N. C. A., Quesada, C. A., Salomao, R., Silva, J. N. M., Lezama, A. T., Martínez, R. V., Terborgh, J., Vinceti, B., and Lloyd, J.: The above-ground coarse wood productivity of 104 Neotropical forest plots, Glob. Change Biol., 10, 563–591, https://doi.org/10.1111/j.1529-8817.2003.00778.x, 2004.
Malhi, Y., Wood, D., Baker, T. R., Wright, J., Phillips, O. L., Cochrane, T., Meir, P., Chave, J., Almeida, S., Arroyo, L., Higuchi, N., Killeen, T. J., Laurance, S. G., Laurance, W. F., Lewis, S. L., Monteagudo, A., Neill, D. A., Vargas, P. N., Pitman, N. C. A., Quesada, C. A., Salomão, R., Silva, J. N. M., Lezama, A. T., Terborgh, J., Martínez, R. V., and Vinceti, B.: The regional variation of aboveground live biomass in old-growth Amazonian forests, Glob. Change Biol., 12, 1107–1138, https://doi.org/10.1111/j.1365-2486.2006.01120.x, 2006.
Malhi, Y., Aragão, L. E. O. C., Metcalfe, D. B., Paiva, R., Quesada, C. A., Almeida, S., Anderson, L., Brando, P., Chambers, J. Q., da Costa, A. C. L., Hutyra, L. R., Oliveira, P., Patiño, S., Pyle, E. H., Robertson, A. L., and Teixeira, L. M.: Comprehensive assessment of carbon productivity, allocation and storage in three Amazonian forests, Glob. Change Biol., 15, 1255–1274, https://doi.org/10.1111/j.1365-2486.2008.01780.x, 2009.
Malhi, Y., Doughty, C., and Galbraith, D.: The allocation of ecosystem net primary productivity in tropical forests, Philos. T. R. Soc. B, 366, 3225–3245, https://doi.org/10.1098/rstb.2011.0062, 2011.
Martins, N. P., Fuchslueger, L., Fleischer, K., Andersen, K. M., Assis, R. L., Baccaro, F. B., Camargo, P. B., Cordeiro, A. L., Grandis, A., Hartley, I. P., Hofhansl, F., Lugli, L. F., Lapola, D. M., Menezes, J. G., Norby, R. J., Rammig, A., Rosa, J. S., Schaap, K. J., Takeshi, B., Valverde-Barrantes, O. J., and Quesada, C. A.: Fine roots stimulate nutrient release during early stages of leaf litter decomposition in a Central Amazon rainforest, Plant Soil, 469, 287–303, https://doi.org/10.1007/s11104-021-05148-9, 2021.
Medlyn, B. E., Zaehle, S., De Kauwe, M. G., Walker, A. P., Dietze, M. C., Hanson, P. J., Hickler, T., Jain, A. K., Luo, Y., Parton, W., Prentice, I. C., Thornton, P. E., Wang, S., Wang, Y. P., Weng, E., Iversen, C. M., Mccarthy, H. R., Warren, J. M., Oren, R., and Norby, R. J.: Using ecosystem experiments to improve vegetation models, Nat. Clim. Change, 5, 528–534, https://doi.org/10.1038/nclimate2621, 2015.
Medlyn, B. E., De Kauwe, M. G., Zaehle, S., Walker, A. P., Duursma, R. A., Luus, K., Mishurov, M., Pak, B., Smith, B., Wang, Y. P., Yang, X., Crous, K. Y., Drake, J. E., Gimeno, T. E., Macdonald, C. A., Norby, R. J., Power, S. A., Tjoelker, M. G., and Ellsworth, D. S.: Using models to guide field experiments: a priori predictions for the CO2 response of a nutrient- and water-limited native Eucalypt woodland, Glob. Change Biol., 22, 2834–2851, https://doi.org/10.1111/gcb.13268, 2016.
Mercado, L. M., Lloyd, J., Dolman, A. J., Sitch, S., and Patiño, S.: Modelling basin-wide variations in Amazon forest productivity – Part 1: Model calibration, evaluation and upscaling functions for canopy photosynthesis, Biogeosciences, 6, 1247–1272, https://doi.org/10.5194/bg-6-1247-2009, 2009.
Mercado, L. M., Patiño, S., Domingues, T. F., Fyllas, N. M., Weedon, G. P., Sitch, S., Quesada, C. A., Phillips, O. L., Aragão, L. E. O. C., Malhi, Y., Dolman, A. J., Restrepo-Coupe, N., Saleska, S. R., Baker, T. R., Almeida, S., Higuchi, N., and Lloyd, J.: Variations in Amazon forest productivity correlated with foliar nutrients and modelled rates of photosynthetic carbon supply, Philos. T. R. Soc. B, 366, 3316–3329, https://doi.org/10.1098/rstb.2011.0045, 2011.
Mirabello, M. J., Yavitt, J. B., Garcia, M., Harms, K. E., Turner, B. L., and Wright, S. J.: Soil phosphorus responses to chronic nutrient fertilisation and seasonal drought in a humid lowland forest, Panama, Soil Res., 51, 215–221, https://doi.org/10.1071/SR12188, 2013.
Mitchard, E. T. A.: The tropical forest carbon cycle and climate change, Nature, 559, 527–534, https://doi.org/10.1038/s41586-018-0300-2, 2018.
Nachtergaele, F., Velthuizen, H. van, Verelst, L., Batjes, N. H., Dijkshoorn, K., Engelen, V. W. P. van, Fischer, G., Jones, A., and Montanarela, L.: The Harmonized World Soil Database, in: Proceedings of the 19th World Congress of Soil Science, Soil Solutions for a Changing World, edited by: Gilkes, R. J. and Prakongkep N., Brisbane, Australia, 1–6 August 2010, 34–37, https://research.wur.nl/en/publications/harmonized-world-soil-database-version-12 (last access: 28 June 2022), 2010.
Nakhavali, A.: JULES_PM, https://code.metoffice.gov.uk/svn/jules/main/branches/dev/mahdinakhavali/vn5.5_JULESPM_NAKHAVALI/ last access: 28 June 2022.
Nakhavali, M. A.: Representation of P cycle in Joint UK Land Environment Simulator – model compile guide, Zenodo [code], https://doi.org/10.5281/zenodo.5711160, 2021a.
Nakhavali, M. A.: Representation of P cycle in Joint UK Land Environment Simulator – aCO2 model configuration, Zenodo [code], https://doi.org/10.5281/zenodo.5711144, 2021b.
Nakhavali, M. A.: Representation of P cycle in Joint UK Land Environment Simulator – eCO2 model configuration, Zenodo [code], https://doi.org/10.5281/zenodo.5711150, 2021c.
Nakhavali, M. A.: Representation of P cycle in Joint UK Land Environment Simulator – Outputs, Zenodo [data set], https://doi.org/10.5281/zenodo.5710898, 2021d.
Nakhavali, M. A., Mercado, L., Hartley, I. P., Sitch, S., Cunha, F. V., di Ponzio, R., Lugli, L. F., Quesada, C. A., Andersen, K. M., Chadburn, S. E., Wiltshire, A. J., Clark, D. B., and Araujo, A.: Representation of P cycle in Joint UK Land Environment Simulator, Zenodo [data set], https://doi.org/10.5281/zenodo.5710896, 2021.
Neff, J. C., Hobbie, S. E., and Vitousek, P. M.: Nutrient and mineralogical control on dissolved organic C, N and P fluxes and stoichiometry in Hawaiian soils, Biogeochemistry, 51, 283–302, https://doi.org/10.1023/A:1006414517212, 2000.
Norby, R. J., De Kauwe, M. G., Domingues, T. F., Duursma, R. A., Ellsworth, D. S., Goll, D. S., Lapola, D. M., Luus, K. A., MacKenzie, A. R., Medlyn, B. E., Pavlick, R., Rammig, A., Smith, B., Thomas, R., Thonicke, K., Walker, A. P., Yang, X., and Zaehle, S.: Model–data synthesis for the next generation of forest free-air CO2 enrichment (FACE) experiments, New Phytol., 209, 17–28, https://doi.org/10.1111/nph.13593, 2016.
Nordin, A., Högberg, P., and Näsholm, T.: Soil nitrogen form and plant nitrogen uptake along a boreal forest productivity gradient, Oecologia, 129, 125–132, https://doi.org/10.1007/s004420100698, 2001.
Pan, Y., Birdsey, R. A., Fang, J., Houghton, R., Kauppi, P. E., Kurz, W. A., Phillips, O. L., Shvidenko, A., Lewis, S. L., Canadell, J. G., Ciais, P., Jackson, R. B., Pacala, S. W., McGuire, A. D., Piao, S., Rautiainen, A., Sitch, S., and Hayes, D.: A Large and Persistent Carbon Sink in the World's Forests, Science, 333, 988–993, https://doi.org/10.1126/science.1201609, 2011.
Perakis, S. S. and Hedin, L. O.: Nitrogen loss from unpolluted South American forests mainly via dissolved organic compounds, Nature, 415, 416–419, https://doi.org/10.1038/415416a, 2002.
Phillips, O. L., Baker, T. R., Arroyo, L., Higuchi, N., Killeen, T. J., Laurance, W. F., Lewis, S. L., Lloyd, J., Malhi, Y., Monteagudo, A., Neill, D. A., Nüñez Vargas, P., Silva, J. N. M., Terborgh, J., Vásquez Martínez, R., Alexiades, M., Almeida, S., Brown, S., Chave, J., Comiskey, J. A., Czimczik, C. I., Di Fiore, A., Erwin, T., Kuebler, C., Laurance, S. G., Nascimento, H. E. M., Olivier, J., Palacios, W., Patiño, S., Pitman, N. C. A., Quesada, C. A., Saldias, M., Torres Lezama, A., and Vinceti, B.: Pattern and process in Amazon tree turnover, 1976–2001, Philos. T. R. Soc. B, 359, 381–407, https://doi.org/10.1098/rstb.2003.1438, 2004.
Phillips, O. L., Brienen, R. J. W., Gloor, E., Baker, T. R., Lloyd, J., Lopez-Gonzalez, G., Monteagudo-Mendoza, A., Malhi, Y., Lewis, S. L., Vásquez Martinez, R., Alexiades, M., Álvarez Dávila, E., Alvarez-Loayza, P., Andrade, A., Aragão, L. E. O. C., Araujo-Murakami, A., Arets, E. J. M. M., Arroyo, L., Aymard, G. A., Bánki, O. S., Baraloto, C., Barroso, J., Bonal, D., Boot, R. G. A., Camargo, J. L. C., Castilho, C. V., Chama, V., Chao, K. J., Chave, J., Comiskey, J. A., Valverde, F. C., da Costa, L., de Oliveira, E. A., Di Fiore, A., Erwin, T. L., Fauset, S., Forsthofer, M., Galbraith, D. R., Grahame, E. S., Groot, N., Hérault, B., Higuchi, N., Honorio Coronado, E. N., Keeling, H., Killeen, T. J., Laurance, W. F., Laurance, S., Licona, J., Magnusson, W. E., Marimon, B. S., Marimon-Junior, B. H., Mendoza, C., Neill, D. A., Nogueira, E. M., Núñez, P., Pallqui Camacho, N. C., Parada, A., Pardo-Molina, G., Peacock, J., Peña-Claros, M., Pickavance, G. C., Pitman, N. C. A., Poorter, L., Prieto, A., Quesada, C. A., Ramírez, F., Ramírez-Angulo, H., Restrepo, Z., Roopsind, A., Rudas, A., Salomão, R. P., Schwarz, M., Silva, N., Silva-Espejo, J. E., Silveira, M., Stropp, J., Talbot, J., ter Steege, H., TeranAguilar, J., Terborgh, J., Thomas-Caesar, R., Toledo, M., TorelloRaventos, M., Umetsu, K., van der Heijden, G. M. F., van der Hout, P., Guimarães Vieira, I. C., Vieira, S. A., Vilanova, E., Vos, V. A., Zagt, R. J., Alarcon, A., Amaral, I., Camargo, P. P. B., Brown, I. F., Blanc, L., Burban, B., Cardozo, N., Engel, J. de Freitas, M. A., de Oliveira, A., Fredericksen, T. S., Ferreira, L., Hinojosa, N. T., Jimenez, E., Lenza, E., Mendoza, C., Mendoza Polo, I., Peña Cruz, A., Peñuela, M. C., Petronelli, P., Singh, J., Maquirino, P., Serano, J., Sota, A., Oliveira dos Santos, C., Ybarnegaray, J., and Ricardo, J.: Carbon uptake by mature Amazon forests has mitigated Amazon nations' carbon emissions, Carbon Balance Manag., 12, 1–9, https://doi.org/10.1186/s13021-016-0069-2, 2017.
Pyle, E. H., Santoni, G. W., Nascimento, H. E. M., Hutyra, L. R., Vieira, S., Curran, D. J., Van Haren, J., Saleska, S. R., Chow, V. Y., Carmago, P. B., Laurance, W. F., and Wofsy, S. C.: Dynamics of carbon, biomass, and structure in two Amazonian forests, J. Geophys. Res.-Biogeosci., 114, 1–20, https://doi.org/10.1029/2007JG000592, 2009.
Quesada, C. A., Lloyd, J., Schwarz, M., Patiño, S., Baker, T. R., Czimczik, C., Fyllas, N. M., Martinelli, L., Nardoto, G. B., Schmerler, J., Santos, A. J. B., Hodnett, M. G., Herrera, R., Luizão, F. J., Arneth, A., Lloyd, G., Dezzeo, N., Hilke, I., Kuhlmann, I., Raessler, M., Brand, W. A., Geilmann, H., Moraes Filho, J. O., Carvalho, F. P., Araujo Filho, R. N., Chaves, J. E., Cruz Junior, O. F., Pimentel, T. P., and Paiva, R.: Variations in chemical and physical properties of Amazon forest soils in relation to their genesis, Biogeosciences, 7, 1515–1541, https://doi.org/10.5194/bg-7-1515-2010, 2010.
Quesada, C. A., Lloyd, J., Anderson, L. O., Fyllas, N. M., Schwarz, M., and Czimczik, C. I.: Soils of Amazonia with particular reference to the RAINFOR sites, Biogeosciences, 8, 1415–1440, https://doi.org/10.5194/bg-8-1415-2011, 2011.
Quesada, C. A., Phillips, O. L., Schwarz, M., Czimczik, C. I., Baker, T. R., Patiño, S., Fyllas, N. M., Hodnett, M. G., Herrera, R., Almeida, S., Alvarez Dávila, E., Arneth, A., Arroyo, L., Chao, K. J., Dezzeo, N., Erwin, T., di Fiore, A., Higuchi, N., Honorio Coronado, E., Jimenez, E. M., Killeen, T., Lezama, A. T., Lloyd, G., López-González, G., Luizão, F. J., Malhi, Y., Monteagudo, A., Neill, D. A., Núñez Vargas, P., Paiva, R., Peacock, J., Peñuela, M. C., Peña Cruz, A., Pitman, N., Priante Filho, N., Prieto, A., Ramírez, H., Rudas, A., Salomão, R., Santos, A. J. B., Schmerler, J., Silva, N., Silveira, M., Vásquez, R., Vieira, I., Terborgh, J., and Lloyd, J.: Basin-wide variations in Amazon forest structure and function are mediated by both soils and climate, Biogeosciences, 9, 2203–2246, https://doi.org/10.5194/bg-9-2203-2012, 2012.
Reed, S. C., Yang, X., and Thornton, P. E.: Incorporating phosphorus cycling into global modeling efforts: A worthwhile, tractable endeavor, New Phytol., 208, 324–329, https://doi.org/10.1111/nph.13521, 2015.
Ryan, M. G.: Three decades of research at Flakaliden advancing whole-tree physiology, forest ecosystem and global change research, Tree Physiol., 33, 1123–1131, https://doi.org/10.1093/treephys/tpt100, 2013.
Sampaio, G., Shimizu, M. H., Guimarães-Júnior, C. A., Alexandre, F., Guatura, M., Cardoso, M., Domingues, T. F., Rammig, A., von Randow, C., Rezende, L. F. C., and Lapola, D. M.: CO2 physiological effect can cause rainfall decrease as strong as large-scale deforestation in the Amazon, Biogeosciences, 18, 2511–2525, https://doi.org/10.5194/bg-18-2511-2021, 2021.
Sanchez, P. A.: Properties and Management of Soils in the Tropics, Soil Sci., 124, 187 pp., 1977.
Sardans, J., Rivas-Ubach, A., and Peñuelas, J.: The stoichiometry of organisms and ecosystems in a changing world: A review and perspectives, Perspect. Plant Ecol., 14, 33–47, https://doi.org/10.1016/j.ppees.2011.08.002, 2012.
Schimel, D., Stephens, B. B., and Fisher, J. B.: Effect of increasing CO2 on the terrestrial carbon cycle, P. Natl. Acad. Sci. USA, 112, 436–441, https://doi.org/10.1073/pnas.1407302112, 2015.
Shen, J., Yuan, L., Zhang, J., Li, H., Bai, Z., Chen, X., Zhang, W., and Zhang, F.: Phosphorus dynamics: From soil to plant, Plant Physiol., 156, 997–1005, https://doi.org/10.1104/pp.111.175232, 2011.
Sitch, S., Huntingford, C., Gedney, N., Levy, P. E., Lomas, M., Piao, S. L., Betts, R., Ciais, P., Cox, P., Friedlingstein, P., Jones, C. D., Prentice, I. C., and Woodward, F. I.: Evaluation of the terrestrial carbon cycle, future plant geography and climate-carbon cycle feedbacks using five Dynamic Global Vegetation Models (DGVMs), Glob. Change Biol., 14, 2015–2039, https://doi.org/10.1111/j.1365-2486.2008.01626.x, 2008.
Stephenson, N. L. and Van Mantgem, P. J.: Forest turnover rates follow global and regional patterns of productivity, Ecol. Lett., 8, 524–531, https://doi.org/10.1111/j.1461-0248.2005.00746.x, 2005.
Sun, Y., Goll, D. S., Chang, J., Ciais, P., Guenet, B., Helfenstein, J., Huang, Y., Lauerwald, R., Maignan, F., Naipal, V., Wang, Y., Yang, H., and Zhang, H.: Global evaluation of the nutrient-enabled version of the land surface model ORCHIDEE-CNP v1.2 (r5986), Geosci. Model Dev., 14, 1987–2010, https://doi.org/10.5194/gmd-14-1987-2021, 2021.
Tipping, E., Somerville, C. J., and Luster, J.: The stoichiometry of soil organic matter, Biogeochemistry, 130, 117–131, https://doi.org/10.1007/s10533-016-0247-z, 2016.
Turner, B. L. and Condron, L. M.: Pedogenesis, nutrient dynamics, and ecosystem development: the legacy of T. W. Walker and J. K. Syers, Plant Soil, 367, 1–10, https://doi.org/10.1007/s11104-013-1750-9, 2013.
Turner, B. L., Yavitt, J. B., Harms, K. E., Garcia, M. N., and Wright, S. J.: Seasonal changes in soil organic matter after a decade of nutrient addition in a lowland tropical forest, Biogeochemistry, 123, 221–235, https://doi.org/10.1007/s10533-014-0064-1, 2015.
Van Langenhove, L., Verryckt, L. T., Bréchet, L., Courtois, E. A., Stahl, C., Hofhansl, F., Bauters, M., Sardans, J., Boeckx, P., Fransen, E., Peñuelas, J., and Janssens, I. A.: Atmospheric deposition of elements and its relevance for nutrient budgets of tropical forests, Biogeochemistry, 149, 175–193, https://doi.org/10.1007/s10533-020-00673-8, 2020.
Vicca, S., Luyssaert, S., Peñuelas, J., Campioli, M., Chapin, F. S., Ciais, P., Heinemeyer, A., Högberg, P., Kutsch, W. L., Law, B. E., Malhi, Y., Papale, D., Piao, S. L., Reichstein, M., Schulze, E. D., and Janssens, I. A.: Fertile forests produce biomass more efficiently, Ecol. Lett., 15, 520–526, https://doi.org/10.1111/j.1461-0248.2012.01775.x, 2012a.
Vicca, S., Luyssaert, S., Peñuelas, J., Campioli, M., Chapin, F. S., Ciais, P., Heinemeyer, A., Högberg, P., Kutsch, W. L., Law, B. E., Malhi, Y., Papale, D., Piao, S. L., Reichstein, M., Schulze, E. D., and Janssens, I. A.: Fertile forests produce biomass more efficiently, Ecol. Lett., 15, 520–526, https://doi.org/10.1111/j.1461-0248.2012.01775.x, 2012b.
Vitousek, P. M.: Nutrient Cycling and Limitation: Hawai'i as a Model System, Princeton University Press, ISBN 0-691-11850-X, 2004.
Vitousek, P. M. and Howarth, R. W.: Nitrogen limitation on land and in the sea: How can it occur?, Biogeochemistry, 13, 87–115, https://doi.org/10.1007/BF00002772, 1991.
Vitousek, P. M., Mooney, H. A., Lubchenco, J. M., and Melillo, J. M.: Human Domination of Earth Ecosystems, Science, 278, 494–499, https://doi.org/10.1126/science.277.5325.494, 1997.
Vitousek, P. M., Porder, S., Houlton, B. Z., and Chadwick, O. A.: Terrestrial phosphorus limitation: Mechanisms, implications, and nitrogen-phosphorus interactions, Ecol. Appl., 20, 5–15, https://doi.org/10.1890/08-0127.1, 2010.
Walker, A. P., De Kauwe, M. G., Bastos, A., Belmecheri, S., Georgiou, K., Keeling, R. F., McMahon, S. M., Medlyn, B. E., Moore, D. J. P., Norby, R. J., Zaehle, S., Anderson-Teixeira, K. J., Battipaglia, G., Brienen, R. J. W., Cabugao, K. G., Cailleret, M., Campbell, E., Canadell, J. G., Ciais, P., Craig, M. E., Ellsworth, D. S., Farquhar, G. D., Fatichi, S., Fisher, J. B., Frank, D. C., Graven, H., Gu, L., Haverd, V., Heilman, K., Heimann, M., Hungate, B. A., Iversen, C. M., Joos, F., Jiang, M., Keenan, T. F., Knauer, J., Körner, C., Leshyk, V. O., Leuzinger, S., Liu, Y., MacBean, N., Malhi, Y., McVicar, T. R., Penuelas, J., Pongratz, J., Powell, A. S., Riutta, T., Sabot, M. E. B., Schleucher, J., Sitch, S., Smith, W. K., Sulman, B., Taylor, B., Terrer, C., Torn, M. S., Treseder, K. K., Trugman, A. T., Trumbore, S. E., van Mantgem, P. J., Voelker, S. L., Whelan, M. E., and Zuidema, P. A.: Integrating the evidence for a terrestrial carbon sink caused by increasing atmospheric CO2, New Phytol., 229, 2413–2445, https://doi.org/10.1111/nph.16866, 2021.
Walker, T. W. and Syers, J. K.: The fate of phosphorus during pedogenesis, Geoderma, 15, 1–19, https://doi.org/10.1016/0016-7061(76)90066-5, 1976.
Walker, A. P., Beckerman, A. P., Gu, L., Kattge, J., Cernusak, L. A., Domingues, T. F., Scales, J. C., Wohlfahrt, G., Wullschleger, S. D., and Woodward, F. I.: The relationship of leaf photosynthetic traits – Vcmax and Jmax – to leaf nitrogen, leaf phosphorus, and specific leaf area: a meta-analysis and modeling study, Ecol. Evol., 4, 3218–3235, https://doi.org/10.1002/ece3.1173, 2014.
Wang, Y. P., Houlton, B. Z., and Field, C. B.: A model of biogeochemical cycles of carbon, nitrogen, and phosphorus including symbiotic nitrogen fixation and phosphatase production, Global Biogeochem. Cy., 21, 1–15, https://doi.org/10.1029/2006GB002797, 2007.
Wang, Y. P., Law, R. M., and Pak, B.: A global model of carbon, nitrogen and phosphorus cycles for the terrestrial biosphere, Biogeosciences, 7, 2261–2282, https://doi.org/10.5194/bg-7-2261-2010, 2010.
Went, F. W. and Stark, N.: Mycorrhiza, Bioscience, 18, 1035–1039, https://doi.org/10.2307/1294552, 1968.
Wiltshire, A. J., Burke, E. J., Chadburn, S. E., Jones, C. D., Cox, P. M., Davies-Barnard, T., Friedlingstein, P., Harper, A. B., Liddicoat, S., Sitch, S., and Zaehle, S.: JULES-CN: a coupled terrestrial carbon–nitrogen scheme (JULES vn5.1), Geosci. Model Dev., 14, 2161–2186, https://doi.org/10.5194/gmd-14-2161-2021, 2021.
Wright, S. J., Yavitt, J. B., Wurzburger, N., Turner, B. I., Tanner, E. V. J., Sayer, E. J., Santiago, L. S., Kaspari, M., Hedin, L. O., Harms, K. E., Garcia, M. N., and Corre, M. D.: Potassium, phosphorus, or nitrogen limit root allocation, tree growth, or litter production in a lowland tropical forest, Ecology, 92, 1616–1625, https://doi.org/10.1890/10-1558.1, 2011.
Xiao, J., Sun, G., Chen, J., Chen, H., Chen, S., Dong, G., Gao, S., Guo, H., Guo, J., Han, S., Kato, T., Li, Y., Lin, G., Lu, W., Ma, M., McNulty, S., Shao, C., Wang, X., Xie, X., Zhang, X., Zhang, Z., Zhao, B., Zhou, G., and Zhou, J.: Carbon fluxes, evapotranspiration, and water use efficiency of terrestrial ecosystems in China, Agr. Forest Meteorol., 182–183, 76–90, https://doi.org/10.1016/j.agrformet.2013.08.007, 2013.
Xu, Z., Jiang, Y., Jia, B., and Zhou, G.: Elevated-CO2 response of stomata and its dependence on environmental factors, Front. Plant Sci., 7, 1–15, https://doi.org/10.3389/fpls.2016.00657, 2016.
Yang, X. and Post, W. M.: Phosphorus transformations as a function of pedogenesis: A synthesis of soil phosphorus data using Hedley fractionation method, Biogeosciences, 8, 2907–2916, https://doi.org/10.5194/bg-8-2907-2011, 2011.
Yang, X., Post, W. M., Thornton, P. E., and Jain, A.: The distribution of soil phosphorus for global biogeochemical modeling, Biogeosciences, 10, 2525–2537, https://doi.org/10.5194/bg-10-2525-2013, 2013.
Yang, X., Thornton, P. E., Ricciuto, D. M., and Post, W. M.: The role of phosphorus dynamics in tropical forests – a modeling study using CLM-CNP, Biogeosciences, 11, 1667–1681, https://doi.org/10.5194/bg-11-1667-2014, 2014.
Zaehle, S. and Dalmonech, D.: Carbon-nitrogen interactions on land at global scales: Current understanding in modelling climate biosphere feedbacks, Curr. Opin. Environ. Sustain., 3, 311–320, https://doi.org/10.1016/j.cosust.2011.08.008, 2011.
Zaehle, S. and Friend, A. D.: Carbon and nitrogen cycle dynamics in the O-CN land surface model: 1. Model description, site-scale evaluation, and sensitivity to parameter estimates, Global Biogeochem. Cy., 24, 1–13, https://doi.org/10.1029/2009GB003521, 2010.
Zechmeister-Boltenstern, S., Keiblinger, K. M., Mooshammer, M., Peñuelas, J., Richter, A., Sardans, J., and Wanek, W.: The application of ecological stoichiometry to plant–microbial–soil organic matter transformations, Ecol. Monogr., 85, 133–155, https://doi.org/10.1890/14-0777.1, 2015.
Zhu, Q., Riley, W. J., Tang, J., and Koven, C. D.: Multiple soil nutrient competition between plants, microbes, and mineral surfaces: model development, parameterization, and example applications in several tropical forests, Biogeosciences, 13, 341–363, https://doi.org/10.5194/bg-13-341-2016, 2016.