the Creative Commons Attribution 4.0 License.
the Creative Commons Attribution 4.0 License.
 | 09 Jun 2022
Climate projections over the Great Lakes Region: using two-way coupling of a regional climate model with a 3-D lake model
Xinyu Ye
Jeremy S. Pal
Philip Y. Chu
Miraj B. Kayastha
Chenfu Huang
Warming trends in the Laurentian Great Lakes and surrounding areas have been observed in recent decades, and concerns continue to rise about the pace and pattern of future climate change over the world's largest freshwater system. To date, most regional climate models used for Great Lakes projections either neglected the lake-atmosphere interactions or are only coupled with a 1-D column lake model to represent the lake hydrodynamics. This study presents a Great Lakes climate change projection that has employed the two-way coupling of a regional climate model with a 3-D lake model (GLARM) to resolve 3-D hydrodynamics essential for large lakes. Using the three carefully selected Coupled Model Intercomparison Project Phase 5 (CMIP5) general circulation models (GCMs), we show that the GLARM ensemble average substantially reduces surface air temperature and precipitation biases of the driving GCM ensemble average in present-day climate simulations. The improvements are not only displayed from an atmospheric perspective but are also evident in the accurate simulations of lake temperature and ice coverage. We further present the GLARM projected climate change for the mid-21st century (2030–2049) and the late 21st century (2080–2099) in the Representative Concentration Pathway (RCP) 4.5 and RCP 8.5 scenarios. Under RCP 8.5, the Great Lakes basin is projected to warm by 1.3–2.1 ∘C by the mid-21st century and 4.1–5.0 ∘C by the end of the century relative to the early century (2000–2019). Moderate mitigation (RCP 4.5) reduces the mid-century warming to 0.8–1.8 ∘C and late-century warming to 1.8–2.7 ∘C. Annual precipitation in GLARM is projected to increase for the entire basin, varying from 0 % to 13 % during the mid-century and from 9 % to 32 % during the late century in different scenarios and simulations. The most significant increases are projected in spring and fall when current precipitation is highest and a minimal increase in winter when it is lowest. Lake surface temperatures (LSTs) are also projected to increase across the five lakes in all of the simulations, but with strong seasonal and spatial variability. The most significant LST increases occur in Lakes Superior and Ontario. The strongest warming is projected in spring that persists into the summer, resulting from earlier and more intense stratification in the future. In addition, diminishing winter stratification in the future suggests the transition from dimictic lakes to monomictic lakes by the end of the century. In contrast, a relatively smaller increase in LSTs during fall and winter is projected with heat transfer to the deep water due to the strong mixing and energy required for ice melting. Correspondingly, the highest monthly mean ice cover is projected to reduce to 3 %–15 % and 10 %–40 % across the lakes by the end of the century in RCP 8.5 and RCP 4.5, respectively. In the coastal regions, ice duration is projected to decrease by up to 60 d.
- Article
(5746 KB) - Full-text XML
-
Supplement
(723 KB) - BibTeX
- EndNote


The Laurentian Great Lakes are the world's largest surface freshwater system, containing 84 % of North America's surface freshwater and 21 % of the world's supply of surface fresh water (EPA, 2014). Spanning more than 244 000 km2, an area roughly equal to the size of the United Kingdom, the vast inland freshwater system provides water for consumption, transportation, power, recreation, and many other uses. The Great Lakes support 1.3 million jobs and USD 82 billion in wages per year (Rau et al., 2020). More than 34 million people call the Great Lakes basin home, and more than 3500 species of plants and animals inhabit it, including over 170 species of fish (EPA, 2014). The Great Lakes commercial, recreational, and tribal fisheries are collectively valued at more than USD 7 billion annually and support more than 75 000 jobs (http://www.glfc.org/the-fishery.php, last access: 31 May 2022).
In recent decades, the Great Lakes and surrounding areas have undergone rapid warming (Austin and Colman, 2007; Hayhoe et al., 2010; Dobiesz and Lester, 2009; Pryor et al., 2014; Melillo et al., 2014; Zhong et al., 2016). The annual mean temperature over the Great Lakes basin increased by 0.9 ∘C between 1901–1960 and 1985–2016, exceeding average changes of 0.7 ∘C for the rest of the contiguous United States (Wuebbles et al., 2019). Consequently, lake surface temperature (LST) in the Great Lakes has increased and ice coverage has decreased. Summer LST has risen faster than the ambient air temperature in Lake Superior (McCormick and Fahnenstiel, 1999; Austin and Colman, 2008). The overall ice coverage on the five Great Lakes has reduced by 71 % from 1973 through 2010 (Wang et al., 2012).
Measurable changes have also been observed in precipitation patterns, lake levels, wave climate, and water biogeochemistry impacting the ecosystems (Jones et al., 2006; Wuebbles et al., 2019; Huang et al., 2021b). For example, climate change and human activities have influenced algal bloom frequency and intensity (Dobiesz and Lester, 2009; Daloğlu et al., 2012; Scavia et al., 2014), reduced primary productivity (Poesch et al., 2016), and altered prey fish habitats and populations (Sharma et al., 2007; Lynch et al., 2016; Collingsworth et al., 2017). As a result, there has been a growing need to better understand climate change and variability for the Great Lakes and surrounding regions.
Various techniques have been used to project how the Great Lakes regional climate could evolve in the future. The direct use of coupled atmosphere-ocean general circulation model (GCM) simulations has shown various problems due to their typically low spatial resolution resulting in inadequacies in representing small-scale processes important in the region (MacKay and Seglenieks, 2013). More importantly, many Coupled Model Intercomparison Project Phase 5 (CMIP5) models do not include adequate representations of the Great Lakes (Briley et al., 2021). Dynamical downscaling using higher resolution regional climate models (RCMs) has been used to improve on these inadequacies (Notaro et al., 2015; Music et al., 2015; Xiao et al., 2018; Zhang et al., 2018, 2019, 2020). Statistical downscaling (Byun and Hamlet, 2018; Byun et al., 2019) and probabilistic Bayesian methods (Wang et al., 2017) have also been recently applied to the Great Lakes region.
Regardless of the techniques used, temperatures over the Great Lakes basin are projected to increase with anthropogenic atmospheric greenhouse gas (GHG) emissions (e.g., Cherkauer and Sinha, 2010; Byun and Hamlet, 2018; Zhang et al., 2020). Projected precipitation changes are less certain, however, several of the studies project reductions in summer precipitation and increases in winter and spring, as well as an increase in the fraction of precipitation falling as rainfall (Cherkauer and Sinha, 2010; Notaro et al., 2015; Byun and Hamlet, 2018; Zhang et al., 2019). Similarly, the lakes themselves are projected to continue to rapidly warm, resulting in reduced ice cover and earlier occurrence of seasonal stratification (Gula and Peltier, 2012; Notaro et al., 2015; Xiao et al., 2018). These changes can further modify the distribution of lake mixing regimes and shift the timing of lake overturning episodes (Woolway and Merchant, 2019; Woolway et al., 2021), and can have profound implications for lake biogeochemistry, ecosystems, power production, navigation, tourism, and other sectors.
Uncertainties in the Great Lakes climate change projections can arise from multiple sources including GHG emission scenarios, internal variability, model deficiencies, and lateral forcing conditions; however, coupled land-lake-ice-atmosphere interactions must be considered. While significant improvements have been made in modeling these systems, they are typically modeled independently, loosely coupled, or with only a limited set of interactions. Few previous studies have applied a dynamical approach to downscaling GCM for climate change projections with results of changes in Great Lakes conditions (Gula and Peltier, 2012; Notaro et al., 2015; Mailhot et al., 2019); however, these studies generally treat the Great Lakes as one-dimensional (1D) water columns and ignore three-dimensional (3D) processes in the large lakes (Hostetler et al., 1993; Subin et al., 2012; Bennington et al., 2014). Incorporating 3D hydrodynamic models into RCMs to represent the hydrodynamics of the Great Lakes has been advocated by the Great Lakes modeling community but is still in its early stage (Delaney and Milner, 2019). Recently, Xue et al. (2017) developed the first two-way coupled RCM and 3D hydrodynamic model system called the Great Lakes–Atmosphere Regional Model (GLARM) and demonstrated the feasibility and clear benefit of this approach for regional climate simulation. The approach leads to more accurate representations of surface sensible and latent heat fluxes that reduce LST biases (Xue et al., 2015) and improve the simulation of atmospheric conditions, such as precipitation and lake-effect snow due to improved representation of LSTs (Shi and Xue, 2019). More recently, a similar study using the Climate-Weather Research and Forecasting Model (CWRF) coupled with the Finite Volume Community Ocean Model (FVCOM) for historical simulations (Sun et al., 2020) also demonstrated the benefit of coupling atmosphere and 3-D lake models in a two-way fashion. These two efforts, however, focused on model development and validation. To date, no studies exist applying such coupled 3-D two-way coupled models to project the evolution of the Great Lakes themselves interacting with regional climate changes.
In this study, an RCM two-way coupled with a 3-D hydrodynamic model to fully resolve the lake-ice-atmosphere interactions is applied to provide more reliable high-resolution projections of climate change for the Great Lakes and surrounding regions. Ensemble projections are conducted for the middle and late 21st century under a high-end Representative Concentration Pathway (RCP) scenario (RCP 8.5) and a moderate mitigation scenario (RCP 4.5). The paper documents the model development, validation, and climate change projections. Emphasis is placed on the climate change over the Great Lakes basin as well as its impacts on and interactions with the changes within the lakes.
2.1 GLARM-V2
The GLARM is a two-way lake-ice-atmosphere coupled climate model system designed for the Great Lakes region (Xue et al., 2017) and has been updated to version 2 (GLARM-V2, hereafter referred to as GLARM). It consists of the 4th version of the International Centre for Theoretical Physics (ICTP) regional climate model (RegCM4) to simulate land and atmospheric processes (Giorgi et al., 2012) and the Finite Volume Community Ocean Model (FVCOM) to simulate the 3-D lake dynamics, thermal dynamics, and ice dynamics (Chen et al., 2003, 2012; Anderson et al., 2018). The version of RegCM used in this study is a 3-D, hydrostatic, compressible, primitive equation, σ-coordinate version (RegCM4.3.4) synchronously coupled with the Community Land Model version 4.5 (CLM4.5, Oleson et al., 2010, 2013), which has the option to include prognostic treatment of the carbon and nitrogen cycles and dynamic vegetation (RegCM‐CLM‐CNDV, Wang et al., 2016). The FVCOM is an unstructured grid, finite-volume, 3-D, primitive equation, hydrodynamic model with a generalized terrain-following coordinate system in the vertical and triangular meshes in the horizontal, and is widely applied to coastal oceans and the Great Lakes (Xue et al., 2014, 2015, 2020; Anderson et al., 2018; Huang et al., 2019, 2021a; Ye et al., 2019, 2020; Ibrahim et al., 2020). The version of FVCOM used in this study is derived from FVCOM 4.3.1 without applying nudging or other similar nonphysical constraints. Lake hydrodynamic conditions are configured to evolve and freely interact with atmospheric conditions over the entire course of climate simulation and projection. In GLARM, the LST fields and ice coverage are dynamically calculated by FVCOM and provided to RegCM4 for the over-lake surface boundary conditions using the OASIS3-MCT coupler (Craig et al., 2017). Meanwhile, the surface forcing fields required by FVCOM are dynamically calculated by RegCM4 and provided to FVCOM through the coupler.
The GLARM domain in this study covers the midwest and northeast United States and the Ontario and Quebec Canadian provinces (Fig. 1), comparable in size to other previous Great Lakes RCM configurations (e.g., Bennington et al., 2014; Xiao et al., 2018). The RegCM4 module (land and atmosphere) has an 18-km horizontal grid spacing and 18 vertical sigma layers. The FVCOM module (Great Lakes) has a horizontal resolution of unstructured triangular grids that varies from 1–2 km near the coast to 2–4 km in the offshore region of the lakes. The model is configured with 40 sigma layers to provide a vertical resolution of <1 m for nearshore waters and 2–5 m in most of the offshore regions of the lakes.
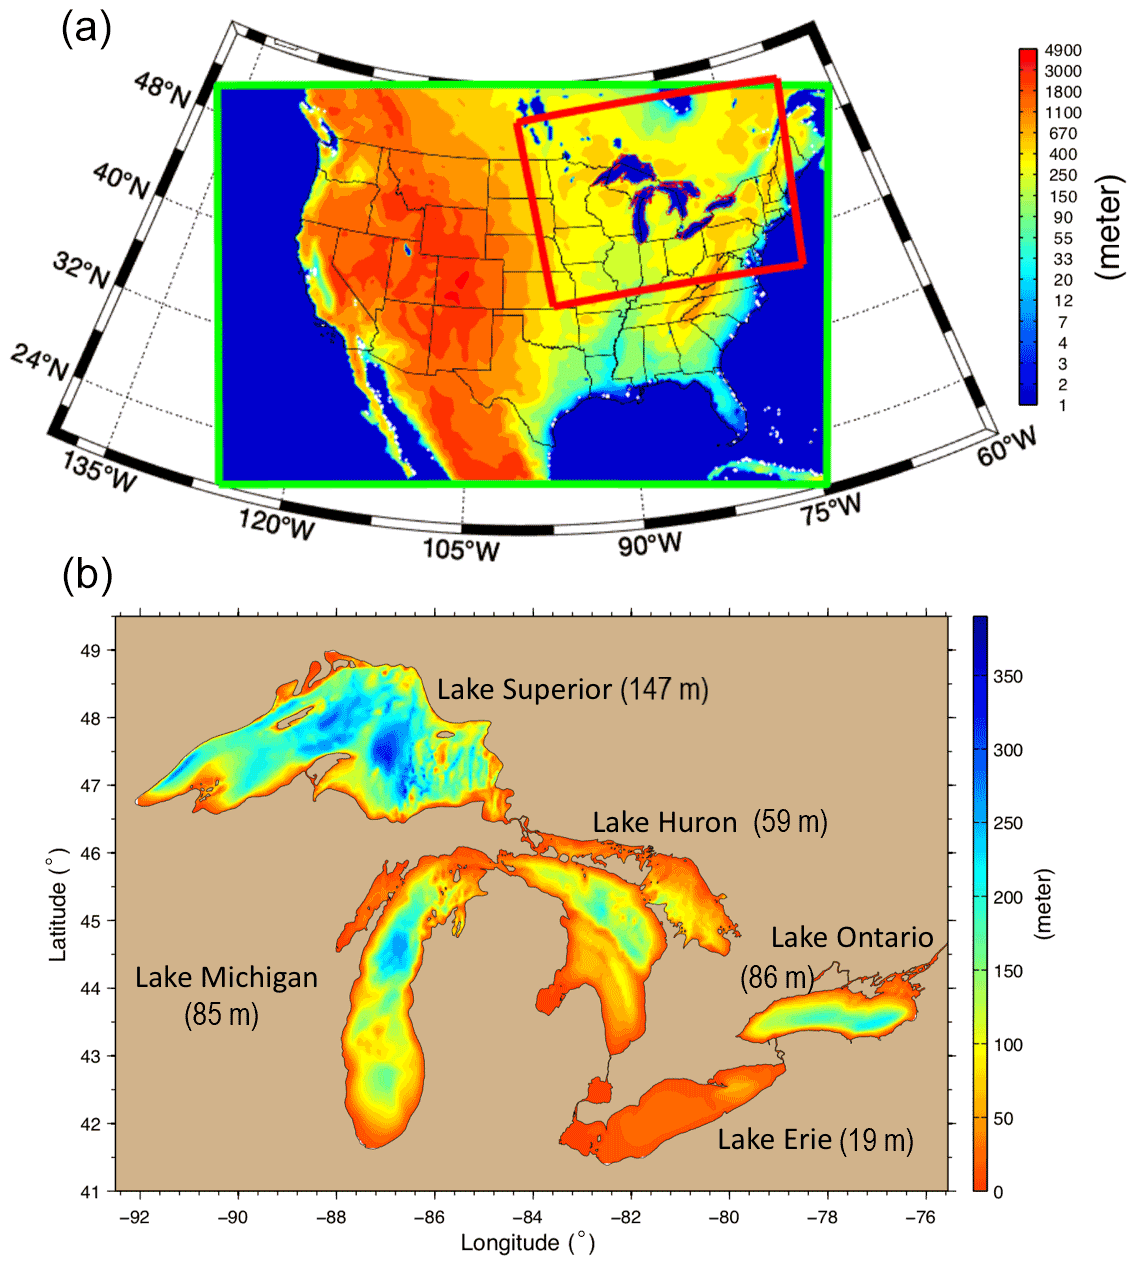
Figure 1(a) The GLARM model domain (red box) overlaid on a topographic map of the majority of North America (green box). (b) Bathymetry map of the Great Lakes labeled with the average depth of each lake.
2.2 Data for model validation
Various datasets were used in this study for evaluating the model performance in simulating present-day climate. Monthly surface air temperature and precipitation were obtained from the land station-based 0.5∘Climate Research Unit data (CRU TS 3.0) (Harris et al., 2014) and the daily LSTs for the five lakes from the Great Lakes Surface Environmental Analysis (GLSEA; https://coastwatch.glerl.noaa.gov/glsea/glsea.html, last access: 31 May 2022). Derived from the NOAA Advanced Very High Resolution Radiometer (AVHRR) satellite imagery, GLSEA serves as the best available product to examine spatial and temporal variability of surface water temperature in the Great Lakes. The daily Great Lakes ice coverage was obtained from the Great Lakes Ice Cover Database (GLICD) using the ice products developed by the U.S. National Ice Center and the Canadian Ice Service (https://www.glerl.noaa.gov/data/ice/#historical, last access: 31 May 2022), which includes the Great Lakes Ice Atlas (https://www.glerl.noaa.gov/data/ice/atlas/, last access: 31 May 2022) for the period 1973–2002 and ice data addendum from 2003 to the present.
2.3 Numerical experimental design
The Intergovernmental Panel on Climate Change (IPCC) assessment reports are largely based on GCM simulations from the Coupled Model Intercomparison Project (CMIP) coordinated framework. As configured, the output from these simulations is a credible data source for climate change assessments at global, continental, and regional scales; however, it may not adequately represent regional and localized features due to the relatively coarse spatial resolution of the GCMs (100s km). Using GCMs output to drive RCMs has been shown to enhance model performance due largely to a more realistic representation of physics and dynamics as well as orography, coastlines, and land cover as a consequence of their higher resolution (Feser et al., 2011; Giorgi, 2019). A primary factor of uncertainty associated with the CMIP5 climate change projections is that different GCMs can simulate very different climate changes across global, continental and regional scales even under the same anthropogenic forcing scenario. For regional climate modeling studies, it is therefore critical to evaluate GCM performance in the region of interest and select those that best represent historical climate. In this work, we first evaluate the performance of CMIP5 GCMs and then select a subset to use as lateral and ocean surface boundary conditions for GLARM. The GLARM present-day (2000–2019) simulations, driven by the selected GCMs, are then validated against observational data. As the CMIP5 GCM hindcast simulations ended in 2005, the GCM results for 2006–2019 under RCP8.5 were used to drive GLARM for the best track of observed GHG concentrations (Schwalm et al., 2020). After that, the GLARM projected climate change for the mid-21st century (2030–2049) and the end of the century (2080–2099) for the RCP 4.5 and RCP 8.5 scenarios are presented. The RCP 8.5 is representative of a scenario with high atmospheric GHG concentrations, while RCP 4.5 represents a scenario with moderate mitigation.
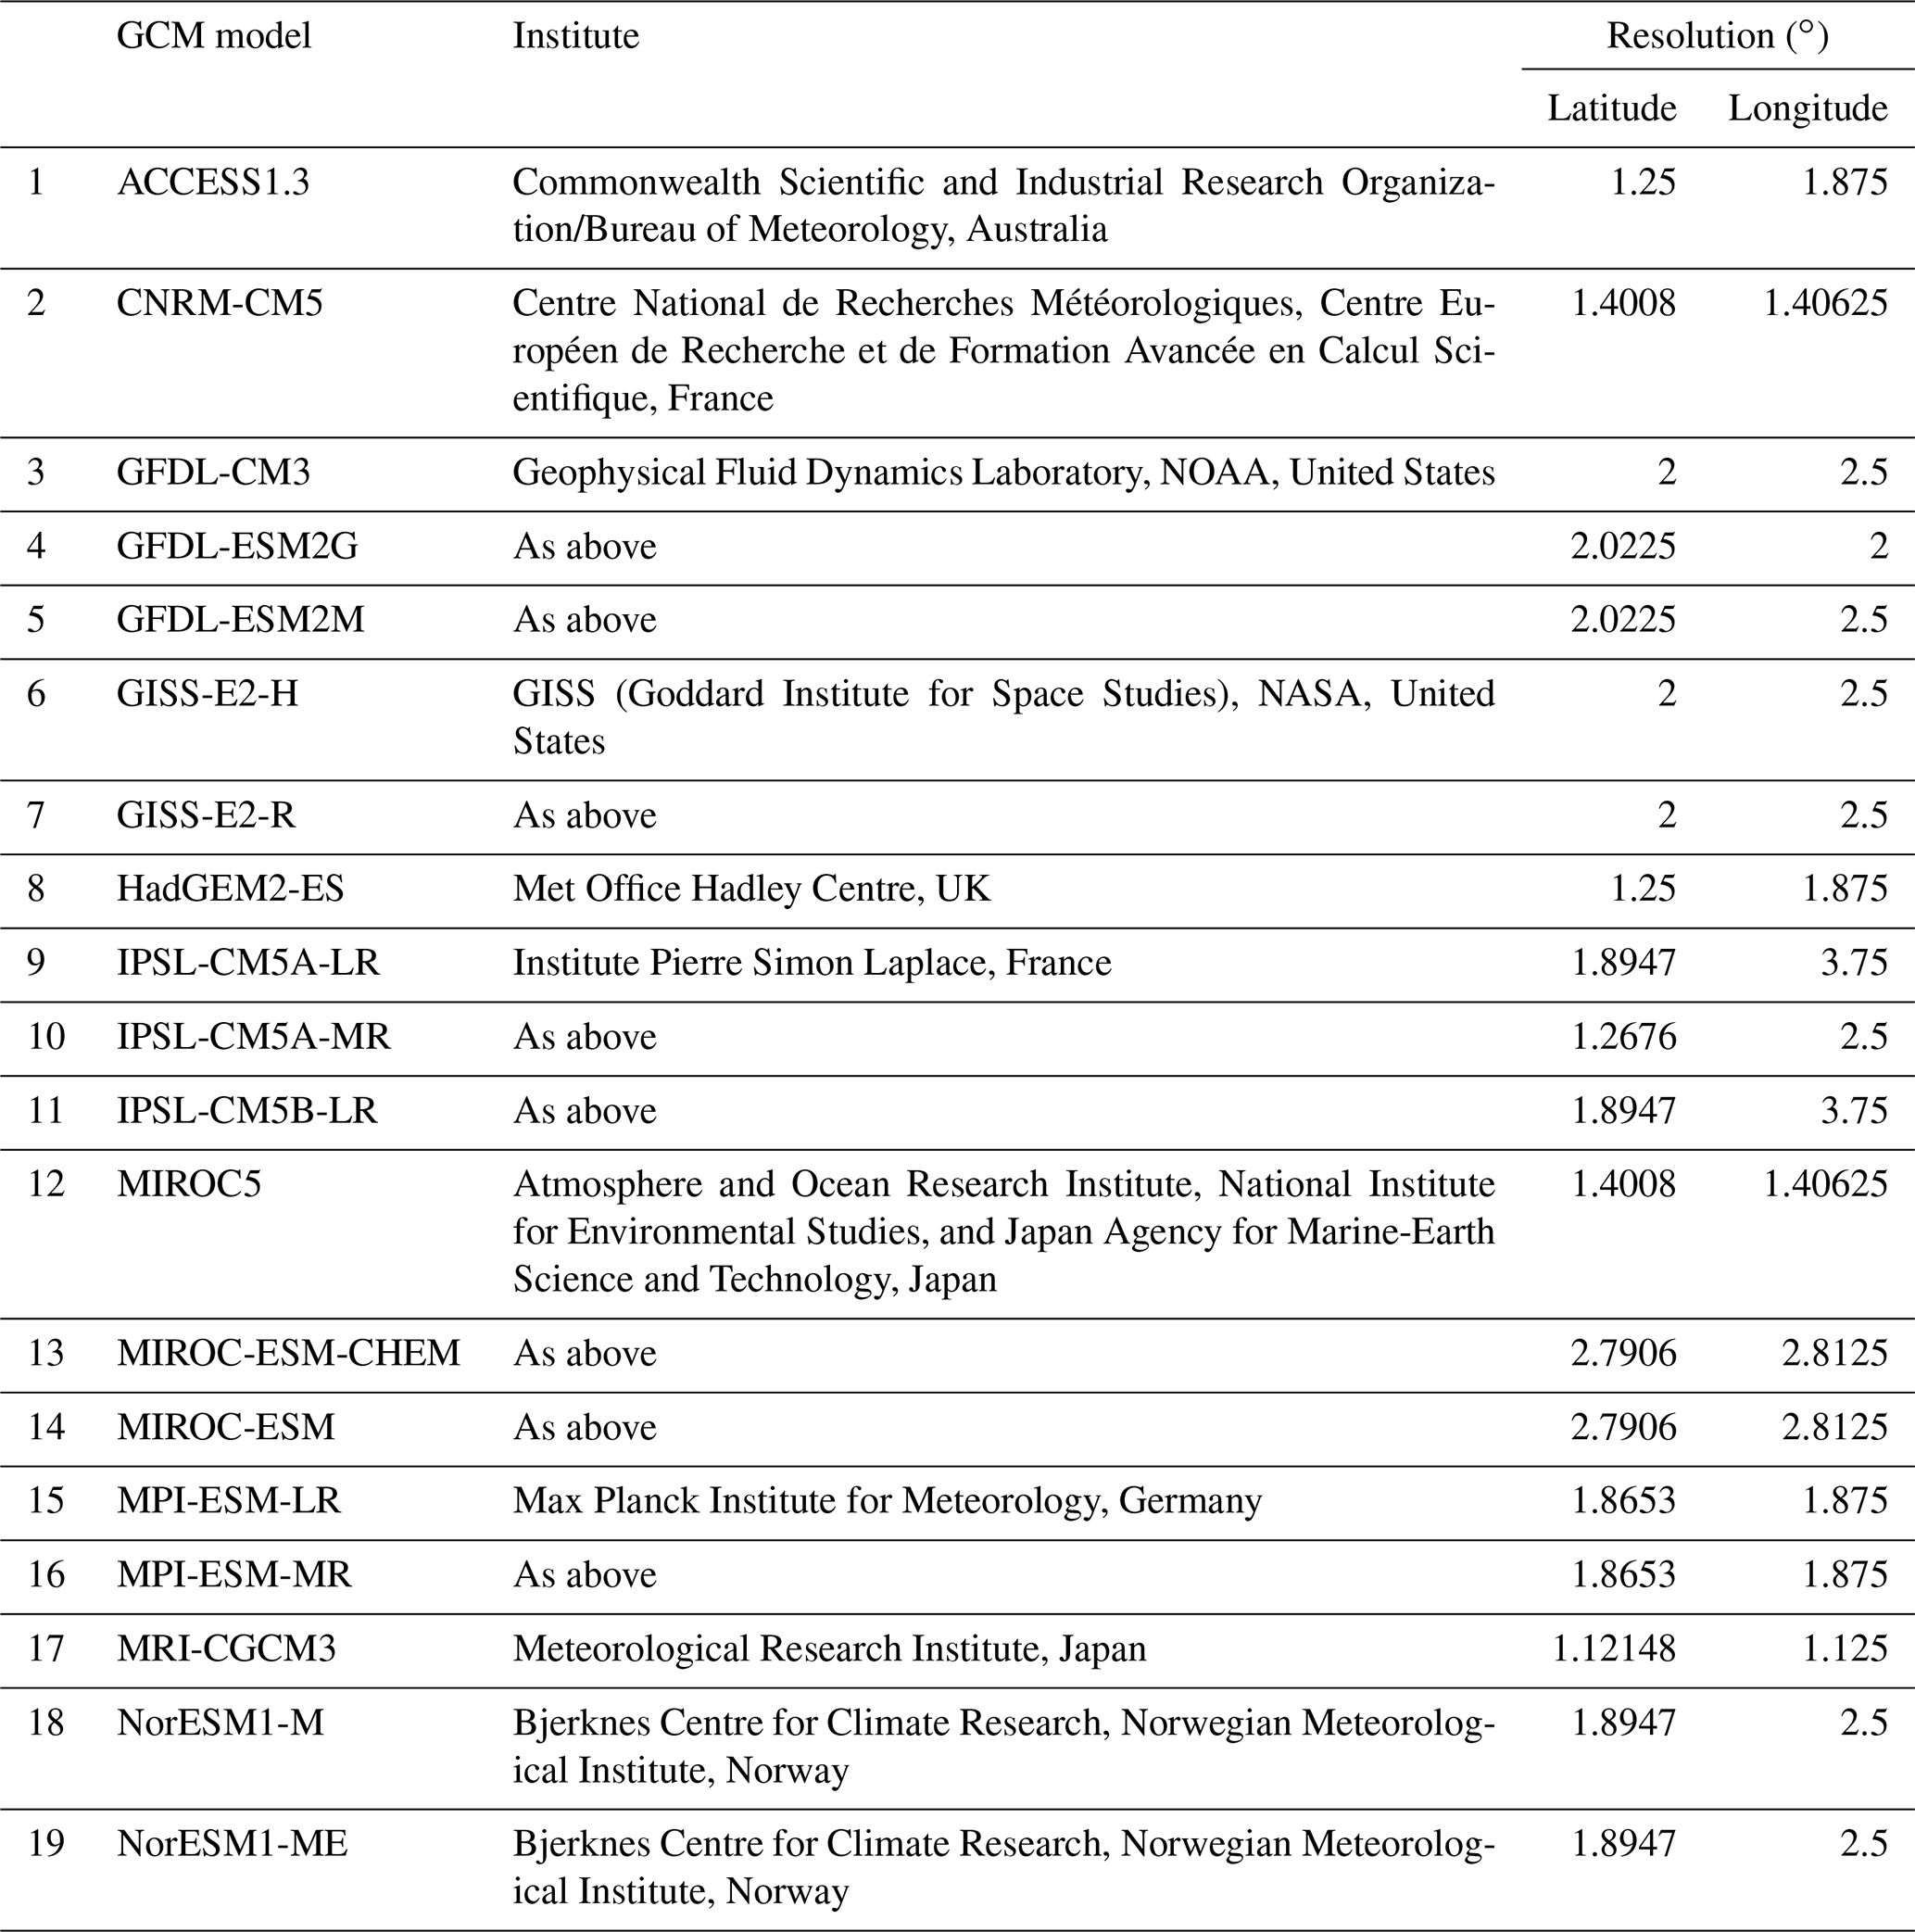
The output from 19 CMIP5 GCMs (Table 1) are assessed based on two general reliability criteria (Giorgi and Mearns, 2002). The first criterion is based on the ability of the GCMs to reproduce different aspects of historical climate, referred to as the model performance criterion. The second, referred to as the model convergence criterion, assesses the convergence of climate projections by different models under a given forcing scenario. Higher convergence implies more robust signals. The reliability score Rk represents the Kth model performance in simulating the historical climate and its degree of convergence in the projected future climate (Giorgi and Mearns, 2002; Miao et al., 2014):
RB,k is a factor inversely proportional to the absolute bias (Bk) of the Kth model in simulating the historical variable. RD,k is a factor that measures the Kth model convergence in terms of the distance (Dk) of its departure from the average of the ensemble change weighted by the reliability score (Rk) of each model (). This average (denoted by ) is therefore called the reliability ensemble average or REA. The parameters m and n (typically equal to 1) represent the weights of the model performance criterion (RB,k) and the model convergence criterion (RD,k) that influence the reliability score Rk of the model. The parameter ϵ describes the natural variability of the climatic variable. is the REA of an assessed variable (e.g., surface air temperature) based on individual model results Tk (). The reliability score Rk is calculated iteratively to converge, since Rk is a function of , and in turn is updated with Rk.
To evaluate the performance of each GCM in reproducing observed climate and projecting future warming trends over North America (NA), we conducted the model reliability analysis using model-simulated NA-averaged temperature in the historical periods (1901–2005) and the future period (2006–2100) from the RCP 8.5 scenario. The three GCMs with the highest reliability scores are selected to drive GLARM for the present-day and two future periods in each scenario.
3.1 GCM evaluation and selection
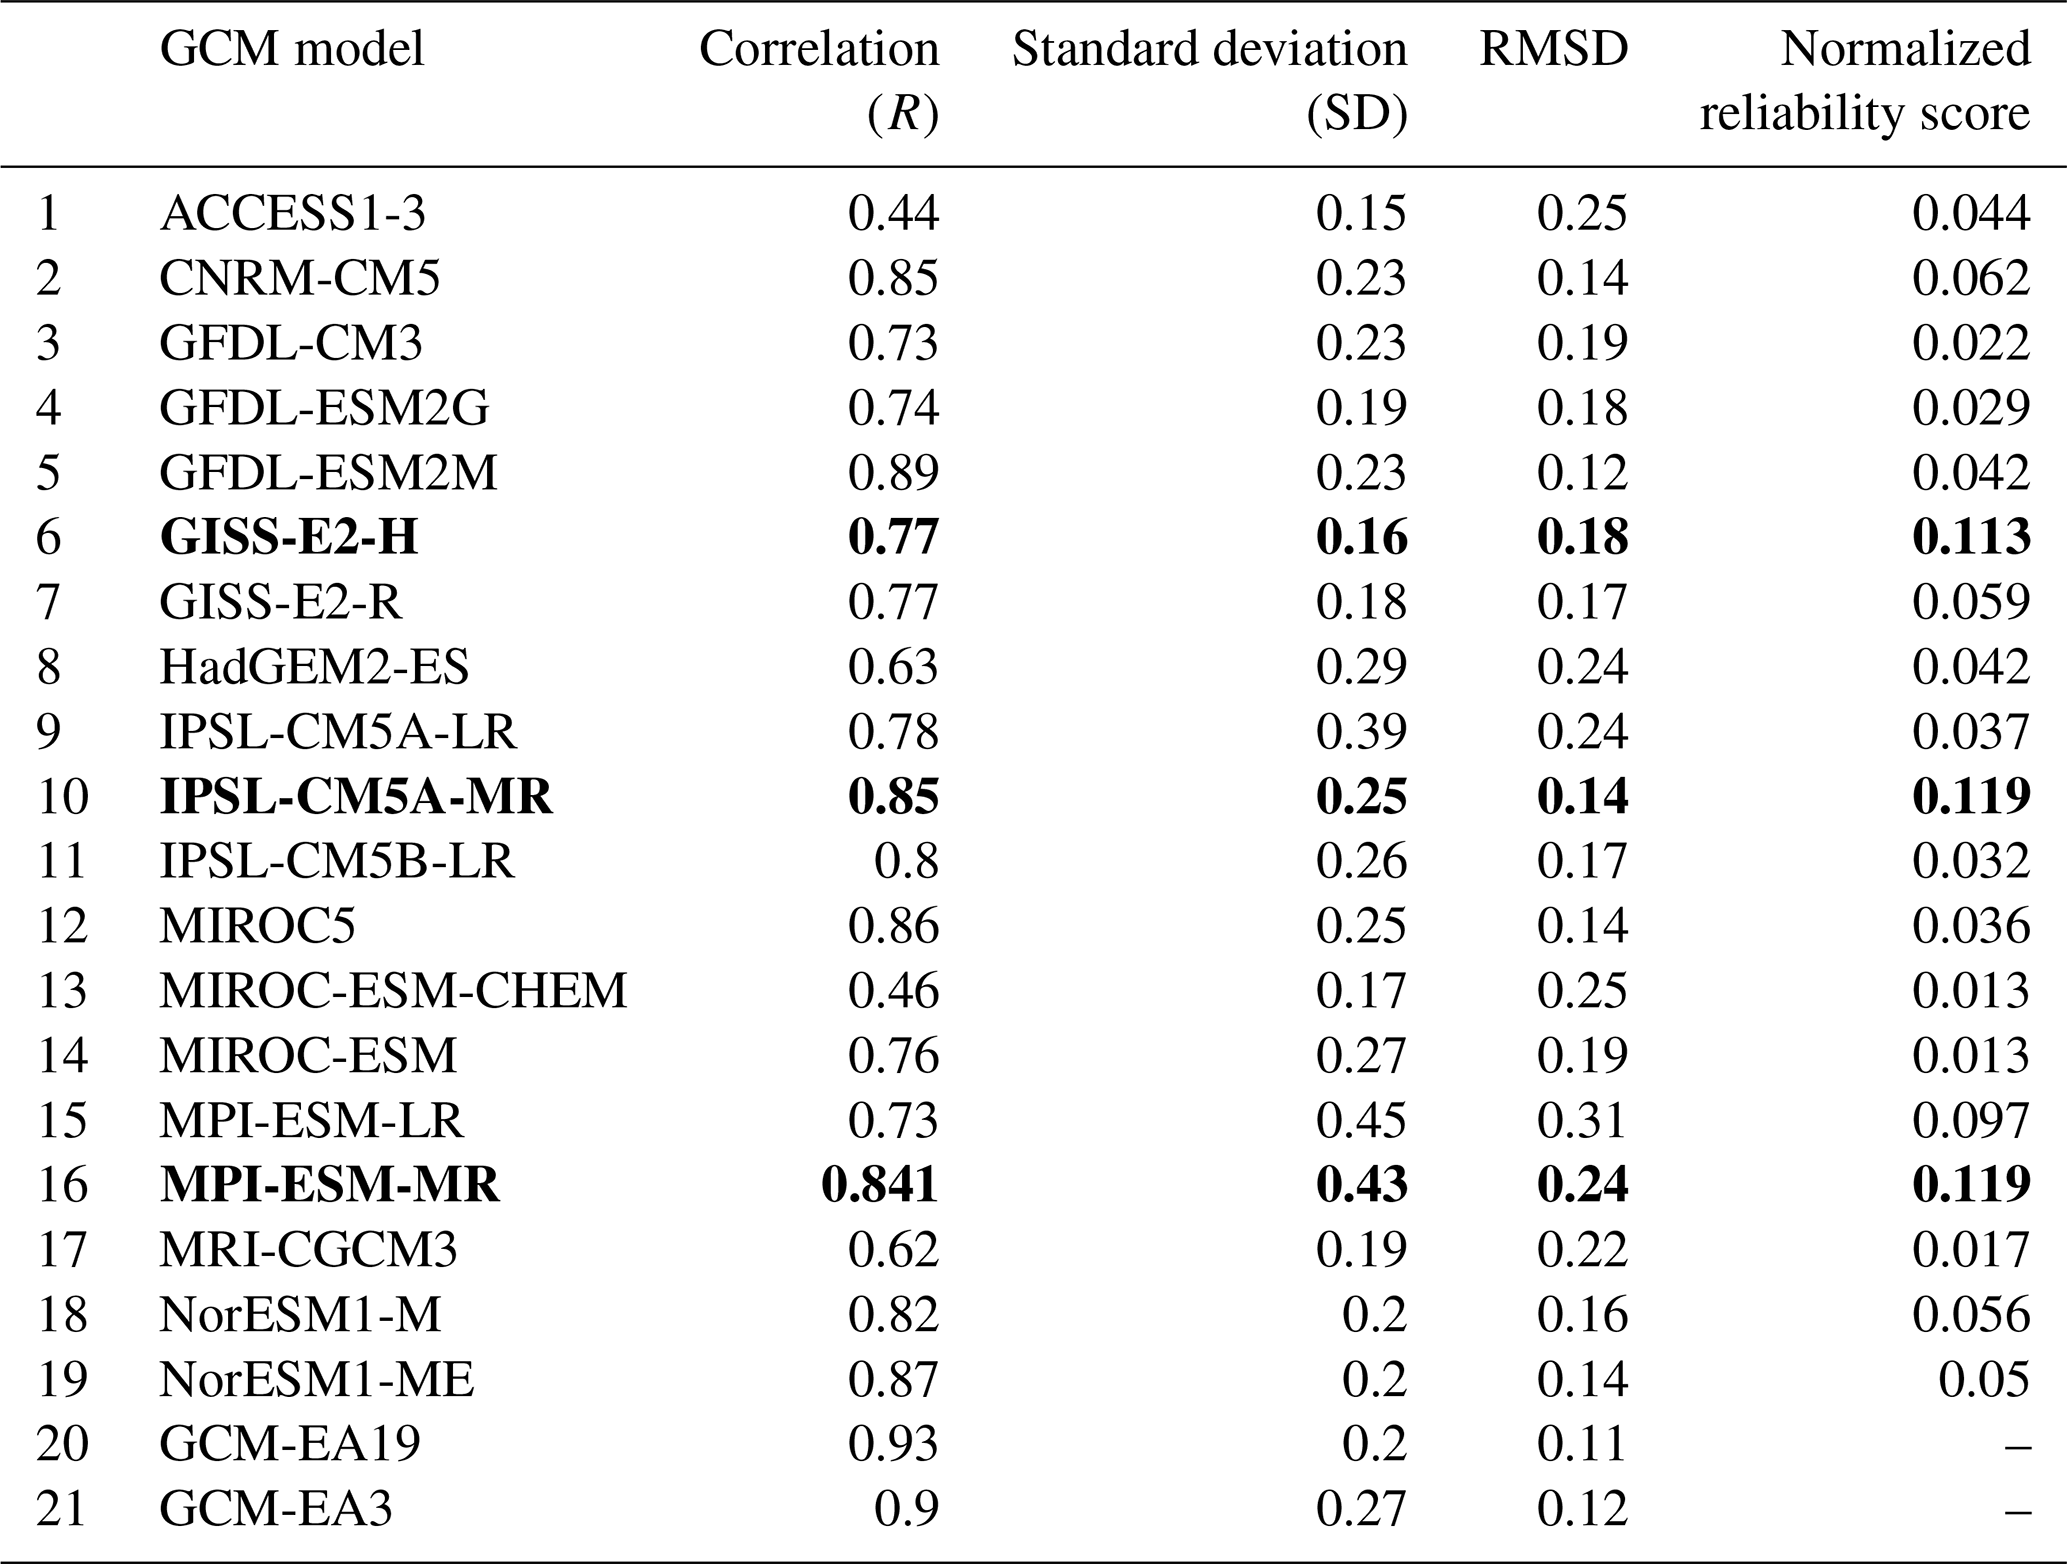
Due to the high computational cost of dynamical downscaling progress using the GLARM, downscaling all GCMs is not feasible at this time. A subset of GCMs is selected based on the performance in simulating mean surface air temperature over NA. Among the 19 GCMs, IPSL-CM5A-MR, MPI-ECM-MR, and GISS-E2-H received the highest reliability scores (Table 2). To validate the GCM selections, we show that our selected three-model ensemble average (GCM-EA3) (1) outperformed the 19 individual CMIP5 GCMs and (2) was comparable to, if not better than, the 19-model ensemble average (GCM-EA19) in 3 performance metrics including correlation coefficient (R), centered root-mean-square deviation (RMSD) and standard deviation (SD) as depicted in the Taylor diagram (Fig. 2a).
These performance metrics are calculated for the 10-year moving average of surface air temperature over NA to evaluate GCMs capability of capturing the decadal variation. The scores from the metrics for the 19 GCMs span a wide range of values (e.g., R, SD, and RMSD range from 0.45–0.93, 0.15–0.45 ∘C, and 0.11–0.33 ∘C, respectively). Both GCM-EA19 and GCM-EA3 show very similar performance with a smaller RMSD (0.11–0.12 ∘C) and higher correlation (0.90–0.93) than any single GCM, therefore highlighting the benefit of ensemble climate modeling. In addition,the GCM-EA3 standard deviation (0.27 ∘C) is closer to the observation (0.28 ∘C) compared to GCM-EA19 (0.21 ∘C), thereby providing us with some confidence in the choice of the three GCMs selected for dynamical downscaling.
In terms of observed warming, the 10-year moving average of annual air temperature for both GCM-EA19 and GCM-EA3 captures the observed trend, including the rapid warming after the 1980s. Additionally, GCM-EA3 tracks the historical temperatures significantly better than GCM-EA19 (Fig. 2b). The temperatures projected from GCM-EA3 and GCM-EA19 remain similar to the observations, however, after 1930 GCM-EA19 deviates and maintains a nearly constant cold bias of 0.4 ∘C. In contrast, GCM-EA3 closely follows the observed trend and magnitude yielding a mean bias of −0.06 ∘C, further confirming our selection of the three models.
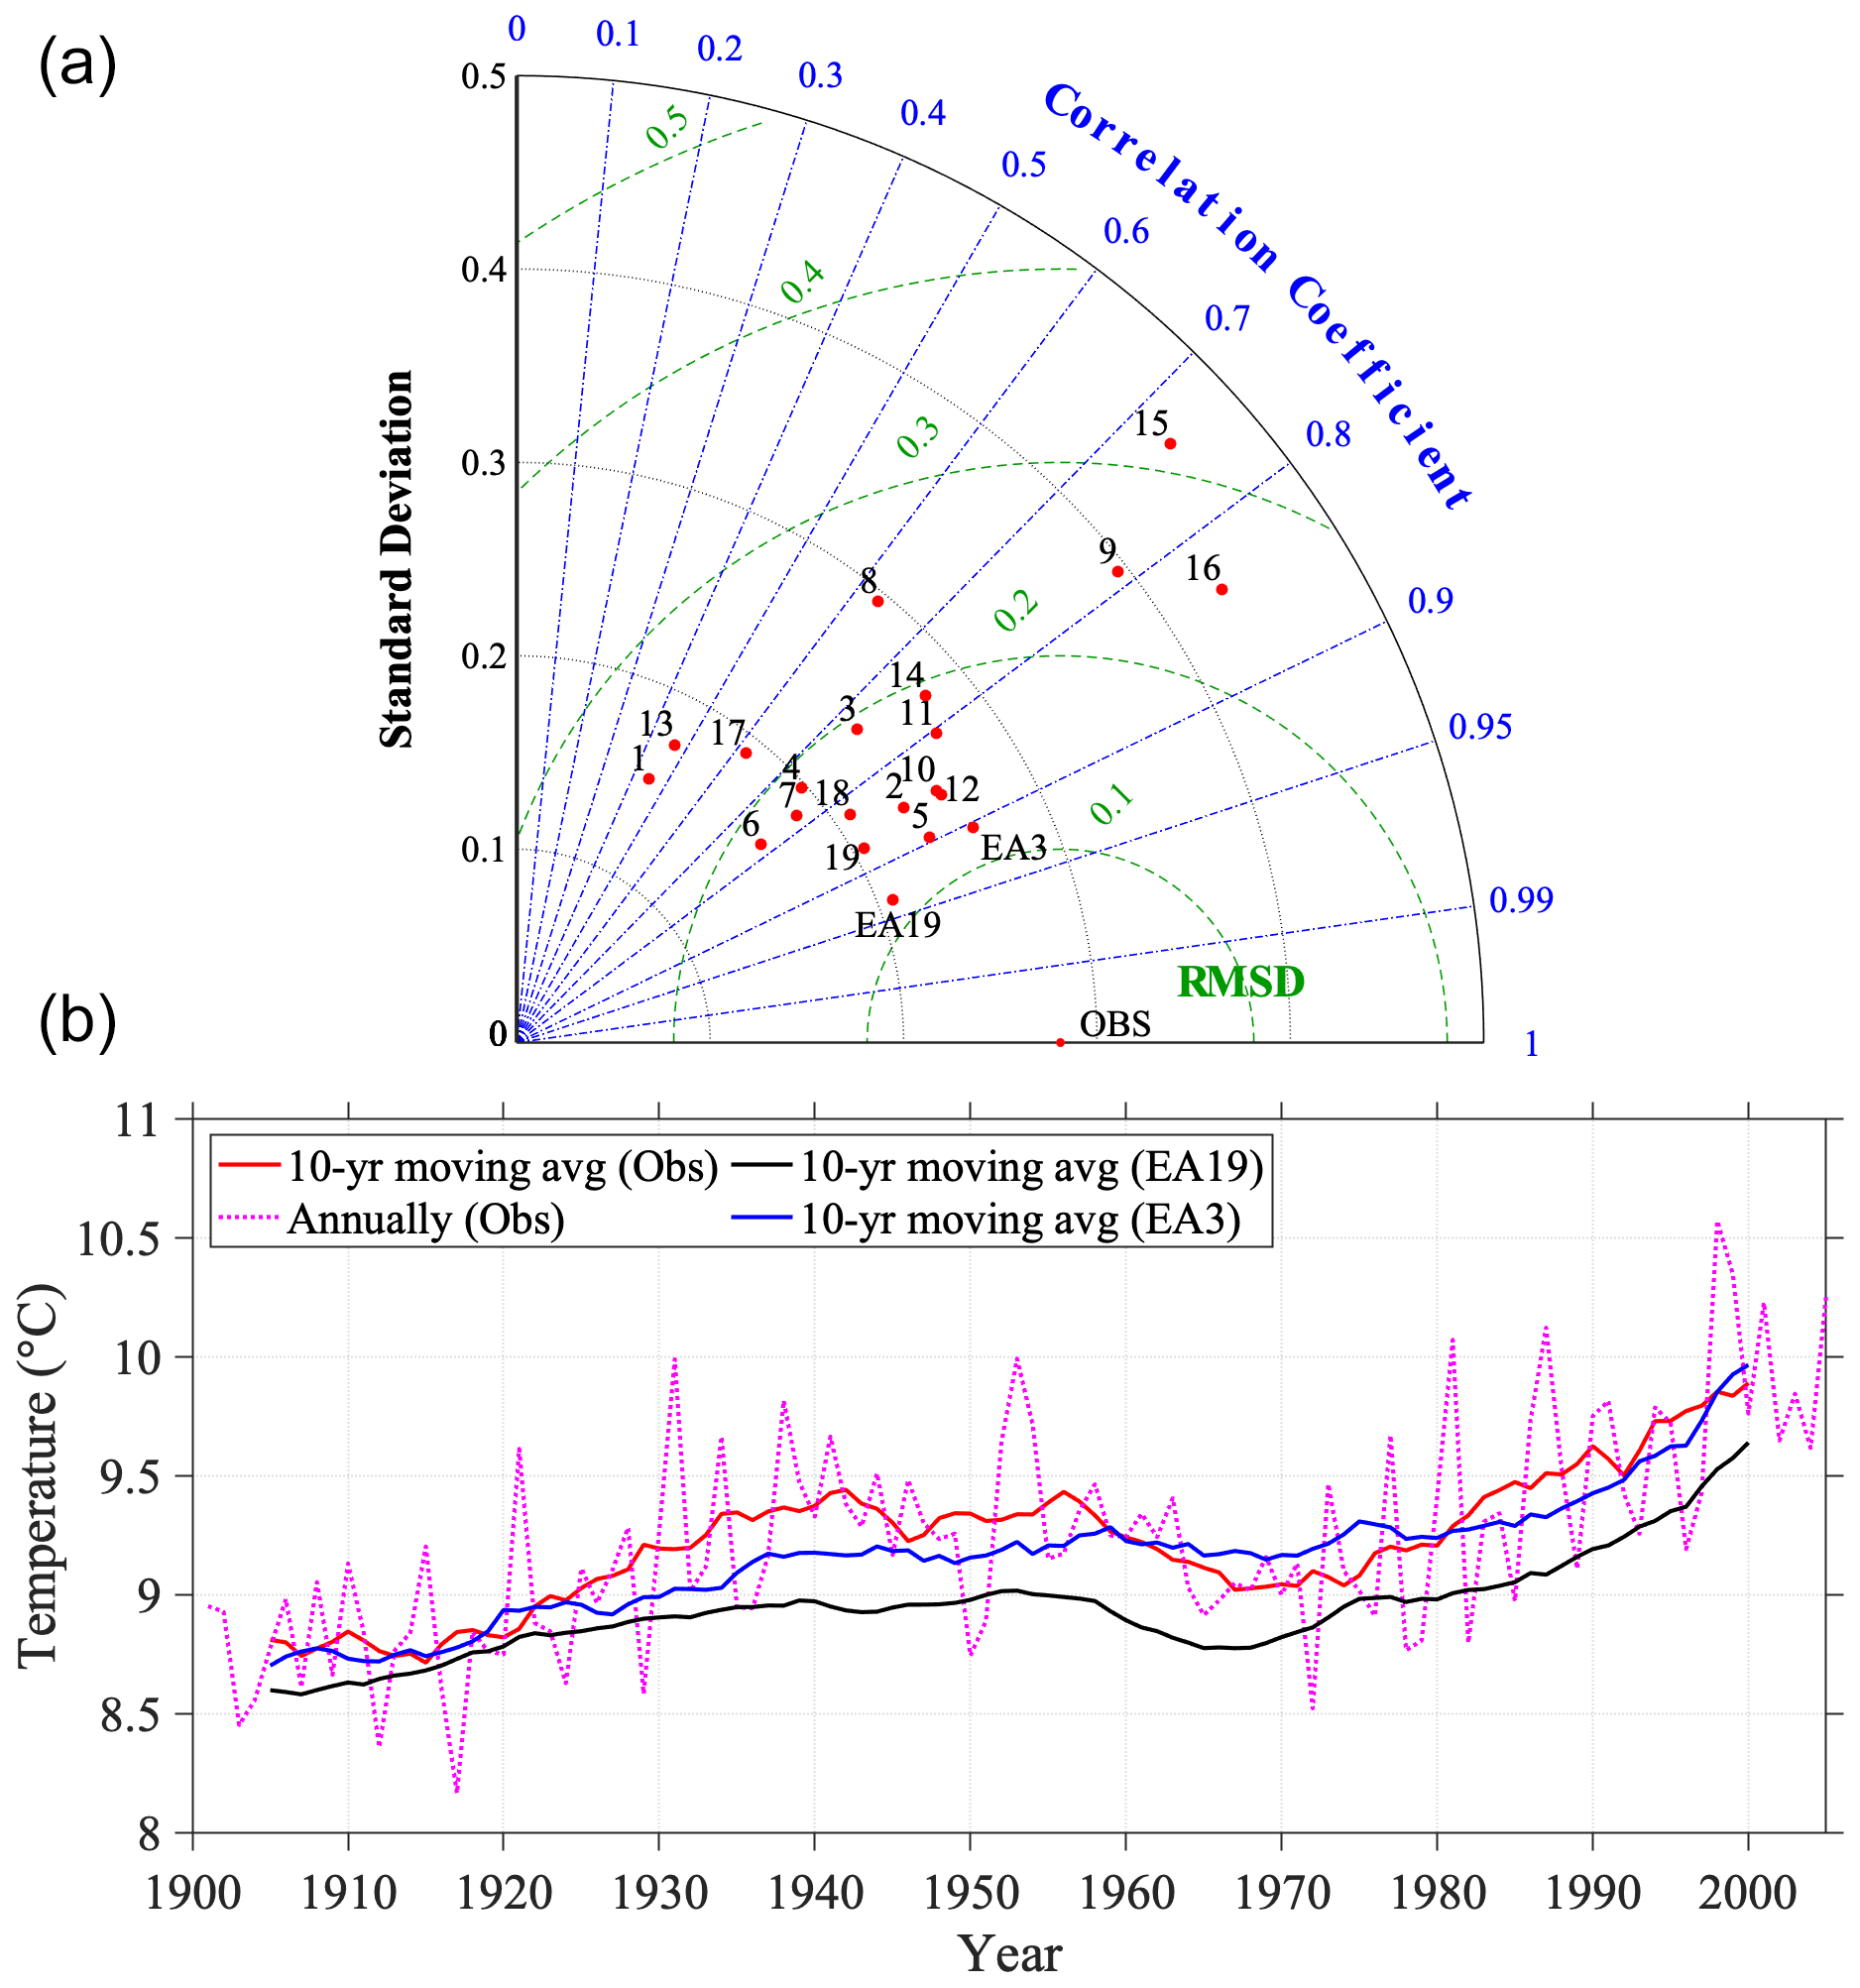
Figure 2(a) Taylor diagram for 19 individual GCMs, ensemble average of 19 GCMs (EA19), and ensemble average (EA3) of the 3 selected GCMs (IPSL-CM5A-MR, MPI-ECM-MR, and GISS-E2-H) for the 10-year moving average of surface air temperature simulation for the period of 1901–2005 over the majority of North America. (b) Annual surface air temperature (pink) of CRU data, its 10-year moving average for the period of 1901–2005 for CRU (red) in comparison to the model results of EA3 (blue) and EA19 (black).
Table 2GCMs performance metrics: R, SD, RMSD and model reliability score for decadal surface air temperature simulations over North America for the 19 individual GCMs, and GCM-EA19 and GCM-EA3. The selected GCMs to force GLARM are highlighted in bold.
3.2 Dynamical downscaling using GLARM
Before analyzing the climate change projections, we first verify how well GLARM simulates the present-day (2000–2019) surface air temperature, precipitation, lake surface temperature, and ice cover forced by the selected three GCMs (IPSL-CM5A-MR, MPI-ECM-MR, and GISS-E2-H). The ensemble average of the three-member projections is hereafter referred to as GLARM-EA3.
3.2.1 Present-day climate
The GLARM simulations better reproduce the historical air temperature and precipitation over the Great Lakes basin compared to the selected three GCMs (Fig. 3). Both GCM-EA3 and GLARM-EA3 reproduce the spatial pattern of observed air temperature well, with model-data pattern correlations of 0.987 and 0.973, respectively (Fig. 3). However, over the Great Lakes basin, GLARM-EA3 has a considerably smaller bias (−0.19 ∘C) than GCM-EA3 (0.94 ∘C). The warm bias produced by GCM-EA3 for the northern parts of the basin is notably reduced in GLARM-EA3 (Fig. 3c1, c2). It should be noted that the CRU data inaccurately represents air temperature over the lakes since it is land station-based only. As all of the selected GCMs ignore or only provide crude representations of the Great Lakes (Fig. 3b2), the temperature patterns over land and lake are quite similar. Unlike the GCM-EA3 simulations, the GLARM-EA3 simulations manifest the lake influence on the over-lake air temperatures, reinforcing the importance of resolving two-way lake-atmosphere interactions (Fig. 3b1). The improvement from GLARM-EA3 is also evident with the monthly surface air temperature over land, where the bias of GCM-EA3 during January–April and June–October is largely removed by GLARM-EA3 (Fig. 3a2).
The added value of the GLARM simulations is also evident in the monthly precipitation. Compared to GCM-EA3, the GLARM-EA3 simulation better represents the CRU observations in nearly every month of the year, and significantly reduces the large wet biases from January to August (Fig. 3d2). The mean bias of GLARM-EA3 is 0.15 mm d−1 as opposed to 0.35 mm d−1 with GCM-EA3. Spatially, GCM-EA3 overestimates precipitation over the entire basin (Fig. 3e2) whereas GLARM-EA3 simulates moderate dry bias in the northeast region and wet bias in the southwest region (Fig. 3d1, e1), leading to a better basin-wide average. The wet biases from GCM-EA3 near Lakes Huron, Erie and Ontario are noticeably reduced by GLARM-EA3 (Fig. 3f1, f2).
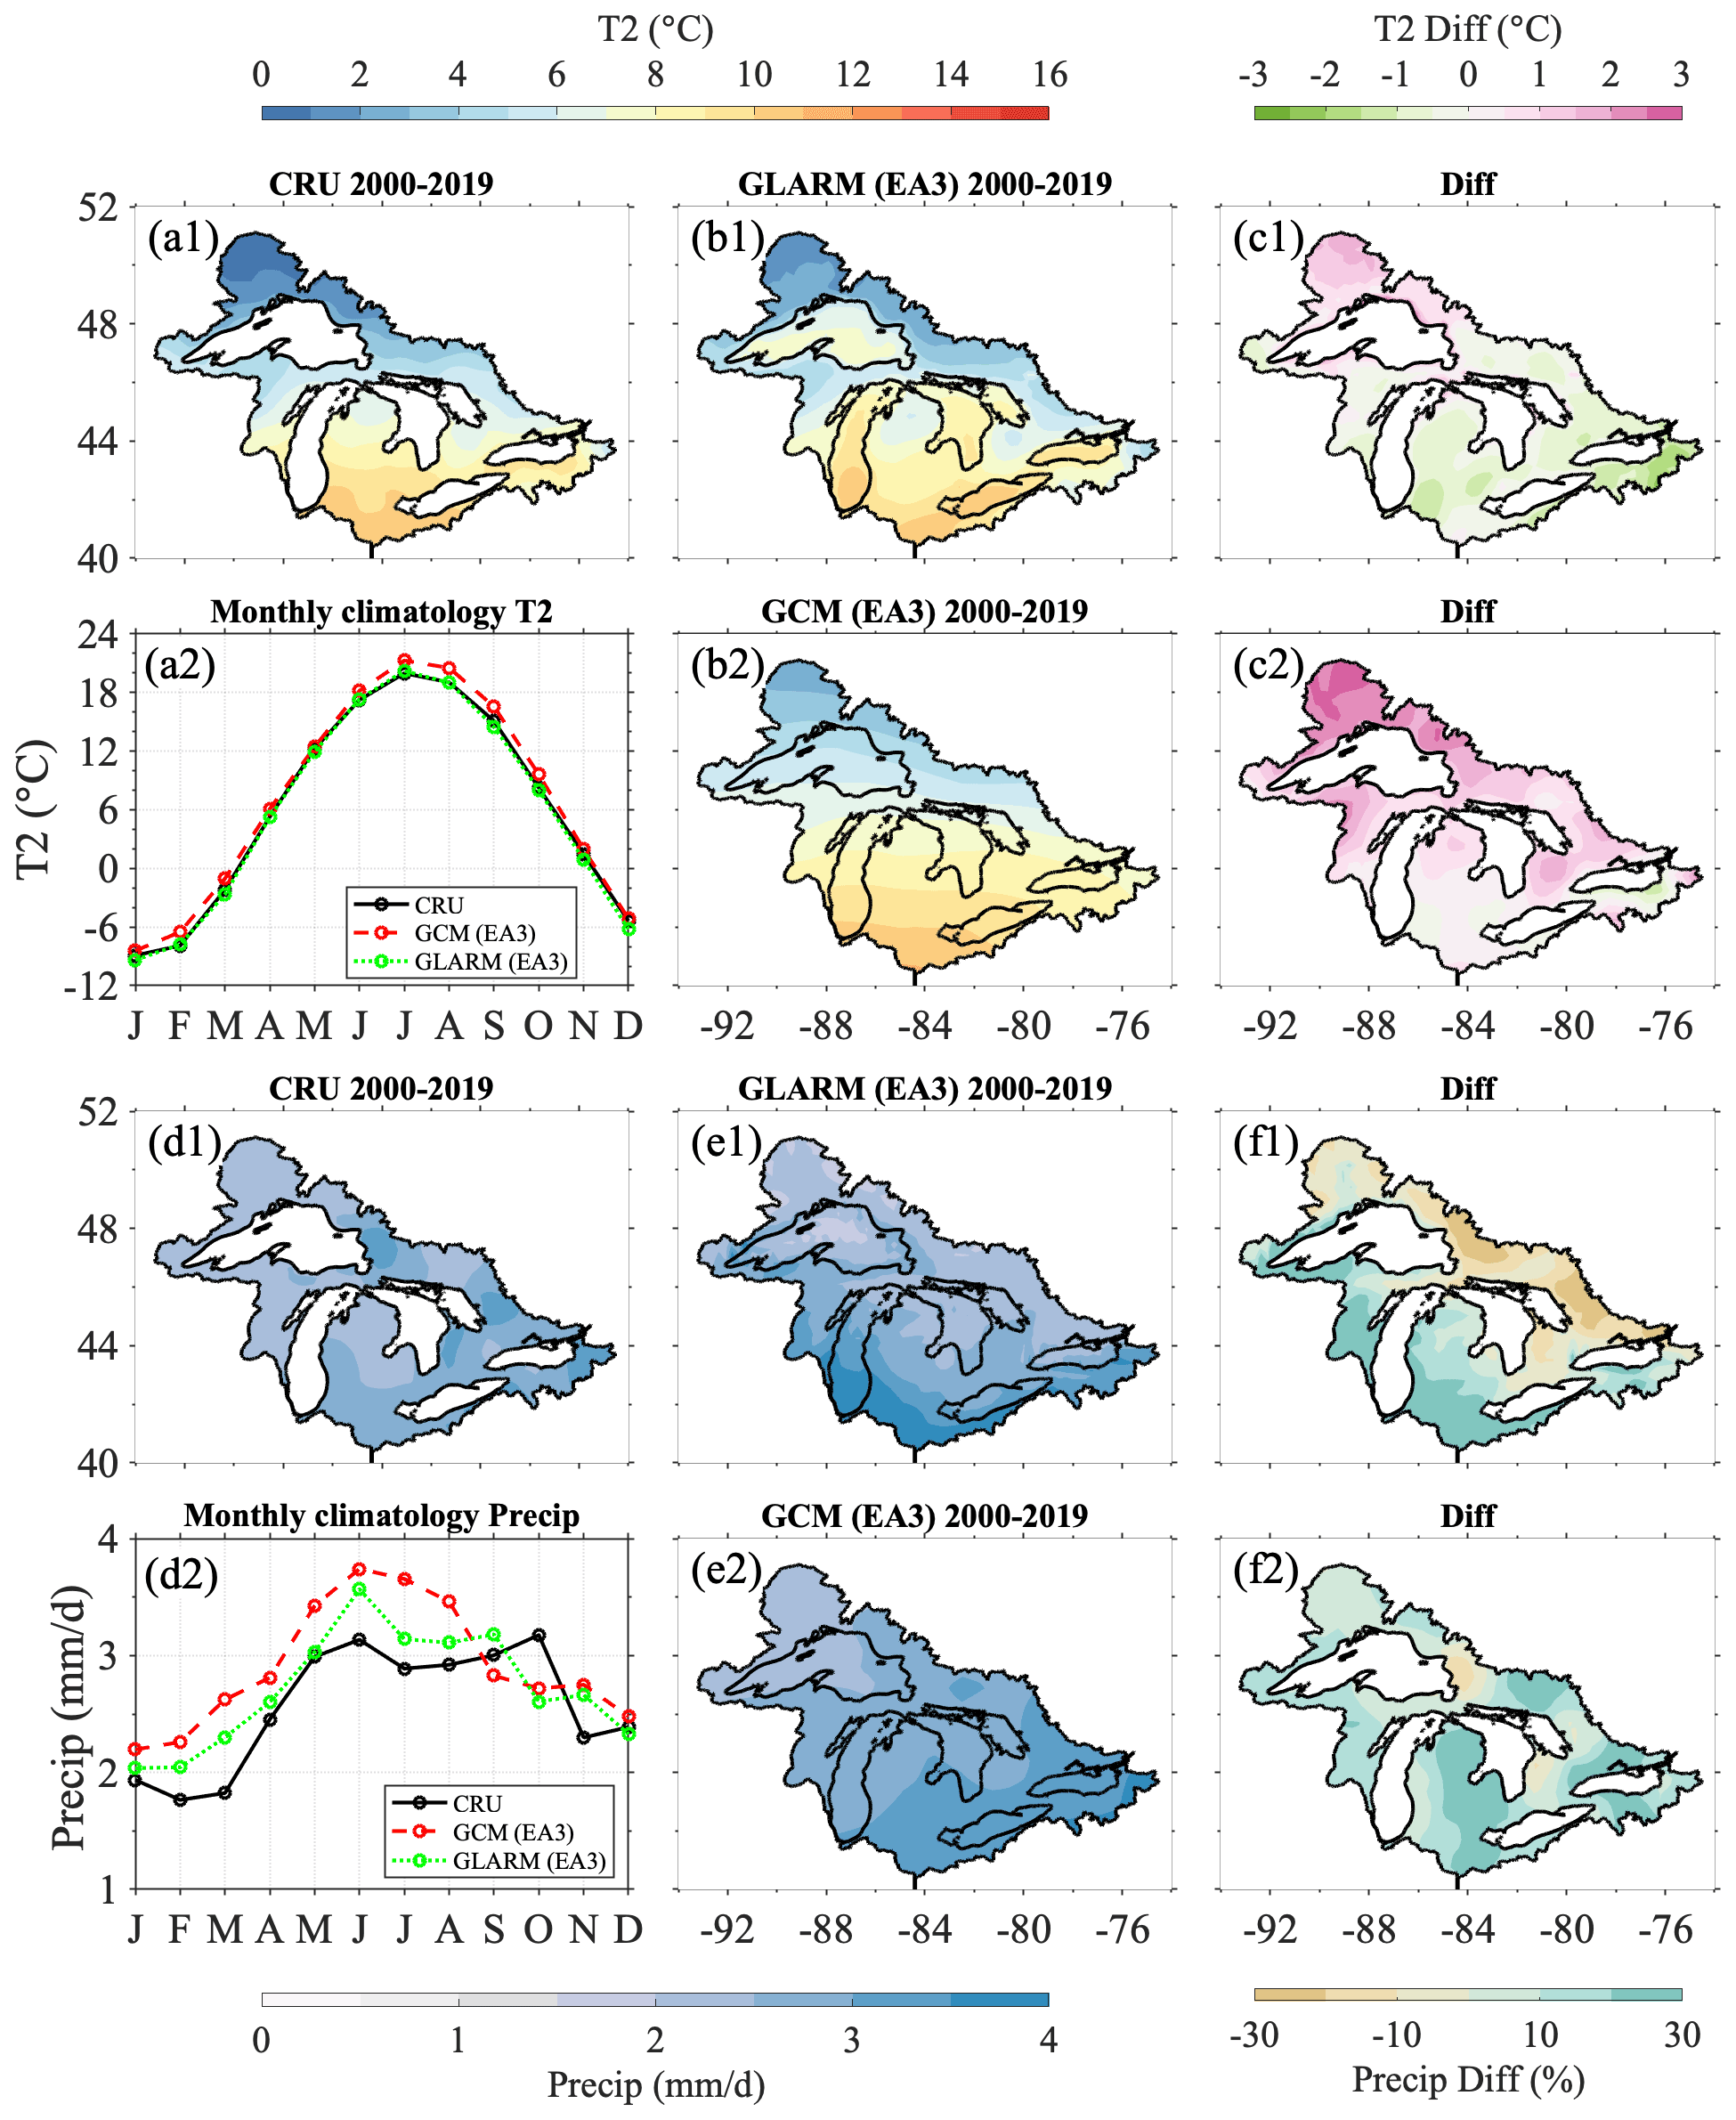
Figure 3Climatology of surface air temperature (a1–c2) and precipitation (d1–f2) over the Great Lakes basin (2000–2019) from the GLARM-EA3 simulation and GCM-EA3 simulation and their biases (model minus observations) relative to CRU land-based observations. Panels (a2) and (d2) show the monthly climatology of surface air temperature and precipitation over the land, respectively.
Within the Great Lakes, LST and ice cover are the two most important physical lake variables that influence the lake-atmosphere heat and water fluxes by affecting solar radiation, longwave radiation, sensible and latent (evaporation) heat. Since the selected GCMs provide little or no representation of the lakes, these variables from the GCMs are not included in the analysis. GLARM-EA3 and GLSEA LSTs show close agreement with each other. LSTs vary significantly across the five lakes due to their immense surface area, large geographic extent, and varying water depth. This spatial heterogeneity across the lakes is primarily along the meridional direction, resulting in earlier warming in the southern lakes (Fig. 4a, b, c). Temperature variations are the strongest during summertime when the northernmost, large, deep Lake Superior (average depth 147 m) maintains a much cooler temperature of 12–16 ∘C than the temperature of 22–24 ∘C in the southernmost, small, shallow Lake Erie (average depth of 19 m). Additionally, GLARM-EA3 well captures the spatial heterogeneity within each lake. For example, GLARM reproduces the warmer eastern basin of Lake Superior during wintertime, the north-south temperature difference in Lakes Huron-Michigan during summertime, and the east-west thermal gradient in Lakes Ontario and Erie during fall.
In addition to resolving the spatial variability of climatological LST for each season, GLARM-EA3 performs well in reproducing the GLSEA lake-wide average LSTs (Fig. 5a1–e1). The GLARM-EA3 simulated LSTs show close agreement with the GLSEA in both phase and magnitude for the five lakes. For example, the spring-early summer warming rate and the summer peaks are well-reproduced by GLARM-EA3, which are often not well-resolved in previous studies using 1D lake models coupled with RCMs (Bennington et al., 2014; Notaro et al., 2015). While GLARM-EA3 generally closely tracks GLSEA LST across the lakes, relatively large biases are simulated in the warming period in Lake Superior (June, July) and summertime (July–September) in Lake Ontario.
Although progress in ice modeling has been made, substantial challenges remain and, as a result, larger biases than simulated LSTs typically exist (Fujisaki et al., 2012, 2013; Anderson et al., 2018). GLARM-EA3 captures the spatial variability of ice cover, with higher and lower ice coverage in shallow coastal and deep offshore regions, respectively (Fig. 4e1, e2). GLARM-EA3 tends to overestimate the magnitude of ice coverage during the ice growth period and underestimate the ice coverage during the ice melting period in all lakes (Fig. 5a2–e2). The shallowest lake, Lake Erie, is characterized by the highest ice coverage. GLARM-EA3 overestimates the Lake Erie ice cover by 25 % in January. For the deepest lake, Lake Superior, GLARM-EA3 does not capture the highest ice coverage observed in March. Instead, it simulates a decrease in ice cover from February to March resulting in a 10 % underestimate in ice cover in March.
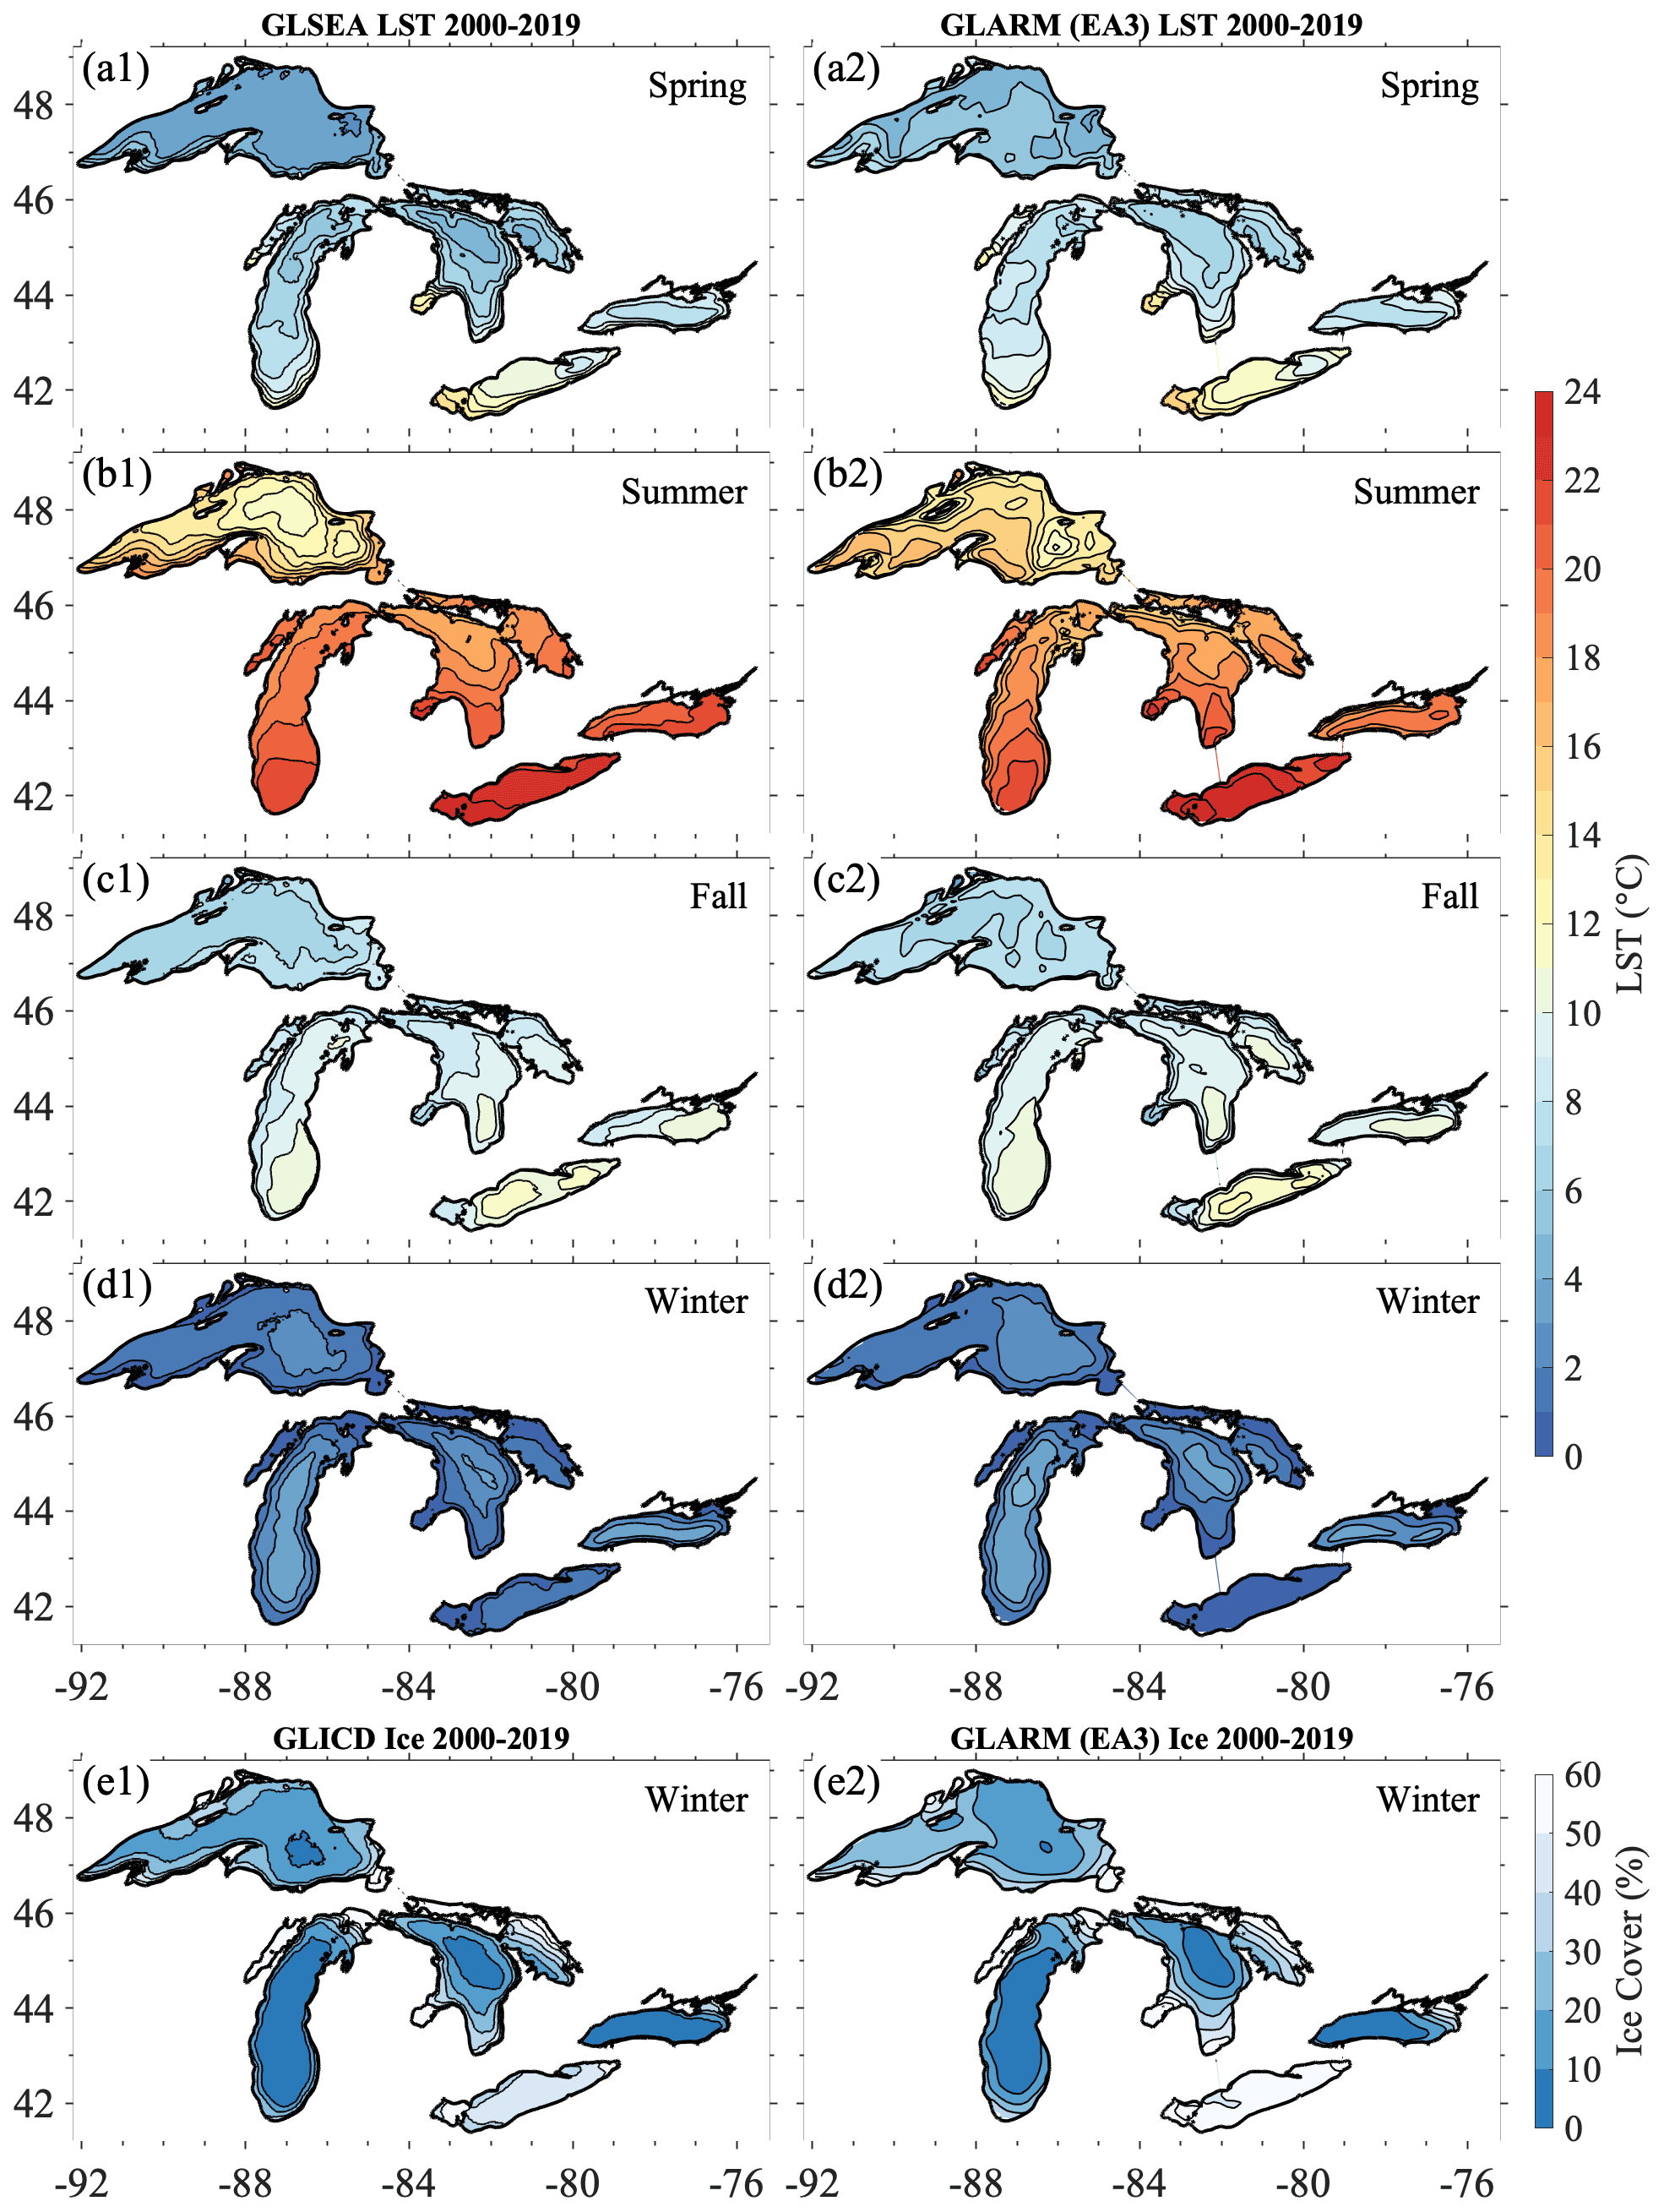
Figure 4LST seasonal climatologies (2000–2019) during (a1, a2) spring (April–June, AMJ), (b1, b2) summer (July–September, JAS), (c1, c2) fall (October–December, OND), and (d1, d2) winter (January–March, JFM), and the winter ice cover climatologies (e1, e2). The winter LSTs are the average for the whole lakes (including regions with snow, ice, and open water). The GLSEA LST and GLICD ice cover are shown on the left panels; the GLARM-EA3 simulations are shown on the right panels.
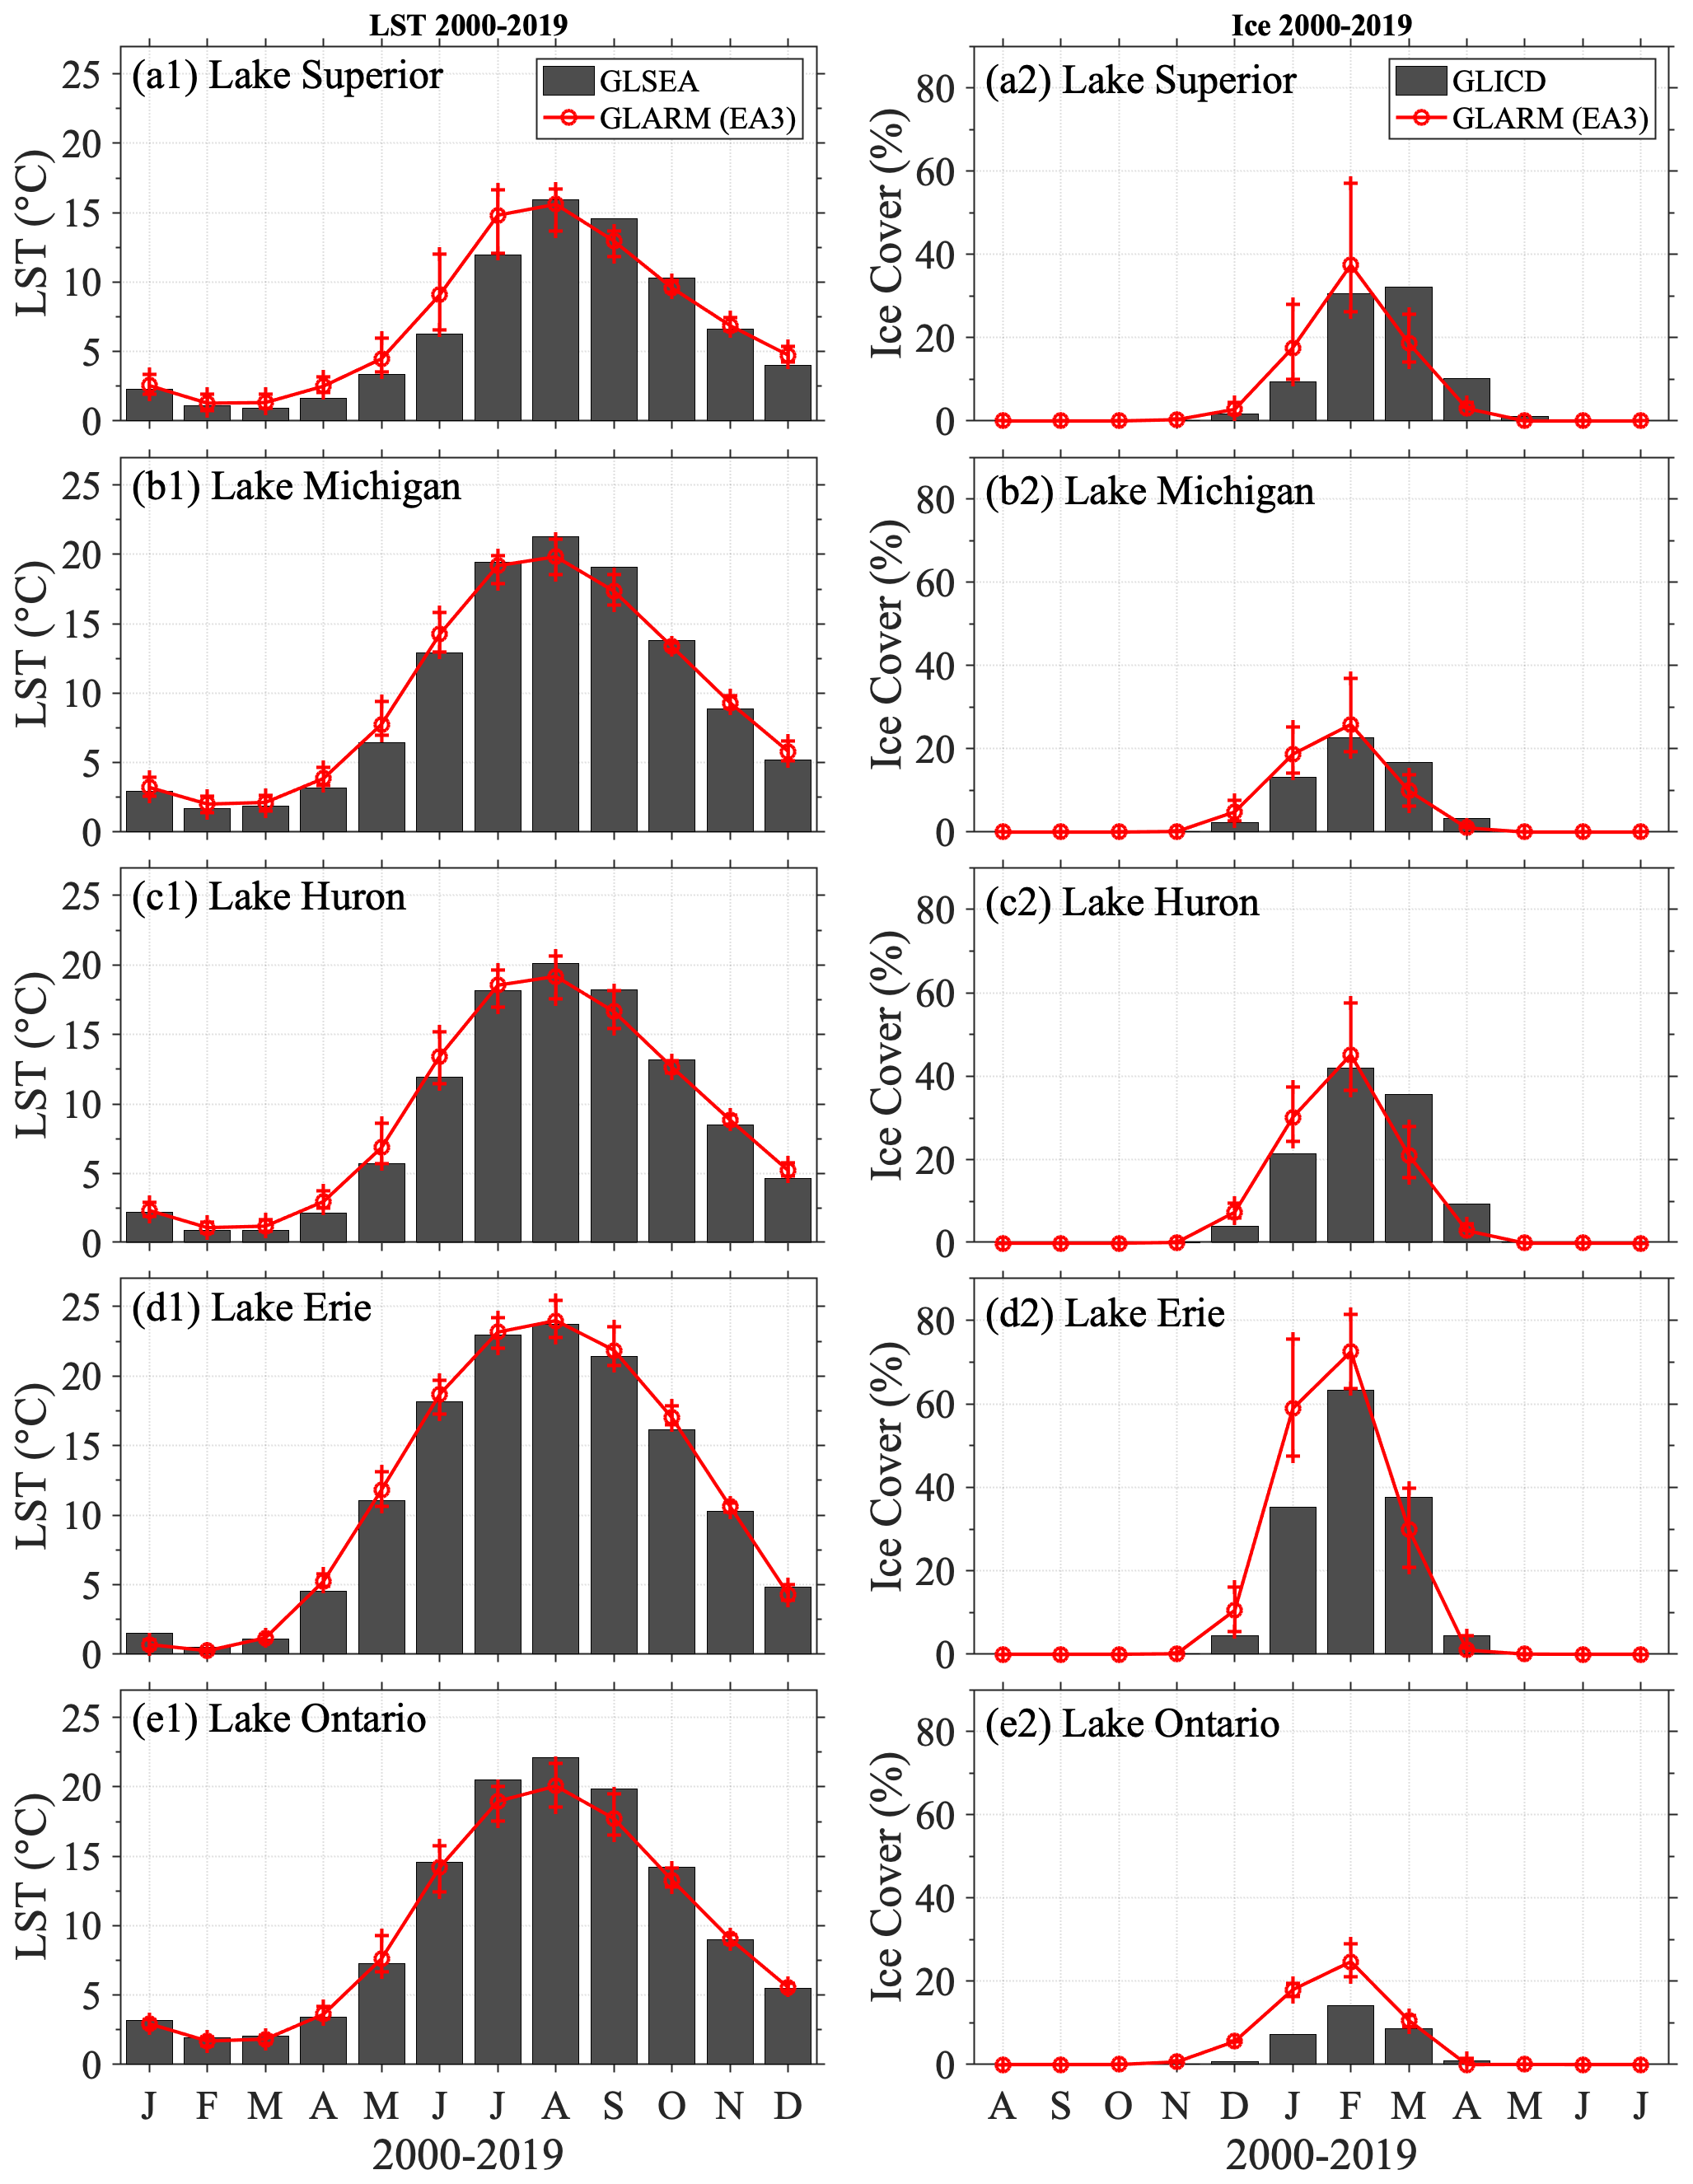
Figure 5Monthly climatologies (2000–2019) of LST (left panels) and monthly mean ice cover (right panels) in the five Great Lakes. The GLSEA LST and GLICD ice cover are shown as bar plots, and the GLARM-EA3 simulations are shown as red lines. The red error bars indicate the range of the three individual GLARM simulations.
3.2.2 Projected climate change
Surface air temperature
Given the reliable performance of GLARM-EA3 in reproducing the present-day climate, we have increased confidence that GLARM is capable of making meaningful and improved scenario-based projections of future climate changes. Here, we consider the RCP 4.5 and RCP 8.5 scenarios for the mid-century (2030–2049) and late century (2080–2099) relative to the early 21st century (2000–2019). In the mid-century, the projected warming over the Great Lakes basin from the two RCP scenarios is relatively similar compared to that in the late century, consistent with the recent IPCC (2013, 2021) reports. The annual surface air temperature increases on average by 1.3 ∘C in RCP 4.5 with a range of 0.8– 1.8 ∘C in 3 individual projections, and 1.7 ∘C in RCP 8.5 with a range of 1.3–2.1 ∘C (Fig. 6a, c). The late century projected warming is more pronounced, with 2.3 ∘C (1.8–2.7 ∘C) warming in RCP 4.5 and 4.4 ∘C (4.1–5.0 ∘C) in RCP 8.5 (Fig. 6b, d). Spatially, all projections show a relatively higher increase of 0.1–0.5 ∘C in the surface air temperature over land than over lake depending on the scenario and time frame considered, revealing the buffering effect of the lake. Such over-lake and over-land temperature differences are most noticeable (4.2 vs. 4.5 ∘C) in the end of the century in the RCP 8.5 scenario. In the mid-century, larger uncertainty in the projected surface air temperature, indicated by the standard deviation of the ensemble projections, is evident in the northern region. In the late century projections, the lowest (highest) uncertainties are found in the eastern part of the Great Lakes in RCP 8.5 (RCP4.5) (Fig. S1 in the Supplement).
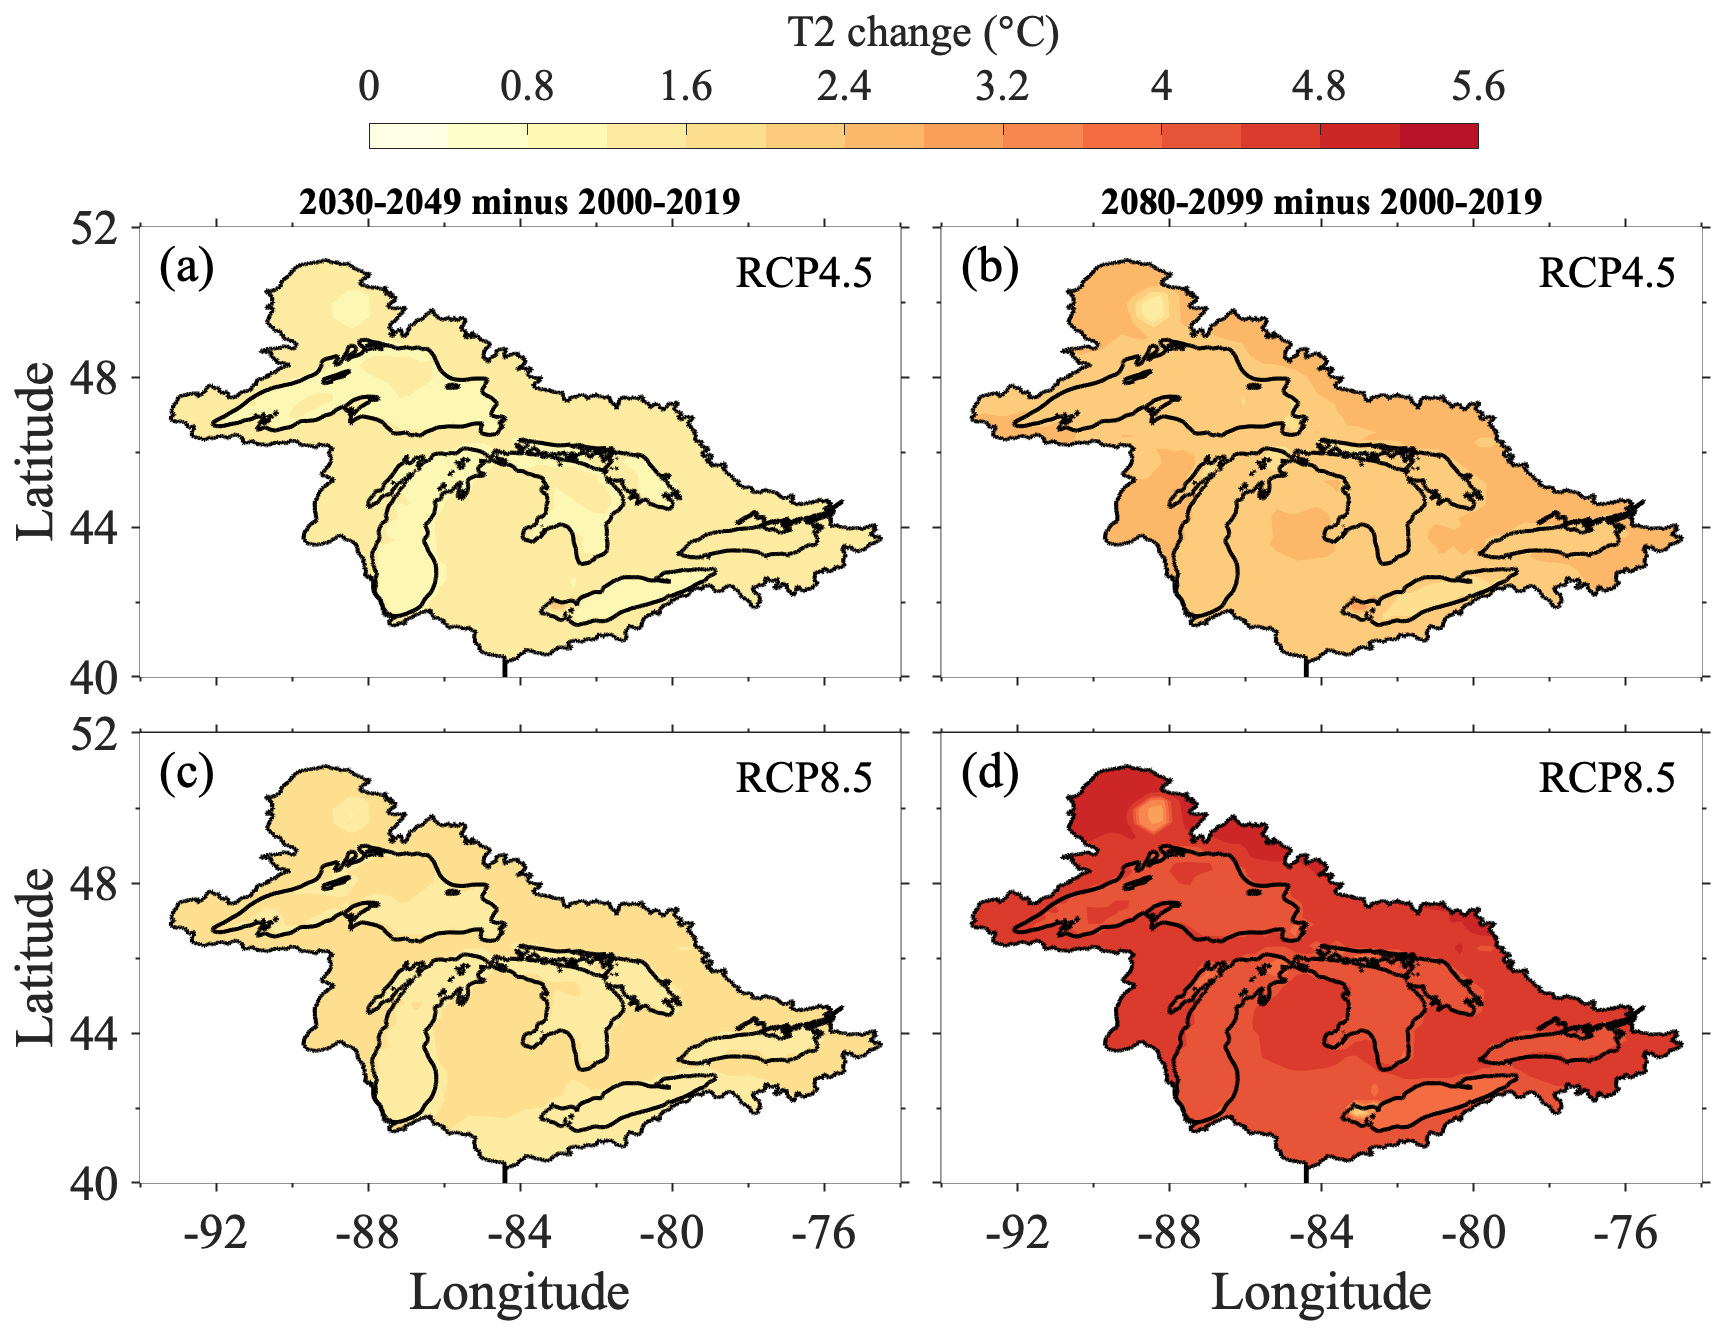
Figure 6Projected changes in the annual mean surface air temperature over the Great Lakes basin during the mid-century (2030–2049) and late century (2080–2099) for the RCP 4.5 (a, b) and RCP 8.5 (c, d) scenarios relative to the present-day climate (2000–2019).
When considering monthly changes for each scenario and period averaged over the Great Lakes basin, increases in surface air temperature are projected to be similar from April to October in each case (Fig. 7 and Table 3). More significant warming is projected during wintertime, which is particularly noticeable in the late century. A larger increase in temperature is projected for November and December for RCP 4.5 and December through March for RCP 8.5 in the mid-century. By the end of the century, the temperature increases most significantly from December through March in both scenarios. The largest variability between the models is during the colder seasons (October through April) with variations up to 2–3 ∘C relative to the GLARM-EA3 ensemble mean, except for the late century in the RCP 8.5 scenario when the largest uncertainties occur from July through October.
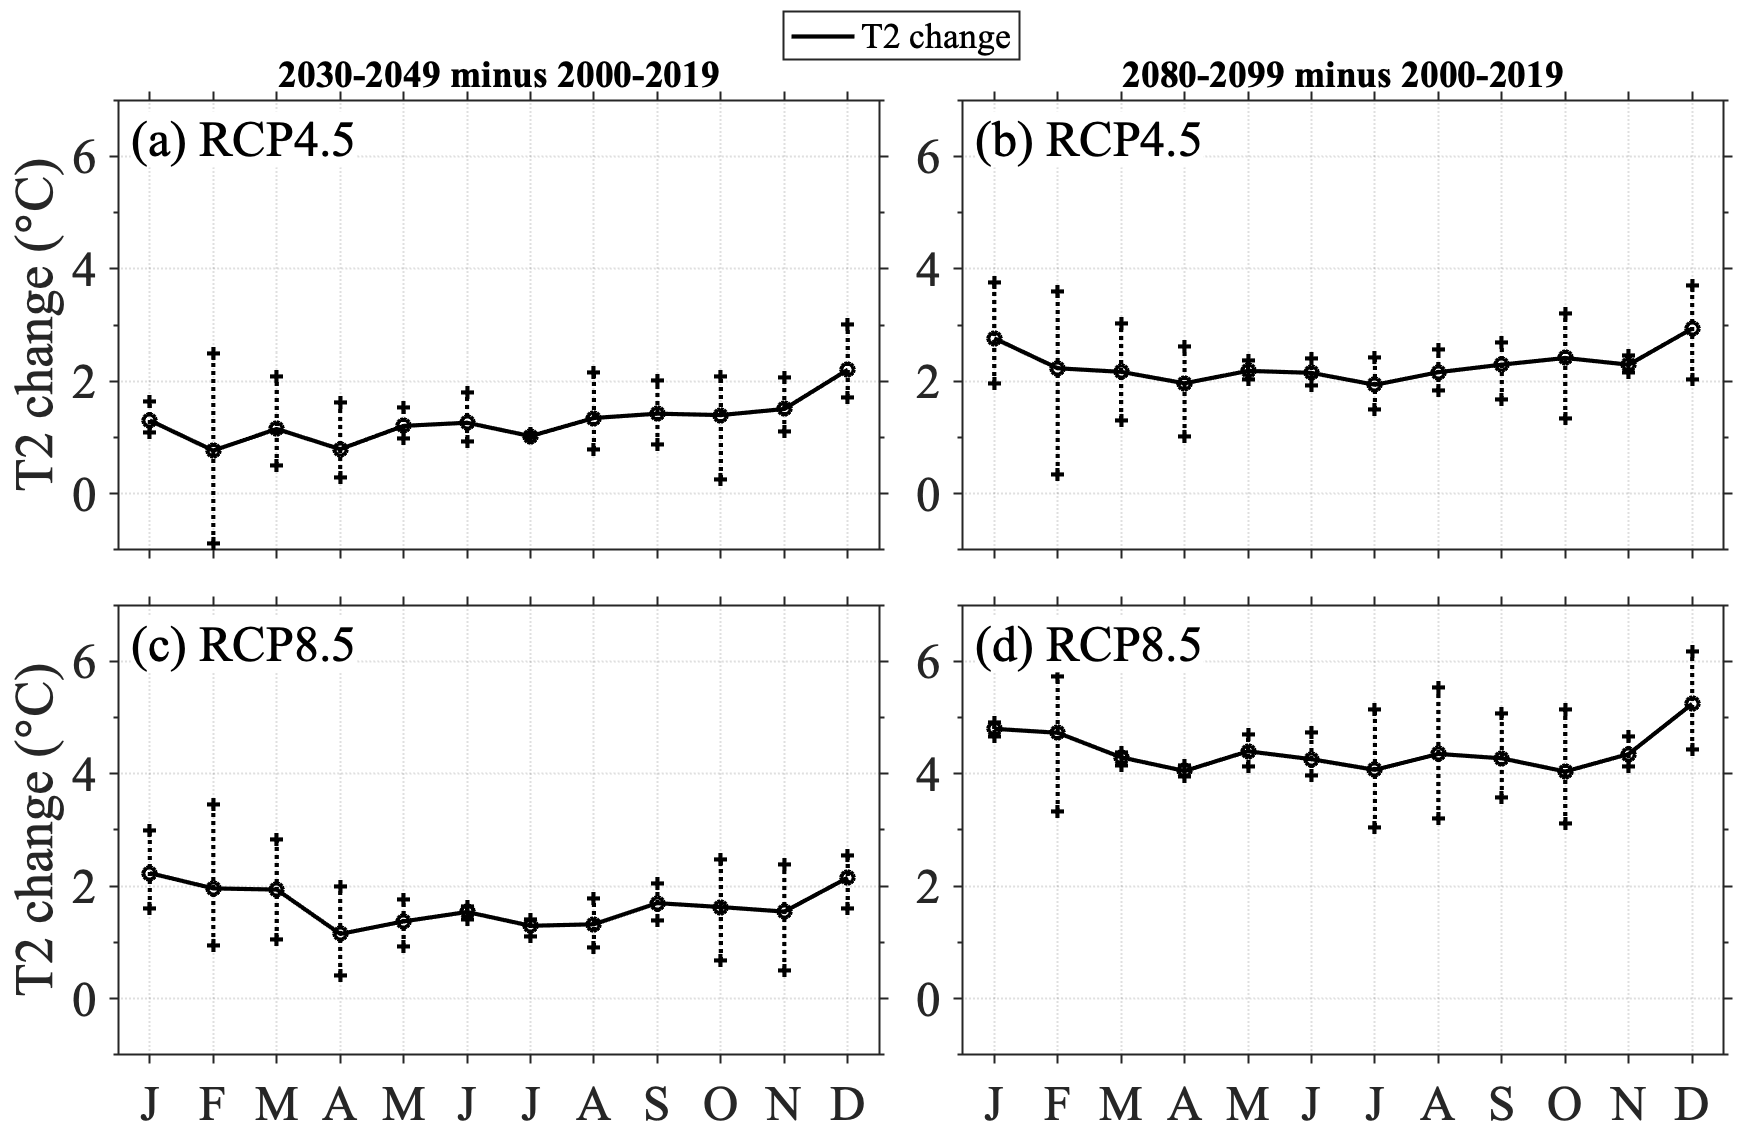
Figure 7Projected changes in monthly surface air temperature over the Great Lakes basin in the mid-century (2030–2049) and late century (2080–2099) for the RCP 4.5 (a, b) and RCP 8.5 (c, d) scenarios, relative to the present-day climate (2000–2019). Vertical error bars indicate the range of the three individual GLARM projections.
Table 3GLARM-EA3 projected changes in monthly, seasonal, and annual surface air temperature over land, lake, and the Great Lakes basin in the mid-century (2030–2049) and late century (2080–2099) for the RCP 4.5 and RCP 8.5 scenarios, relative to the present-day climate (2000–2019).
Precipitation
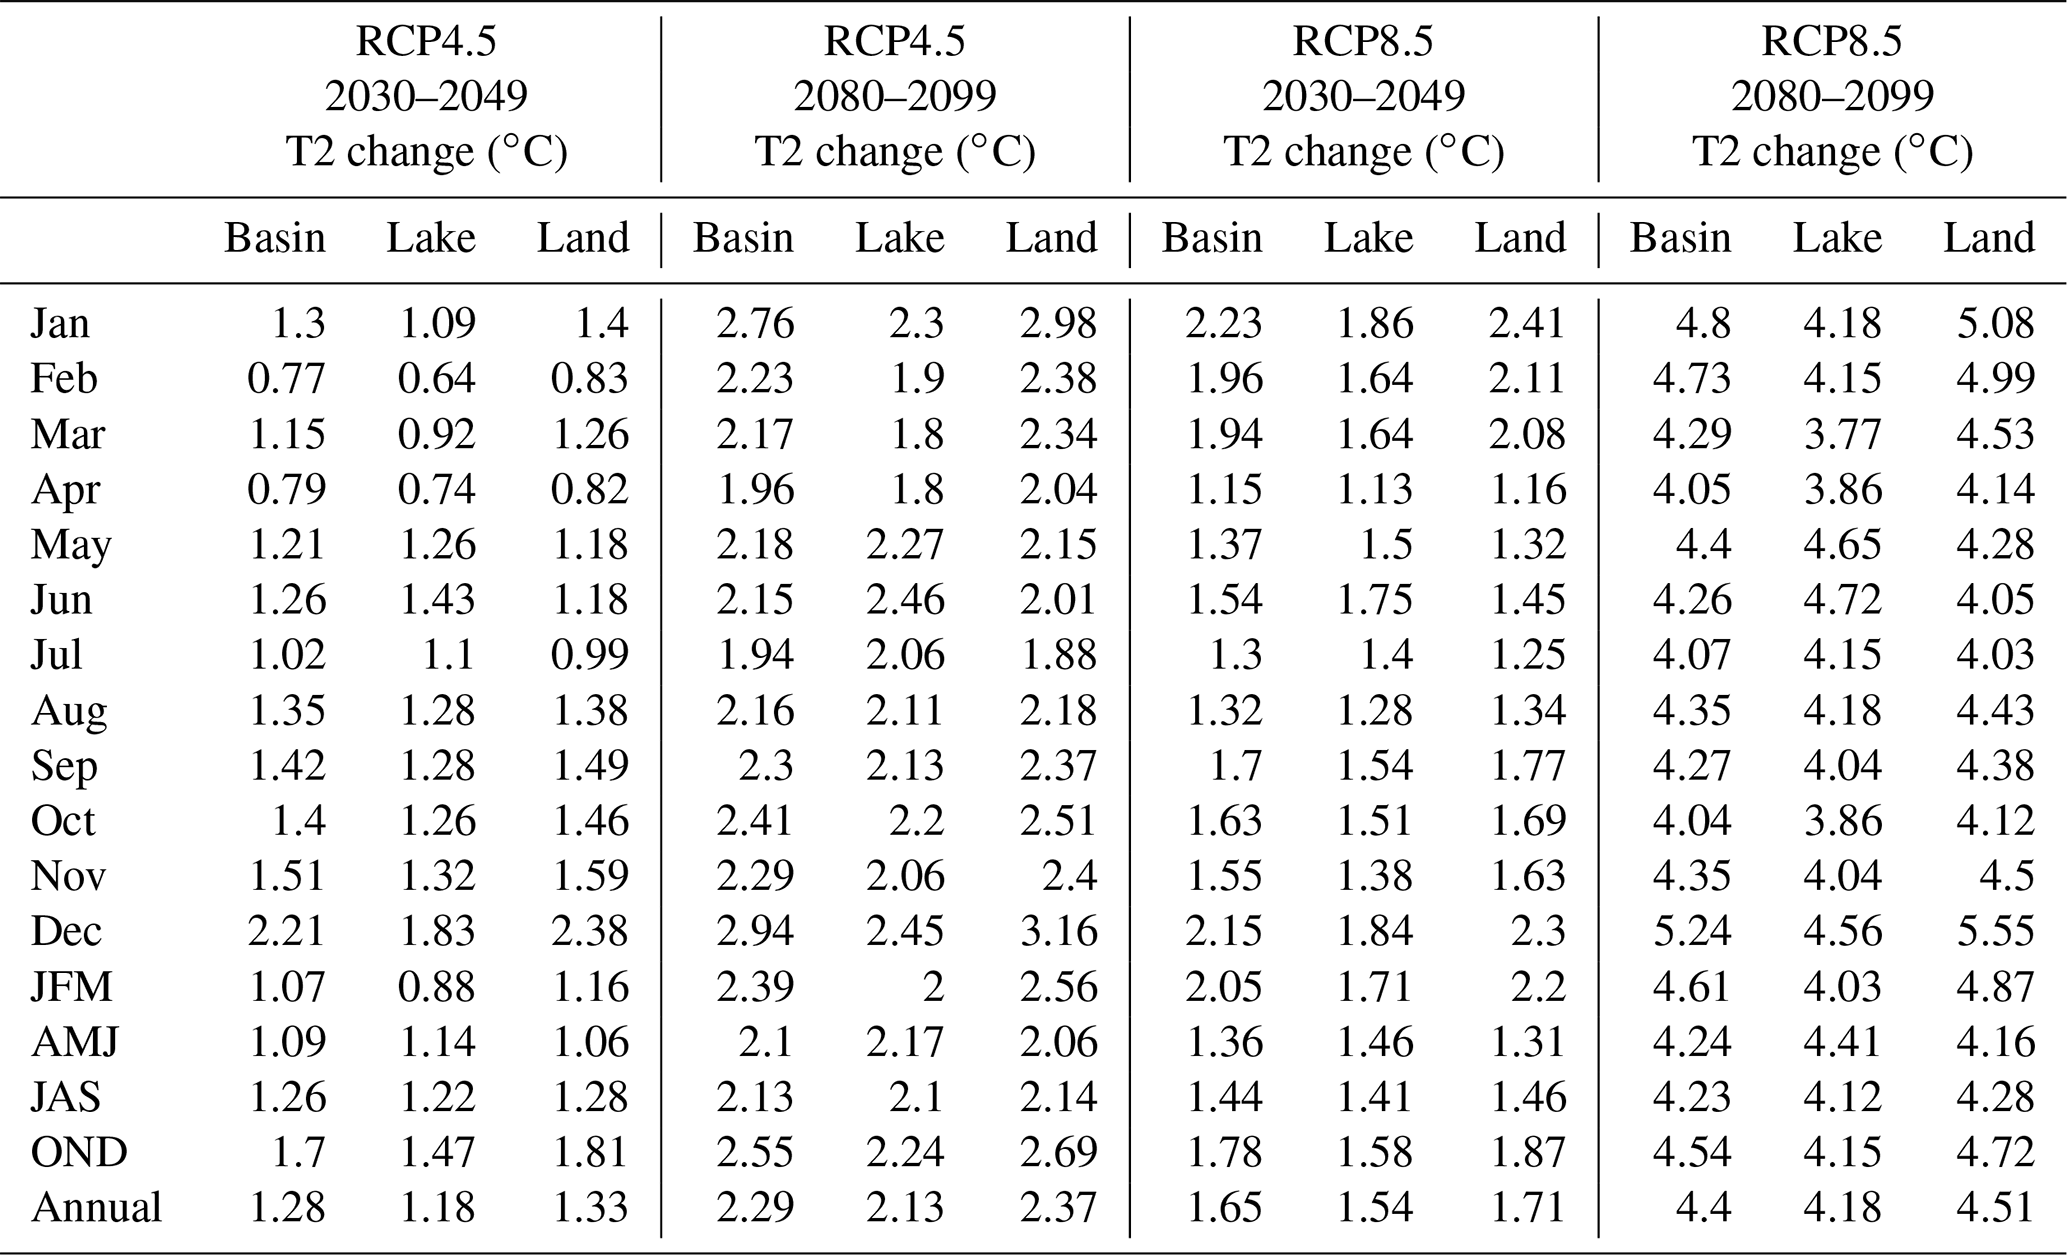
The enhanced warming due to increased atmospheric GHG emissions results in increased precipitation almost uniformly over the Great Lakes basin (Fig. 8 and Table 4). The projected mid-century increase in precipitation is similar in RCP 4.5 (6.5 %) and RCP 8.5 (5.6 %) with relatively similar atmospheric GHG concentrations over the period. However, by the end of the century when the differences in GHG forcing are substantial, the precipitation increases are considerably greater for RCP 8.5 (21 %) than RCP 4.5 (9 %). The substantial precipitation increase under RCP 8.5 during the latter half of the century aligns with the results presented in Wuebbles et al. (2019).
The spatial variation of the precipitation increase by the late 21st century is more pronounced under RCP 8.5 than under RCP 4.5 (Fig. 8b, d). Southern and western parts of the basin are projected to experience the most significant precipitation increases, up to 30 % in RCP 8.5 and 10 % in RCP 4.5. The uncertainties from GLARM precipitation projections show no clear spatial pattern, except for RCP 8.5 in which larger uncertainties are exhibited in the southwest region (Fig. S2).
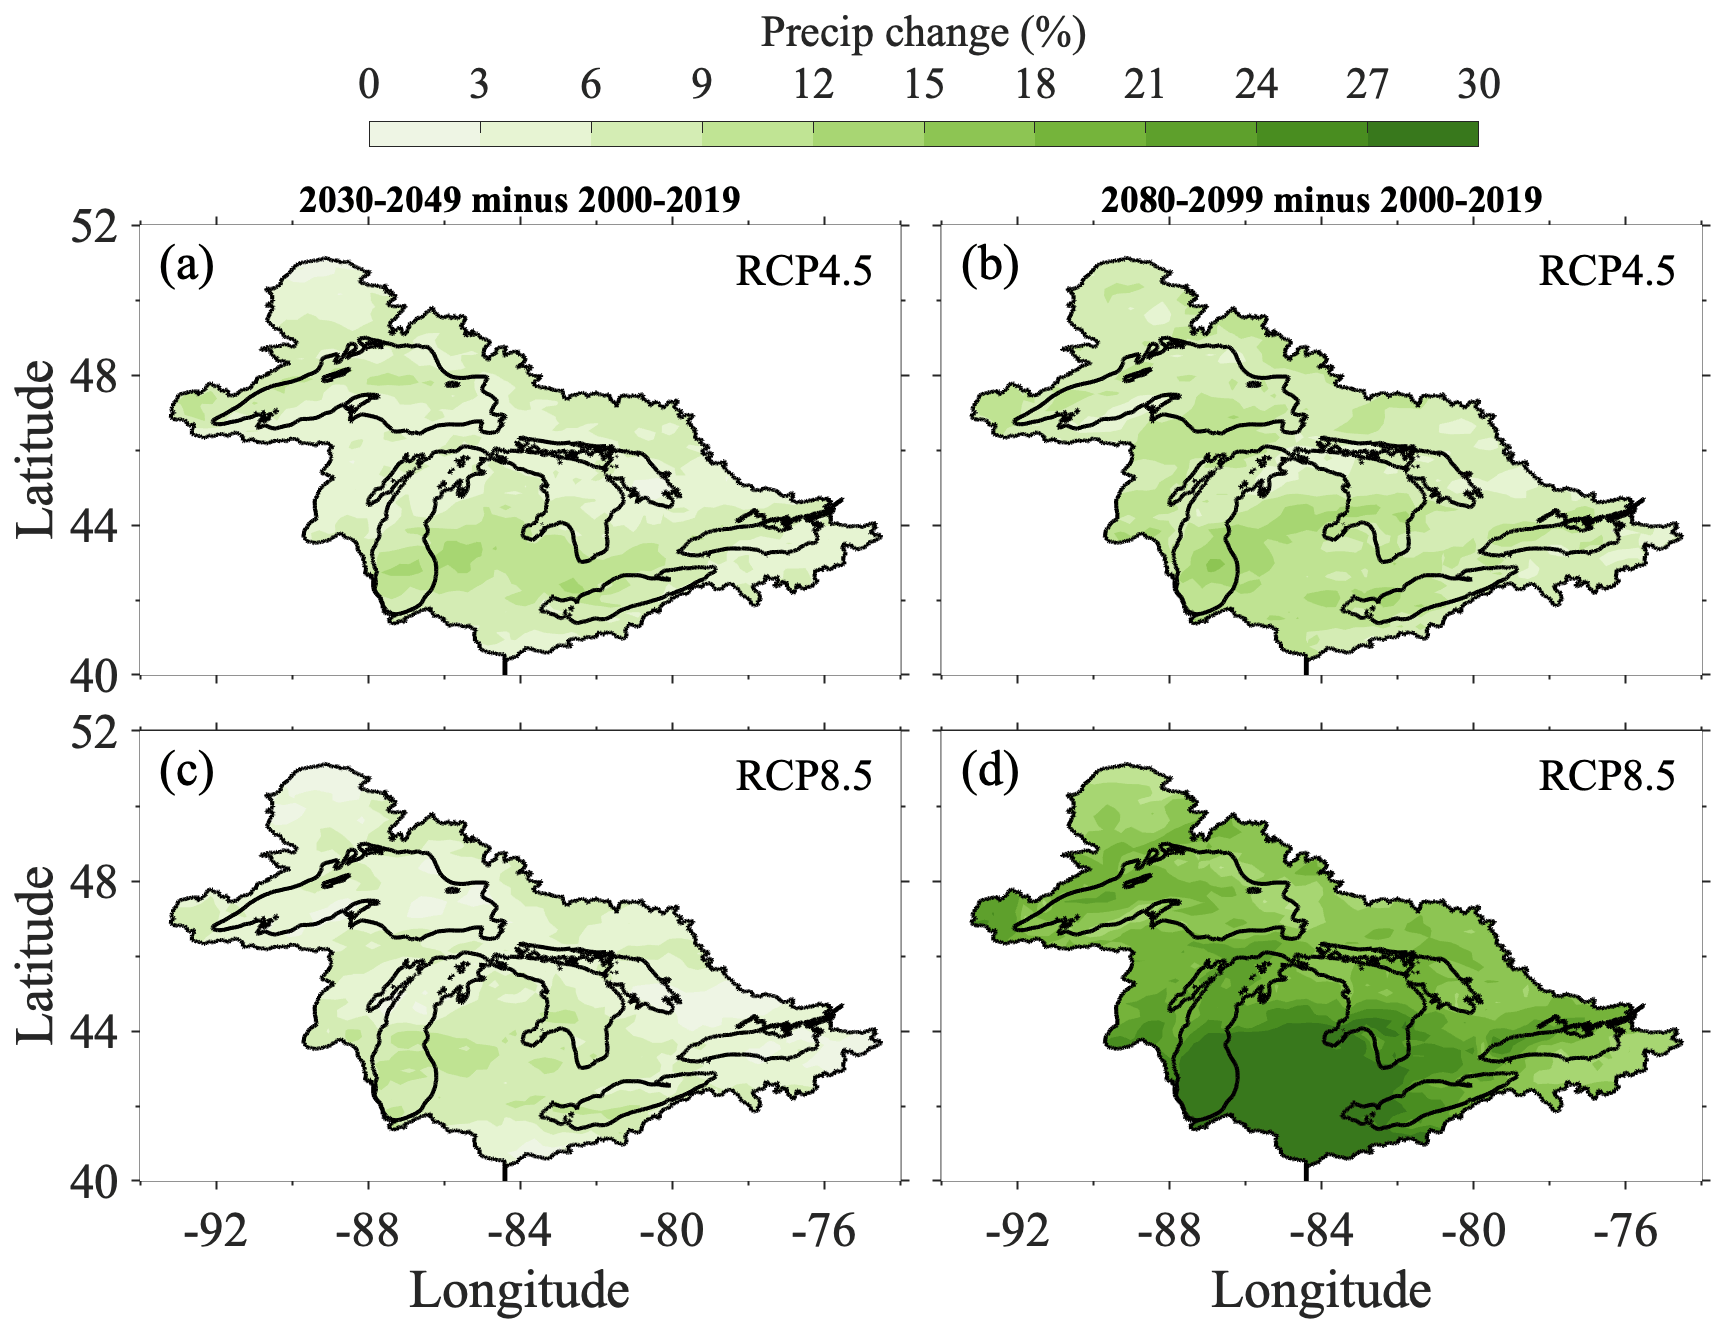
Figure 8Projected changes in precipitation over the Great Lakes basin in the mid-century (2030–2049) and late century (2080–2099) for the RCP 4.5 (a, b) and RCP 8.5 (c, d) scenarios, relative to the present-day climate (2000–2019).
Seasonally, while the GLARM-EA3 projects basin-wide precipitation increases in nearly all months, the results differ considerably between the individual three ensemble members (Fig. 9). The strongest and most robust signal is the projected wetting in spring, particularly in April and May, which is found in all cases and is consistent with several previous studies (Notaro et al., 2015; Byun and Hamlet, 2018; Zhang et al., 2020). Not consistent with the aforementioned studies, however, is that the GLARM-EA3 projected precipitation increase is small in the winter.
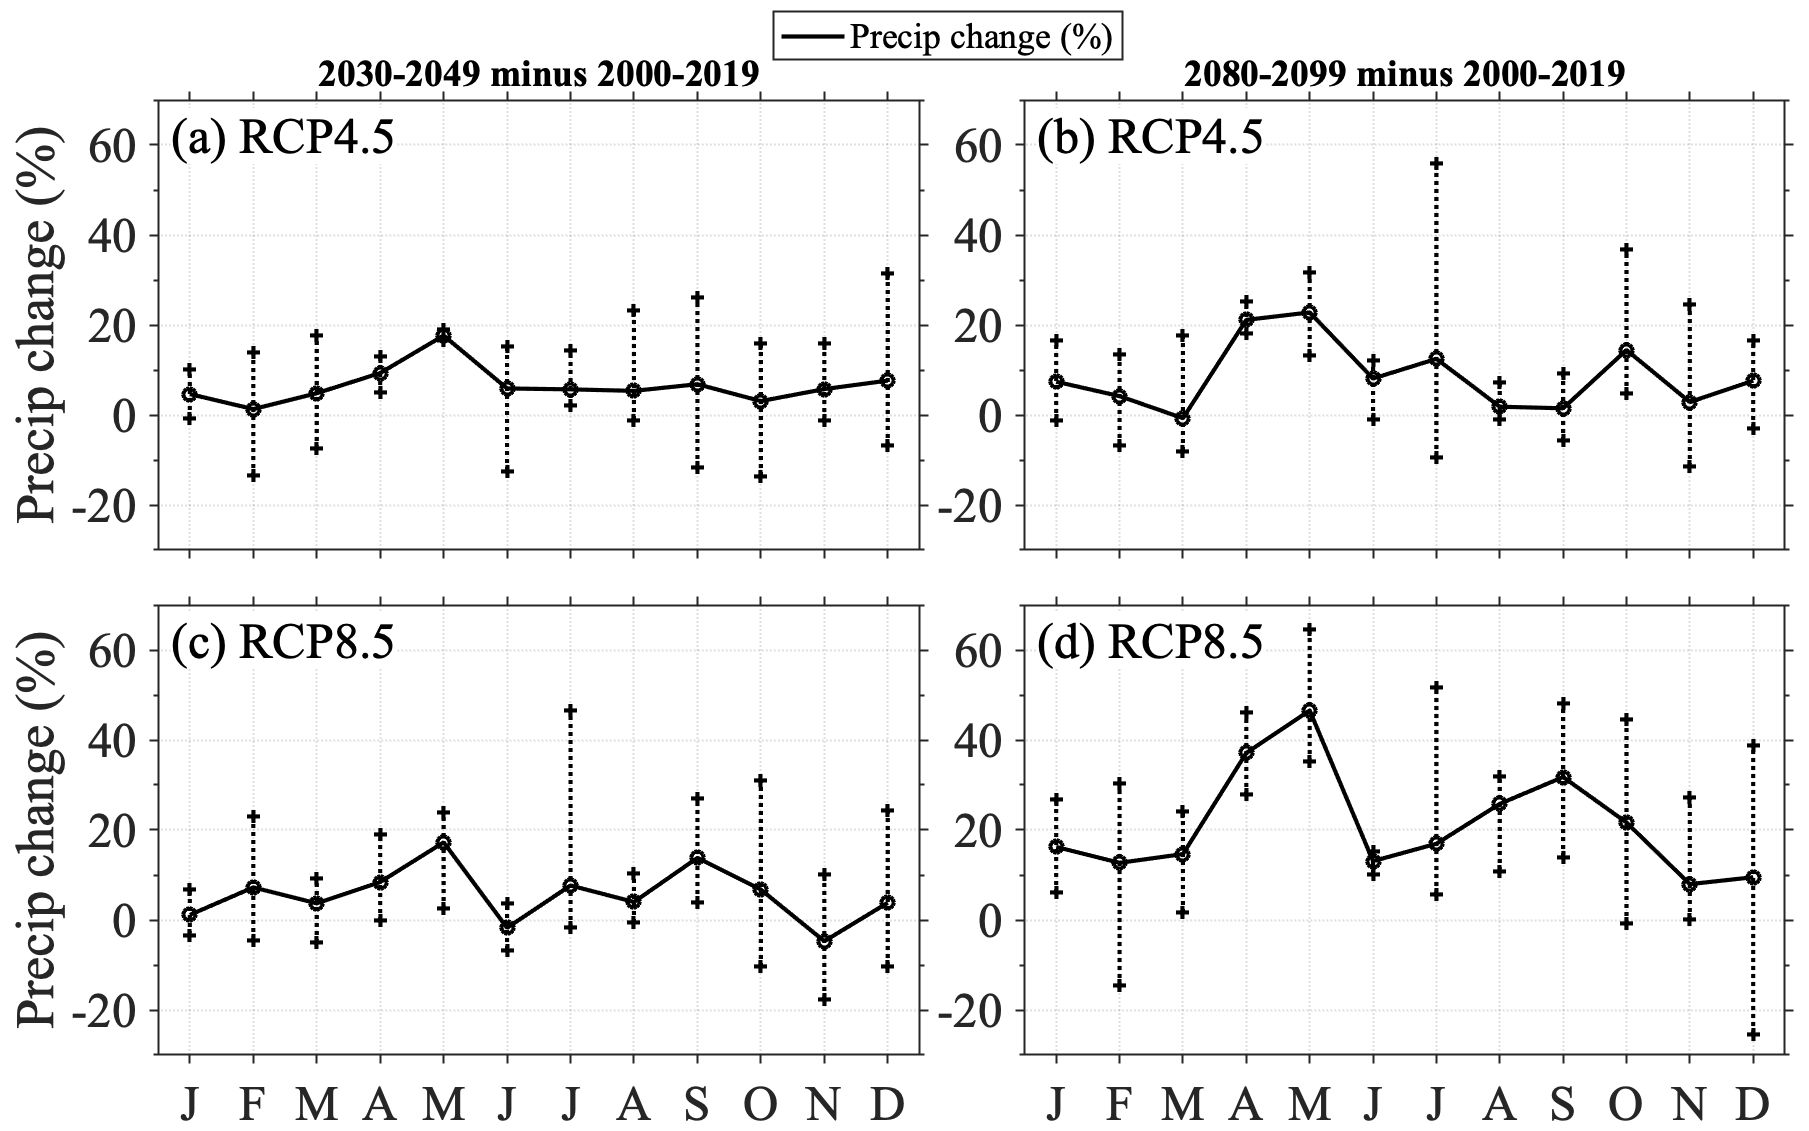
Figure 9Projected changes in monthly precipitation over the Great Lakes basin in the mid-century (2030–2049) and late century (2080–2099) for the RCP 4.5 (a, b) and RCP 8.5 (c, d) scenarios relative to the present-day climate (2000–2019). Vertical error bars indicate the range of the three individual GLARM projections.
Table 4GLARM-EA3 projected changes in monthly, seasonal, and annual precipitation over land, lake, and the Great Lakes basin in the mid-century (2030–2049) and late century (2080–2099) for the RCP 4.5 and RCP 8.5 scenarios, relative to the present-day climate (2000–2019).

Lake thermal structure and ice coverage
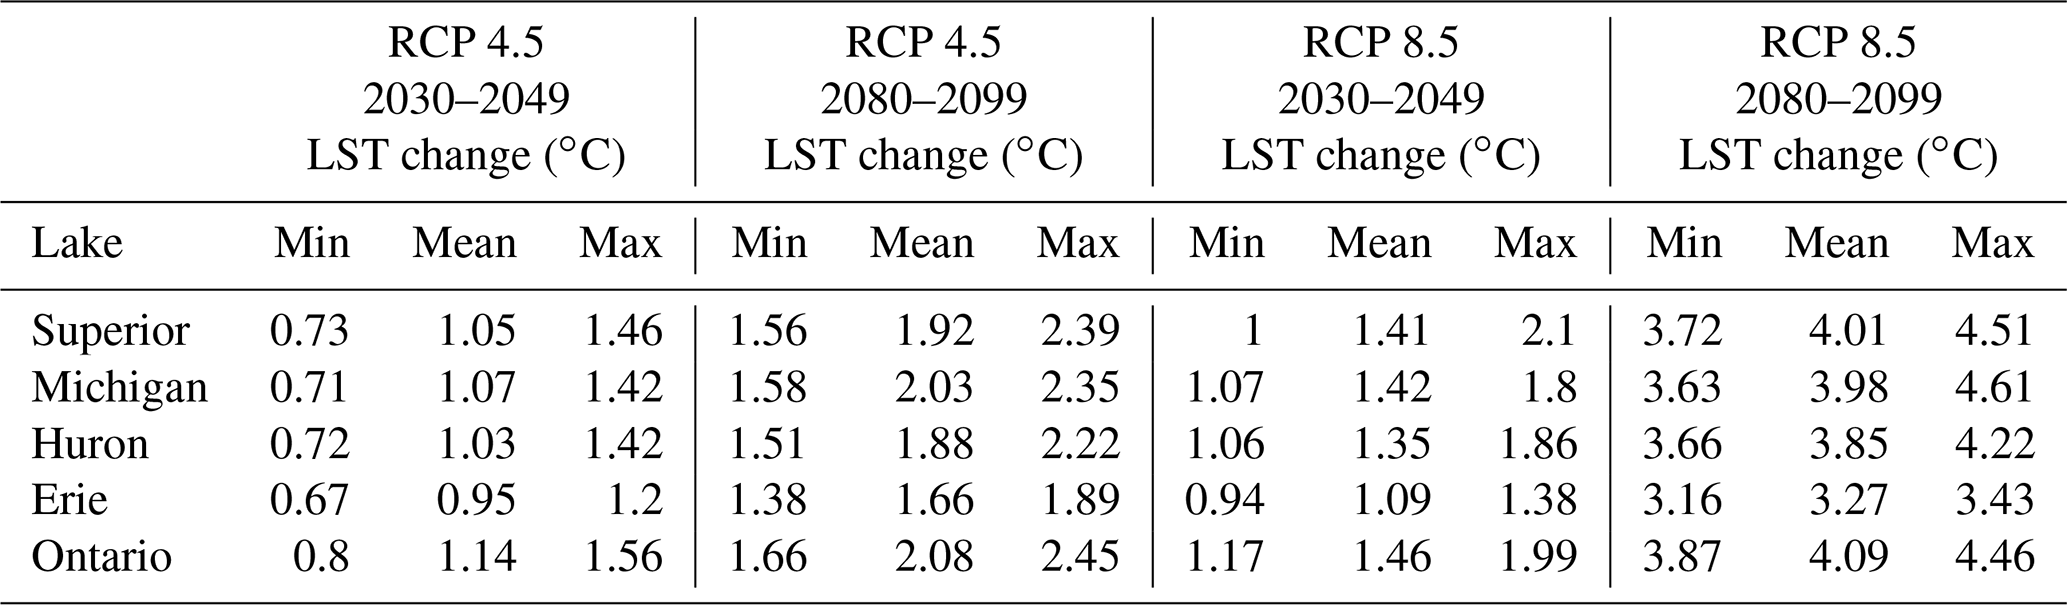
The LST variability in each of the Great Lakes is significantly influenced by water depth and geographic characteristics. The shallower lakes, such as Lake Erie exhibit larger seasonal LST variability than the deeper lakes, such as Lake Superior (Fig. 4). Similar to the surface air temperature warming in the basin, LSTs in the five lakes are projected to increase in time as the atmospheric GHGs accumulate. In contrast to surface air temperature, which increases relatively more significantly during winter, the LST increases show substantial seasonal variability, with the most significant changes projected in May and June (Figs. 7 and 10). For example, the Lake Superior LSTs increase by 6.1 and 3.2 ∘C at the end of the century in RCP 8.5 and RCP 4.5, respectively, which are significantly larger than the annual mean respective increases of 4.0 and 2.0 ∘C (Table 5). As the summer progresses, the amplified warming begins to decline until the winter where it reaches its minimum increase of approximately 3 ∘C in RCP 8.5 and 1.5 ∘C in RCP 4.5 in the late century. Such patterns are projected across the lakes under all scenarios and for all periods, except for Lake Erie where peak warming occurs in summer. Spatially, offshore waters with greater water depth are projected to experience the most significant warming across the lakes (Fig. 11).
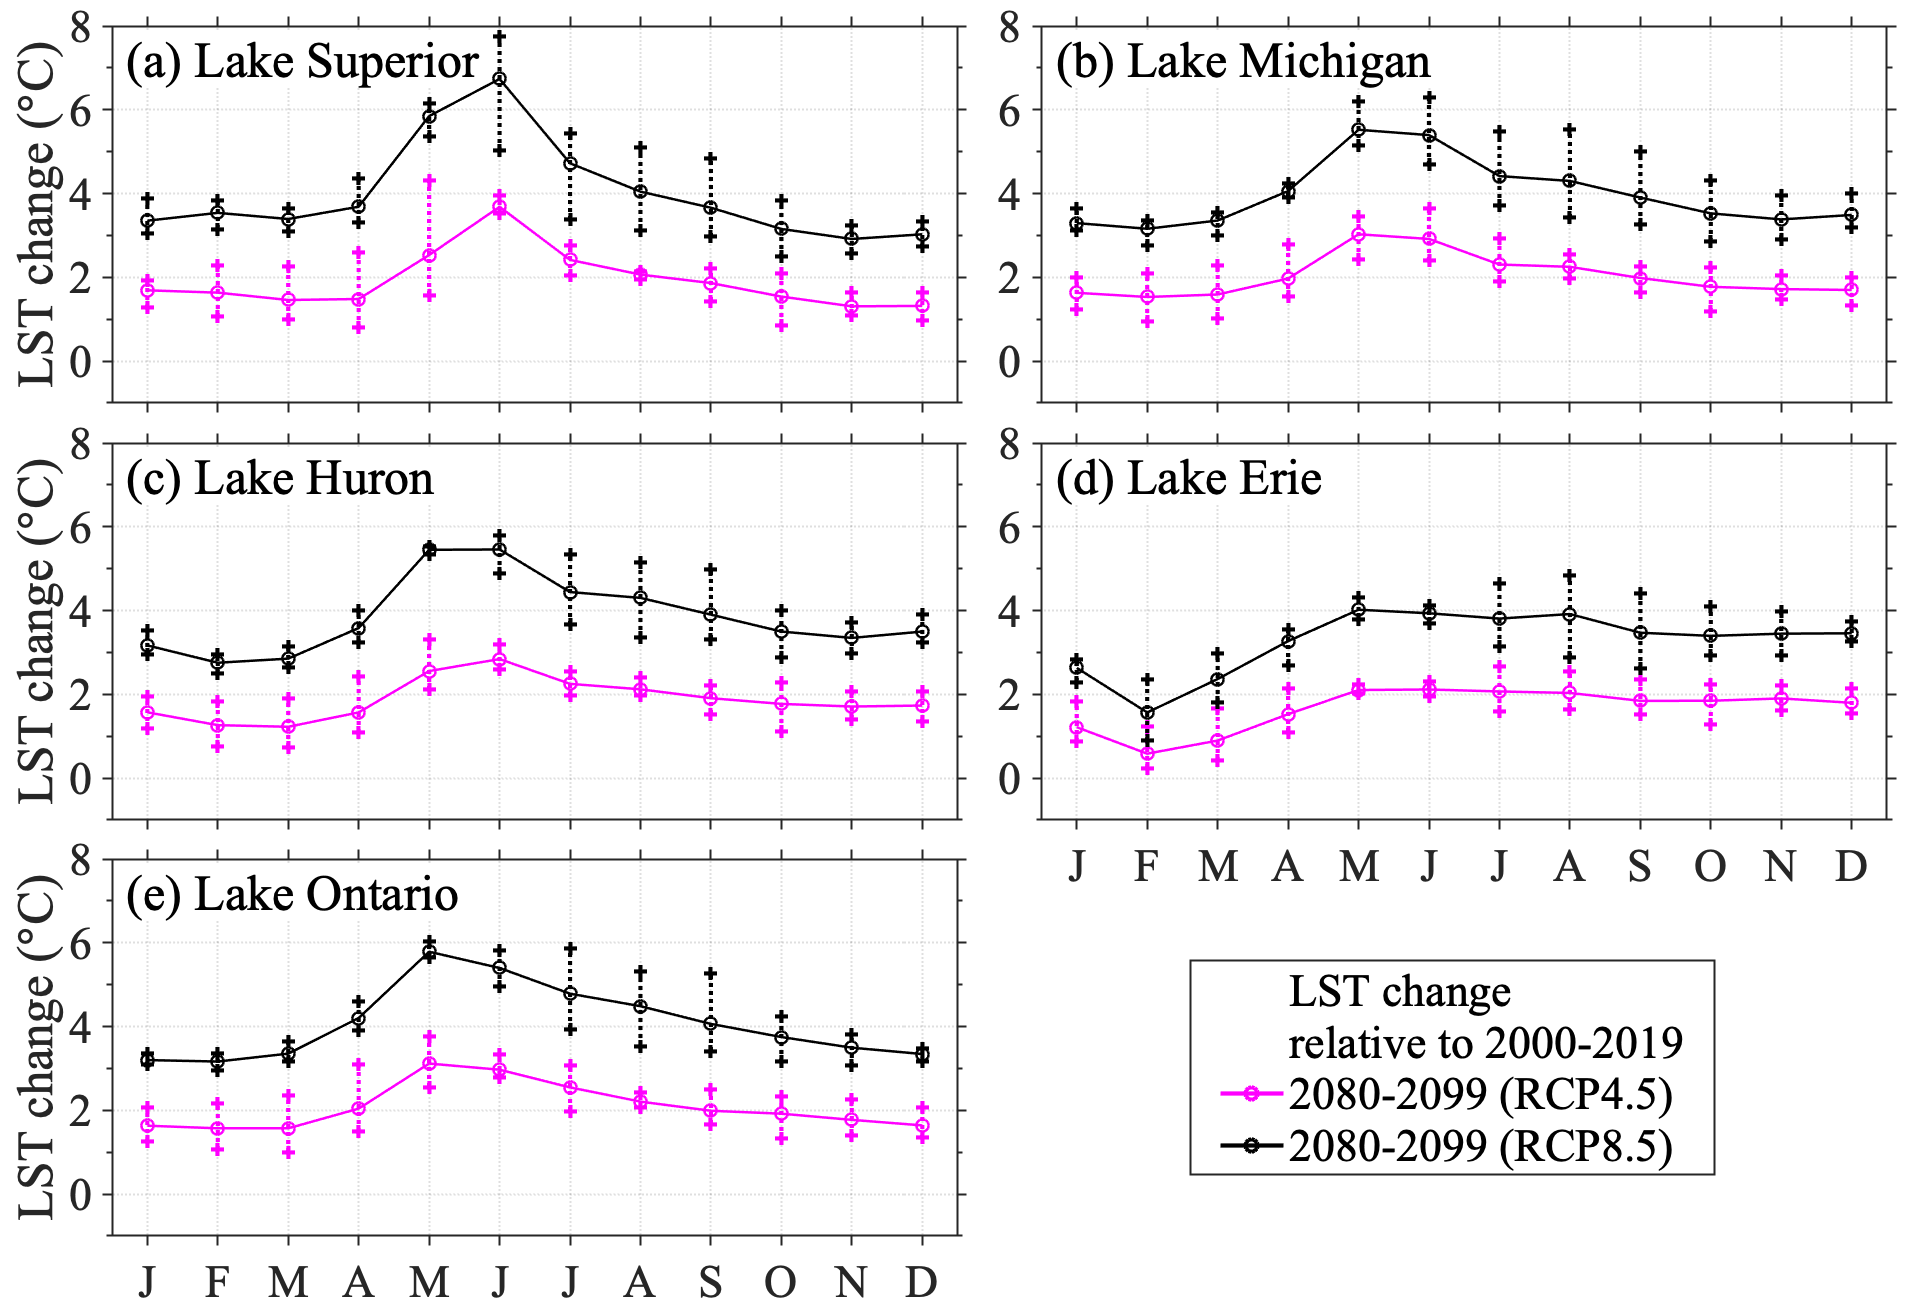
Figure 10Projected changes in monthly LST in the five lakes in the late century (2080–2099) for the RCP 4.5 and RCP 8.5 scenarios, relative to the present-day climate (2000–2019). Vertical error bars indicate the range of the three individual GLARM projections for RCP4.5 (pink) and RCP 8.5 (black).
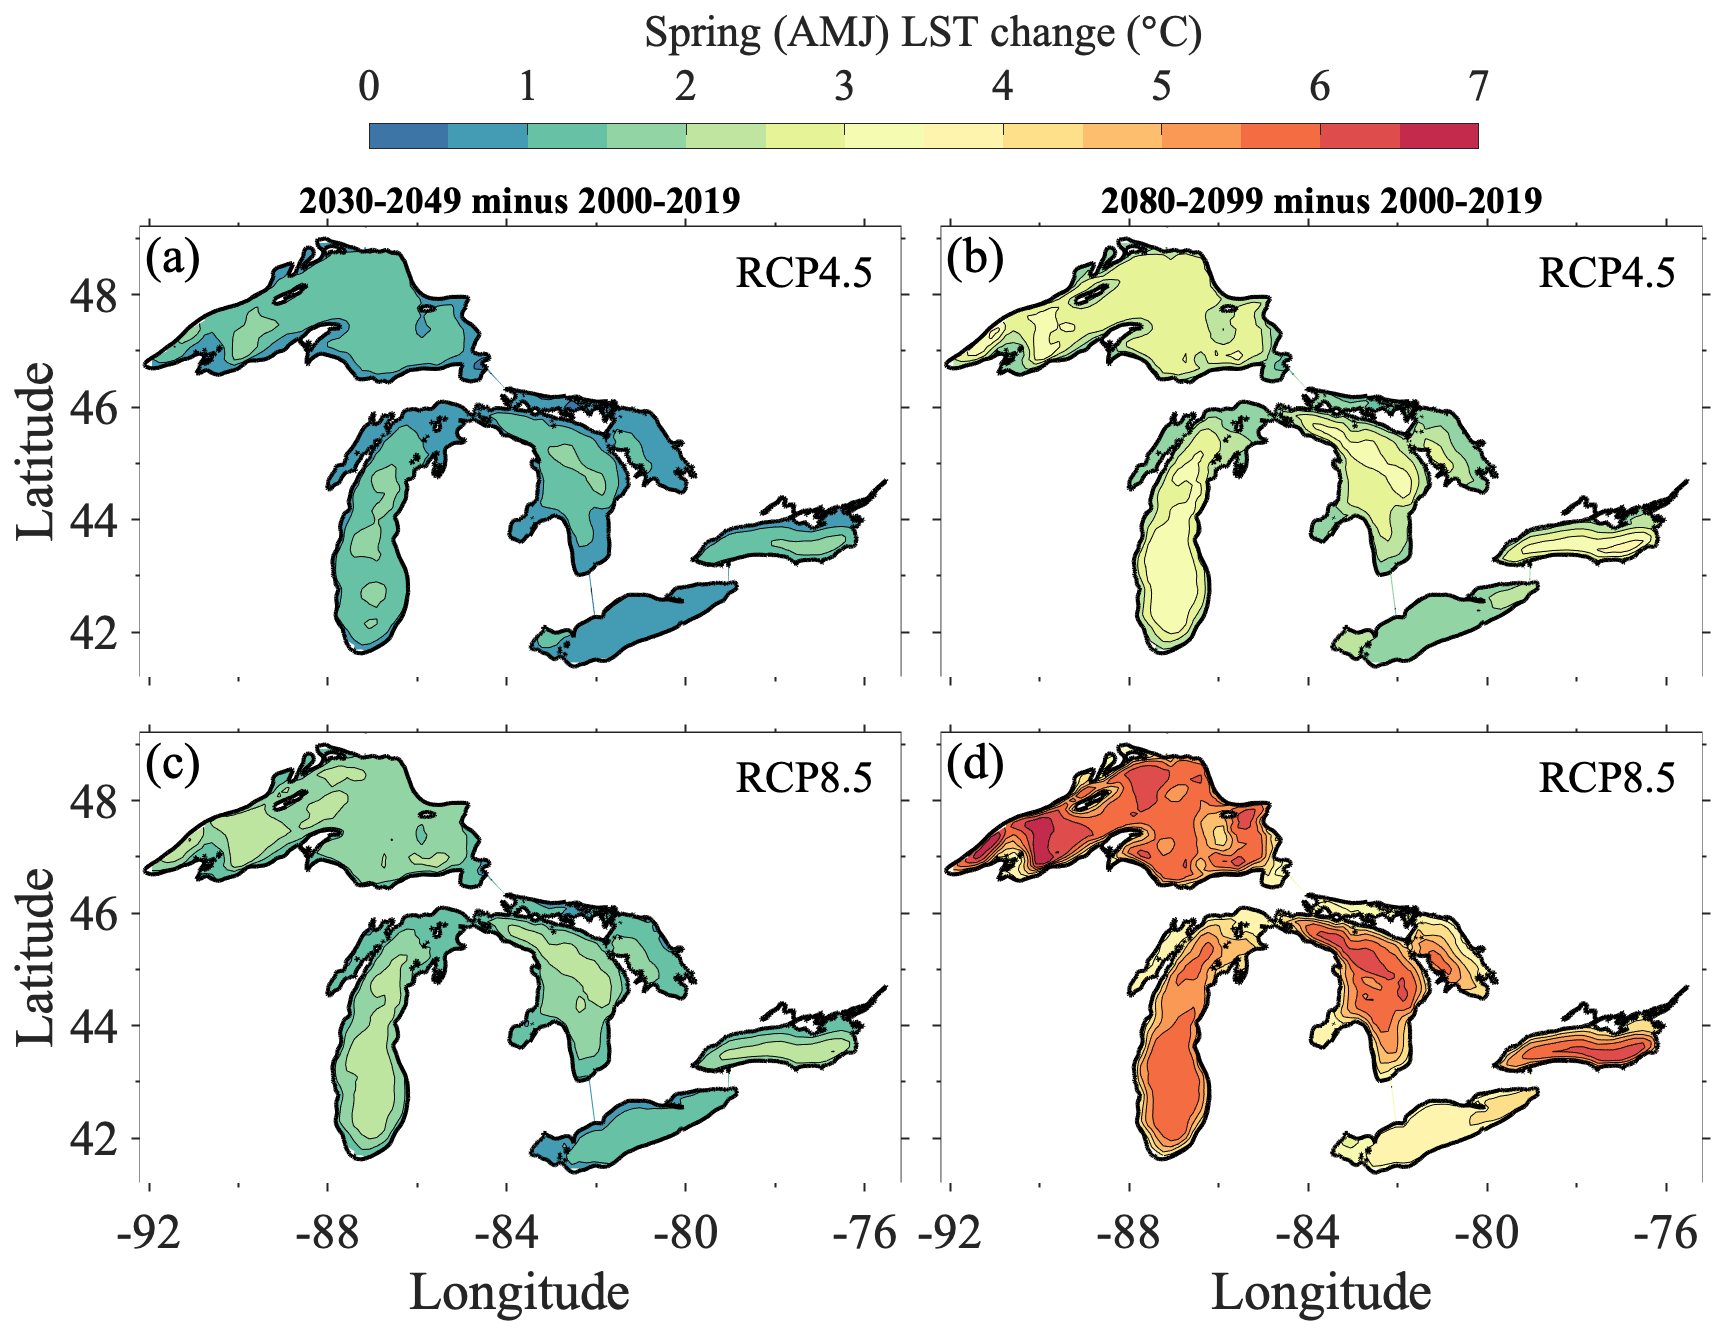
Figure 11Projected changes in spring (AMJ) LSTs in the five Great Lakes in the mid-century (2030–2049) and late-century (2080–2099) for the RCP 4.5 (a, b) and RCP 8.5 (c, d) scenarios, relative to the present-day climate (2000–2019).
In the RCP 8.5 scenario,the most significant LST increase occurs in Lakes Ontario and Superior, followed by Lakes Michigan, Huron, and Erie (Fig. 10, Table 5). In the spring (e.g., May and June) and winter (January–March), lake surface warming is much more significant in the deep lakes (e.g., Lakes Superior and Ontario) than in the shallow Lake Erie (Fig. 12). In fact, the average warming in the other months (August–December) of a year is similar between Lakes Superior and Erie, with an average LST increase of 3.4 ∘C in Lake Superior and 3.5 ∘C in Lake Erie. The strong lake surface warming in spring is a consequence of early stratification, which happens most significantly in deep lakes (Fig. 12). For example, in the present-day climate, the water in Lake Superior during May and June is typically well-mixed between the transition from winter inverse stratification to summer stratification. In the late century, however, the water is projected to become highly stratified in May and June, causing a sharp increase in surface water temperature (Fig. 12). Meanwhile, the deep layer is also projected to become warmer with heat transfer to the deep water through mixing. Due to the shallowness of Lake Erie, the change in stratification is less drastic and hence has less impact. In addition, another important feature to be highlighted is diminishing winter stratification in the future, suggesting the transition from dimictic lakes (which overturn twice per year) to monomictic lakes (which overturn once per year) by the end of the century (Woolway et al., 2021).
In the winter the magnitude of the LST increase is heavily influenced by the presence of ice cover, as some of the energy is used for melting ice before increasing LST. Therefore, the warming signals are reflected in an overall reduction in ice coverage and duration (Figs. 13 and 14) in addition to the LST increase. Here we present the projected lake conditions in the late century as an example (Fig. 13). The ice cover projections show the least uncertainty in the RCP 8.5 scenario in the late century, in response to the strongest warming. The highest monthly mean ice coverage (February) is projected to reduce to 3 %–7 % in the other four lakes except for Lake Erie, which is projected to have a higher ice coverage of 15 % (Fig. 13). While the deep lakes are projected to be nearly ice-free by the end of the century, Lake Erie is projected to still experience some ice coverage and lead to a relatively lower increase in LST during winter. This is because deep lakes are, by nature, large heat reservoirs that can transfer heat from a deep layer to the surface reducing ice formation. The best example is the observed ice coverage of the shallowest lake (Erie) and the second deepest lake (Ontario) (Fig. 5). Both lakes have small surface areas but significantly different water depths (mean water depths are 19 and 86 m, respectively, Fig. 1b), resulting in high (low) winter ice cover in Lake Erie (Ontario) (Figs. 5 and 13).
In addition to the reduction of ice coverage, the ice duration (defined with a threshold of 10 % ice coverage at a given model grid) is projected to decrease correspondingly (Fig. 14). By the mid-century, the ice duration is projected to decrease by 5–30 d depending on the scenario and location; and by the late century, ice duration is projected to decrease by up to 60 d in the coastal regions where higher ice covers are typical in the present-day climate.
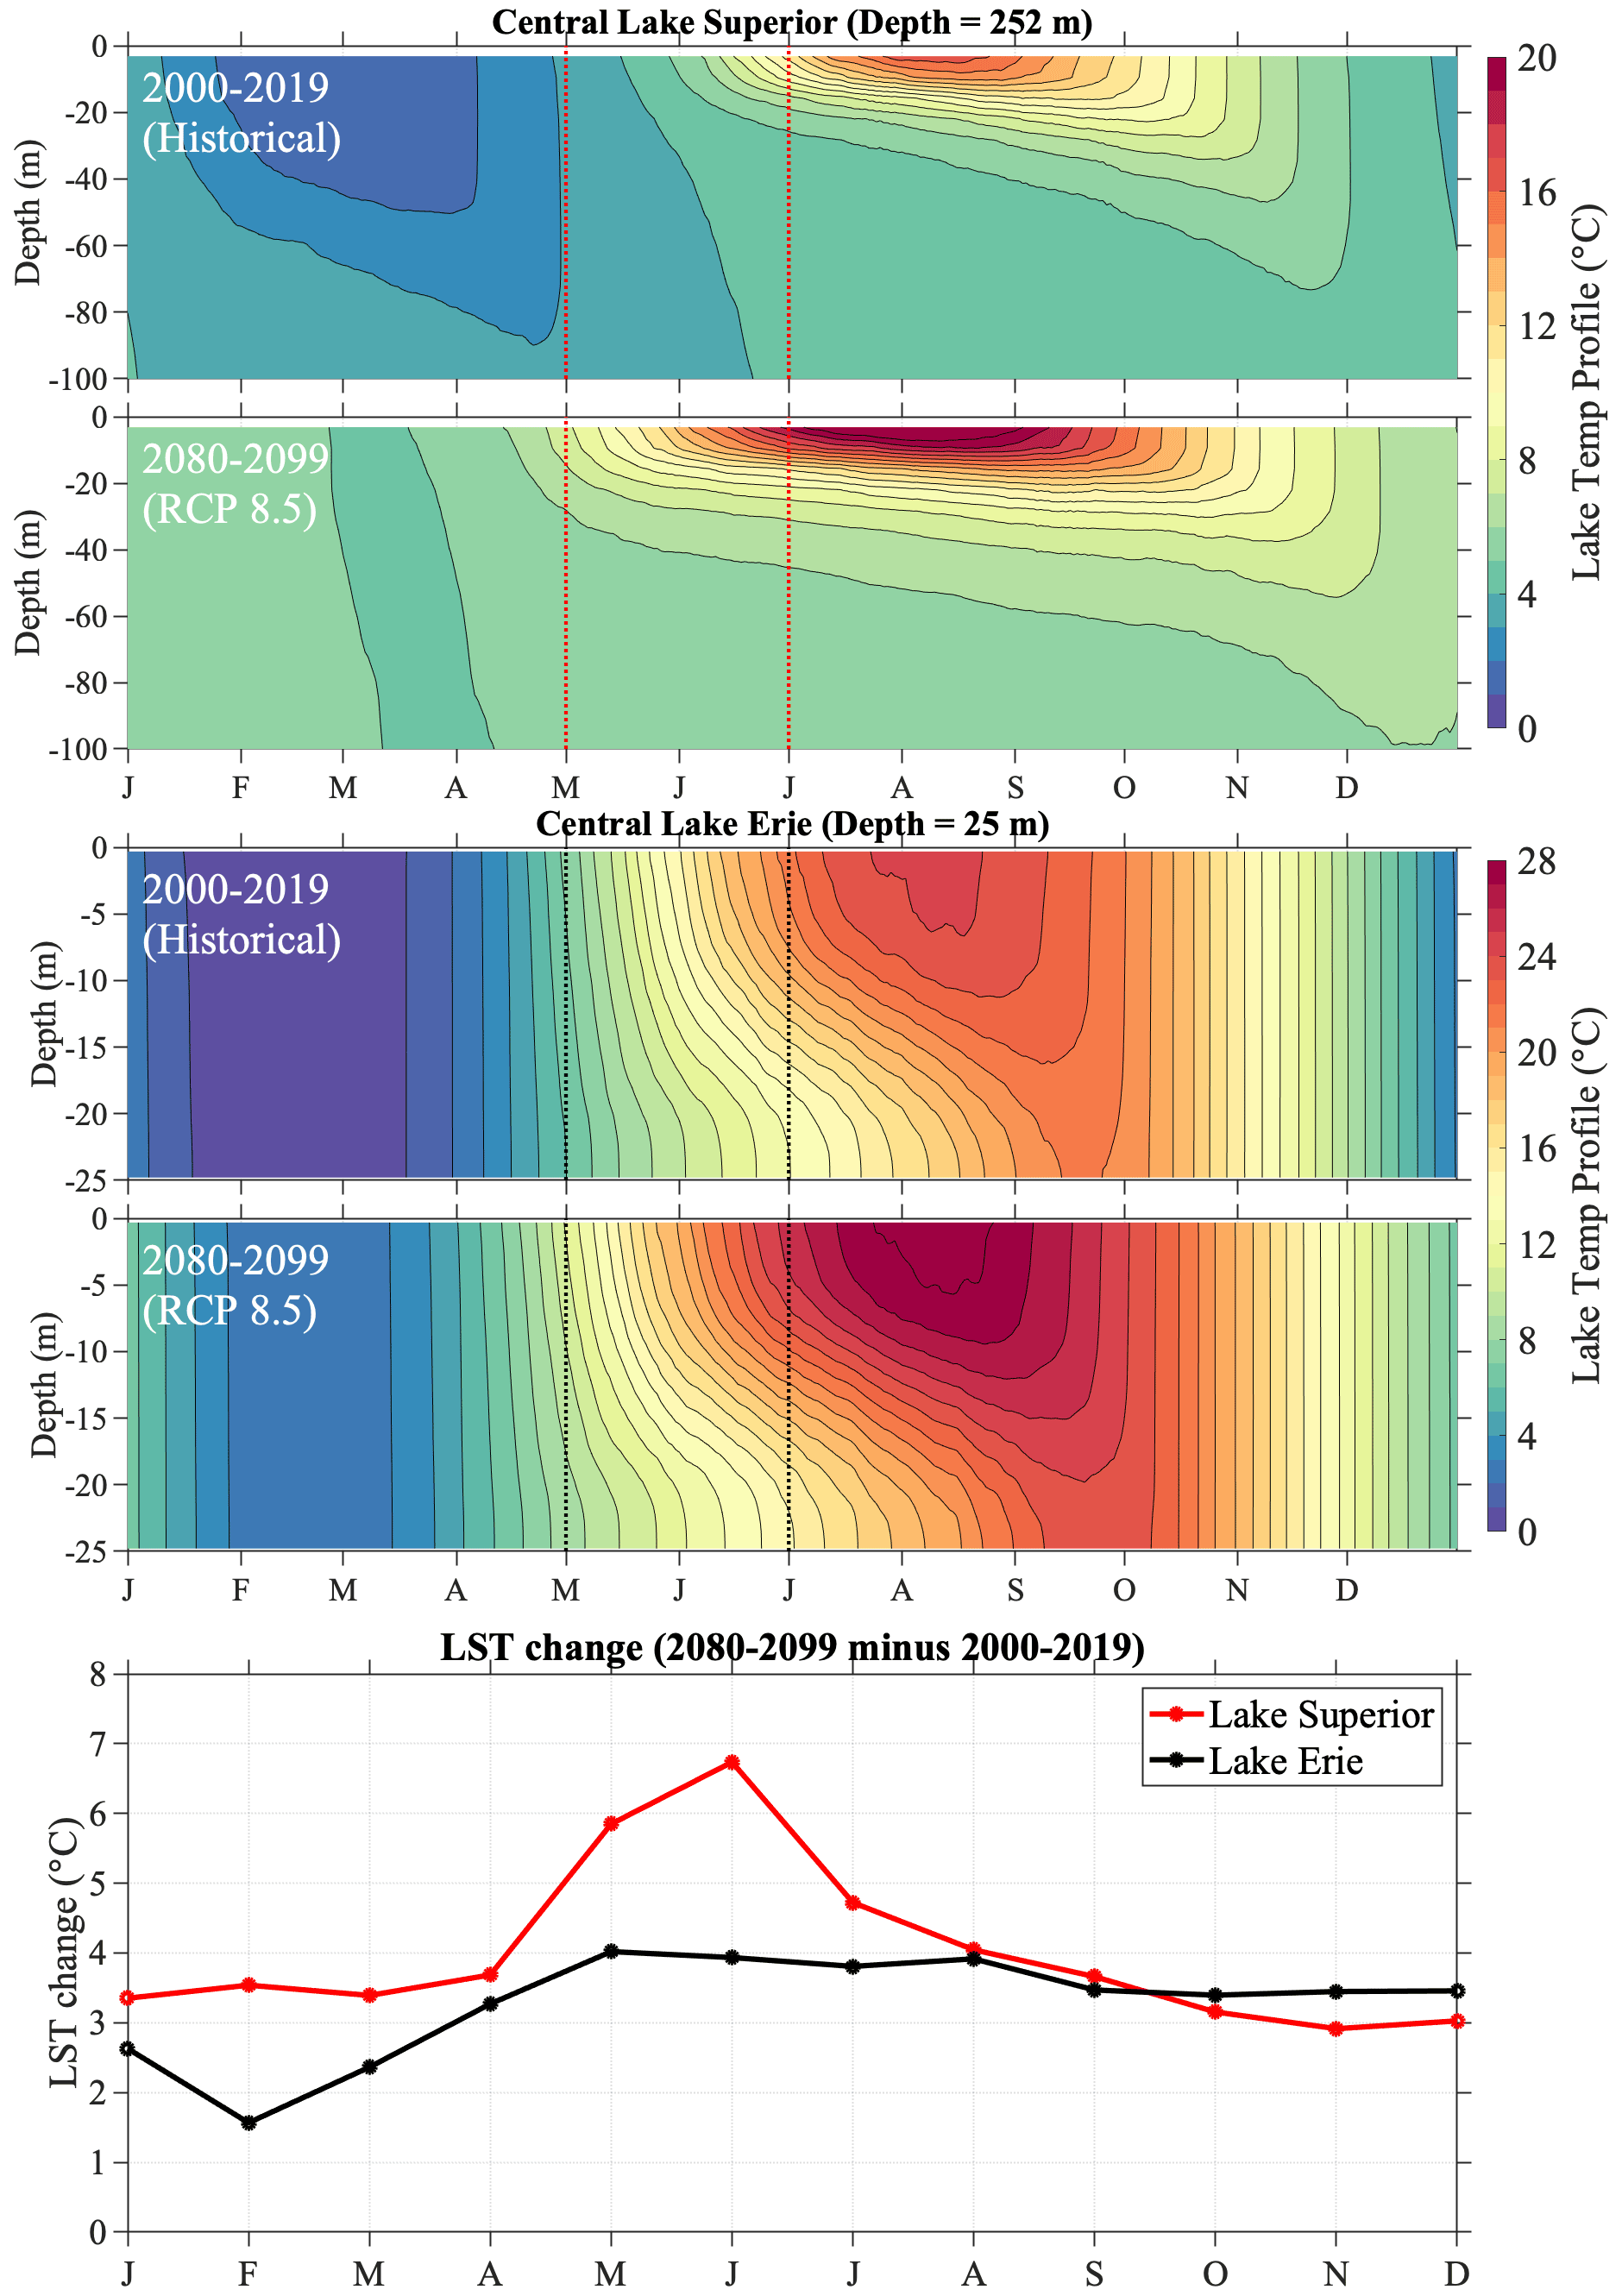
Figure 12Lake thermal structures in central Lake Superior (two upper panels) and Lake Erie (two middle panels) in the present-day climate (2000–2019) and late century (2080–2099). (bottom panel) Comparison of projected changes in monthly LST for Lake Superior and Lake Erie in the late century (2080–2099) in RCP 8.5, relative to the present-day climate (2000–2019).
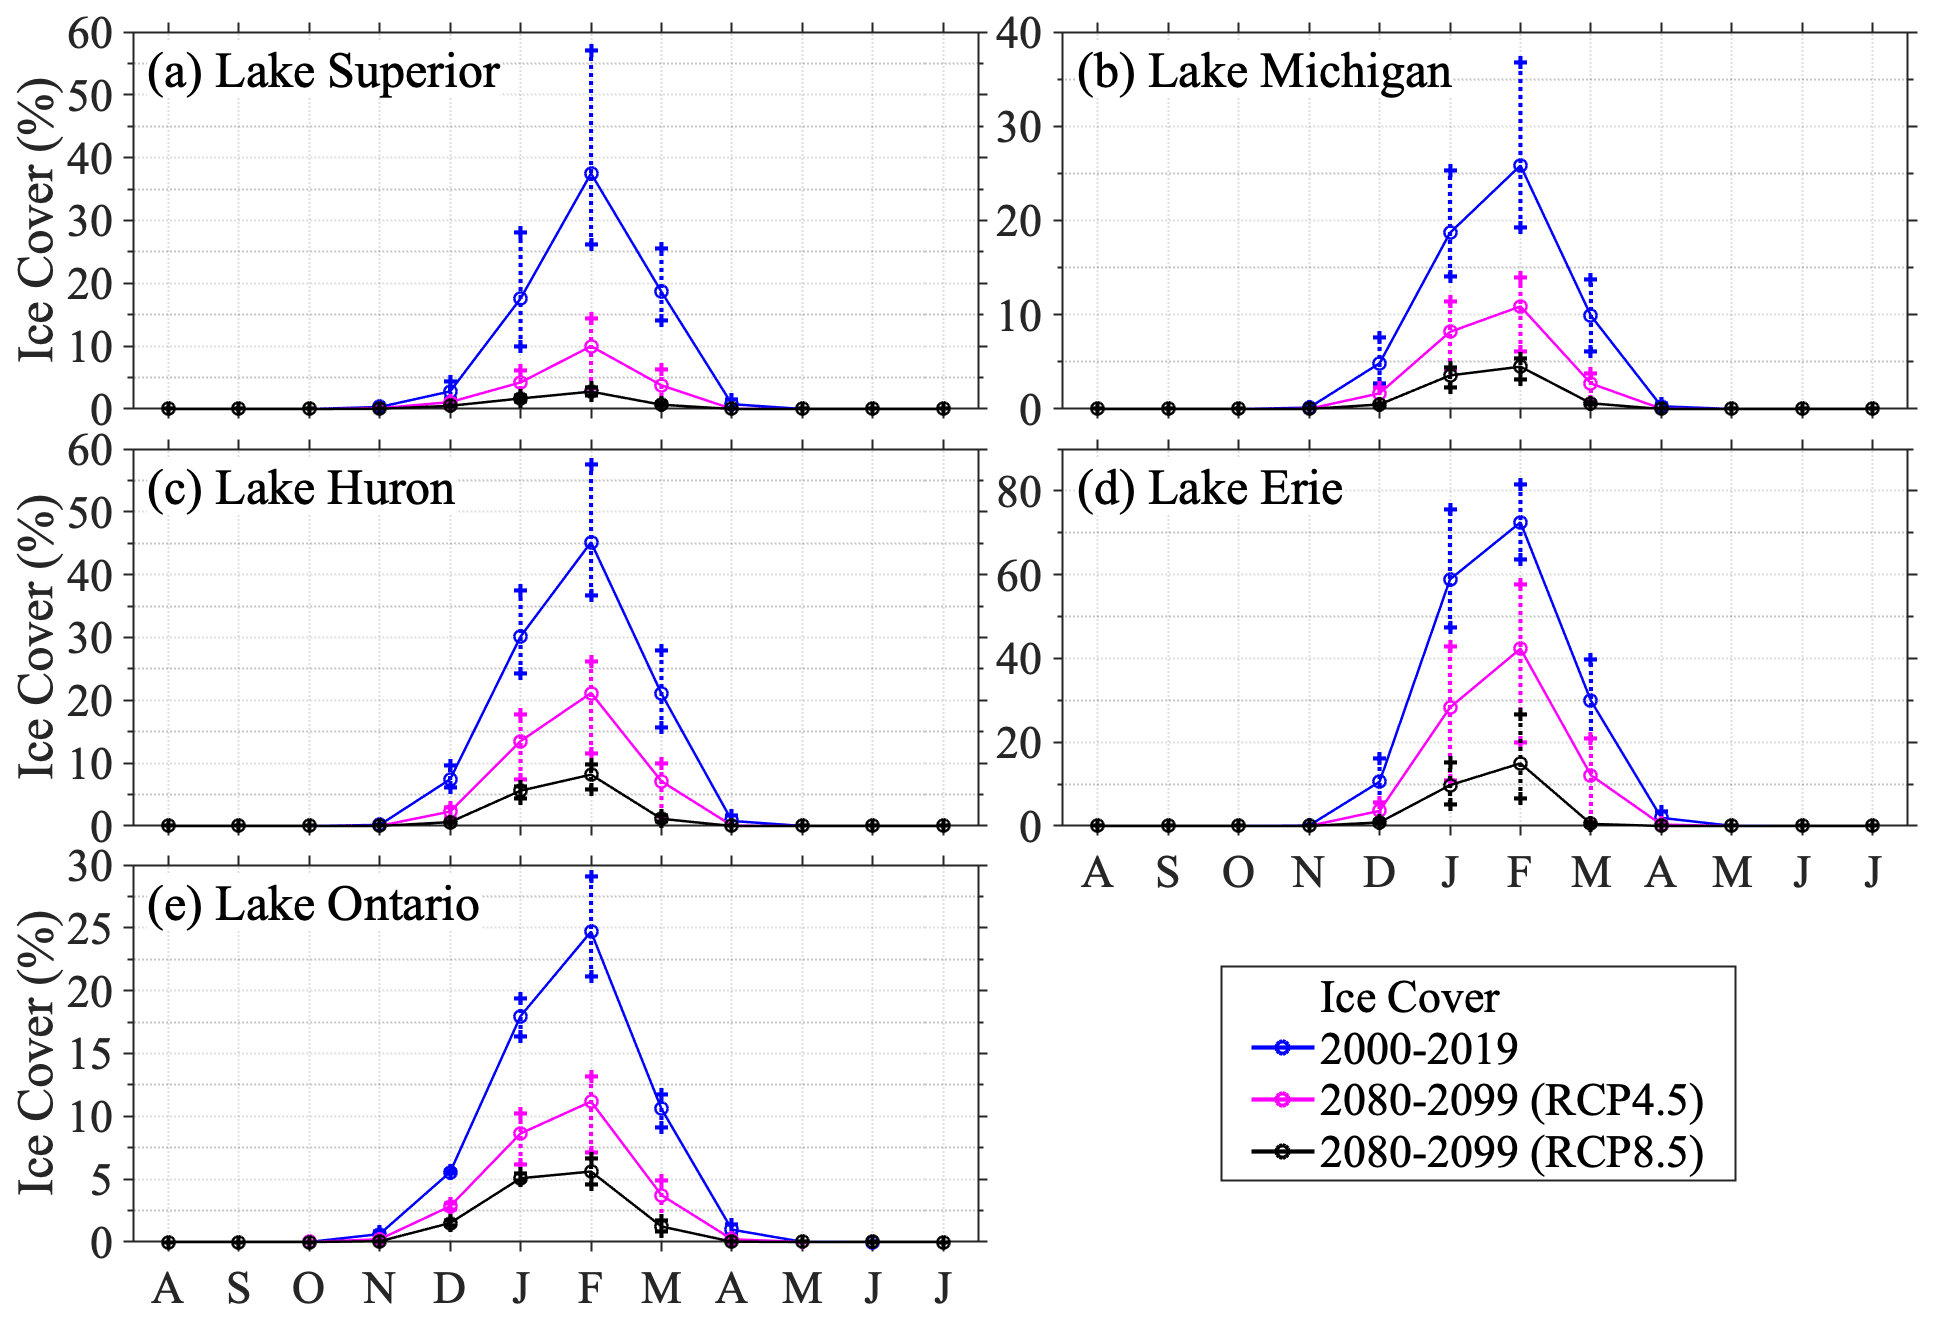
Figure 13Projected monthly ice cover in the five lakes in the late century (2080–2099) in RCP 4.5 (pink) and RCP 8.5 (black) in comparison to the present-day conditions (2000–2019) (blue). Vertical error bars indicate the range of the three individual GLARM projections.

Figure 14Projected changes in ice duration in the five Great Lakes in the mid-century (2030–2049) and the late century (2080–2099) for the RCP 4.5 (a, b) and RCP 8.5 (c, d) scenarios, relative to the present-day climate (2000–2019).
Table 5GLARM-EA3 projected changes in annual mean LST in the five Great Lakes in the mid-century (2030–2049) and late century (2080–2099) for the RCP 4.5 and RCP 8.5 scenarios, relative to the present-day climate (2000–2019). The maxima (Max) and minima (Min) indicate the range of the three individual GLARM projections.
4.1 Model advancement and limitation
The Laurentian Great Lakes are a key element in the regional climate of the basin and play an essential role in influencing local weather patterns and climate processes. Climate processes are changing, accompanied by changes in the Great Lakes. Many of these complex changes are regulated by interactions among the atmosphere, lake, ice, and surrounding land areas and have an important influence in regulating the regional climate. The lack of fully integrated regional models that resolve 3-D lake dynamics may result in inaccurate projections of climate change for the basin and associated adaptation and mitigation measures. To the best of our knowledge, this study presents the first climate change projections including both the Great Lakes basin and the changes in the five Great Lakes by employing a two-way coupled regional climate model with a 3-D lake model (GLARM).
Using three carefully selected CMIP5 GCMS, we show that the GLARM ensemble average substantially reduces the surface air temperature and precipitation biases of the driving GCM ensemble average in present-day climate simulations. The improvements are not only displayed from an atmospheric perspective but are also evident in the simulation of lake temperature and ice coverage.
We note that this study does not directly simulate the surface hydrological cycle for three reasons. First, the water levels of the Great Lakes are primarily governed by the net basin supply (NBS) of each lake (over-lake precipitation, river runoff, and lake evaporation), in combination with natural and regulated inter-lake flows. The projection of water level changes requires the integration of a suite of models. Such integration is documented in our separate study (Kayastha et al., 2022), in which we use GLARM (for over-lake precipitation, lake evaporation), the large basin runoff model (LBRM) for river runoff into each lake, and the coordinated Great Lakes regulation and routing model (CGLRRM) for inter-lake flows. Second, the impact of water level change on the surface area of the Great Lakes is negligible; therefore, water level change does not play a critical role in influencing lake-air heat fluxes and climate change. Third, compared to the primary factor (surface heat fluxes) of lake thermal change, the heat transport between lakes associated with inter-lake flows is secondary on the lake basin-wide scale.
4.2 Summary of climate projections
The GLARM climate change projections are performed for the mid-century (2030–2049) and late century (2080–2099) for the RCP 8.5 high-end emission scenario and the RCP 4.5 moderate mitigation scenario. Surface air temperature over the Great Lakes basin is projected to increase in all months regardless of the scenario, period of consideration and ensemble member. Under RCP 8.5, the Great Lakes basin is projected to warm by 1.3–2.1 ∘C by the mid-21st century and 4.1–5.0 ∘C by the end of the century relative to the early century (2000–2019). Moderate mitigation (RCP 4.5) reduces the mid-century warming to 0.8–1.8 ∘C and late century warming to 1.8–2.7 ∘C. The largest increase in surface air temperature is projected during the winter, consistent with the projections from Byun and Hamlet (2018) and Zhang et al. (2020). Since previous studies considered different time periods and GHG emission scenarios for their projections, a comparison of precise magnitude of changes is not possible; nevertheless, qualitative comparisons can be made. The GLARM simulations presented here project surface air temperature increases slightly smaller than those of previous studies (e.g., Notaro et al., 2015; Zhang et al., 2020). For example, by 2080–2099 under RCP 8.5, Notaro et al. (2015) projected annual over-land air temperature to increase by up to 5.9 ∘C relative to 1980–1999, while GLARM projects an increase of 4.4 ∘C relative to 2000–2019. When considering that the CRU data show a 0.5 ∘C difference between the baseline periods of the two studies, the GLARM RCP 8.5 ensemble projects a reduction by about 1.0 ∘C compared to Notaro et al. (2015). As for the spatial variation of the projected increase, GLARM-EA3 projects a relatively larger increase in the northern part of the basin (particularly by the end of the 21st century), which is consistent with Xiao et al. (2018). Annual precipitation in GLARM is projected to increase for the entire basin, varying from 0 % to 13 % during the mid-century and from 9 % to 32 % during the late century in different scenarios and simulations. The most significant increases are projected in spring and fall when current precipitation is highest and smallest increases in winter when it is lowest. There is some consensus among previous studies on the annual timescale, however, these studies project larger increases in winter and spring (e.g., Notaro et al., 2015; Byun and Hamlet, 2018; Zhang et al., 2020).
The LSTs also increase across the five lakes in all simulations, with strong seasonal and spatial variability. The greatest warming is projected in spring, and persists into the summer, resulting from earlier and more intense stratification in the future. In addition, diminishing winter stratification in the future suggests the transition from dimictic lakes to monomictic lakes by the end of the century. In contrast, a relatively smaller increase in LSTs during fall and winter is projected with heat transfer to the deep water due to the strong mixing and energy required for ice melting. Correspondingly, the GLARM ensemble projects a decrease in ice cover and duration. Of particular note, the highest monthly mean ice cover is projected to be only 3–15 % across the lakes in the late century in RCP 8.5, and ice duration is projected to decrease by up to 60 d in the coastal regions. The few climate change studies that dynamically downscale the Great Lakes temperature and ice cover use 1-D lake models embedded in the RCMs (Notaro et al., 2015; Xiao et al., 2018). The GLARM simulations are consistent with these previous studies, however, the magnitude of the increase is considerably less than Xiao et al. (2018) who project increases of 3.5–4.0 ∘C for 2070–2100 relative to 1975–2005 under RCP 4.5 and Notaro et al. (2015) who project increases of up to 8 ∘C by 2080–2099 relative to 1980–1999 under RCP 8.5. Counterintuitively, both of these studies projected larger ice coverage than that in the GLARM simulations. It should be noted that their ice coverage simulations are heavily limited by their 1D lake-ice model; both studies explicitly note that the absence of the 3D model produced substantial summer warm biases and cold biases in winter (Notaro et al., 2015) with earlier ice onset and excessive mid-winter ice (Xiao et al., 2018). The 3D representation of lake and ice processes within GLARM can better represent advective and turbulent heat transport, lake thermal structure, and ice coverage and duration.
Collectively, the projected changes in the atmosphere and the lakes are expected to modify weather and climate extremes and associated coastal hazards, including extended local heat stresses and marine lake heat waves, heavy precipitation, rising lake levels, and coastal flooding (Wuebbles et al., 2019; Huang et al., 2021a, b; Zhang et al., 2019; Notaro et al., 2021). With unabated GHG gas emissions, all lakes will experience less ice coverage and duration and very likely even ice-free winters. This will significantly alter the over-lake heat and moisture fluxes during the cold season, which could lead to intensified winter storms. For example, the increased winter moisture supply from the lakes along with events of cold air mass (e.g., polar vortex) can create ideal conditions for stronger lake effect snowfall events (d'Orgeville et al., 2014; Basile et al., 2017). As such, a regional earth system modeling system with the integration of observing networks can be vitally essential to guide decision-makers in response to climate change and climate-driven coastal hazards.
GLARM includes RegCM4 and FVCOM codes. The FVCOM code is available for registered users through http://fvcom.smast.umassd.edu/fvcom/ (last access: 31 May 2022). The FVCOM code used in this study is available from https://doi.org/10.5281/zenodo.6534139 (Huang, 2022a). The authors do not have the permission to offer public access to RegCM-CLM-CNDV (Wang et al., 2016) through this publication. It can be available upon request from https://hydroclimatology.uconn.edu (last access: 31 May 2022). The observational data used in this study are available from https://doi.org/10.5281/zenodo.6540504 (Huang, 2022b). The original data are also available from the following websites: The Great Lakes Surface Environmental Analysis (GLSEA) is available from https://coastwatch.glerl.noaa.gov/glsea/glsea.html (last access: 31 May 2022). The Great Lakes Ice Cover Database (GLICD) is available from https://www.glerl.noaa.gov/data/ice/#historical (last access: 31 May 2022). The CRU data is available from https://crudata.uea.ac.uk/cru/data/hrg/#current (last access: 31 May 2022).
The supplement related to this article is available online at: https://doi.org/10.5194/gmd-15-4425-2022-supplement.
PX conceived the study. PX and CH developed the model code. PX, XY, and JSP designed the experiments. PX, JSP, CH, and XY conducted the analyses. PX, JSP, and XY wrote the original manuscript. MBK, PYC, and CH contributed to revising the manuscript. All authors have read and agreed to the published version of the manuscript.
The contact author has declared that neither they nor their co-authors have any competing interests.
Publisher's note: Copernicus Publications remains neutral with regard to jurisdictional claims in published maps and institutional affiliations.
This is contribution no. 91 of the Great Lakes Research Center at Michigan Technological University. The Michigan Tech high-performance computing cluster, Superior, was used in obtaining the modeling results presented in this publication. The work was partly supported by Cooperative Agreement No. G21AC10141 from the United States Geological Survey. This research was also partly supported by the National Aeronautics and Space Administration, Grant 80NSSC17K0287. Hydrodynamic modeling was also supported, in part, by COMPASS-GLM, a multi-institutional project supported by the U.S. Department of Energy, Office of Science, Office of Biological and Environmental Research, Earth and Environmental Systems Modeling program. This is NOAA GLERL contribution no. 2003. The contents of the work are solely the responsibility of the authors and do not necessarily represent the views of the agencies or programs.
This research has been supported by the National Aeronautics and Space Administration (grant no. 80NSSC17K0287), United States Geological Survey (grant no. G21AC10141), and the U.S. Department of Energy, Office of Science.
This paper was edited by Charles Onyutha and reviewed by three anonymous referees.
Anderson, E. J., Fujisaki-Manome, A., Kessler, J., Lang, G. A., Chu, P. Y., Kelley, J. G., Chen, Y., and Wang, J.: Ice forecasting in the next-generation Great Lakes operational forecast system (GLOFS), J. Mar. Sci. Eng., 6, 123, https://doi.org/10.3390/jmse6040123, 2018. a, b, c
Austin, J. and Colman, S.: A century of temperature variability in Lake Superior, Limnol. Oceanogr., 53, 2724–2730, 2008. a
Austin, J. A. and Colman, S. M.: Lake Superior summer water temperatures are increasing more rapidly than regional air temperatures: A positive ice-albedo feedback, Geophys. Res. Lett., 34, L06604, https://doi.org/10.1029/2006GL029021, 2007. a
Basile, S. J., Rauscher, S. A., and Steiner, A. L.: Projected precipitation changes within the Great Lakes and Western Lake Erie Basin: a multi-model analysis of intensity and seasonality, Int. J. Climatol., 37, 4864–4879, 2017. a
Bennington, V., Notaro, M., and Holman, K. D.: Improving climate sensitivity of deep lakes within a regional climate model and its impact on simulated climate, J. Climate, 27, 2886–2911, 2014. a, b, c
Briley, L. J., Rood, R. B., and Notaro, M.: Large lakes in climate models: A Great Lakes case study on the usability of CMIP5, J. Great Lakes Res., 47, 405–418, 2021. a
Byun, K. and Hamlet, A. F.: Projected changes in future climate over the Midwest and Great Lakes region using downscaled CMIP5 ensembles, Int. J. Climatol., 38, e531–e553, 2018. a, b, c, d, e, f
Byun, K., Chiu, C.-M., and Hamlet, A. F.: Effects of 21st century climate change on seasonal flow regimes and hydrologic extremes over the Midwest and Great Lakes region of the US, Sci. Total Environ., 650, 1261–1277, 2019. a
Chen, C., Liu, H., and Beardsley, R. C.: An unstructured grid, finite-volume, three-dimensional, primitive equations ocean model: application to coastal ocean and estuaries, J. Atmos. Ocean. Tech., 20, 159–186, 2003. a
Chen, C., Beardsley, R.C., Cowles, G., Qi, J., Lai, Z., Gao, G., David Stuebe, D., Liu, H., Xu, Q., Xue. P., Ge, J., Hu, S., Ji, R., Tian, R., Huang, H., Wu, L., Lin, H., Sun, Y., and Zhao L.: An unstructured grid, finite-volume community ocean model, FVCOM user manual, 4th Edn., SMAST/UMASSD Technical Report-13-0701, 404 pp., 2013. a
Cherkauer, K. A. and Sinha, T.: Hydrologic impacts of projected future climate change in the Lake Michigan region, J. Great Lakes Res., 36, 33–50, 2010. a, b
Collingsworth, P. D., Bunnell, D. B., Murray, M. W., Kao, Y.-C., Feiner, Z. S., Claramunt, R. M., Lofgren, B. M., Höök, T. O., and Ludsin, S. A.: Climate change as a long-term stressor for the fisheries of the Laurentian Great Lakes of North America, Rev. Fish Biol. Fish., 27, 363–391, 2017. a
Craig, A., Valcke, S., and Coquart, L.: Development and performance of a new version of the OASIS coupler, OASIS3-MCT_3.0, Geosci. Model Dev., 10, 3297–3308, https://doi.org/10.5194/gmd-10-3297-2017, 2017. a
Daloğlu, I., Cho, K. H., and Scavia, D.: Evaluating causes of trends in long-term dissolved reactive phosphorus loads to Lake Erie, Environ. Sci. Technol., 46, 10660–10666, 2012. a
Delaney, F. and Milner, G.: The State of Climate Modeling in the Great Lakes Basin – A Synthesis in Support of a Workshop held on June 27, 2019 in Ann Arbor, MI, https://climateconnections.ca/app/uploads/2020/05/The-State-of-Climate-Modeling-in-the-Great-Lakes-Basin_Sept132019.pdf (last access: 31 May 2022), 2019. a
Dobiesz, N. E. and Lester, N. P.: Changes in mid-summer water temperature and clarity across the Great Lakes between 1968 and 2002, J. Great Lakes Res., 35, 371–384, 2009. a, b
d'Orgeville, M., Peltier, W. R., Erler, A. R., and Gula, J.: Climate change impacts on Great Lakes Basin precipitation extremes, J. Geophys. Res.-Atmos., 119, 10–799, 2014. a
Environmental Protection Agency (EPA): State of the Great Lakes 2011, EPA 950-R-13-002, https://archive.epa.gov/solec/web/pdf/sogl-2011-technical-report-en.pdf (last access: 31 May 2022), 2014. a, b
Feser, F., Rockel, B., von Storch, H., Winterfeldt, J., Zahn, M., Feser, F., Rockel, B., Storch, H. v., Winterfeldt, J., and Zahn, M.: Regional climate models add value to global model data: a review and selected examples, B. Am. Meteorol. Soc., 92, 1181–1192, 2011. a
Fujisaki, A., Wang, J., Hu, H., Schwab, D. J., Hawley, N., and Rao, Y. R.: A modeling study of ice–water processes for Lake Erie applying coupled ice-circulation models, J. Great Lakes Res., 38, 585–599, 2012. a
Fujisaki, A., Wang, J., Bai, X., Leshkevich, G., and Lofgren, B.: Model-simulated interannual variability of Lake Erie ice cover, circulation, and thermal structure in response to atmospheric forcing, 2003–2012, J. Geophys. Res.-Oceans, 118, 4286–4304, 2013. a
Giorgi, F.: Thirty years of regional climate modeling: where are we and where are we going next?, J. Geophys. Res.-Atmos., 124, 5696–5723, 2019. a
Giorgi, F. and Mearns, L. O.: Calculation of average, uncertainty range, and reliability of regional climate changes from AOGCM simulations via the “reliability ensemble averaging” (REA) method, J. Climate, 15, 1141–1158, 2002. a, b
Giorgi, F., Coppola, E., Solmon, F., Mariotti, L., Sylla, M. B., Bi, X., Elguindi, N., Diro, G. T., Nair, V., Giuliani, G., Turuncoglu, U. U., Cozzini, S., Güttler, I., O'Brien, T. A., Tawfik, A. B., Shalaby, A., Zakey, A. S., Steiner, A. L., Stordal, F., Sloan, L. C., and Brankovic, C.: RegCM4: model description and preliminary tests over multiple CORDEX domains, Clim. Res., 52, 7–29, 2012. a
Gula, J. and Peltier, W. R.: Dynamical downscaling over the Great Lakes basin of North America using the WRF regional climate model: The impact of the Great Lakes system on regional greenhouse warming, J. Climate, 25, 7723–7742, 2012. a, b
Harris, I., Jones, P. D., Osborn, T. J., and Lister, D. H.: Updated high-resolution grids of monthly climatic observations – the CRU TS3. 10 Dataset, Int. J. Climatol., 34, 623–642, 2014. a
Hayhoe, K., VanDorn, J., Croley II, T., Schlegal, N., and Wuebbles, D.: Regional climate change projections for Chicago and the US Great Lakes, J. Great Lakes Res., 36, 7–21, 2010. a
Hostetler, S. W., Bates, G. T., and Giorgi, F.: Interactive coupling of a lake thermal model with a regional climate model, J. Geophys. Res.-Atmos., 98, 5045–5057, 1993. a
Huang, C.: Model Code for manuscript “Climate Projections over the Great Lakes Region: Using Two-way Coupling of a Regional Climate Model with a 3-D Lake Model”, Zenodo [code], https://doi.org/10.5281/zenodo.6534139, 2022a. a
Huang, C.: Validation Data used for manuscript “Climate Projections over the Great Lakes Region: Using Two-way Coupling of a Regional Climate Model with a 3-D Lake Model”, Zenodo [data set], https://doi.org/10.5281/zenodo.6540504, 2022b. a
Huang, C., Kuczynski, A., Auer, M. T., O’Donnell, D. M., and Xue, P.: Management transition to the Great Lakes nearshore: Insights from hydrodynamic modeling, J. Mar. Sci. Eng., 7, 129, https://doi.org/10.3390/jmse7050129, 2019. a
Huang, C., Anderson, E., Liu, Y., Ma, G., Mann, G., and Xue, P.: Evaluating essential processes and forecast requirements for meteotsunami-induced coastal flooding, Natural Hazards, 1–26, 2021a. a, b
Huang, C., Zhu, L., Ma, G., Meadows, G. A., and Xue, P.: Wave Climate Associated With Changing Water Level and Ice Cover in Lake Michigan, Front. Marine Sci., 8, 746916, https://doi.org/10.3389/fmars.2021.746916, 2021b. a, b
Ibrahim, H. D., Xue, P., and Eltahir, E. A.: Multiple salinity equilibria and resilience of Persian/Arabian Gulf basin salinity to brine discharge, Front. Marine Sci., 7, 573, https://doi.org/10.3389/fmars.2020.00573, 2020. a
IPCC: Climate Change 2013: The Physical Science Basis. Contribution of Working Group I to the Fifth Assessment Report of the Intergovernmental Panel on Climate Change, edited by: Stocker, T. F., Qin, D., Plattner, G.-K., Tignor, M., Allen, S. K., Boschung, J., Nauels, A., Xia, Y., Bex, V., and Midgley, P. M., Cambridge University Press, Cambridge, United Kingdom and New York, NY, USA, 1535 pp., 2013. a
IPCC: Climate Change 2021: The Physical Science Basis. Contribution of Working Group I to the Sixth Assessment Report of the Intergovernmental Panel on Climate Change, editedby: Masson-Delmotte, V., Zhai, P., Pirani, A., Connors, S. L., Péan, C., Berger, S., Caud, N., Chen, Y., Goldfarb, L., Gomis, M. I., Huang, M., Leitzell, K., Lonnoy, E., Matthews, J. B. R., Maycock, T. K., Waterfield, T., Yelekçi, O., Yu, R., and Zhou, B., Cambridge University Press, Cambridge, United Kingdom and New York, NY, USA, https://doi.org/10.1017/9781009157896, in press, 2021. a
Jones, M. L., Shuter, B. J., Zhao, Y., and Stockwell, J. D.: Forecasting effects of climate change on Great Lakes fisheries: models that link habitat supply to population dynamics can help, Can. J. Fish. Aqua. Sci., 63, 457–468, 2006. a
Lynch, A. J., Myers, B. J., Chu, C., Eby, L. A., Falke, J. A., Kovach, R. P., Krabbenhoft, T. J., Kwak, T. J., Lyons, J., Paukert, C. P., and Whitney, J. E.: Climate change effects on North American inland fish populations and assemblages, Fisheries, 41, 346–361, 2016. a
MacKay, M. and Seglenieks, F.: On the simulation of Laurentian Great Lakes water levels under projections of global climate change, Climatic Change, 117, 55–67, 2013. a
Mailhot, E., Music, B., Nadeau, D. F., Frigon, A., and Turcotte, R.: Assessment of the Laurentian Great Lake'’ hydrological conditions in a changing climate, Climatic Change, 157, 243–259, 2019. a
McCormick, M. J. and Fahnenstiel, G. L.: Recent climatic trends in nearshore water temperatures in the St. Lawrence Great Lakes, Limnol. Oceanogr., 44, 530–540, 1999. a
Melillo, J. M., Richmond, T., and Yohe, G. (Eds.): Climate Change Impacts in the United States: The Third National Climate Assessment, U.S. Global Change Research Program, 841 pp., https://doi.org/10.7930/J0Z31WJ2, 2014. a
Miao, C., Duan, Q., Sun, Q., Huang, Y., Kong, D., Yang, T., Ye, A., Di, Z., and Gong, W.: Assessment of CMIP5 climate models and projected temperature changes over Northern Eurasia, Environ. Res. Lett., 9, 055007, https://doi.org/10.1088/1748-9326/9/5/055007, 2014. a
Music, B., Frigon, A., Lofgren, B., Turcotte, R., and Cyr, J.-F.: Present and future Laurentian Great Lakes hydroclimatic conditions as simulated by regional climate models with an emphasis on Lake Michigan-Huron, Climatic Change, 130, 603–618, 2015. a
Notaro, M., Bennington, V., and Vavrus, S.: Dynamically downscaled projections of lake-effect snow in the Great Lakes basin, J. Climate, 28, 1661–1684, 2015. a, b, c, d, e, f, g, h, i, j, k, l, m
Notaro, M., Zhong, Y., Xue, P., Peters-Lidard, C., Cruz, C., Kemp, E., Kristovich, D., Kulie, M., Wang, J., Huang, C., and Vavrus, S. J.: Cold Season Performance of the NU-WRF Regional Climate Model in the Great Lakes Region, J. Hydrometeorol., 22, 2423–2454, 2021. a
Oleson, K., Lawrence, D., Bonan, G., Drewniak, B., Huang, M., Koven, C., Levis, S., Li, F., Riley, W., Subin, Z., Swenson, S., Thornton, P., Bozbiyik, A., Fisher, R., Heald, C., Kluzek, E., Lamarque, J.-F., Lawrence, P., Leung, L., Lipscomb, W., Muszala, S., Ricciuto, D., Sacks, W., Sun, Y., Tang, J., and Yang, Z.-L.: Technical description of version 4.5 of the Community Land Model (CLM), Tech. rep., https://doi.org/10.5065/D6RR1W7M, 2013. a
Oleson, K. W., Lawrence, D. M., Gordon, B., Flanner, M. G., Kluzek, E., Peter, J., Levis, S., Swenson, S. C., Thornton, E., Feddema, J., Heald, C. L., Hoffman, F., Lamarque, J.-F., Mahowald, N., Niu, G.-Y., Qian, T., Randerson, J., Running, S., Sakaguchi, K., Slater, A., Stockli, R., Wang, A., Yang, Z.-L., Zeng, X., and Zeng, X.: Technical description of version 4.0 of the Community Land Model (CLM), https://doi.org/10.5065/D6FB50WZ, 2010. a
Poesch, M. S., Chavarie, L., Chu, C., Pandit, S. N., and Tonn, W.: Climate change impacts on freshwater fishes: a Canadian perspective, Fisheries, 41, 385–391, 2016. a
Pryor, S. C., Scavia, D., Downer, C., Gaden, M., Iverson, L., Nordstrom, R., Patz, J., and Robertson, G. P.: chap. 18: Midwest. Climate change impacts in the United States: The third national climate assessment, in: National Climate Assessment Report, edited by: Melillo, J. M., Richmond, T. C., and Yohe, G. W., Washington, DC: US Global Change Research Program, 418–440, https://doi.org/10.7930/J0J1012N, 2014. a
Rau, E., Vaccaro, L., Riseng, C., and Read, J.: The dynamic great lakes economy employment trends from 2009 to 2018, https://www.michiganseagrant.org/wp-content/uploads/2020/10/MICHU-20-203Great-Lakes-Jobs-Report.pdf (last access: 31 May 2022), 2020. a
Scavia, D., Allan, J. D., Arend, K. K., Bartell, S., Beletsky, D., Bosch, N. S., Brandt, S. B., Briland, R. D., Daloğlu, I., DePinto, J. V., Dolan, D. M., Evans, M. A., Farmer, T. M., Goto, D., Han, H., Höök, T. O., Knight, R., Ludsin, S. A., Mason, D., Michalak, A. M., Richards, R. P., Roberts, J. J., Rucinski, D. K., Rutherford, E., Schwab, D. J., Sesterhenn, T. M., Zhang, H., and Zho, Y.: Assessing and addressing the re-eutrophication of Lake Erie: Central basin hypoxia, J. Great Lakes Res., 40, 226–246, 2014. a
Schwalm, C. R., Glendon, S., and Duffy, P. B.: RCP8. 5 tracks cumulative CO2 emissions, P. Natl. Acad. Sci. USA, 117, 19656–19657, 2020. a
Sharma, S., Jackson, D. A., Minns, C. K., and Shuter, B. J.: Will northern fish populations be in hot water because of climate change?, Glob. Change Biol., 13, 2052–2064, 2007. a
Shi, Q. and Xue, P.: Impact of lake surface temperature variations on lake effect snow over the Great Lakes region, J. Geophys. Res.-Atmos., 124, 12553–12567, 2019. a
Subin, Z. M., Riley, W. J., and Mironov, D.: An improved lake model for climate simulations: Model structure, evaluation, and sensitivity analyses in CESM1, J. Adv. Model. Earth Sy., 4, M02001, https://doi.org/10.1029/2011MS000072, 2012. a
Sun, L., Liang, X.-Z., and Xia, M.: Developing the Coupled CWRF-FVCOM Modeling System to Understand and Predict Atmosphere-Watershed Interactions Over the Great Lakes Region, J. Adv. Model. Earth Sy., 12, e2020MS002319, https://doi.org/10.1029/2020MS002319, 2020. a
Wang, G., Yu, M., Pal, J. S., Mei, R., Bonan, G. B., Levis, S., and Thornton, P. E.: On the development of a coupled regional climate–vegetation model RCM–CLM–CN–DV and its validation in Tropical Africa, Clim. Dynam., 46, 515–539, 2016. a
Wang, J., Bai, X., Hu, H., Clites, A., Colton, M., and Lofgren, B.: Temporal and spatial variability of Great Lakes ice cover, 1973–2010, J. Climate, 25, 1318–1329, 2012. a
Wang, S., Sun, X., and Lall, U.: A hierarchical Bayesian regression model for predicting summer residential electricity demand across the USA, Energy, 140, 601–611, 2017. a
Woolway, R. I. and Merchant, C. J.: Worldwide alteration of lake mixing regimes in response to climate change, Nat. Geosci., 12, 271–276, 2019. a
Woolway, R. I., Sharma, S., Weyhenmeyer, G. A., Debolskiy, A., Golub, M., Mercado-Bettín, D., Perroud, M., Stepanenko, V., Tan, Z., Grant, L., Ladwig, R., Mesman, J., Moore, T. N., Shatwell, T., Vanderkelen, I., Austin, J. A., DeGasperi, C. L., Dokulil, M., La Fuente, S., Mackay, E. B., Schladow, S. G., Watanabe, S., Marcé, R., Pierson, D. C., Thiery, W., and Jennings, E.: Phenological shifts in lake stratification under climate change, Nat. Commun., 12, 1–11, 2021. a, b
Wuebbles, D., Cardinale, B., Cherkauer, K., Davidson-Arnott, R., Hellmann, J., Infante, D., and Ballinger, A.: An assessment of the impacts of climate change on the Great Lakes, Environmental Law & Policy Center, https://elpc.org/wp-content/uploads/2020/04/2019-ELPCPublication-Great-Lakes-Climate-Change-Report.pdf (last access: 31 May 2022), 2019. a, b, c, d
Xiao, C., Lofgren, B. M., Wang, J., and Chu, P. Y.: A dynamical downscaling projection of future climate change in the Laurentian Great Lakes region using a coupled air-lake model, Preprints, https://doi.org/10.20944/preprints201807.0468.v1, 2018. a, b, c, d, e, f, g
Xue, P., Eltahir, E. A., Malanotte-Rizzoli, P., and Wei, J.: Local feedback mechanisms of the shallow water region around the M aritime C ontinent, J. Geophys. Res.-Oceans, 119, 6933–6951, 2014. a
Xue, P., Schwab, D. J., and Hu, S.: An investigation of the thermal response to meteorological forcing in a hydrodynamic model of Lake Superior, J. Geophys. Res.-Oceans, 120, 5233–5253, 2015. a, b
Xue, P., Pal, J. S., Ye, X., Lenters, J. D., Huang, C., and Chu, P. Y.: Improving the simulation of large lakes in regional climate modeling: Two-way lake–atmosphere coupling with a 3D hydrodynamic model of the Great Lakes, J. Climate, 30, 1605–1627, 2017. a, b
Xue, P., Malanotte-Rizzoli, P., Wei, J., and Eltahir, E. A.: Coupled ocean-atmosphere modeling over the Maritime Continent: A review, J. Geophys. Res.-Oceans, 125, e2019JC014978, https://doi.org/10.1029/2019JC014978, 2020. a
Ye, X., Anderson, E. J., Chu, P. Y., Huang, C., and Xue, P.: Impact of water mixing and ice formation on the warming of Lake Superior: A model-guided mechanism study, Limnol. Oceanogr., 64, 558–574, 2019. a
Ye, X., Chu, P. Y., Anderson, E. J., Huang, C., Lang, G. A., and Xue, P.: Improved thermal structure simulation and optimized sampling strategy for Lake Erie using a data assimilative model, J. Great Lakes Res., 46, 144–158, 2020. a
Zhang, L., Zhao, Y., Hein-Griggs, D., and Ciborowski, J. J.: Projected monthly temperature changes of the Great Lakes Basin, Environ. Res., 167, 453–467, 2018. a
Zhang, L., Zhao, Y., Hein-Griggs, D., Barr, L., and Ciborowski, J. J.: Projected extreme temperature and precipitation of the Laurentian Great Lakes Basin, Global Planet. Change, 172, 325–335, 2019. a, b, c
Zhang, L., Zhao, Y., Hein-Griggs, D., Janes, T., Tucker, S., and Ciborowski, J. J.: Climate change projections of temperature and precipitation for the great lakes basin using the PRECIS regional climate model, J. Great Lakes Res., 46, 255–266, 2020. a, b, c, d, e, f
Zhong, Y., Notaro, M., Vavrus, S. J., and Foster, M. J.: Recent accelerated warming of the Laurentian Great Lakes: Physical drivers, Limnol. Oceanogr., 61, 1762–1786, 2016. a