the Creative Commons Attribution 4.0 License.
the Creative Commons Attribution 4.0 License.
 | 28 Apr 2022
Improved runoff simulations for a highly varying soil depth and complex terrain watershed in the Loess Plateau with the Community Land Model version 5
Jiming Jin
Lei Wang
Jie Yang
Bingcheng Si
Guo-Yue Niu
This study aimed to improve runoff simulations and explore deep soil hydrological processes for a watershed in the center of the Loess Plateau (LP), China. This watershed, the Wuding River Basin (WRB), has very complex topography, with soil depths ranging from 0 to 197 m. The hydrological model used for our simulations was Community Land Model version 5 (CLM5) developed by the National Center for Atmospheric Research. Actual soil depths and river channels were incorporated into CLM5 to realistically represent the physical features of the WRB. Through sensitivity tests, CLM5 with 150 soil layers with the observed variable soil depths produced the most reasonable results and was adopted for this study. Our results showed that CLM5 with actual soil depths significantly suppressed unrealistic variations of the simulated subsurface runoff when compared to the default simulations. In addition, when compared with the default version with 20 soil layers, CLM5 with 150 soil layers slightly improved runoff simulations but generated simulations with much smoother vertical water flows that were consistent with the uniform distribution of soil textures in our study watershed. The runoff simulations were further improved by the addition of river channels to CLM5, where the seasonal variability of the simulated runoff was reasonably captured. Moreover, the magnitude of the simulated runoff remarkably decreased with increased soil evaporation by lowering the soil water content threshold, which triggers surface resistance. The lowered threshold was consistent with the loess soil, which has a high sand component. Such soils often generate stronger soil evaporation than soils dominated by clay. Finally, with the above changes in CLM5, the simulated total runoff matched very closely with observations. When compared with those for the default runoff simulations, the correlation coefficient, root mean square error, and Nash–Sutcliffe coefficient for the improved simulations changed dramatically from 0.02, 10.37 mm, and −12.34 to 0.62, 1.8 mm, and 0.61. The results in this study provide strong physical insight for further investigation of hydrological processes in complex terrain with deep soils.
- Article
(3950 KB) - Full-text XML
- BibTeX
- EndNote


Understanding runoff processes in regions with very complex topography is important for managing and predicting water resources. Such an understanding can assist in quantifying the allocation of water resources (Chen et al., 2013; Camacho et al., 2015), evaluating surface and groundwater vulnerability to natural and anthropogenic processes (Uhlenbrook et al., 2002), improving drought and flood management (Camacho et al., 2015), and predicting the amount and spatiotemporal distribution of water resources (Saraiva Okello et al., 2018). However, complex topography leads to intricate runoff processes (Jencso et al., 2011), causing uncertain estimation of water resources. Therefore, it is crucial to investigate runoff processes for the wellbeing of topographically complex regions.
As the largest area covered by continuous loess soils in the world (Fu et al., 2017; Zhu et al., 2018), the Loess Plateau (LP) in China has complicated hydrological processes because of its extremely complex topography and unique soil types. Due to an arid and semi-arid climate and a population of more than 100 million (Zhang et al., 2018), this region experiences severe water shortages (Xiao et al., 2019). It is essential to accurately estimate the spatiotemporal distribution of water resources in this region of complex terrain. Soil depth in the LP can reach 350 m (Zhu et al., 2018; Li et al., 2019), making it difficult to measure deep soil hydrological processes and understand runoff generation (Shao et al., 2018; Liu et al., 2012). In addition, terrain in the LP includes loess tablelands, ridges, hills, gullies, and river channels (Fu, 1989), all of which have quite different runoff generation processes (Liu et al., 2012). In loess tablelands with deep water tables (Huang et al., 2013; Shao et al., 2018), the soils store most infiltrated water, generate insignificant surface runoff, and remarkably delay subsurface runoff. Areas in the LP with gullies and river channels usually have high water tables (Liu et al., 2012) and can easily be saturated during precipitation events, generating a large amount of surface runoff. Especially, extreme rainfall events that mostly occur over the summer monsoon season (Tian et al., 2020) produce strong soil erosion and a large amount of fast infiltration-excess surface runoff to the river channels in hillslope areas, sometimes causing severe flooding. In the meantime, the loess soils that dominate the LP have a large capillary porosity, with loose and homogeneous textures due to a high sand component, often resulting in high evaporation (Li et al., 1985; Lei, 1987; Han et al., 1990; Wang and Shao, 2013). A better understanding of the hydrological processes within the complex terrain and special soil types of the LP is vital to improving the prediction of water resources in this region.
Numerical hydrological models are essential tools to investigate runoff processes in the LP. Field measurements such as those from tracer techniques (Huang and Pang, 2011; Li et al., 2017; Huang et al., 2017, 2019; Xiang et al., 2019) have been made to quantify the hydrological processes in the LP, but these measurements have significant limitations, including short temporal and small spatial coverage, which cannot account for the processes at watershed scales. Hydrological models based on mass and energy equations are effective in simulating the long-term spatiotemporal variability of runoff at watershed scales (Döll and Fiedler, 2008; Turkeltaub et al., 2015; Shao et al., 2018). Hydrological models can also simulate the quantity of different components in the water budget (e.g., surface runoff, subsurface, etc.) that are difficult or impossible to be measured directly. Based on detailed soil information at a depth of 98 m at a research site on the Changwu tableland in the LP, Shao et al. (2018) used a hydrological model to generate reasonable simulations for deep soil percolation and groundwater level. Their study provides important clues (e.g., high-resolution soil layering) for exploring deep soil hydrological processes and producing reliable runoff simulations at a watershed scale in the LP. Therefore, it is apparent that hydrological models can overcome the drawbacks of field experiments.
However, in hydrological models, soil depth and river channels are very important in simulating soil water movement and storage and runoff processes, especially in regions with complex topography (Tesfa et al., 2009; Fu et al., 2011). Soil depth is set to a constant in most hydrological models (Shangguan et al., 2017). For example, the Noah (Ek et al., 2003) and Noah-MP (Niu et al., 2011) models have a fixed soil depth of 2 m, which cannot represent the realistic spatial distribution of soil depth in the LP, which ranges from 0 to 350 m. In addition, soil depth in most river channels with exposed bedrock in the LP is close to zero (Jing and Cheng, 1983; Li et al., 2017; Zhu et al., 2018), and areas dominated by these channels are very important in generating runoff. Some hydrological models such as the Community Land Model version 5 (CLM5) and the Soil and Water Assessment Tool (Neitsch et al., 2011) have embedded river routing schemes. In these schemes, the river channels described based on elevation differences still have the same soil depth as other places without these channels, which cannot reflect the actual conditions in the LP and many other regions where soil depth changes significantly across rivers. Thus, soil depth variations and river channels need to be considered in hydrological models for better soil water flow and runoff simulations.
The objective of this study was to use CLM5 to improve runoff simulations and better understand the hydrological processes with varying soil depths for a very complex topography watershed in the LP. To achieve this objective, the highly varying soil depths and river channels were incorporated into CLM5 to realistically represent the features of the watershed. In fact, Brunke et al. (2016) have conducted a study with CLM version 4.5 by including varying soil depths at a global scale where the runoff simulations are focused at grid cell scales, which cannot be evaluated with actual streamflow data. However, evaluating hydrological simulations at watershed scales is essential to improving our understanding of runoff processes. In this study, the most important finding was that river channels where the soil depth is often equal or close to zero played a vital role in runoff simulations especially in complex topography areas. According to our extensive literature search, river channels are not configured in most of existing land surface and hydrological models. In addition, although this study focused on a relatively small watershed, our runoff simulation methods and science ideas can be easily transferred to investigate the hydrological processes in other watersheds across the world with observed soil depth and river channel information. The text is laid out as follows: Sects. 2 and 3 introduce the study area and data, respectively, Sect. 4 provides the model description, Sect. 5 describes the methodology, Sect. 6 includes the results, and the conclusions are in Sect. 7.
The Wuding River Basin (WRB) was selected as the study area. This basin, with an area of about 30 261 km2, is in the center of the LP (Fig. 1a), which is the largest continuous loess area in the world (∼ 640 000 km2) (Fu et al., 2017; Zhu et al., 2018). The WRB shows complex geomorphic characteristics including tablelands, ridges, hills, gullies, and river channels (Liu et al., 2012). The main land use types in the WRB are bare ground, grassland, and sparse forest. Across the basin, soil thickness generally ranges from 0 to 200 m (Liu, 2016), and the loess, consisting mainly of silt and sand (Li et al., 1985), is relatively homogeneous in the vertical direction (Huang et al., 2013; Xiang et al., 2019). The WRB has a continental monsoon climate with mean annual precipitation of around 400 mm, about 70 % of which falls during the flood season from June through September, based on observations over the period of 1956–2010 (http://data.cma.cn/, last access: 18 August 2021). Figure 1b shows the geographic distribution of the observed soil depth for the WRB, which is discussed again in Sect. 3.2.
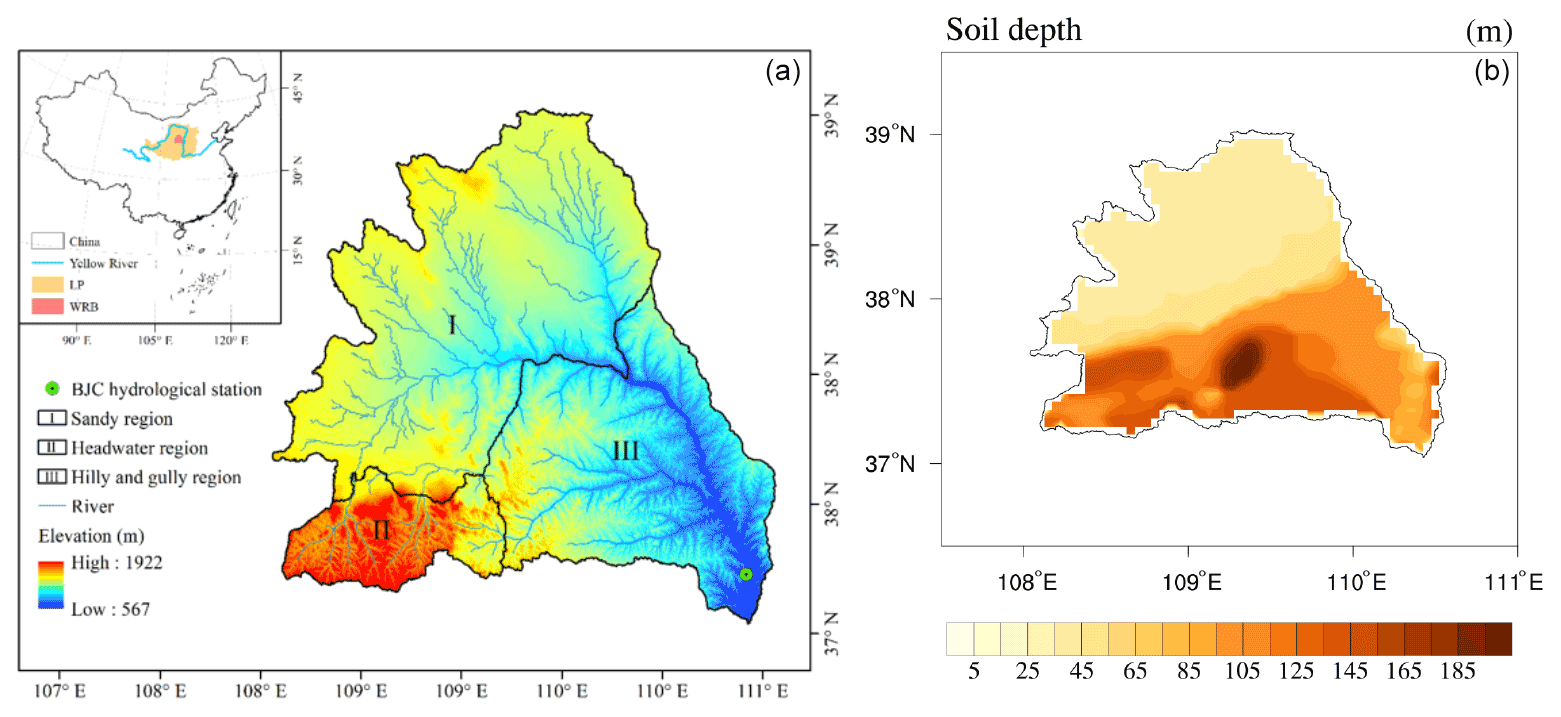
Figure 1(a) Location of the Loess Plateau (LP) and WRB in China; (b) the geographic distribution of the observed soil depth for the WRB.
3.1 Meteorological and runoff data
High-quality meteorological and runoff data for the WRB were used to force and evaluate CLM5, respectively. The Global Soil Wetness Project phase 3 (GSWP3) meteorological dataset (http://hydro.iis.u-tokyo.ac.jp/GSWP3/index.html, last access: 1 July 2020) was selected to drive the model for this study. The GSWP3 dataset contains seven climate forcing variables, including precipitation, air temperature, downward shortwave and longwave radiation, specific humidity, surface pressure, and wind speed. These data cover the period of 1901–2010 with a spatial resolution of 0.5∘ at a 3 h time step. Meanwhile, we obtained the observed monthly runoff data of the Baijiachuan (BJC) hydrological station from the Data Sharing Network of Earth System Science (http://loess.geodata.cn/index.html, last access: 1 May 2021). The BJC station is located at the WRB outlet and its drainage area covers ∼ 98 % of the basin. These runoff data were used to assess CLM5 output.
3.2 Soil data
Soil depth data for the WRB as shown in Fig. 1b were obtained from different sources. We first collected and recorded 61 soil depths for the WRB and nearby areas from ∼ 15 published papers and books (not cited here). In addition, two soil depth maps for the WRB were obtained from Qi et al. (1991) and Wang (2016) and were digitized. Soil depth data for model grids with gullies and rivers were derived based on digital elevation model (DEM) data. Soil depth in gullies and rivers was assumed to be 0 due to the exposure of bedrock (Jing and Cheng, 1983; Li et al., 2017; Zhu et al., 2018). The elevations of these gully and river channels were retrieved from a DEM at a resolution of 90 m. The differences between these elevations and those at a 5 km resolution were used to represent the soil depth in model grids with gullies and rivers. This is different from river routing that is based only on one DEM. The proportion of the total gully and river area to the entire WRB area (defined as Pgr hereafter) was determined with the Cressman method (Cressman, 1959). A value of 0.3 is suggested by Qi et al. (1991) for the LP. In this study, we identified the optimal Pgr value through sensitivity tests by setting different interpolation radii in the Cressman method. The soil depth data from these sources were then combined and interpolated into a 5 km resolution, still based on the Cressman method.
Soil texture data for the WRB were necessary input into CLM5. These data were derived from a soil type map for the LP (http://loess.geodata.cn, last access: 10 June 2020) and included three soil layers: 0–20, 20–76, and 76–180 cm. For soil layers deeper than 180 cm, the texture data for the 76–180 cm layer were applied.
CLM5 was used in this study for runoff simulations. This model was developed by the National Center for Atmospheric Research. The CLM5 includes one vegetation layer, up to five snow layers, and 20 soil layers. In the model, each grid cell is split into different land units including vegetated surface, lake, urban, glacier, and cropland. The spatial distribution and seasonal climatology of the plant functional types for CLM5 are derived from MODIS satellite land surface data products (Lawrence and Chase, 2007). CLM5 uses the simplified TOPMODEL (Niu et al., 2005) to parameterize runoff, which is partitioned into surface and subsurface runoff. Surface runoff is calculated based on the saturation-excess mechanism. Subsurface runoff is produced when saturated conditions occur within the soil column. CLM5 is attached with a river routing module for runoff simulations. However, in this study, we focused our simulations on a monthly time scale at which the river flow should be able to travel from the farthest point to the outlet of the WRB with an area of 30 261 km2 that can easily fit into a 200 by 200 km box. Thus, we turned off the river routing module during our simulations and used the total runoff over the entire watershed for comparison with observations.
In CLM5, soil evaporation is affected by soil resistance, which is associated with a dry surface layer (DSL) (Swenson and Lawrence, 2014). A DSL forms near the soil surface in the model when the soil water content in the top layer is below a threshold value (SWCth), which is set to 80 % of the soil porosity of the top layer (SWCsat,1). The formation of the DSL generates soil resistance, limiting soil evaporation. Meanwhile, CLM5 uses Richard's equation and Darcy's law to describe changes in soil water content (SWC) and soil water flux. The soil hydraulic conductivity and retention used in these equations are determined by the soil texture and the SWC of the previous time step, based on Clapp and Hornberger (1978), Cosby et al. (1984), and Lawrence and Slater (2008).
5.1 Soil layering
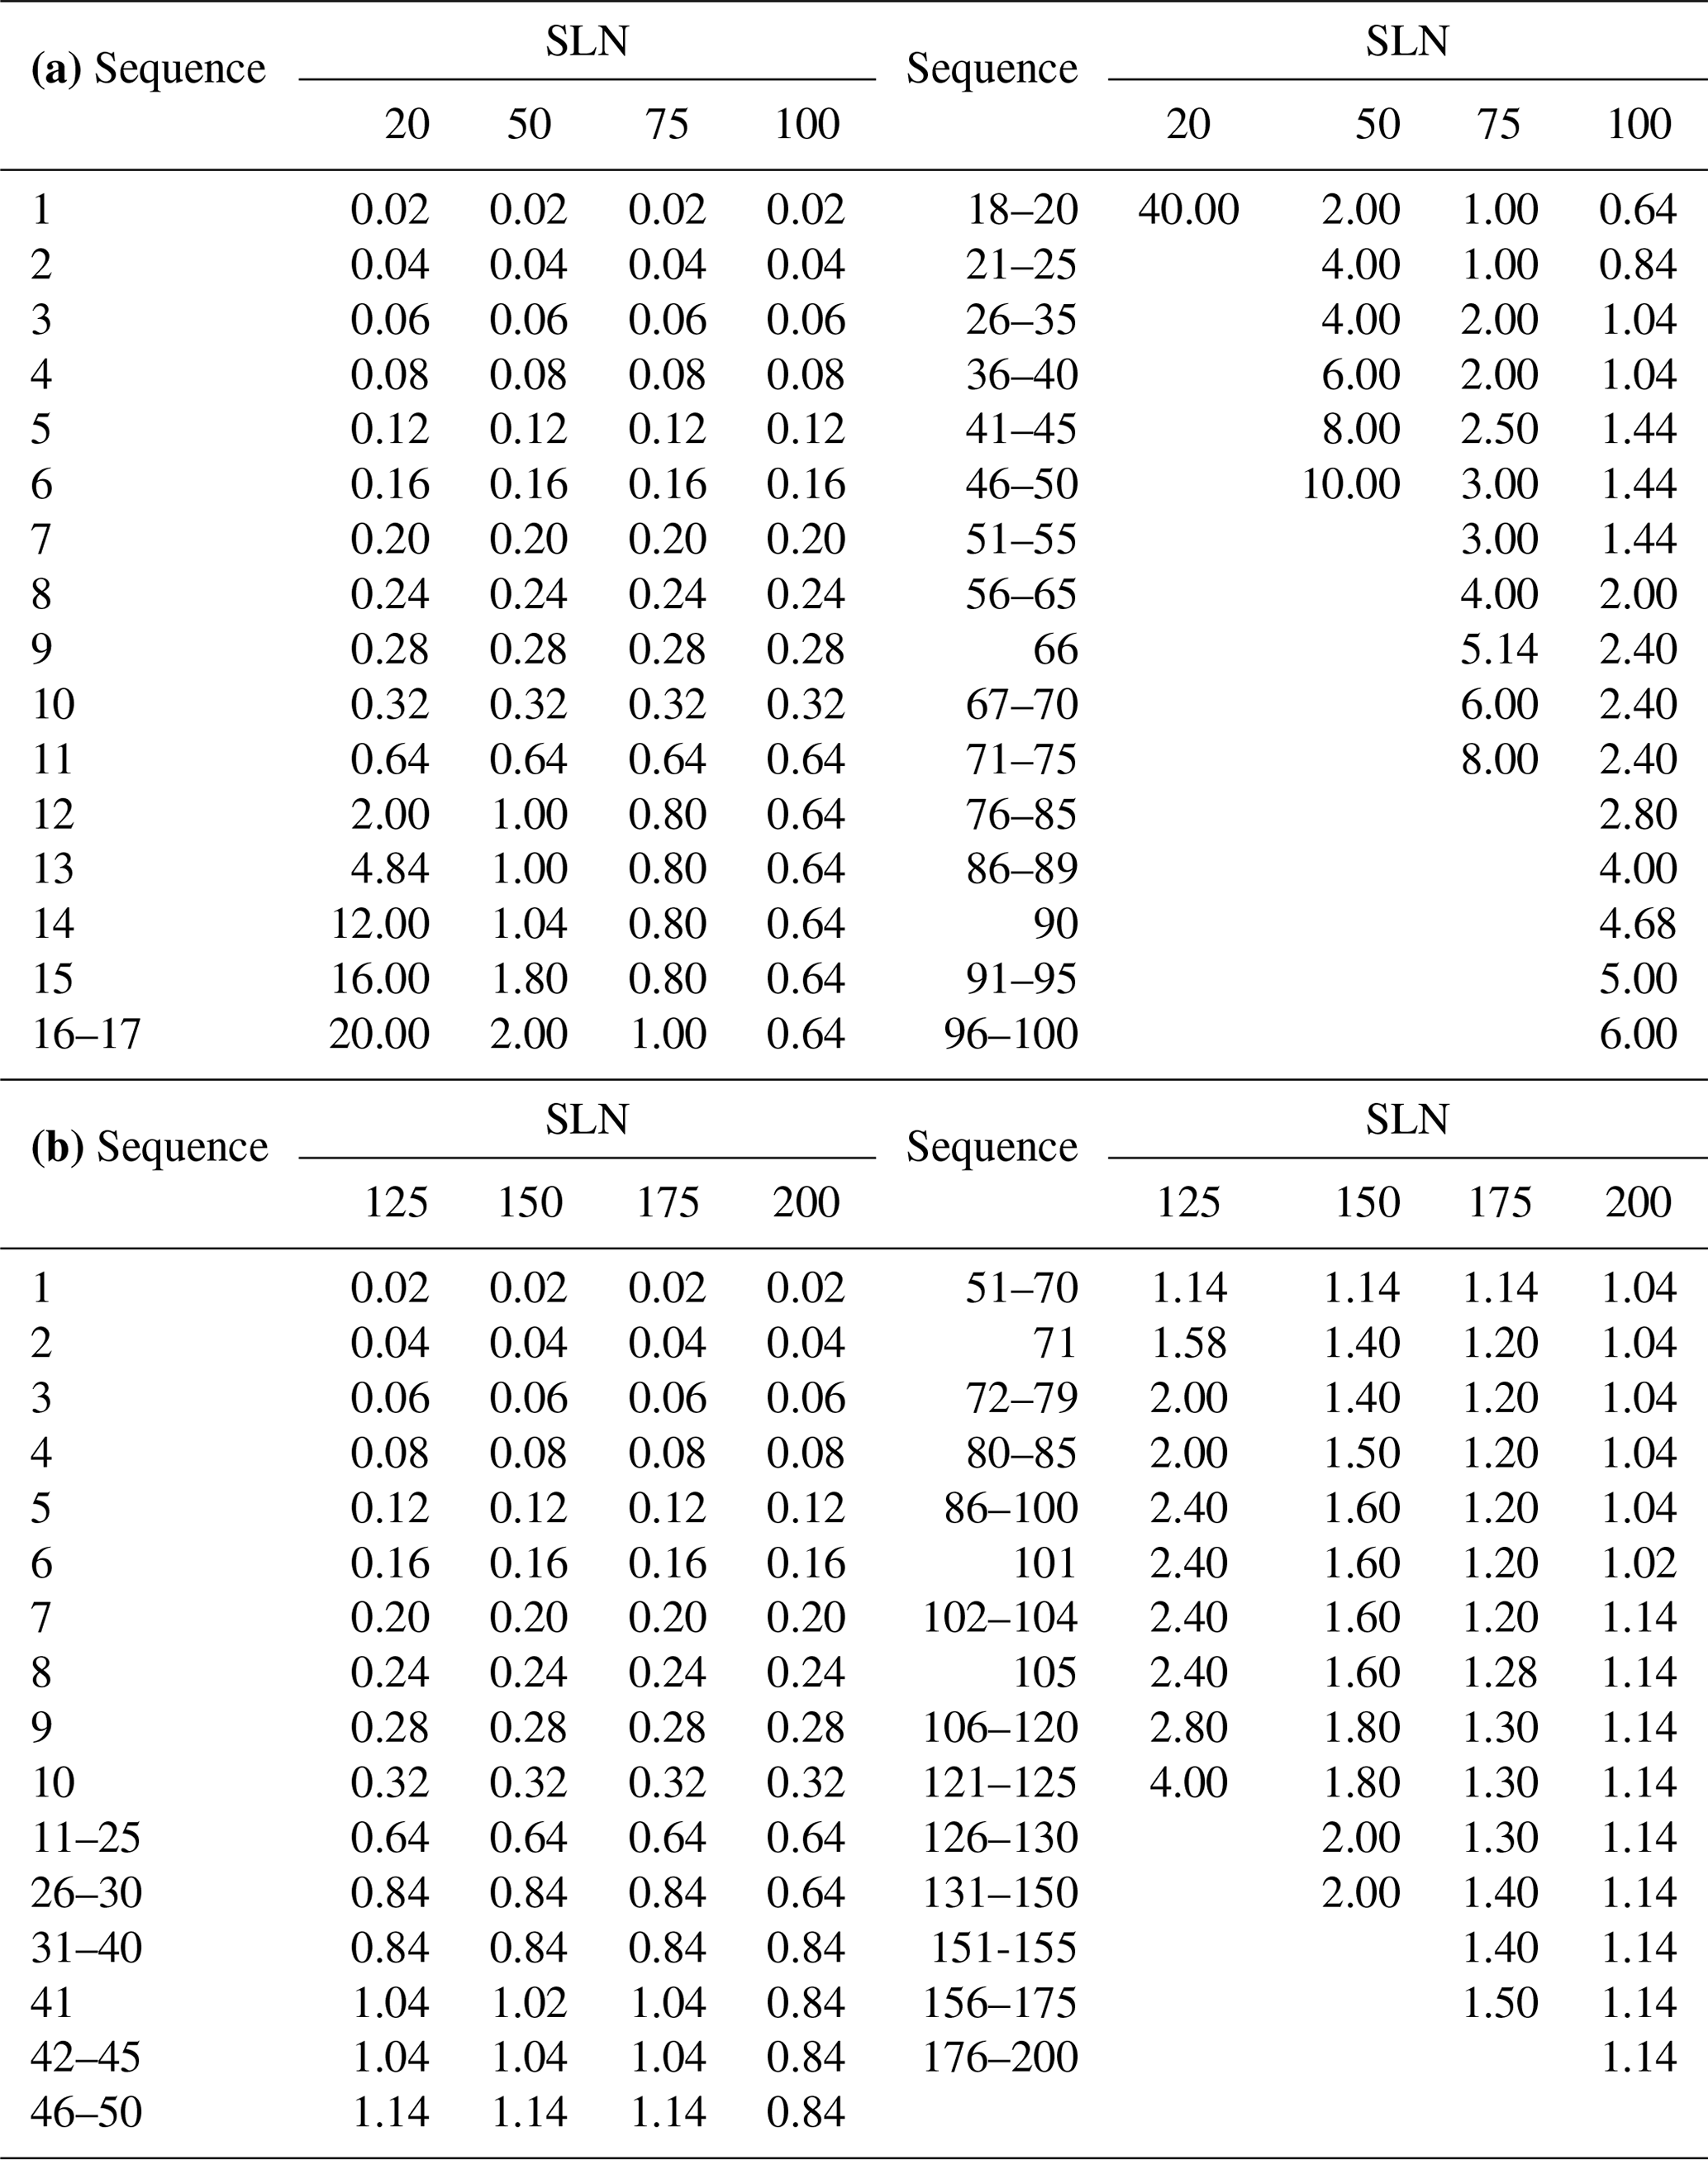
As mentioned earlier, actual soil depth in the WRB is strongly variable, with a range of ∼ 0–197 m (Fig. 1b). In our default run, the soil depth in CLM5 was set to a constant of 8.6 m (see Table 2.2.3 in Lawrence et al., 2018) and is discretized into 20 layers defined as hydrological active layers (HALs) to distinguish them from the five bedrock layers set in the model. In this study, we compared the simulations with a default fixed soil depth to those with the observed variable soil depths for the WRB based on the soil depth data shown in Fig. 1b. Eight sensitivity tests were conducted with soil layer numbers (SLNs) of 20, 50, 75, 100, 125, 150, 175, and 200 to determine the optimal soil layering method for runoff simulations in the WRB (Tables 1a and b). In each sensitivity test, the SLN is the same for the entire WRB, and the HAL number is identified based on the input soil depth for each soil column. Layers that are not HALs are treated as bedrock layers and are not used in the hydrology calculations in the model. These sensitivity simulations were compared to those with the default options of CLM to examine how the vertical resolution with observed variable soil depths affected the runoff simulations for the WRB.
Table 1(a) Thickness (m) of each soil layer for different SLNs (20, 50, 75, and 100). (b) Thickness (m) of each soil layer for different SLNs (125, 150, 175, and 200).
5.2 Model spinup and simulations
All runs in this study needed model spinup to ensure that the soil moisture of each HAL reached equilibrium. We found that the spinup period could last for more than 50 years for different initial SWC conditions and soil depths in the WRB. The initial SWC was set to 0.2 mm3 mm−3, and we performed two cycles of continuous simulations over the period of 1901–2010. The first cycle was discarded as spinup, and the second cycle was retained for analysis. Through these spinup runs, the SWC at all model grids can reach the equilibrium state (an example is given in Fig. 5 where the soil has the deepest depth of 197 m in our simulation domain). In this study, each sensitivity run had its own spinup cycles.
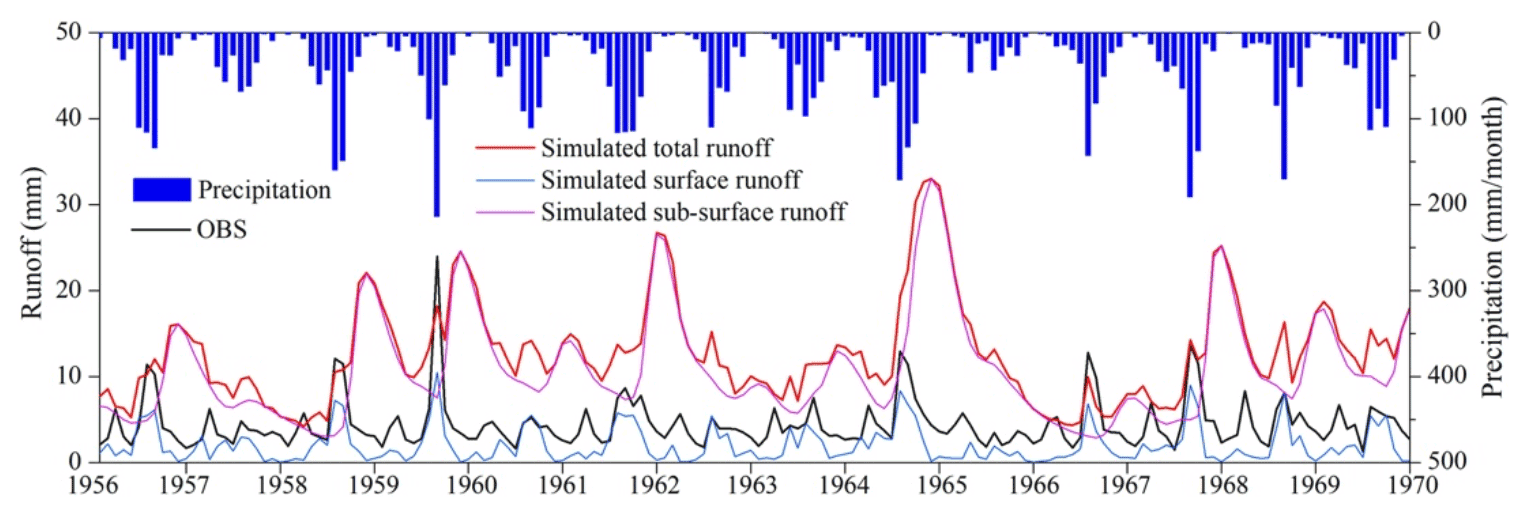
Figure 2Observed monthly precipitation and runoff (black line) and simulated total runoff, surface runoff, and subsurface runoff in the default run from 1956 to 1969. The observed monthly precipitation is for the entire WRB, and the OBS (observations) and simulations are for the BJC hydrological station.
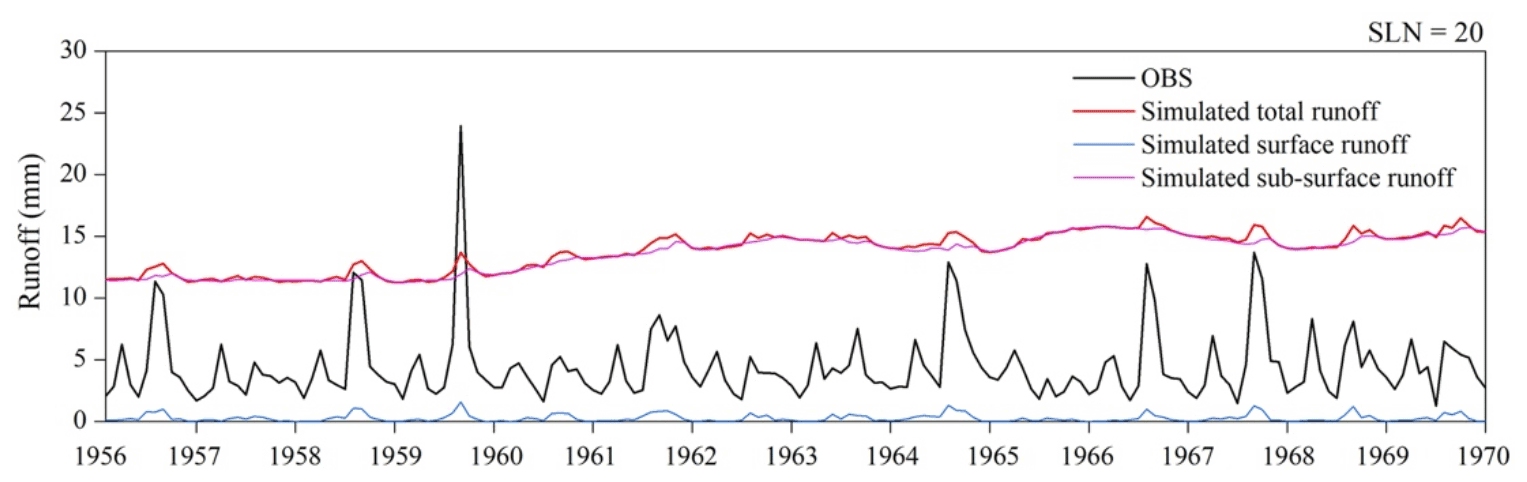
Figure 3Observed and simulated total runoff, surface runoff, and subsurface runoff from 1956 to 1969 by the run with actual soil depths. The SLN was set to 20.
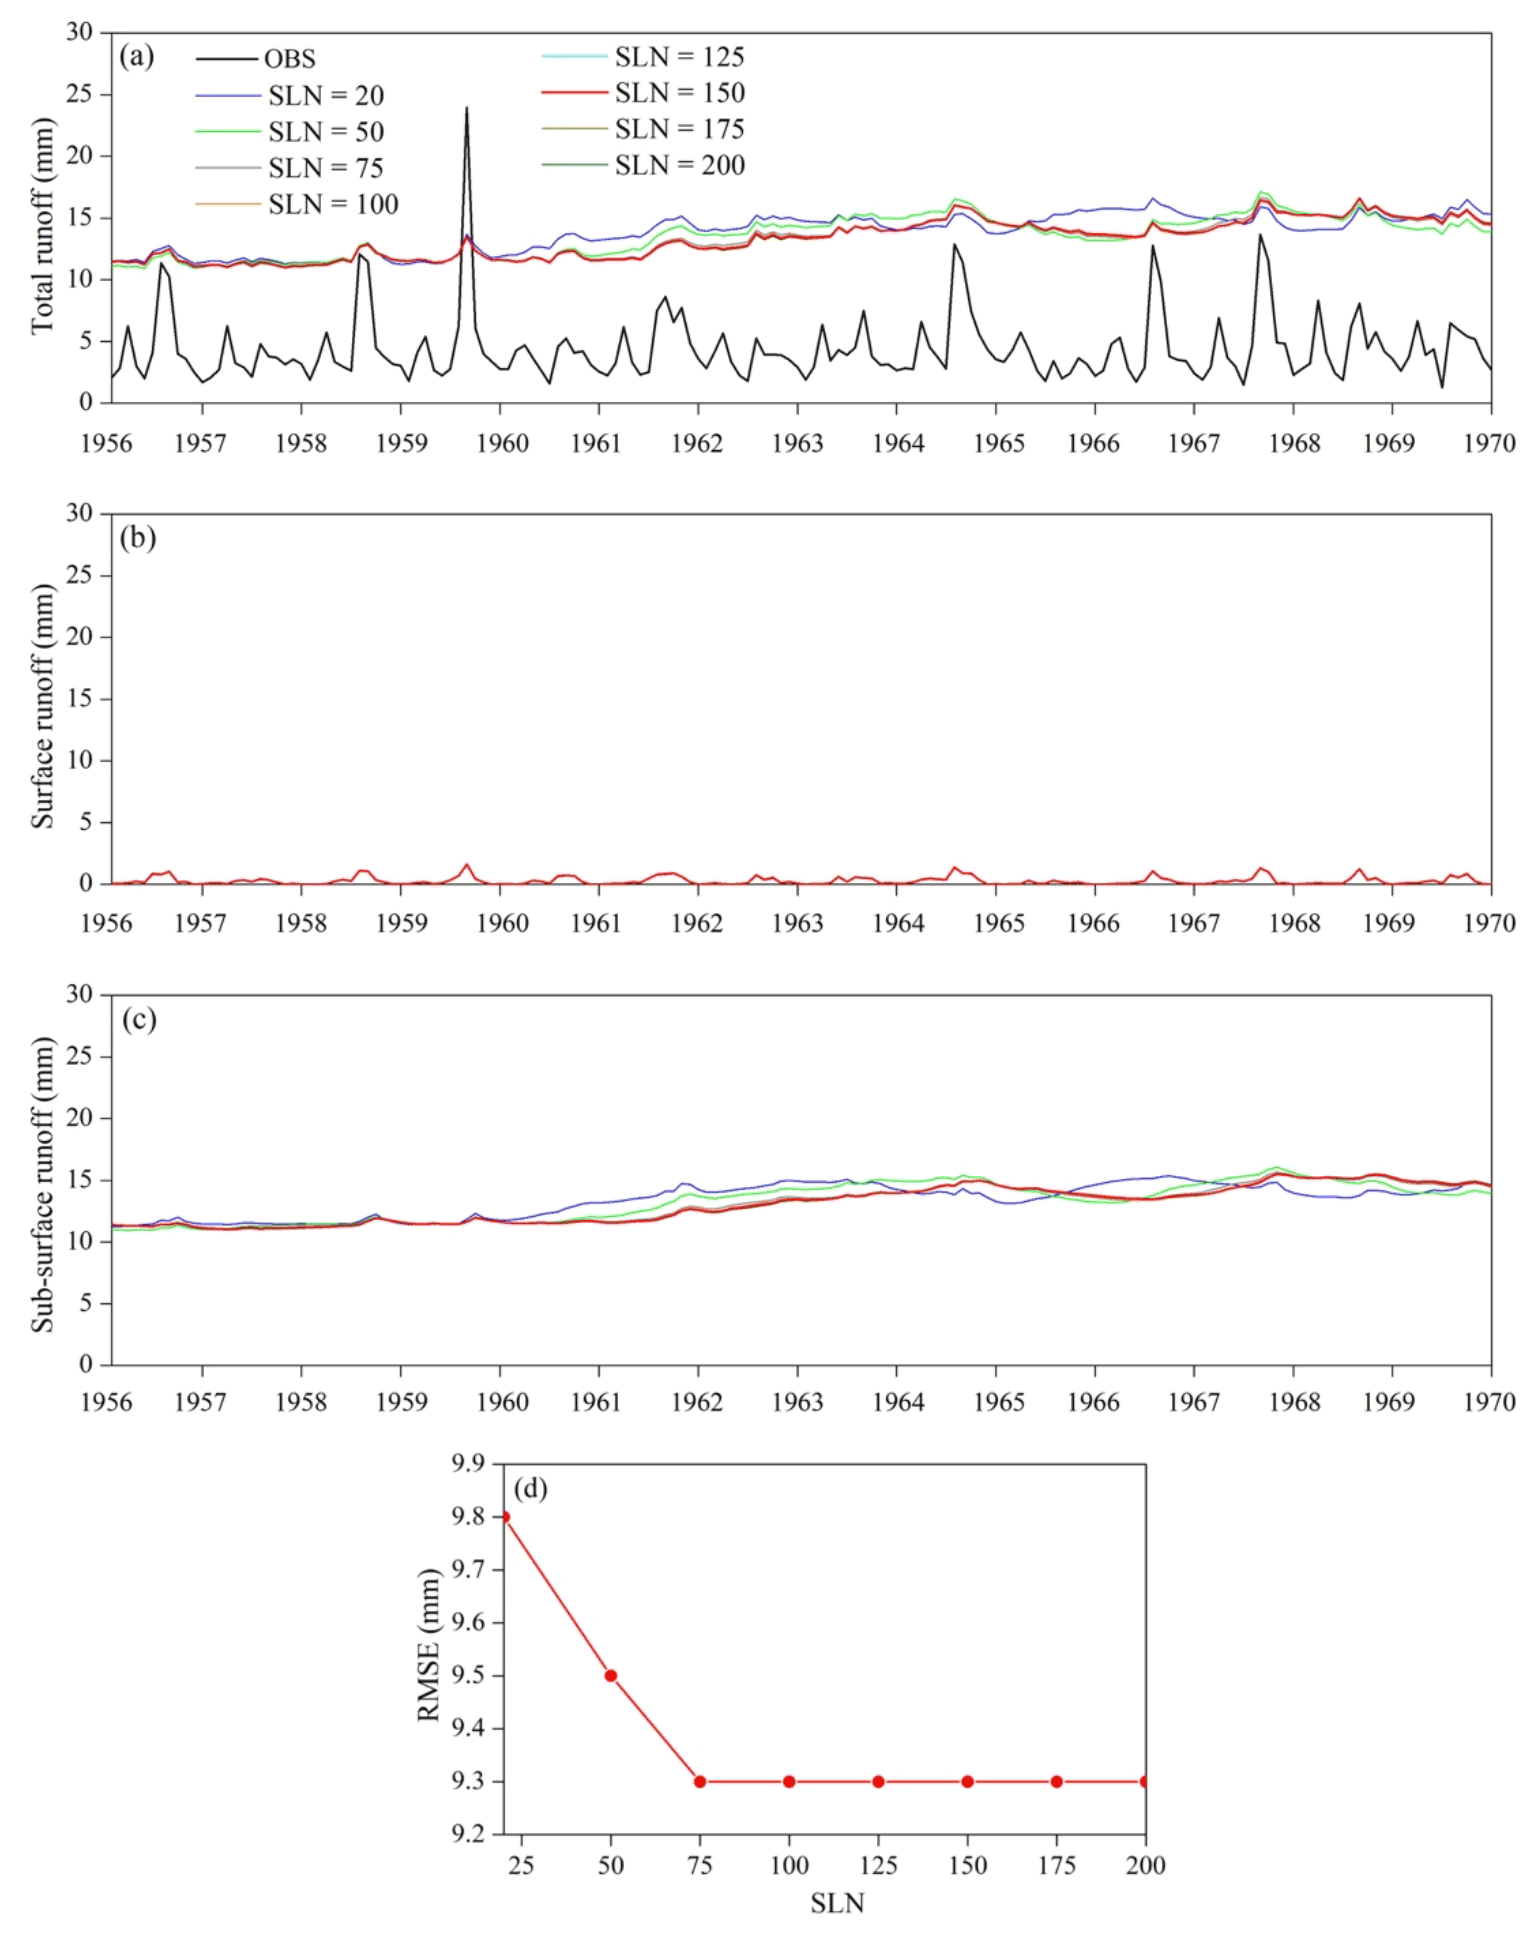
Figure 4(a) Observed and simulated monthly runoff for the BJC hydrological station; (b) simulated surface runoff; (c) simulated subsurface runoff; (d) RMSEs of the simulated total runoff. All simulations were produced with different SLN values.
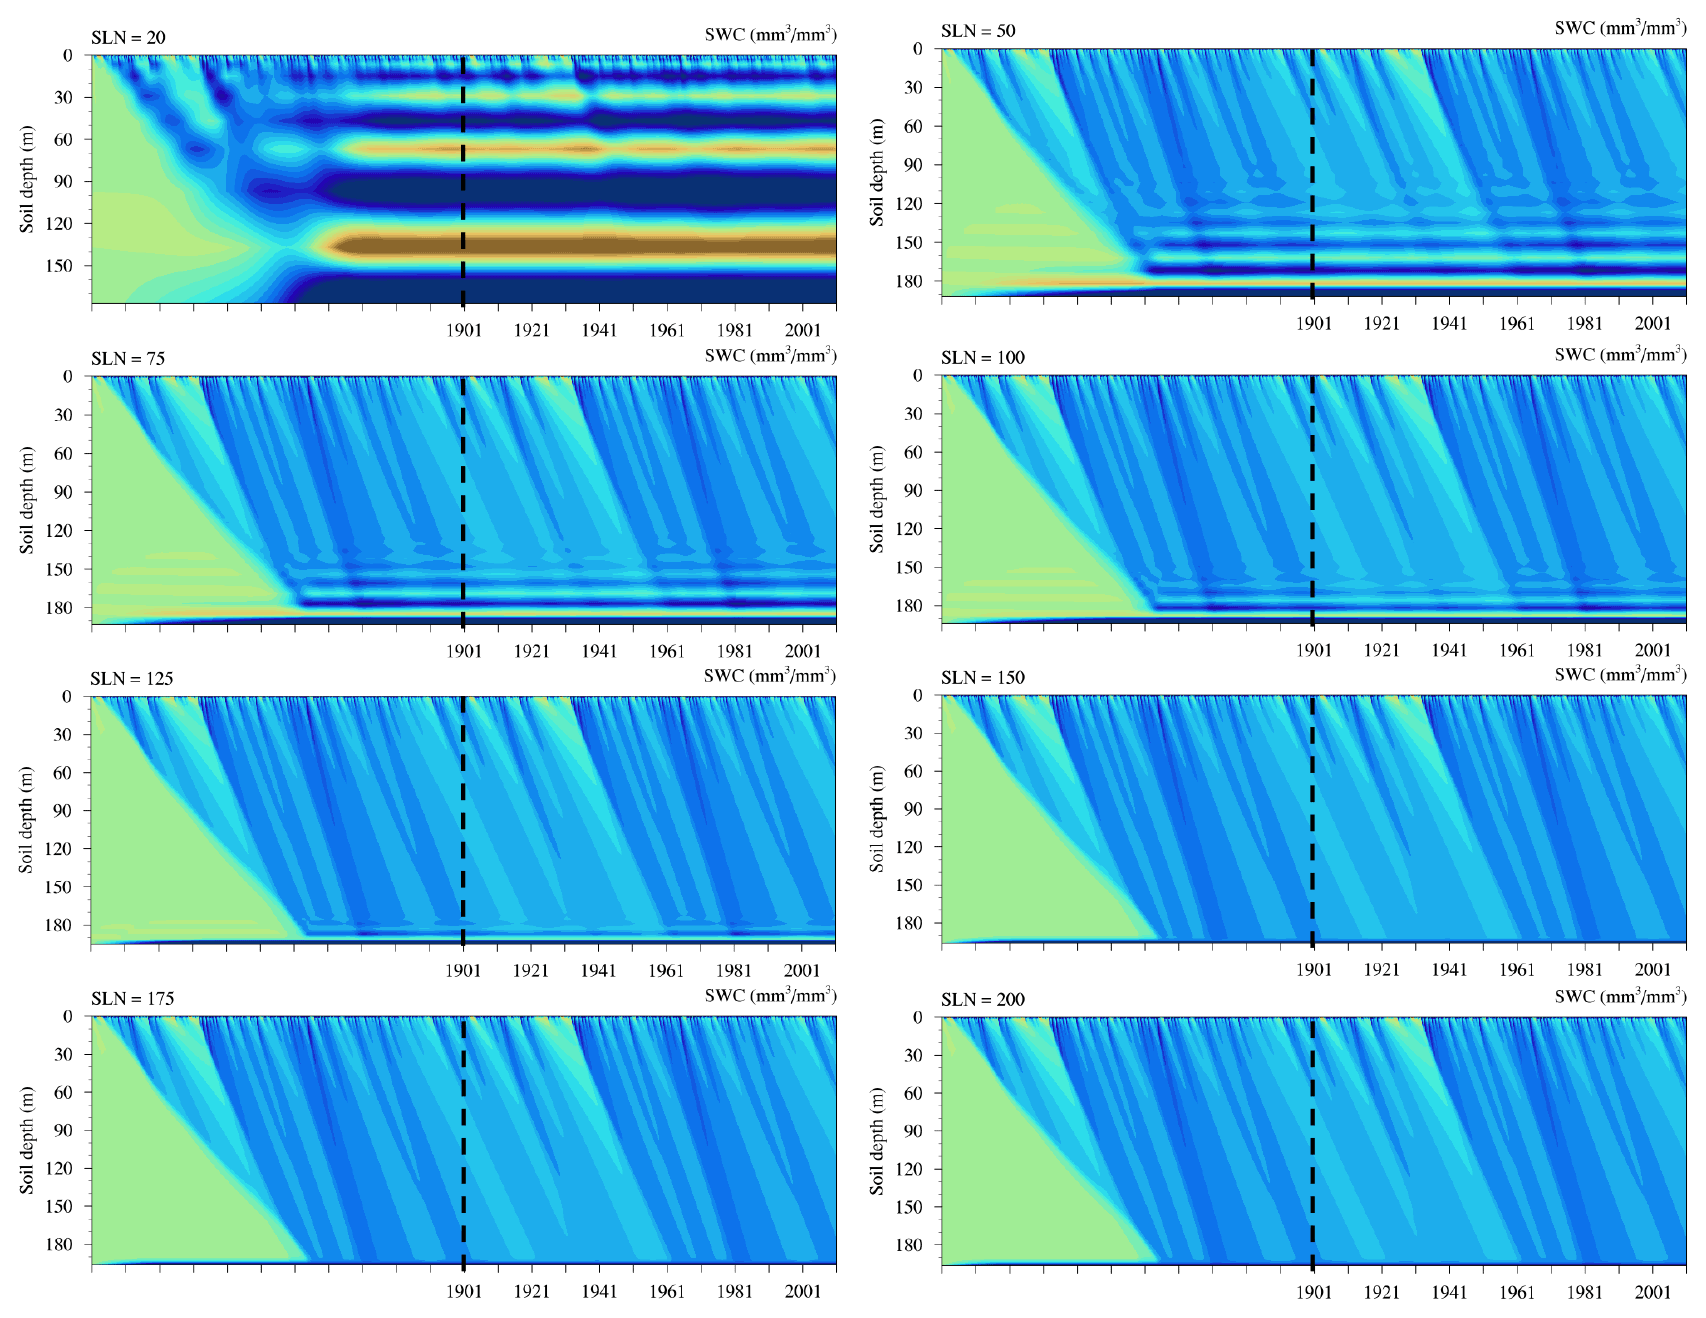
Figure 5Simulated vertical monthly SWC profiles for the selected point in the WRB during both the spinup (left of the dashed black line) and simulation (right of the dashed black line) periods. All simulations were conducted with different SLN values.
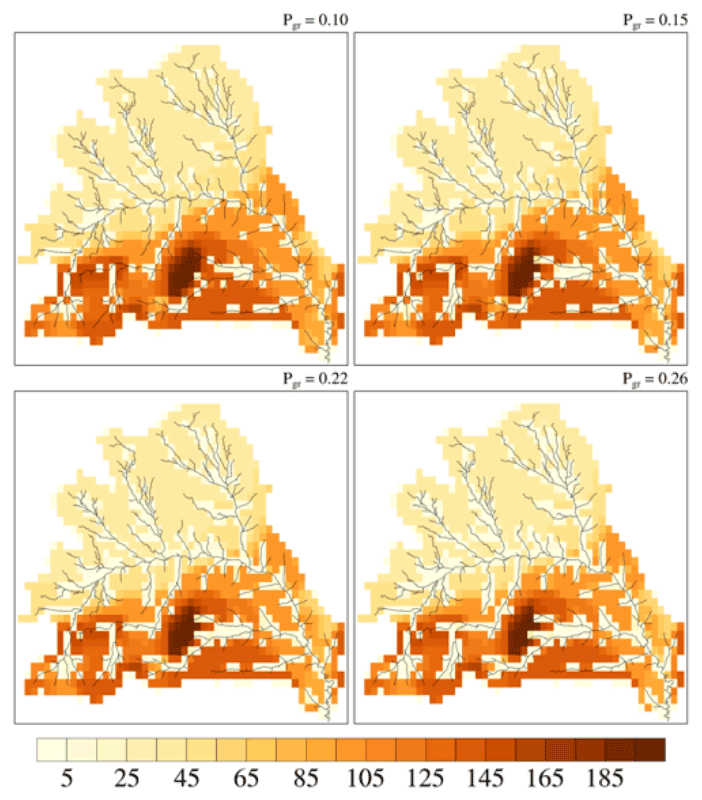
Figure 6Spatial distributions of river channels (black lines) and soil depths for the WRB with different values of Pgr.
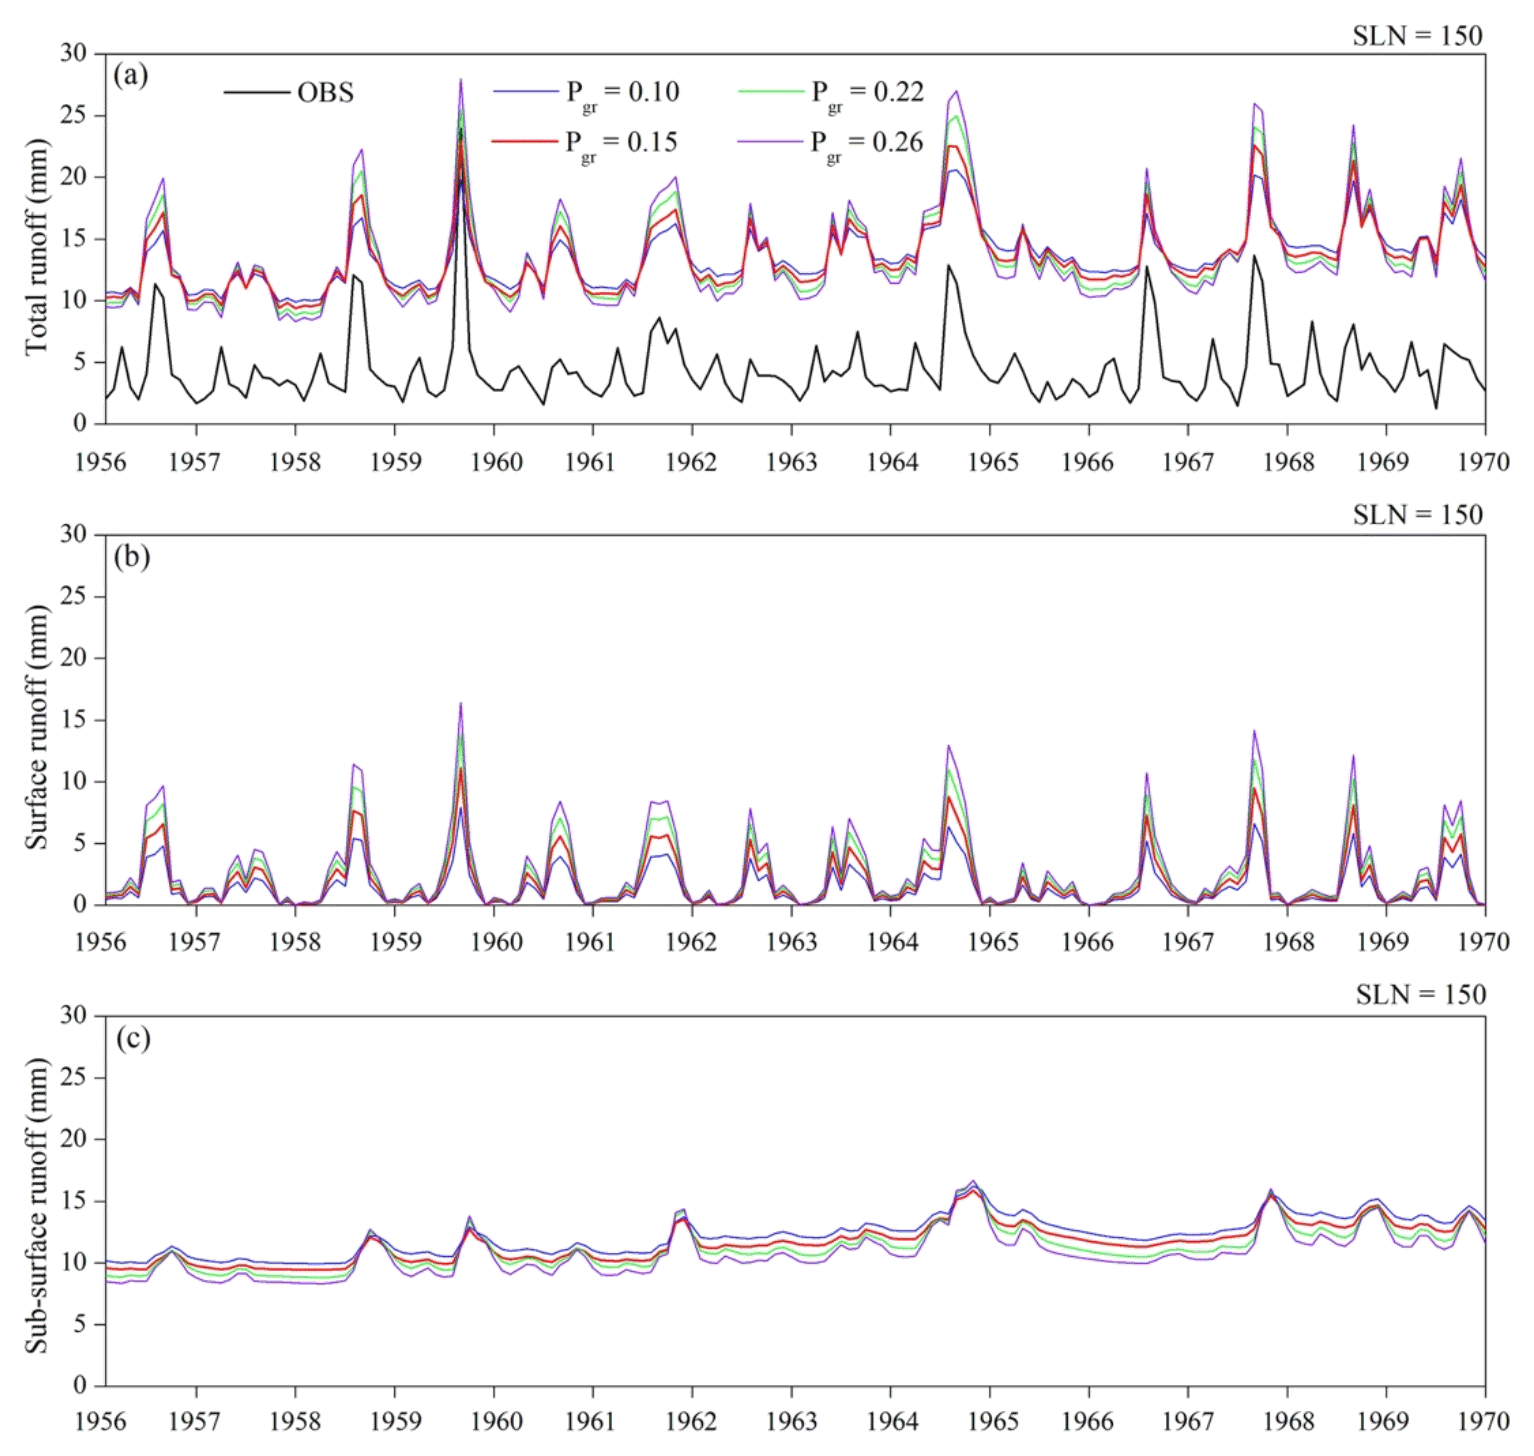
Figure 7(a) Observed and simulated monthly runoff for the BJC hydrological station; (b) simulated surface runoff; (c) simulated subsurface runoff. All simulations were produced with different Pgr values.
6.1 Default runoff simulation
We conducted a default run to evaluate the performance of the original CLM5 in simulating runoff in the WRB. The model remarkably overestimated monthly total and subsurface runoff when compared with observations from the BJC hydrological station over 1956–1969, a period with minimal human activity (Jiao et al., 2017). The correlation coefficient (R2), root mean square error (RMSE), and Nash–Sutcliffe efficiency (NSE) were 0.02, 10.37 mm, and −12.34, respectively. We can see that the overestimation was due mainly to the unrealistic simulations of subsurface runoff. The reasons for these erroneous simulations are discussed in detail in the following sections.
6.2 Effects of soil depth on runoff simulations
We examined how the simulated runoff for the WRB was affected by the actual soil depths (40–197 m) that were inputted into CLM5 with a default SLN of 20. As shown in Fig. 3, CLM5 with deep soils greatly suppressed the seasonal variability of subsurface runoff and reduced the magnitude of surface runoff when compared with the CLM5 simulations with a uniform soil depth of 8 m. The R2, RMSE, and NSE between observations and the simulations with actual soil depths were 0.04, 9.8 mm, and −10.96, respectively. Although the actual soil depth data for the WRB were included in CLM5, the runoff simulations were still remarkably different from observations in both variability and magnitude. Hence, the runoff simulations for the WRB need to be further explored and understood.
6.3 Effects of soil layering on runoff simulations
The eight soil layering methods mentioned in Sect. 3.2 were applied to CLM5 with the actual soil depths for the WRB to investigate the effects of soil layering on the runoff simulations. We can see that all the CLM5 runs generated similar temporal patterns of simulated total runoff, as shown in Fig. 4a. Obviously, the soil layering methods had almost no effect on the surface runoff simulations (Fig. 4b), while these methods did affect the subsurface runoff simulations to some extent (Fig. 4c). When the vertical spatial resolution increased from 20 to 200 soil layers, the RMSE of the simulated total runoff decreased until the SLN was equal to 75, and then the errors reached a minimum for SLN ranging from 100 to 200 (Fig. 4d). Although the model with 75 soil layers seemed to be an efficient case, the soil layering method was further examined with vertical soil moisture profile simulations.
We selected a point (37.53∘ N, 109.33∘ E) with the deepest soil depth of 197 m in the WRB to study the soil layering method based on vertical soil moisture profile simulations. As shown in Fig. 5, the coarser-resolution simulations (SLN ≤ 125) resulted in alternating persistent wet–dry layers throughout our study period, and this alternation gradually weakened with increasing SLN. When the SLN was equal to 150, the wet–dry alternation almost disappeared. We examined the model numerical method and found that the coarser resolution numerically caused smaller soil matric potential (SMP) gradients between the soil layers, leading to the wet–dry alternation. These vertical soil moisture simulations indicated that CLM5 could produce smooth soil water flow simulations with at least 150 soil layers at a soil depth of 197 m to avoid these numerical issues, although the RMSE of the simulated total runoff reached the minimum value with SLN equal to 75. Therefore, in the following simulations, we set the model soil layers to 150. With this soil layering, the R2, RMSE, and NSE for the total runoff simulations were 0.07, 9.3 mm, and −9.71, respectively.
6.4 Effects of Pgr on runoff simulations
In addition to the actual soil depth and high-resolution soil layering, we prescribed the river channels for the WRB in CLM5 to explore the effects of those channels on runoff simulations. Figure 6 shows the spatial distribution of the river channels for the WRB with different values of Pgr, a proportion of the total river channel area to the entire WRB area, as previously defined. The larger the Pgr, the denser the river channels. Our results showed that CLM5 dramatically improved the simulations of the seasonal variability of total runoff (Fig. 7a), and the R2 increased to 0.41–0.56 from 0.07 for the previous simulations. These improvements resulted mainly from the surface runoff simulations with a much higher seasonal variability (Fig. 7b). The subsurface runoff simulations did not show significant changes with the addition of the river channels to CLM5 (Fig. 7c). We can see that CLM5 with Pgr equal to 0.15 produced the lowest RMSE (9.3 mm) and the highest NSE (−9.78), although the R2 was not the highest (0.52) with this Pgr value. Moreover, we found that the seasonal peak values of the simulated surface runoff with Pgr values of 0.22 and 0.26 were higher than the observed peak values (figure not shown), which was not realistic. Thus, we selected 0.15 for Pgr for the rest of our simulations.
Table 2R2, RMSE, and NSE for total runoff simulations with different Pgr values.


Figure 8Time series of observed monthly runoff (black line) for the BJC hydrological station and simulated monthly total (red line), surface (blue line), and subsurface runoff (pink line).
6.5 Water balance analysis
We looked into the water balance for the WRB and attempted to further reduce the biases of the runoff simulations. In the previous sections, the more realistic conditions of the WRB (actual soil depths, high-resolution soil layering, and river channels) were incorporated into CLM5 to improve the runoff simulations, but the simulations were still far away from observations. Tian et al. (2018) indicated that the change in water storage in the WRB approached zero over a period of 13 years. Our study focused on a period of 14 years (1956–1969). Thus, we estimated the mean evapotranspiration (ET) with observed precipitation and runoff over our study period by assuming a water storage change of zero in the WRB as follows:
where ETavg, Pavg, and Ravg are mean ET (mm), precipitation (mm), and runoff (mm) over 1956–1969, respectively. Here, Pavg is 454.7 mm, Ravg is 53.2 mm, and the estimated ETavg is 401.5 mm. However, the simulated mean ET over the study period was 267.8 mm, which was far below the estimated value. According to the soil evaporation parameterization in CLM5, when the SWC of the top soil layer (SWC1) was less than SWCth, a DSL formed to resist soil evaporation. In CLM5, the SWCth is defined as 80 % of SWCsat,1. However, previous studies (Lee and Pielke, 1992; Sakaguchi and Zeng, 2009; Flammini et al., 2018) found that soil evaporation starts to decrease significantly when the surface SWC is less than the field capacity. Yang et al. (1985) also found that soil evaporation in the LP slows down when the surface SWC becomes lower than a stable capacity that is close to the field capacity. Thus, in this study, we changed the SWCth to the SWCfc,1 to conduct one additional simulation. With this modification, the simulated annual ET fluctuated around the estimated mean ET for our study period (401.5 mm), and the simulated 14-year mean value was 392.5 mm, which was close to the estimated mean. Very importantly, the simulated total runoff drastically reduced to match observations by increasing ET (Fig. 8). When compared with those for the simulations in the last section, R2 increased from 0.52 to 0.62, RMSE decreased from 9.3 to 1.8 mm, and NSE increased dramatically from −9.78 to 0.61. Therefore, we remarkably improved runoff simulations with more accurate ET simulations in addition to the more realistic WRB features.
This study was intended to improve runoff simulations with CLM5 for the complex topography of the WRB and to improve our understanding of deep soil hydrological processes. In CLM5, we included actual soil depths for the WRB ranging from 0 to 197 m and added the river channels for this watershed. We tested eight soil layering methods and found that CLM5 with at least 150 soil layers could produce rational simulations for both runoff and the vertical soil moisture profile. Different values of river channel density were examined with CLM5, showing that a ratio of 15 % of the total river channel area to the entire WRB area generated the most reasonable results.
With the above model settings, our simulations showed that CLM5 with actual soil depths greatly suppressed the seasonal variability of simulated subsurface runoff and reduced the simulated surface runoff when compared with the default simulations with a uniform soil depth of 8 m. In addition, CLM5 with finer-resolution soil layering (SLN ≥ 150) led to more accurate runoff and smoother vertical soil water flow simulations than that with coarser-resolution layering, and the latter was consistent with the homogeneous distribution of vertical soil texture in the WRB. The addition of river channels for the WRB to CLM5 significantly increased the seasonal variability of simulated surface runoff, remarkably improving the seasonal variability of simulated total runoff. Moreover, more accurate simulations of soil evaporation in the WRB dramatically reduced the simulated subsurface runoff and improved the total runoff simulations.
Limitations still exist in this study. We used atmospheric forcing data at a 5 km resolution to drive CLM5, but for our study region with very complex terrain, this resolution may not be sufficient and could potentially have generated errors in our simulations. In the meantime, it is very important to expand this study to a larger or even global scale, and accurate soil depth and detailed soil texture data would be vital to such an expanded study. In addition, soil hydraulic properties may change with depth, but this study did not consider such changes, and this needs to be tested in future studies. Despite these limitations, it is clear that our final runoff simulations with an improved CLM5 were highly accurate, and our understanding of deep soil hydrological processes has advanced.
Our improved model and data are available at https://doi.org/10.5281/zenodo.5044541 (Jin et al., 2021).
JJ and LW designed the research; LW conducted the simulations; LW and JY collected the soil depth data; JJ and LW analyzed the data; JY was involved in several sensitivity simulation tests; JJ and LW wrote the paper; BS and GYN edited the paper and provided substantial comments for scientific clarification.
The contact author has declared that neither they nor their co-authors have any competing interests.
Publisher’s note: Copernicus Publications remains neutral with regard to jurisdictional claims in published maps and institutional affiliations.
This research has been supported by the Innovative Research Group Project of the National Natural Science Foundation of China (grant nos. 41571030, 91637209, and 91737306).
This paper was edited by Wolfgang Kurtz and reviewed by two anonymous referees.
Brunke, M. A., Broxton, P., Pelletier, J., Gochis, D., Hazenberg, P., Lawrence, D. M., Leung, L. R., Niu, G., Troch, P. A., and Zeng, X.: Implementing and Evaluating variable soil thickness in the Community Land Model Version 4.5 (CLM4.5), J. Climate, 29, 3441–3461, https://doi.org/10.1175/JCLI-D-15-0307.1, 2016.
Camacho Suarez, V. V., Saraiva Okello, A. M. L., Wenninger, J. W., and Uhlenbrook, S.: Understanding runoff processes in a semi-arid environment through isotope and hydrochemical hydrograph separations, Hydrol. Earth Syst. Sci., 19, 4183–4199, https://doi.org/10.5194/hess-19-4183-2015, 2015.
Chen, L., Sela, S., Svoray, T., and Assouline, S.: The role of soil-surface sealing, microtopography, and vegetation patches in rainfall-runoff processes in semiarid areas, Water Resour. Res., 49, 5585–5599, 2013.
Clapp, R. B. and Hornberger, G. M.: Empirical equations for some soil hydraulic properties, Water Resour. Res., 14, 601–604, 1978.
Cosby, B. J., Hornberger, G. M., Clapp, R. B., and Ginn, T. R.: A statistical exploration of the relationships of soil moisture characteristics to the physical properties of soils, Water Resour. Res., 20, 682–690, 1984.
Cressman, G. P.: An operational objective analysis system, Mon. Weather Rev., 87, 367–374, 1959.
Döll, P. and Fiedler, K.: Global-scale modeling of groundwater recharge, Hydrol. Earth Syst. Sci., 12, 863–885, https://doi.org/10.5194/hess-12-863-2008, 2008.
Ek, M. B., Mitchell, K. E., Lin, Y., Rogers, E., Grunmann, P., Koren, V., Gayno, G., and Tarpley, J. D.: Implementation of Noah land surface model advances in the National Centers for Environmental Prediction operational mesoscale Eta model, J. Geophys. Res., 108, 8851, https://doi.org/10.1029/2002JD003296, 2003.
Flammini, A., Corradini, C., Morbidelli, R., Saltalippi, C., Picciafuoco, T., and Giráldez, J. V.: Experimental analyses of the evaporation dynamics in bare soils under natural conditions, Water Resour. Manag., 32, 1153–1166, https://doi.org/10.1007/s11269-017-1860-x, 2018.
Fu, B.: Soil erosion and its control in the Loess Plateau of China, Soil Use Manage., 5, 76–82, 1989.
Fu, B., Wang, S., Liu, Y., Liu, J., Liang, W., and Miao, C.: Hydrogeomorphic Ecosystem Responses to Natural and Anthropogenic Changes in the Loess Plateau of China, Annu. Rev. Earth Planet. Sci., 45, 223–243, https://doi.org/10.1146/annurev-earth-063016-020552, 2017.
Fu, Z., Li, Z., Cai, C., Shi, Z., Xu, Q., and Wang, X.: Soil thickness effect on hydrological and erosion characteristics under sloping lands: A hydropedological perspective, Geoderma, 167–168, 41–53, https://doi.org/10.1016/j.geoderma.2011.08.013, 2011.
Han, S., Li, Y., Shi, Y., Yang, X., Zhang, X., and Shi, Z.: The characteristic of soil moisture resources on the Loess Plateau, Bulletin of Soil and Water Conservation, 10, 36–43, 1990.
Huang, T. and Pang, Z.: Estimating groundwater recharge following land-use change using chloride mass balance of soil profiles: A case study at Guyuan and Xifeng in the Loess Plateau of China, Hydrogeology J., 19, 177–186, https://doi.org/10.1007/s10040-010-0643-8, 2011.
Huang, T., Pang, Z., and Edmunds, W. M.: Soil profile evolution following land-use change: Implications for groundwater quantity and quality, Hydrol. Process., 27, 1238–1252, https://doi.org/10.1002/hyp.9302, 2013.
Huang, T., Pang, Z., Liu, J., Yin, L., and Edmunds, W. M.: Groundwater recharge in an arid grassland as indicated by soil chloride profile and multiple tracers, Hydrol. Process., 31, 1047–1057, https://doi.org/10.1002/hyp.11089, 2017.
Huang, Y., Evaristo, J., and Li, Z.: Multiple tracers reveal different groundwater recharge mechanisms in deep loess deposits, Geoderma, 353, 204–212, https://doi.org/10.1016/j.geoderma.2019.06.041, 2019.
Jencso, K. G. and Mcglynn, B. L.: Hierarchical controls on runoff generation: Topographically driven hydrologic connectivity, geology, and vegetation, Water Resour. Res., 47, W11527, https://doi.org/10.1029/2011WR010666, 2011.
Jiao, Y., Lei, H., Yang, D., Huang, M., Liu, D., and Yuan, X.: Impact of vegetation dynamics on hydrological processes in a semi-arid basin by using a land surface-hydrology coupled model, J. Hydrol., 551, 116–131, https://doi.org/10.1016/j.jhydrol.2017.05.060, 2017.
Jin, J., Wang, L., Yang, J., Si, B., and Niu, G.-Y.: Improved Runoff Simulations for a Highly Varying Soil Depth and Complex Terrain Watershed in the Loess Plateau with the Community Land Model Version 5, Zenodo [code and data set], https://doi.org/10.5281/zenodo.5044541, 2021.
Jing, K. and Cheng, Y.: Preliminary study of the erosion environment and rates on the Loess Plateau, Geogr. Res., 2, 1–11, 1983.
Lawrence, D., Fisher, R., Koven, C., Oleson, K., Swenson, S., Vertenstein, M., Andre, B., Bonan, G., Ghimire, B., Kampenhout, L. V., Kennedy, D., Kluzek, E., Knox, R., Lawrence, P., Li, F., Li, H., Lombardozzi, D., Lu, Y., Perket, J., Riley, W., Sacks, W., Shi, M., Wieder, W., Xu, C., Ali, A., Badger, A., Bisht, G., Broxton, P., Brunke, M., Buzan, J., Clark, M., Craig, T., Dahlin, K., Drewniak, B., Emmons, L., Fisher, J., Flanner, M., Gentine, P., Lenaerts, J., Levis, S., Leung, L. R., Lipscomb, W., Pelletier, J., Ricciuto, D. M., Sanderson, B., Shuman, J., Slater, A., Subin, Z., Tang, J., Tawfik, A., Thomas, Q., Tilmes, S., Vitt, F., and Zeng, X.: The Community Land Model Version 5: Description of New Features, Benchmarking, and Impact of Forcing Uncertainty, J. Adv. Model. Earth Sy., 11, 4245–4287, https://doi.org/10.1029/2018MS001583, 2019.
Lawrence, D. M. and Slater, A. G.: Incorporating organic soil into a global climate model, Clim. Dynam., 30, 145–160, https://doi.org/10.1007/s00382-007-0278-1, 2008.
Lawrence, P. J. and Chase, T. N.: Representing a new MODIS consistent land surface in the Community Land Model (CLM5 3.0), J. Geophys. Res., 112, G01023, https://doi.org/10.1029/2006JG000168, 2007.
Lee, T. J. and Pielke, R. A.: Estimating the soil surface specific humidity, J. Appl. Meteorol., 31, 480–484, 1992.
Lei, X.: Pore types and collapsibility of the loess in China, Science China Press, 17, 1203–1208, https://doi.org/10.1360/zb1987-17-12-1309, 1987.
Li, Y., Han, S., and Wang, Z.: Soil water properties and its zonation in the Loess Plateau. Res. Soil Water Conserv., 2, 1–17, 1985.
Li, Z., Chen, X., Liu, W., and Si, B.: Determination of groundwater recharge mechanism in the deep loessial unsaturated zone by environmental tracers, Sci. Total Environ., 586, 827–835, https://doi.org/10.1016/j.scitotenv.2017.02.061, 2017.
Li, Z., Jasechko, S., and Si, B.: Uncertainties in tritium mass balance models for groundwater recharge estimation, J. Hydrol., 571, 150–158, https://doi.org/10.1016/j.jhydrol.2019.01.030, 2019.
Liu, D., Tian, F., Hu, H., and Hu, H.: The role of run-on for overland flow and the characteristics of runoff generation in the Loess Plateau, China, Hydrol. Sci. J., 57, 1107–1117, 2012.
Liu, Z.: The Study on the Classification of Loess Landscape and the Characteristics of Loess Stratum, MS thesis, College of Geological Engineering and Geomatics, Chang'an University, China, 97 pp., 2016 (in Chinese with English abstract).
Neitsch, S. L., Arnold, J. G., Kiniry, J. R., and Williams, J. R.: Soil and Water Assessment Tool Theoretical Documentation Version 2009, Texas Water Resources Institute Technicial Report No. 406, Texas, https://hdl.handle.net/1969.1/128050 (last access: 20 November 2021), 2011.
Niu, G., Yang, Z., Mitchell, K. E., Chen, F., Ek, M. B., Barlage, M., Kumar, A., Manning, K., Niyogi, D., Rosero, E., Tewari, M., and Xia, Y.: The community Noah land surface model with multiparameterization options (Noah-MP): 1. Model description and evaluation with local-scale measurements, J. Geophys. Res., 116, D12109, https://doi.org/10.1029/2010JD015139, 2011.
Niu, G. Y., Yang, Z. L., Dickinson, R. E., and Gulden, L. E.: A simple TOPMODEL-based runoff parameterization (SIMTOP) for use in global climate models, J. Geophys. Res., 110, D21106, https://doi.org/10.1029/2005JD006111, 2005.
Qi, C., Gan, Z., Xi, Z., Wu, C., Sun, H., Chen, W., Liu, T., and Zhao, G.: The research of the relations between erosion landforms and soil erosion of the Loess Plateau, Shaanxi People's Education Publishing House, Shaanxi, China, 164–168, 1991 (in Chinese with English abstract).
Sakaguchi, K. and Zeng, X.: Effects of soil wetness, plant litter, and under-canopy atmospheric stability on ground evaporation in the Community Land Model (CLM53. 5), J. Geophys. Res., 114, D001107, https://doi.org/10.1029/2008JD010834, 2009.
Saraiva Okello, A. M. L., Uhlenbrook, S., Jewitt, G. P. W., Masih, I., Riddell, E. S., and Van der Zaag, P.: Hydrograph separation using tracers and digital filters to quantify runoff components in a semi-arid mesoscale catchment, Hydrol. Process., 32, 1334–1350, https://doi.org/10.1002/hyp.11491, 2018.
Shangguan, W., Hengl, T., Mendes de Jesus, J., Yuan, H., and Dai, Y.: Mapping the global depth to bedrock for land surface modeling, J. Adv. Model. Earth Syst., 9, 65–88, https://doi.org/10.1002/2016MS000686, 2017.
Shao, J., Si, B., and Jin, J.: Extreme precipitation years and their occurrence frequency regulate long-term groundwater recharge and transit time, Vadose Zone J., 17, 1–9, https://doi.org/10.2136/vzj2018.04.0093, 2018.
Swenson, S. C. and Lawrence, D. M.: Assessing a dry surface layer-based soil resistance parameterization for the Community Land Model using GRACE and FLUXNET-MTE data, J. Geophys. Res.-Atmos., 119, 10299–10312, 2014.
Tesfa, T. K., Tarboton, D. G., Chandler, D. G., and McNamara, J. P.: Modeling soil depth from topographic and land cover attributes, Water Resour. Res., 45, W10438, https://doi.org/10.1029/2008WR007474, 2009.
Tian, L., Jin, J., Wu, P., and Niu, G.: Assessment of the effects of climate change on evapotranspiration with an improved elasticity method in a nonhumid area, Sustainability, 10, 4589, https://doi.org/10.3390/su10124589, 2018.
Tian, L., Jin, J., Wu, P., Niu, G.-Y., and Zhao, C.: High-resolution simulations of mean and extreme precipitation with WRF for the soil-erosive Loess Plateau, Clim. Dynam., 54, 3489–3506, https://doi.org/10.1007/s00382-020-05178-6, 2020.
Turkeltaub, T., Kurtzman, D., Bel, G., and Dahan, O.: Examination of groundwater recharge with a calibrated/validated flow model of the deep vadose zone, J. Hydrol., 522, 618–627, https://doi.org/10.1016/j.jhydrol.2015.01.026, 2015.
Uhlenbrook, S., Frey, M., Leibundgut, C., and Maloszewski, P.: Hydrograph separations in a mesoscale mountainous basin at event and seasonal timescales, Water Resour. Res., 38, 1096, https://doi.org/10.1029/2001WR000938, 2002.
Wang, S.: Study on geological engineering of loess in North Shaanxi, MS thesis, College of Geological Engineering and Geomatics, Chang'an University, China, 57 pp., 2016 (in Chinese with English abstract).
Wang, Y. and Shao, M.: Spatial variability of soil physical properties in a region of the Loess Plateau of pr China subject to wind and water erosion, Land Degrad. Dev., 24, 296–304, https://doi.org/10.1002/ldr.1128, 2013.
Xiang, W., Si, B., Biswas, A., and Li, Z.: Quantifying dual recharge mechanisms in deep unsaturated zone of Chinese Loess Plateau using stable isotopes, Geoderma, 337, 773–781, https://doi.org/10.1016/j.geoderma.2018.10.006, 2019.
Xiao, J., Wang, L., Deng, L., and Jin, Z.: Characteristics, sources, water quality and health risk assessment of trace elements in river water and well water in the Chinese Loess Plateau, Sci. Total Environ., 650, 2004–2012, https://doi.org/10.1016/j.scitotenv.2018.09.322, 2019.
Yang, W., Shi, Y., and Fei, W.: Water evaporation from soils under unsaturated condition and evaluation for drought resistance of soils on Loessal Plateau, Acta Pedologica Sinica, 22, 13–23, 1985 (in Chinese with English abstract).
Zhang, F., Zhang, W., Qi, J., and Li, F.: A regional evaluation of plastic film mulching for improving crop yields on the Loess Plateau of China, Agr. Forest Meteorol., 248, 458–468, https://doi.org/10.1016/j.agrformet.2017.10.030, 2018.
Zhu, Y., Jia, X., and Shao, M.: Loess thickness variations across the Loess Plateau of China, Surv. Geophys., 39, 715–727, https://doi.org/10.1007/s10712-018-9462-6, 2018.