the Creative Commons Attribution 4.0 License.
the Creative Commons Attribution 4.0 License.
 | 01 Apr 2022
Added value of EURO-CORDEX high-resolution downscaling over the Iberian Peninsula revisited – Part 1: Precipitation
João António Martins Careto
Pedro Miguel Matos Soares
Rita Margarida Cardoso
Sixto Herrera
José Manuel Gutiérrez
Over the years, higher-resolution regional climate model simulations have emerged owing to the large increase in computational resources. The 12 km resolution from the Coordinated Regional Climate Downscaling Experiment for the European domain (EURO-CORDEX) is a reference, which includes a larger multi-model ensemble at a continental scale while spanning at least a 130-year period. These simulations are computationally demanding but do not always reveal added value. In this study, a recently developed regular gridded dataset and a new metric for added value quantification, the distribution added value (DAV), are used to assess the precipitation of all available EURO-CORDEX hindcast (1989–2008) and historical (1971–2005) simulations. This approach enables a direct comparison between the higher-resolution regional model runs against their forcing global model or ERA-Interim reanalysis with respect to their probability density functions. This assessment is performed for the Iberian Peninsula. Overall, important gains are found for most cases, particularly in precipitation extremes. Most hindcast models reveal gains above 15 %, namely for wintertime, while for precipitation extremes values above 20 % are reached for the summer and autumn. As for the historical models, although most pairs display gains, regional models forced by two general circulation models (GCMs) reveal losses, sometimes around −5 % or lower, for the entire year. However, the spatialization of the DAV is clear in terms of added value for precipitation, particularly for precipitation extremes with gains well above 100 %.
- Article
(7283 KB) - Full-text XML
- Companion paper
-
Supplement
(2512 KB) - BibTeX
- EndNote


From the last decades of the 20th century up to today, climate change due to anthropogenic gas emissions has become a major concern for mankind. General circulation models (GCMs) are the primary tool used by the IPCC (Intergovernmental Panel on Climate Change) to assess past, present, and future climate conditions. Overall, GCMs can capture the large-scale circulations of the atmosphere and the ocean, together with their centennial to decadal variability and synoptic weather (Meehl et al., 2007; Randall et al., 2007; Stocker et al., 2014). However, GCM coarse resolution does not allow for a good representation of orography, land–ocean–atmosphere interactions, or sub-grid processes (Randall et al., 2007; Rummunukainen, 2010; Soares et al., 2012a, b). Instead, these local processes often rely on parameterizations, resulting in a poor description of processes such as convection and thermal circulations (Prein et al., 2015). Therefore, to bridge the gap between large- and local-scale climate, downscaling techniques were developed. These include statistical downscaling (Wilby et al., 1998; Khan et al., 2006) and dynamical downscaling (Giorgi and Bates, 1989; McGregor, 1997; Christensen et al., 2007; Rummukainen, 2010); the latter makes use of regional climate models (RCMs). RCMs are run over a geographical domain (continental, national, or regional) driven by a GCM, including reanalysis, by means of the boundary conditions. RCMs are an important tool for the representation of regional to local climates, since they are run at much higher resolutions (nowadays from tenths of kilometres down to convection-permitting scales) and can therefore capture physically consistent regional to local processes and circulations (Giorgi and Mearns, 1991, 1999; Leung et al., 2003; Laprise, 2008; Heikkilä et al., 2010; Soares et al., 2012a, b; Cardoso et al., 2013; Rios-Entenza et al., 2014; Soares et al., 2014). The gains for an individual variable or process of higher-resolution RCM simulations against lower resolutions, given by the GCM or reanalysis driving the RCM, relative to observations, are commonly known as added value (Di Luca et al., 2012, 2013; Prein et al., 2013a, 2016; Torma et al., 2015; Rummukainen, 2016; Soares and Cardoso, 2018; Cardoso and Soares, 2021; Careto et al., 2022).
In recent years, the increase in computational resources has allowed researchers to run simulations with larger domains and resolutions (Prein et al., 2015; Soares et al., 2017; Jacob et al., 2020; Coppola et al., 2020). These often encompass an entire continent, spanning larger periods from a few decades to over a century: for instance, from the 20th to the end of the 21st century or from the 50 km horizontal resolution of the PRUDENCE project (Christensen and Christensen, 2007) or the 25 km from ENSEMBLES (van der Linden and Mitchell, 2009) down to the 12 km resolution from the World Research Climate Program Coordinated Regional Downscaling Experiment (WRCP-CORDEX, Jacob et al., 2014, 2020) for the European domain (EURO-CORDEX, hereafter). Moreover, other examples are ideal case studies employing simulations at kilometre scale (Hohenegger et al., 2009; Kendon et al., 2012, 2014; Prein et al., 2013b; Ban et al., 2014; Froidevaux et al., 2014; Fosser et al., 2017; Imamovic et al., 2017; Leutwyler et al., 2017; Liu et al., 2017; Kirshbaum et al., 2018; Fumière et al., 2020; Berthou et al., 2020) and the convection-permitting simulations from the WRCP-CORDEX flagship pilot studies focused over the Alps (Coppola et al., 2020; Ban et al., 2021; Pichelli et al., 2021).
The evaluation and added value of higher-resolution simulations constitute an important step to gauge their quality and usefulness. Soares and Cardoso (2018) proposed a new metric to quantify the added value of higher resolutions with respect to their forcing or lower-resolution counterpart simulations. This metric is based on the ability of models to represent the observed probability density functions (PDFs). It relies on a distribution added value (DAV) which can be applied to either the full PDF or to PDF sections, thus enabling an easy evaluation of extremes or any section of the PDF.
In the past, the hindcast simulations from the EURO-CORDEX were extensively evaluated, revealing gains for the main meteorological variables (Kotlarski et al., 2014; Casanueva et al., 2016a, b; Prein et al., 2016; Soares and Cardoso, 2018; Herrera et al., 2020; Cardoso and Soares, 2021; Careto et al., 2022). Kotlarski et al. (2014) assessed temperature and precipitation at monthly and seasonal timescales for the hindcast simulations, reporting slight improvements from EURO-CORDEX relative to ENSEMBLES (Van der Linden and Mitchell, 2009). Overall, the models showed ability to capture the space–time variability of the European climate. However, when considering averages over large subdomains and at the seasonal timescale, the higher-resolution simulations did not reveal noticeable improvements. Prein et al. (2016) also assessed precipitation for both resolutions of the hindcast EURO-CORDEX (50 and 12 km) and found improvements, mostly in regions characterized by complex terrain and in summertime precipitation due to the better-resolved convective features. More recently, Herrera et al. (2020) performed an assessment for precipitation and temperature for an ensemble of eight hindcast EURO-CORDEX RCMs over the Iberian Peninsula. The authors report good spatial agreement between models and observations, namely for temperature. On the other hand, this agreement decreases when extremes are considered. Nevertheless, the authors also report a larger uncertainty related to observations for precipitation relative to temperature.
The first to quantify the added value of the EURO-CORDEX hindcast runs were Soares and Cardoso (2018), evaluating five RCMs for precipitation at both resolutions (50 and 12 km) considering their probability density functions with the station-based dataset ECAD (Klein Tank et al., 2002; Klok and Klein Tank, 2009) as an observational benchmark. This study reported relevant added value of the RCMs against the driving ERA-Interim reanalysis (Dee et al., 2011). Nonetheless, when comparing the two resolutions, the improvements are not as significant, with the exception of extreme precipitation. More recently, other studies such as Cardoso and Soares (2021) and Careto et al. (2022) used a similar DAV technique to assess the added value for other variables, simulations, and domains.
The precipitation historical period EURO-CODEX simulations were also assessed for specific regions (Torma et al., 2015; Soares et al., 2017; Ciarlo et al., 2020). For instance, Torma et al. (2015) evaluated precipitation over an alpine area, whereas Soares et al. (2017) assessed the same variable but for Portugal. Both studies describe the ability of the higher-resolution runs to simulate the mean spatial and temporal patterns of precipitation, as well as their distributions. More recently, Ciarlo et al. (2020) assessed the added value of all available EURO-CORDEX and CORDEX-CORE (Gutowski et al., 2016) simulations for precipitation, also considering a probability density function metric. The authors found added value, particularly at the tail of the distributions; however, they also report a significant uncertainty linked to the observational datasets in the results.
In this study, the DAV metric is used to assess the added value of precipitation for all available 12 km resolution simulations from the EURO-CORDEX hindcast (1989–2008) and historical (1971–2005) set. The added value is then computed by comparing the RCM precipitation results versus their corresponding driver GCM or ERA-Interim reanalysis with the recently developed Iberia Gridded Dataset (IGD; Herrera et al., 2019) considered to be a baseline. The IGD is a high-resolution dataset, with 0.1∘ resolution, and is based on a large number of weather stations covering the entire Iberian Peninsula. Thus, a new and unprecedented assessment of the added value in the high-resolution EURO-CORDEX regional simulations is performed for this domain, with observations at a similar resolution scale. The next section introduces the data and a description of the methods considered. The results and discussion are presented in the following section. Finally, the main conclusions are drawn in the last section.
2.1 Iberian Gridded Dataset
A recently developed dataset, the Iberian Gridded Dataset at 0.1∘ resolution (IGD; Herrera et al., 2019a, b), is used as a baseline for the added value assessment. This dataset was built by considering an unprecedented number of weather stations: 3486 (275) for precipitation (temperatures) over the entire Iberian Peninsula for daily precipitation as well as maximum, minimum, and mean temperatures spanning 45 years from 1971 until the end of 2015. The authors performed a comparison with E-OBS v17 and v17e, confirming the ability of this new dataset to reproduce the mean and extreme precipitation and also the temperature regimes. The two datasets are comparable yet statistically different. Since a large number of stations were considered, particularly for precipitation, IGD should reproduce the climate of the Iberian Peninsula more realistically.
2.2 EURO-CORDEX
The aim of CORDEX is to develop a coordinated ensemble of high-resolution regional climate projections to provide detailed climate data for all land regions of the world, at user-relevant scales, and support climate change impact and adaptation research (Giorgi et al., 2009; Gutowski et al., 2016). All model data are available at the Earth System Grid Federation portal (Williams et al., 2011). EURO-CORDEX (Jacob et al., 2014, 2020) is a branch from the international CORDEX initiative and consists of a multi-model ensemble of simulations at 50, 25, or 12 km resolution for the European domain. These simulations consist of hindcast for the 1989–2008 period forced by the ERA-Interim reanalysis (Dee et al., 2011) and the historical and scenario simulations driven by the Intergovernmental Panel on Climate Change Coupled Model Intercomparison Project Phase 5 (IPCC-CMIP5) GCMs covering the 1971–2100 period. All simulations are available at the Earth System Grid Federation portal (Williams et al., 2011; https://esgf.llnl.gov/, last access: 29 April 2021).
The information regarding the simulations used is summarized in Table S1 in the Supplement for hindcast and Table S2 for the historical. For all models, the added value is computed for the common Iberian Peninsula domain shown in Fig. 1; prior to all computations, all RCM model data were first conservatively interpolated (Schulzweida et al., 2021) into this observational domain, while the observations were interpolated into each low-resolution grid. Thus, the evaluation of the EURO-CORDEX regional models is performed at the 0.1∘ regular grid, while at the same time the GCMs or ERA-Interim (0.75∘) are evaluated at their native resolutions (see Table S2 for each GCM resolution).

Figure 1Orography from the Iberian Gridded Dataset for the Iberian Peninsula at 0.1∘ horizontal resolution
2.3 Distribution added value
The distribution added value (DAV) is a metric put forward by Soares and Cardoso (2018), which allows assessing in a direct way the gains or losses of using higher- against lower-resolution models relying on their probability density functions (PDFs) by having an observational dataset as a reference. DAV uses the PDF skill score proposed by Perkins et al. (2007) to measure the similarity between two different PDFs. In order to compute this metric, first, a PDF must be built from the data. In this work, two slightly different methods are considered for building the PDFs to assess the daily precipitation from the EURO-CORDEX models.
In the first method the precipitation values are accumulated within each bin, thus returning a precipitation intensity distribution, while the second one considers the number of events that fall into each bin, thus returning a precipitation frequency distribution. Then, a normalization is carried out by dividing each bin by the sum of all data considered input for the PDF (Gutowski et al., 2007; Boberg et al., 2009, 2010). With this normalization, one can more accurately compare the results between seasons or regions (Soares and Cardoso, 2018), but also, changes in PDF are identified more straightforwardly (Gutowski et al., 2007). Each bin has a width of 1 mm d−1 to avoid excessively fine and potential noisy steps in both methodologies, thus satisfying the criteria proposed by Wilks (1995). All DAVs are computed by only considering the wet days, i.e. days with precipitation equal to or above to 1 mm, as models tend to overestimate the days with very small precipitation amounts (Boberg et al., 2009, 2010; Soares and Cardoso, 2018). For either methodology, the score is given by the sum of the minimum value obtained at each bin between the model PDF and the observational PDF:
where n is the number of bins for the PDFs, m denotes the high- or low-resolution simulation, and obs is the observational PDF. For precipitation, the limits are bounded between 1 and 300 mm, roughly corresponding to the maximum precipitation rate in IGD. Subsequently, the DAV metric is then computed as follows:
with the subscript hr depicting the high resolution and lr the low resolution. The DAVs return the fraction or percentage of gains or losses of value by downscaling the low-resolution runs. With the normalization of the PDFs, the contribution from each bin to the overall score of a particular model is more relevant for the lower bins, decreasing when approaching the tails of the distribution. If for a specific bin there is no model or observation data, then the contribution of that bin would be 0. By definition, the maximum value for S is 1; if a specific model overestimates the observable PDF in one section, then it will inevitably underestimate in another section. Both these scenarios lower the score of individual models. DAV is a versatile metric with the advantage of being able to be computed for PDF sections, which is useful for the added value characterization of extremes. In this study, the added value assessment is performed by considering not only the whole PDF but also for an extreme precipitation PDF section, with only values above the observational 95th percentile accounted for. Since the resolution difference between observations and the high-resolution models is approximately 0.01∘, this threshold is computed from the observations at the original resolution, while for the low-resolution driving models, the percentile is obtained from the interpolated observations.
For the DAV assessment, firstly, a regional approach is considered by pooling together all data from the Iberia Peninsula, thus computing the added value for the entire domain. Secondly, a spatial approach is performed, whereby all data within each grid cell from the low-resolution simulation are pooled together, returning a DAV's spatial view instead. Therefore, the Iberian overall value does not represent a mean from the spatial DAVs. Although the results should be similar, one must consider that different behaviour is expected, and care must be taken when comparing the results.
3.1 Hindcast (1989–2008)
This section presents the results for the EURO-CORDEX hindcast (1989–2008) simulations by applying the DAV metric to precipitation and precipitation extremes. All results have the IGD as a reference. The precipitation PDFs are shown in the Supplement. Figure 2 is derived from the results obtained in Fig. S1. Two different approaches are performed: one following a precipitation intensity PDF (left panels in Fig. S1) and one following a precipitation frequency (right panels in Fig. S1). Overall, the high-resolution RCM simulations better capture the observable PDFs, contrary to their lower-resolution counterparts. This behaviour suggests an expected and overall added value of the high-resolution runs relative to the coarser resolution over the Iberian Peninsula domain for both the annual and seasonal timescales. Contrasts are visible for both methodologies; for precipitation intensity, the differences between the low- and high-resolution PDFs are more perceptible, particularly at bins below the percentile thresholds. Thus, one can anticipate generalized larger added value. On the other end, for precipitation frequency and for the lower bins, the PDFs show a closer representation, almost overlapping, resulting in lower DAVs. Moreover, low-resolution runs tend to considerably overestimate the lower rainfall bins, and, as a consequence of the normalization, the higher bins roughly above 15 mm d−1 are underestimated. The same occurs for the high-resolution runs but at a lower degree, hence reproducing the observable PDF more reliably.
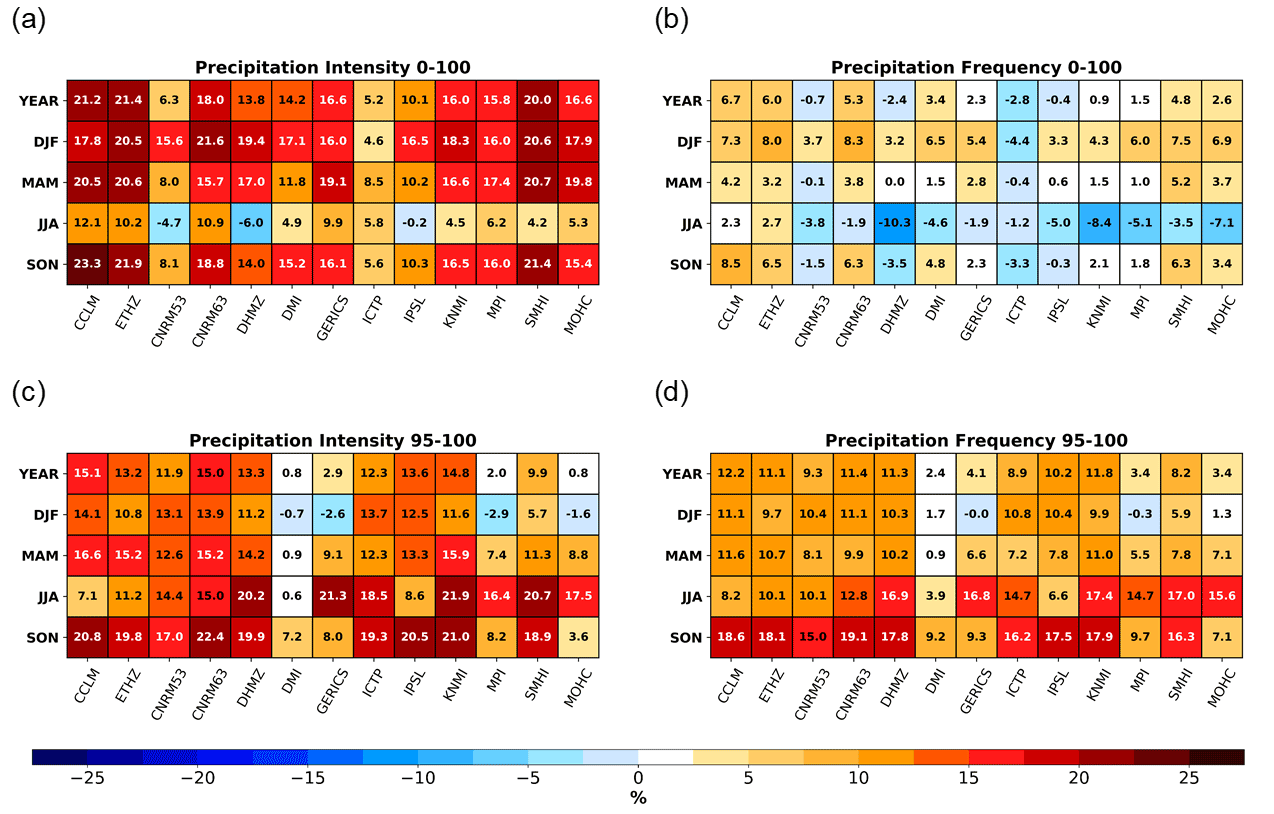
Figure 2Yearly and seasonal distribution added values (DAVs) of the Iberian Peninsula between the RCMs and the ERA-Interim reanalysis for the 1989–2008 period taken from the hindcast EURO-CORDEX simulations, with the IGD regular dataset as a reference for (a) daily precipitation intensity considering the whole PDF shown in the left panels of Fig. S1, (b) daily precipitation frequency considering the whole PDF shown in the right panels of Fig. S1, (c) daily precipitation intensity extremes only considering the values above the observational 95th percentile shown in Fig. S1 on the left side, and (d) daily precipitation frequency extremes only considering the values above the observational 95th percentile shown on the right side of Fig. S1. All RCM data were previously interpolated to 0.1∘ regular resolution from the observations, while the observations were interpolated into the ERA-Interim resolution.
In Fig. 2, the DAVs for the entire Iberian Peninsula are shown, revealing important gains of the EURO-CORDEX hindcast high-resolution simulations in comparison to the driving ERA-Interim. Figure 2a displays the DAVs for precipitation intensity considering the whole PDF with larger gains at the annual scale for 11 models, which have a DAV equal to or above to 10 %. From these CCLM, ETHZ, CNRM63, and SMHI models stand out as surpassing 18 %. CNRM53, ICTP, and IPSL RCMs show lower gains ranging from ∼ 5 % to 10 %. In winter, spring, and autumn the models roughly reproduce similar DAV values seen at the annual scale; however, this is not the case for summer. Of all seasons, summer has the lowest performances, particularly CNRM53, DHMZ, and IPSL, showing a detrimental effect ranging from −0.2 % to −6 %. In fact, summer is the season when models display more difficulty in capturing the precipitation features, since it is the driest season for the entire Iberian Peninsula and precipitation is mostly associated with water recycling through soil moisture–atmosphere feedbacks (Rios-Entenza et al., 2014). In addition to the added importance of lower precipitation rates, which models overestimate (Boberg et al., 2009, 2010; Soares and Cardoso, 2018), the representation of soil moisture in any model is still very challenging, and thus the weaker performance of the RCMs is not surprising. In fact, the summer PDF for the precipitation intensity (Fig. S1), in comparison with the other seasons, reveals a higher overestimation for the lowest bins and an underestimation in the tails, thus reducing the downscaling added value. Additionally, ERA-Interim assimilates soil moisture and temperature, near-surface temperature, and humidity, thus constraining the local land–atmosphere feedbacks and improving its added value.
While Fig. 2a shows the added value for the precipitation intensities, Fig. 2b considers the precipitation frequencies. The overall DAVs are lower, yet the models reveal similar differences, with the same models showing maximum DAVs in Fig. 2a also present in Fig. 2b. In this case, four models reveal some detrimental effects associated with the downscaling of ERA-Interim at the annual scale. For instance, the underperformance of the downscaling ICTP is highlighted with the negative values at the yearly scale derived from the poorer performance for winter and autumn. Similar to the precipitation intensity, summer has the lowest DAV values, but in this case 11 out of 13 models reveal losses, in particular DHMZ, KNMI, and MOHC with negative DAVs higher than −7 %. In fact, Herrera et al. (2020) reported a bad performance for the DHMZ RCM for all the metrics. In the opposite sense for most RCMs, winter and to some extent spring and autumn reveal gains, particularly winter with DAVs above 7 % for four RCMs. In Herrera et al. (2020), all regional models assessed against the same IGD still reveal strong biases for precipitation. Nevertheless, the gains found here for precipitation intensities (Fig. 2a) and frequencies (Fig. 2b) still reveal improvements in comparison to the driving ERA-Interim reanalysis. Moreover, in Soares and Cardoso (2018) Iberia displayed larger added value in comparison to the other regions analysed.
The next panel shows the DAV metric but applied only for values above the observational 95th percentile, with the normalization carried out considering just the bins above this threshold, thus only inspecting the added value related to the extreme precipitation tail. Previous studies such as Soares and Cardoso (2018) and Ciarlo et al. (2020) reported more relevant gains when looking into extremes, with a few exceptions. Instead, results from Fig. 2c reveal lower DAVs compared to the whole PDF case (Fig. 2a), yet this is noteworthy. The same was reported by Soares and Cardoso (2018) for the Iberia Peninsula; despite the low station density considered, the DAVs reveal smaller values for the extremes and higher values for the PDF as a whole. At the annual scale, four RCMs reveal similar performances in comparison to the driving simulation, while the other RCMs have added value above ∼ 10 %. From all seasons, winter reveals four RCMs with slight detrimental effects, contrasting with the results obtained from the other seasons and against Fig. 2a. The downscaling shows a better performance, i.e. larger added value, for the summer and autumn season for more than half of the RCMs, which display gains equal to or higher than 15 %. The gains for the summer season when most precipitation is convective (Azorin-Molina et al., 2014) are relevant, as low-resolution models have trouble capturing these highly spatial and temporal heterogeneities due to shortcomings associated with the parameterization of convection (Prein et al., 2015). Spring also revealed high added value for almost all RCMs, ranging from 7.4 % to 16.6 %. The exception is for the DMI model, which has limited to no added value throughout the year, apart from autumn. In fact, this RCM is the only one showing a performance similar to the driving simulation for three seasons. In Herrera et al. (2020) most models overestimate the 50-year return period for precipitation extremes for a large part of the domain, which is in line with the results shown in Fig. S1. However, the low-resolution models cannot reproduce such high precipitation rates, which in the end results in added value despite the overestimation.
For the precipitation frequency extremes (Fig. 2d), the DAVs are almost always slightly lower in comparison to precipitation intensity (Fig. 2c) but larger than Fig. 2b. The similarity across the two methodologies at the yearly and seasonal scale is clear, with summer and autumn revealing larger gains, while for spring and winter most RCMs display gains close to 10 %. The exceptions are DMI, GERICS, MPI, and MOHC, namely for winter and autumn with more limited DAVs.
Figure S2 from the Supplement displays a slightly different approach than in Fig. 2. In this case, all model data were previously interpolated to the 0.1∘ resolution from the observations. A conservative remapping of precipitation was considered (Schuzweida et al., 2009), resulting in a smoothing of the precipitation field, which does not significantly impact the PDFs from ERA-Interim. On the other hand, by upscaling the IGD, part of the original variability is conserved, thus changing the intensity or frequency within each bin. These differences result in larger gains for Fig. S2 in comparison to Fig. 2. Nevertheless, the overall inter-model variability is close between these two metrics.
Figure 3 displays the same metric used in Fig. 2, but from a spatial overview. Here a different approach is implemented, whereby the percentiles and PDFs are computed by pooling together all information only within each grid cell from the low-resolution driving model. Figure 3a displays a spatialization of the added value for the full precipitation intensity PDF, revealing notable added value for most of the domain, as expected from the results obtained from Fig. 2a.
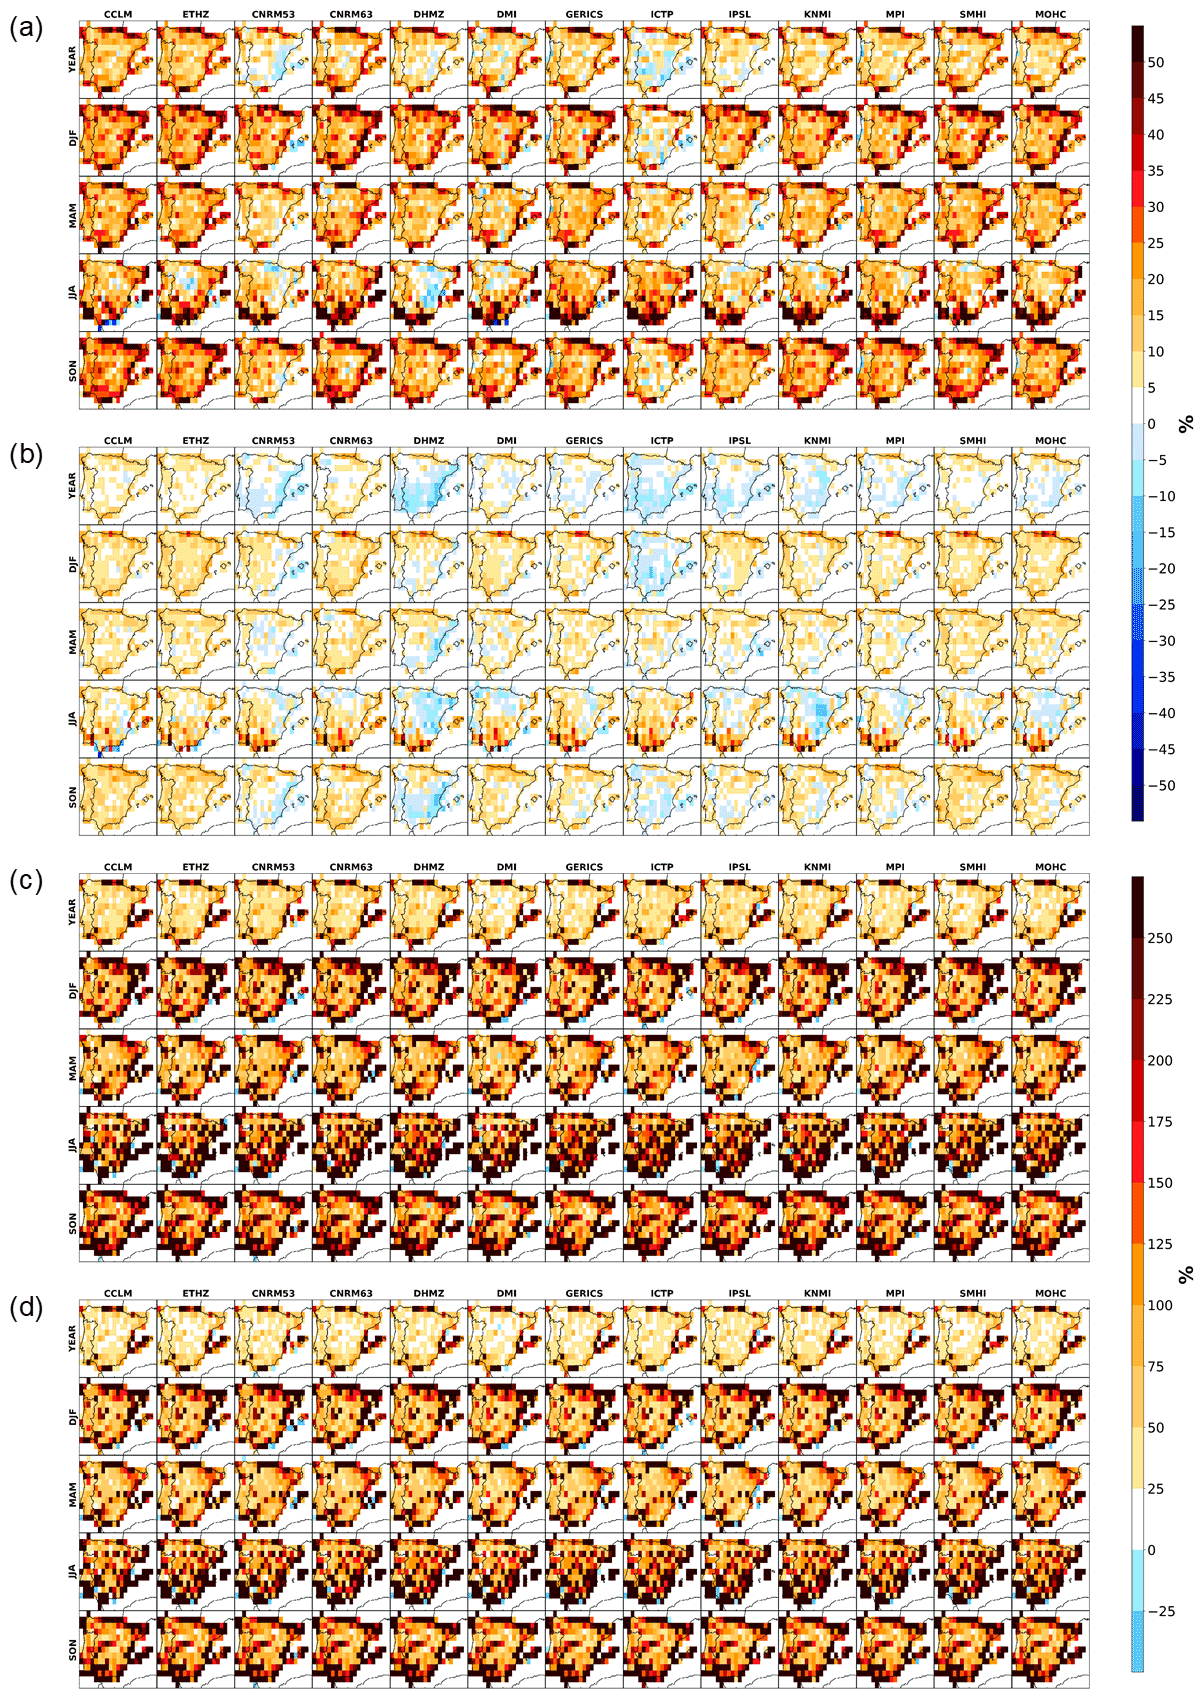
Figure 3Yearly and seasonal spatial distribution added values (DAVs) of the Iberian Peninsula between the RCMs and the ERA-Interim reanalysis for the 1989–2008 period taken from the hindcast EURO-CORDEX simulations, with the IGD regular dataset as a reference for (a) daily precipitation intensity considering the whole PDF, (b) daily precipitation frequency considering the whole PDF, (c) daily precipitation intensity extremes, only considering the values above the observational 95th percentile from each ERA-Interim grid point, and (d) daily precipitation frequency extremes only considering the values above the observational 95th percentile from each ERA-Interim grid point. All RCM data were previously interpolated to 0.1∘ regular resolution from the observations, while the observations were interpolated into the ERA-Interim resolution.
In general, the gains are larger for the coastal areas and the Pyrenees throughout the year due to a better representation by the higher resolutions of the land–sea and topographically induced circulations. The more expressive gains for coastal areas, particularly for the Mediterranean, were also observed in Careto et al. (2022) for maximum and minimum temperatures. Similar to Fig. 2a, most models for winter, spring, and autumn mostly display locations with large added value. For summer, the gains are more focused in the southern part of the peninsula, although most models still reveal noteworthy percentages for the central and northern locations. RCMs such as CNRM53, ICTP, and to some extent IPSL reveal sites in the Iberian interior with low or even negative added values. Those have a clear impact on the results shown in Fig. 2a. Moreover, DHMZ, which was revealed to have the minimum value in the summer regional overview, displays some points in Fig. 3a having a slightly detrimental effect of ∼ −10 %.
In contrast with Fig. 3a and following the results from relative precipitation frequency in Fig. 2b, Fig. 3b shows an overall smaller added value, following a very similar inter-model difference. While for precipitation intensity, values easily surpassed 50 %, namely near the coast, here the gains are more limited, going up to 30 % at some coastal sites. Moreover, for the same models which had a lower performance in the regional overview, particularly over the summer season, locations emerge having DAVs of ∼ −10 % to −15 % in comparison with the driving simulation. Nevertheless, for the same season, all models reveal large added value for the southern peninsula, mirroring Fig. 3a. However, these positive values are not enough to reverse the losses found for the entire domain in Fig. 2b. The regional overview of the DAVs is not a mean from the spatializations, and thus care must be taken when comparing the two figures. For instance, the ICTP model in Fig. 2b had the worst overall performance with negative values for all timescales, while in Fig. 3b the picture is different. ICTP only shows negative percentages at the annual scale and for the winter and autumn seasons. On the other hand, DHMZ, which had the minimum DAV in Fig. 2b, still reveals locations with large gains.
The picture for the extreme precipitation intensity and frequencies is completely different (Fig. 3c and d). Here the gains of the high resolution relative to the ERA-Interim reanalysis are evident when moving to more local scales. Moreover, the contrast of values with the extremes shown in Fig. 2 highlights the difference in both methodologies. For the spatialization, each point of the low resolution only considers the amount of information available within, whereas, in Fig. 2, all data are considered. In the former, there are fewer values above the observational percentiles and even fewer for the seasons, contrasting with the high resolution. This fact highlights the difficulty in the representation of extremes by the lower-resolution models, resulting in added value. Moreover, in Fig. 2, precipitation intensity showed higher DAVs, while the results in Fig. 3c and d are similar to each other, with points revealing gains above 250 %. Still, at the annual scale, in comparison to the individual seasons, it is possible to see lower percentages over the centre of Iberia, highlighting the improvements near the coast.
3.2 Historical (1971–2005)
This section displays the same metric, but applied to the historical simulation, covering the 1971–2005 period. For this case, the same RCM could be forced by different GCMs; however, the results do not necessarily have to agree. In fact, following the values from Fig. 4, the different performances are more closely related to the different GCMs themselves than across the same high-resolution models. This enforces a weak or even no relationship between a single RCM forced by different GCMs. Moreover, any comparison with the previous hindcast (Figs. 2 and 3) is hindered, not only owing to these differences, but also due to different time periods. Nevertheless, the range of DAVs for the historical is considerably higher. Figures S3 and S4 display the PDFs of models and observations. In the first all model data were previously interpolated to the 0.1∘ resolution of the IGD observations. For the last, the PDFs from the GCMs are kept at their original resolutions, while the observations were interpolated into each GCM grid. Thus, the PDFs for the RCMs in Fig. S3, together with the PDFs in Fig. S4, represent the base to derive the DAVs shown in Fig. 4. Following the results from the hindcast simulations, there is stronger agreement between all PDFs for precipitation frequency (right side of Figs. S3 and S4) in comparison to precipitation intensity (left side of Figs. S3 and S4), namely for the lower bins, anticipating more difficulty obtaining added value for the first.

Figure 4Yearly and seasonal distribution added values (DAVs) of the Iberian Peninsula between the RCMs and the CMIP5 GCMs for the 1989–2008 period taken from the historical EURO-CORDEX simulations, with the IGD regular dataset as a reference for (a) daily precipitation intensity considering the whole PDF shown in the left panels of Fig. S3, (b) daily precipitation frequency considering the whole PDF shown in the right panels of Fig. S3, (c) daily precipitation intensity extremes only considering the values above the observational 95th percentile shown in Fig. S3 on the left side, and (d) daily precipitation frequency extremes only considering the values above the observational 95th percentile shown on the right side of Fig. S1. All RCM data were previously interpolated to 0.1∘ regular resolution from the observations, while the observations were interpolated into each CMI5 GCM resolution. The thick blue lines separate the RCMs driven by a different GCM.
The precipitation intensity with respect to the whole PDF is shown in Fig. 4a. For most cases, there is some added value or even larger added value. From those, models forced by the NCC GCM are highlighted as having the highest added values for all timescales, namely at the annual scale, with values above 30 %. For this GCM group, only the winter season displays slightly lower gains for some RCMs, yet this is still noteworthy. IPSL-LR–GERICS also displays large gains at the annual scale, reaching 28 %, contrasting with the slightly lower results for the individual seasons. The other GCM groups do not reveal such relevant added value, namely models forced by CNRM, ICHEC1, ICHEC2, IPSL-MR, and NOAA ,with gains ranging 5 % to 20 %. Despite the overall gains, some models driven by CNRM for winter, spring, and summer reveal an absence of added value. Moreover, all ICHEC1-driven RCMs for winter, ICHEC1–DMI for spring, and some RCMs driven by ICHEC2, particularly for summer, reveal small and sometimes slightly negative percentages bounded between −5.7 % and 0.4 %. While the previous pairs still reveal some gains, MPI1 mostly shows neutral percentages oscillating between −6.9 % and 8 %, indicating a closer performance between low and high resolutions in comparison with the cases mentioned before. As for MPI2 and MPI3, the RCMs driven by these two GCMs also reveal neutral percentages for almost all timescales, with values up to 9.5 % for MPI2-ETHZ for autumn. Following the previous results, the MOHC-driven RCMs also show lower gains, but in this case also some detrimental effects in seven RCMs at the annual scale, thus having the worst results amongst all GCM–RCM pairs. From these same RCMs, at least one season also displays losses up to −13.8 %. Nevertheless, MOHC–CCLM and MOHC–ETHZ reveal values close to 0 % throughout the year.
The different behaviour across the downscaling of each GCM group may be related not only to their resolution but also to the performance and quality of the GCM itself, mainly within the lateral boundary forcing zone and also on the storm-track positioning. For instance, Brands et al. (2013) describe the MPI and MOHC as the best-performing GCMs over these regions. This implies a more correct representation of the circulation in comparison with other GCMs. In fact, Zappa et al. (2013) described the MOHC GCM as having a correct placement of storm tracks. However, a good-performing GCM in terms of circulation, which the RCMs inherit, does not translate into added value for the downscaling products. In fact, the Perkins skill score of these lower-resolution models is higher, with 0.95 for MOHC, for instance. This high score value implies an added difficulty for the downscaling RCMs in revealing added value. On the other hand, Jury et al. (2015) refer to the IPSL_MR as having a poor performance for upper-air variables over the same forcing region. Moreover, Table 6 from McSweeney et al. (2015) displays the overall performance for the individual GCMs, with CNRM, NOAA, MOHC, and MPI having a good performance, IPSL_MR and NCC with an intermediate performance, and ICHEC and IPSL_LR with a poorer performance. In fact, the RCMs driven by either the MOHC or MPI GCMs have difficulty obtaining added value, whereas the models driven by NCC or IPSL_LR clearly display added value. The resolution of the GCMs can also play a major role in the added value of precipitation. For instance, although the NOAA GCM reveals a good performance (McSweeney et al., 2015), at the same time it has one of the lowest resolutions, which may be a possible reason behind the gains found in Fig. 4a for the NOAA–GERICS pair. An important note is the fact that the precipitation variable is not directly linked between the GCMs and RCMs, as only the circulation information is passed for the dynamical downscaling models.
The next panel displays the precipitation frequency relative to the whole PDF (Fig. 4b). As with the hindcast simulation (Fig. 2), the frequency reveals limited gains but with similar inter-model differences, correlating well with the precipitation intensity approach. Thus, the overall results for precipitation frequency are lower and closer to 0 %. In other words, the negative values are not as expressive; for instance, the losses for the MOHC-driven RCMs are slightly less notable in comparison to Fig. 4a. At the other end of the spectrum, models forced by the NCC GCM still reveal some of the largest added value, although it is lower when compared to precipitation intensity. The exception is for winter when six RCMs display minor and slightly negative DAVs. Following this reasoning, the other GCM–RCM pairs reveal similar inter-model variability across Fig. 4a and b. The main reason for the similar behaviour, yet lower results, comes from the closer PDFs seen for precipitation frequency in comparison to precipitation intensity (Figs. S3 and S4) and higher Perkins skill score obtained for the lower resolutions.
Figure 4c displays the results for the precipitation intensity extremes by considering only the values above the observational 95th percentile. Compared with the hindcast results from Fig. 2, some GCM–RCM pairs do display larger added values, while at the same time showing higher DAV variability. Mirroring Fig. 4a, the NCC-forced RCMs reveal a very noticeable added value at the annual scale, derived from the strong signal found seasonally, particularly for winter. At the same time, four RCMs from this group are highlighted for having gains above 30 % for almost all seasons. The other GCM–RCM pairs do not reveal such expressive added value. Nevertheless, two RCMs driven by ICHEC1, six by ICHEC2, and all models forced by the IPSL GCMs display at least one season with percentages above 20 %. From these, three GCM–RCM pairs reveal gains higher than 30 % for a single season. In contrast, the DMI RCM forced by ICHEC reveals lower gains, namely for spring and summer. Moreover, the IPSL-MR RCMs display small percentages for spring and even losses for winter, which overshadows the gains found in summer and autumn. The CNRM-driven RCMs reveal five models with similar percentages found in Fig. 4a. However, CNRM–DMI and CNRM–GERICS display losses at the annual scale derived from a noticeable detrimental effect for summer and winter, respectively. The losses found in extremes hint towards lower accuracy for the RCMs in representing the higher bins. On the other hand, the models forced by MPI1 show an overall intensification of either gains or losses found in Fig. 4a, meaning that the gains for the whole PDF are possibly derived from the gains obtained for the extremes. The same occurs for the NOAA–GERICS pair. As for models driven by MPI2 or MPI3, while in the whole PDF the DAVs for the high resolution are more neutral, for Fig. 4c the values are more expressive, surpassing 20 % in two situations. Finally, six RCMs driven by MOHC reveal added value for the second half of the year, but with more modest values for winter and spring. From all pairs, MOHC–DMI reveals the lowest DAV, particularly for the winter season, having repercussions at the annual scale.
The last panel in Fig. 4 shows the precipitation frequency. In this case, the similarity across precipitation intensity and precipitation frequency is evident as there is good agreement between Fig. 4c and d, although as expected from before, with more limited DAVs; the negative values are not as negative, e.g. winter season in MOHC–DMI, and the positive values are not as expressive, e.g. annual scale and winter season for models driven by the NCC GCM.
Similar to the hindcast simulations, a second metric was implemented, whereby all data were interpolated to the 0.1∘ resolution from the observations (Fig. S5). The results here reveal an overall higher added value due to the stronger effect in upscaling the observations in comparison to the downscaling of the low resolution. The gains are even more evident for both precipitation intensity and frequency extremes, with percentages well above 100 % for models forced by the NCC GCM at the annual scale and in the winter season. Nevertheless, the DAVs in Fig. S5 correlate well with the results obtained in Fig. 4.
The next set of figures shows a spatialization of the DAV metric, with individual PDFs and percentile thresholds considered for each low-resolution grid point. As with the hindcast in Fig. 3, the spatialization of the technique allows the emergence of points with either high positive added value or losses, which would be masked otherwise. Figure 5 displays the results for precipitation intensity, and overall, important gains are found for all models, even for those which underperformed at the Iberia Peninsula scale in Fig. 4a. Nevertheless, it is possible to verify higher added value in coastal areas relative to inland points. This situation also occurred for the hindcast simulations and is owed mainly to a better representation of the land–sea circulations. Moreover, RCMs forced by IPSL–LR, NCC, and NOAA reveal most grid points with large positive gains, corroborating the results from Fig. 4a. In contrast, the GCM–RCM pairs that displayed gains not as relevant as those listed before all display points with limited values and sometimes small losses for sites in the interior, thus lowering the joint performance. Nevertheless, these pairs reveal substantial added value, in particular on the Mediterranean coast. Similar to the previous cases, models forced by all three MPI GCM versions reveal a similar behaviour, with higher gains in coastal areas and lower values in the interior. However, these results contrast with the DAVs found in Fig. 4a, namely for models forced by MPI2, i.e. when assessing the precipitation at a more local scale, the gains become even more evident.
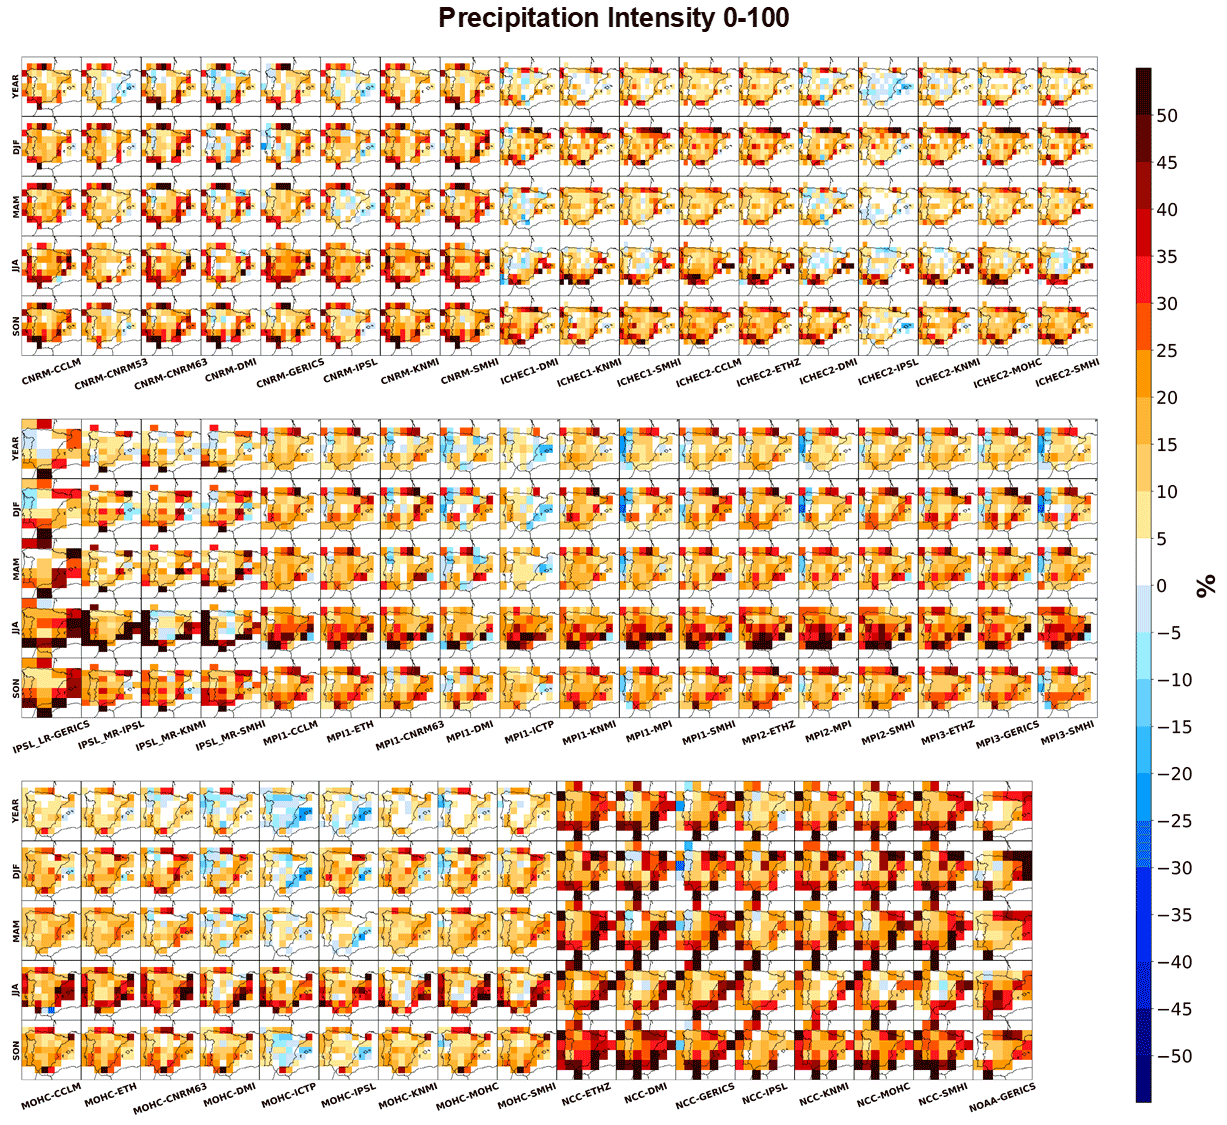
Figure 5Yearly and seasonal distribution added values (DAVs) of the Iberian Peninsula for the historical (1971–2005) EURO-CORDEX RCMs, with the IGD as a reference for the daily precipitation intensity, considering the whole PDF. All RCM data were previously interpolated to 0.1∘ regular resolution from the observations, while the observations were interpolated into each CMI5 GCM resolution.
Lastly, models forced by the MOHC GCM still reveal relevance for the most part, namely for summer in coastal areas, contrasting with the lower values in the other seasons. MOHC–ICTP had the overall worst performance, yet some added value is still shown for points located on the Atlantic coast for winter, spring, and autumn.
Figure 6 displays the same results, but for precipitation frequency instead. As expected from the previous cases, the overall gains are more limited for both the positive and negative percentages. Still, good agreement with Figs. 4b and 5 is found. From all GCM–RCM pairs, 36 models reveal a better performance for most points within the domain for the summer season. Although a good performance is revealed for most locations for the ICHEC-driven GCMs in Fig. 5, widespread small DAVs occur for precipitation frequency. IPSL-driven RCMs also show relevant gains at the annual and seasonal scales, namely over Portugal and on the Atlantic coast. As for the models forced by the NCC GCM, precipitation frequency revealed smaller DAVs in comparison to Fig. 5. Only a single point located over Gibraltar displays very large added value of above 30 % for all seasons but summer.
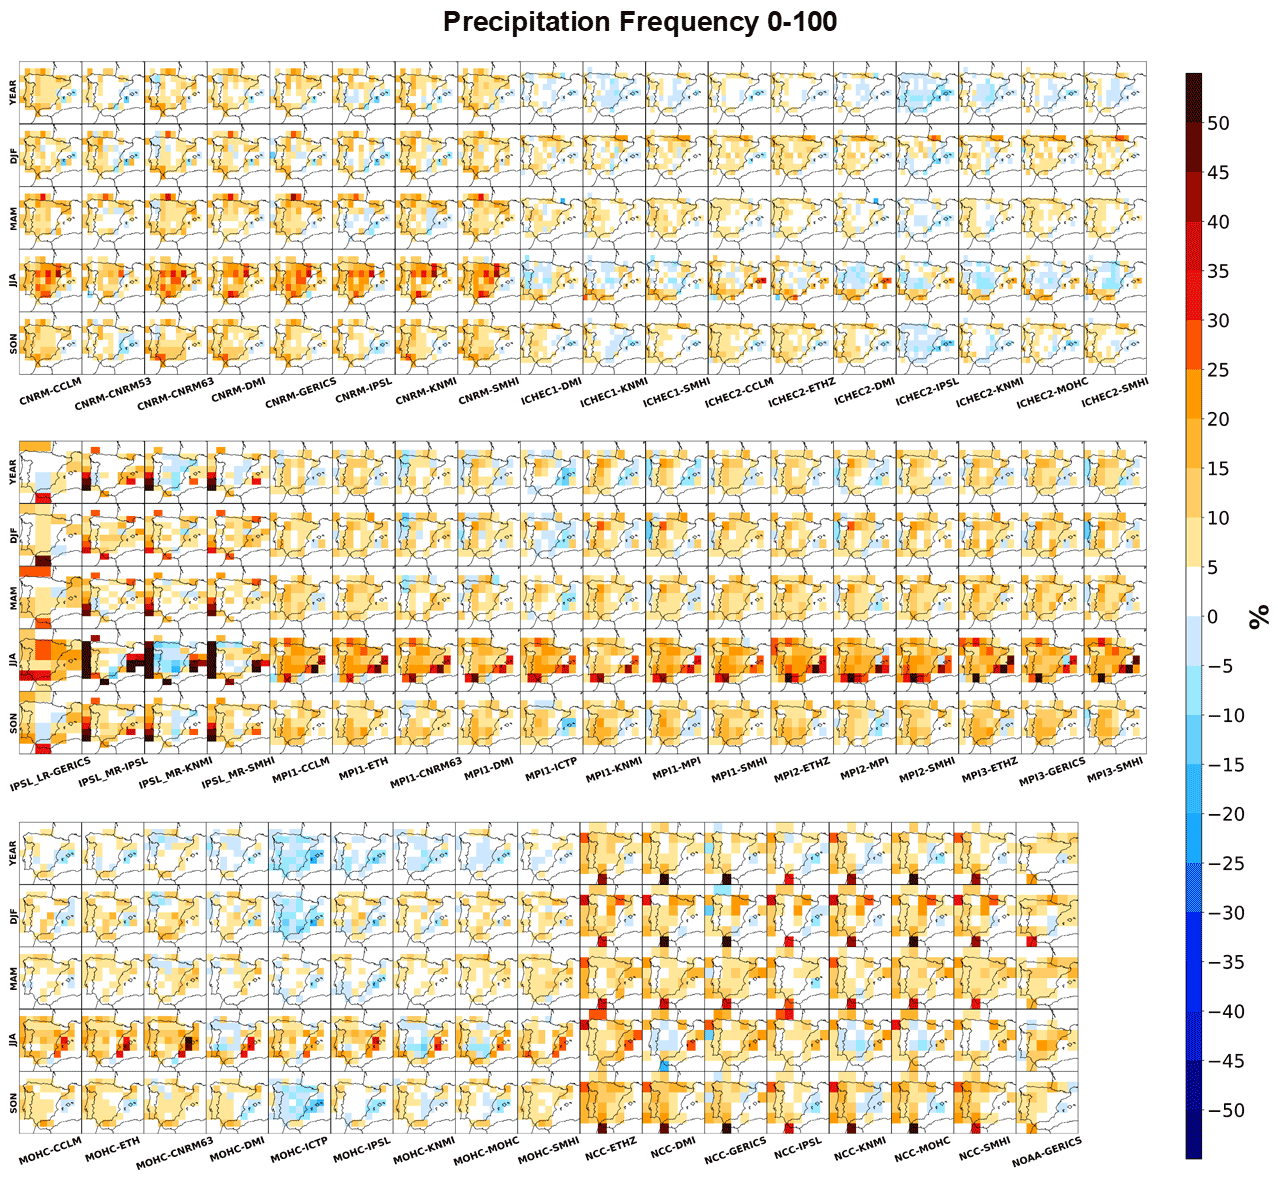
Figure 6Yearly and seasonal distribution added values (DAVs) of the Iberian Peninsula for the historical (1971–2005) EURO-CORDEX RCMs, with the IGD as a reference for the daily precipitation frequency, considering the whole PDF. All RCM data were previously interpolated to 0.1∘ regular resolution from the observations, while the observations were interpolated into each CMI5 GCM resolution.

Figure 7Yearly and seasonal distribution added values (DAVs) of the Iberian Peninsula for the historical (1971–2005) EURO-CORDEX RCMs, with the IGD as a reference for the daily precipitation intensity, only considering the values above the observational 95th percentile. All RCM data were previously interpolated to 0.1∘ regular resolution from the observations, while the observations were interpolated into each CMI5 GCM resolution.
The next figures show the results for precipitation intensity extremes (Fig. 7) and precipitation frequency extremes (Fig. 8). In comparison to the hindcast simulations, the results here reveal more spatial variability. Nevertheless, the added value is more noteworthy for the DAV spatialization than for the whole domain (Fig. 4), particularly for precipitation extremes due to the fact that this variable is highly localized. In contrast, between Figs. 5 and 6, where some differences arose, the precipitation intensity and frequency extremes (Figs. 7 and 8) reveal a closer behaviour. Similar to the previous cases, since the data are further split up when assessing the seasons, the DAVs at the annual scale are usually slightly lower. In fact, all models in Figs. 7 and 8 clearly reveal this nature. Moreover, from all model pairs, only the MOHC, NCC, and NOAA groups display smaller DAVs for points in the interior, while the other pairs mostly show large gains throughout the entire domain.
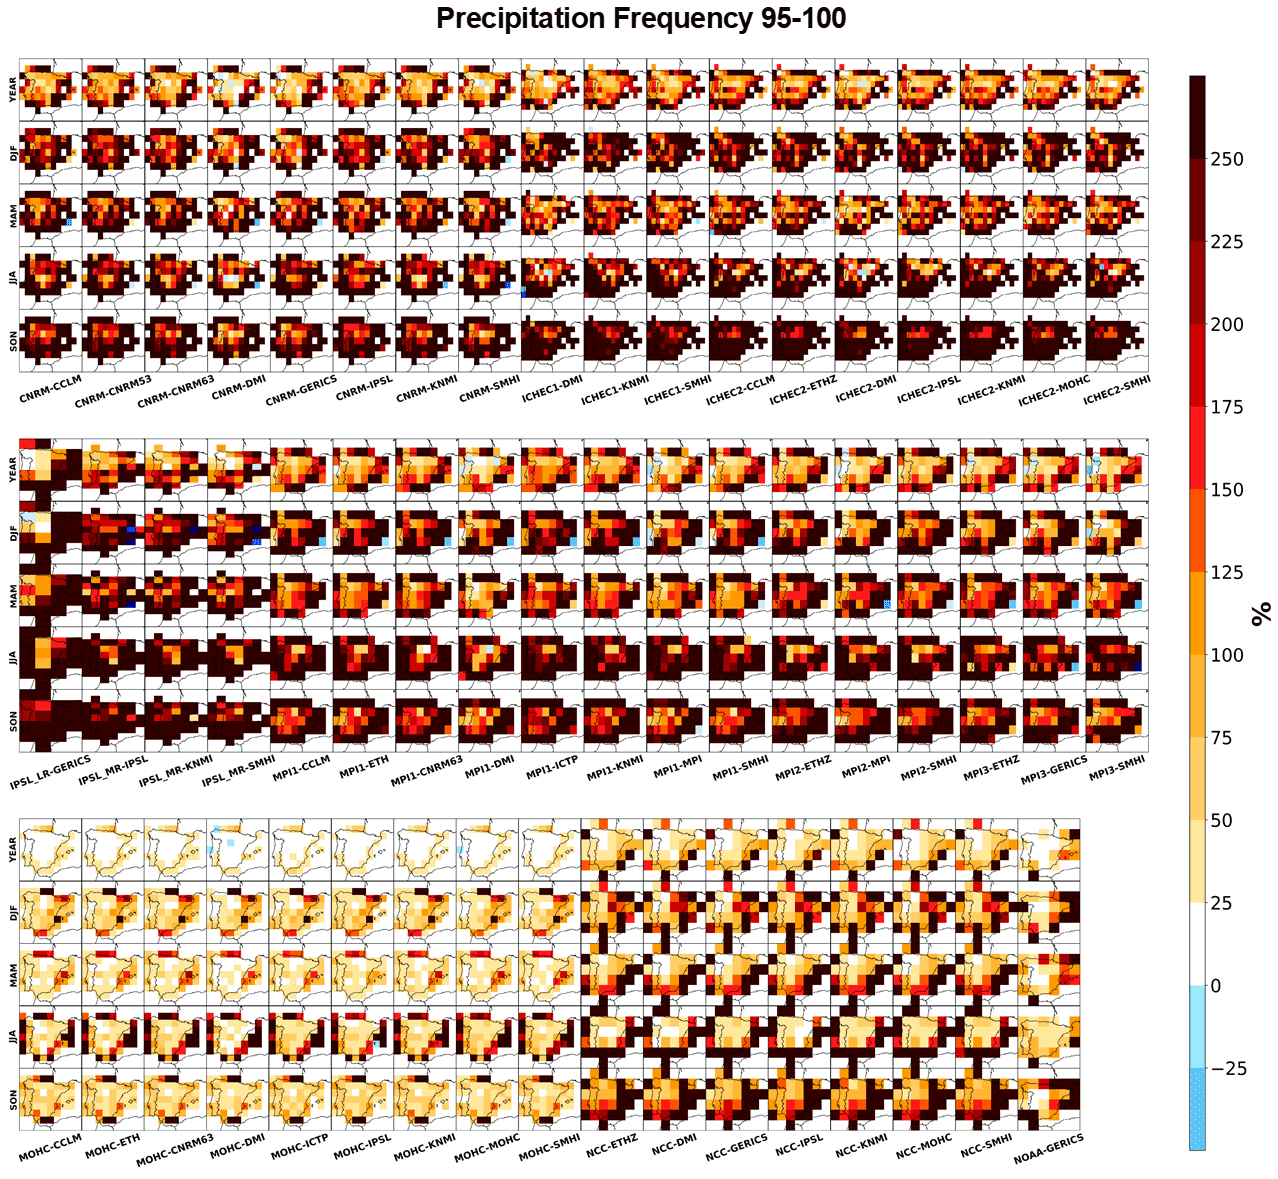
Figure 8Yearly and seasonal distribution added values (DAVs) of the Iberian Peninsula for the historical (1971–2005) EURO-CORDEX RCMs, with the IGD as a reference for the daily precipitation frequency, only considering the values above the observational 95th percentile. All RCM data were previously interpolated to 0.1∘ regular resolution from the observations, while the observations were interpolated into each CMI5 GCM resolution.
In this study, the performance of RCMs from the hindcast (1989–2008) and historical (1971–2005) simulations is assessed relative to their PDFs by using a distribution added value metric proposed by Soares and Cardoso (2018). This assessment has the IGD regular gridded dataset observations as a reference, covering the entire Iberian Peninsula. To this end, all RCM information was first interpolated to the 0.1∘ resolution from the observations, while the low resolution is assessed at native resolution. Two slightly different approaches were considered here, one following a precipitation intensity PDF and the other a precipitation frequency. Between the two, the results reveal very similar inter-model differences; however, a stronger signal is found for precipitation intensity. Nevertheless, all RCMs reveal notable added value, particularly in the representation of extremes, with the global models having more difficulty describing the higher precipitation rates. This result is expected and shows the importance of considering regional models with higher resolution. However, in some isolated cases, the RCMs instead display a neutral effect or even a slight deterioration effect. On the other hand, by considering a more local scale in the spatialization of the DAVs, in particular for extreme precipitation, very large added values within the entire Iberia Peninsula are revealed. These gains are more relevant for coastal sites, possibly due to the better representation of the land–sea boundary.
Previous works included warnings about the uncertainty due to interpolation procedures (Ciarlo et al., 2020). In a way, interpolating the GCMs to higher resolutions could generate unrealistic values, whereas upscaling the high resolution degrades the spatial information, primarily affecting the tail end of the distributions (Torma et al., 2015; Prein et al., 2016). To gauge these differences a second methodology was investigated, whereby all data were interpolated to the 0.1∘ resolution from the observations. In this case, the overall DAVs revealed higher added value. These results hint towards a stronger effect in the upscaling of the high-resolution PDF against the effect of the generation of spurious values when interpolating lower-resolution datasets, not considering local feedback systems and the effect that higher-resolution topography has on precipitation. Nonetheless, since unrealistic values may be created, the uncertainty associated with this second approach is higher.
While the DAV metric allows for quantification of the gains or losses by the downscaling of the global models, no relationship is found when the same RCM is forced by multiple GCMs. More importantly, a strong connection is observed for high-resolution models driven by the same GCM. The performance of the GCM along the regions of lateral forcing for EURO-CORDEX plays an important role in the ability of the RCMs to downscale precipitation. This study clearly shows that the gains obtained from the use of higher-resolution RCMs are paramount, not only due to finer details in the representation of variables by itself, but also due to the increased description of orography and land–ocean–atmosphere feedbacks, which all have important impacts on precipitation. The added value associated with the higher resolution gives credence to the growing effort to perform increasingly higher-resolution simulations up to convection-permitting scales. However, the inter-model variability supports the need for a coordinated ensemble of simulations similar to the one of the CORDEX flagship pilot study: “Convective phenomena at high resolution over Europe and the Mediterranean”. Increasing resolution implies higher computational costs; thus, in the last years the CORDEX community has identified the objective quantification of RCM added value with respect to the GCM forcing as a major challenge. Added value assessments will allow the detection of future model development needs.
All model and observational datasets are publicly available. The regional and global model data are available through the Earth System Grid Federation portal (Williams et al., 2011; https://esgf.llnl.gov/, last access: 29 April 2021). The ERA-Interim reanalyses are available at the ECMWF portal after registration (https://apps.ecmwf.int/datasets/data/interim-full-daily/levtype=sfc/, last access: 29 April 2020). The Iberia01 dataset is publicly available through the DIGITAL.CSIC open science service (Herrera et al., 2019a, https://doi.org/10.20350/digitalCSIC/8641).
The supplement related to this article is available online at: https://doi.org/10.5194/gmd-15-2635-2022-supplement.
JAMC computed all results and developed the paper with contributions from all co-authors. PMMS and RMC developed the metric on which this paper is based. SH, JMG, PMMS, and RAMC previously developed the observation-based Iberian Gridded Dataset.
The contact author has declared that neither they nor their co-authors have any competing interests.
Publisher's note: Copernicus Publications remains neutral with regard to jurisdictional claims in published maps and institutional affiliations.
The authors would like to thank all the individual participating institutes listed in Tables S1 and S2 and the Earth System Grid Federation infrastructure for providing all the model data used in this study. The authors also acknowledge the Iberian Gridded Dataset (IGD) http://hdl.handle.net/10261/183071 (last access: 28 January 2021).
João António Martins Careto is supported by the Portuguese Foundation for Science and Technology (FCT) with the doctoral grant SFRH/BD/139227/2018 financed by national funds from the MCTES within the Faculty of Sciences, University of Lisbon. Pedro Miguel Matos Soares would like to acknowledge the financial support of FCT through project UIDB/50019/2020 (IDL and EEA-Financial Mechanism 2014–2021) and the Portuguese Environment Agency through Pre-defined Project-2 National Roadmap for Adaptation XXI (PDP-2). Rita Margarida Cardoso is supported by the FCT under the project LEADING (PTDC/CTA-MET/28914/2017). This work was also supported by project FCT UIDB/50019/2020 – Instituto Dom Luiz (IDL).
This paper was edited by Augustin Colette and reviewed by two anonymous referees.
Azorin-Molina, C., Tijm, S., Ebert, E. E., Vicente-Serrano, S. M., and Estrela, M. J.: Sea breeze thunderstorms in the eastern Iberian Peninsula. Neighborhood verification of HIRLAM and HARMONIE precipitation forecasts, Atmos. Res., 139, 101–115, https://doi.org/10.1016/j.atmosres.2014.01.010, 2014.
Ban, N., Schmidli, J., and Schär, C.: Evaluation of the convection-resolving regional climate modeling approach in decade-long simulations, J. Geophys. Res.-Atmos., 119, 7889–7907, https://doi.org/10.1002/2014JD021478, 2014.
Ban, N., Caillaud, C., Coppola, E., Pichelli, E., Sobolowski, S., Adinolfi, M., Ahrens, B., Alias, A., Anders, I., Bastin, S., and Belušić, D.: The first multi-model ensemble of regional climate simulations at kilometer-scale resolution, Part I: Evaluation of precipitation, Clim. Dynam., 57, 275–302, https://doi.org/10.1007/s00382-021-05708-w, 2021.
Berthou, S., Kendon, E. J., Chan, S. C., Ban, N., Leutwyler, D., Schär, C., and Fosser, G.: Pan-European climate at convection-permitting scale: a model intercomparison study, Clim. Dynam., 55, 35–59, https://doi.org/10.1007/s00382-018-4114-6, 2020.
Boberg, F., Berg, P., Thejll, P., Gutowski, W. J., and Christensen, J. H.: Improved confidence in climate change projections of precipitation evaluated using daily statistics from the PRUDENCE ensemble, Clim. Dynam., 32, 1097–1106, https://doi.org/10.1007/s00382-008-0446-y, 2009.
Boberg, F., Berg, P., Thejll, P., Gutowski, W. J., and Christensen, J. H.: Improved confidence in climate change projections of precipitation further evaluated using daily statistics from ENSEMBLES models, Clim. Dynam., 35, 1509–1520, https://doi.org/10.1007/s00382-009-0683-8, 2010.
Brands, S., Herrera, S., Fernández, J., and Gutiérrez, J. M.: How well do CMIP5 Earth System Models simulate present climate conditions in Europe and Africa?, Clim. Dynam., 41, 803–817, https://doi.org/10.1007/s00382-013-1742-8, 2013.
Cardoso, R. M., and Soares, P. M. M.: Is there added value in the EURO-CORDEX hindcast temperature simulations? Assessing the added value using climate distributions in Europe, Int. J. Climatol., 1–16, https://doi.org/10.1002/joc.7472, 2022.
Cardoso, R. M., Soares, P. M. M., Miranda, P. M. A., and Belo-Pereira, M.: WRF high resolution simulation of Iberian mean and extreme precipitation climate, Int. J. Climatol., 33, 2591–2608, https://doi.org/10.1002/joc.3616, 2013.
Careto, J. A. M., Soares, P. M. M., Cardoso, R. M., Herrera, S., and Gutiérrez, J. M.: Added value of EURO-CORDEX high-resolution downscaling over the Iberian Peninsula revisited – Part 2: Max and min temperature, Geosci. Model Dev., 15, 2653–2671, https://doi.org/10.5194/gmd-15-2653-2022, 2022.
Casanueva, A., Herrera, S., Fernández, J., and Gutiérrez, J. M.: Towards a fair comparison of statistical and dynamical downscaling in the framework of the EURO-CORDEX initiative, Climatic Change, 137, 411–426, https://doi.org/10.1007/s10584-016-1683-4, 2016a.
Casanueva, A., Kotlarski, S., Herrera, S., Fernández, J., Gutiérrez, J. M., Boberg, F., Colette, A., Christensen, O. B., Goergen, K., Jacob, D., and Keuler, K.: Daily precipitation statistics in a EURO-CORDEX RCM ensemble: added value of raw and bias-corrected high-resolution simulations, Clim. Dynam., 47, 719–737, https://doi.org/10.1007/s00382-015-2865-x, 2016b.
Christensen, J. H. and Christensen, O. B.: A summary of the PRUDENCE model projections of changes in European climate by the end of this century, Climatic Change, 81, 7–30, https://doi.org/10.1007/s10584-006-9210-7, 2007.
Christensen, J. H., Hewitson, B., Busuioc, A., Chen, A., Gao, X., Held, I., Jones, R., Kolli, R. K., Kwon, W.-T., Laprise, R., Magaña Rueda, V., Mearns, L., Menéndez, C. G., Räisänen, J., Rinke, A., Sarr, A., and Whetton, P.: Regional climate projections, in: Climate Change 2007: The Physical Science Basis. Contribution of Working Group I to the Fourth Assessment Report of the Intergovernmental Panel on Climate Change, edited by: Solomon, S., Qin, D., Manning, M., Chen, Z., Marquis, M., Averyt, K. B., Tignor, M., and Miller, H. L., Cambridge University Press, Cambridge, UK and New York, NY, TRN: GB07CC205, 2007.
Christensen, O. B., Drews, M., Christensen, J. H., Dethloff, K., Ketelsen, K., Hebestadt, I., and Rinke, A.: The HIRHAM regional climate model, Version 5 (beta), https://www.dmi.dk/fileadmin/Rapporter/TR/tr06-17.pdf (last access: 29 April 2021), 2007.
Ciarlo, J. M., Coppola, E., Fantini, A., Giorgi, F., Gao, X., Tong, Y., Glazer, R. H., Alavez, J. A. T., Sines, T., Pichelli, E., and Raffaele, F.: A new spatially distributed added value index for regional climate models: the EURO-CORDEX and the CORDEX-CORE highest resolution ensembles, Clim. Dynam., 57, 1403–1424, https://doi.org/10.1007/s00382-020-05400-5, 2020.
Coppola, E., Sobolowski, S., Pichelli, E., Raffaele, F., Ahrens, B., Anders, I., Ban, N., Bastin, S., Belda, M., Belusic, D., and Caldas-Alvarez, A.: A first-of-its-kind multi-model convection permitting ensemble for investigating convective phenomena over Europe and the Mediterranean, Clim. Dynam., 55, 3–34, https://doi.org/10.1007/s00382-018-4521-8, 2020.
Dee, D. P., Uppala, S. M., Simmons, A. J., Berrisford, P., Poli, P., Kobayashi, S., Andrae, U., Balmaseda, M. A., Balsamo, G., Bauer, D. P., and Bechtold, P.: The ERA-Interim reanalysis: Configuration and performance of the data assimilation system, Q. J. Roy. Meteor. Soc., 137, 553–597, https://doi.org/10.1002/qj.828, 2011.
Di Luca, A., de Elía, R., and Laprise, R.: Potential for added value in precipitation simulated by high-resolution nested regional climate models and observations, Clim. Dynam., 38, 1229–1247, https://doi.org/10.1007/s00382-011-1068-3, 2012.
Di Luca, A., de Elía, R., and Laprise, R.: Potential for small scale added value of RCM's downscaled climate change signal, Clim. Dynam., 40, 601–618, https://doi.org/10.1007/s00382-012-1415-z, 2013.
Fosser, G., Khodayar, S., and Berg, P.: Climate change in the next 30 years: What can a convection-permitting model tell us that we did not already know?, Clim. Dynam., 48, 1987–2003, https://doi.org/10.1007/s00382-016-3186-4, 2017.
Froidevaux, P., Schlemmer, L., Schmidli, J., Langhans, W., and Schär, C.: Influence of the background wind on the local soil moisture–precipitation feedback, J. Atmos. Sci., 71, 782–799, https://doi.org/10.1175/JAS-D-13-0180.1, 2014.
Fumière, Q., Déqué, M., Nuissier, O., Somot, S., Alias, A., Caillaud, C., Laurantin, O., and Seity, Y.: Extreme rainfall in Mediterranean France during the fall: added value of the CNRM-AROME Convection-Permitting Regional Climate Model, Clim. Dynam., 55, 77–91, https://doi.org/10.1007/s00382-019-04898-8, 2020.
Giorgi, F. and Bates, G. T.: The climatological skill of a regional model over complex terrain, Mon. Weather Rev., 117, 2325–2347, https://doi.org/10.1175/1520-0493(1989)117<2325:TCSOAR>2.0.CO;2, 1989.
Giorgi, F. and Mearns, L. O.: Approaches to the simulation of regional climate change: a review, Rev. Geophys., 29, 191–216, https://doi.org/10.1029/90RG02636, 1991.
Giorgi, F. and Mearns, L. O.: Introduction to special section: Regional climate modeling revisited, J. Geophys. Res.-Atmos., 104, 6335–6352, https://doi.org/10.1029/98JD02072, 1999.
Giorgi, F., Jones, C. and Asrar, G. R.: Addressing climate information needs at the regional level: the CORDEX framework, World Meteorological Organization (WMO) Bulletin, 58, 175–183, 2009.
Gutowski Jr., W. J., Takle, E. S., Kozak, K. A., Patton, J. C., Arritt, R. W., and Christensen, J. H.: A possible constraint on regional precipitation intensity changes under global warming, J. Hydrometeorol., 8, 1382–1396, https://doi.org/10.1175/2007JHM817.1, 2007.
Gutowski Jr., W. J., Giorgi, F., Timbal, B., Frigon, A., Jacob, D., Kang, H.-S., Raghavan, K., Lee, B., Lennard, C., Nikulin, G., O'Rourke, E., Rixen, M., Solman, S., Stephenson, T., and Tangang, F.: WCRP COordinated Regional Downscaling EXperiment (CORDEX): a diagnostic MIP for CMIP6, Geosci. Model Dev., 9, 4087–4095, https://doi.org/10.5194/gmd-9-4087-2016, 2016.
Heikkilä, U., Sandvik, A., and Sorteberg, A.: Dynamical downscaling of ERA-40 in complex terrain using the WRF regional climate model, Clim. Dynam., 37, 1551–1564, https://doi.org/10.1007/s00382-010-0928-6, 2011.
Herrera, S., Cardoso, R. M., Soares, P. M. M., Espírio-Santo, F., Viterbo, P., and Gutiérrez, J. M.: “Iberia01: Daily gridded (0.1º resolution) dataset of precipitation and temperatures over the Iberian Peninsula” DIGITAL.CSIC [data set], https://doi.org/10.20350/digitalCSIC/8641, 2019a.
Herrera, S., Cardoso, R. M., Soares, P. M., Espírito-Santo, F., Viterbo, P., and Gutiérrez, J. M.: Iberia01: a new gridded dataset of daily precipitation and temperatures over Iberia, Earth Syst. Sci. Data, 11, 1947–1956, https://doi.org/10.5194/essd-11-1947-2019, 2019b.
Herrera, S., Soares, P. M., Cardoso, R. M., and Gutiérrez, J. M.: Evaluation of the EURO-CORDEX Regional Climate Models Over the Iberian Peninsula: Observational Uncertainty Analysis, J. Geophys. Res.-Atmos., 125, e2020JD032880, https://doi.org/10.1029/2020JD032880, 2020.
Hohenegger, C., Brockhaus, P., Bretherton, C. S., and Schär, C.: The soil moisture–precipitation feedback in simulations with explicit and parameterized convection, J. Climate, 22, 5003–5020, https://doi.org/10.1175/2009JCLI2604.1, 2009.
Imamovic, A., Schlemmer, L., and Schär, C.: Collective impacts of orography and soil moisture on the soil moisture-precipitation feedback, Geophys. Res. Lett., 44, 11682–11691, https://doi.org/10.1002/2017GL075657, 2017.
Jacob, D., Petersen, J., Eggert, B., Alias, A., Christensen, O. B., Bouwer, L. M., Braun, A., Colette, A., Déqué, M., Georgievski, G., and Georgopoulou, E.: EURO-CORDEX: new high-resolution climate change projections for European impact research, Reg. Environ. Change, 14, 563–578, https://doi.org/10.1007252Fs10113-013-0499-2, 2014.
Jacob, D., Teichmann, C., Sobolowski, S., Katragkou, E., Anders, I., Belda, M., Benestad, R., Boberg, F., Buonomo, E., Cardoso, R. M., Casanueva, A., Christensen, O. B., Christensen, J. H., Coppola, E., De Cruz, L., Davin, E. L., Dobler, A., Domínguez, M., Fealy, R., Fernandez, J., Gaertner, M. A., García-Díez, M., Giorgi, F., Gobiet, A., Goergen, K., Gómez-Navarro, J. J., Alemán, J. J. G., Gutiérrez, C., Gutiérrez, J. M., Güttler, I., Haensler, A., Halenka, T., Jerez, S., Jiménez-Guerrero, P., Jones, R. G., Keuler, K., Kjellström, E., Knist, S., Kotlarski, S., Maraun, D., van Meijgaard, E., Mercogliano, P., Montávez, J. P., Navarra, A., Nikulin, G., Noblet-Ducoudré, N., Panitz, H. J., Pfeifer, S., Piazza, M., Pichelli, E., Pietikäinen, J. P., Prein, A. F., Preuschmann, S., Rechid, D., Rockel, B., Romera, R., Sánchez, E., Sieck, K., Soares, P. M. M., Somot, S., Srnec, L., Sørland, S. L., Termonia, P., Truhetz, H., Vautard, R., Warrach-Sagi, K., and Wulfmeyer, V., Regional climate downscaling over Europe: perspectives from the EURO-CORDEX community, Reg. Environ. Change, 20, 51, https://doi.org/10.1007/s10113-020-01606-9, 2020.
Jury, M. W., Prein, A. F., Truhetz, H., and Gobiet, A., Evaluation of CMIP5 models in the context of dynamical downscaling over Europe, J. Climate, 28, 5575–5582, https://doi.org/10.1175/JCLI-D-14-00430.1, 2015.
Kendon, E. J., Roberts, N. M., Senior, C. A., and Roberts, M. J.: Realism of rainfall in a very high-resolution regional climate model, J. Climate, 25, 5791–5806, https://doi.org/10.1175/JCLI-D-11-00562.1, 2012.
Kendon, E. J., Roberts, N. M., Fowler, H. J., Roberts, M. J., Chan, S. C., and Senior, C. A.: Heavier summer downpours with climate change revealed by weather forecast resolution model, Nat. Clim. Change, 4, 570–576, https://doi.org/10.1038/nclimate2258, 2014.
Khan, M. S., Coulibaly, P., and Dibike, Y.: Uncertainty analysis of statistical downscaling methods, J. Hydrol., 319, 357–382, https://doi.org/10.1016/j.jhydrol.2005.06.035, 2006.
Kirshbaum, D. J., Adler, B., Kalthoff, N., Barthlott, C., and Serafin, S.: Moist orographic convection: Physical mechanisms and links to surface-exchange processes, Atmosphere, 9, 80, https://doi.org/10.3390/atmos9030080, 2018.
Klein Tank, A. M. G., Wijngaard, J. B., Können, G. P., Böhm, R., Demarée, G., Gocheva, A., Mileta, M., Pashiardis, S., Hejkrlik, L., Kern-Hansen, C., and Heino, R.: Daily dataset of 20th-century surface air temperature and precipitation series for the European Climate Assessment, Int. J. Climatol., 22, 1441–1453, https://doi.org/10.1002/joc.773, 2002.
Klok, E. J. and Klein Tank, A. M. G.: Updated and extended European dataset of daily climate observations, Int. J. Climatol., 29, 1182–1191, https://doi.org/10.1002/joc.1779, 2009.
Kotlarski, S., Keuler, K., Christensen, O. B., Colette, A., Déqué, M., Gobiet, A., Goergen, K., Jacob, D., Lüthi, D., van Meijgaard, E., Nikulin, G., Schär, C., Teichmann, C., Vautard, R., Warrach-Sagi, K., and Wulfmeyer, V.: Regional climate modeling on European scales: a joint standard evaluation of the EURO-CORDEX RCM ensemble, Geosci. Model Dev., 7, 1297–1333, https://doi.org/10.5194/gmd-7-1297-2014, 2014.
Laprise, R.: Regional climate modelling, J. Comput. Phys., 227, 3641–3666, https://doi.org/10.1016/j.jcp.2006.10.024, 2008.
Leung, L. R., Mearns, L. O., Giorgi, F., and Wilby, R. L.: Regional climate research: Needs and opportunities, B. Am. Meteorol. Soc., 84, 89–95, 2003.
Leutwyler, D., Lüthi, D., Ban, N., Fuhrer, O., and Schär, C.: Evaluation of the convection-resolving climate modeling approach on continental scales, J. Geophys. Res.-Atmos., 122, 5237–5258, https://doi.org/10.1002/2016JD026013, 2017.
Liu, C., Ikeda, K., Rasmussen, R., Barlage, M., Newman, A. J., Prein, A. F., Chen, F., Chen, L., Clark, M., Dai, A., and Dudhia, J.: Continental-scale convection-permitting modeling of the current and future climate of North America, Clim. Dynam., 49, 71–95, https://doi.org/10.1007/s00382-016-3327-9, 2017.
McGregor, J. L.: Regional climate modelling, Meteorol. Atmos. Phys., 63, 105–117, https://doi.org/10.1007/BF01025367, 1997.
McSweeney, C. F., Jones, R. G., Lee, R. W., and Rowell, D. P.: Selecting CMIP5 GCMs for downscaling over multiple regions, Clim. Dynam., 44, 3237–3260, https://doi.org/10.1007/s00382-014-2418-8, 2015.
Meehl, G. A., Stocker, T. F., Collins, W. D., Friedlingstein, P., Gaye, A. T., Gregory, J. M., Kitoh, A., Knutti, R., Murphy, J. M., Noda, A., and Raper, S. C.: Global climate projections In Climate Change 2007: The Physical Science Basis, Contribution of Working Group I to the Fourth Assessment Report of the Intergovernmental Panel on Climate Change, edited by: Solomon, S., Qin, D., Manning, M., Chen, Z., Marquis, M., Averyt, K. B., Tignor, M., Miller, H. L., Cambridge University Press, Cambridge, UK and New York, NY, TRN: GB07CC205, 2007.
Perkins, S. E., Pitman, A. J., Holbrook, N. J., and McAneney, J.: Evaluation of the AR4 climate models' simulated daily maximum temperature, minimum temperature, and precipitation over Australia using probability density functions, J. Climate, 20, 4356–4376, https://doi.org/10.1175/JCLI4253.1, 2007.
Pichelli, E., Coppola, E., Sobolowski, S., Ban, N., Giorgi, F., Stocchi, P., Alias, A., Belušić, D., Berthou, S., Caillaud, C., and Cardoso, R. M.: The first multi-model ensemble of regional climate simulations at kilometer-scale resolution part 2: historical and future simulations of precipitation, Clim. Dynam., 56, 3581–3602, https://doi.org/10.1007/s00382-021-05657-4, 2021.
Prein, A. F., Gobiet, A., Suklitsch, M., Truhetz, H., Awan, N. K., Keuler, K., and Georgievski, G.: Added value of convection permitting seasonal simulations, Clim. Dynam., 41, 2655–2677, https://doi.org/10.1007/s00382-013-1744-6, 2013a.
Prein, A. F., Holland, G. J., Rasmussen, R. M., Done, J., Ikeda, K., Clark, M. P., and Liu, C. H.: Importance of regional climate model grid spacing for the simulation of heavy precipitation in the Colorado headwaters, J. Climate, 26, 4848–4857, https://doi.org/10.1175/JCLI-D-12-00727.1, 2013b.
Prein, A. F., Langhans, W., Fosser, G., Ferrone, A., Ban, N., Goergen, K., Keller, M., Tölle, M., Gutjahr, O., Feser, F., and Brisson, E.: A review on regional convection-permitting climate modeling: Demonstrations, prospects, and challenges, Rev. Geophys., 53, 323–361, https://doi.org/10.1002/2014RG000475, 2015.
Prein, A. F., Gobiet, A., Truhetz, H., Keuler, K., Goergen, K., Teichmann, C., Maule, C. F., Van Meijgaard, E., Déqué, M., Nikulin, G., and Vautard, R.: Precipitation in the EURO-CORDEX 0.11∘ and 0.44∘ simulations: high resolution, high benefits?, Clim. Dynam., 46, 383, https://doi.org/10.1007/s00382-015-2589-y, 2016.
Randall, D. A., Wood, R. A., Bony, S., Colman, R., Fichefet, T., Fyfe, J., Kattsov, V., Pitman, A., Shukla, J., Srinivasan, J., and Stouffer, R. J.: Climate models and their evaluation. In Climate change 2007: The physical science basis. Contribution of Working Group I to the Fourth Assessment Report of the Intergovernmental Panel on Climate Change, edited by: Solomon, S., Qin, D., Manning, M., Chen, Z., Marquis, M., Averyt, K. B., Tignor, M., and Miller, H. L., Cambridge University Press: Cambridge, UK and New York, NY, TRN: GB07CC205, 2007.
Rios-Entenza, A., Soares, P. M. M., Trigo, R. M., Cardoso, R. M., and Miguez-Macho, G.: Precipitation recycling in the Iberian Peninsula: spatial patterns and temporal variability, J. Geophys. Res.-Atmos., 119, 5895–5912, https://doi.org/10.1002/2013JD021274, 2014.
Rummukainen, M.: State-of-the-art with regional climate models, Wires Clim. Change, 1, 82–96, https://doi.org/10.1002/wcc.8, 2010.
Rummukainen, M.: Added value in regional climate modeling, Wires Clim. Change, 7, 145–159, https://doi.org/10.1002/wcc.378, 2016.
Schulzweida, U.: Climate Data Operators, User's Guide, Version 1.1.9, Max-Planck Institute for Meteorology, Hamburg, Germany, https://code.mpimet.mpg.de/projects/cdo/embedded/cdo.pdf, last access: 29 April 2021.
Soares, P. M. and Cardoso, R. M.: A simple method to assess the added value using high-resolution climate distributions: application to the EURO-CORDEX daily precipitation, Int. J. Climatol., 38, 1484–1498, https://doi.org/10.1002/joc.5261, 2018.
Soares, P. M., Cardoso, R. M., Miranda, P. M., de Medeiros, J., Belo-Pereira, M., and Espirito-Santo, F: WRF high resolution dynamical downscaling of ERA-Interim for Portugal, Clim. Dynam., 39, 2497–2522, https://doi.org/10.1007/s00382-012-1315-2, 2012a.
Soares, P. M., Cardoso, R. M., Miranda, P. M., Viterbo, P., and Belo-Pereira, M.: Assessment of the ENSEMBLES regional climate models in the representation of precipitation variability and extremes over Portugal, J. Geophys. Res.-Atmos., 117, D07114, https://doi.org/10.1029/2011JD016768, 2012b.
Soares, P. M., Cardoso, R. M., Semedo, Á., Chinita, M. J., and Ranjha, R.: Climatology of the Iberia coastal low-level wind jet: weather research forecasting model high-resolution results, Tellus A, 66, 22377, https://doi.org/10.3402/tellusa.v66.22377, 2014.
Soares, P. M., Cardoso, R. M., Lima, D. C., and Miranda, P. M.: Future precipitation in Portugal: high-resolution projections using WRF model and EURO-CORDEX multi-model ensembles, Clim. Dynam., 49, 2503–2530, https://doi.org/10.1007/s00382-016-3455-2, 2017.
Stocker, T. F., Qin, D., Plattner, G. K., Tignor, M. M., Allen, S. K., Boschung, J., Nauels, A., Xia, Y., Bex, V., and Midgley, P. M. (Eds.): Climate Change 2013: The physical science basis. contribution of working group I to the fifth assessment report of IPCC the intergovernmental panel on climate change, Cambridge University Press, Cambridge, United Kingdom and New York, NY, USA, https://doi.org/10.1017/CBO9781107415324, 2014.
Torma, C., Giorgi, F., and Coppola, E.: Added value of regional climate modeling over areas characterized by complex terrain – Precipitation over the Alps, J. Geophys. Res.-Atmos., 120, 3957–3972, https://doi.org/10.1002/2014JD022781, 2015.
van der Linden, P. and Mitchell, J. E.: ENSEMBLES: Climate Change and its Impacts: Summary of research and results from the ENSEMBLES project, Met Office Hadley Centre, FitzRoy Road, Exeter EX1 3PB, UK, 2009.
Wilby, R. L., Wigley, T. M. L., Conway, D., Jones, P. D., Hewitson, B. C., Main, J., and Wilks, D. S.: Statistical downscaling of general circulation model output: A comparison of methods, Water Resour. Res., 34, 2995–3008, https://doi.org/10.1029/98WR02577, 1998.
Wilks, D. S.: Statistical Methods in the Atmospheric Sciences. Academic Press, Oxford, UK, 467 pp., 1995.
Williams, D. N., Taylor, K. E., Cinquini, L., Evans, B., Kawamiya, M., Lautenschlager, M., Lawrence, B., Middleton, D., and ESGF Contributors: The Earth System Grid Federation: Software framework supporting CMIP5 data analysis and dissemination, ClIVAR Exchanges, 56, 40–42, http://centaur.reading.ac.uk/25732/1/WilEA11_CE.pdf (last access: 29 April 2021), 2011.
Zappa, G., Shaffrey, L. C., and Hodges, K. I.: The ability of CMIP5 models to simulate North Atlantic extratropical cyclones, J. Climate, 26, 5379–5396, https://doi.org/10.1175/JCLI-D-12-00501.1, 2013.