the Creative Commons Attribution 4.0 License.
the Creative Commons Attribution 4.0 License.
 | 18 Mar 2022
A dynamic local-scale vegetation model for lycopsids (LYCOm v1.0)
Susanne K. M. Arens
Kai Jensen
Tais W. Dahl
Philipp Porada
Lycopsids represent a distinct lineage of vascular plants with a long evolutionary history including numerous extant and extinct species that started out as tiny herbaceous plants and later went on to grow into forests with tree-like structures. They enriched the soil carbon pool through newly developed root-like structures and promoted soil microbial activity by providing organic matter. These plants enhanced soil carbon dioxide (CO2) via root respiration and also modified soil hydrology. These effects potentially promoted the dissolution of silicate minerals, thus intensifying silicate weathering. The weathering of silicate rocks is considered one of the most significant geochemical regulators of atmospheric CO2 over a long (hundreds of thousands to millions of years) timescale. The motivation for this study is to achieve an increased understanding of the realized impacts of vascular plants, represented by modern relatives of the most basal plants with vascular tissues and shallow root systems, on silicate weathering and past climate. To this end, it is necessary to quantify physiological characteristics, spatial distribution, carbon balance, and the hydrological impacts of early lycopsids. These properties, however, cannot be easily derived from proxies such as fossil records. Hence, as a first step, a process-based model is developed to estimate net carbon uptake by these organisms at the local scale. The model includes key features such as the distribution of biomass above and below ground, along with a plausible root distribution in the soil affecting water uptake by plants. The stomatal regulation of water loss and its immediate implications for photosynthesis are considered. Moreover, root respiration plays a crucial role in the model by affecting soil carbon dioxide and weathering rates. The model features ranges of key physiological traits of lycopsids to predict the emerging characteristics of the Lycopsida class community under any given climate by implicitly simulating the process of selection. In this way, extinct plant communities can also be represented. In addition to physiological properties, the model also simulates weathering rates using a simple limit-based approach and estimates the biotic enhancement of weathering by these plants. We run the Lycopsid model, called LYCOm, at seven sites encompassing various climate zones under today's climatic conditions. LYCOm can simulate realistic properties of lycopsid communities at the respective locations and estimates values of net primary production (NPP) ranging from 126 to 245 g carbon m−2 yr−1. Our limit-based weathering model predicts a mean chemical weathering rate ranging from 5.3 to 45.1 cm ka−1 of rock with lycopsids varying between different sites, as opposed to 0.6–8.3 cm ka−1 of rock without these plants, thereby highlighting the potential importance of such vegetation at the local scale for enhancing chemical weathering. Our modeling study establishes a basis for assessing the biotic enhancement of weathering by lycopsids at the global scale and also for the geological past. Although our method is associated with limitations and uncertainties, it represents a novel, complementary approach towards estimating the impacts of lycopsids on biogeochemistry and climate.
- Article
(2293 KB) - Full-text XML
- BibTeX
- EndNote


The increasing carbon dioxide (CO2) content of the atmosphere is one of the most discussed topics in climate research and pertains to rising concerns over the aggravating impacts of its greenhouse effect. Since societal well-being is closely connected to the level of CO2 in the atmosphere, it is important to look at past developments and understand the key events which ensued changes in the level of CO2 in the atmosphere. The fluctuations in atmospheric CO2 content of the Earth through history have been significant (Berner, 1998; Foster et al., 2017). A rapid drawdown of carbon dioxide is observed at around 420 Ma, around a similar timeline, the advent of the earliest lycopsids recorded (Garratt et al., 1984). Very few attempts have been made to explain this dip, and silicate weathering has often been cited as an important factor contributing to this rapid fall in CO2 over geologic timescales (Hilley and Porder, 2008; Colbourn et al., 2015) but the influence of these evolving flora has not been explored in detail.
Lycopsids are regarded as one of the earliest forms of extant vascular plants (tracheophytes) with a long evolutionary history (Kenrick et al., 2012; Morris, 2018; Dahl and Arens, 2020). This ancient group of vascular plants (Kenrick and Crane, 1997; Qiu et al., 2006; Wickett et al., 2014) dates back to the Silurian (Garratt et al., 1984; Kotyk et al., 2002) and were initially relatively simple, but later evolved into tree stature in the Middle Devonian (Stein et al., 2012) before surpassing a height of 50 m during the Carboniferous Period (Thomas and Watson, 1976; Taylor et al., 2009). This long transformative history along with a rich fossil record and extant diversity have made studies of lycopsids central to plant evolution. In any case, lycopsids were not only abundant during the Carboniferous Period but became ecologically significant much earlier in the late Silurian–Lower Devonian (Wellman et al., 2013) and later dominated the flora. The dominant role of these plants as terrestrial vegetation in those periods could be attributed to the appearance of root-like structures (Matsunaga and Tomescu, 2016) coupled with stomatal control (Brodribb and McAdam, 2011) for controlling water loss.
Root evolution has been a gradual process and Fig. 1 depicts the transformation from its early elementary stages of appearance in lycopsids to a sophisticated structure comparable to the roots of modern plants during the Upper Devonian (Hetherington and Dolan, 2017; Matsunaga and Tomescu, 2016). It is without a doubt that the transformation took place over a considerable period. In fact, this evolution led to the foundation of modern plants and trees which are characterized by complex tissue structure allowing transport of water and nutrients, thus making high rates of net primary production (NPP) possible. Root-like structures have been observed in fossil records dating back to as early as 413 Ma (Hao et al., 2010) in the Lower Devonian (Gensel et al., 2001). This innovation might have been central to the dominance of flora on the planet and enabled plants to grow in size and overcome the physiological drawback of their dependence on moist habitats (Bateman et al., 1998).
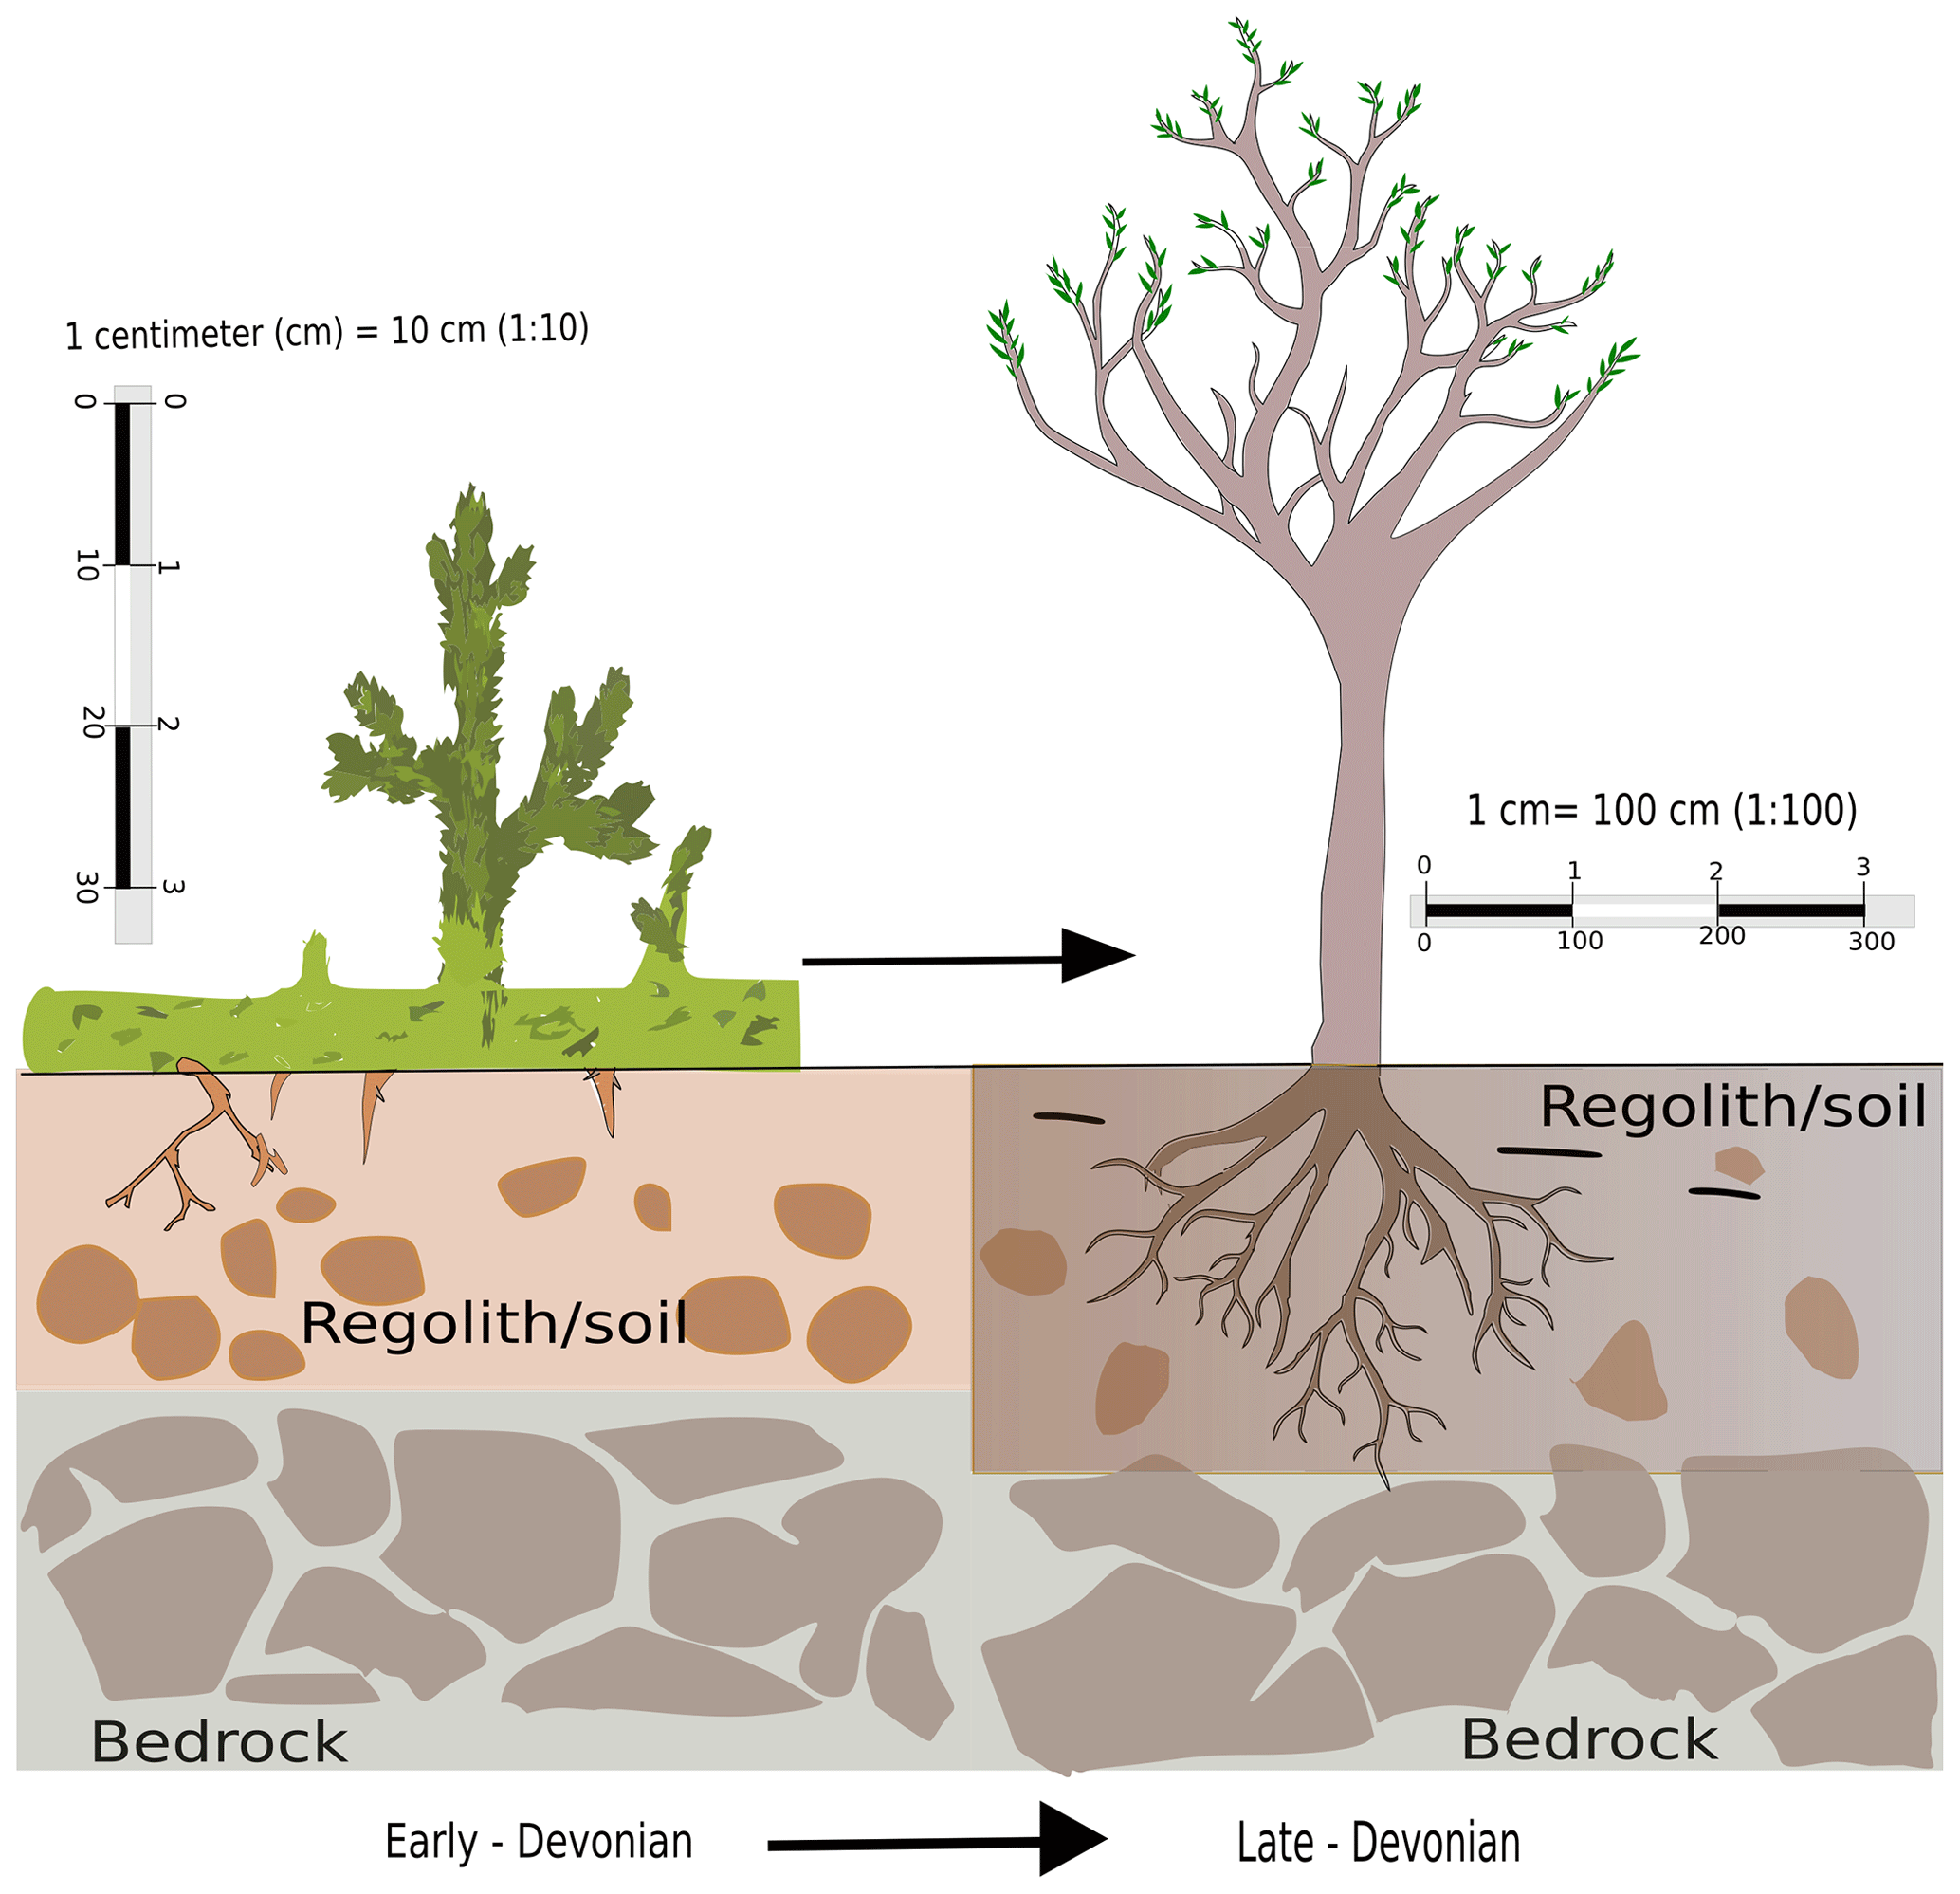
Figure 1A conceptual diagram of evolution of roots from its earliest stage in the Silurian Period to a sophisticated form during the Devonian.
Roots provided the lycopsids with a key interface for interaction with the terrestrial environment for their nutrient and water supply, as they could utilize the underground reserves which had remained previously untouched. Roots provided an anchorage, which may have been a precondition for the development of the first trees. This effect also increased soil stability, and hence it potentially reduced the erosion rate (Vannoppen et al., 2017). Roots influenced hydrological processes through transpiration due to the evolution of deep roots, which accessed groundwater that would otherwise remain shielded from uptake and/or subject to loss through evapotranspiration from plants according to atmospheric and physiological demand. This potentially could have enhanced weathering (Lee and Boyce, 2010). The other notable consequence of root development is believed to be an enhancement of chemical weathering (Algeo and Scheckler, 1998, 2010), which could have had strong impacts on atmospheric CO2 content and the global carbon budget (Le Hir et al., 2011).
In general, the weathering regime is often influenced by several factors and plants, and the associated microorganisms have been suggested to have had a substantial impact on weathering, through respiration in the soil, hence increasing the partial pressure of soil CO2 to several-fold greater than the atmospheric CO2 level (Kelly et al., 1998; Montanez, 2013). In addition to plant-derived organic matter respired by these microorganisms, root respiration also adds to soil CO2 content, thus increasing soil acidity and influencing weathering rates (Moulton et al., 2000; Andrews and Schlesinger, 2001; Berner et al., 2003; Ibarra et al., 2019).
Roots were not the only suite of innovations from these kinds of plants: they further developed stomatal control (Kenrick and Strullu-Derrien, 2014; Brodribb and McAdam, 2011) of water loss to be able to photosynthesize under adverse climatic conditions, which might have given lycopsids yet another advantage over their contemporaries. The evolution of stomata followed the innovation of roots closely, at least 420 Ma (Chater et al., 2011; Ruszala et al., 2011). Water loss and NPP are regulated by the opening and closing of stomata (McAdam and Brodribb, 2013). By changing the aperture of the stomata, plants inhibit water loss to prevent desiccation, at the cost of reduced photosynthetic productivity. The combination of adjustable stomata with an internal water transport system, i.e., vascularity, was a turning point in plant evolution that might have enabled vascular plants to invade most terrestrial environments, tolerating water stress and exploiting favorable conditions (Raven, 2002). The development of such traits in lycopsids was gradual and was initially relatively primitive. Brodribb and McAdam (2011) suggested that lycophyte (a broader classification encompassing lycopsids) and fern stomata lacked key responses to abscisic acid and epidermal cell turgor, making stomatal behavior highly predictable. The stomatal regulation of water loss was determined solely by the surrounding environmental conditions due to a poorly developed hydraulic system (Boyce and Lee, 2010), unlike today's plants which have a more complex mechanism driving stomatal control.
Stomatal development primarily impacted and regulated water loss through transpiration, which may have had a significant role in altering the global water cycle, in particular by increasing the land surface area affected by precipitation through the recycling of water vapor (Berner, 1992; Drever, 1994; Ibarra et al., 2019). This may have then indirectly contributed to the alteration of weathering rates via an enhancement of local and global water recycling, as well as increasing the area available for weathering in the interiors of continents (Shukla and Mintz, 1982; Boyce and Lee, 2010, 2017). Moisture recycling likely also increased plant productivity, thus increasing soil CO2 content across continents. Consequently, the presence of land plants increased the quantity of water in continental interiors available for weathering and increased primary productivity, further contributing to an increase in global weathering.
Silicate weathering is considered one of the most significant geochemical regulators of atmospheric CO2 over a long (hundreds of thousands to millions of years) timescale (Berner, 1990). Silicate weathering is primarily mediated by the hydrological cycle (Walker et al., 1981; Bluth and Kump, 1994; Maher, 2011; Maher and Chamberlain, 2014; Green et al., 2017; Ibarra et al., 2019) and it serves as a dominant carbon sink for Earth in the long run (Berner, 1998; Bergman et al., 2004; Gibling et al., 2014). A precondition for weathering reactions is the production of weak carbonic acid from rainwater and soil CO2, which dissociates into bicarbonate (HCO) ions during the dissolution of silicate minerals. The ions subsequently enter streams via runoff and eventually the oceans, where they are used by various organisms to build shells and skeletons. These then serve as a long-term carbon sink after sedimentation. Hence the weathering of silicate rocks corresponds closely to the flux of carbon from the atmosphere into seafloor sediments (Algeo and Scheckler, 1998; Elick et al., 1998).
This silicate weathering feedback might have been significantly influenced over various periods of Earth's history following the further evolution of plants and the development of roots and stomata. The increased soil carbon pool had the potential to promote the dissolution of silicate minerals (Walker et al., 1981). The study of Matsunaga and Tomescu (2016) demonstrates substantial plant–substrate interaction that was already underway in the Devonian, causing weathering by root penetration (Algeo and Scheckler, 1998), and thereby confirming the significance of such an advent of vascular vegetation. Further studies have already claimed an enhancement of chemical weathering by vascular plants to have exceeded six fold as compared to their earlier counterpart, i.e., non-vascular vegetation (Cochran and Berner, 1993), along with improved pedogenesis (Quirk et al., 2015).
Although lycopsids were abundant in the Upper and Middle Devonian, these plants thrived even in the Lower Devonian, but their effects on weathering rates remain unclear. Detailed information on physiology, productivity, spatial distribution, and hydrological properties of these early plants, which is crucial to determine their effects on weathering rates in the root zone, is lacking. This makes it difficult to estimate the impacts of early lycopsids on the climate of the past. Lycopsids today are primarily represented by Lycopodiaceae (club mosses), Selaginellaceae (spike mosses), and Isoetaceae (quillworts) and are typically found as undergrowth beneath the forest canopy (Spencer et al., 2021). They are morphologically quite different from those of the past. Also, fossil records and proxy studies, which provide key information on morphological properties of early lycopsids and their approximate geographical distribution, are usually not sufficient to derive the extent of biogeochemical impacts of early vegetation in a quantitative way. It is thus necessary to develop an approach that can estimate vegetation properties for the late Silurian–Lower Devonian, based on available information, such as climate reconstructions and known physiological mechanisms.
Here, we introduce a process-based model, called LYCOm, which simulates lycopsid properties and is able to simulate diverse extinct plant communities based on given climatic conditions. This is complemented by a simple limit-based weathering model (Arens and Kleidon, 2011), which is utilized to determine the biotic enhancement of weathering by these plants. We test if the model can predict realistic lycopsid properties for a range of prescribed current climatic conditions, and assess whether the organisms have a significant impact on weathering rates. The current study focuses on the impacts of roots and stomata of Lycopsida on hydrological processes and the weathering of rocks of today, as a first step towards a more quantitative understanding of the impacts of early vascular vegetation on global biogeochemical cycles and climate of the past.
2.1 Lycopsid model (LYCOm)
The process-based vegetation model used in the current study aims at a general representation of lycopsids in order to estimate the productivity and physiological properties of these organisms under a broad climatic range. LYCOm follows other dynamic global vegetation models (DGVMs) closely regarding the representation of plant properties and functioning (Randerson et al., 2009). Vegetation is represented as a set of carbon pools, namely below and above ground, corresponding to roots and shoots with leaves. The balance of these pools depends on NPP, which is simulated as a function of climate forcing.
The current version of LYCOm differs from other vegetation models in some aspects. Stomatal conductance, for instance, is described as a function of soil water content and potential evaporation, instead of using the vapor pressure deficit (VPD) as the controlling factor for the calculation of photosynthesis (Sellers et al., 1996; Lawson et al., 2010). The use of VPD fails to accurately capture the fact that a plant’s stomata may also react to water loss due to transpiration into saturated air, which is warmed up by radiation and thus may take up water while staying close to saturation during this process. Hence, VPD does not capture the possibility of plants' water stress due to transpiration of water into saturated air (at low VPD), which is driven by the energy balance, or water stress due to low soil moisture. Hence, efficient handling of a broader range of environmental conditions is possible. Since we ultimately want to apply LYCOm to the Devonian Period, we prefer a general approach that considers all relevant factors affecting stomatal conductance over a specific parameterization, which may be more accurate for the present day, but might not hold for the geological past.
Another difference between LYCOm and other DGVMs is the representation of leaves and stems. To account for the accurate morphology of lycopsids, the aboveground biomass is distributed in the form of inclined cylinders, representing the stems, with small-sized leaves attached to the sides (see Fig. 2) instead of the detailed and complicated branching structure occurring in most plants. The vertical distribution of roots simulated in LYCOm is similar to other DGVMs with an exponential decrease in biomass distribution with depth.
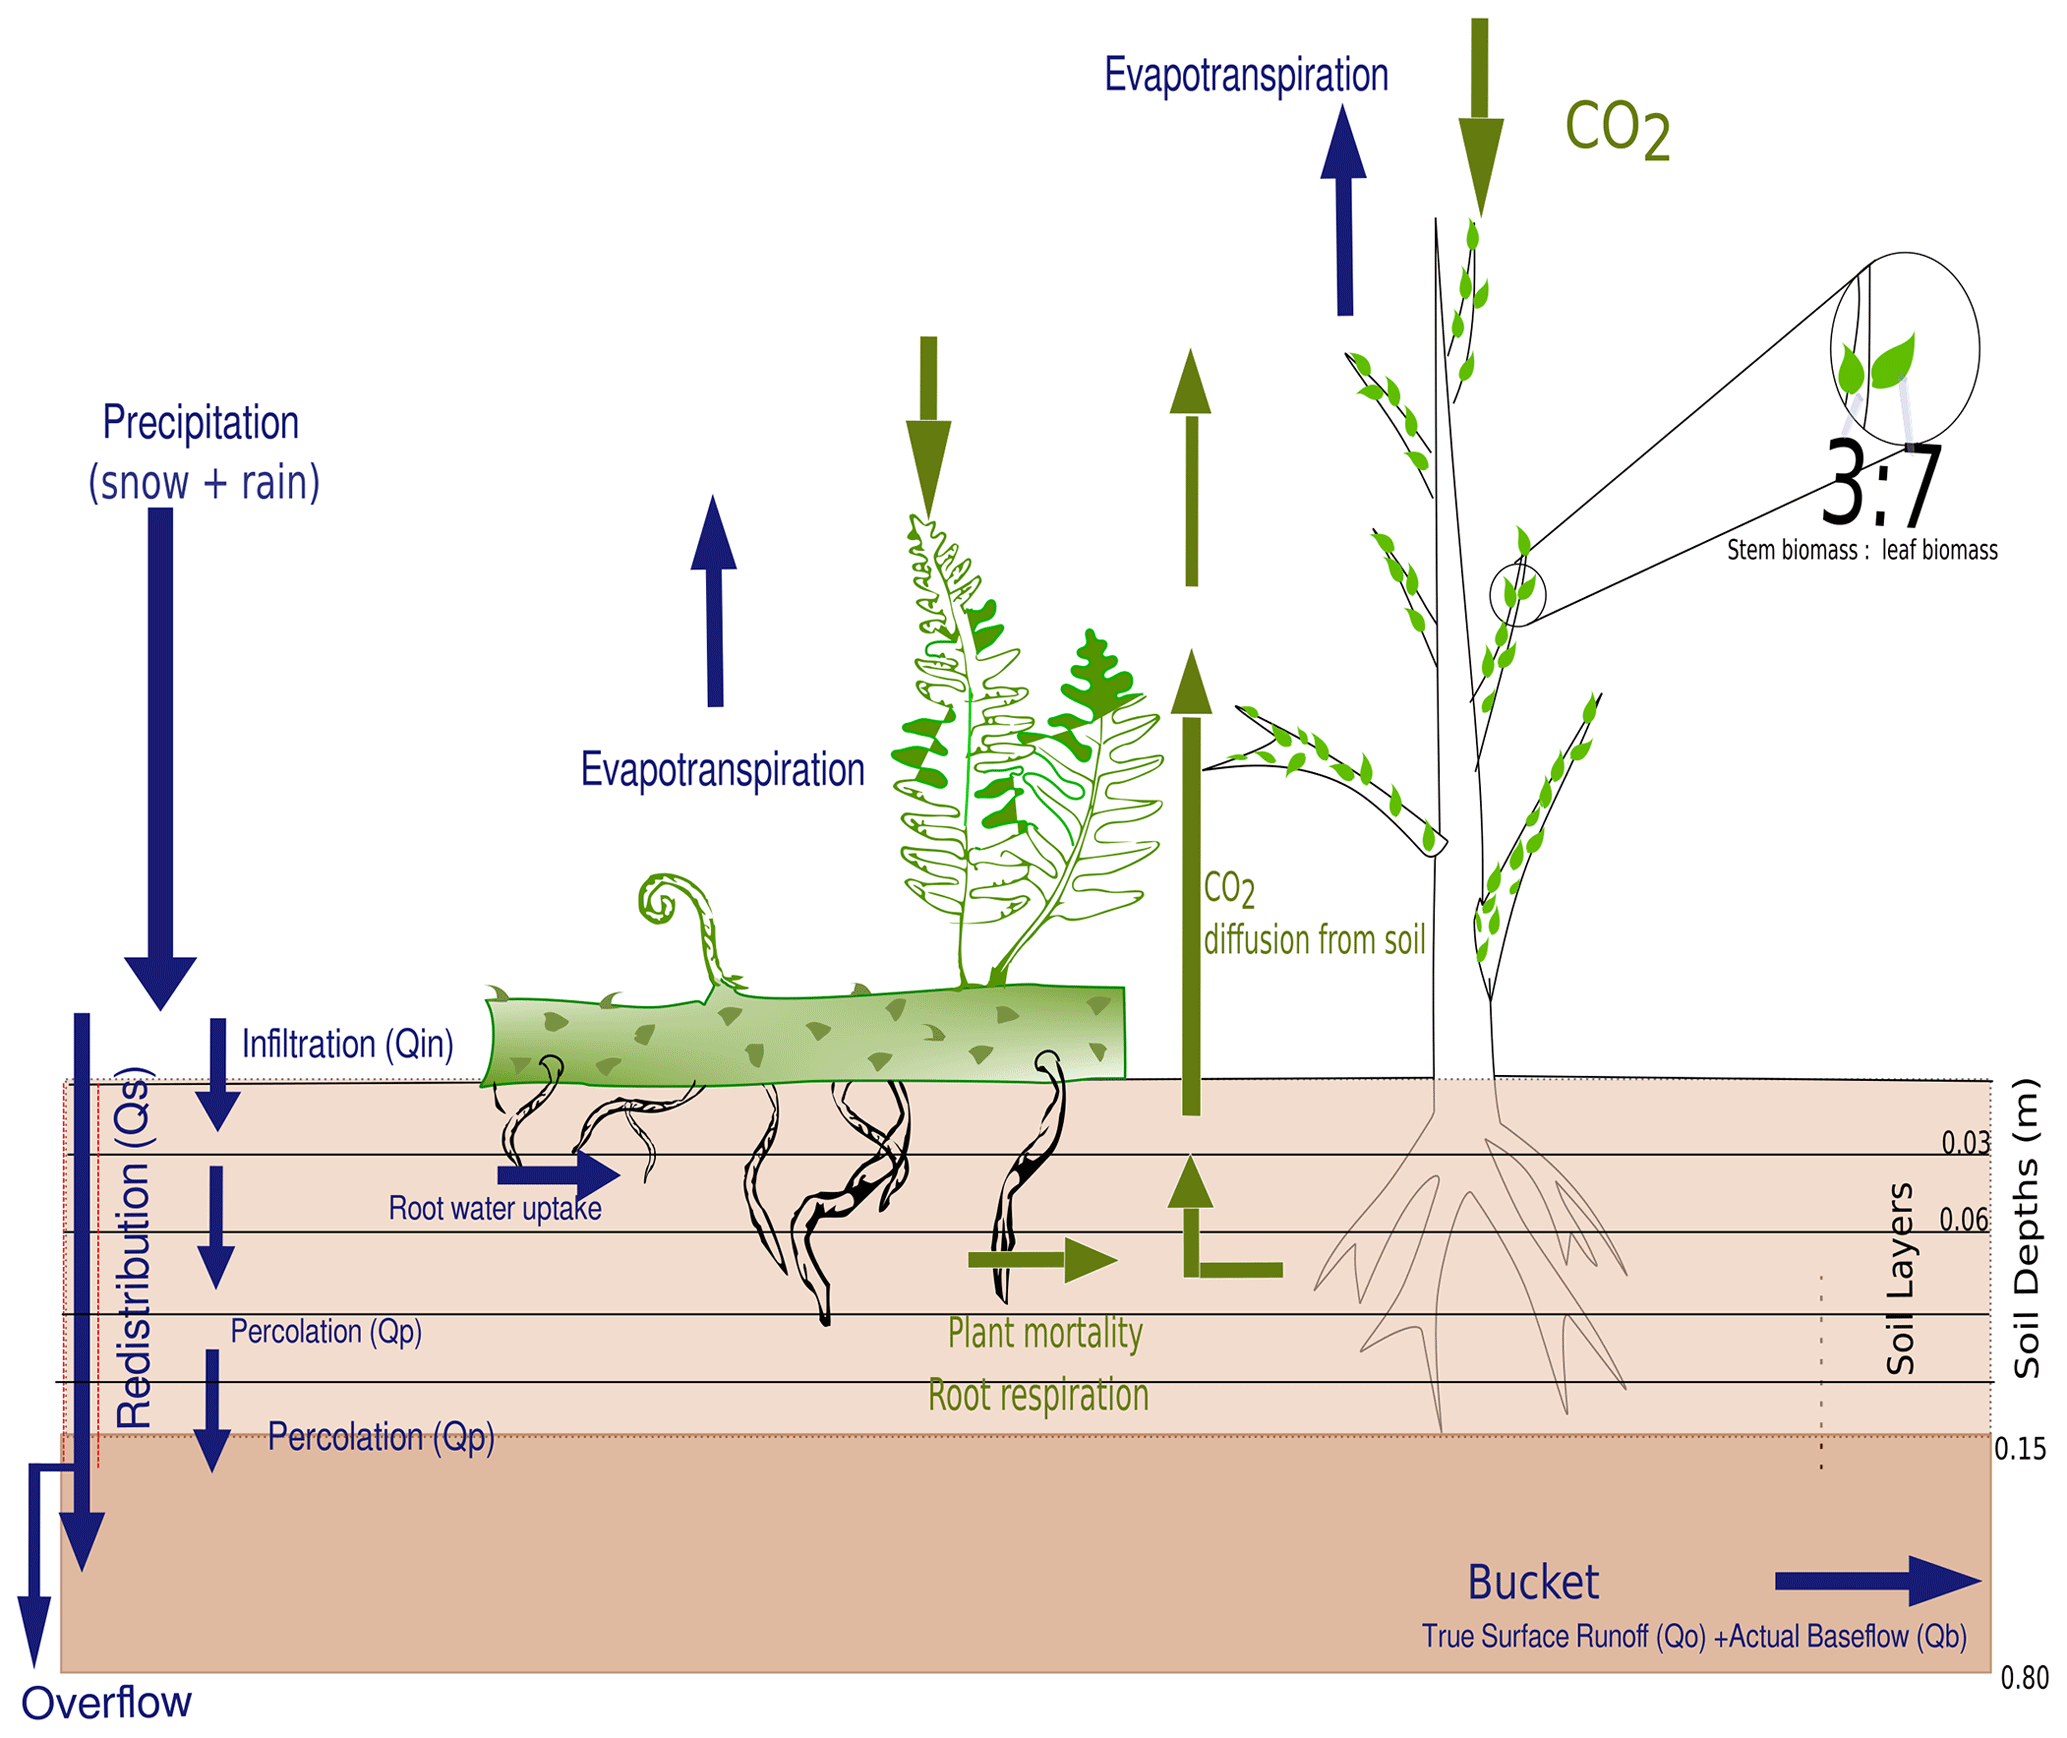
Figure 2The root profile and general soil scheme comprising the five layers of top soil up to 15 cm, followed by a bucket extending up to 0.65 m, are represented along with the hydrological profile and carbon pathways.
In contrast to most global vegetation models, which use plant functional types, LYCOm explicitly represents physiological variation concerning several key characteristics of plants. This means that the ranges of observed physiological parameters derived from the literature are sampled by a Monte Carlo algorithm to generate hypothetical “species”, which will be referred to as strategies in the article. These do not correspond directly to any particular lycopsids in the real world but instead represent the diversity of physiological strategies for lycopsids.
In this way, the response of a plant community of unknown composition with regard to a large range of environmental conditions can be simulated, and the effects of the adapted community on biogeochemical processes can be estimated. This modeling approach is more flexible compared to simulating a low number of “average” functional types with fixed properties, and it has already been successfully implemented in JeDi-DGVM (Pavlick et al., 2013), and was further developed in LiBry-DGVM for lichens and bryophytes (Porada et al., 2013). LYCOm is based in parts on the LiBry model. Another advantage of explicitly simulating diversity is the possibility of representing extinct species in the model, for which direct current analogs are lacking. The LiBry model, for instance, has already been applied to simulate the biogeochemical effects of early non-vascular vegetation in the Ordovician Period (Porada et al., 2016).
Variation in the physiological features of different lycopsid strategies in LYCOm results in differences regarding their carbon balance. To acquire new carbon, lycopsids have to invest their carbon resources into structures for carbon uptake. Since carbon can be allocated to different parts of the plant (leaves, roots), this represents a trade-off. The various strategies simulated by the model differ in their carbon allocation and are thus adapted to different climatic conditions. Hence, through analyzing the relative performance of each strategy, we can identify the key ecophysiological properties which determine the distribution of lycopsids under any given recent or past climate.
2.2 Model description
To determine both the spatial distribution of lycopsids and their impacts on weathering rates, it is necessary to quantify the carbon balance of the organisms and their dependence on climatic conditions. LYCOm includes three carbon pools for lycopsids: belowground (root) biomass and aboveground biomass, which is subdivided into a pool for leaves and another for stems. Gains in biomass result from NPP, while losses are due to mortality, which includes both aboveground litterfall and root turnover. NPP is calculated as the difference between photosynthesis and respiration (partitioned into leaf and root respiration), which are computed in LYCOm as functions of environmental climatic conditions, such as available water, light, and temperature. Thereby, root water uptake and subsequent transpiration through leaves connect the carbon to the water balance in the model. In the following sections, we describe the various equations aimed to describe biochemical and physical processes in LYCOm.
2.2.1 Soil scheme and hydrology
To simulate the water balance at the land surface and its connection to vegetation processes, we developed a hybrid soil scheme, consisting of a root zone, which is subdivided into five layers, and a “bucket” below the root zone. The layers have a thickness of 3 cm each and the bucket has a depth of 65 cm, resulting in a total depth of 0.8 m. This scheme aims to take into account the effects of the vertical distribution of soil water on the success of simulated strategies of class Lycopsida that differ in their root profiles. Since extant lycopsids, however, can only reach a maximum rooting depth of approximately 15 cm (Matsunaga and Tomescu, 2016), we resolve the soil water profile and its effects on the root profile up to this depth (Fig. 2). The inclusion of a bucket as water storage below the layers is necessary to simulate a realistic overall partitioning of rainfall at the land surface into evapotranspiration and runoff, i.e., avoid overestimation of runoff due to frequent saturation of the soil.
Rainfall serves as the primary water source for the soil and enters the first layer of the root zone. From there, water percolates down into the next layer, as a function of the relative water content of the respective layer, limited to the actual amount of water contained in the layer (Eqs. 1–3). This sequence is repeated until the bucket is reached. In each layer, surplus water, which results from the exceeded water storage capacity of a layer, directly enters the bucket. This is justified by the spatial resolution of the model, which is designed to ultimately run at the regional or global scale. If the surface soil is saturated locally, overflowing water usually infiltrates the surrounding soil, and does not immediately contribute to surface runoff. Only in the case the soil is saturated at a large scale, which corresponds to the bucket being near saturation, is surface runoff generated in the model, which then contributes to total runoff.
Here, Qin = incoming water into layers (rain + snow melt − interception by surrounding vegetation (for first layer)), pdt = time step, Qp = percolation (which becomes the Qin for the following layer), QP0 = ( [m s−1]) Percolation under water saturated condition, S = relative water saturation level of the layer, Wu = updated layer water content, and WO = initial layer water content.
In addition to infiltration and percolation, root water uptake changes the water content of the layered soil in the model. Root water uptake is calculated for each layer as a function of potential evapotranspiration (Monteith, 1981), which is then modified depending on the share of the root biomass contained in the respective layer on the total root biomass (Eq. 4). Additionally, root uptake is limited to the available water in each layer.
Here, QR = root uptake from layer, QRpot = potential evapotranspiration [m s−1], Br = layer biomass content, total root biomass, and Wu = water content of layer.
Here, Qb = base flow, Qb0 = base runoff rate [m s−1], S2 = average saturation of the bucket soil part, and Wx = water content of bucket.
The water balance of the bucket is then calculated according to the following equation:
where Wx = updated bucket water content, WIx = initial bucket water content, Qp = percolation from upper layers, Qs = overflow from top layer, Qb = actual base flow, and Qo = large-scale runoff comprising the excess water from the saturated bucket.
2.2.2 Stomatal conductance
In LYCOm, stomatal conductance depends on two main factors: firstly, it is controlled by the evapotranspiration ratio (ETratio), which means the ratio of the potential evapotranspiration at a given time of the day and the average potential evapotranspiration for the overall timeframe (Eq. 8). Through the ETratio (Eq. 7), a normalized estimate of the atmospheric water demand (and, thus, potential water stress) is defined, which is independent of empirical parameters and considers both the VPD and net radiation as drivers of evaporation. The motivation for this approach is the potential dependence of empirical parameterizations on recent climatic conditions and also on physiological properties of the current vegetation community, which is likely adapted to the climate. Consequently, when applied to the geological past, these parameterizations may no longer be valid. Our approach is flexible enough to be applied to paleo-climatic scenarios. This thereby depends on the assumption that the plant community has adapted to the prevailing average conditions, and thus using our normalized measure for atmospheric water demand will lead to a realistic response of stomatal conductance to short-term variations in the climate forcing.
The average atmospheric evaporation demand for the full time span of the run is determined in the pre-processing. The run-time atmospheric demand is then evaluated using the following (Eq. 7):
where ETratio = relative atmospheric demand for the particular run-time, ETdata = run-time atmospheric water demand, and ETdavg = average atmospheric water demand for the whole runtime.
The stomatal conductance is then computed as follows:
where gs0 = maximum stomatal conductance (varies between maximum derived from Soni et al. (2012) and minimum derived from (Tosens et al., 2016); 20 % more than the actual value stipulated for Pteridium aquilinum), ETratio = potential evapotranspiration at the given time step / average evapotranspiration, pgs1 = shape parameter (1000 used here), ETrmax = maximum ETratio for the entire simulation, and gsleaf = stomatal conductance due to atmospheric demand.
Secondly, stomatal conductance is limited by maximum conductance (dependent on species) and soil water availability in our model. To this end, the conductivity for water flow at the soil root interface is computed, which is proportional to the soil water content (Eq. 10). The realized stomatal conductance is then limited to root conductance. In this way, also the impacts of soil water stress on stomatal conductance can be taken into account, in addition to the atmospheric drivers.
Here, gsroot = stomatal conductance determined by average layer water content, gsfinal = stomatal conductance limited both by soil water availability and atmospheric demand, and S1 = average saturation of the layered soil part.
2.2.3 Above- and belowground biomass
In LYCOm, plant growth corresponds to NPP, which is based on the simulated net photosynthesis averaged over 1 month. Thereby, net photosynthesis is computed as gross photosynthesis minus respiration according to Farquhar and Von Caemmerer (1982).
Here, fGPP,L = light-limited gross primary production, = carbon dioxide-limited gross primary production, vcm = maximum specific carboxylation rate, J = actual rate of electron transport, CO2 = CO2 concentration in the chloroplast, O2 = oxygen concentration in the chloroplast, P = CO2 compensation point, and Kc, Ko = Michaelis–Menten constants of carboxylation and oxygenation reactions.
Gross photosynthesis is simulated as the minimum of a light-limited and a CO2-limited rate. The light-limited rate is an increasing function of the absorption of light and is constrained by the maximum rate of the electron flux (Jmax). The CO2-limited rate is an increasing function of the CO2 concentration in the chloroplasts and saturates at high values of CO2 concentration, the maximum rate being VCmax. The detailed formulation can be found in Porada et al. (2013).
Here, GPP = gross primary production.
Photosynthesis peaks around an optimum surface temperature estimated for the individual strategies (June et al., 2004), and the estimation of respiration is done using a common empirical temperature response framework with respect to Q10 (Eq. 15) (Vanderwel et al., 2015). GPP and NPP are calculated as follows:
where NPP = net primary production, R = Respiration, R0 = Reference respiration rate at 10 ∘C (Tosens et al., 2016; Soni et al., 2012; Carriquí et al., 2019), Q10 = Q10 value of respiration (Atkin et al., 2005; Proctor, 2014), T = temperature on the surface of the plant, Topt = optimum temperature.
The pore space CO2 concentration inside the leaves is a function of the stomatal conductance which is in turn controlled by the water availability in the soil (Eq. 10). Thereafter, we considered a steady-state assumption of pore space CO2 between diffusion and net photosynthesis which is in turn dependent on respiration. This drives the light- and CO2-limited Farquhar and Von Caemmerer (1982) assimilation model of photosynthesis. The rest of the scheme is analogous to the LiBry model (Porada et al., 2013).
Plant growth is often limited by water availability, which causes the organisms to invest carbon from NPP into root structures to increase access to soil water. Since plant growth is also limited by light, carbon needs to be invested into stems and leaves, too. This leads to a trade-off regarding the allocation of the assimilated carbon to either above- or belowground biomass. To address this key physiological trade-off, LYCOm includes a flexible allocation scheme that is adaptive to the prevailing atmospheric conditions, i.e., whether the plant photosynthesizes under light-limited or CO2-limited (i.e., water-limited) conditions. The light-limited photosynthesis enhances the allocation of NPP into shoots and leaves while the CO2 limitation leads to the accumulation of root biomass (Eqs. 16, 17 and 18). The distribution and amount of root biomass and aboveground biomass are key to the quantitative estimation of impacts of vegetation on multiple biogeochemical processes, such as microbial respiration of soil organic matter being closely linked to chemical weathering.
Equations (16) and (17) determine the amount of assimilated carbon (NPP) assigned to root biomass with depth depending on the relative amount of limiting factors for photosynthesis. The available root biomass Broot is then distributed layer-wise ( in Eq. 18), with decreasing fractions at increasing depth, which is determined by the fracR0 factor (Fan et al., 2016). This ensures a decreasing cumulative root distribution profile with depth.
Here, NPP = net primary productivity and fracL = fraction of time where light limitation dominates during photosynthesis. In this case, we allocate more biomass into leaves in order to capture more light for photosynthesis. fracR0 = shape constant (0.25) for an exponential decrease of root biomass allocation with depth and Broot = available root biomass that is still available for allocation in this layer.
Here, = root biomass of the layer i, IB = Root biomass contained in the ith layer, = root biomass available, and Mortalityi = a term based on baseline mortality and the biomass allocation in soil layers.
The assigning of root biomass to litterfall (Eq. 19) is an important aspect to focus on as it determines the silicate weathering in the soil. When the soil layer reaches its maximum root biomass holding capacity, the excess is directly assigned to litterfall (Eq. 19). This adds to the mortality calculated in Eq. (18), which is in turn utilized to determine the soil carbon pool and later the weathering regime.
LYCOm considers the root respiration as well, which potentially could further affect the soil CO2 content (Eq. 20). Root respiration (Eq. 20) is basically comprised of root maintenance respiration, which is used for keeping roots alive, root growth respiration for growing new roots as well as new root tissues, along with microbial respiration.
RtoM = root to direct litterfall, = root biomass of layer, and Brmaxi = maximum layer root biomass.
Here, Rresp = root respiration, R0 = respiration determined by strategy-specific parameters, Q10 = Q10 value, T = soil temperature, Topt = optimum temperature, = root biomass of layer, and total root biomass.
Besides roots, the hypothetical plants in the model also consist of shoots and leaves partitioned at a 3:7 ratio, which constitute the total available aboveground biomass, represented as a cylinder to emulate the vertical structure of the given plant strategies, as well as the leaf area index (LAI) calculated in Eq. (22). The leaf-to-shoot ratio is analogous to the horizontal to vertical biomass ratio value derived from Zier et al. (2015). Lycopsids exhibit root-bearing axes and true roots, leafy shoot axes, along with scale-like leaves called microphylls covering the aboveground part of the plant (Hetherington et al., 2021). In contrast to trees or shrubs, the scale-like nature of leaves is hard to distinguish from the stem in the model and hence we assume that photosynthesizing parts of the plant in the model comprise approximately 70 % of the aboveground biomass.
This is a distinct feature of the model which departs from the traditional simple LAI approach while representing the aboveground share of biomass.
The leaf biomass (Eq. 21) is used thereafter to estimate the LAI which is computed using Eq. (22).
Here, Bl = leaf biomass, Bli = initial leaf biomass, and Mortalityshoot = a term based on baseline mortality and the biomass production and allocation into aboveground biomass.
Total leaf area = Aleaf ⋅ (BlDrw), Aleaf = leaf area using measurements from Valdespino (2015a) and Drw = dry leaf weight as measured in Leopold et al. (1981), GrA = ground area.
The projection of the ground area covered by plants used for the calculation of the LAI in the model assumes a random value ranging from 30 to 50 cm2. The range is close to the reconstruction of Zosterophyllum shengfengense (Hao et al., 2010) but we assume a maximum coverage of a lateral area equivalent of a square of 70 mm edge.
2.2.4 Weathering and soil carbon dioxide
To estimate chemical weathering rates and their biotic enhancement, we apply a simple limit-based approach (Arens and Kleidon, 2011), which has been used in other studies to quantify large-scale weathering, both for the current climate and also for the geological past (Porada et al., 2016). This approach assumes that chemical weathering can be derived from the minimum of a supply-limited rate, which corresponds to the provision of primary minerals into the dynamic soil profile via uplift, and a transport-limited rate, which describes the removal of dissolved weathering products from the soil via runoff, named the eco-hydrological limit. Without runoff, the soil solution would remain in a state of chemical saturation, and the weathering reactions would stop. Consequently, the chemical weathering rate cannot exceed the rate of weathering products exported via runoff. Furthermore, the rate of chemical weathering cannot exceed the rate of exposure of unweathered rock material at the surface, which is equal in the steady state to the erosion rate (see Table 3).
While the supply limit is not affected by biotic processes, unless the impact of vegetation on erosion and uplift are considered, the transport limit may be altered through the effect of CO2 in the soil solution on the equilibrium concentration of weathering products, and also through the effects of vegetation on runoff. The erosion is simply a function of the elevation of the sites (see Table 2), which is derived from the database of the National Center for Atmospheric Research called “TerrainBase” (TBASE).
Plants affect soil CO2 mainly via two processes: firstly, they directly release CO2 into the soil as a result of root respiration, and, secondly, they enhance microbial respiration due to the decomposition of plant biomass originating from root turnover and litter input into the soil. In LYCOm, we assume a steady state between the incoming soil CO2 via mortality (Eqs. 16–18) and root respiration (Eq. 19), and the outgassing of the CO2 from the soil. The overall carbon going into the soil as litter is subject to diffusion, and this is the primary carbon pool responsible for facilitating weathering. Subsequently, the concentration of CO2 in the soil can be determined from the known atmospheric CO2 concentration and a soil diffusivity equation (Jabro et al., 2012) as shown in Eq. (23).
Here, Br = root turnover and litter input to the soil, Dc = , T=0.66 (tortuosity constant), D0=0.05, ϵ = air-filled soil porosity, hmon = hours in month, CO = soil carbon dioxide concentration from the previous time step, pa = 0.51 (L g−1), CO2 = atmospheric CO2 content, and Sd = maximum root depth.
2.3 Physiological strategies
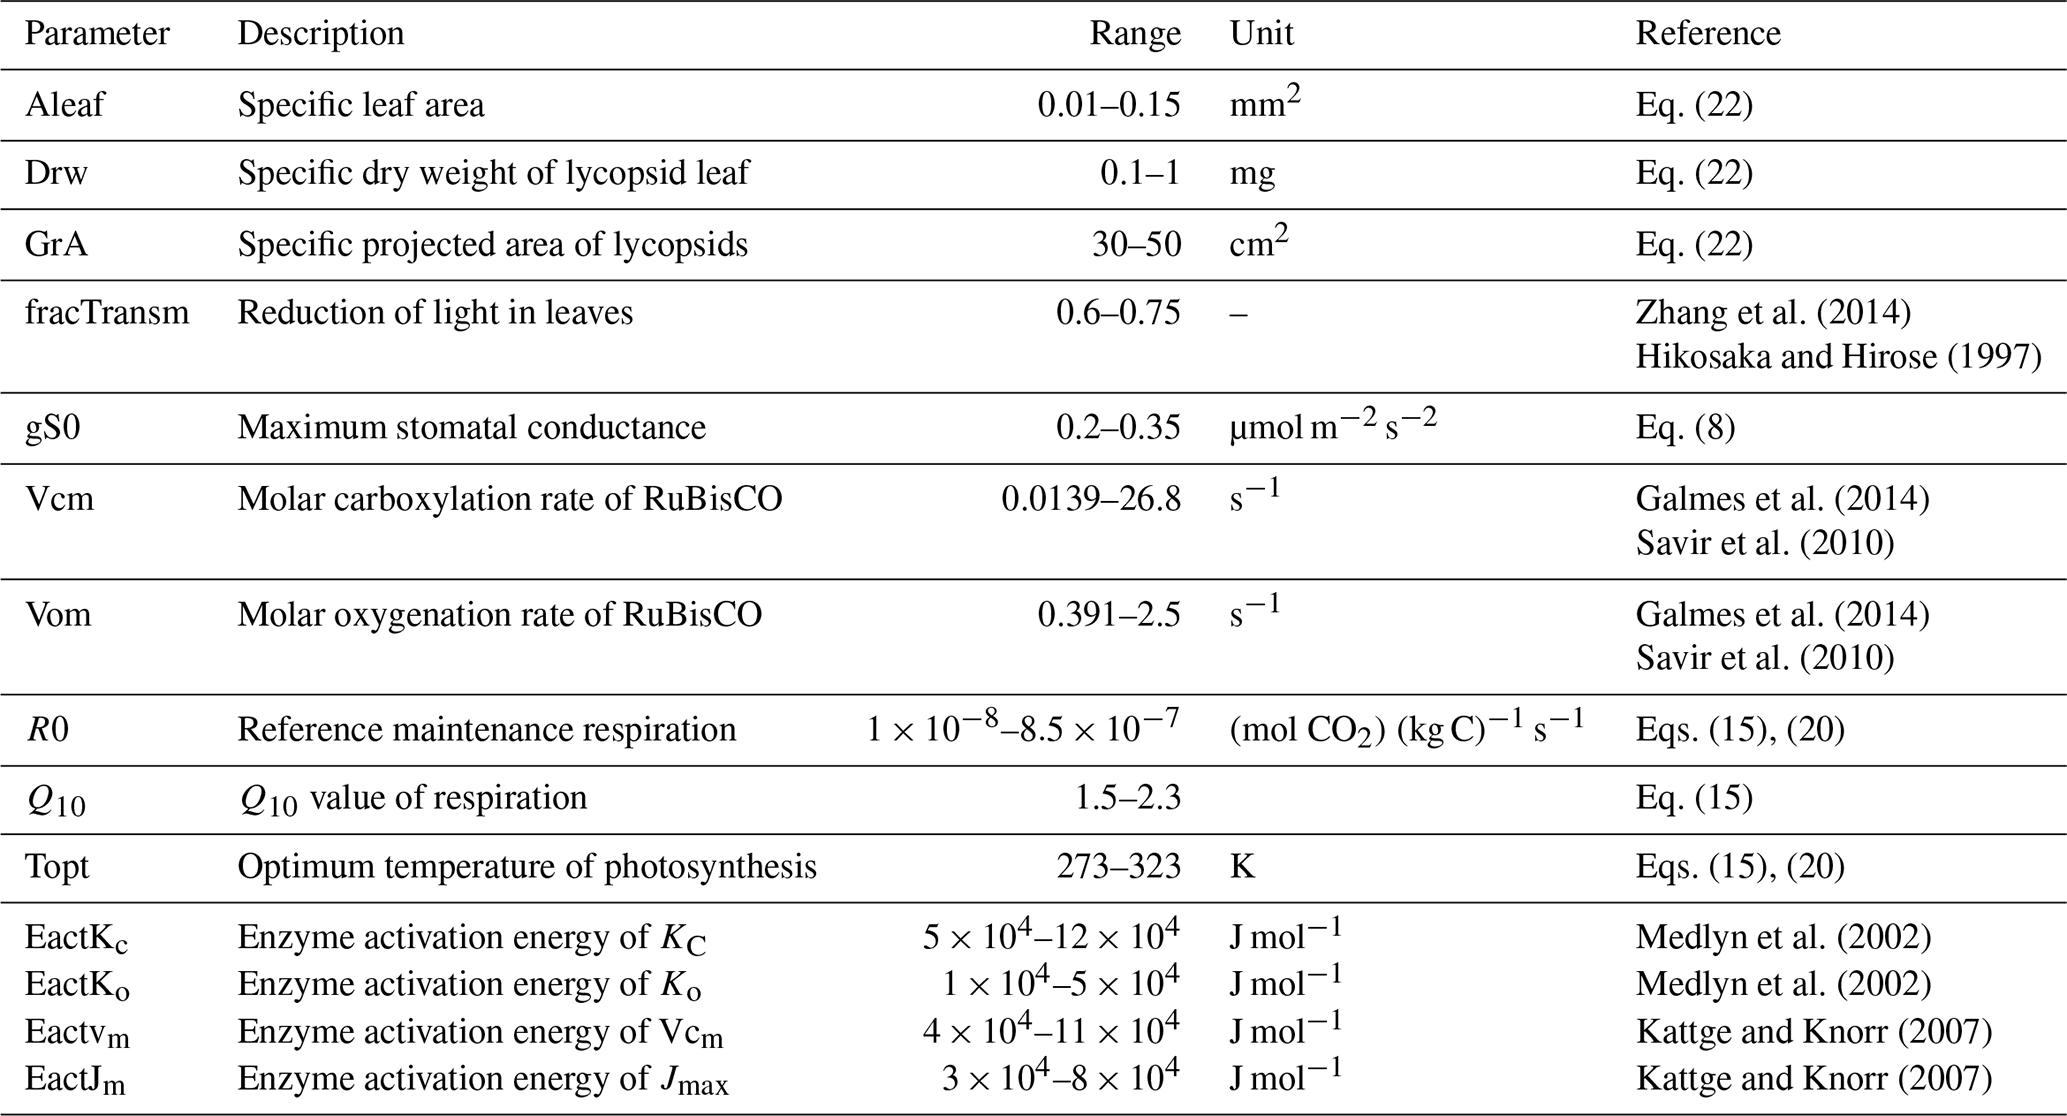
The variation of physiological properties in the model is summarized in Table 1. Some photosynthetic parameters such as the stomatal conductance responsible for the diffusion of atmospheric CO2 into the leaves is limited as shown in the aforementioned table. The upper limit of the optimal temperature is limited to between 0 and 50 ∘C along with a restricted Q10 value between 1.5 and 2.3. The RuBisCO kinetic limits are adjusted from Galmes et al. (2014). This is done keeping in mind that the current model serves as a basis for paleoclimate (Devonian) simulations when the lycopsids were abundant and the mean surface temperature was comparatively higher than today (Song et al., 2019). Furthermore, the physical realism of the lycopsid is asserted by constraining certain parameter ranges such as the leaf area (Valdespino, 2015b) or the dry weight of leaves (Leopold et al., 1981) based on literature that includes various taxonomic details of lycopsids. The rest of the scheme is analogous to the model described in Porada et al. (2013).
Zhang et al. (2014)Hikosaka and Hirose (1997)Galmes et al. (2014)Savir et al. (2010)Galmes et al. (2014)Savir et al. (2010)Medlyn et al. (2002)Medlyn et al. (2002)Kattge and Knorr (2007)Kattge and Knorr (2007)Table 1Parameters used to define the lycopsid-specific model.
2.4 Weighting scheme
The weighting scheme used to calculate the resulting productivity depends on the allocation of root and aboveground biomass (Eqs. 24, 25, 26). To obtain a representative value, we scale the productivity of all surviving strategies by their weights. This yields an averaged representative NPP (Table 4) and soil CO2, which would be difficult once the dominant species is solely chosen for the purpose. To eliminate overestimation, we consider the root as well as leaf biomass for the weighing scheme. In Table A1 a comparative chart of the productivity by weighted mean, mean, and that of the dominant species is summarized.
Here, NPPji = monthly mean NPP of species i, Wi = weight calculated for species i, NPPj = monthly NPP averaged over 30 years, Mi = root biomass accumulated over 30 simulation years for species i, = mean root biomass for all surviving species, LAIi = leaf area index at the last time step for species i, and = mean leaf area index of the surviving species at the final time step.
The performance of LYCOm is assessed using gas exchange measurements of photosynthesis by lycopsids under varying ambient conditions, such as temperature, carbon dioxide concentration, and photosynthetic photon flux density (PPFD) (Soni et al., 2012). The data used for the purpose is obtained for Selaginella bryopteris (see Fig. 5 dashed lines). This aims to confirm the ability of LYCOm to replicate real species and affirms the realism of our approach. Moreover, certain parameter ranges, for example, the habitable temperature range (Topt in Table 1) of lycopsids, are determined using the data derived from Soni et al. (2012).
3.1 Model setup
We run LYCOm locally for seven locations (listed in Table 2) with 2.8125∘ spatial resolution data for 30 years between 1958 and 1989 with an hourly time step, simulating 100 different physiological strategies one at a time, and evaluate their survival rates. The meteorological forcing data set used for the purpose is derived from WATCH Forcing Data (WFD) by making use of the ERA-Interim reanalysis data (Weedon et al., 2011). In addition, the model setup is initialized with a close-to-present atmospheric composition of CO2 concentration of 400 ppm and oxygen content of 210 000 ppm. The soil porosity is constrained to a relative value of 0.45 with a percolation rate of 0.5 × 10⁻⁷ m s−1 between the layers and an average baseflow of 1.0 × 10⁻⁸ m s−1 from the bucket.
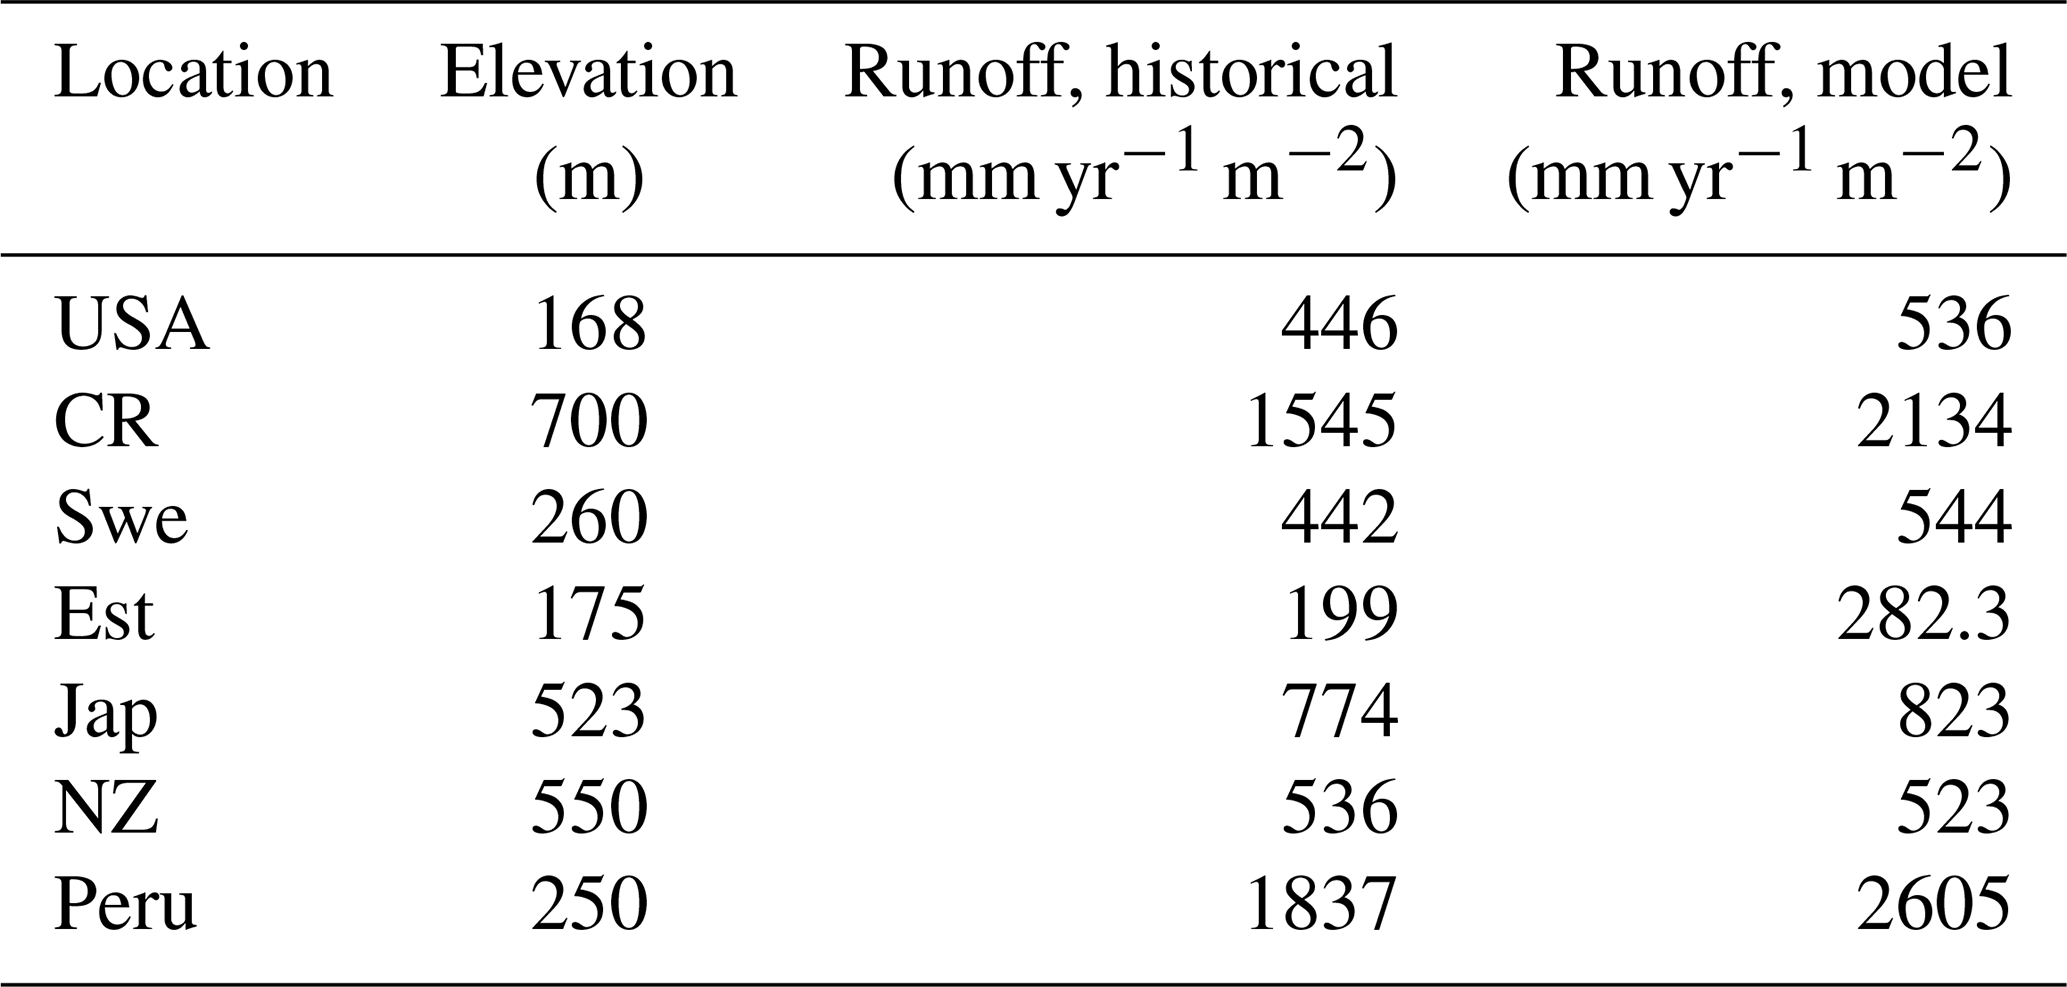
Table 2Various characteristics of the sites where the model is run, including the local relief, and a comparison of the runoffs from the model and historical runoff data between 1958 and 1988.
3.2 Model validation
The chosen study sites encompass various climate zones to assess whether the model can capture the productivity and viability of the local lycopsid communities. The chosen sites are characterized by a high occurrence of lycopsids, as determined based on the Global Biodiversity Information Facility (GBIF, https://www.gbif.org, last access: 10 June 2021).
The study of Ghiggi et al. (2019) provides data that is suitable to evaluate the hydrological cycle achieved via the hybrid soil hydrological scheme in LYCOm.
Although the physiological evolution of lycopsids is well documented, there is a significant lack of literature concerning biochemical properties and the characteristic productivity range of lycopsids under various climate regimes. Hence, our validation of the model is limited. However, the on-site measurements of productivities of Lycopodium annotinum and Lycopodium clavatum in Estonia by Tosens et al. (2016) in May and early June provides an order-of-magnitude estimate in this regard, which improves our ability to evaluate LYCOm. Both Lycopodium annotinum and Lycopodium clavatum have a widespread distribution across several continents today and are the most common species in Estonia (https://www.gbif.org, last access: 10 June 2021). A similar study, by Campany et al. (2019) of Costa Rica, affirms the robust model performance.
3.3 Parameters of LYCOm
As described in Sect. 2, LYCOm represents the physiological diversity of lycopsids via generating multiple strategies, which are closely analogous to thriving lycopsid species, and the intra-specific diversity of lycopsids is accounted for in the physiological processes implemented in the LYCOm model. The distinguishing features of lycopsid strategies are represented by 14 parameters and their corresponding ranges. To generate the lycopsid strategies, these 14 characteristic parameters are assigned through randomly sampling ranges of possible values (Table 1). Assignment of parameter values is performed in two steps: (a) for each strategy, a set of 14 random numbers uniformly distributed between 0 and 1 is sampled. The random numbers are generated by a Latin hypercube algorithm (McKay et al., 2000). (b) These random numbers are used to map values of the parameters from permissible ranges particular to lycopsids derived from the literature. The particulars of the equations utilized in the model are briefly described in Table 1.
The modeled lycopsids cope well at all the sites except in India, where the plants die due to water stress. The aforementioned run is undertaken to incorporate the microclimate of Selaginella bryopteris from where the sample was collected by Soni et al. (2012). The study forms the basis of the light, CO2, and temperature dependence of productivity, for model calibration (Fig. 4). Out of 100 strategies, a maximum of 46 species survive in New Zealand followed by the USA which features 41 surviving strategies. The climate of Sweden suits 24 varieties of the generated species, and in Costa Rica the number is 30. The prevailing weather conditions in Japan and Peru support 32 and 24 strategies, respectively. In India, none of the strategies survive 30 simulation years as shown in Table 2, and Estonia features the least number of surviving strategies at 18.
The measured productivity of Lycopodium clavatum and Lycopodium annotinum in Estonia by Tosens et al. (2016) range from 1.4 to 1.7 µmol CO2 m−2 s−1 for the respective species. The productivity range in LYCOm model varies from 0.5 to 1.23 µmol CO2 m−2 s−1 in May and early June for five dominant species possessing the maximum weights (Eq. 26). The ecophysiological study of Selaginella, an early lineage vascular plant group from a tropical forest understory in Costa Rica (Campany et al., 2019) in June exhibits a range of net photosynthesis from 1.8 to 5.8 µmol CO2 m−2 s−1. The mean productivity of the top 10 strategies (by weights) over the 30-year simulation period for June varies between 1.07 and 2.42 µmol CO2 m−2 s−1 in the model. The higher productivity range in the study results from the prevailing atmospheric temperature, which ranges from 24 to 29 ∘C during the on-site measurement, while in the model the temperature range in June varied from 13 to 25 ∘C between 1958 and 1988 with a mean temperature of 21 ∘C which is significantly lower than the aforementioned study.
In general, the LYCOm simulates high weighted yearly productivity (see Table 4) at the tropical site in Costa Rica of 20.45 mol CO2 m−2 (245.37 g C m−2), followed closely by the area in New Zealand estimating around 14.86 mol CO2 m−2 (178.35 g C m−2), which shows a reverse seasonality compared to other locations (Fig. 4) situated in the Northern Hemisphere. The mainland around the Great Lakes in the USA shows annual productivity of 10.68 mol CO2 m−2 (128 g C m−2) and values in Sweden and Estonia of around 12.22 mol CO2 m−2 (146.7 g C m−2) and 10.5 mol C m−2 (126.03 g C m−2), respectively, which is comparatively low as a result of the local climate that restricts high productivity to the summer and renders poor productivity in other times of the year. Peru, with a higher average year-round temperature, provides a reasonably better climate for lycopsids, resulting in productivity of 14.17 mol CO2 m−2 (170.09 g C m−2) per year.
We averaged the weighted monthly productivity over a 30-year seasonal cycle to obtain an average measure of annual plant growth (Table 4). We use a weighting scheme (see methods) to generate weighted NPP to obtain a mean seasonal cycle over 30 years (Fig. 4). LYCOm can capture the seasonality with the highest productivity over the summer months. The productivity is solely a function of the local climate and is clear from Fig. 4.
The assessment of the net assimilation rate is undertaken to evaluate the model performance, as mentioned in the section on model setup and validation (Sect. 3.2), to verify its capability to reproduce the lycopsid-specific lab measurements with our newly imposed parameter ranges (Table 2). The model performs reasonably, and increased photosynthetic productivity is observed with an increase in photosynthetic photon flux density (PPFD), reaching saturation at 600 µmol m−2 s−1 for all strategies with a steeper slope, as opposed to Soni et al. (2012), where they observed a saturation around 800 µmol m−2 s−1. The temperature response studies in Soni et al. (2012) showed a gradual increase until 40 ∘C and it dropped marginally beyond that, a behavior well captured in our calibration (see Fig. 3) with a slightly lower maximum (around 7 µmol m−2 s−1) in all strategies. Photosynthetic response to carbon dioxide levels in close consistency with that of Selaginella bryopteris for strategy 53, while the rest of the strategies exhibit saturation at higher maxima. We use four strategies to calibrate since the generated strategies are not a direct representation of a single species of lycopsid. This gives a relatively good idea of the model behavior under various conditions for unique strategies.
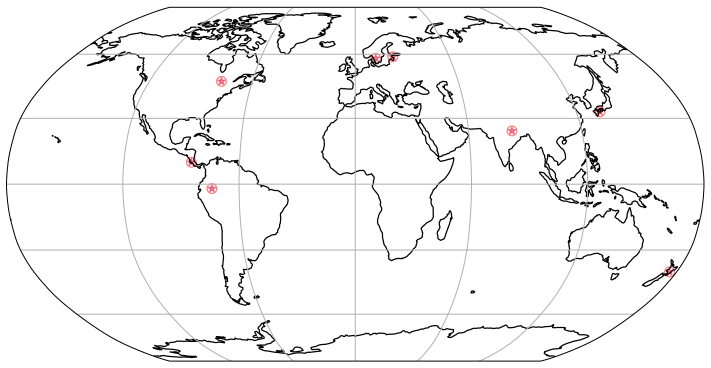
Figure 3The locations used for the simulations are found in the following regions: United States of America (USA) [47∘ N 78∘ W], Costa Rica (CR) [10∘ N, 85∘ W], Sweden (Swe) [58∘ N, 13∘ E], Estonia (Est) [58.75∘ N, 24∘ E], Japan (Jap) [33∘ N, 133∘ E], New Zealand (NZ) [40∘ S, 176∘ E], Peru [2∘ S, 74∘ W].
Runoff is generated in LYCOm when water input by rainfall or snowmelt exceeds the water-storage capacity of the soil, with consideration of water loss via plants according to the climatic demand and stomatal regulation. Hence climate and vegetation are pivotal to the calculation of the runoff of the model. Table 2 confirms the realistic nature of our hydrological approximations and we obtain values of runoff (mean yearly runoff) from LYCOm that are comparable to historical runoff data between 1958 and 1988 (Ghiggi et al., 2019). In general, the model runoff is overestimated when compared with the literature (Ghiggi et al., 2019) except for the location in New Zealand where LYCOm slightly underestimates the annual runoff per unit area (m2). The model renders an average runoff of 2605 mm yr−1 for Peru and 2134 mm yr−1 for Costa Rica, followed by 823 mm yr−1 for Japan (see Table 2). This overestimation can be attributed to the fact that only the layered topsoil is subject to transpirational loss as opposed to the conditions in real forests or vegetated regions since the roots of modern plants penetrate deeper into the soil. The loss by transpiration is several times higher than we capture in the current model, which simulates only one kind of vegetation, i.e., lycopsids. In addition, the soil water saturation determines the amount of CO2 diffusing out of the soil. The water in the soil acts as an inhibitor to the diffusion of CO2 through pathways of available pore space. The more the soil saturates, the lower the CO2 emissions. The concentration of soil CO2 (see Fig. 4) is thus coherently linked with the rainy season and productivity (monthly productivity shown in Fig. 4). This effect is prominent in some locations, namely, in Costa Rica, when both the productive season and most rainfall coincide, leading to a high content of soil CO2 in June. The effect of both productivity and rainfall on carbon content in soil can be seen in some cases as well, such as in Sweden and Estonia, where the most productive months for lycopsids are May and June but soil CO2 peaks slightly in August in the rainy months.
The resulting soil CO2 concentration after diffusion forms the basis of the weathering estimate in the post-processing of the model.

Figure 4Annual cycle of weighted NPP (solid lines) and carbon dioxide concentration (dashed) in the soil.
Soil CO2 (see Table 4) concentration, which is primarily a function of productivity and soil water saturation, is seen to reach the maximum level in Costa Rica on a yearly average scale of 77 330 ppm over the 30 simulation years, followed closely by the location in Peru, where the average carbon dioxide content in soil is averaged at 53 640 ppm on a yearly scale (Table 4). Even though the seasonality of the soil CO2 shows a close relationship with productivity (Fig. 4) on a seasonal scale, we identify a broad range of soil CO2 values over the study sites, with the overall minimum at the study site in the USA, where NPP is low as well. The values in Table 4 are the yearly aggregation of the weighted monthly soil carbon dioxide content over 30 years. Figure 4 shows the monthly fluctuating nature of the monthly soil CO2 content in the soil averaged over the full period of simulation (in ppm).
The supply-limited calculation of weathering rates (Arens and Kleidon, 2011) is a unique approach, where chemical weathering of silicate minerals in the soil is limited either by erosion rate or by runoff, the latter being the “eco-hydrological limit”. Furthermore, LYCOm accounts for the effect of soil CO2 on the maximum saturation state of the soil solution (see Sect. 2.2.4). At the respective sites, the chemical weathering is evaluated using the soil CO2 and runoff from LYCOm along with erosion. The eco-hydrological limits play a crucial role in determining the chemical weathering rates at all sites except for Peru and Costa Rica, where the weathering is limited by erosion. Areas with shallow relief structures show consequently low erosion, such as lowland Peru, where weathering by lycopsids becomes limited by a layer of highly weathered material blocking access to the unweathered rock substrate. We represent this potential limitation of chemical weathering implicitly by calculating the erosion rate, which is essentially a function of elevation of the location. Maximum ecohydrologically limited weathering rates of 0.418 and 0.451 mm of rock per year for every square meter is found in Costa Rica and Peru, which is representative of the high levels of productivity. Weathering in these areas is strictly restricted by erosion (see Table 3). The area of study in Japan exhibits a weathering rate of 0.086 mm rock m−2 per year, which is comparatively higher than the simulated areas in the USA, Sweden, and New Zealand, which showcase 0.045, 0.055, and 0.055 mm rock m−2 weathering per year, respectively.
Table 3Weathering regimes post processed using Arens and Kleidon (2011) approach from LYCOm products.

Table 4LYCOm outputs: survival rates, weighted leaf area index (LAI), weighted NPP and weighted soil CO2 content.

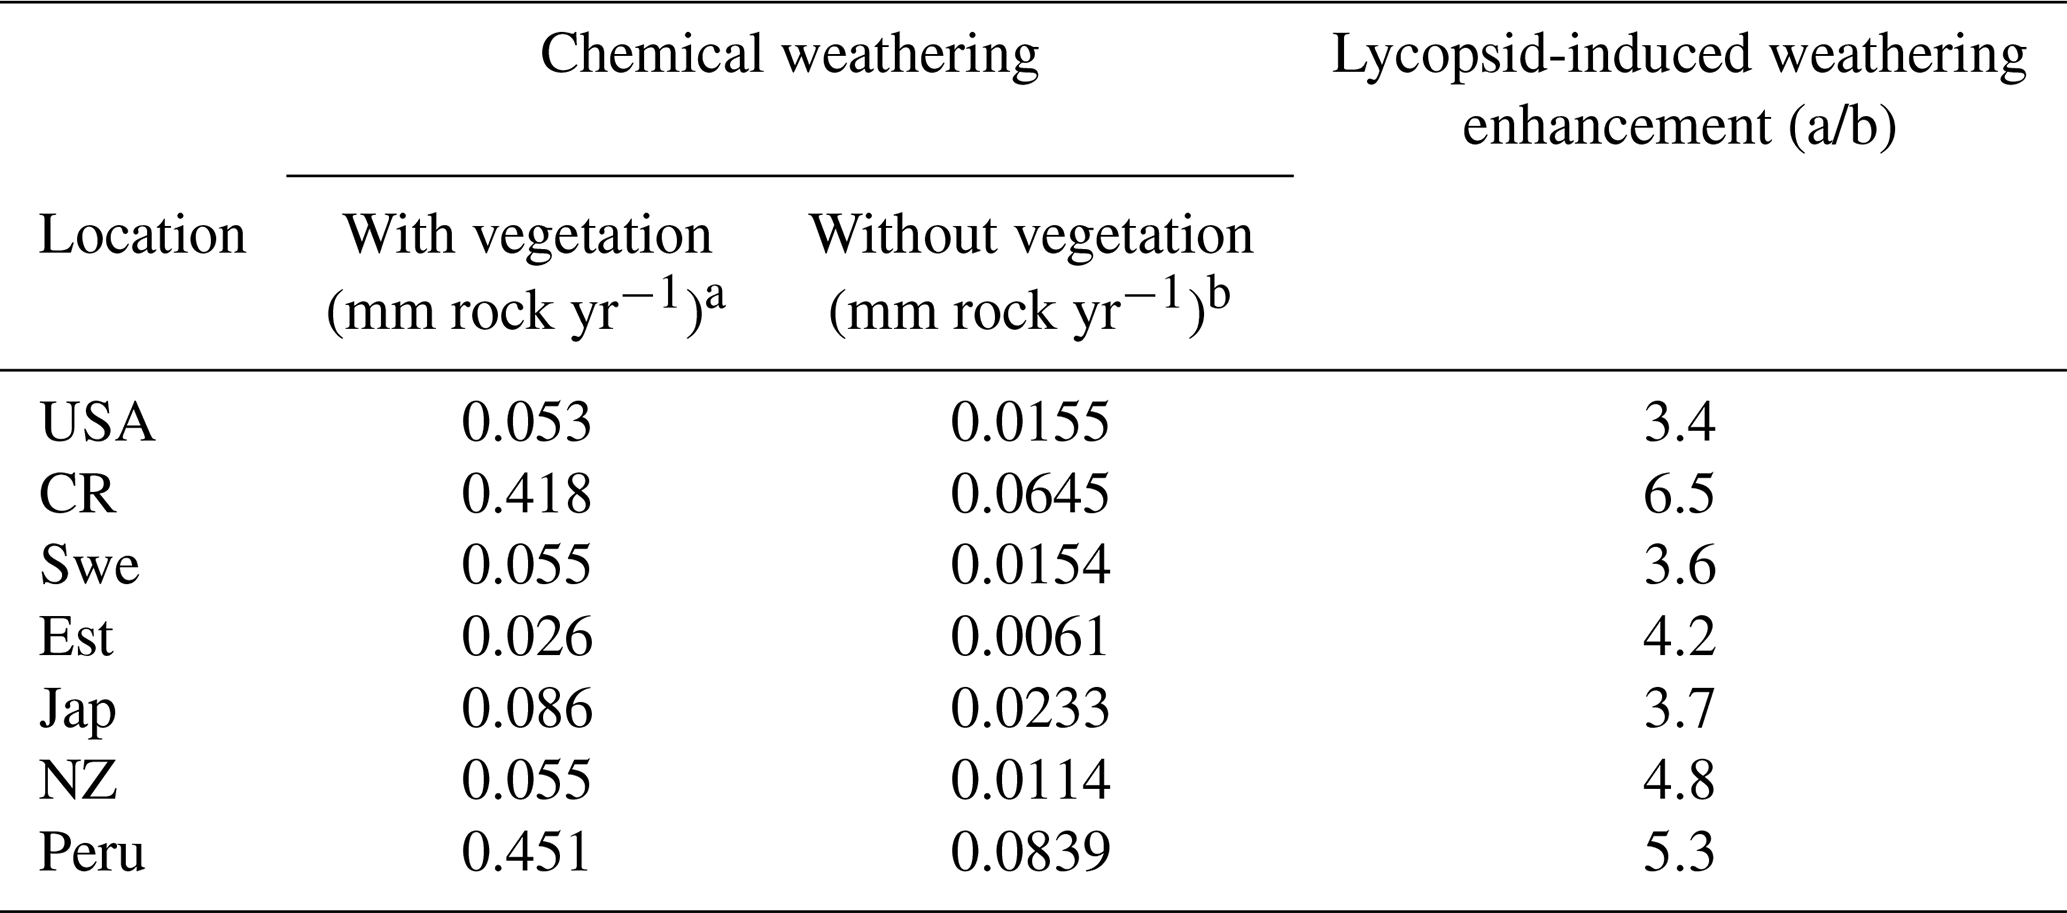
A regional influence of ecohydrologically limited weathering is conceived in the sensitivity runs undertaken to obtain insight into the influence of lycopsids on weathering. In addition to the runs with (a) vegetation (lycopsids), we run the model in (b) a vegetation-free scenario. The model run with no lycopsids is undertaken to determine the large-scale runoff, and the soil CO2 concentration is assumed to be in equilibrium with that of the atmosphere for computation of the weathering when the location is devoid of vegetation (scenario (b) in Table 5). In general, an elevated level (see Table 5) of weathering is observed at all sites with vegetation as compared to the case without vegetation. The weathering was observed to be 6 times higher in Costa Rica and almost 5 times in Peru with vegetation. The location-specific enhancement due to vegetation is a result of different levels of productivity and varying hydrology. The least enhancement is recorded around the great lakes in the USA, followed by Sweden and Japan.
Table 5Comparison of supply limited eco-hydrological-controlled weathering regimes with vegetation (a) and without vegetation (b). In addition, the percolation rate is doubled in the with vegetation (a) scenario, which incorporates the impact of roots on the soil (making it more porous).
LYCOm represents a community of lycopsids at several local sites. The respective locations provide suitable climatic conditions for the growth of lycopsids (GBIF), and the model shows relatively high survival rates there, as pointed out in Table 2. The tropical climate of Costa Rica and Peru ensure continuous productivity throughout the year, while the temperate climate at the rest of the sites results in a strong seasonal pattern (see Fig. 4). Increased productivity in warmer months as compared to colder months varies over latitudes as well. Indirectly, differences in climatic conditions between the locations affect productivity levels of the plants also through soil water availability. In addition, a prominent impact of soil water can be noticed in the soil CO2 concentration. The microclimate at the site chosen for emulating the lab sample in India is likely to be substantially different from the large-scale climate derived from the global dataset. The climate of the region is markedly drier compared to the other chosen locations in the study. Therefore, the rainfall is insufficient for the sustenance of the generated lycopsid strategies. As a result, no strategies survive through the whole simulation period at the location.
The runoff in the LYCOm model is comparable to Ghiggi et al. (2019) and the lycopsid productivity in the model is comparable to Tosens et al. (2016) and Campany et al. (2019), even though the generated strategies in the model are not analogous to the species utilized for observation. This establishes LYCOm as a robust process-based vegetation model with reasonable eco-hydrological representation (Table 2) given the complexity of the model. Weathering is classified in LYCOm according to the dominant limiting factor, which is either the supply of parent material or the eco-hydrological conditions. In the sensitivity study, it is apparent that the influence of lycopsids on chemical weathering rates is substantial at the local scale (Table 3). It is in fact, significantly higher than lichens and bryophytes, which colonized terrestrial ecosystems earlier than lycopsids (Wellman et al., 2003; Wellman and Gray, 2000; Chang and Graham, 2011; Yin-Long, 2008). Aghamiri and Schwartzman (2002) explore weathering by lichens and bryophytes on rock surfaces and estimate a range of 0.0004 to 0.01 mm rock yr−1 weathering, comparatively lower than that of lycopsids, which exhibit a greater weathering potential of 0.026 to 0.418 mm rock yr−1 (see Table 3). The change in weathering potential emphasizes the impacts of lycopsids and their corresponding effects on the biogeochemical cycle.
The approach of simulating strategies encompassing various physiological properties and trade-offs adds flexibility to the model, which is advantageous in representing already extinct or evolving species. In Fig. 5, four species generated in LYCOm are plotted under varying ambient conditions, against assimilation rates measured in the laboratory by Soni et al. (2012). This figure depicts the potential (test species in figure, shown in dashed lines) of the model to closely replicate real-world species, which can be achieved with an appropriate selection of parameters within the defined ranges of LYCOm.

Figure 5CO2, light, and temperature responses of four lycophyte strategies simulated (colored solid lines) in LYCOm against the four best test strategies (dashed lines) generated from LYCOm parameterization ranges in order to replicate the lab data (in black solid line; Soni et al. (2012)) as closely as possible.
LYCOm emulates well the behavior of the organisms under local climate at the local scale. The chosen locations, suggested to be suitable for such plant communities, do not , however, allow for direct extrapolation of the effects of lycopsids at the global scale. For further assessment of biogeochemical impacts of lycopsids, it is necessary to extend the model to a large scale.
Even though we cannot account for all biochemical processes existing in nature, the model accounts for the most relevant properties of lycopsids and represents the local interactions sufficiently to a certain degree. It is crucial to ensure that our modeling approach remains consistent when we upscale it in the future. LYCOm, paired with the weathering model, forms a crucial component towards understanding the long-term impacts of such plants on Earth's climate, as influenced by the CO2 content of the atmosphere. Although our model can provide subsequent insights into the impacts of such plants, the study is restricted by a lack of data on the properties of lycopsids. Data concerning plant physiology and measurements involving productivity will contribute towards better optimization and validation of the model. The light, CO2, and temperature curves of lycopsid species other than Selaginella bryopteris would not only strengthen the model performance further, but they would also help us constrain the parameter ranges with better precision.
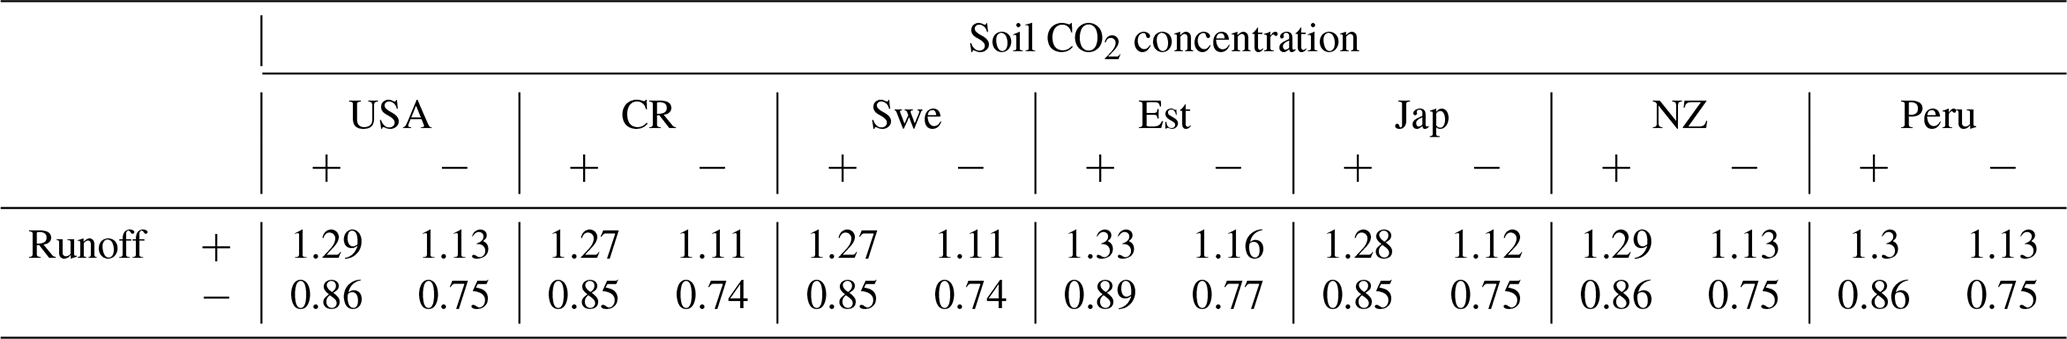
One option for improvement would be the use of high-resolution meteorological data to reduce the uncertainty of the model estimates. This would not only provide an enhanced possibility to evaluate the model performance but also resolve the biogeochemical processes on a finer scale. Local enhancement of weathering rates could be captured better with such a setup since runoff and soil CO2 concentration are dependent on productivity and hydrological balance at the respective sites. Table 6 summarizes the sensitivity of weathering with increases and decreases in these components. We do not observe any disproportional enhancement factor in the weathering and thus assume that our weathering estimates are robust. Although we consider the light and water interception by the surrounding, the influence of the large forests on the water uptake from soil and humidity of the surrounding needs to be accounted for explicitly when upscaling our estimates. This may be achieved with a higher spatial resolution of the model input data representing environmental conditions.
Table 6Sensitivity of eco-hydrological-controlled weathering regime at respective locations with (+) 20 % enhancement and (−) 20 % decrease of runoff and soil CO2 concentration relative to the original enhancement due to vegetation from Table 5.
The LYCOm model draws in information from fossil records as it helps in setting the physiological limitations of the extinct species. Modern lycophytes, such as terrestrial lineages of Lycopodiaceae, maintain some degrees of functional and morphological conservatism concerning Lower Devonian herbaceous lycopsids and their forerunners. On this basis, modern lycophytes can be used as a suitable analog system for widespread elements of Lower Devonian plant communities. Lycopsids survive under a variety of climatic conditions (Petersen and Burd, 2018) and have been represented well by the local version of the model. The productivity from the model shows strong agreement with the on-site measurements for the contemporary lycopsids. LYCOm, therefore, has the potential to be utilized beyond the range of current conditions. The study aims to lay the foundation for a global lycopsid model which could also estimate the variability of atmospheric CO2 levels and climate on geological timescales on coupling with a global mass balance model of carbon pools. The current study hints at a potential enhancement of the weathering by the lycopsids considerably higher than that of lichens but requires further exploration, especially keeping in mind the nutrient limitation that has not been incorporated in LYCOm. This model therefore can be applied toward investigations targeting weathering dynamics in early terrestrial ecosystems. Hence, lycopsids could turn out to be a crucial contributor to the enhancement of silicate weathering on a global scale, especially, during the periods in which the species dominated the flora. Hence, this implication of the model for the fossil record is imminent and we, therefore, try to explore the past using information from such records. Further studies delving into the geochemical changes resulting from the advent of lycopsids could give us detailed insights into understanding the gradual evolution of the composition of the atmosphere today.
The study is restricted by two primary factors. Firstly, the current coarse resolution of the dataset in use poses the risk of averaging the real behavior of the plant species and therefore might mask a higher potential impact of the lycopsids on weathering rates. Secondly, poorly sampled physiological properties of lycopsids make it difficult to evaluate the model. Further enhancement and extension of the lycopsid datasets are thus required, which would require a collective effort of the research community. The current work attempts to map out a relatively new field of research that has shown to hold much potential based on this preliminary work. The work aims to draw scientific interest in the field and try to incorporate these details in works such as the Paleoclimate Modelling Intercomparison Project (Otto-Bliesner et al., 2021).
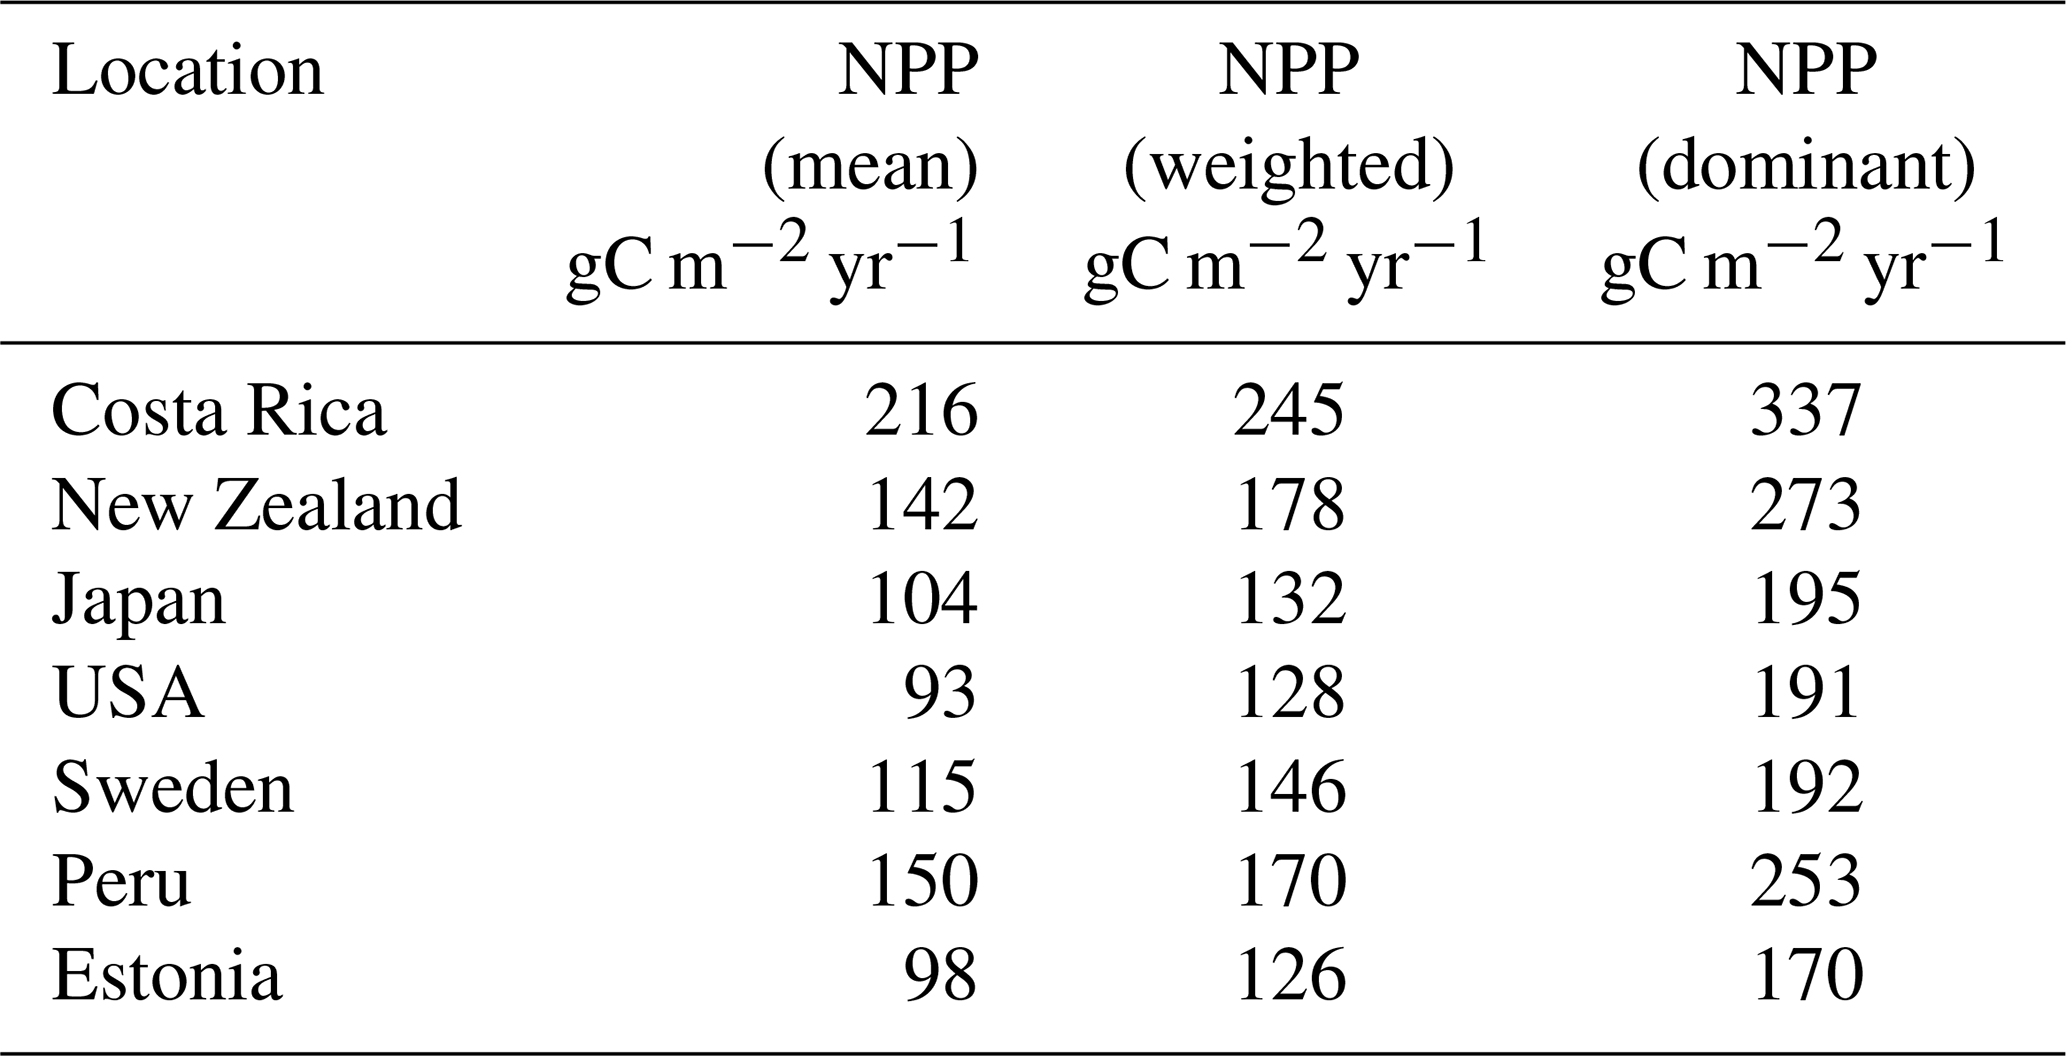
Table A1Comparison of NPP: (i) mean, which refers to the average of all surviving species; (ii) weighted, according to Eq. (24), averaged by root and leaf biomass; (iii) dominant species at the location which accumulates the maximum biomass during the simulation period in gram carbon per square meter per year.
The model code (LYCOm v1.0) used in this study is archived at https://doi.org/10.5281/zenodo.4960947 (Halder and Porada, 2021).
The input data (referred to in Sect. 3.1) can be accessed from https://doi.org/10.5065/486N-8109 (Weedon et al., 2018).
SH and PP designed the model and SH carried out model simulations. SH prepared the manuscript with substantial suggestions and corrections by SKMA, KJ, and TWD. Inputs from SKMA, KJ, TWD, and PP added to the quality of the work significantly.
The contact author has declared that neither they nor their co-authors have any competing interests.
Publisher’s note: Copernicus Publications remains neutral with regard to jurisdictional claims in published maps and institutional affiliations.
Universität Hamburg provided computational resources. We would like to thank Jeffrey Benca, currently working at the University of California, for their constant support of the project.
This research has been supported by the Deutsche Forschungsgemeinschaft (DFG, German Research Foundation) – grant no. 408092731. Susanne K. M. Arens and Tais W. Dahl acknowledge funding by the Danish Council for Independent Research DFF (7014-00295 and 8102–00005b).
This paper was edited by Tomomichi Kato and reviewed by two anonymous referees.
Aghamiri, R. R. and Schwartzman, D. W.: Weathering rates of bedrock by lichens: a mini watershed study, Chem. Geol., 188, 249–259, 2002. a
Algeo, T. J. and Scheckler, S. E.: Terrestrial-marine teleconnections in the Devonian: links between the evolution of land plants, weathering processes, and marine anoxic events, Philos. T. Roy. Soc. B, 353, 113–130, 1998. a, b, c
Algeo, T. J. and Scheckler, S. E.: Land plant evolution and weathering rate changes in the Devonian, J. Earth Sci., 21, 75–78, 2010. a
Andrews, J. A. and Schlesinger, W. H.: Soil CO2 dynamics, acidification, and chemical weathering in a temperate forest with experimental CO2 enrichment, Global Biogeochem. Cy., 15, 149–162, 2001. a
Arens, S. and Kleidon, A.: Eco-hydrological versus supply-limited weathering regimes and the potential for biotic enhancement of weathering at the global scale, Appl. Geochem., 26, S274–S278, 2011. a, b, c, d
Atkin, O. K., Bruhn, D., Hurry, V. M., and Tjoelker, M. G.: Evans Review No. 2: The hot and the cold: unravelling the variable response of plant respiration to temperature, Funct. Plant Biol., 32, 87–105, 2005. a
Bateman, R. M., Crane, P. R., DiMichele, W. A., Kenrick, P. R., Rowe, N. P., Speck, T., and Stein, W. E.: Early evolution of land plants: phylogeny, physiology, and ecology of the primary terrestrial radiation, Annu. Rev. Ecol. Syst., 29, 263–292, 1998. a
Bergman, N. M., Lenton, T. M., and Watson, A. J.: COPSE: a new model of biogeochemical cycling over Phanerozoic time, Am. J. Sci., 304, 397–437, 2004. a
Berner, E., Berner, R., and Moulton, K.: Plants and mineral weathering: present and past, Treatise on Geochemistry, 5, 169–188, https://doi.org/10.1016/B0-08-043751-6/05175-6, 2003. a
Berner, R. A.: Atmospheric carbon dioxide levels over Phanerozoic time, Science, 249, 1382–1386, 1990. a
Berner, R. A.: Weathering, plants, and the long-term carbon cycle, Geochim. Cosmochim. Ac., 56, 3225–3231, 1992. a
Berner, R. A.: The carbon cycle and carbon dioxide over Phanerozoic time: the role of land plants, Philos. T. Roy. Soc. B, 353, 75–82, 1998. a, b
Bluth, G. J. and Kump, L. R.: Lithologic and climatologic controls of river chemistry, Geochim. Cosmochim. Ac., 58, 2341–2359, 1994. a
Boyce, C. K. and Lee, J.-E.: An exceptional role for flowering plant physiology in the expansion of tropical rainforests and biodiversity, P. Roy. Soc. B-Biol. Sci., 277, 3437–3443, 2010. a, b
Boyce, C. K. and Lee, J.-E.: Plant evolution and climate over geological timescales, Annu. Rev. Earth Pl. Sc., 45, 61–87, 2017. a
Brodribb, T. J. and McAdam, S. A.: Passive origins of stomatal control in vascular plants, Science, 331, 582–585, 2011. a, b, c
Campany, C. E., Martin, L., and Watkins Jr., J. E.: Convergence of ecophysiological traits drives floristic composition of early lineage vascular plants in a tropical forest floor, Ann. Bot.-London, 123, 793–803, 2019. a, b, c
Carriquí, M., Roig-Oliver, M., Brodribb, T. J., Coopman, R., Gill, W., Mark, K., Niinemets, Ü., Perera-Castro, A. V., Ribas-Carbó, M., Sack, L., and Tosens, T.: Anatomical constraints to nonstomatal diffusion conductance and photosynthesis in lycophytes and bryophytes, New Phytol., 222, 1256–1270, 2019. a
Chang, Y. and Graham, S. W.: Inferring the higher-order phylogeny of mosses (Bryophyta) and relatives using a large, multigene plastid data set, Am. J. Bot., 98, 839–849, 2011. a
Chater, C., Kamisugi, Y., Movahedi, M., Fleming, A., Cuming, A. C., Gray, J. E., and Beerling, D. J.: Regulatory mechanism controlling stomatal behavior conserved across 400 million years of land plant evolution, Curr. Biol., 21, 1025–1029, 2011. a
Cochran, M. F. and Berner, R. A.: Enhancement of silicate weathering rates by vascular land plants: quantifying the effect, Chem. Geol., 107, 213–215, 1993. a
Colbourn, G., Ridgwell, A., and Lenton, T.: The time scale of the silicate weathering negative feedback on atmospheric CO2, Global Biogeochem. Cy., 29, 583–596, 2015. a
Dahl, T. W. and Arens, S. K.: The impacts of land plant evolution on Earth's climate and oxygenation state – An interdisciplinary review, Chem. Geol., 547, 119665, https://doi.org/10.1016/j.chemgeo.2020.119665, 2020. a
Drever, J. I.: The effect of land plants on weathering rates of silicate minerals, Geochim. Cosmochim. Ac., 58, 2325–2332, 1994. a
Elick, J. M., Driese, S. G., and Mora, C. I.: Very large plant and root traces from the Early to Middle Devonian: Implications for early terrestrial ecosystems and atmospheric p(CO2), Geology, 26, 143–146, 1998. a
Fan, J., McConkey, B., Wang, H., and Janzen, H.: Root distribution by depth for temperate agricultural crops, Field Crop. Res., 189, 68–74, 2016. a
Farquhar, G. D. and Von Caemmerer, S.: Modelling of photosynthetic response to environmental conditions, in: Physiological plant ecology, Vol. 12 B: Water relations and photosynthetic productivity, edited by: Lange, O. L., Nobel, P. S., Osmond, C. B., Ziegler, H., Springer-Verlag, Berlin Heidelberg New York, 549–587, https://doi.org/10.1007/978-3-642-68150-9_17, 1982. a, b
Foster, G. L., Royer, D. L., and Lunt, D. J.: Future climate forcing potentially without precedent in the last 420 million years, Nat. Commun., 8, 14845, https://doi.org/10.1038/ncomms14845, 2017. a
Galmes, J., Kapralov, M. V., Andralojc, P. J., Conesa, M. À., Keys, A. J., Parry, M. A., and Flexas, J.: Expanding knowledge of the R ubisco kinetics variability in plant species: environmental and evolutionary trends, Plant Cell Environ., 37, 1989–2001, 2014. a, b, c
Garratt, M., Tims, J., Rickards, R., Chambers, T., and Douglas, J.: The appearance of Baragwanathia (Lycophytina) in the Silurian, Bot. J. Linn. Soc., 89, 355–358, 1984. a, b
Gensel, P. G., Kotyk, M. E., and Basinger, J. F.: Morphology of Above-and Below-Ground Structures in Early Devonian (Pragian–Emsian) Plants, Plants invade the land: evolutionary and environmental perspectives, edited by: Gensel, P. G. and Edwards, D., Columbia University Press, 83–102, https://doi.org/10.7312/gens11160-006, 2001. a
Ghiggi, G., Humphrey, V., Seneviratne, S. I., and Gudmundsson, L.: GRUN: an observation-based global gridded runoff dataset from 1902 to 2014, Earth Syst. Sci. Data, 11, 1655–1674, https://doi.org/10.5194/essd-11-1655-2019, 2019. a, b, c, d
Gibling, M., Davies, N., Falcon-Lang, H., Bashforth, A. R., DiMichele, W. A., Rygel, M., and Ielpi, A.: Palaeozoic co-evolution of rivers and vegetation: a synthesis of current knowledge, P. Geologist. Assoc., 125, 524–533, 2014. a
Green, J. K., Konings, A. G., Alemohammad, S. H., Berry, J., Entekhabi, D., Kolassa, J., Lee, J.-E., and Gentine, P.: Regionally strong feedbacks between the atmosphere and terrestrial biosphere, Nat. Geosci., 10, 410–414, 2017. a
Halder, S. and Porada, P.: A dynamic local scale vegetation model for lycopsids (LYCOm), Zenodo [code], https://doi.org/10.5281/zenodo.4960947, 2021. a
Hao, S., Xue, J., Guo, D., and Wang, D.: Earliest rooting system and root: shoot ratio from a new Zosterophyllum plant, New Phytol., 185, 217–225, 2010. a, b
Hetherington, A. J. and Dolan, L.: The evolution of lycopsid rooting structures: conservatism and disparity, New Phytol., 215, 538–544, 2017. a
Hetherington, A. J., Bridson, S. L., Jones, A. L., Hass, H., Kerp, H., and Dolan, L.: An evidence-based 3D reconstruction of Asteroxylon mackiei the most complex plant preserved from the Rhynie chert, eLife, 10, e69447, https://doi.org/10.7554/eLife.69447, 2021. a
Hikosaka, K. and Hirose, T.: Leaf angle as a strategy for light competition: optimal and evolutionarily stable light-extinction coefficient within a leaf canopy, Ecoscience, 4, 501–507, 1997. a
Hilley, G. E. and Porder, S.: A framework for predicting global silicate weathering and CO2 drawdown rates over geologic time-scales, P. Natl. Acad. Sci. USA, 105, 16855–16859, 2008. a
Ibarra, D. E., Rugenstein, J. K. C., Bachan, A., Baresch, A., Lau, K. V., Thomas, D. L., Lee, J.-E., Boyce, C. K., and Chamberlain, C. P.: Modeling the consequences of land plant evolution on silicate weathering, Am. J. Sci., 319, 1–43, https://doi.org/10.2475/01.2019.01, 2019. a, b, c
Jabro, J. D., Sainju, U. M., Stevens, W. B., and Evans, R. G.: Estimation of CO2 diffusion coefficient at 0–10 cm depth in undisturbed and tilled soils, Arch. Agron. Soil Sci., 58, 1–9, https://doi.org/10.1080/03650340.2010.506482, 2012. a
June, T., Evans, J. R., and Farquhar, G. D.: A simple new equation for the reversible temperature dependence of photosynthetic electron transport: a study on soybean leaf, Funct. Plant Biol., 31, 275–283, 2004. a
Kattge, J. and Knorr, W.: The temperature dependence of photosynthetic capacity in a photosynthesis model acclimates to plant growth temperature: a re-analysis of data from 36 species, Plant Cell Environ., 30, 1176–1190, 2007. a, b
Kelly, E. F., Chadwick, O. A., and Hilinski, T. E.: The effect of plants on mineral weathering, Biogeochemistry, 42, 21–53, 1998. a
Kenrick, P. and Crane, P. R.: The origin and early evolution of plants on land, Nature, 389, 33–39, 1997. a
Kenrick, P. and Strullu-Derrien, C.: The origin and early evolution of roots, Plant Physiol., 166, 570–580, 2014. a
Kenrick, P., Wellman, C. H., Schneider, H., and Edgecombe, G. D.: A timeline for terrestrialization: consequences for the carbon cycle in the Palaeozoic, Philos. T. R. Soc. B., 367, 519–536, https://doi.org/10.1098/rstb.2011.0271, 2012. a
Kotyk, M. E., Basinger, J. F., Gensel, P. G., and de Freitas, T. A.: Morphologically complex plant macrofossils from the Late Silurian of Arctic Canada, Am. J. Bot., 89, 1004–1013, 2002. a
Lawson, T., von Caemmerer, S., and Baroli, I.: Photosynthesis and stomatal behaviour, in: Progress in botany, edited by: Lüttge, U. E., Beyschlag, W., Büdel, B., Francis, D., Springer, Berlin, 265–304, https://doi.org/10.1007/978-3-642-13145-5_11, 2010. a
Lee, J.-E. and Boyce, K.: Impact of the hydraulic capacity of plants on water and carbon fluxes in tropical South America, J. Geophys. Res.-Atmos., 115, D23123, https://doi.org/10.1029/2010JD014568, 2010. a
Le Hir, G., Donnadieu, Y., Goddéris, Y., Meyer-Berthaud, B., Ramstein, G., and Blakey, R. C.: The climate change caused by the land plant invasion in the Devonian, Earth Planet. Sc. Lett., 310, 203–212, 2011. a
Leopold, A. C., Musgrave, M. E., and Williams, K. M.: Solute leakage resulting from leaf desiccation, Plant Physiol., 68, 1222–1225, 1981. a, b
Maher, K.: The role of fluid residence time and topographic scales in determining chemical fluxes from landscapes, Earth Planet. Sc. Lett., 312, 48–58, 2011. a
Maher, K. and Chamberlain, C.: Hydrologic regulation of chemical weathering and the geologic carbon cycle, Science, 343, 1502–1504, 2014. a
Matsunaga, K. K. and Tomescu, A. M.: Root evolution at the base of the lycophyte clade: insights from an Early Devonian lycophyte, Ann. Bot.-London, 117, 585–598, https://doi.org/10.1093/aob/mcw006, 2016. a, b, c, d
McAdam, S. A. and Brodribb, T. J.: Ancestral stomatal control results in a canalization of fern and lycophyte adaptation to drought, New Phytol., 198, 429–441, 2013. a
McKay, M. D., Beckman, R. J., and Conover, W. J.: A comparison of three methods for selecting values of input variables in the analysis of output from a computer code, Technometrics, 42, 55–61, 2000. a
Medlyn, B., Loustau, D., and Delzon, S.: Temperature response of parameters of a biochemically based model of photosynthesis. I. Seasonal changes in mature maritime pine (Pinus pinaster Ait.), Plant Cell Environ., 25, 1155–1165, https://doi.org/10.1046/j.1365-3040.2002.00890.x, 2002. a, b
Montanez, I. P.: Modern soil system constraints on reconstructing deep-time atmospheric CO2, Geochim. Cosmochim. Ac., 101, 57–75, 2013. a
Monteith, J.: Evaporation and surface temperature, Q. J. Roy. Meteor. Soc., 107, 1–27, https://doi.org/10.1002/qj.49710745102, 1981. a
Morris, J. L., Puttick, M. N., Clark, J. W., Edwards, D., Kenrick, P., Pressel, S., Wellman, C. H., Yang, Z., Schneider, H., and Donoghue, P. C. J.: The timescale of early land plant evolution, P. Natl. Acad. Sci. USA, 115, E2274–E2283, https://doi.org/10.1073/pnas.1719588115, 2018. a
Moulton, K. L., West, J., and Berner, R. A.: Solute flux and mineral mass balance approaches to the quantification of plant effects on silicate weathering, Am. J. Sci., 300, 539–570, 2000. a
Otto-Bliesner, B. L., Brady, E. C., Zhao, A., Brierley, C. M., Axford, Y., Capron, E., Govin, A., Hoffman, J. S., Isaacs, E., Kageyama, M., Scussolini, P., Tzedakis, P. C., Williams, C. J. R., Wolff, E., Abe-Ouchi, A., Braconnot, P., Ramos Buarque, S., Cao, J., de Vernal, A., Guarino, M. V., Guo, C., LeGrande, A. N., Lohmann, G., Meissner, K. J., Menviel, L., Morozova, P. A., Nisancioglu, K. H., O'ishi, R., Salas y Mélia, D., Shi, X., Sicard, M., Sime, L., Stepanek, C., Tomas, R., Volodin, E., Yeung, N. K. H., Zhang, Q., Zhang, Z., and Zheng, W.: Large-scale features of Last Interglacial climate: results from evaluating the lig127k simulations for the Coupled Model Intercomparison Project (CMIP6)–Paleoclimate Modeling Intercomparison Project (PMIP4), Clim. Past, 17, 63–94, https://doi.org/10.5194/cp-17-63-2021, 2021. a
Pavlick, R., Drewry, D. T., Bohn, K., Reu, B., and Kleidon, A.: The Jena Diversity-Dynamic Global Vegetation Model (JeDi-DGVM): a diverse approach to representing terrestrial biogeography and biogeochemistry based on plant functional trade-offs, Biogeosciences, 10, 4137–4177, https://doi.org/10.5194/bg-10-4137-2013, 2013. a
Petersen, K. B. and Burd, M.: The adaptive value of heterospory: Evidence from Selaginella, Evolution, 72, 1080–1091, 2018. a
Porada, P., Weber, B., Elbert, W., Pöschl, U., and Kleidon, A.: Estimating global carbon uptake by lichens and bryophytes with a process-based model, Biogeosciences, 10, 6989–7033, https://doi.org/10.5194/bg-10-6989-2013, 2013. a, b, c, d
Porada, P., Lenton, T., Pohl, A., Weber, B., Mander, L., Donnadieu, Y., Beer, C., Pöschl, U., and Kleidon, A.: High potential for weathering and climate effects of non-vascular vegetation in the Late Ordovician, Nat. Commun., 7, 1–13, https://doi.org/10.1038/ncomms12113, 2016. a, b
Proctor M. C.: The diversification of bryophytes and vascular plants in evolving terrestrial environments, in: Photosynthesis in bryophytes and early land plants, edited by: Hanson, D. T. and Rice, S. K., Springer, Dordrecht, 59–77, 2014. a
Qiu, Y.-L., Li, L., Wang, B., Chen, Z., Knoop, V., Groth-Malonek, M., Dombrovska, O., Lee, J., Kent, L., Rest, J., Estabrook, G. F., Hendry, T. A., Taylor, D. W., Testa, C. M., Ambros, M., Crandall-Stotler, B., Duff, R. J., Stech, M., Frey, W., Quandt, D., and Davis C. C.: The deepest divergences in land plants inferred from phylogenomic evidence, P. Natl. Acad. Sci. USA, 103, 15511–15516, https://doi.org/10.1073/pnas.0603335103, 2006. a
Quirk, J., Leake, J. R., Johnson, D. A., Taylor, L. L., Saccone, L., and Beerling, D. J.: Constraining the role of early land plants in Palaeozoic weathering and global cooling, P. Roy. Soc. B-Biol. Sci., 282, 20151115, https://doi.org/10.1098/rspb.2015.1115, 2015. a
Randerson, J. T., Hoffman, F. M., Thornton, P. E., Mahowald, N. M., Lindsay, K., Lee, Y. H., Nevison, C. D., Doney, S. C., Bonan, G., Stöckli, R., Covey, C., Running, S. W., and Fung, I. Y.: Systematic assessment of terrestrial biogeochemistry in coupled climate–carbon models, Global Change Biol., 15, 2462–2484, https://doi.org/10.1111/j.1365-2486.2009.01912.x, 2009. a
Raven, J. A.: Selection pressures on stomatal evolution, New Phytol., 153, 371–386, 2002. a
Ruszala, E. M., Beerling, D. J., Franks, P. J., Chater, C., Casson, S. A., Gray, J. E., and Hetherington, A. M.: Land plants acquired active stomatal control early in their evolutionary history, Curr. Biol., 21, 1030–1035, 2011. a
Savir, Y., Noor, E., Milo, R., and Tlusty, T.: Cross-species analysis traces adaptation of Rubisco toward optimality in a low-dimensional landscape, P. Natl. Acad. Sci. USA, 107, 3475–3480, https://doi.org/10.1073/pnas.0911663107, 2010. a, b
Sellers, P., Randall, D., Collatz, G., Berry, J., Field, C., Dazlich, D., Zhang, C., Collelo, G., and Bounoua, L.: A revised land surface parameterization (SiB2) for atmospheric GCMs. Part I: Model formulation, J. Climate, 9, 676–705, 1996. a
Shukla, J. and Mintz, Y.: Influence of land-surface evapotranspiration on the earth's climate, Science, 215, 1498–1501, 1982. a
Song, H., Wignall, P. B., Song, H., Dai, X., and Chu, D.: Seawater temperature and dissolved oxygen over the past 500 million years, J. Earth Sci., 30, 236–243, 2019. a
Soni, D. K., Ranjan, S., Singh, R., Khare, P. B., Pathre, U. V., and Shirke, P. A.: Photosynthetic characteristics and the response of stomata to environmental determinants and ABA in Selaginella bryopteris, a resurrection spike moss species, Plant Sci., 191, 43–52, 2012. a, b, c, d, e, f, g, h, i
Spencer, V., Nemec Venza, Z., and Harrison, C. J.: What can lycophytes teach us about plant evolution and development? Modern perspectives on an ancient lineage, Evol. Dev., 23, 174–196, 2021. a
Stein, W. E., Berry, C. M., Hernick, L. V., and Mannolini, F.: Surprisingly complex community discovered in the mid-Devonian fossil forest at Gilboa, Nature, 483, 78–81, 2012. a
Taylor, E. L., Taylor, T. N., and Krings, M.: Paleobotany: the biology and evolution of fossil plants, Academic Press, Burlington, NY, USA, MA, edn. 2, ISBN 978-0-12-373972-8, 2009. a
Thomas, B. A. and Watson, J.: A rediscovered 114-foot Lepidodendron from Bolton, Lancashire, Geol. J., 11, 15–20, 1976. a
Tosens, T., Nishida, K., Gago, J., Coopman, R. E., Cabrera, H. M., Carriquí, M., Laanisto, L., Morales, L., Nadal, M., Rojas, R., Talts, E., Tomas, M., Hanba, Y., Niinemets, U., and Flexas, J.: The photosynthetic capacity in 35 ferns and fern allies: mesophyll CO2 diffusion as a key trait, New Phytol., 209, 1576–1590, 2016. a, b, c, d, e
Valdespino, I. A.: Two New Species and a New Record of Selaginella (Selaginellaceae) from Bolivia, Novon, 24, 96–105, https://doi.org/10.3417/2011022, 2015a. a
Valdespino, I. A.: Two new species and a new record of Selaginella (Selaginellaceae) from Bolivia, Novon, 24, 96–105, 2015b. a
Vanderwel, M. C., Slot, M., Lichstein, J. W., Reich, P. B., Kattge, J., Atkin, O. K., Bloomfield, K. J., Tjoelker, M. G., and Kitajima, K.: Global convergence in leaf respiration from estimates of thermal acclimation across time and space, New Phytol., 207, 1026–1037, 2015. a
Vannoppen, W., De Baets, S., Keeble, J., Dong, Y., and Poesen, J.: How do root and soil characteristics affect the erosion-reducing potential of plant species?, Ecol. Eng., 109, 186–195, 2017. a
Walker, J. C., Hays, P., and Kasting, J. F.: A negative feedback mechanism for the long-term stabilization of Earth's surface temperature, J. Geophys. Res.-Oceans, 86, 9776–9782, 1981. a, b
Weedon, G., Gomes, S., Viterbo, P., Shuttleworth, W., Blyth, E., Österle, H., Adam, J., Bellouin, N., Boucher, O., and Best, M.: Creation of the WATCH Forcing Data and Its Use to Assess Global and Regional Reference Crop Evaporation over Land during the Twentieth Century, J. Hydrometeorol., 12, 823–848, https://doi.org/10.1175/2011JHM1369.1, 2011. a
Weedon, G. P., Balsamo, G., Bellouin, N., Gomes, S., Best, M. J., and Viterbo, P.: The WFDEI Meteorological Forcing Data, Research Data Archive at the National Center for Atmospheric Research, Computational and Information Systems Laboratory [data set], https://doi.org/10.5065/486N-8109, 2018. a
Wellman, C. H. and Gray, J.: The microfossil record of early land plants, Philos. T. Roy. Soc. B, 355, 717–732, 2000. a
Wellman, C. H., Osterloff, P. L., and Mohiuddin, U.: Fragments of the earliest land plants, Nature, 425, 282–285, 2003. a
Wellman, C. H., Steemans, P., and Vecoli, M.: Palaeophytogeography of Ordovician–Silurian land plants, Geological Society, London, Memoirs, 38, 461–476, 2013. a
Wickett, N. J., Mirarab, S., Nguyen, N., Warnow, T., Carpenter, E., Matasci, N., Ayyampalayam, S., Barker, M. S., Burleigh, J. G., Gitzendanner, M. A., Ruhfel, B. R., Wafula, E., Der, J. P., Graham, S. W., Mathews, S., Melkonian, M., Soltis, D. E., Soltis, P. S., Miles, N. W., Rothfels, C. J., Pokorny L., Shaw, A. J., DeGironimo, L., Stevenson, D. W., Surek, B., Villarreal, J. C., Roure, B., Philippe, H., dePamphilis, C. W., Chen, T., Deyholos, M. K., Baucom, R. S., Kutchan, T. M., Augustin, M. M., Wang, J., Zhang, Y., Tian, Z., Yan, Z., Wu, X., Sun, X., Wong, G. K., and Leebens-Mack, J.: Phylotranscriptomic analysis of the origin and early diversification of land plants, P. Natl. Acad. Sci. USA, 111, E4859–E4868, https://doi.org/10.1073/pnas.1323926111, 2014. a
Yin-Long, Q.: Phylogeny and evolution of charophytic algae and land plants, J. Syst. Evol., 46, 287–306, 2008. a
Zhang, L., Hu, Z., Fan, J., Zhou, D., and Tang, F.: A meta-analysis of the canopy light extinction coefficient in terrestrial ecosystems, Front. Earth Sci.-PRC, 8, 599–609, https://doi.org/10.1007/s11707-014-0446-7, 2014. a
Zier, J., Belanger, B., Trahan, G., and Watkins, J. E.: Ecophysiology of four co-occurring lycophyte species: an investigation of functional convergence, AoB Plants, 7, plv137, https://doi.org/10.1093/aobpla/plv137, 2015. a