the Creative Commons Attribution 4.0 License.
the Creative Commons Attribution 4.0 License.
 | 16 Mar 2022
GOBLIN version 1.0: a land balance model to identify national agriculture and land use pathways to climate neutrality via backcasting
Remi Prudhomme
Brian Duffy
James Gibbons
Cathal O'Donoghue
Mary Ryan
David Styles
The Paris Agreement commits 197 countries to achieve climate stabilisation at a global average surface temperature less than 2 ∘C above pre-industrial times using nationally determined contributions (NDCs) to demonstrate progress. Numerous industrialised economies have targets to achieve territorial climate neutrality by 2050, primarily in the form of “net zero” greenhouse gas (GHG) emissions. However, particular uncertainty remains over the role of countries' agriculture, forestry, and other land use (AFOLU) sectors for reasons including the potential trade-offs between GHG mitigation and food security, a non-zero emission target for methane as a short-lived GHG, and the requirement for AFOLU to act as a net sink to offset residual emissions from other sectors. These issues are represented at a coarse level in integrated assessment models (IAMs) that indicate the role of AFOLU in global pathways towards climate stabilisation. However, there is an urgent need to determine appropriate AFOLU management strategies at a national level within NDCs. Here, we present a new model designed to evaluate detailed AFOLU scenarios at national scale using the example of Ireland, where approximately 40 % of national GHG emissions originate from AFOLU. GOBLIN (General Overview for a Backcasting approach of Livestock INtensification) is designed to run randomised scenarios of agricultural activities and land use combinations within biophysical constraints (e.g. available land area, livestock productivities, fertiliser-driven grass yields, and forest growth rates). Using AFOLU emission factors from national GHG inventory reporting, GOBLIN calculates annual GHG emissions out to the selected target year for each scenario (2050 in this case). The long-term dynamics of forestry are represented up to 2120 so that scenarios can also be evaluated against the Paris Agreement commitment to achieve a balance between emissions and removals over the second half of the 21st century. Filtering randomised scenarios according to compliance with specific biophysical definitions (GHG time series) of climate neutrality will provide scientific boundaries for appropriate long-term actions within NDCs. We outline the rationale and methodology behind the development of GOBLIN, with an emphasis on biophysical linkages across food production, GHG emissions, and carbon sinks at a national level. We then demonstrate how GOBLIN can be applied to evaluate different scenarios in relation to a few possible simple definitions of “climate neutrality”, discussing opportunities and limitations.
- Article
(2542 KB) - Full-text XML
- BibTeX
- EndNote


Article four of the United Nations Framework Convention on Climate Change (UNFCCC) Paris Agreement (UNFCCC, 2015) states that in order for parties to achieve long-term temperature goals, peak greenhouse gas (GHG) emissions must be reached as soon as possible. Parties must strive to “achieve a balance between anthropogenic emissions by sources and removals by sinks of GHGs” (UNFCCC, 2015). The agriculture, forestry, and other land use (AFOLU) sector incorporates both agricultural activities (such as animal husbandry and crop production) and land use, land use change, and forestry (LULUCF) activities. As such, it contains important GHG sources and sinks, making a net contribution of 24 % to global GHG emissions (Smith et al., 2014). However, LULUCF is regarded as a major potential carbon dioxide (CO2) sink that will be central to any future balance between emissions and removals (IPCC, 2019b; Smith et al., 2014). Lóránt and Allen (2019) emphasise the central role that the AFOLU sector will play to reach climate neutrality through mitigation of current emission sources, reduced emissions intensity of agricultural production linked with increased efficiency, production of bio-based products to substitute more carbon-intensive products, and carbon sequestration.
An increasing number of countries have established ambitious national “climate neutrality” targets for 2050 in legislation (Oireachtas, 2021; Reisinger and Leahy, 2019; UK CCC, 2019). These targets pose a particular challenge for countries with high per capita GHG emissions and a high percentage of land occupation by ruminant livestock production, such as Ireland (P. Duffy et al., 2020) and New Zealand (NZ-MftE, 2021), because of the difficulty in reducing ruminant livestock emissions of methane (CH4) and nitrous oxide (N2O) (Herrero et al., 2016), and the large carbon dioxide (CO2) sinks needed to offset remaining CH4 and N2O based upon the 100-year average global warming potentials (GWP100) recommended for national inventory reporting (UNFCCC, 2014). Furthermore, meeting climate neutrality targets is likely to require AFOLU sectors to be better than climate neutral and to a provide net GHG offset to compensate for difficult-to-mitigate residual emissions in other sectors, such as aviation (Huppmann et al., 2018).
Until now, most national or AFOLU-specific plans for climate neutrality by 2050 have been based on achieving a balance between GHG emissions and removals in terms of GWP100 equivalents (Schulte et al., 2013; Searchinger et al., 2021; UK CCC, 2019). However, the warming effect of stable but continuous CH4 emissions is approximately constant, whilst the warming effect of continuous CO2 and N2O emissions is cumulative (Allen et al., 2018). Consequently, global climate modelling indicates that biogenic CH4 reductions of 24 %–47 % relative to 2010 are sufficient to achieve climate stabilisation at a global mean surface temperature 1.5 ∘C above pre-industrial times (Rogelj et al., 2018). A modified version of GWP100, termed GWP∗, has been proposed to evaluate future climate forcing effect considering the recent change in CH4 emissions, which is more consistent with global climate modelling used to identify climate stabilisation pathways (Huppmann et al., 2018; Rogelj et al., 2018). However, GWP∗ diverges from current inventory reporting and effectively discounts attribution of recent warming caused by existing methane emissions, posing challenges for attribution and questions for international equity if applied to determine climate neutrality at national level (Rogelj and Schleussner, 2019). Furthermore, the Paris Agreement specifically mentions the need to safeguard food security and end hunger (UNFCCC, 2015). Thus, there is considerable debate and uncertainty regarding the broad suite of agricultural and land use activities compatible with climate neutrality at the individual country level, which strongly depend on the GHG aggregation metric (e.g. GWP100 or GWP∗), and/or various approaches to downscale global emissions and sinks from particular scenarios compatible with climate stabilisation (Huppmann et al., 2018; Rogelj et al., 2018) and the particular impacts of GHG mitigation on food production in different countries (Prudhomme et al., 2021) .There is an urgent need to explore implications of different definitions for national AFOLU sectors.
Ireland's AFOLU sector provides an excellent case study to explore the implications of different definitions of, and pathways towards, climate neutrality because it sits at the international nexus of livestock production and climate mitigation. In 2019, agriculture contributed ∼ 34 % to national GHG emissions (P. Duffy et al., 2021) owing to a large ruminant sector producing beef and milk largely (90 %) for international export. Somewhat unusually within Europe, Ireland's LULUCF sector is a net source of GHG emissions, owing to over 300 000 ha of drained organic soils emitting approximately 8 million tonnes of CO2 equivalent annually, compared with a declining forestry sink of approximately 4.5 million tonnes of CO2 annually (P. Duffy et al., 2020). In 2018, the entire AFOLU sector made up ∼ 40 % of the Irish national emissions profile (CCAC, 2021). Methane accounts for circa 60 % of agricultural GHG emissions, and LULUCF emissions of CH4 could increase if organic soils are rewetted to reduce CO2 emissions. The future shape of climate neutrality in Ireland's AFOLU sector, and the amount of beef and milk that can be produced within associated emission constraints, is thus particularly sensitive to CH4 accounting (Prudhomme et al., 2021). Nonetheless, it is clear that achieving climate neutrality will require dramatic changes in agricultural and land management practises, not least because AFOLU emissions have been increasing over the past decade (P. Duffy et al., 2020). The debate about future land use has implications for livelihoods and cultural norms (Aznar-Sánchez et al., 2019) and is therefore highly sensitive. In such a context, pathways to climate neutrality cannot be objectively identified through extrapolation of recent trajectories nor stakeholder “visions”, invoking the need for a backcasting approach to first establish what a climate neutral AFOLU sector could look like.
This paper presents a new biophysical model capable of identifying broad pathways towards climate neutrality in Ireland's AFOLU sector, “GOBLIN” (General Overview for a Backcasting approach of Livestock INtensification). GOBLIN integrates, with sensitivity analyses, key parameters that influence agricultural production, GHG fluxes, ammonia (NH3) emissions, and nutrient losses to water using a methodology aligned with Ireland's UNFCCC reporting. The model is designed to be run repeatedly with randomly varied, biophysically compatible combinations of parameter inputs in order to identify specific combinations of agricultural production and land use that achieve climate neutrality by the target year. In the following sections, we will describe the scope, model architecture, implementation and functionality of GOBLIN, ending with discussion of its suitability for intended application and conclusions.
Scenario analysis is one of the major methods utilised in research on the impacts of agriculture (Kalt et al., 2021). Noszczyk (2019) highlights some of the popular modelling approaches to land use change, which include statistical, econometric, spatial interaction, optimisation, and integrated models. GOBLIN can be classified as an integrated land use model, given that it provides links between human (including inputs and outputs) and natural land use changes. Global examples of the integrated land use change models include LandSHIFT (Schaldach et al., 2011) and CLUMondo (Van Asselen and Verburg, 2013).
Exploratory scenarios describe plausible but alternative socioeconomic development pathways (Rounsevell and Metzger, 2010). Forecasting scenarios can fail to give a clear indication as to the impacts of policy implementation (Brunner et al., 2016), whereas backcasting is a complementary approach to scenario development that starts with the definition of a desired future state, which then determines various pathways that will achieve that future state (Brunner et al., 2016; Gordon, 2015). The GOBLIN model embraces this backcasting approach by randomly running scenarios that are screened against a specific target (e.g. climate neutrality by 2050). Model input parameters are randomised for hundreds of model runs so that unbiased scenario outputs can then be filtered according to the pre-defined target. Crucially, these results are not limited or biased by preconceived notions of “feasibility” or “plausibility”. As such, all calculated potential options for achieving the defined target are identified.
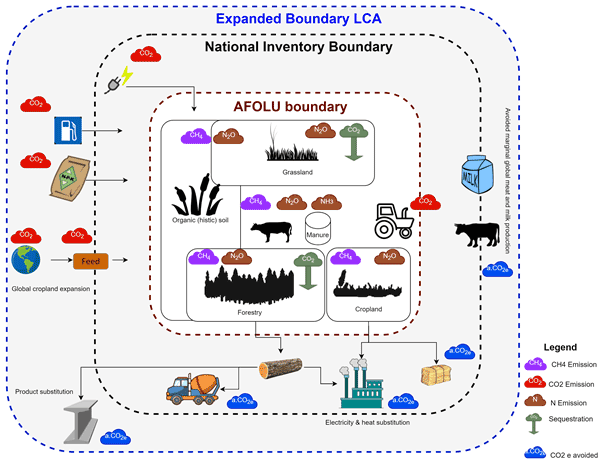
Figure 1Key emission sources and sinks critical to the determination of “climate neutrality” in Ireland's AFOLU sector accounted for in GOBLIN (white), alongside linked upstream and downstream sources and sinks to be included in subsequent life cycle assessment (LCA) modelling to determine wider climate mitigation efficacy.
The scope of GOBLIN is currently confined to national AFOLU boundaries (Fig. 1), accounting for the main AFOLU sources and sinks reported in national inventory reporting (P. Duffy et al., 2020) including, inter alia, CO2 fluxes to and from (organic) soils and forestry; CH4 emissions from enteric fermentation, manure management, wetlands, and other sources; and direct and indirect losses of nitrogen (N) from animal housing, manure management, and fertiliser application in the form of N2O, ammonia (NH3), and dissolved forms (e.g. nitrate, NO3) (P. Duffy et al., 2020). GOBLIN applies a gross–net approach to calculate absolute emissions and removals. This differs from recent LULUCF accounting in European Union policy that has used a net–net approach to determine changes in the GHG flux from LULUCF. Figure 1 highlights the main sources and sinks accounted for in GOBLIN alongside related sources and sinks that will be accounted for in subsequent a life cycle assessment (LCA) through coupling and/or integration with related models (Forster et al., 2021; Soteriades et al., 2019; Styles et al., 2016, 2018).
In the form of a global sensitivity analysis (Saltelli et al., 2009), GOBLIN varies key uncertain parameters within the AFOLU sector to calculate emissions and removals associated with linear rates of land use change up to the initial “target year” for neutrality. The year 2050 has been selected for this model illustration given its relevance to Irish reduction ambitions; however, it is not fixed as a target year, given that various definitions of climate neutrality involve GHG flux trajectories beyond 2050. The backcasting approach used in GOBLIN makes the linkages across biophysical constraints explicit, relating model outputs (emission reduction targets) with model inputs (parameters defining production systems and land management). These explicit linkages enable GOBLIN users to better understand complementarities and trade-offs across AFOLU activities with respect to the climate neutrality objective based on transparent and objective scenario construction. A primary aim of the model is to ensure consistency of scenarios in terms of land use (e.g. within available areas for grazing and carbon sequestration), associated agricultural production potential within land constraints (related to key production efficiency parameters), and associated GHG fluxes. The model allows scenarios to be built based on standardised sampling methods for key input parameters, avoiding sampling bias introduced by screening methods (Saltelli et al., 2009). The model is designed to run a large number (e.g. hundreds) of times to generate a suite of results representing different land use scenarios to 2050 (and beyond) and time series of emissions and removals up to 2120. Scenarios can then filtered to identify which ones comply with climate neutrality based on different definitions and metrics, e.g. (i) net zero GHG balance based on GWP100 (IPCC, 2013). (ii) no additional warming based on GWP∗ (Allen et al., 2018; Lynch et al., 2020), and (iii) compliance with a specific CH4 target downscaled from Integrated Assessment Models (IAMs) combined with a GWP100 balance across CO2 and N2O fluxes. Climate neutrality can be determined at one point in time (e.g. 2050) and/or as a time-integrated outcome over the second half of the century as per the Paris Agreement (UNFCCC, 2015). Filtered scenarios enable identification of input combinations compatible with climate neutrality as an objective evidence base for stakeholders to elaborate more detailed pathways towards climate neutrality considering wider socio-economic factors (Clarke et al., 2014).
A key feature of GOBLIN is its relation of complex interactions across livestock production, grassland management, and emissions offsetting within the AFOLU sector to a few simple input parameters used to define a plethora of possible scenarios. Reflecting the dominance of bovine production within Ireland's AFOLU sector, primary input data to initialise the model are national herd sizes (derived from milking cow and suckler cow numbers) and average animal-level productivity (e.g. milk yield per cow) to determine feed energy intake, fertiliser application rates, and grass utilisation rates to determine stocking densities and production outputs, followed by proportions of any spared grassland (relative to the baseline year) going to alternative land uses. In v1.0, alternative land uses are limited to fallow, commercial, or conservation forestry and rewetting of drained organic soils (bioenergy cropping and anaerobic digestion can be readily integrated for coupling with downstream energy models). Subsequent iterations and model coupling will account for upstream effects of, e.g. fertiliser and feed production, and extend downstream value chains to consider, e.g. energy and material substitutions, taking a full LCA approach (Fig. 1). Activity data and emission coefficients are largely based on those used in Ireland's National Inventory Report (NIR) (P. Duffy et al., 2021), which are in turn based on the IPCC (2006) and IPCC (2019a) good practice guidelines for national GHG reporting at Tier 1 level for soil emissions, Tier 2 level for animal emissions, and Tier 3 level for forestry carbon dynamics.
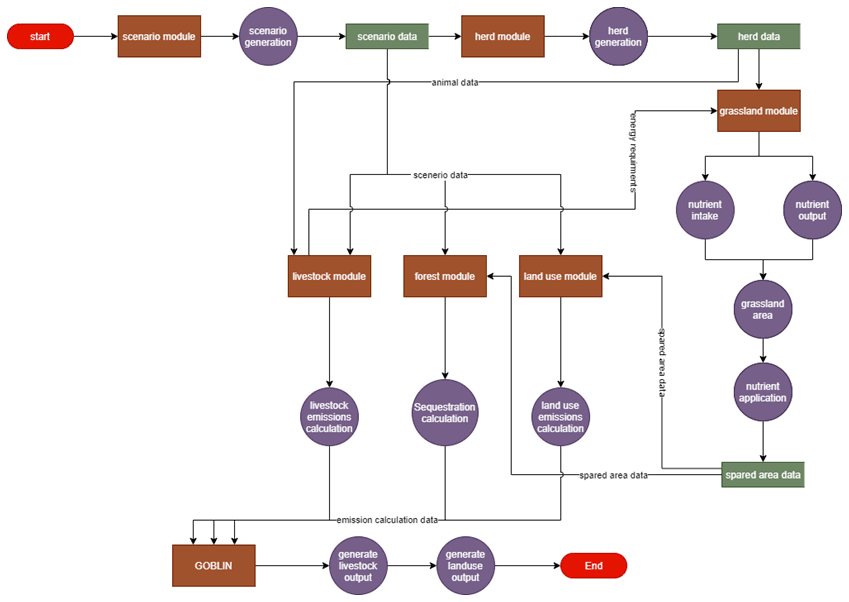
Figure 2GOBLIN data flow diagram. Arrows represent data flow. Modules are represented by brown rectangles, processes are represented by purple circles, and open-ended green rectangles represent data stores.
2.1 Modelling architectural overview
GOBLIN incorporates seven modules, displayed in a dataflow diagram (Pressman, 2010) in Fig. 2, some of which are derived from previous models on national grassland intensification (McEniry et al., 2013), farm LCA (Jones et al., 2014; Styles et al., 2018), and forest GHG fluxes (C. Duffy et al., 2020a). The flow of data is represented by arrows between interlinked modules (brown rectangles), processes (purple circles), and data stores ( open-ended green rectangles) (Fig. 2). The scenario, herd, grassland, livestock, land use, forestry, and integration modules included in GOBLIN reflect initiation and synthesis functions and data of the main activities and emissions arising within the AFOLU sector. The modules are run in sequential order, with subsequent modules relying on the output generated by previous modules.
Initially, the scenario generation module (1) varies the key input parameters utilised in the sub modules. The cattle and sheep livestock herd module (2) computes the national cattle herd and ewe flock from milking and suckler cow numbers and upland and lowland ewe numbers (input parameters) based on coefficients derived from the average national composition (Donnellan et al., 2018); see Table 3. The grassland module (3) computes the energy (feed) requirements of each animal cohort within the national herd, fertiliser application, and subsequently the area of grassland needed (depending on concentrate feed inputs, fertiliser application rates, and grass utilisation rate) and the grassland area free for other purposes (“spared grassland”). Emissions related to livestock production are computed in the livestock module (4) and rely on inputs from the cattle herd (2) and grassland (3) modules based on a Tier 2 IPCC approach (P. Duffy et al., 2020; IPCC, 2019a). Once the grass and concentrate feed demand has been calculated (detailed in subsequent sections) using the herd and grassland modules, the land use module (5) computes the remaining emissions from land uses related to forest, cropland, wetlands, and other land. The remaining LULUCF categories related to forest are captured in the forest module (6) and are utilised by the land use module (5). The scenario generation module provides the proportion of spared grassland to be converted to each alternative land use (forestry, rewetting, etc.). GOBLIN does not yet include a harvested wood products module, but the architecture anticipates this being included in subsequent versions based on harvestable biomass outputs from the forest module related tree cohort (species, yield class and age profile) and management practises. The sequential resolution of these modules allows for an accurate representation of biophysically resolved land use combinations in terms of land areas, production (meat, milk, crops, and forestry), and emissions.
2.2 Modelling application
Grass feed requirements are calculated based on the Tier 2 IPCC (2006) net energy requirements for livestock (NEfeed) related to animal cohort (c) and productivity (p) minus net energy received from supplementary (concentrate) feeds (NEsupp) and grass net energy density (DNE-grass) (Eq. 1). Subsequent calculation of N excretion (Nex) from animals and share of time indoors (IPCC, 2019a) enables average organic nutrient loading to grassland to be calculated. Organic nutrient loading is then combined with average synthetic fertiliser application rate (exogenous variable) to determine total N inputs (Ninput) and average grass yield (Ygrass) based on the grass yield function reported by Finneran et al. (2012). According to the grass utilisation coefficient (Ugrass), calibrated for baseline (2015) animal grass feed requirements and grassland area (A-BLgrass), the calculated required area of grassland is then subtracted from the grassland area reported in the baseline year (2015) to calculate spared grass area (A-Sgrass).
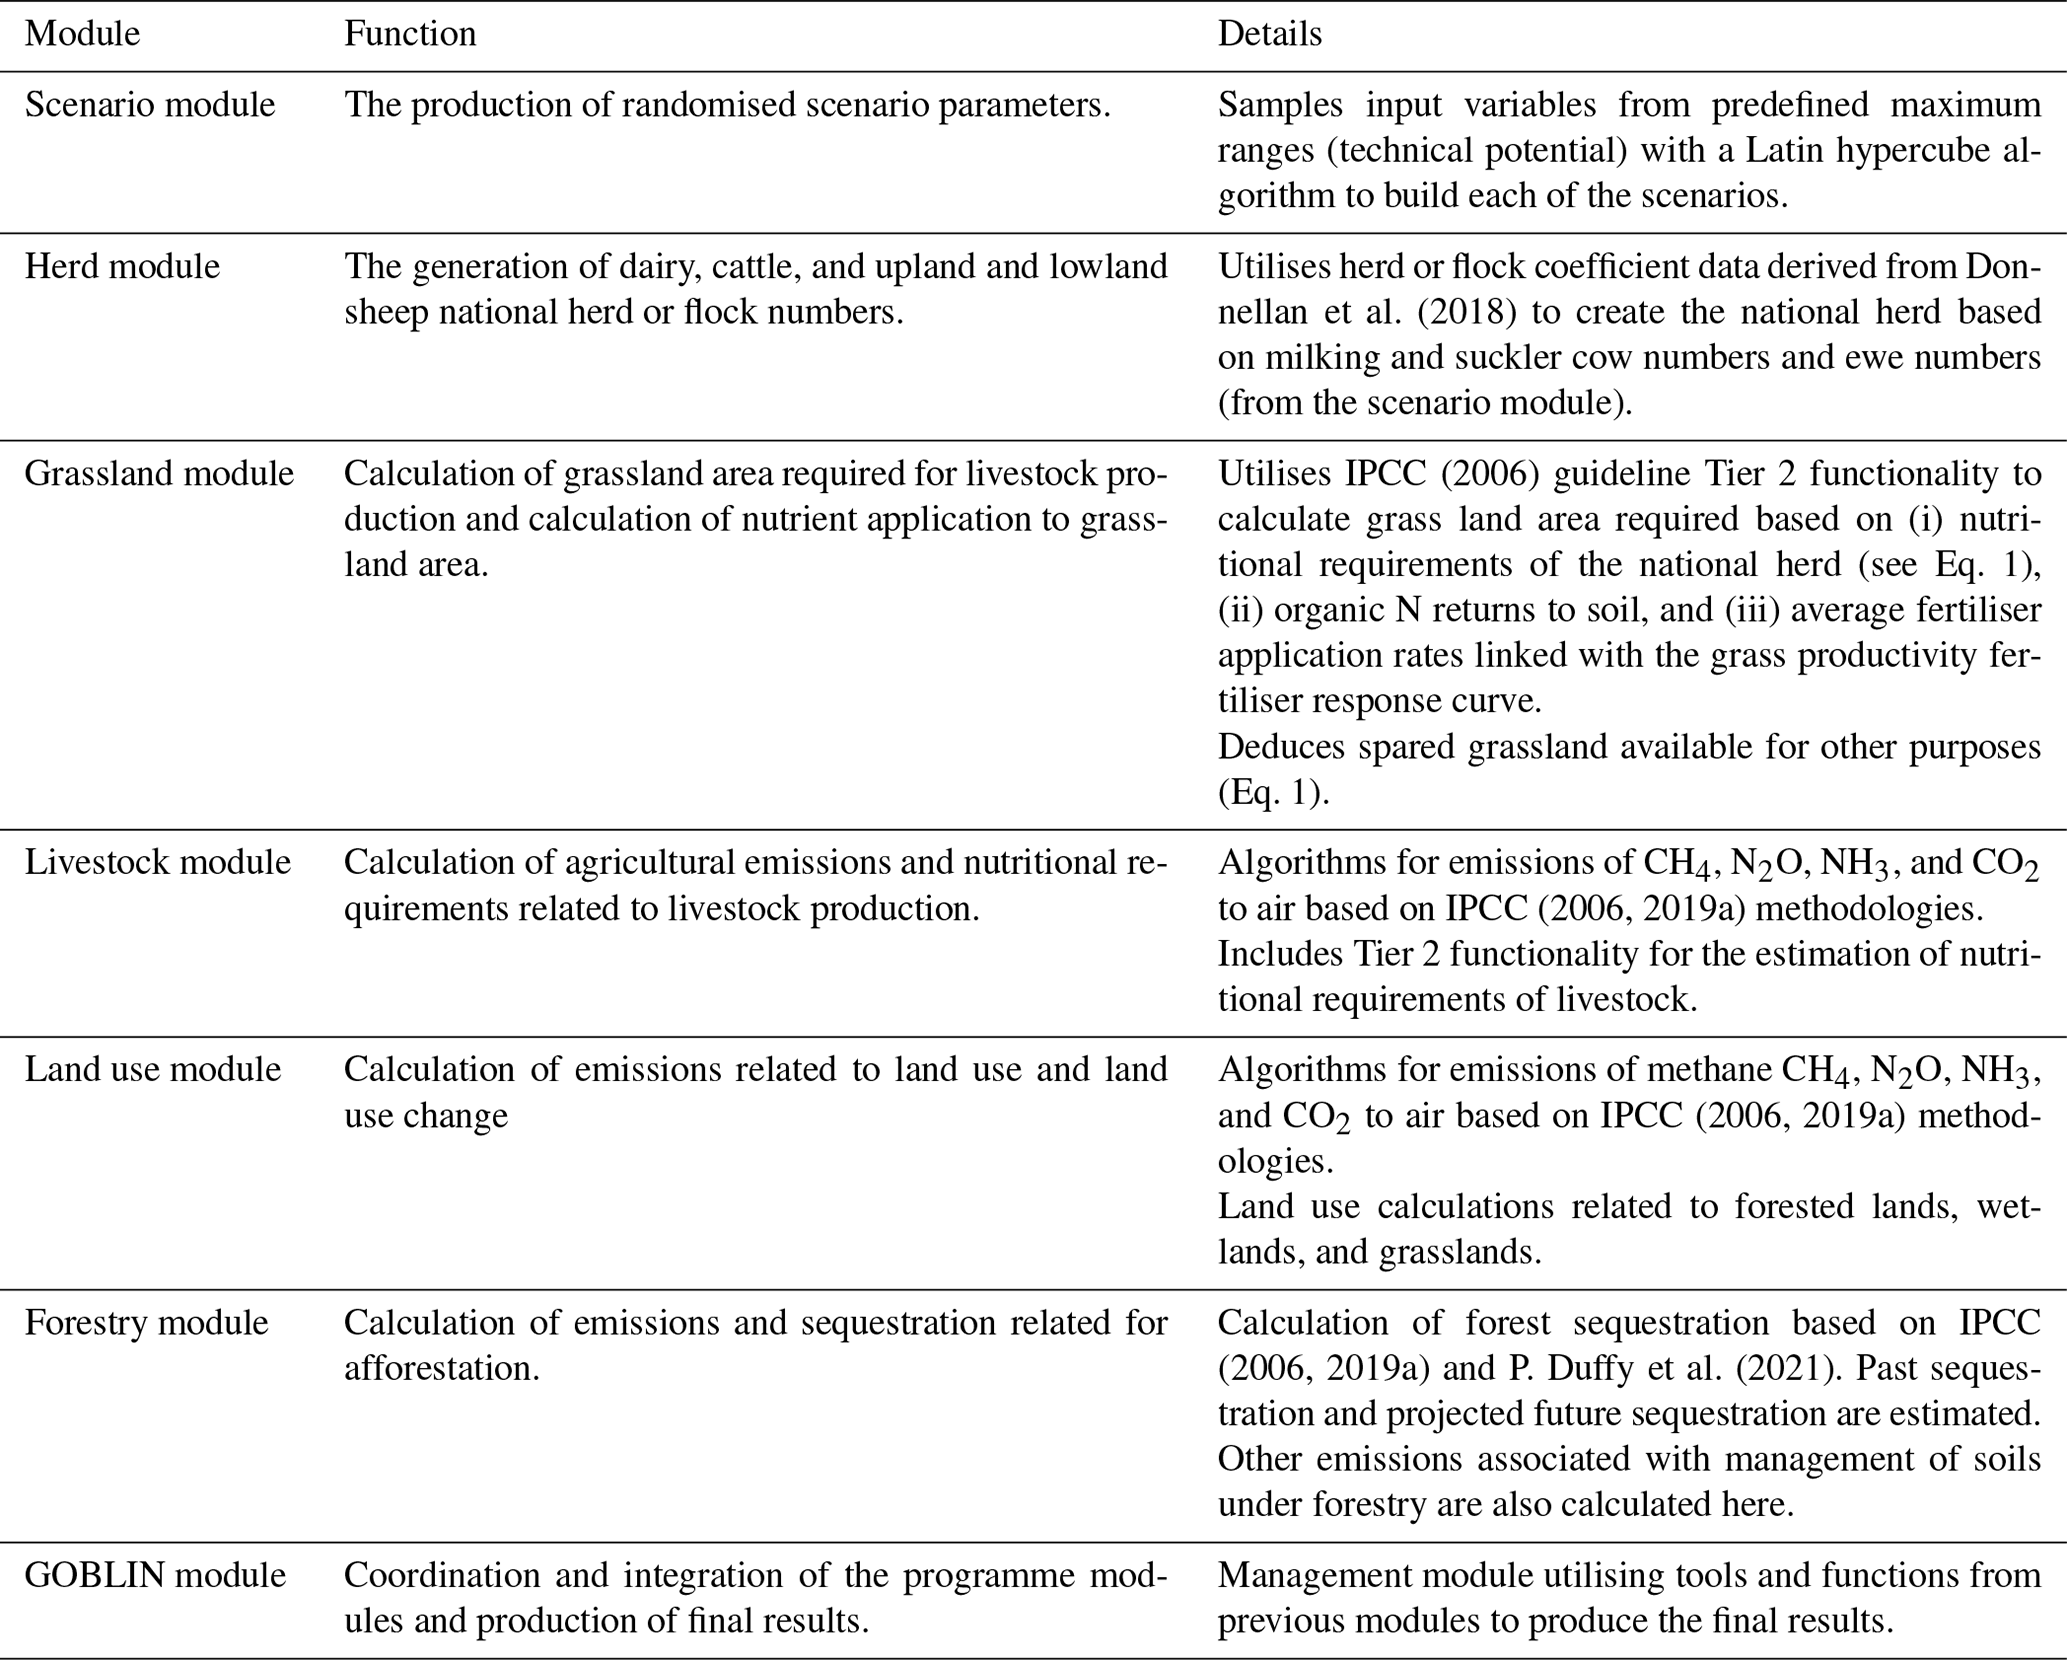
Spared grassland area is apportioned to various alternative land uses based on exogenous inputs via the scenario module. The GOBLIN integration module then combines outputs from the grassland, livestock, forest, and land use modules to calculate relevant GHG fluxes. Table 1 gives a brief description of the modules and their purpose. The following sections will elaborate on scenario generation, cattle herd building, grassland management, land balance, emissions, and forestry sequestration calculations.
Table 2Definitions and selected value range examples for key GOBLIN input parameters for the Irish system.

2.2.1 Scenario generation
There are 65 input parameters included in the global sensitivity analyses that influence the outputs of GOBLIN. Table 2 outlines the definitions, baseline values, and scenario ranges of the key input parameters. Categories related to productivity increases are designed to reflect efficiency gains resulting from adoption of mitigation technologies. The objective of the GOBLIN model is to identify which combinations of input variables are compatible with climate neutrality in the target year. With this number of input parameters (65) and the complexity of the relationships between them, it is impossible to study all combinations of parameters. To reduce the number of simulations while keeping a broad and unbiased exploration of the possible value ranges for these parameters, a Latin Hypercube sampling algorithm is utilised (McKay et al., 2000). This established sampling method allows the values taken by the input parameters in the scenarios to be distributed across plausible (technically possible) ranges and then utilised by downstream modules to generate results.
Table 3Coefficients used to compute animal numbers across cohorts based on milking and suckler cow numbers.

Animal cohort populations are calculated as a proportion of adult stock utilising the relevant cohort coefficient and are derived from Donnellan et al. (2018).
2.2.2 Cattle herd model
Calculation of national livestock numbers relies on coefficients relating animal cohorts to the numbers of milking and suckler cows (Donnellan et al., 2018). In terms of cattle production, dairy (milking) and beef suckler cow numbers are exogenous parameters bounded between floor and ceiling values (in this use case, 0 and 1.43 and 0 and 1.55 million head, respectively). A calving rate of between 0.81 and 1 for dairy cows and between 0.8 and 0.9 for suckler cows is used to derive the number of first-year and second-year male and female calves (48 % of male calves are under 1 year old, 44 % of male calves are between 1 and 2 years old, and 46 % of male calves are over 2 years old). The dairy and suckler heifers are then derived with a replacement rate of 0.23 and 0.15, respectively. Finally, the number of bulls is computed as a share of suckler cows. The dairy and beef herd are thus recomputed for different dairy and suckler cow numbers. Table 3 shows the coefficients utilised in the computation of national cattle and sheep herds for 2015 based on the number of milking and suckler cows and upland and lowland ewes.
Estimation of current average milk yield is derived from CSO (2018), and future milk yields are based on the Teagasc (2020b) dairy sector roadmap. The average milk yield ranges from 5049 to 5800 kg of milk per cow per year. Live weights are based on research conducted by O'Mara et al. (2007). Live weight gain of female and male calves are kept constant at 0.7 and 0.8 kg per head per day, respectively, and average baseline live weights for dairy cattle are assumed constant at 538, 511, 300, 290, 320, and 353 kg per head for milking cows, dry cows, heifers, female calves, male calves, and bullocks, respectively, based on farm LCA model default values (Soteriades et al., 2018). The same is assumed in relation to beef cattle, with the exception year 1 and 2 heifers, whose live weights range from 275 to 322 and 430 to 503 kg per head, respectively. Increased beef live weights are based on the Teagasc sectoral roadmap (Teagasc, 2020a). Live weights, live weight gain, and milk yield are used to calculate net energy requirements for specified animal cohorts (IPCC, 2006).

Figure 3Data flow and processing through the grassland module. Arrows represent data flow. Modules are represented by brown rectangles, processes are represented by purple circles, and open-ended green rectangles represent data stores.
2.2.3 Grassland management module
The purpose of the grassland module is to estimate the required area of land necessary to maintain the scenario-specific herds and flocks at a given yield and utilisation rate. National average grassland utilisation rate is calibrated at 57 % of grass productivity based on calculated grass uptake and total grassland area utilised in the baseline year (2015). The calibrated rate is between the average rate of 60 % reported by McEniry et al. (2013) and a rate of 53 % deduced from average grass dry matter (DM) utilisation report by Creighton et al. (2011) divided by average DM production reported by Donovan et al. (2021). The estimation of grassland area is contingent on establishing the energy requirements of the herd or flock and grassland fertilisation rates as described above. Figure 3 shows the data flow within the grassland module.
Grassland production is computed per major soil group (Gardiner and Radford, 1980; McEniry et al., 2013) from group 1 (highest productivity potential) to group 3 (lowest productivity potential). Each grass type has a different yield class (YC) based on its soil group. GOBLIN's grassland module deduces the area required to satisfy the livestock grass demand for each category of grass (pasture, silage, hay) for each YC (1, 2, 3) and year. The basic equation is as follows:
where Dland refers to area demand, grass refers to grass type, YC refers to grass YC based on soil group, and t refers to year. The parameter Sgrass refers to the grass supply, while Ygrass refers to the grass yield.
GOBLIN allocates the silage, hay, and grazed grass requirement at the year t (Sgrass,t) between soil groups based on the share of the soil group in the grass production at the reference year (2015) () as follows:
The grassland management module utilises a similar approach to the determination of grassland DM yield reported by McEniry et al. (2013) based on Finneran et al. (2011) as follows:
where f(Nrate) refers to the maximum yield response to fertiliser nitrogen rate from Finneran et al. (2012) in experimental fields, which is given as the following equation:
where is the manure excretion on pasture and is the manure excretion on pasture in the reference year. This term considers the influence of the livestock stocking rate on pasture fertilisation. For grassland other than pasture (hay and grass silage), . Nrate represents the nitrogen application (manure and synthetic application).
The remaining elements of Eq. (4) are yield efficiencyYC, and utilisationt, where yield efficiencyYC refers to the yield efficiency of each YC category (0.85, 0.8, and 0.7 for YC 1, 2, and 3, respectively) and utilisationt refers to the utilisation rate (calibrated as described above).
Once land use demand has been satisfied, the area available for land use change (Dland,available) is computed as follows:
Once the spared area (Dland,available) has been determined, it can then be allocated to alternative land uses.
The GOBLIN integration module coordinates the livestock and other agricultural emissions with LULUCF fluxes. The following subsections will elaborate on each of these in turn, beginning with the estimation of livestock and other agricultural emissions
3.1 Livestock emissions
This module utilises an adapted farm LCA model developed in previous studies of UK livestock systems (Soteriades et al., 2018, 2019b; Styles et al., 2015) to estimate environmental footprints. Algorithms for emissions of CH4, N2O, ammonia (NH3), and CO2 to air were applied to relevant activity data inputs. Enteric CH4 and manure management CH4 and N2O emissions were calculated using IPCC (2006, 2019a) Tier 2 equations and Tier 2 calculation of energy intake and Nex according to dietary crude protein (CP) intake. Enteric fermentation is based on a methane conversion factor (Ym) value of 6.5 % (4.5 % for lambs) applied to gross energy intake calculated by cohort as previously described and an average feed digestibility of 730 g kg−1 for Irish cattle (P. Duffy et al., 2020). Soil N2O emissions are derived from Nex during grazing, and the application of synthetic fertiliser (as urea or calcium ammonium nitrate) and manure spreading. Indirect emissions of N2O were calculated based on NH3 emission and N-leaching factors from the most recent national emission inventory (P. Duffy et al., 2021).
Emissions of CH4, NH3, and direct and indirect N2O from housing and manure management were calculated from total Nex indoors based on the proportion of time animals are housed, housing type, and emission factors specific to each manure management system (IPCC, 2019). The fraction of time spent indoors for milking cows, suckler cows, heifers, female calves, male calves, bullocks, and bulls are, respectively, 0.43, 0.39, 0.36, 0.48, 0.07, and 0.43 (O'Mara, 2007). Manure storage NH3-N emission factors (EFs)of 0.05 and 0.515 of total ammoniacal N (TAN) for tanks (crusted) and lagoons, respectively, were taken from (Misselbrook et al., 2010), assuming 60 % of N excretion is TAN (Webb and Misselbrook, 2004), and applied to 92 % and 8 % of managed cattle manures, respectively (O'Mara, 2007).
3.2 Soil emissions
Emissions from agricultural soils originate from mineral fertilisation, manure application, and urine and dung deposited by grazing animals. The average annual mineral N fertilisation rate across all grassland is 70 kg ha−1 in the baseline (McEniry et al., 2013). Direct N2O emissions for manure spreading are calculated based on IPCC (2006) using an emission factor of 0.01 kg N2O per kilogram of N. The NIR (P. Duffy et al., 2021) utilises country-specific disaggregated emissions factors from N2O–N in relation to direct emissions from faeces and urine, which in aggregate equate to 0.0088 of Nex, which is 56 % lower than that of the IPCC (2006) but 55 % higher than the IPCC (2019a) refinement. A country-specific 10 % leaching of fertiliser residue and grazing N inputs to water is also applied (P. Duffy et al., 2021). However, it should be noted that while this leaching factor is considered “representative of Irish conditions” (P. Duffy et al., 2021), this fixed factor does not allow for variation according to N loading rates. In addition, an NH3-N emissions factor of 0.06 was applied to grazing TAN deposition (Misselbrook et al., 2010). Indirect N2O–N emissions were calculated as per IPCC (2019a): 0.01 of volatilised N, following deposition, and 0.01 of leached N. Other sources (residues, cultivation of organic soils, mineralisation associated with loss of soil organic matter) are kept constant in this version of the model, as these represent minor emission sources. NIR (P. Duffy et al., 2021) country-specific emissions factors relating to synthetic fertiliser direct emissions were applied. These emissions factors correspond to 0.014, 0.0025, and 0.004 kg N2O per kilogram of N applied, respectively, for CAN, urea, and urea + n-butyl thiophosphoric triamide. The fraction of synthetic fertiliser N that volatilises as NH3 and NOx (kilogram of volatilised N per kilogram of applied N) is also disaggregated by type (0.45, 0.097, and 0.02, corresponding to urea, urea + n-butyl thiophosphoric triamide, and CAN, respectively). These values are based on updated IPCC values from Misselbrook and Gilhespy (2019).
3.3 Land use module
The land use module coordinates a range of emission calculations and allocation of spared land between different land uses based on input parameters defined in the scenario module, as outlined in the subsections below.
3.3.1 Land use allocation
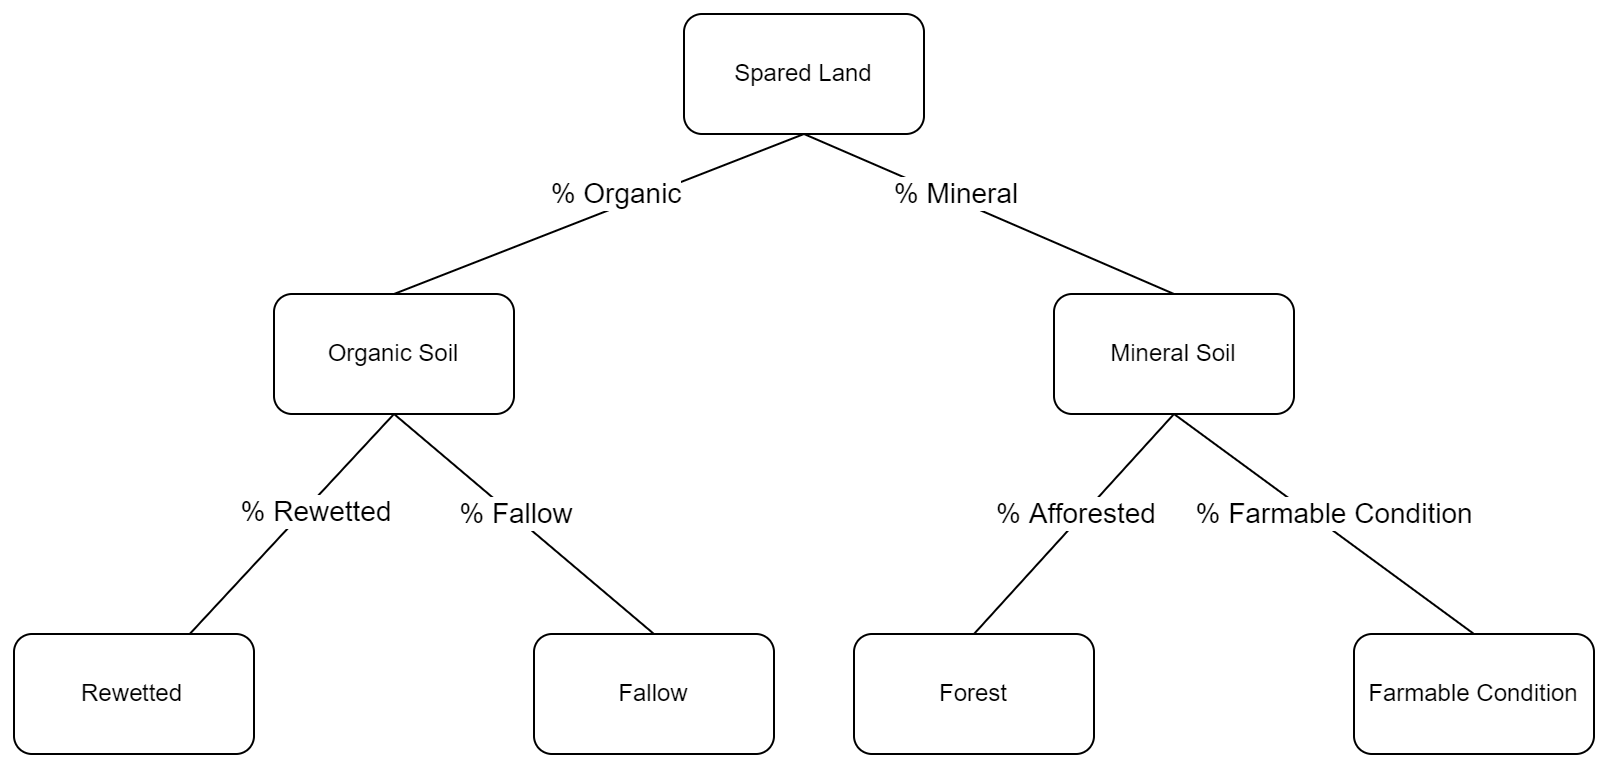
Spared land is computed in the grassland module. The proportion of spared area that is organic or mineral soil is defined by the scenario input parameters. The proportion of spared area that is organic is limited by the total organic grassland area in 2015. Any spared area that exceeds the area of organic grassland soil is deemed mineral soil by default. The spared organic and mineral soil areas are then assigned various land uses. Drained organic soils are either rewetted or converted to fallow (drainage maintained) depending on scenario input regarding fraction of spared organic soils rewetted. For spared mineral soil areas, the proportion of area afforested is determined by the scenario input values. Spared area that has not been allotted to afforestation is said to be left in “farmable condition”, in line with subsidy incentives. Figure 4 summarises the apportioning of spared area in GOBLIN.
3.3.2 Forest emissions
Additional land use emissions not accounted for in the forest sequestration module are calculated in the land use module. These emissions relate to drainage and rewetting of organic soils, biomass burning, land use conversion, and deforestation. The CO2, N2O, and CH4 emissions from drained organic forest soils and drain ditches are based on the IPCC good-practice guidelines (IPCC, 2006) and the 2013 wetlands supplement (Hiraishi et al., 2014). In addition, the NIR (P. Duffy et al., 2020) breaks these organic soils into nutrient-rich and nutrient-poor organic soils. The default emission factor of 2.8 is applied to nutrient-rich organic soils; however, P. Duffy et al. (2020) utilise a country-specific emission factor of 0.7 on organic soils classed as poor. The CH4 emissions from drained organic soils and drained ditches are also based on default emission factors from the IPCC wetland supplement (Hiraishi et al., 2014), and country-specific parameters were derived from the NIR (P. Duffy et al., 2020).
3.3.3 Grassland emissions
Grassland emissions accounted for in the land use module relate to drainage and rewetting of organic soils, biomass burning, and land use conversion. A Tier 1 methodology from the IPCC (2006) is used to estimate the direct carbon loss from drainage of organic soils. The default emissions factor of 5.3 for shallow-drained managed grassland soils for cold temperate regions is derived from the 2013 wetlands supplement (Hiraishi et al., 2014). The estimation of emissions from the drained inland organic soils derives from the 2013 wetlands supplement (Hiraishi et al., 2014). The default emission factor of 4.3 kg N2O–N yr−1 for nutrient-poor, drained grassland from the 2013 wetlands supplement (Hiraishi et al., 2014) is utilised. Tier 1 IPCC (2006) methodology is used to estimate CO2 removals (from the atmosphere) via uptake by soils, CO2 losses from dissolved organic carbon to water, and CH4 emissions. Emissions factors are again derived from the 2013 wetlands supplement (Hiraishi et al., 2014). Finally, emissions of CH4 and N2O from the burning of biomass are estimated utilising the IPCC (2006) Tier 1 approach.
3.3.4 Wetland Emissions
Wetland emissions include CO2 from horticultural peat extraction, drainage, rewetting, and burning; CH4 and N2O from drainage and burning; and CH4 from rewetting. The NIR (P. Duffy et al., 2020) includes emissions related to the extraction and use of peat products under the category of “horticultural peat”. Data related to the quantities of exported peat are reported by United Nations Commodity Trade Statistics Database (UN, 2016). To calculate off-site emissions from peat products, GOBLIN utilises a Tier 1 methodology (IPCC, 2006) to estimate carbon loss by product weight.
Carbon stock changes in biomass are determined by the balance between carbon loss due to the removal of biomass when preparing for peat harvesting, and the gain on areas of restored peat lands (P. Duffy et al., 2020). Non-CO2 emissions related to drainage and rewetting are CH4 and N2O. CH4 emissions are estimated in accordance with the 2013 wetlands supplement (Hiraishi et al., 2014) and require data on the area impacted by drainage and the density of drainage ditches. Annual direct N2O–N emissions from drained organic soils are estimated utilising a Tier 1 approach based on the IPCC (2006) methodology and a default emission factor of 0.3 kg N2O–N yr−1.
GOBLIN also calculates emissions from CH4 and N2O from biomass burning. The value used in the NIR (P. Duffy et al., 2020) to represent the mass of fuel available for burning is 336 t ha−1 DM. The emissions factor values utilised for CO2, CH4, and N2O correspond to 362, 9, and 0.21 g kg−1 DM burned, respectively.
3.3.5 Cropland emissions
Cropland emissions are estimated utilising a Tier 1 approach (IPCC, 2006). CO2 emissions include emissions related to land use transitions from grassland or forested land to cropland and from biomass burning. N2O and CH4 are also related to biomass burning. Emissions of CO2, CH4, and N2O from the burning of crop biomass are also estimated utilising the IPCC (2006) Tier 1 approach.

Figure 5GOBLIN forest module calculation methodology. Arrows represent data flow. Modules are represented by brown rectangles, processes are represented by purple circles, and open-ended green rectangles represent data stores.
3.4 Forest management
Irish forest cover accounts for about 11 % of total land area (DAFM, 2018). Conifers make up over 71 % of the forest estate, the main species being Sitka spruce (Picea sitchensis (Bong.) Carr.) (SS), which comprises over 50 % of total forest land area. In 2017, broadleaf species made up almost 29 % of total forest land area (DAFM, 2018; C. Duffy et al., 2020a and b). However, given that the historic rate of broadleaf inclusion within afforestation was less than 10 % for significant periods (DAFM, 2020b), GOBLIN utilises an aggregate value of 20 % broadleaf inclusion to represent historic afforestation. Given the complexity of representing the current forest estate and simulating future afforestation and reforestation, the forest module is split into two containers: the old forest container (OFC) and the new forest container (NFC). The OFC estimates sequestration from afforestation from 1922 until 2025 and is used to determine the age profile of standing forest. After 2025, the OFC no longer adds area to the model, but continues calculation of growth (carbon sequestration) and harvest (terrestrial carbon removal) in pre-existing forested area until the end of the simulation has been reached (2050 in our example).
From 2025 onwards, sequestration from afforestation is calculated in the NFC utilising annualised afforested areas derived from the target year's spared area calculated in the grassland management model and shares of that area going to forest types (scenario module). The NFC computes sequestration from afforestation from 2025 to the end point (target year) of the simulation. The results of the OFC and NFC are added together to calculate total net sequestration in forests. The purpose of this two-step calculation is to save system resources. Net sequestration in the existing forest estate only needs to be calculated once as it remains the same across different scenarios irrespective of changes in the afforestation rate. As such, we utilise the OFC a single time, adding the static results to the variable output from each scenario generated in the NFC.
Figure 5 illustrates the flow of data through the forest model. The brown rectangles represent entities, mainly conifer and broadleaf, for old and new forest. The purple circles represent processes, while the green rectangle represents a common data store. The old and new forests are kept in separate containers before being aggregated. To estimate the various elements (sequestration from biomass, organic and mineral soil emissions, dead organic matter, etc.) for the forest estate, a matrix approach is adopted. For each element in the forest model, a value matrix is established based on the age of the forest stand. Stand age is then utilised to establish the total biomass, dead organic matter, and emissions from organic soils. Once the final matrix has been established, it is aggregated into a single vector with a single cell per year. At this point, any further annual additions or subtractions that need to be made are factored into the model. For further detail on the calculation of biomass increment, DOM, and organic and mineral soil emissions refer to C. Duffy et al. (2020a).
The main purpose of the GOBLIN model is to provide an evidence base for climate action in Ireland's AFOLU sector that is aligned with existing GHG accounting procedures that will ultimately be used (with refinements through time) by policy to track progress towards climate neutrality. Acknowledging the significant scientific uncertainty around many AFOLU fluxes, the most appropriate manner to validate GOBLIN in relation to its core purpose is to test how well it replicates NIR fluxes from the same activity data. These activity data are largely input into GOBLIN in the same format as for the NIR, with some differences relating to the simulation sequence, most notably for animal cohort numbers, which are derived from milking cow, suckler cow, and ewe numbers. Therefore, to validate national cattle herd estimations (accounting for the vast majority of livestock emissions), outputs from the herd module derived from Donnellan et al. (2018) coefficients were compared with NIR activity input data from 1990 to 2015 (Fig. 6). The coefficients utilised in GOBLIN are derived from recent data, and thus the accuracy of total cattle number estimations increases through time, converging in 2015.
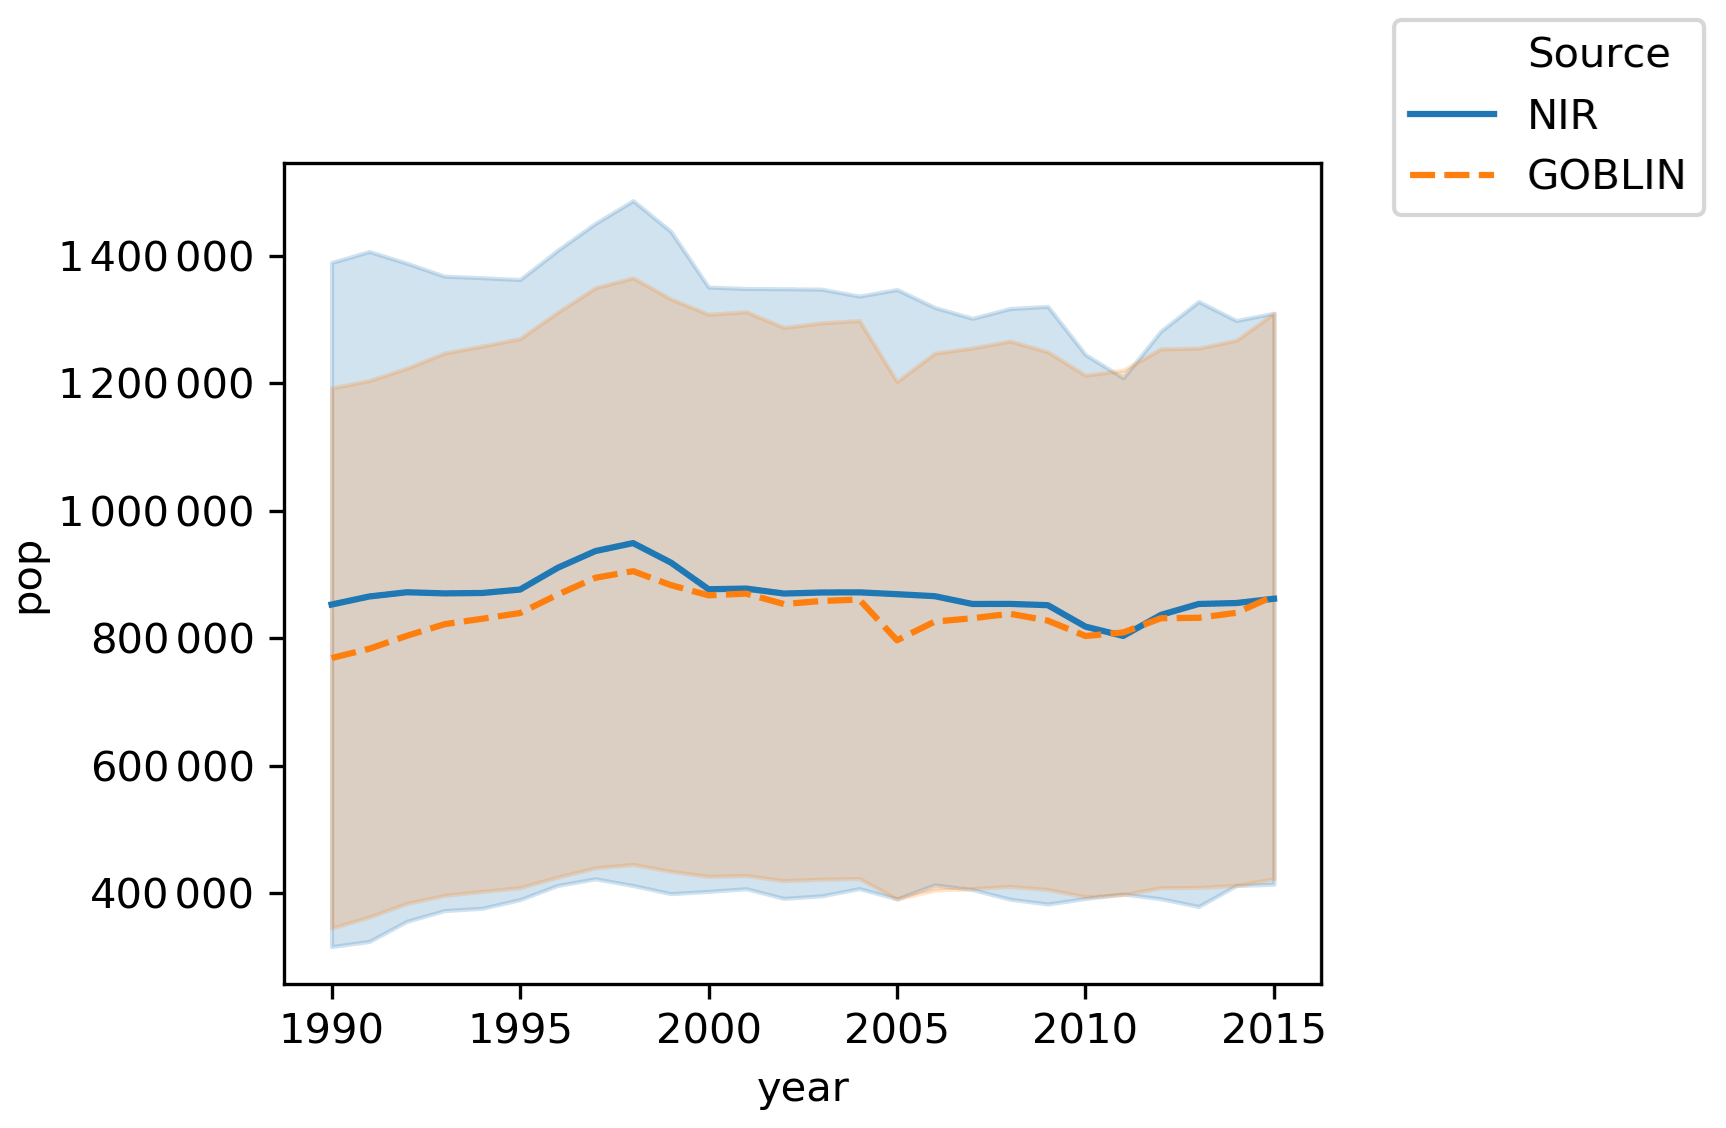
Figure 6Average cattle livestock population (lines) and standard deviation among sub-groups over time (shaded areas) input into the national inventory report (NIR) and generated by the GOBLIN herd module from milking and suckler cow numbers.
Table 4Ireland-specific emissions factors derived from national inventory reporting (NIR) utilised in GOBLIN modelling.
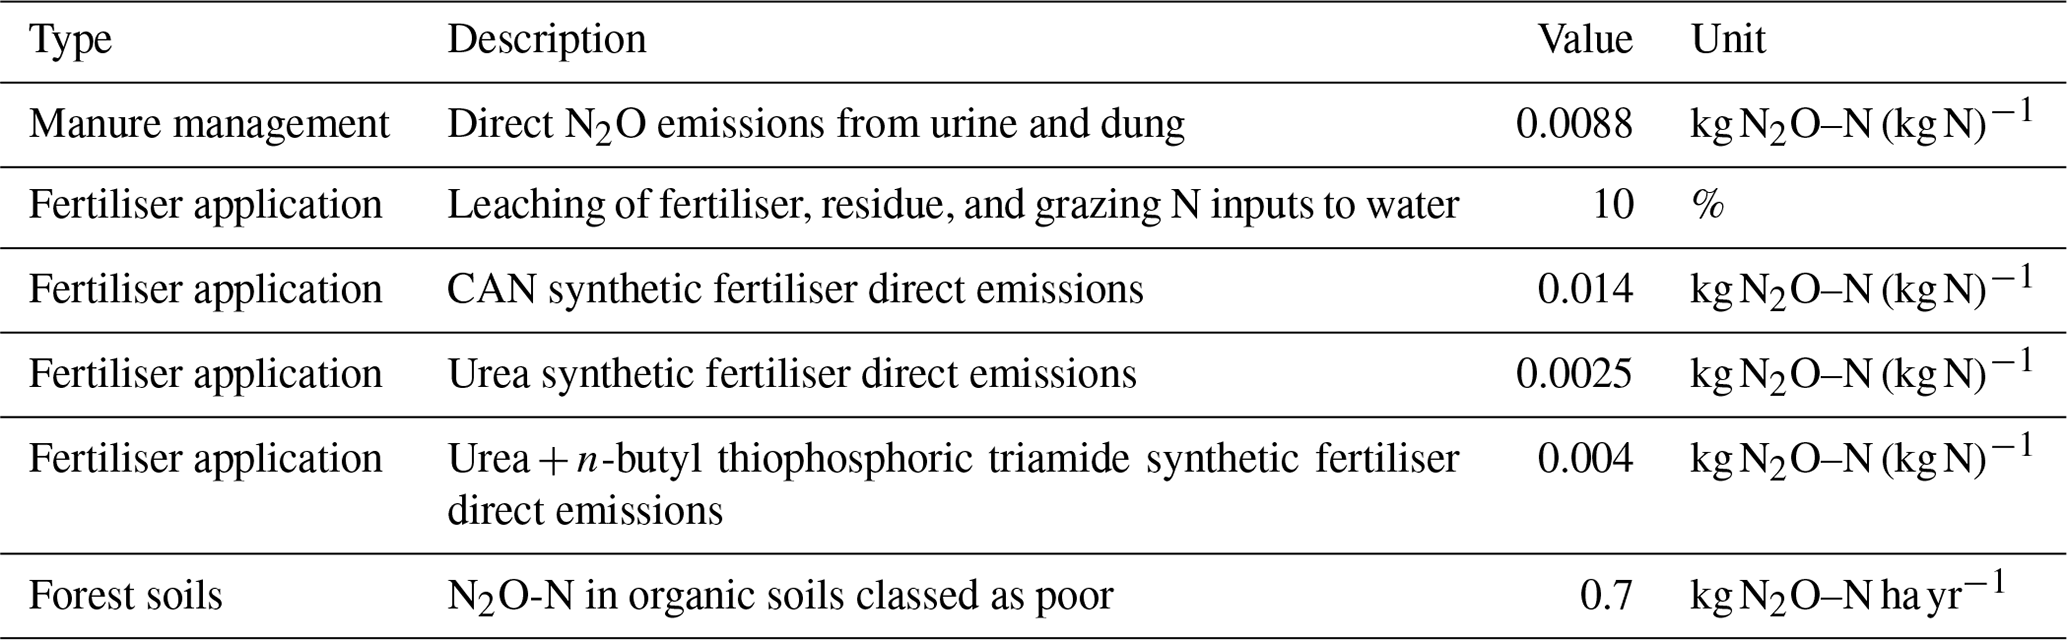
GOBLIN applies a range of IPCC default and Ireland-specific emissions factors in line with the NIR. The EPA has implemented a detailed quality control and assurance procedure for Ireland's NIR reporting. This includes auditing and external reviews of the agriculture sector and the emissions trading scheme (P. Duffy et al., 2021). Table 4 shows the complete list of Ireland-specific emissions factors utilised.

Figure 7Comparison of land use GHG fluxes computed by GOBLIN with those reported in national inventory reports and derived from the same activity data for 1990 to 2015.
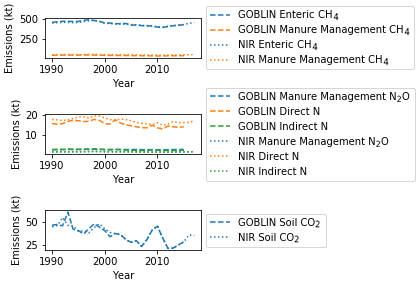
Figure 8Comparison of agricultural GHG fluxes computed by GOBLIN with those reported in national inventory reports and derived from the same activity data for 1990 to 2015.
To assess whether or not GOBLIN has achieved its goals, validation of emission and removal calculations for livestock production and land use (change), as well as forest biomass calculations, were carried out utilising real-world activity data supplied by the Central Statistics Office (CSO). These activity data are also input to the NIR (with some minor differences relating to derived variables for simulation purposes) so that GOBLIN should generate almost identical time series of emissions and removals as the NIR using past input data. GOBLIN outputs over 1990 to 2015 were compared with NIR outputs over the same time period using CRF files dating back to 1990. Figures 7 and 8 illustrate the validation of GOBLIN's replication of NIR flux accounting across major emissions and removals sources.
Beginning with land use and land use change (Fig. 7), solid lines represent CO2, CH4, and N2O emissions modelled in GOBLIN, while the dashed lines represent equivalent emissions reported in the NIR. Absolute emission levels and trends calculated by GOBLIN very closely match those of the NIR, with the most notable deviation arising for forest sequestration (representing the complex Tier 3 modelling of fluxes, sensitive to compound estimates of stand age profiles across hundreds of land parcels). Figure 8 shows validation of agricultural emission sources. Enteric and manure management CH4 from GOBLIN and the NIR are almost identical, while CO2 and N2O emissions levels and trends are very similar. This validation specifically indicates that emission factors, land area calculations, forest volume increments and harvest removals, and animal feed intake calculations derived from raw input data are in line with NIR methodology, providing confidence in scenario extrapolations based on variations in these input data.

To demonstrate and explore the critical functions of GOBLIN, several scenarios were analysed to reflect national-level GHG reductions within the AFOLU sector (Table 5). As set out in Ireland's Climate Action Bill (2021), Ireland must achieve a 51 % emission reduction by 2030. Given that agriculture makes a significant contribution to the national emissions profile (DAFM, 2020a), the illustrative scenarios produced as part of this model summary reflect potential emissions reduction pathways. In terms of animal numbers, all scenarios reflect reductions in dairy cattle, beef cattle, and sheep numbers of 10 %, 50 %, and 50 %, respectively, by 2050. In terms of land use, all scenarios, with the exception of scenario 4, assume at least the baseline (recent average) afforestation rate continues to 2050 (the average afforestation rate was 6664 ha yr−1 between 2006 and 2017; C. Duffy et al., 2020a). All annual afforestation rates continue to 2050, with zero afforestation assumed after 2050, and are based on a 70:30 conifer:broadleaf mix.

Figure 9Summary of agricultural CH4, N2O, and CO2 emissions from enteric fermentation, manure management, direct and indirect N2O sources, and synthetic fertiliser application to soils.
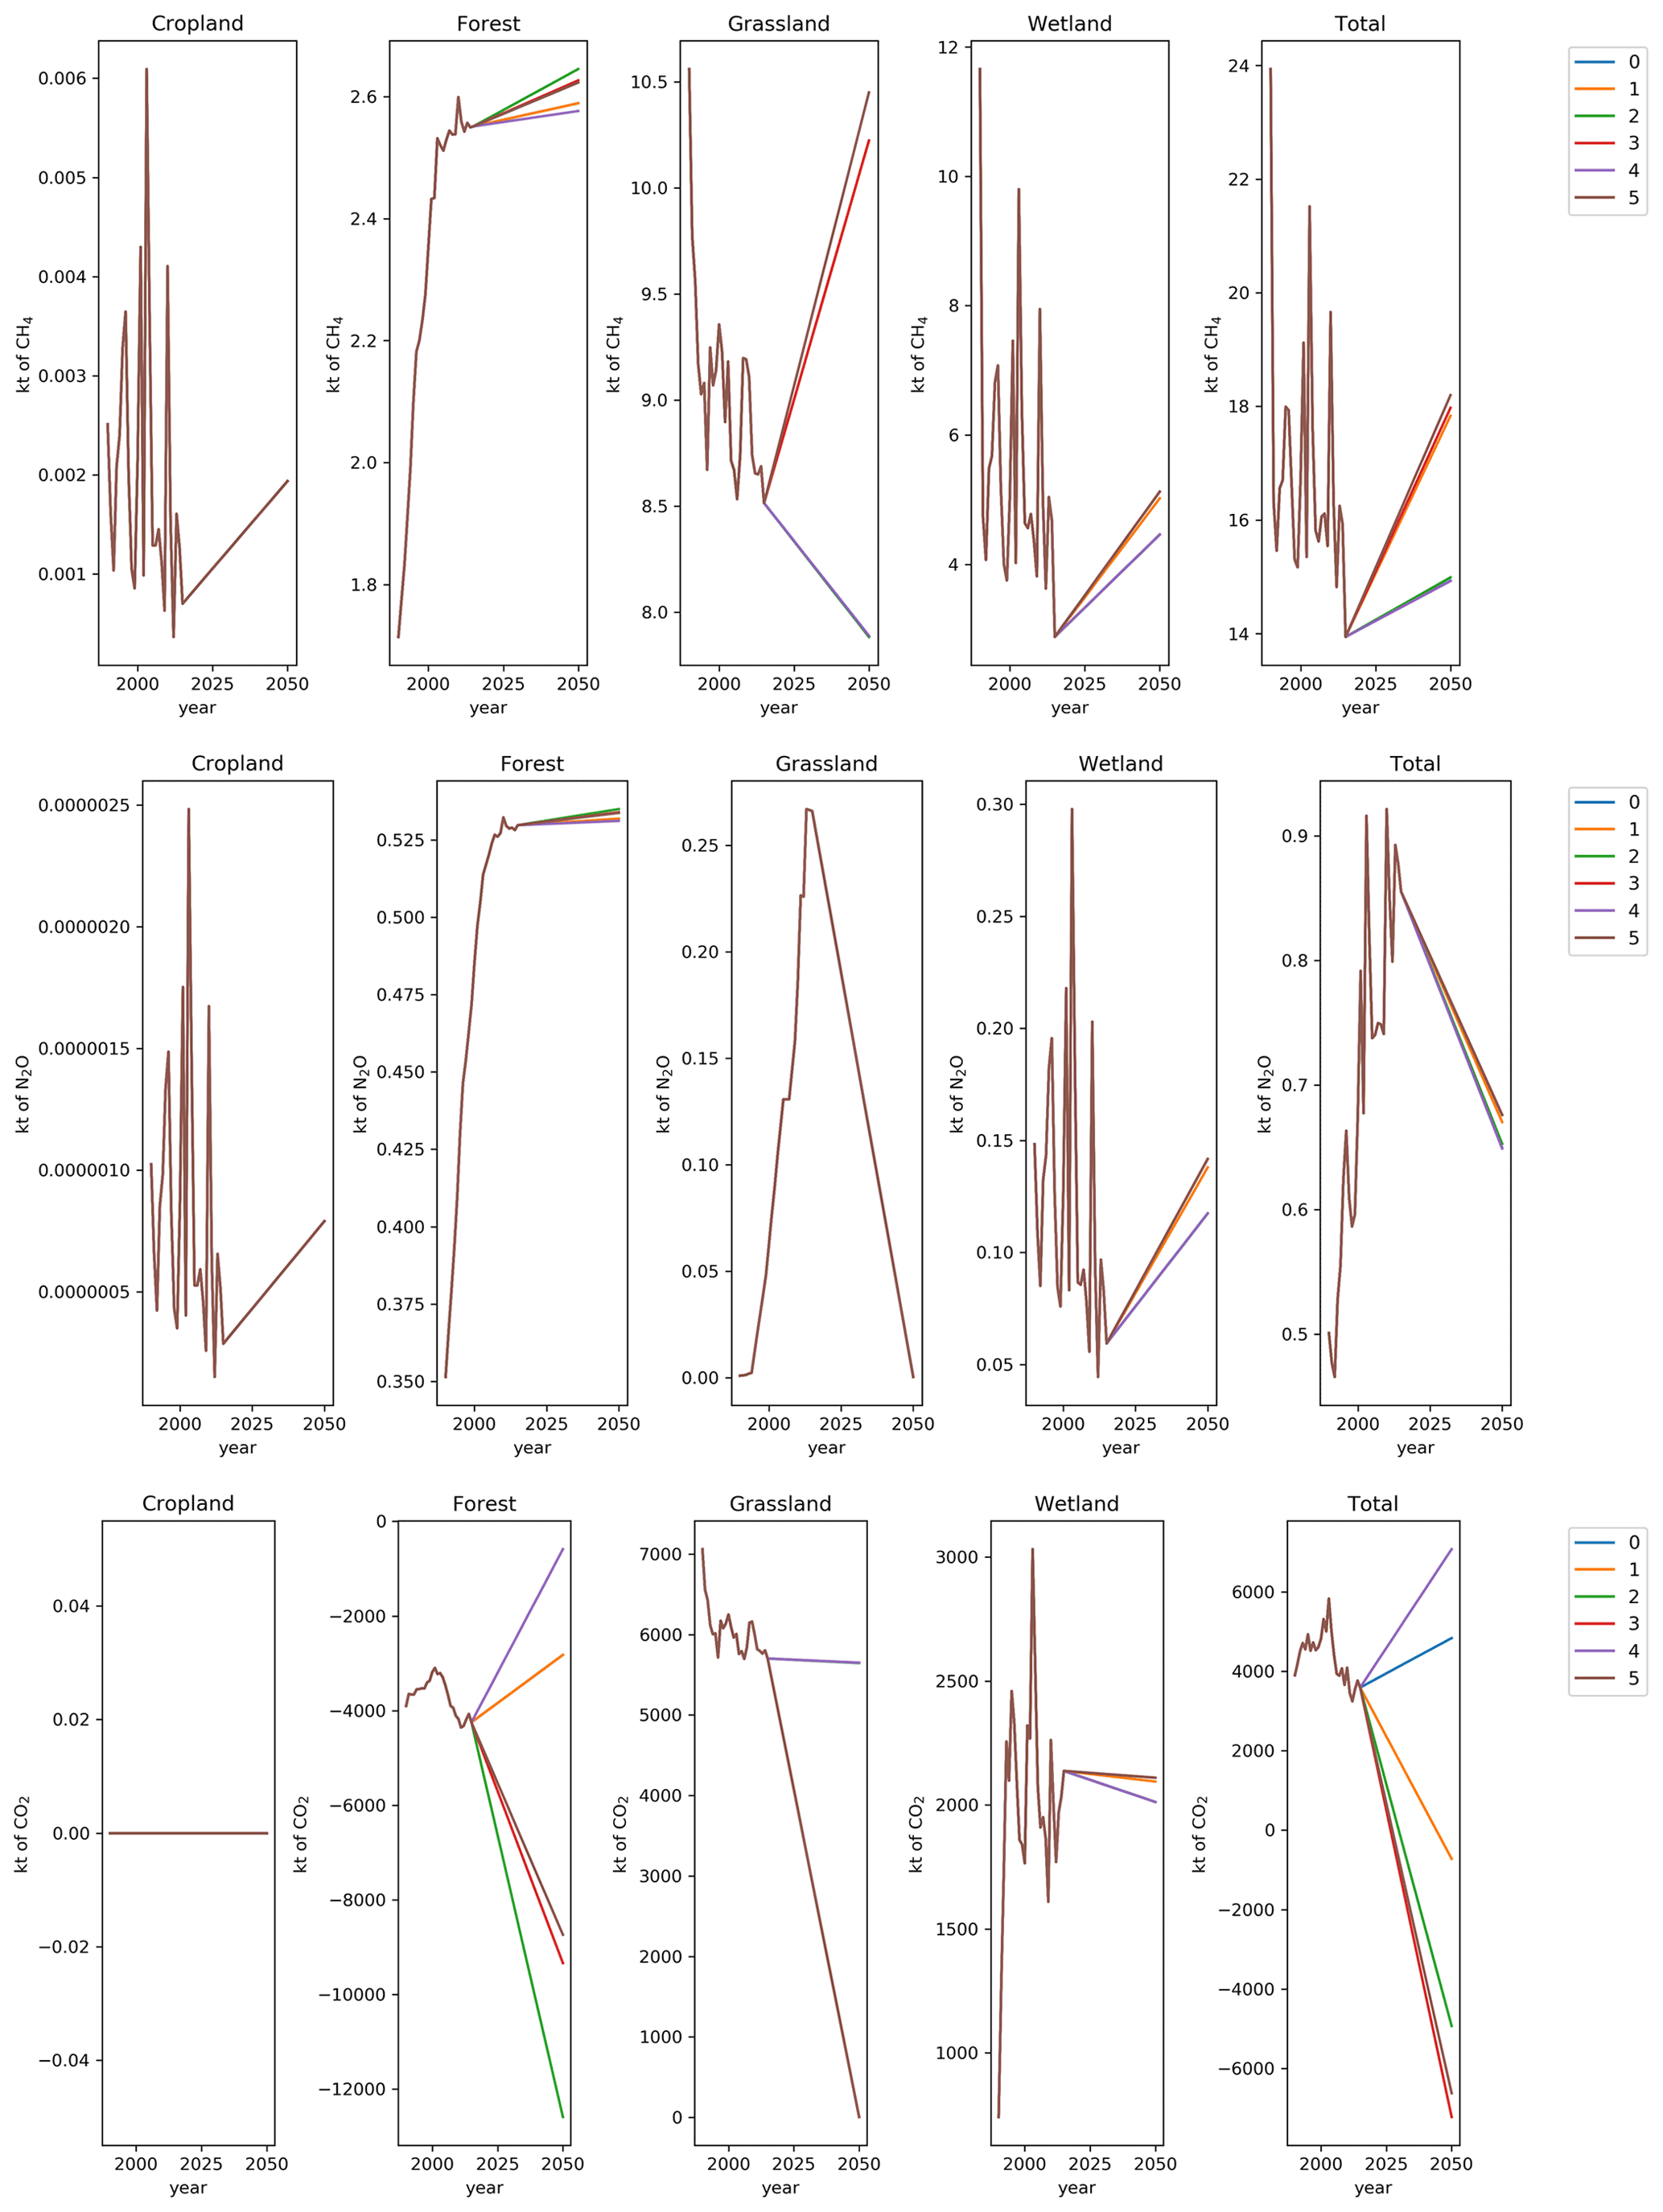
Figure 10Summary of agricultural CH4, N2O, and CO2 fluxes across cropland, forest, grassland, and wetland land uses.
Figures 9 and 10 present the main AFOLU GHG fluxes. Firstly, the agricultural emissions (Fig. 9) illustrate the results for CH4 emissions from enteric fermentation and manure management, N2O results from manure management and other direct and indirect N2O emission pathways, and finally CO2 emissions from fertiliser application to soils. Emissions related to livestock are slightly higher in scenarios that have increased production related to milk and beef output than scenarios with default production estimates.
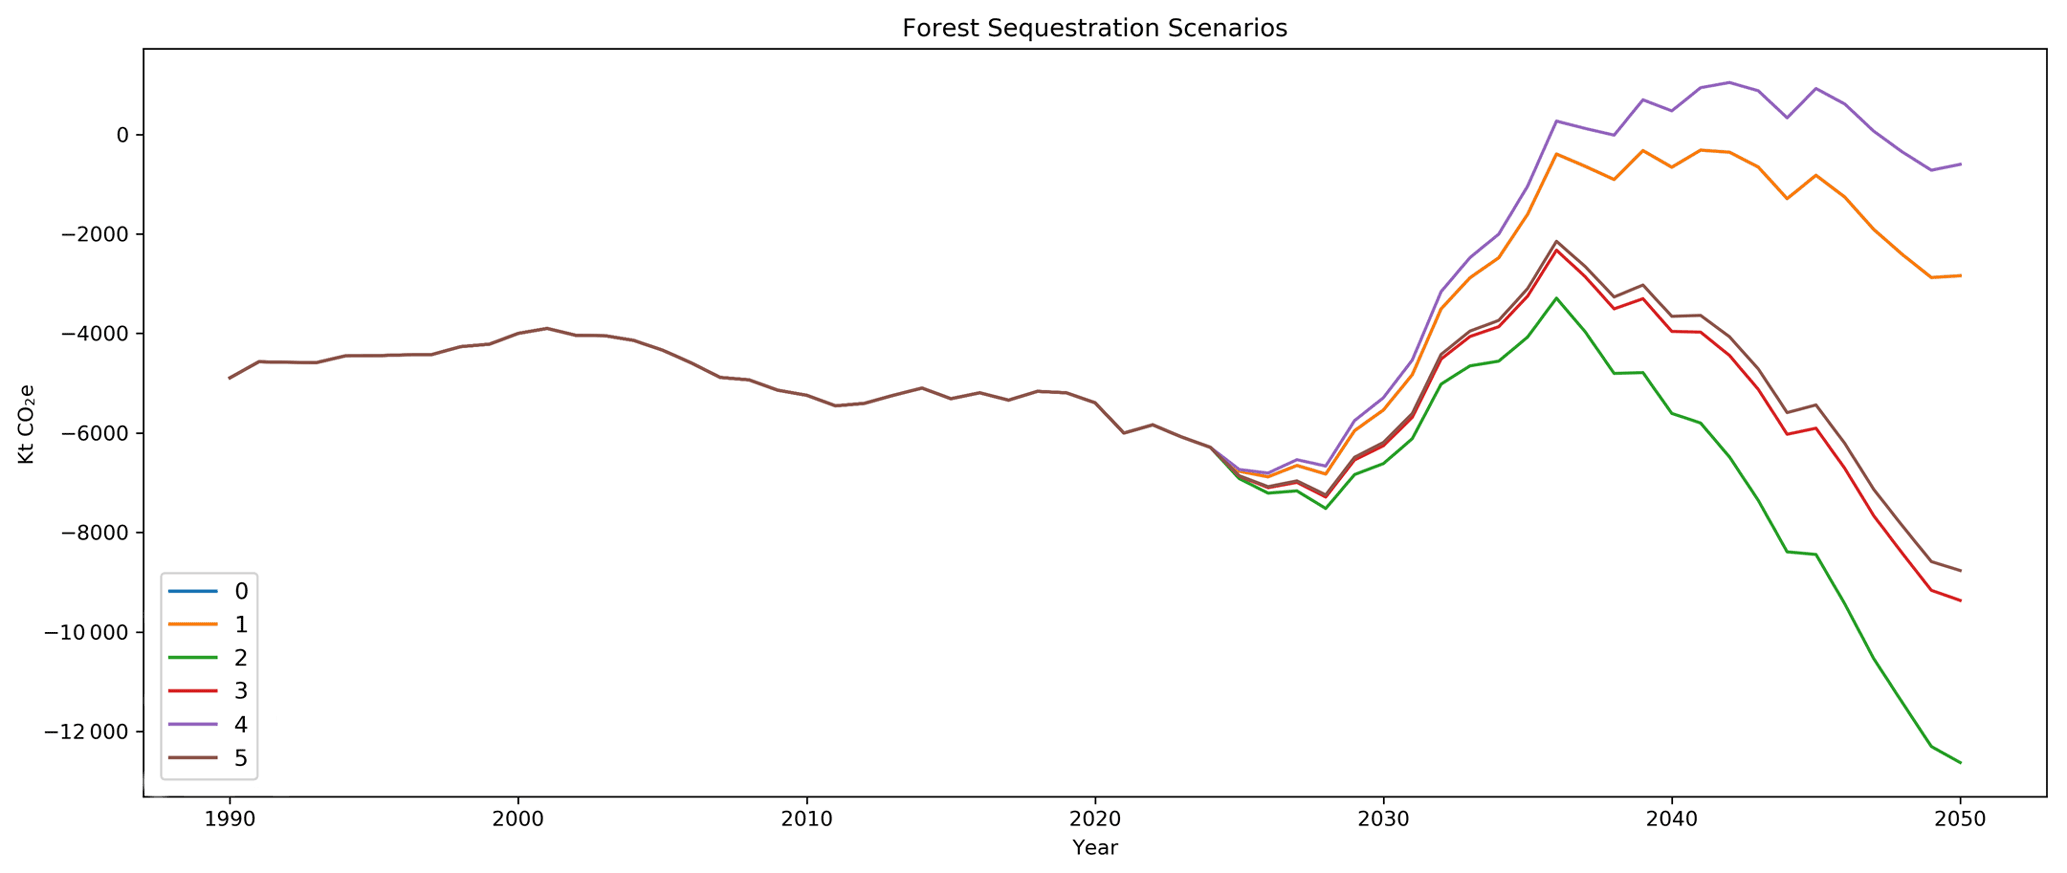
Figure 11Net marginal GHG removals (accounted for as CO2e balance) from forestry between 1990 and 2050 across scenarios.
Figure 10 illustrates land use emissions related to CH4, N2O and CO2. Firstly, we examine CH4 emissions from land use and land use change. The changes relative to the baseline year are as a result of a decrease in grassland area and changes in forest and wetland areas. Changes in grassland CH4 result from reduction in animal numbers, rewetting of organic soils and removal of production from organic soils. Relative to scenario 0, the straight animal reduction scenario, there is a 19 %, 20 % and 22 % increase in CH4 emissions in scenarios 1, 3 and 5, respectively largely owing to rewetting of drained organic soils. These increases are largely observed in the grassland category, with additional emissions in the wetland and forest categories. In the wetland and cropland categories, an increase is observed relative to the baseline year. This is explained by the utilisation of a multi-year average to estimate the burned area, this average is higher than the baseline year, as such emissions related to burning in the target year are higher.
Secondly, we examine N2O emissions related to land use and land use change. Relative to scenario 0, we can observe a 3 %–4 % increase in emissions for scenarios 1, 3, and 5. The increases in emissions from wetland areas are related to the rewetting of previously drained soils. Again, we can see that cropland emissions increase; however, this is again a reflection of burned area assumptions. The next noticeable difference is in terms of grassland N2O emissions, which appear to fall dramatically. Past N2O emissions in this category are driven largely by conversion of modest amounts of forested land to grassland. As the model assumes land is converted from grassland to other uses, and not the other way around, the emissions in this category drop significantly. Relative to scenario 0, emissions in scenarios where rewetting takes place increase by 20 %. As there are no changes to cropland, emissions remain constant among scenarios, the increase relative to the baseline year is again explained by assumptions regarding the burned area.
Finally, Fig. 10 presents the CO2 emissions from land use change. Emissions related to grassland drop to less than 0.1 % relative to scenario 0 where rewetting has taken place (scenarios 1, 3 and 5). Regarding forestry, Fig. 10 highlights the expected value in 2050, drawing a line linearly from 2015 to 2050. As expected, sequestration potential is greater at higher levels of afforestation. The entire time series is explored in more detail in Fig. 10. Wetland emissions increase relative to scenario 0 by 4 % to 5 % in scenarios in which rewetting takes place. Lastly, we have assumed no emissions changes for cropland.
To further elaborate the forestry modelling, Fig. 11 shows the forest sequestration time series for each of the scenarios. As can be seen, scenarios 0 and 1 reflect the average afforestation rate or the “business-as-usual” land use change, while scenario 4 has no afforestation. Scenarios 2, 3, and 5 increase sequestration potential significantly. Scenario 2 assumes that all spared area is mineral soil, and as such this scenario has the highest afforestation rate and the highest sequestration potential. Scenario 3 assumes that all drained areas are rewetted and that the remaining land area is mineral and afforested. Lastly, scenario 5 assumes the same; however, there is less land area available as a result of increased production output from animals. The time series also inherently factors in the harvesting rates. All scenarios assume that afforestation, if applicable, takes place up to 2050, with zero thereafter.
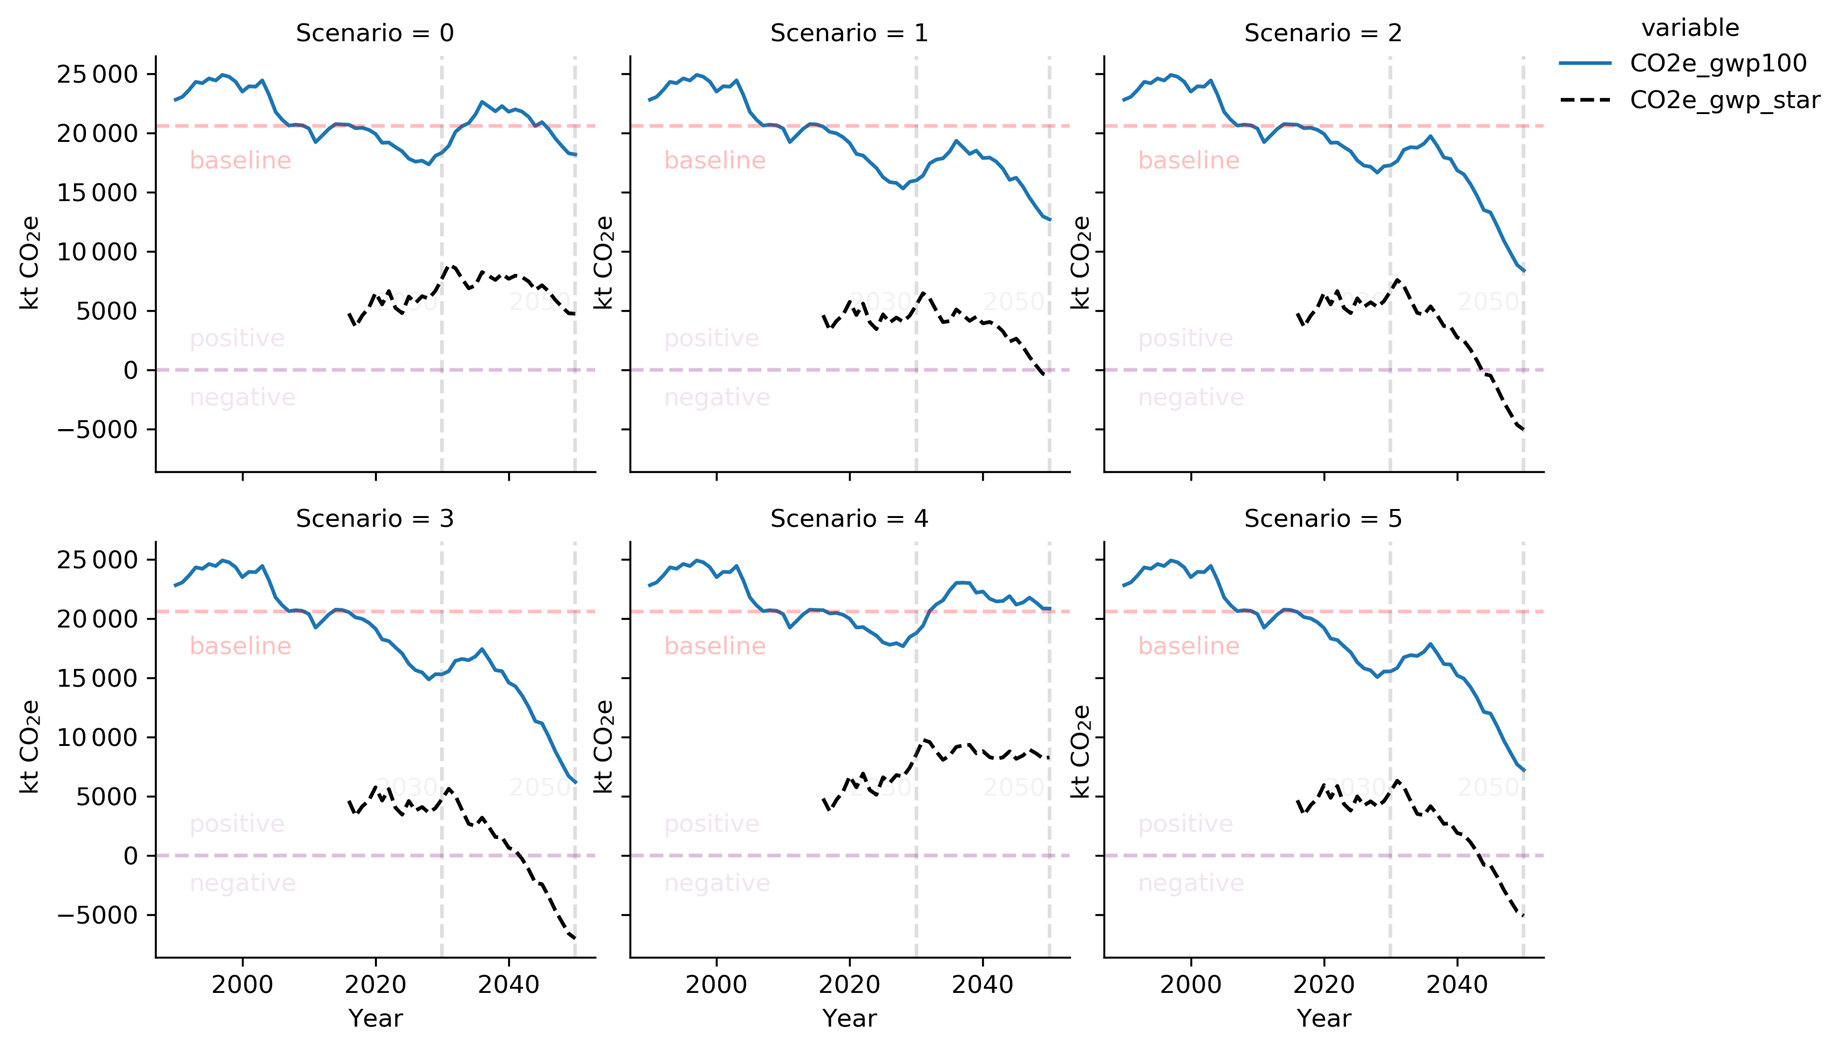
Figure 12GOBLIN scenario GHG balance through time based on CO2 aggregation using GWP100 and GWP∗. Blue lines represent GWP100, and the black line represents the GWP∗.
Finally, Fig. 12 represents aggregated GHG emissions from the AFOLU sector for each scenario using either GWP100 or GWP∗ to equate warming potential to CO2e. The calculation of GWP∗ is based on Lynch et al. (2020). The aggregated emissions are presented net of forest sequestration in order to present a final emissions balance. As can be seen, the reduction in animal numbers drives both emissions reductions. The rewetting of previously drained land provides an easy win in terms of emissions reductions despite additional CH4 and N2O emissions. However, the potential to offset remaining emissions in terms of carbon sequestration comes by utilising spared land for afforestation. Both organic soil rewetting and higher rates of afforestation are needed to reduce the GWP100 emissions balance, which in the best case (scenario 3) is reduced by circa 73 % from the 2015 balance.
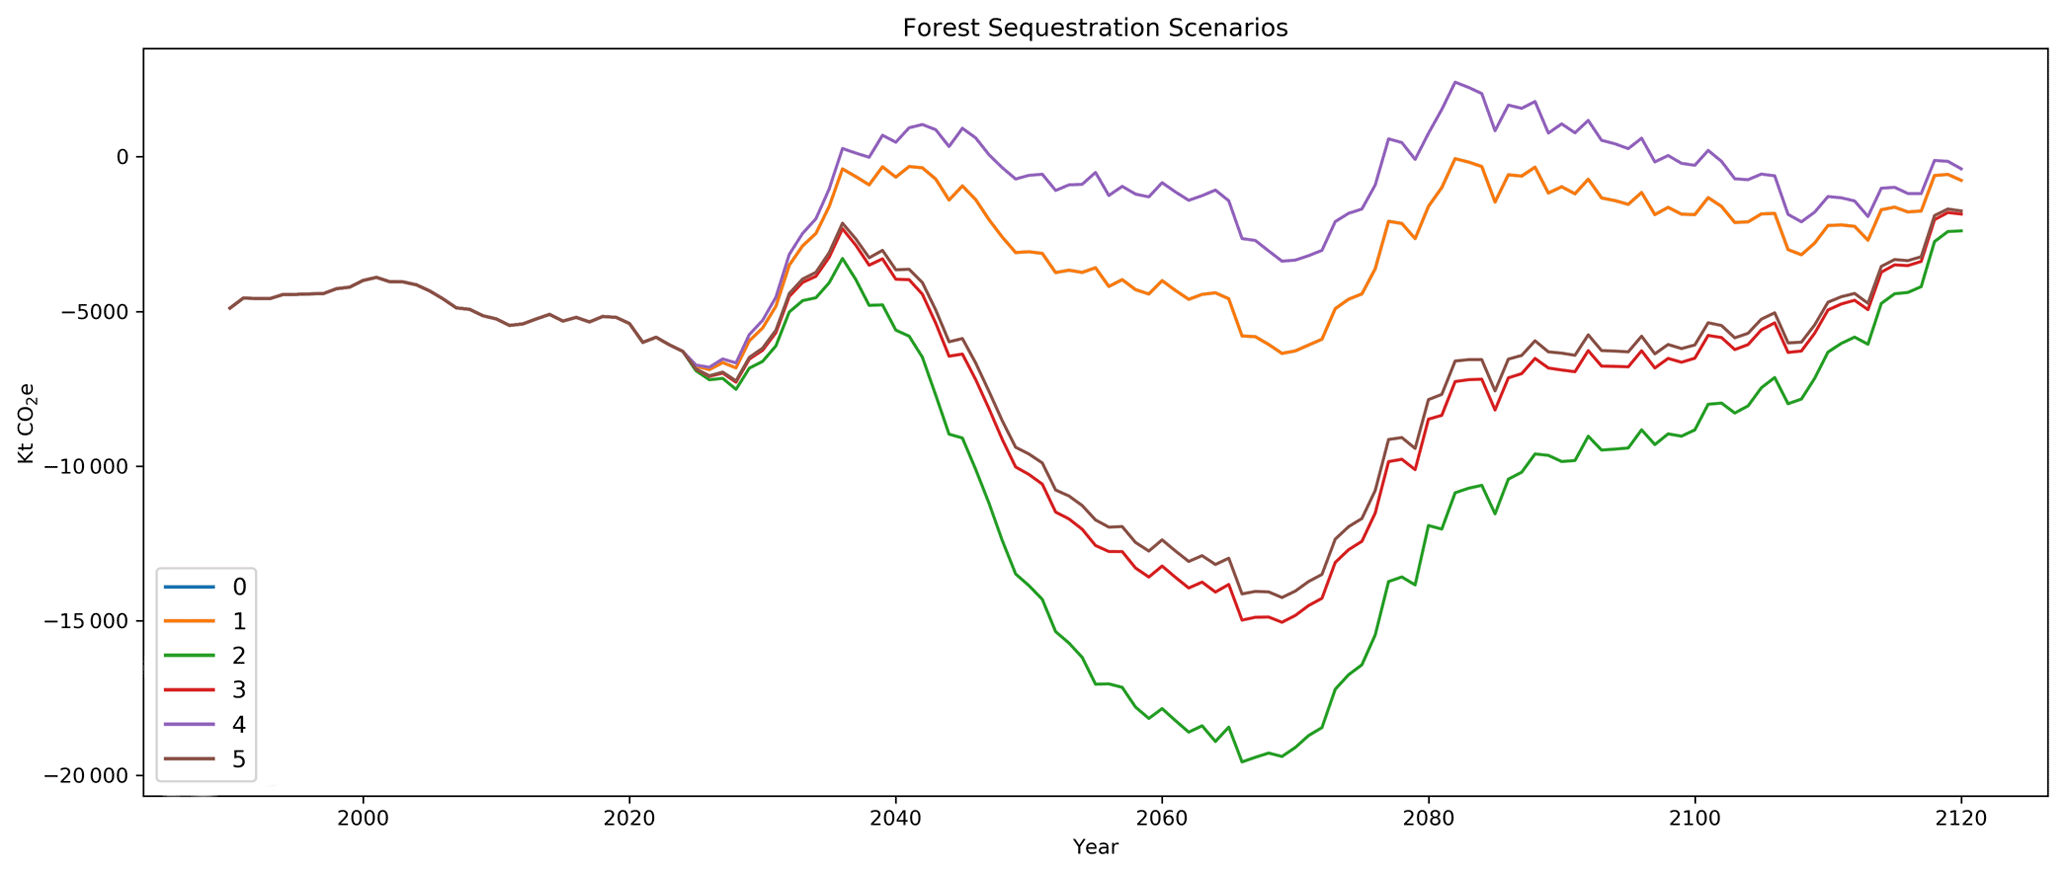
Figure 13Net marginal GHG flux (accounted for as CO2e balance) from forestry between 1990 and 2120 with zero afforestation after 2050 and 0 % harvest rate.
Figure 13 presents an extended time series for forest sequestration to 2120. Specifically, Fig. 13 illustrates afforestation to 2050, with zero afforestation thereafter. A forest conservation approach is considered for all new forest, assuming a 0 % harvest rate. This conservation approach does successfully avoid the so-called “carbon cliff” in scenarios 2, 3, and 5. However, the marginal gains are reduced over time as trees reach maturity. Ongoing model development will enable longer-term mitigation associated with harvested wood use to be represented.
7.1 National AFOLU models for climate policy
The AFOLU sector is central to global efforts required to stabilise the climate and will need to shift from being a net source to a net sink of emissions by 2050 in order to constrain anthropogenic global warming to 1.5 ∘C (Masson-Delmotte et al., 2019). Such a shift will require widespread and rapid deployment of appropriate mitigation options to reduce the emissions intensity of agricultural production whilst maintaining food security, alongside food demand management and actions to realise emissions removals via forestry and bioenergy (Huppmann et al., 2018; IPCC, 2019b). The GOBLIN model described here was developed as a tool to quantify long-term (circa 100-year) GHG emission fluxes associated with different AFOLU scenarios representing changes in land use over the next 3 decades. The intention is to bridge the gap between hindsight representation of national emissions via UN FCCC reporting (P. Duffy et al., 2020) and global IAMs (Huppmann et al., 2018) that are broad in scope but lack (sub)national detail. IAMs global pathways towards climate stabilisation involve many assumptions and are difficult to downscale to national targets. Whilst a number of countries have set national “net zero” GHG emission targets for 2050 (UK CCC, 2019), there remains considerable uncertainty about the role of distinct national AFOLU sectors, particularly with respect to appropriate targets for CH4 emissions and CO2 offsetting within nationally determined contributions (NDCs; Prudhomme et al., 2021). Ireland provides an excellent case study country to explore possible trade-offs between food production and various definitions of climate neutrality owing to high per capita GHG (including CH4) emissions from the AFOLU sector, both from ruminant food production destined for export and from land management (P. Duffy et al., 2020).
GOBLIN has been calibrated against Ireland's NIR (P. Duffy et al., 2020) to align outputs with GHG reporting methodologies but is novel in its integration with a land balance approach to determine future combinations of emissions sources and sinks related to animal feed energy requirements and grass production under different fertilisation and grazing (utilisation efficiency) regimes. Through integration of animal energy demand functions and grass fertiliser response curves, the model is able to vary areas needed to support different combinations of livestock systems at the national level. This functionality enables critical aspects of livestock production efficiency to be explicitly varied within scenarios, providing deep insight into interactions between livestock production, including sustainable intensification trajectories (Cohn et al., 2014; Havlík et al., 2014) that represent implications for future food production and biophysically compatible levels of organic soil rewetting and sequestration across forest types. The latter functionality derives from integration of aforementioned livestock system modelling with detailed representation of the complex carbon dynamics of existing and “new” forests. This represents a significant advance in national AFOLU GHG modelling capability and will build on modelling of livestock emissions displacement with forestry offsets recently calculated in C. Duffy et al. (2020a) to provide a solid evidence base for development and implementation of NDCs.
Crucially for a national AFOLU sector so far from complying with any definition of climate neutrality, fully randomised scenario simulations within GOBLIN will generate new evidence on which biophysically coherent combinations of agricultural activities and land uses satisfy particular definitions of climate neutrality. The combination of randomisation and a backcasting approach to filter climate neutral scenarios can inform objective comparison of trade-offs and may also help to elicit more constructive and focussed stakeholder engagement on a complex and sensitive topic. The small number of scenarios modelled in this paper were designed simply to demonstrate the technical potential of the model, but GOBLIN ultimately provides a platform to support participatory modelling (Basco-Carrera et al., 2017) or systematic analysis of alternative land use choices (Loucks and Van Beek, 2017). Combining the biophysical outputs of GOBLIN with socio-economic assessment will be crucial to determine effective climate policy at national level.
7.2 Defining “climate neutrality”
When model development began in 2018 it was assumed that achieving “net zero” GWP100 balance would be the primary objective for GOBLIN scenario modelling. Such an approach remains valid and in line with UN FCCC reporting and is applied for other countries' 2050 climate targets (Lóránt and Allen, 2019; UK CCC, 2019). Since then, there has been significant debate about how to combine the short-term warming effect of CH4 with the long-term cumulative warming effect of CO2 and N2O (Cain et al., 2019; Prudhomme et al., 2021). An important but initially unanticipated use of GOBLIN will therefore be to explore the implications of various possible definitions of “climate neutrality” underpinned by different value judgements. It is clear from the small selection of indicative scenarios analysed in this paper that the choice of GHG aggregation metric and definition of climate neutrality both profoundly alter the mix of agricultural production and land use (change) compatible with climate neutrality in 2050 and beyond. None of the scenarios meet climate neutrality in the traditional GWP100 sense. However, a “no further warming” definition, represented by a zero balance for GWP∗ (Lynch et al., 2020), is achieved (or surpassed) by 2050 among four of the six indicative scenarios explored here, whilst “net zero GHG”, represented as a zero balance for GWP100 (IPCC, 2013), is not achieved across any of the scenarios by 2050. For example, reducing the dairy herd by 10 % and beef cattle and sheep numbers by 50 % could result in “no further warming” (GWP∗ balance) climate neutrality in 2050 assuming all organic soils are rewetted and recent rates of afforestation (just under 6700 ha yr−1) are maintained. However, the same scenario brings the AFOLU sector only halfway towards net zero GHG emissions (GWP100 balance) by 2050. Separate calculation of each major GHG within GOBLIN will enable a wider range of climate neutrality “filters” to be applied beyond these simple GWP balance examples, such as a separate target for CH4 combined with a GWP100 balance across N2O and CO2. Over half of global CH4 emissions come from food production (Saunois et al., 2020); detailed modelling of ruminant food production compatible with various approaches to determine territorial climate neutrality could contribute significantly to policy formulation on separate CH4 targets, e.g. the EU Methane Strategy. Additionally, cumulative GWP∗ and GWP100 can also be applied as neutrality filters.
7.3 Model limitations and development priorities
GOBLIN examines rewetting of drained organic soils and forestry as the primary mechanisms of emissions mitigation and offset within Ireland's LULUCF sector, reflecting the “main levers” that can be pulled to achieve climate neutrality. Additional land use and technology interactions that could realise significant GHG mitigation by 2050 include, for example, bioenergy crop production, such as willow and miscanthus for electricity, heat, or advanced liquid biofuel chains and manures or grasses for biomethane production (Englund et al., 2020; Van Meerbeek et al., 2019). GOBLIN can be adapted and coupled with existing downstream energy emissions models to explicitly represent AFOLU consequences of such options and to illustrate inter-sectoral mitigation pathways (Fig. 1). In this regard, it is important to note that the forestry element of GOBLIN is relatively sophisticated, representing forest composition in terms of broadleaf and conifer species mixes, differing forest management practises, and harvest rates. This provides interesting possibilities to link AFOLU mitigation with future use of harvested wood products, possibly in cascading value chains that store carbon in wood products before end-of-life use for bioenergy carbon with capture and storage (BECCS) that can transform forestry CO2 sequestration into potentially permanent offsets (Forster et al., 2021). One of the first applications of GOBLIN will be to couple AFOLU forestry outputs with downstream LCA modelling of wood value chains in order to generate robust projections of CO2 offsetting out to 2120, providing new insight into the post-2050 longevity of various climate neutrality scenarios. Additionally, cropland areas are kept constant, reflecting the minor role of crop production in Ireland's current agri-food system and GHG emission profile. Nonetheless, future versions of GOBLIN should allow cropping area to be changed, reflecting potential increase in demand for plant-based proteins in place of animal protein (Tilman and Clark, 2014). Finally, whilst GOBLIN has been extensively validated against the NIR for current management practises, components such as fertiliser response curves for grass productivity could be altered by new grass varieties or mixed grass–clover swords or updated to be more spatially explicit in relation to soil and land categorisations (O'Donovan et al., 2021). There is potential to adapt this (and other) components of GOBLIN to represent specific mitigation options. Acknowledging that there are still important developments related to, inter alia, management of harvested wood products and bioenergy production to be included in future iterations of the model, GOBLIN represents a powerful tool for academics and policymakers to better understand what is required to reach climate neutrality within Ireland's AFOLU sector (and indeed other national AFOLU sectors dominated by livestock production). Crucially, GOBLIN decouples scenario generation from preconceptions of what pathways to climate neutrality could look like by enabling randomised scenarios to be generated and filtered in a backcasting approach. Although such modelling on its own cannot provide all the answers, it does establish a range of biophysically plausible targets which stakeholders can select from and choose to navigate towards, considering important factors such as delivery of wider ecosystem services and socio-economic and cultural feasibility. Future iterations of the GOBLIN model will seek to explicitly model the effect of land use change on a wide range of ecosystems services via the inclusion of a broader set of LCA impact categories and ecosystem service indicators.
7.4 Global transferability
GOBLIN is parameterised utilising emissions factors and land use characteristics related to Ireland's AFOLU sector, in line with specific national climate neutrality modelling objectives. However, the model is based on the IPCC GHG accounting framework, and refactoring for wider spatial applicability was considered from the outset. In this regard, each module contains its own database of emissions factors. The source country is utilised as the primary key, and the relevant country for the scenarios can be selected upon initialisation of the model run. This does not mean that GOBLIN is currently ready to deliver international results. Significant refactoring would be required across various country-specific functions, such as grass fertiliser response curves and grass utilisation efficiency. Livestock-intensive, temperate contexts will be significantly easier to parameterise owing to similar biophysical characteristics and EFs. For example, the model is currently being adjusted to include Scotland as an output country. However, contexts that differ a great deal from that of Ireland will require significantly greater refactoring. Modules related to land use and land use allocation will potentially require the most detailed refactoring, depending on how much they depart from the Irish context. In addition, the forest module, being Tier 3 at present, would need to be rebuilt for each country (or at least agro-ecological region) of application. Additional livestock categories and cohorts would also be necessary for specific regions. The modular nature of the model allows for “plug-in” of new modules, or “plug-out” of unnecessary modules depending on user needs. This adds flexibility and simplifies integration of new components in future iterations. Thus, the value of GOBLIN lies in its regional specificity to explore climate neutrality pathways aligned with IAMs projections of much coarser resolution, and this currently limits applicability to Ireland, but there is a high potential for its application in other livestock-intensive, temperate contexts following modest adaptations.
The AFOLU sector is both a source and a sink for GHG emissions. The sector will play a key role in mitigation of emissions via reduced agricultural emissions intensity and increased carbon sequestration and other off-setting or displacement activities. GOBLIN is a high-resolution integrated “bottom-up” biophysical land use model for Ireland's AFOLU sector. The novelty of GOBLIN lies in its integration of detailed land requirements and GHG emissions associated with different levels of livestock intensification and in its grassland management and sophisticated representation of forestry carbon dynamics alongside other important land use emission sources and sinks. GOBLIN is aligned with and validated against Ireland's inventory reporting methodology for GHG emissions, including a Tier 2 approach for livestock emissions and a Tier 3 approach for forestry. By calculating GHG flux trajectories towards (randomised) future (2050) scenarios of agricultural activities and land use (change), GOBLIN is able to provide new insight into the biophysical boundaries associated with different definitions of climate neutrality. This could help ground an increasingly polarised debate around the role of AFOLU in ambitious national climate policy. Detailed representation of current and future forestry combinations (species, management, and harvesting mixes) also provides a powerful platform for future downstream modelling of harvested wood product uses in the bioeconomy. This could be complemented by integration of bioenergy uses for spared land through further model development and/or coupling with existing bioenergy models and will enable the evaluation of long-term (to 2120) GHG fluxes in order to determine more enduring climate neutrality actions. Following model development and validation, GOBLIN will be used to provide a unique, impartial, and quantitatively rigorous evidence base for actions and strategies needed to achieve climate neutrality across Ireland's AFOLU sector.
The exact version of the model used to produce the results used in this paper is archived on Zenodo (https://doi.org/10.5281/zenodo.5047230, C. Duffy et al., 2021) and is freely available for download.
All data utilised for calibration and validation during GOBLIN model development, from public sources referenced throughout this paper, are archived, along with the model code itself, on Zenodo (https://doi.org/10.5281/zenodo.5047230, C. Duffy et al, 2021).
CD conducted design, development, analysis, testing, validation, and manuscript preparation. RP conducted design, development, analysis, and validation. BD conducted design and development. JG conducted validation, review, and editing. CO'D conducted validation, review, and editing. MR conducted validation, review, and editing. DS conducted design, development, analysis, review, and editing.
The contact author has declared that neither they nor their co-authors have any competing interests.
Publisher's note: Copernicus Publications remains neutral with regard to jurisdictional claims in published maps and institutional affiliations.
Thank you to the Environmental Protection Agency (Ireland), the James Hutton Institute, National University of Ireland Galway, University of Limerick, and Teagasc for the facilitation of this research. The James Hutton Institute is supported by the Rural & Environment Science & Analytical Services Division (RESAS), a division of the Scottish Government.
This research has been supported by the Environmental Protection Agency (grant no. EPA 2018-CCRP-MS.57).
This paper was edited by Daniel Huppmann and reviewed by two anonymous referees.
Allen, M. R., Shine, K. P., Fuglestvedt, J. S., Millar, R. J., Cain, M., Frame, D. J., and Macey, A. H.: A solution to the misrepresentations of CO2-equivalent emissions of short-lived climate pollutants under ambitious mitigation, npj Clim. Atmos. Sci., 1, 16, https://doi.org/10.1038/s41612-018-0026-8, 2018.
Aznar-Sánchez, J. A., Piquer-Rodríguez, M., Velasco-Muñoz, J. F., and Manzano-Agugliaro, F.: Worldwide research trends on sustainable land use in agriculture, Land Use Policy, 87, 104069, https://doi.org/10.1016/j.landusepol.2019.104069, 2019.
Basco-Carrera, L., Warren, A., van Beek, E., Jonoski, A., and Giardino, A.: Collaborative modelling or participatory modelling? A framework for water resources management, Environ. Modell. Softw., 91, 95–110, https://doi.org/10.1016/j.envsoft.2017.01.014, 2017.
Brunner, S. H., Huber, R., and Grêt-Regamey, A.: A backcasting approach for matching regional ecosystem services supply and demand, Environ. Modell. Softw., 75, 439–458, https://doi.org/10.1016/j.envsoft.2015.10.018, 2016.
Cain, M., Lynch, J., Allen, M. R., Fuglestvedt, J. S., Frame, D. J., and Macey, A. H.: Improved calculation of warming-equivalent emissions for short-lived climate pollutants, npj Clim. Atmos. Sci., 2, 29, https://doi.org/10.1038/s41612-019-0086-4, 2019.
CCAC: Climate Change Advisory Council Carbon Budget Technical Report, Climate Change Advisory Council, Dublin, Ireland, 2021.
Clarke L., Jiang, K., Akimoto, K., Babiker, M., Blanford, G., Fisher-Vanden, K., Hourcade, J.-C., Krey, V., Kriegler, E., Löschel, A., McCollum, D., Paltsev, S., Rose, S., Shukla, P. R., Tavoni, M., van der Zwaan, B. C. C., and van Vuuren, D. P.: Assessing Transformation Pathways, in: Climate Change 2014: Mitigation of Climate Change. Contribution of Working Group III to the Fifth Assessment Report of the Intergovernmental Panel on Climate Change, edited by: Edenhofer, O., Pichs-Madruga, R., Sokona, Y., Farahani, E., Kadner, S., Seyboth, K., Adler, A., Baum, I., Brunner, S., Eickemeier, P., Kriemann, B., Savolainen, J., Schlömer, S., von Stechow, C., Zwickel, T., and Minx, J. C., Cambridge University Press, Cambridge, United Kingdom and New York, NY, USA, https://www.ipcc.ch/site/assets/uploads/2018/02/ipcc_wg3_ar5_chapter6.pdf (last access: February 2022), 2014.
Cohn, A. S., Mosnier, A., Havlík, P., Valin, H., Herrero, M., Schmid, E., O'Hare, M., and Obersteiner, M.: Cattle ranching intensification in Brazil can reduce global greenhouse gas emissions by sparing land from deforestation, P. Natl. Acad. Sci. USA, 111, 7236–7241, https://doi.org/10.1073/pnas.1307163111, 2014.
Creighton, P., Kennedy, E., Shalloo, L., Boland, T. M., and O' Donovan, M.: A survey analysis of grassland dairy farming in Ireland, investigating grassland management, technology adoption and sward renewal, Grass Forage Sci., 66, 251–264, https://doi.org/10.1111/j.1365-2494.2011.00784.x, 2011.
CSO: CSO AKA01 – Intake of Cows Milk by Creameries and Pasteurisers, PxSTAT, Central Statistics Office, https://data.cso.ie/table/AKA01 (last access: June 2021), 2018.
DAFM: Ireland's National Forest Inventory 2015–2017, Forest Service Department of Agriculture, Food and the Marine, https://www.gov.ie/en/publication/823b8-irelands-national-forest-inventory/ (last access: February 2022), 2018.
DAFM: Ag Climatise A Roadmap towards Climate Neutrality, Department of Agriculture, Food and the Marine, Dublin, Ireland, https://www.gov.ie/en/publication/07fbe-ag-climatise-a-roadmap-towards-climate-neutrality/ (last access: February 2022), 2020a.
DAFM: Forest Statistics Ireland 2020, Department of Agriculture, Food and the Marine, Wexford, Ireland, https://www.gov.ie/en/collection/15b56-forest-statistics-and-mapping/#annual-forest-sector-statistics (last access: February 2022), 2020b.
Donnellan, T., Hanrahan, K., and Lanigan, G. J.: Future Scenarios for Irish Agriculture: Implications for Greenhouse Gas and Ammonia Emissions, Teagasc, Galway, Ireland, https://www.teagasc.ie/media/website/publications/2018/GHGscenarios2030final.pdf (last access: 26 November 2020), 2018.
Duffy, C., O'Donoghue, C., Ryan, M., Styles, D., and Spillane, C.: Afforestation: Replacing livestock emissions with carbon sequestration, J. Environ. Manage., 264, 110523, https://doi.org/10.1016/j.jenvman.2020.110523, 2020a.
Duffy, C., O'Donoghue, C., Ryan, M., Kilcline, K., Upton, V., and Spillane, C.: The impact of forestry as a land use on water quality outcomes: An integrated analysis, Forest Policy Econ., 116, 102185, https://doi.org/10.1016/j.forpol.2020.102185, 2020b.
Duffy, C., Pruhomme, R., Duffy, B., and Styles, D.: General Overview for a Backcasting approach of Livestock Intensification (GOBLIN) (Version v1.0), Zenodo [code, data set], https://doi.org/10.5281/zenodo.5047230, 2021.
Duffy, P., Black, K., Fahey, D., Hyde, B., Kehoe, A., Murphy, J., Quirke, B., Ryan, A. M., and Ponzi, J.: Ireland's National Inventory Report 2020, Environmental Protection Agency, https://www.epa.ie (last access: June 2021), 2020.
Duffy, P., Black, K., Fahey, D., Hyde, B., Kehoe, A., Murphy, J., Quirke, B., Ryan, A., and Ponzi, J.: Ireland's National Inventory Report 2021, Environmental Protection Agency, https://www.epa.ie (last access: June 2021), 2021.
Englund, O., Börjesson, P., Berndes, G., Scarlat, N., Dallemand, J. F., Grizzetti, B., Dimitriou, I., Mola-Yudego, B., and Fahl, F.: Beneficial land use change: Strategic expansion of new biomass plantations can reduce environmental impacts from EU agriculture, Global Environ. Chang., 60, 101990, https://doi.org/10.1016/j.gloenvcha.2019.101990, 2020.
Finneran, E., Crosson, P., O'Kiely, P., Shalloo, L., Forristal, P. D., and Wallace, M.: Stochastic modelling of the yield and input price risk affecting home produced ruminant feed cost, J. Agr. Sci., 150, 123–139, 2011.
Finneran, E., Crosson, P., O'Kiely, P., Shalloo, L., Forristal, D., and Wallace, M.: Stochastic simulation of the cost of home-produced feeds for ruminant livestock systems, J. Agr. Sci., 150, 123–139, https://doi.org/10.1017/S002185961100061X, 2012.
Forster, E. J., Healey, J. R., Dymond, C., and Styles, D.: Commercial afforestation can deliver effective climate change mitigation under multiple decarbonisation pathways, Nat. Commun., 12, 3831, https://doi.org/10.1038/s41467-021-24084-x, 2021.
Gardiner, M. J. and Radford, T.: Soil associations and their land use potential Explanatory bulletin to accompany the general soil map of Ireland, Teagasc, https://www.teagasc.ie/media/website/environment/soil/General.pdf (last access: March 2021), 1980.
Gordon, A.: Implementing backcasting for conservation: Determining multiple policy pathways for retaining future targets of endangered woodlands in Sydney, Australia, Biol. Conserv., 181, 182–189, https://doi.org/10.1016/j.biocon.2014.10.025, 2015.
Havlík, P., Valin, H., Herrero, M., Obersteiner, M., Schmid, E., Rufino, M. C., Mosnier, A., Thornton, P. K., Böttcher, H., Conant, R. T., Frank, S., Fritz, S., Fuss, S., Kraxner, F., and Notenbaert, A.: Climate change mitigation through livestock system transitions, P. Natl. Acad. Sci. USA, 111, 3709–3714, https://doi.org/10.1073/pnas.1308044111, 2014.
Herrero, M., Henderson, B., Havlík, P., Thornton, P. K., Conant, R. T., Smith, P., Wirsenius, S., Hristov, A. N., Gerber, P., Gill, M., Butterbach-Bahl, K., Valin, H., Garnett, T., and Stehfest, E.: Greenhouse gas mitigation potentials in the livestock sector, Nat. Clim. Change, 6, 452–461, https://doi.org/10.1038/nclimate2925, 2016.
Hiraishi, T., Krug, T., Tanabe, K., Srivastava, N., Baasansuren, J., Fukuda, M., and Troxler, T. G.: 2013 supplement to the 2006 IPCC guidelines for national greenhouse gas inventories: Wetlands, IPCC, Geneva, Switzerland, 2014.
Huppmann, D., Rogelj, J., Kriegler, E., Krey, V., and Riahi, K.: A new scenario resource for integrated 1.5 ∘C research, Nat. Clim. Change, 8, 1027–1030, https://doi.org/10.1038/s41558-018-0317-4, 2018.
IPCC: 2006 IPCC guidelines for national greenhouse gas inventories, Intergovernmental Panel on Climate Change, Cambridge, UK, 2006.
IPCC: Climate change 2013: The physical science basis, edited by: Stocker, T. F., Qin, D., Plattner, G.-K., Tignor, M., Allen, S. K., Boschung, J., Nauels, A., Xia, Y., Bex, V., and Midgley, P. M., Intergovernmental Panel on Climate Change, Working Group I Contribution to the IPCC Fifth Assessment Report (AR5), Cambridge Univ Press, New York, 2013.
IPCC: 2019 Refinement to the 2006 IPCC Guidelines for National Greenhouse Gas Inventories, IPCC, https://www.ipcc.ch/report/2019-refinement-to-the-2006-ipcc-guidelines-for-national-greenhouse-gas-inventories/ (last access: May 2021), 2019a.
IPCC: Summary for Policymakers, in: Climate Change and Land: an IPCC special report on climate change,desertification, land degradation, sustainable land management, food security, and greenhouse gas fluxes interrestrial ecosystems, IPCC, https://www.ipcc.ch/site/assets/uploads/sites/4/2020/02/SPM_Updated-Jan20.pdf (last access: 10 September 2020), 2019b.
Jones, A. K., Jones, D. L., and Cross, P.: The carbon footprint of lamb: Sources of variation and opportunities for mitigation, Agr. Syst., 123, 97–107, https://doi.org/10.1016/j.agsy.2013.09.006, 2014.
Kalt, G., Mayer, A., Haberl, H., Kaufmann, L., Lauk, C., Matej, S., Röös, E., Theurl, M. C., and Erb, K. H.: Exploring the option space for land system futures at regional to global scales: The diagnostic agro-food, land use and greenhouse gas emission model BioBaM-GHG 2.0, Ecol. Model., 459, 109729, https://doi.org/10.1016/j.ecolmodel.2021.109729, 2021.
Lóránt, A. and Allen, B.: Net-zero agriculture in 2050: how to get there?, Institute for European Environmental Policy, https://ieep.eu/uploads/articles/attachments/eeac4853-3629-4793-9e7b-2df5c156afd3/IEEP_NZ2050_Agriculture_report_screen.pdf?v=63718575577 (last access: May 2021), 2019.
Loucks, D. P. and Van Beek, E.: Water resource systems planning and management: An introduction to methods, models, and applications, Springer, Cham, ISBN 92-3-103998-9, 2017.
Lynch, J., Cain, M., Pierrehumbert, R., and Allen, M.: Demonstrating GWP: A means of reporting warming-equivalent emissions that captures the contrasting impacts of short- and long-lived climate pollutants, Environ. Res. Lett., 15, 044023, https://doi.org/10.1088/1748-9326/ab6d7e, 2020.
Masson-Delmotte, V., Zhai, P., Pörtner, H.-O., Roberts, D., Skea, J., Shukla, P. R., Pirani, A., Moufouma-Okia, W., Péan, C., Pidcock, R., Connors, S., Matthews, J. B. R., Chen, Y., Zhou, X., Gomis, M. I., Lonnoy, E., Maycock, T., Tignor, M., and Waterfield, T.: Global warming of 1.5 ∘C An IPCC Special Report on the impacts of global warming of 1.5 ∘C above pre-industrial levels and related global greenhouse gas emission pathways, in the context of strengthening the global response to the threat of climate change, IPCC, https://www.ipcc.ch/site/assets/uploads/sites/2/2019/06/SR15_Full_Report_Low_Res.pdf (last access: February 2022), 2019.
McEniry, J., Crosson, P., Finneran, E., Mcgee, M., Keady, T. W. J., and O'kiely, P.: How much grassland biomass is available in Ireland in excess of livestock requirements?, Teagasc, https://www.jstor.org/stable/23631018 (last access: February 2022), 2013.
McKay, M. D., Beckman, R. J., and Conover, W. J.: A comparison of three methods for selecting values of input variables in the analysis of output from a computer code, Technometrics, 42, 55–61, https://doi.org/10.1080/00401706.2000.10485979, 2000.
Misselbrook, T. and Gilhespy, S.: Report: Inventory of Ammonia Emissions from UK Agriculture 2017, DEFRA, https://uk-air.defra.gov.uk/assets/documents/reports/cat09/1903141332_UK_Agriculture_Ammonia_Emission_Report_1990-2017.pdf (last access: November 2021), 2019.
Misselbrook, T., Chadwick, D., Gilhespy, S., Chambers, B. J., Smith, K. A., Williams, J., and Dragosits, U.: Inventory of Ammonia Emissions from UK Agriculture 2009 DEFRA Contract AC0112, DEFRA, http://nora.nerc.ac.uk/id/eprint/13234/2/N013234CR.pdf (last access: 30 November 2020), 2010.
Noszczyk, T.: A review of approaches to land use changes modeling, Hum. Ecol. Risk Assess., 25, 1377–1405, https://doi.org/10.1080/10807039.2018.1468994, 2019.
NZ-MftE: New Zealand's Greenhouse Gas Inventory 1990–2019, Ministry for the Environment, Wellington, 2021.
O'Donovan, M., Hennessy, D., and Creighton, P.: Ruminant grassland production systems in Ireland, Irish J. Agr. Food Res., 59, 225–232, https://doi.org/10.15212/ijafr-2020-0118, 2021.
O'Mara, F. P.: Development of emission factors for the Irish cattle herd (2000-LS-5.1.1-M1): special report, Environmental Protection Agency, Wexford, Ireland, 2007.
Oireachtas: Climate Action and Low Carbon Development (Amendment) Bill 2021, Oireachtas, Dublin, Ireland, https://www.gov.ie/en/publication/984d2-climate-action-and-low-carbon-development-amendment-bill-2020/ (last access: 4 May 2021), 2021.
Pressman, R.: Software Engineering: A Practitioner's Approach, 7th edn., McGraw Hill, http://www.mhhe.com/pressman (last access: October 2021), 2010.
Prudhomme, R., O'Donoghue, C., Ryan, M., and Styles, D.: Defining national biogenic methane targets: Implications for national food production and climate neutrality objectives, J. Environ. Manage., 295, 113058, https://doi.org/10.1016/j.jenvman.2021.113058, 2021.
Reisinger, A. and Leahy, S.: Scientific aspects of New Zealand’s 2050 emission targets, NZAGRC, https://www.nzagrc.org.nz/publications/scientific-aspects-of-new-zealands-2050-emission-targets/ (last access: February 2022), 2019
Rogelj, J. and Schleussner, C.-F.: Unintentional unfairness when applying new greenhouse gas emissions metrics at country level, Environ. Res. Lett., 14, 114039, https://doi.org/10.1088/1748-9326/ab4928, 2019.
Rogelj, J., Popp, A., Calvin, K. V., Luderer, G., Emmerling, J., Gernaat, D., Fujimori, S., Strefler, J., Hasegawa, T., Marangoni, G., Krey, V., Kriegler, E., Riahi, K., Vuuren, D. P. van, Doelman, J., Drouet, L., Edmonds, J., Fricko, O., Harmsen, M., Havlík, P., Humpenöder, F., Stehfest, E., and Tavoni, M.: Scenarios towards limiting global mean temperature increase below 1.5 ∘C, Nat. Clim. Change, 8, 325–332, https://doi.org/10.1038/s41558-018-0091-3, 2018.
Rounsevell, M. D. A. and Metzger, M. J.: Developing qualitative scenario storylines for environmental change assessment, WIREs Clim. Change, 1, 606–619, https://doi.org/10.1002/wcc.63, 2010.
Saltelli, A., Chan, E. and Scott, E. M.: Sensitivity Analysis, Wiley Series in Probability and Statistics, Wiley, https://www.wiley.com/en-us/Sensitivity+Analysis-p-9780470743829 (last access: October 2021), 2009.
Saunois, M., Stavert, A. R., Poulter, B., Bousquet, P., Canadell, J. G., Jackson, R. B., Raymond, P. A., Dlugokencky, E. J., Houweling, S., Patra, P. K., Ciais, P., Arora, V. K., Bastviken, D., Bergamaschi, P., Blake, D. R., Brailsford, G., Bruhwiler, L., Carlson, K. M., Carrol, M., Castaldi, S., Chandra, N., Crevoisier, C., Crill, P. M., Covey, K., Curry, C. L., Etiope, G., Frankenberg, C., Gedney, N., Hegglin, M. I., Höglund-Isaksson, L., Hugelius, G., Ishizawa, M., Ito, A., Janssens-Maenhout, G., Jensen, K. M., Joos, F., Kleinen, T., Krummel, P. B., Langenfelds, R. L., Laruelle, G. G., Liu, L., Machida, T., Maksyutov, S., McDonald, K. C., McNorton, J., Miller, P. A., Melton, J. R., Morino, I., Müller, J., Murguia-Flores, F., Naik, V., Niwa, Y., Noce, S., O'Doherty, S., Parker, R. J., Peng, C., Peng, S., Peters, G. P., Prigent, C., Prinn, R., Ramonet, M., Regnier, P., Riley, W. J., Rosentreter, J. A., Segers, A., Simpson, I. J., Shi, H., Smith, S. J., Steele, L. P., Thornton, B. F., Tian, H., Tohjima, Y., Tubiello, F. N., Tsuruta, A., Viovy, N., Voulgarakis, A., Weber, T. S., van Weele, M., van der Werf, G. R., Weiss, R. F., Worthy, D., Wunch, D., Yin, Y., Yoshida, Y., Zhang, W., Zhang, Z., Zhao, Y., Zheng, B., Zhu, Q., Zhu, Q., and Zhuang, Q.: The Global Methane Budget 2000–2017, Earth Syst. Sci. Data, 12, 1561–1623, https://doi.org/10.5194/essd-12-1561-2020, 2020.
Schaldach, R., Alcamo, J., Koch, J., Kölking, C., Lapola, D. M., Schüngel, J., and Priess, J. A.: An integrated approach to modelling land-use change on continental and global scales, Environ. Modell. Softw., 26, 1041–1051, https://doi.org/10.1016/j.envsoft.2011.02.013, 2011.
Schulte, R. P. O., Donnellan, T., Black, K. G., Crosson, P., Farrelly, N., Fealy, R. M., Finnan, J., Lannigan, G., O'Brien, D., O'Kiely, P., Shalloo, L., and O'Mara, F.: Carbon-Neutrality as a horizon point for Irish Agriculture, Teagasc, Dublin, 2013.
Searchinger, T., Zionts, J., Wirsenius, S., Peng, L., Beringer, T., and Dumas, P.: A Pathway to Carbon Neutral Agriculture in Denmark, https://doi.org/10.46830/wrirpt.20.00006, World Resources Institute, 2021.
Smith, P., Bustamante, M., Ahammad, H., Clark, H., Dong, H., and Elsiddig, E. A.: Agriculture, Forestry and Other Land Use (AFOLU), in: Climate Change 2014: Mitigation of Climate Change. Contribution ofWorking Group III to the Fifth Assessment Report of the Intergovernmental Panel on Climate Change, edited by: Edenhofer, O., Pichs-Madruga, R., Sokona, Y., Farahani, E., Kadner, S., Seyboth, K., Adler, A., Baum, I., Brunner, S., Eickemeier, P., Kriemann, B., Savolainen, J., Schlömer, S., von Stechow, C., Zwickel, T., and Minx, J., Cambridge University Press, Cambridge, UK and New York, NY, USA, 2014.
Soteriades, A. D., Gonzalez-Mejia, A. M., Styles, D., Foskolos, A., Moorby, J. M., and Gibbons, J. M.: Effects of high-sugar grasses and improved manure management on the environmental footprint of milk production at the farm level, J. Clean. Prod., 202, 1241–1252, https://doi.org/10.1016/j.jclepro.2018.08.206, 2018.
Soteriades, A. D., Foskolos, A., Styles, D., and Gibbons, J. M.: Diversification not specialization reduces global and local environmental burdens from livestock production, Environ. Int., 132, 104837, https://doi.org/10.1016/j.envint.2019.05.031, 2019.
Styles, D., Gibbons, J., Williams, A. P., Stichnothe, H., Chadwick, D. R., and Healey, J. R.: Cattle feed or bioenergy? Consequential life cycle assessment of biogas feedstock options on dairy farms, GCB Bioenergy, 7, 1034–1049, https://doi.org/10.1111/gcbb.12189, 2015.
Styles, D., Dominguez, E. M., and Chadwick, D.: Environmental balance of the of the UK biogas sector: An evaluation by consequential life cycle assessment, Sci. Total Environ., 560–561, 241–253, https://doi.org/10.1016/j.scitotenv.2016.03.236, 2016.
Styles, D., Gonzalez-Mejia, A., Moorby, J., Foskolos, A., and Gibbons, J.: Climate mitigation by dairy intensification depends on intensive use of spared grassland, Glob. Change Biol., 24, 681–693, https://doi.org/10.1111/gcb.13868, 2018.
Teagasc: 2027 SECTORAL ROAD MAP: BEEF Road Map for 2027, Teagasc, https://www.teagasc.ie (last access: November 2021), 2020a.
Teagasc: 2027 SECTORAL ROAD MAP: DAIRY Road Map for 2027, Teagasc, https://www.teagasc.ie/publications/2020/2027-sectoral-road-map-dairy.php (last access: 21 January 2021), 2020b.
Tilman, D. and Clark, M.: Global diets link environmental sustainability and human health, Nature, 515, 518–522, https://doi.org/10.1038/nature13959, 2014.
UFCCC: Report of the Conference of the Parties on its nineteenth session, held in Warsaw from 11 to 23 November 2013, Addendum Part two: Action taken by the Conference of the Parties at its nineteenth session Contents, United Nations Framework Convention on Climate Change, Geneva, 2014.
UK CCC: Net Zero: The UK's contribution to stopping global warming, UK Climate Change Committee, London, 2019.
UN: UNcomtrade, United Nations Commod. Trade Stat. Database, United Nations, https://comtrade.un.org/db/default.aspx, (last access: 10 December 2020), 2016.
UNFCCC: Paris Agreement on Climate Change, United Nations Framework Convention on Climate Change, UNFCC: Adoption of the Paris Agreement, 21st Conference of the Parties, Paris, United Nations, 12 December 2015, https://unfccc.int/resource/docs/2015/cop21/eng/l09r01.pdf (last access: February 2022), 2015.
Van Asselen, S. and Verburg, P. H.: Land cover change or land-use intensification: Simulating land system change with a global-scale land change model, Glob. Change Biol., 19, 3648–3667, https://doi.org/10.1111/gcb.12331, 2013.
Van Meerbeek, K., Muys, B., and Hermy, M.: Lignocellulosic biomass for bioenergy beyond intensive cropland and forests, Renew. Sust. Energ. Rev., 102, 139–149, https://doi.org/10.1016/J.RSER.2018.12.009, 2019.
Webb, J. and Misselbrook, T. H.: A mass-flow model of ammonia emissions from UK livestock production, Atmos. Environ., 38, 2163–2176, https://doi.org/10.1016/j.atmosenv.2004.01.023, 2004.
- Abstract
- Introduction
- Model classification, scope, and description
- GHG fluxes
- Model validation
- Example of model output
- Forest sequestration time series extension
- Discussion
- Conclusions
- Code availability
- Data availability
- Author contributions
- Competing interests
- Disclaimer
- Acknowledgements
- Financial support
- Review statement
- References
bottom-upbiophysical land use model capable of identifying broad pathways towards climate neutrality in the agriculture, forestry, and other land use (AFOLU) sector. The model is intended to bridge the gap between hindsight representations of national emissions and much larger globally integrated assessment models.
- Abstract
- Introduction
- Model classification, scope, and description
- GHG fluxes
- Model validation
- Example of model output
- Forest sequestration time series extension
- Discussion
- Conclusions
- Code availability
- Data availability
- Author contributions
- Competing interests
- Disclaimer
- Acknowledgements
- Financial support
- Review statement
- References