the Creative Commons Attribution 4.0 License.
the Creative Commons Attribution 4.0 License.
 | 12 Jan 2022
Development of aerosol optical properties for improving the MESSy photolysis module in the GEM-MACH v2.4 air quality model and application for calculating photolysis rates in a biomass burning plume
Mahtab Majdzadeh
Craig A. Stroud
Christopher Sioris
Paul A. Makar
Ayodeji Akingunola
Chris McLinden
Xiaoyi Zhao
Michael D. Moran
Ihab Abboud
Jack Chen
The photolysis module in Environment and Climate Change Canada's online chemical transport model GEM-MACH (GEM: Global Environmental Multi-scale – MACH: Modelling Air quality and Chemistry) was improved to make use of the online size and composition-resolved representation of atmospheric aerosols and relative humidity in GEM-MACH, to account for aerosol attenuation of radiation in the photolysis calculation. We coupled both the GEM-MACH aerosol module and the MESSy-JVAL (Modular Earth Submodel System) photolysis module, through the use of the online aerosol modeled data and a new Mie lookup table for the model-generated extinction efficiency, absorption and scattering cross sections of each aerosol type. The new algorithm applies a lensing correction factor to the black carbon absorption efficiency (core-shell parameterization) and calculates the scattering and absorption optical depth and asymmetry factor of black carbon, sea salt, dust and other internally mixed components.
We carried out a series of simulations with the improved version of MESSy-JVAL and wildfire emission inputs from the Canadian Forest Fire Emissions Prediction System (CFFEPS) for 2 months, compared the model aerosol optical depth (AOD) output to the previous version of MESSy-JVAL, satellite data, ground-based measurements and reanalysis products, and evaluated the effects of AOD calculations and the interactive aerosol feedback on the performance of the GEM-MACH model. The comparison of the improved version of MESSy-JVAL with the previous version showed significant improvements in the model performance with the implementation of the new photolysis module and with adopting the online interactive aerosol concentrations in GEM-MACH. Incorporating these changes to the model resulted in an increase in the correlation coefficient from 0.17 to 0.37 between the GEM-MACH model AOD 1-month hourly output and AERONET (Aerosol Robotic Network) measurements across all the North American sites. Comparisons of the updated model AOD with AERONET measurements for selected Canadian urban and industrial sites, specifically, showed better correlation coefficients for urban AERONET sites and for stations located further south in the domain for both simulation periods (June and January 2018). The predicted monthly averaged AOD using the improved photolysis module followed the spatial patterns of MERRA-2 reanalysis (Modern-Era Retrospective analysis for Research and Applications – version 2), with an overall underprediction of AOD over the common domain for both seasons. Our study also suggests that the domain-wide impacts of direct and indirect effect aerosol feedbacks on the photolysis rates from meteorological changes are considerably greater (3 to 4 times) than the direct aerosol optical effect on the photolysis rate calculations.
- Article
(28556 KB) - Full-text XML
- BibTeX
- EndNote


Atmospheric aerosols are very small solid, aqueous or mixed-state particles suspended in the atmosphere, typically ranging from 10−3 to 10 µm in size, which affect Earth's radiative balance (Bond and Bergstrom, 2006). Photolysis or photo-dissociation reactions are those for which molecules break down by absorbing sunlight. Aerosol particles scatter and absorb solar radiation, and can thus change the actinic fluxes, or the flux of spherically integrated spectral radiance of the Sun, and hence the rate coefficients of photolysis reactions, also known as J values (Jacobson, 2005). The latter are the rates of the molecular dissociation of the gaseous species by sunlight and depend on the attenuation of the radiation stream as a function of the particle size, composition and morphology (arrangement of the components within the particle), on gases' effective size (molecular cross section) and on the fraction of molecules broken apart per incoming photon (quantum yield). One way of quantifying the effects of aerosols on radiative transfer processes, including photolysis, is through the use of the aerosol optical depth (hereafter AOD). AOD is a dimensionless quantity, a measure of the extinction of the solar light by aerosols in the atmosphere, and it provides a measure of the amount of aerosols in a vertical column from the surface to the top of the atmosphere.
Aerosol mixing state within a population of aerosol particles is defined as the distribution of chemical species in each aerosol particle (Riemer et al., 2019) and can also be referred to as the particle morphology in the aerosol population (Stevens and Dastoor, 2019). When all the species are homogeneously mixed within an aerosol particle, the population is known to be “internally mixed”, whereas an “externally mixed” population of particles consists of each particle being of only one chemical species. Internal mixtures can also be described as homogeneous populations of homogeneous particles and external mixtures as heterogeneous populations of homogeneous particles (Bond and Bergstrom, 2006). In reality, completely internally and externally mixed aerosol populations are rare in the atmosphere, and aerosol particles are complex mixtures of different chemical species (Bond et al., 2006; Riemer et al., 2019; Healy et al., 2014).
Black carbon (a widely used term for light-absorbing carbon) from fossil fuel and biomass burning is known to have a large positive radiative forcing in the atmosphere due to its highly absorptive properties and strong extinction (Jacobson, 2000; Bond and Bergstrom, 2006). Black carbon is generally modeled using different assumptions on its mixing state: externally mixed, where black carbon and other aerosols are in separate particles, volume-averaged internally mixed, where each particle contains a mixture of black carbon and other aerosols, and a core-shell structure, in which each particle consists of a black carbon core surrounded by a mixture of other aerosols through condensation and coagulation or aging processes (Jacobson, 2001). When black carbon is coated with other aerosols, the light-absorbing properties of black carbon may be enhanced (absorption enhancement) by 50 % to 60 % through a lensing effect (Liu et al., 2017). Since absorption, and therefore the radiative forcing in the atmosphere, is influenced by different assumptions of the mixing state of particles, the representation of aerosol size and the mixing state of black carbon is essential to have a realistic estimation of radiative forcing in atmospheric models (Bond et al., 2006). Bond et al. (2006), calculated the absorption amplification (ratio of absorption by core-shell black carbon to pure black carbon with the same carbon mass) for a wide range of core-shell thickness, using an implementation of the Bohren and Huffman (1983) Mie scattering algorithm in MATLAB (Mätzler, 2002) at 550 nm. They identified five distinct geometric regimes for different black carbon (core) and shell sizes, and calculated the best fit for the absorption amplification for each individual regime (Bond et al., 2006, Table 2).
To date, the estimates of AOD in atmospheric models have been based on one or a combination of different mixing states of aerosols. The variation in the resulting aerosol optical properties from the atmospheric models is associated with the assumptions regarding the methods used in AOD calculations, aerosol mixing states, density, refractive index and hygroscopic growth, with the most important factor being the choice of the mixing states of aerosols (Curci et al., 2015). The latter accounts for 30 % to 35 % of the uncertainty in estimation of AOD and single scattering albedo (Curci et al., 2015). Other studies, e.g., Barnaba et al. (2010), found different spatial patterns in AOD vs. surface particulate matter, highlighting the sensitivity of calculated AOD to aerosol vertical profile rather than the aerosol surface concentrations.
The radiative transfer module in chemical transport models contains parameterizations for extinction efficiency (the sum of scattering and absorption efficiencies), single scattering albedo (the ratio of scattering efficiency to total extinction efficiency) and asymmetry factor (the angular direction of the scattered radiation by particles or gases) for each particle type and calculates scattering and absorption coefficients (a measure of photon scattering and absorption by particles) to predict the radiative state of the atmosphere. AOD is calculated by integrating the extinction of the solar beam due to aerosols over the vertical column. These optical effects of aerosols may also influence the shorter wavelengths associated with atmospheric gas photolysis, influencing atmospheric reactivity. These processes may be harmonized in an online chemical transport model, such as Environment and Climate Change Canada's (ECCC) online-coupled meteorology and chemical transport model, GEM-MACH (GEM: Global Environmental Multi-scale – MACH: Modelling Air quality and Chemistry). Chemical transport models such as GEM-MACH have been used in past works, investigating AOD and evaluating different aerosol light attenuation methods and mixing states of black carbon.
Gan et al. (2015) performed a long-term simulation of aerosol concentration and optical depth for 16 years (1995 to 2010), using the coupled Weather Research and Forecasting – Community Multi-scale Air Quality (WRF v3.4 and CMAQ v5.0.2) models over the continental US (CONUS). For model evaluation, they used 16 years (1995 to 2010) of observation data and 14 years of AOD data (1997 to 2010) from several measurement networks including SURFRAD (Surface Radiation Budget Network), ARM (Atmospheric Radiation Measurement), CASTNET (Clean Air Status and Trend Network) and IMPROVE (Interagency Monitoring of Protection Visual Environments) observations (Gan et al., 2014a, 2015). The aerosol light attenuation method in their model was based on Mie and core-shell scattering (Gan et al., 2014b), and the model used online aerosol feedback on radiation and photolysis (sulfate, nitrate, ammonium, dust and organic aerosols) (Gan et al., 2015). Although their simulations showed the overall observed trends of AOD from SURFRAD, the magnitude of simulated AOD was underestimated compared to the observations. For instance, the 1997–2010 annual mean AOD time series over the eastern US showed the model AOD values ranging from a minimum of ∼0.06 to a maximum of ∼0.09, while SURFRAD observations had a minimum of ∼0.125 and maximum of ∼0.175.
Latimer et al. (2019) performed a 10-year simulation of aerosol mass scattering efficiency and AOD using the GEOS-Chem (Goddard Earth Observing System for chemistry of the NASA Global Modeling and Assimilation Office, version 11-02, http://geos-chem.org, last access: 1 December 2021) chemical transport model. Their simulations of aerosol mass scattering efficiency, from an aerosol speciation including sulfate, ammonium, nitrate, primary and secondary organic carbon, mineral dust and sea salt, were evaluated using data from the North American IMPROVE (Interagency Monitoring of Protected Visual Environments) monitoring network between 2000 and 2010; the global AERONET (Aerosol Robotic Network) data were used for AOD evaluation. Aerosol optical properties were generated using a GEOS-Chem default optical lookup table. They examined the impact of secondary inorganic aerosol and organic aerosol size and hygroscopicity, excluding sites dominated by dust, and those with a high degree of internal subgrid-scale elevation variability, in order to focus on the composition and/or size issues. The revised hygroscopicity assumptions resulted in an increase of 19 % in global mean simulated AOD with the revised aerosol optical properties. Despite improvements to simulated AOD on a global scale, those values were still underestimated at most North American sites (Latimer et al., 2019), with a correlation relation (R) of 0.78 and root mean square error (RMSE) of 0.1 for measured vs. revised simulated AOD at all AERONET sites in 2006.
Alvarado et al. (2016) used measurements of aerosol scattering and absorption gathered during the 2008 Arctic Research of the Composition of the Troposphere from Aircraft and Satellites (ARCTAS) campaign to evaluate the aerosol optical properties from global numerical models. The NASA ARCTAS campaign (Jacob et al., 2010) was conducted over Alaska in April 2008 (ARCTAS-A) and over western Canada during June–July 2008 (ARCTAS-B). ARCTAS-CARB (sponsored by the California Air Resources Board; CARB), was conducted over California, 1 week prior to ARCTAS-B. These evaluations examined the effects of different mixing states of black carbon (volume averaged, core shell and externally mixed, as well as the Maxwell–Garnet mixing rule, in which black carbon is assumed to be present in randomly distributed inclusions) on aerosol scattering and absorption properties, for wavelengths between 250 and 700 nm, using an offline approach of the Aerosol Simulation Program (ASP v2.1, Alvarado et al., 2015). ASP is a single-box aerosol model, with modules to calculate aerosol thermodynamics, gas-to-aerosol mass transfer (condensation/evaporation), coagulation of aerosols and aerosol optical properties (Alvarado et al., 2016). Using the instruments of the NASA Langley Aerosol Research Group (LARGE; Anderson et al., 1998), they showed that the use of a core-shell mixing state for black carbon, especially for fresh biomass burning episodes, led to the overestimation of aerosol absorption by 29 % to 35 %, with insignificant dependence on the wavelength, while an external mixture assumption led to the underestimation of aerosol absorption, with a strong dependence on wavelength. Their collected observations suggested using an externally mixed black carbon for the fresh smoke observations and an internally mixed core-shell approach for the aged Arctic haze and the anthropogenic pollution. Their implementation of a variable mixing state resulted in an average overestimation of aerosol absorption of 10 % at 470 nm, 17 % at 532 nm and 23 % at 660 nm.
The mixing state of aerosols has a key impact on radiative transfer, with black carbon's ability to absorb significant amounts of incoming short wavelength light and re-emit this energy as longer wavelengths, resulting in its identification as a short-term climate forcer (IPCC, 2018). However, the mixing state of black carbon, and the impact of that mixing state on the radiative properties of atmospheric aerosols, varies in the literature. Tombette et al. (2008) suggested that the mixing state of black carbon presents an insignificant effect on aerosol optical thickness (AOT) calculations (RMSE difference <10−4). Liu et al. (2017) recommended using an absorption enhancement in order to account for optical lensing associated with biomass burning emissions and no-absorption enhancement for fresh traffic sources. In another study, over 10 European AERONET sites, Péré et al. (2009) found the mean modeled core-shell single scattering albedo (SSA) provided the closest match to the corresponding measurements, with the spatiotemporal correlation coefficient of 0.51 (compared to 0.04 and 0.35 for the internally homogeneous and externally mixed particles, respectively) and therefore is the best representation for simulating anthropogenic and/or biomass burning emissions.
In the work which follows, we make use of the Global Environmental Multiscale – Modelling Air quality and Chemistry (GEM-MACH) model. The atmospheric chemistry module in GEM-MACH has been included as an online component of the core weather forecast model (GEM) (Côté et al., 1998a, b; Girard et al., 2014; Charron et al., 2012) and consists of air quality processes, including computationally efficient ADOM-II (Acid Deposition and Oxidant Model, version 2) gas-phase chemistry mechanism with 47 species (Lurmann et al., 1986; Fung et al., 1991), aqueous-phase and heterogeneous chemistry, wet and dry deposition, aerosol–cloud processes and aerosol microphysics (Gong et al., 2003a, b; Moran et al., 2010; Makar et al., 2015a, b). The model's aerosol distribution is based on 12 particle size bins. The aerosol species in GEM-MACH consist of eight components within each size bin: ammonium, sulfate, nitrate, sea salt, crustal material, black carbon, primary organic aerosol (POA) and secondary organic aerosol (SOA). The aerosol and microphysical parameterizations include particle nucleation, condensation and coagulation (Gong et al., 2003a, b), gas and particle dry deposition (Zhang et al., 2001; Makar et al., 2018), cloud processing and in-cloud aqueous-phase chemistry (Gong et al., 2006), direct and indirect feedback options (Makar et al., 2015a, b; Gong et al., 2015) and equilibrium inorganic gas–aerosol partitioning (Makar et al., 2003). The model can be used with either one-way coupling (meteorology drives the chemistry) or with two-way coupling (which enables the model-generated aerosols' impact on radiative transfer – aerosol direct effect, and on radiative transfer via cloud formation – aerosol indirect effect; Makar et al., 2015 a, b). However, the default configuration of GEM-MACH's photolysis calculations makes use of an a priori lookup table as a function of solar zenith angle and height. Here, we update this module, examine the effects of photolysis on the aerosol feedbacks and show their relative importance to model performance.
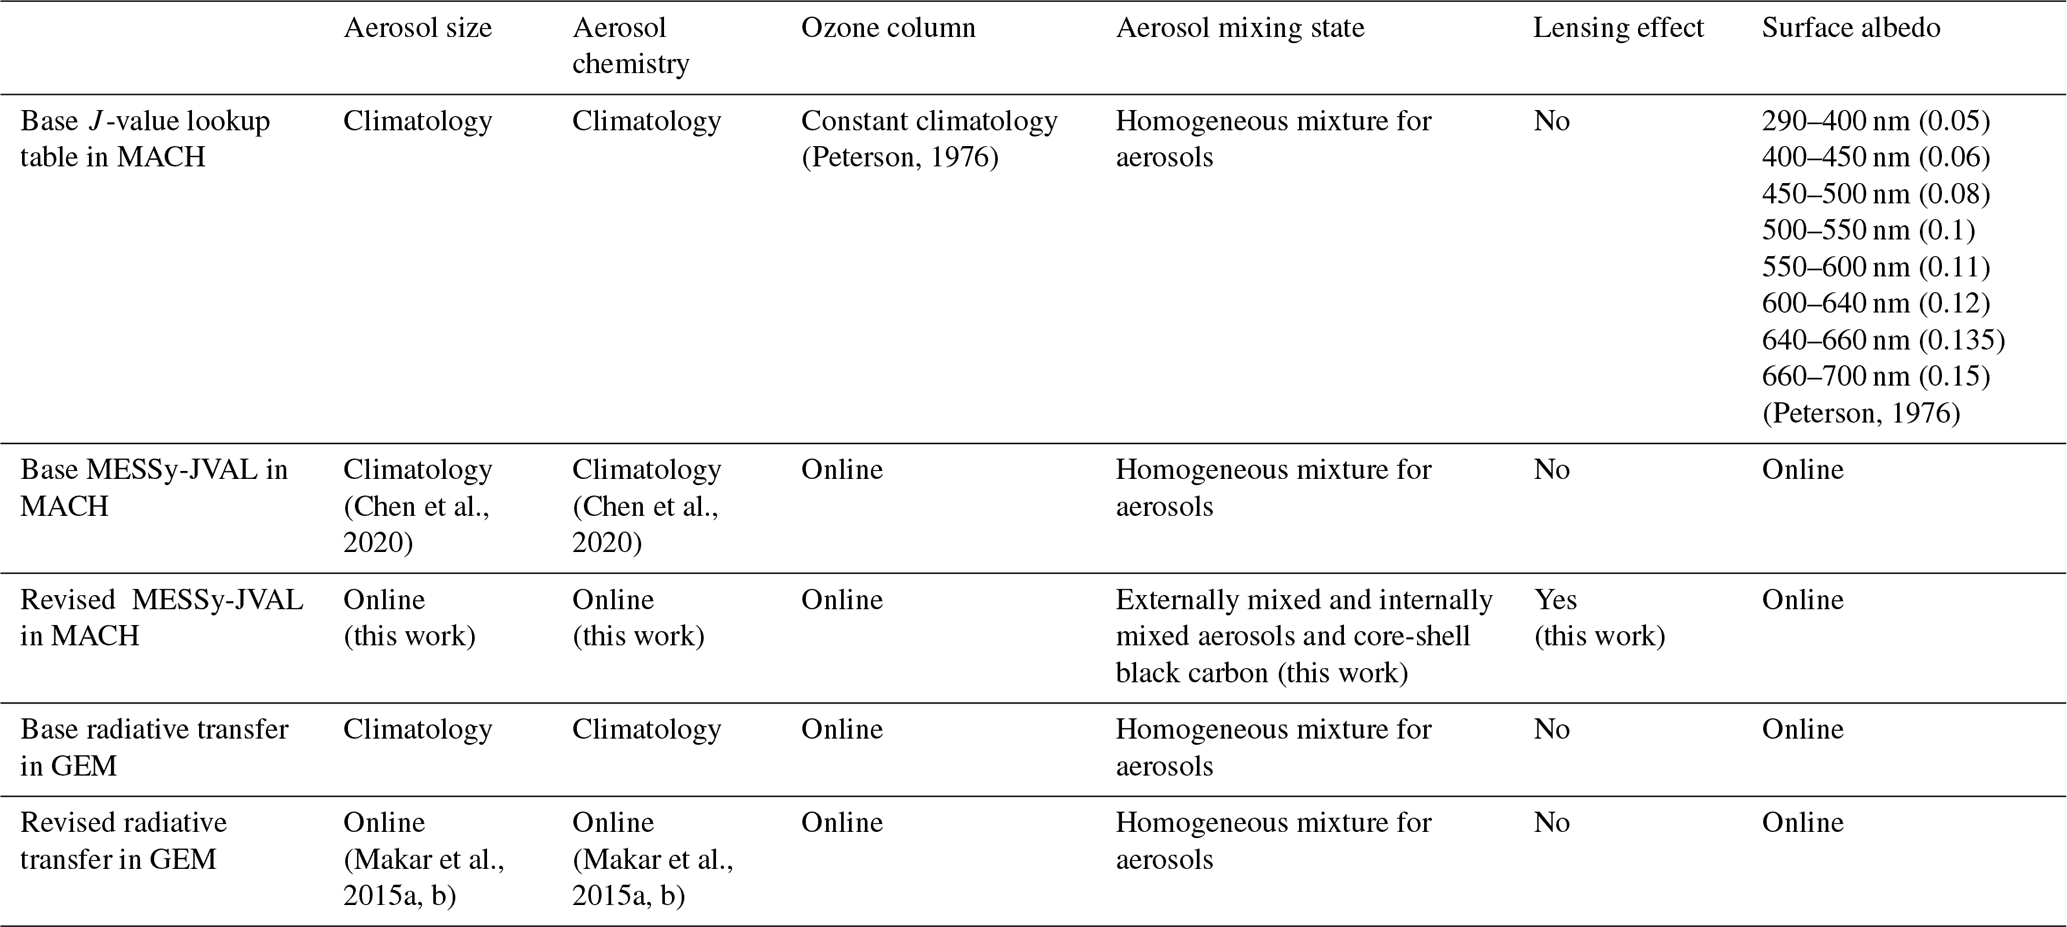
Table 1 represents the different options for aerosol optical calculations in the current version of GEM-MACH. The original, precalculated, clear-sky J-value lookup table in GEM-MACH is a function of solar zenith angle and height. The photolysis rates are calculated using the input data of Peterson (1976) and the radiative transfer model of Dave (1972), with cross sections and quantum yields taken from DeMore et al. (1988) (Kelly et al., 2012). The model uses the online cloud fraction and liquid water content from the GEM model to scale the precalculated clear-sky J values, based on an algorithm by Chang et al. (1987). The size distribution and number density profile of aerosols used in the lookup table generation were based on Braslau and Dave (1973), and the refractive index of the aerosols was assumed to be independent of height and wavelength, with a single uniform value of 1.5–0.01i (Yamamoto and Tanaka, 1972). The resultant optical depth at 500 nm wavelength is 0.25.
The calculations of aerosol optical depth, single scattering albedo and asymmetry factor used by the GEM weather forecast model, also used in the offline version of the radiative transfer module in GEM-MACH (Li and Barker, 2005) with no-feedback configuration, are based on a climatology produced by Toon and Pollack (1976), with specified aerosol loading for continents and oceans, a maximum value at the Equator and a decrease towards the poles. The solar absorption properties are only assumed to be affected by aerosols in the clear-sky atmosphere (Markovic et al., 2008). In contrast, the online version of the radiative transfer module in the feedback-enabled version of GEM-MACH makes use of a homogeneous aerosol mixture Mie scattering (Bohren and Huffman, 1983) code for meteorological radiative transfer calculations, and the model-generated aerosols in the feedback mode (Makar et al., 2015a, b) are used for radiative transfer calculations.
The new photolysis module in GEM-MACH (MESSy-JVAL) is based on JVAL14-MESSy of Sander et al. (2014). The photolysis module JVAL was adapted by Sander et al. as a module inside the Modular Earth Submodel System (MESSy) interface of Jöckel et al. (2005). The original formulation of photolysis rates calculations was developed by Landgraf and Crutzen (1998) and has been since adopted in several atmospheric models (Sander et al., 2014). The actinic flux calculations include the effects of aerosols and clouds on photolysis rates. The optical data for cloud scattering and absorption are adopted from Slingo (1989) (Sander et al., 2011). The previous offline application of MESSy-JVAL in GEM-MACH (Chen et al., 2020) made use of a climatology of aerosol concentration (a constant aerosol vertical profile above land and a different vertical profile over water). Cloud radiative properties and cloud fraction were calculated online at runtime (Chen et al., 2020). The focus of this study is to improve the representation of aerosol optical properties in MESSy-JVAL and to determine their impact on model performance.
In the following sections, we describe the methods we used to improve the representation of aerosol optical properties in MESSy-JVAL, followed by the evaluations of the improved photolysis module and the limitations of the model in photolysis rate calculations. Section 2 provides a description of the model configuration, simulation setup and the observations used to evaluate the model output, calculations of the new lookup table for aerosol optical properties and a description of the revised photolysis rate calculations in GEM-MACH. The comparison of the updated MESSy-JVAL with the base offline version is presented in Sect. 3, followed by the results of different evaluations of the improved photolysis module: comparisons with observations, evaluations of the impacts of AOD calculations and model-generated aerosols on the photolysis rates calculations and a case study of photolysis calculations under high pollutant flux emissions conditions. The summary and conclusions of this study are presented in Sect. 4.
2.1 Overview
In order to improve the photolysis module and calculate aerosol feedbacks more accurately, we developed a new Mie lookup table for aerosol optical properties which was accessed within the improved version of MESSy-JVAL. An initial lookup table was calculated using the refractive indices of seven representative aerosol components and the Mie scattering code within the VECTOR model (McLinden et al., 2002). Using the hygroscopic growth factor of each aerosol type, we calculated the dry size parameter (Sect. 2.2, Eq. 1) of the initial lookup table, which was then interpolated into GEM-MACH dry size parameter. The final lookup table which was implemented into GEM-MACH is a function of GEM-MACH dry size parameters and wavelengths. The calculated aerosol composition and size in GEM-MACH was used as input for photolysis rate calculations, and a hybrid aerosol mixing state was assumed for size bins containing different concentrations of black carbon to calculate the optical properties of four aerosol categories: black carbon, sea salt, dust and other internally mixed components.
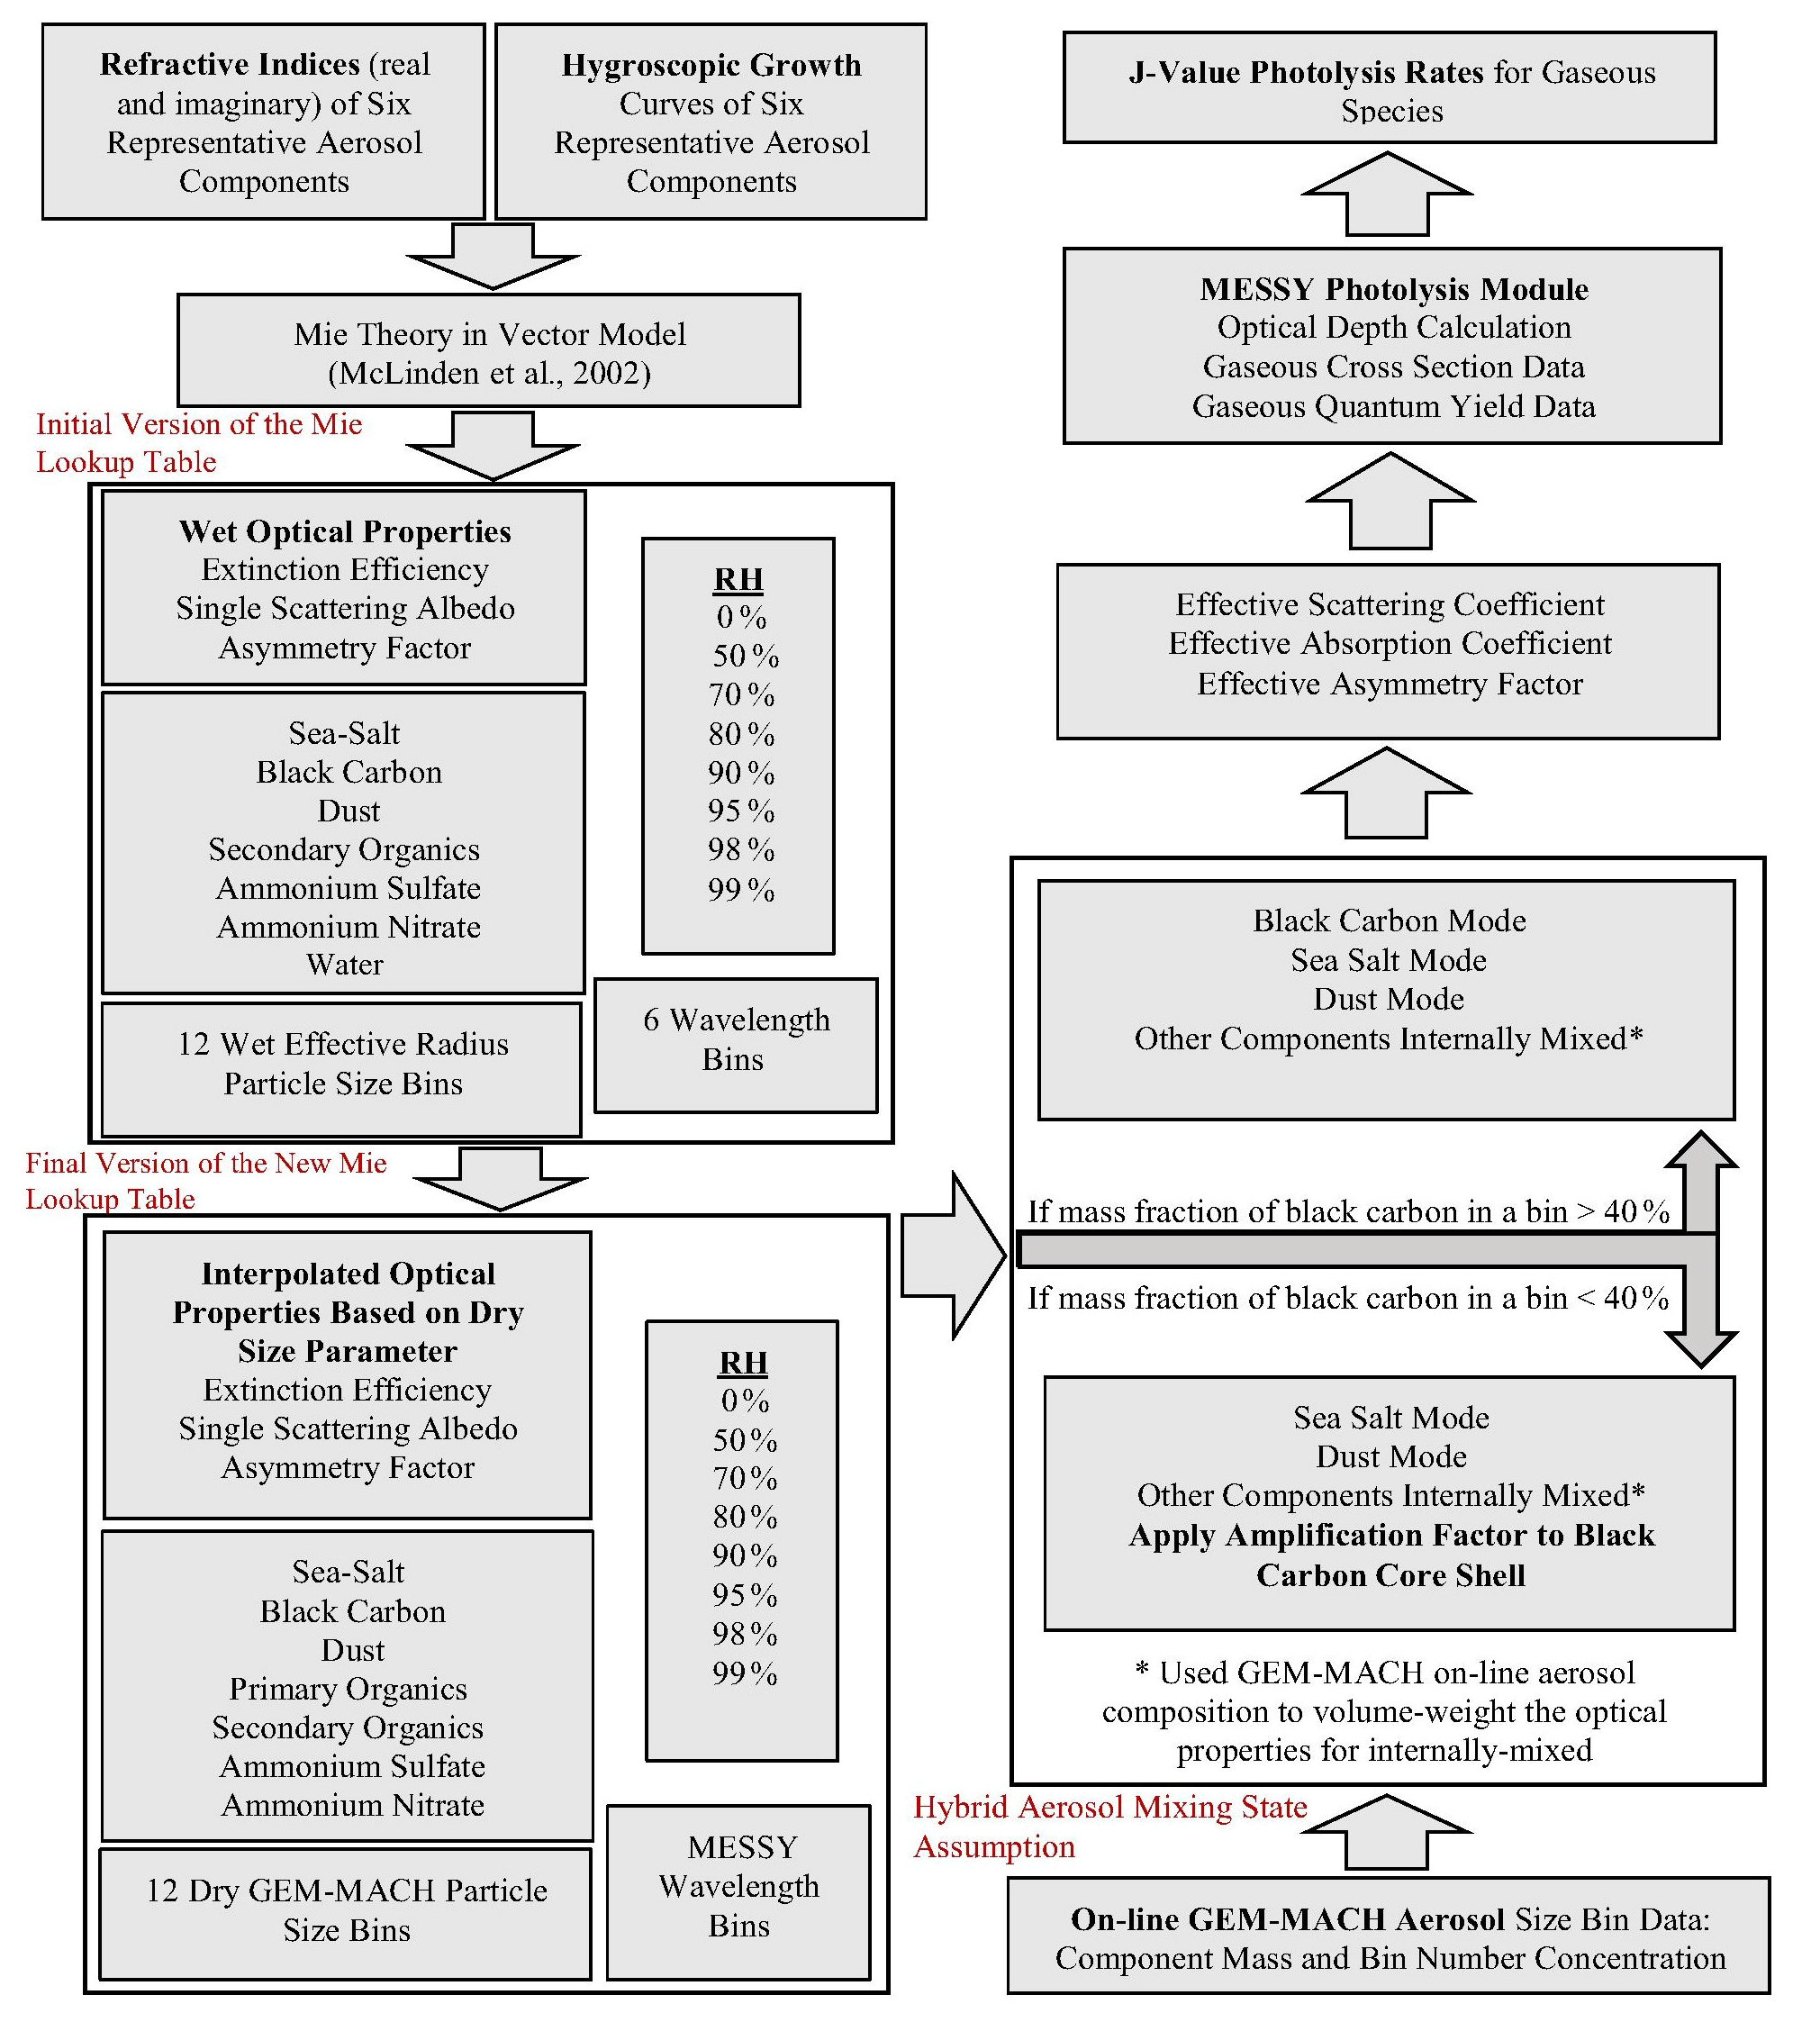
Figure 1Steps and methods in calculating the new Mie lookup table for photolysis rates in GEM-MACH. RH represents the relative humidity and λ is the wavelength.
Currently, there is a size-resolved (sectional) representation of atmospheric aerosol particles in GEM-MACH, which may be used for determining the impact of aerosol feedbacks on radiation and photolysis. When GEM-MACH's aerosol feedbacks are enabled, the aerosol direct effect makes use of a Mie scattering approach and the assumption of a binary mixture between dry aerosols and water for the complex refractive index (Makar et al., 2015a). For photolysis calculations as carried out here, we made use of GEM-MACH's calculated aerosol composition and size as input for photolysis rate calculations. The new algorithm uses the eight dry chemical components of GEM-MACH aerosol (sulfate, nitrate, ammonium, primary organic matter, secondary organic matter, black carbon, dust and sea salt) and reads in the data from the updated lookup table (see Sect. 2.2, 2.3, following) to calculate the scattering and absorption optical depth and asymmetry factor of black carbon, sea salt, dust and other internally mixed components. We used the black carbon particle size in GEM-MACH as an indicator of the mixing state of the internally mixed particles. For each GEM-MACH size bin, the mass fraction of black carbon to the total mass of all the other particles in that bin was calculated. Since the externally mixed black carbon particles are most common near combustion sources, if a GEM-MACH particle size bin contains a black carbon mass fraction that is near or larger than that of a typical combustion emission particle (the black carbon mass fraction of more than 40 %; Stevens and Dastoor, 2019), the particle bin was considered to be mostly black carbon, no absorption amplification factor was applied to black carbon photolysis rate calculations, and an external particle mixing state for that size bin was assumed (i.e., black carbon as a separate particle and a volume-averaged homogeneously mixture of ammonium sulfate, ammonium nitrate, primary and secondary organics). If the black carbon mass fraction for a particle size bin was less than 40 %, we assumed that black carbon is coated with other internal particle components, and a core-shell configuration was used for that size bin; the black carbon forms a core and other internal particle components (primary and secondary organic matter, ammonium sulfate and ammonium nitrate) form a shell. In this case, the black carbon is mixed with other condensed or coagulated components, the bin is more aged, and we apply a lensing correction factor to the black carbon absorption efficiency recommended by Bond et al. (2006). It should be noted that sea salt and dust were not included in the assumptions of the internally mixed particles, and in both cases mentioned above, those aerosols were considered as separate particles. These underlying assumptions were used for the calculations of the aerosol optical properties for four independent aerosol groups: sea salt, dust, black carbon and the internally mixed particles (see Fig. 1). We describe our methodology in more detail in the following sections.
2.2 Developing a new aerosol optical properties lookup table for MESSy
In order to update the aerosol effects in the MESSy photolysis module in GEM-MACH, we calculated a new lookup table using the Mie scattering code within the VECTOR model (McLinden et al., 2002) for extinction efficiency, single scattering albedo and asymmetry factor for seven aerosol types, which within the lookup table are treated as pure-composition particles of sea salt, black carbon, dust, ammonium sulfate, ammonium nitrate, organic carbon and pure water. The initial version of the new lookup table was calculated for single components, each with its own water uptake properties derived from the literature. One dimension of the table is the wet particle radius range for a logarithmically expanding set of cut sizes of the aerosol distribution of GEM-MACH (0–10, 10–20, 20–40, 40–80, 80–160, 160–320, 320–640, 640–1280, 1280–2560, 2560–5120, 5120–10 240 and 10 240–20 480 nm), five wavelengths (200, 300, 400, 600, 1000 nm) and seven different relative humidity levels (0 %, 50 %, 70 %, 80 %, 90 %, 95 %, 98 %, 99 %) for all aerosols except dust, which was assumed to have no water uptake. The effective wet particle radii were calculated based on a power-law distribution (Hansen and Travis, 1974) of each particle range. The relative humidity determines the water fraction for all other aerosol types. The selection of wider spacing at lower relative humidity and longer wavelength was due to the growing dependency of optical properties to increasing relative humidity and decreasing wavelengths. We assumed a flat distribution of aerosol radii within each bin size. The complex refractive indices of the water-soluble inorganic aerosols, namely ammonium sulfate, ammonium nitrate and sea salt, were calculated using the FORTRAN software developed by Andrew Lacis (https://www.giss.nasa.gov/staff/mmishchenko/ftpcode/lacis/lacis_refrac.rhwmri.f, last access: 1 December 2021), which has been used in many recent studies (Jeong, 2020; Bozzo et al., 2020; Escribano et al., 2014; Schuster et al., 2009). In this model, all aerosols are treated as homogeneous mixtures. Parametric formulas are derived for the changes in the real part of the refractive index, specific density, size and water activity as functions of mass fraction. These formulas are used to interpolate spectrally between the refractive indices of dry ammonium sulfate, sea salt and ammonium nitrate and those of water. For ammonium sulfate, the complex refractive index is from Toon et al. (1976). The water activity for this aerosol type is based on Tang and Munkelwitz (1994). For ammonium nitrate, the real and imaginary parts of the refractive index are from Tang et al. (1981) and Gosse et al. (1997), and the water uptake is from Tang (1996). The complex refractive index of sea salt is based on Shettle and Fenn (1979), which relies on Dorsey (1940).
Table 3Hygroscopic growth factors (HGFs) for black carbon (based on Lei et al., 2014).
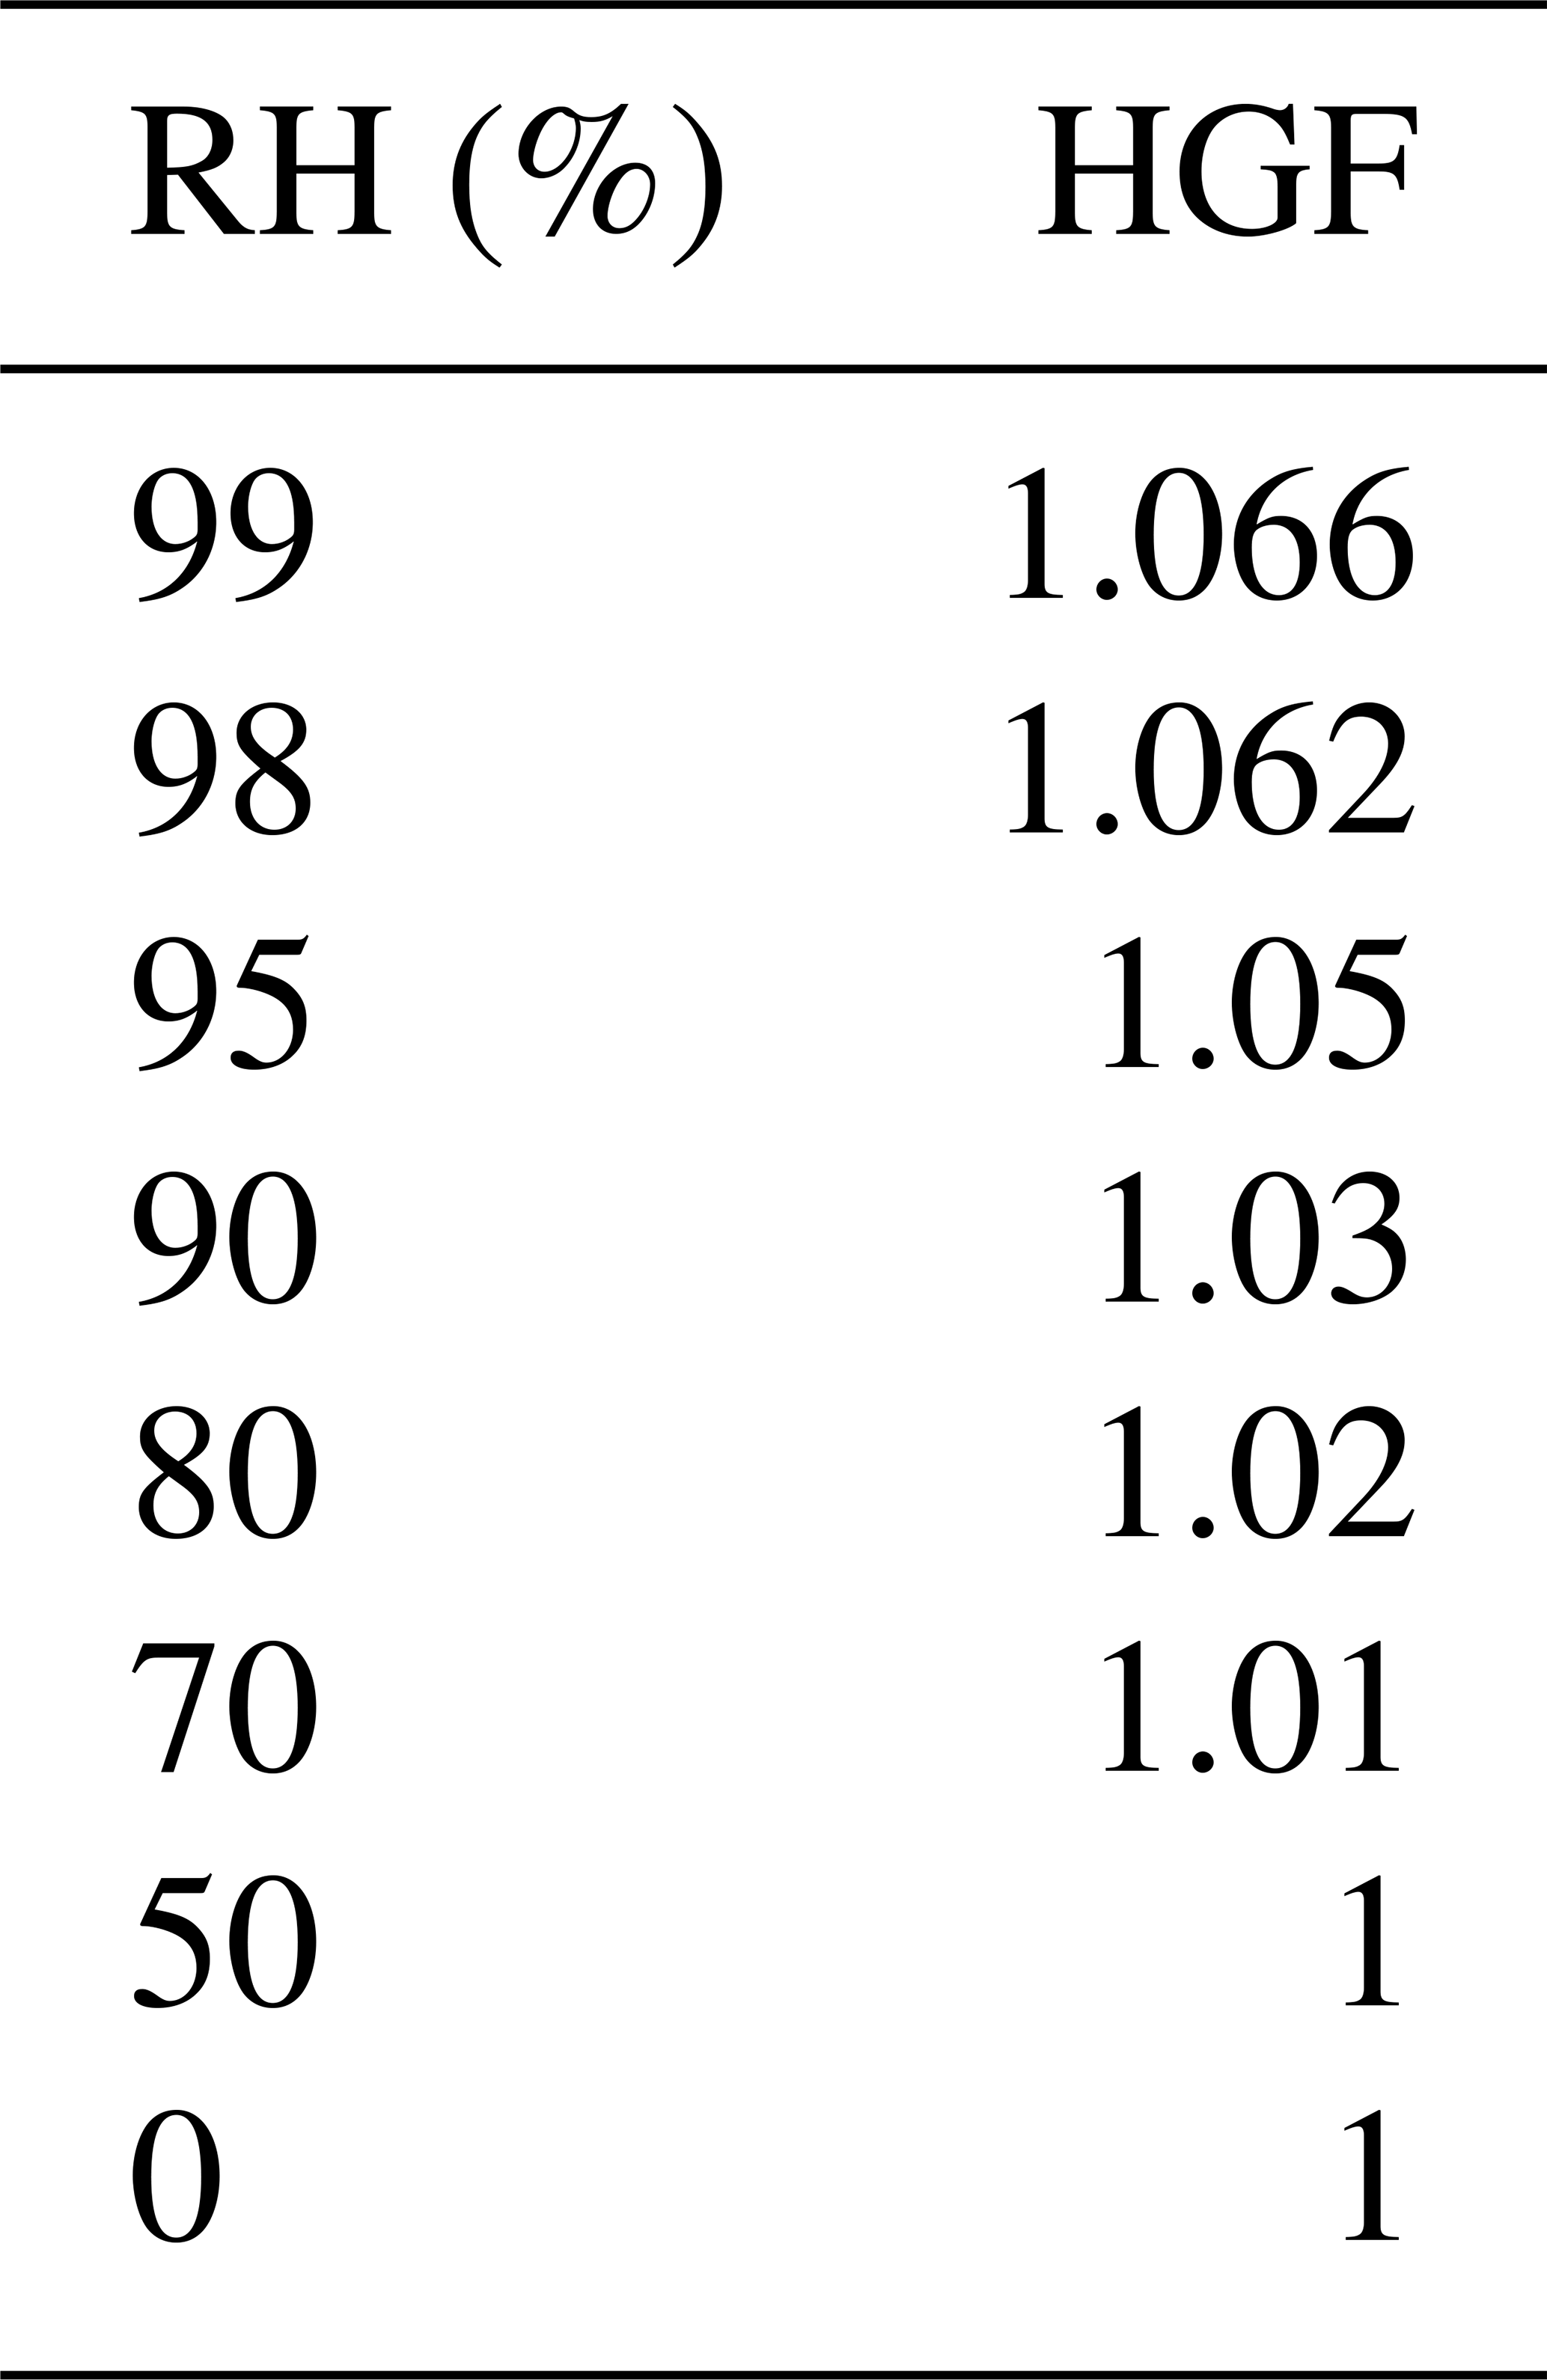
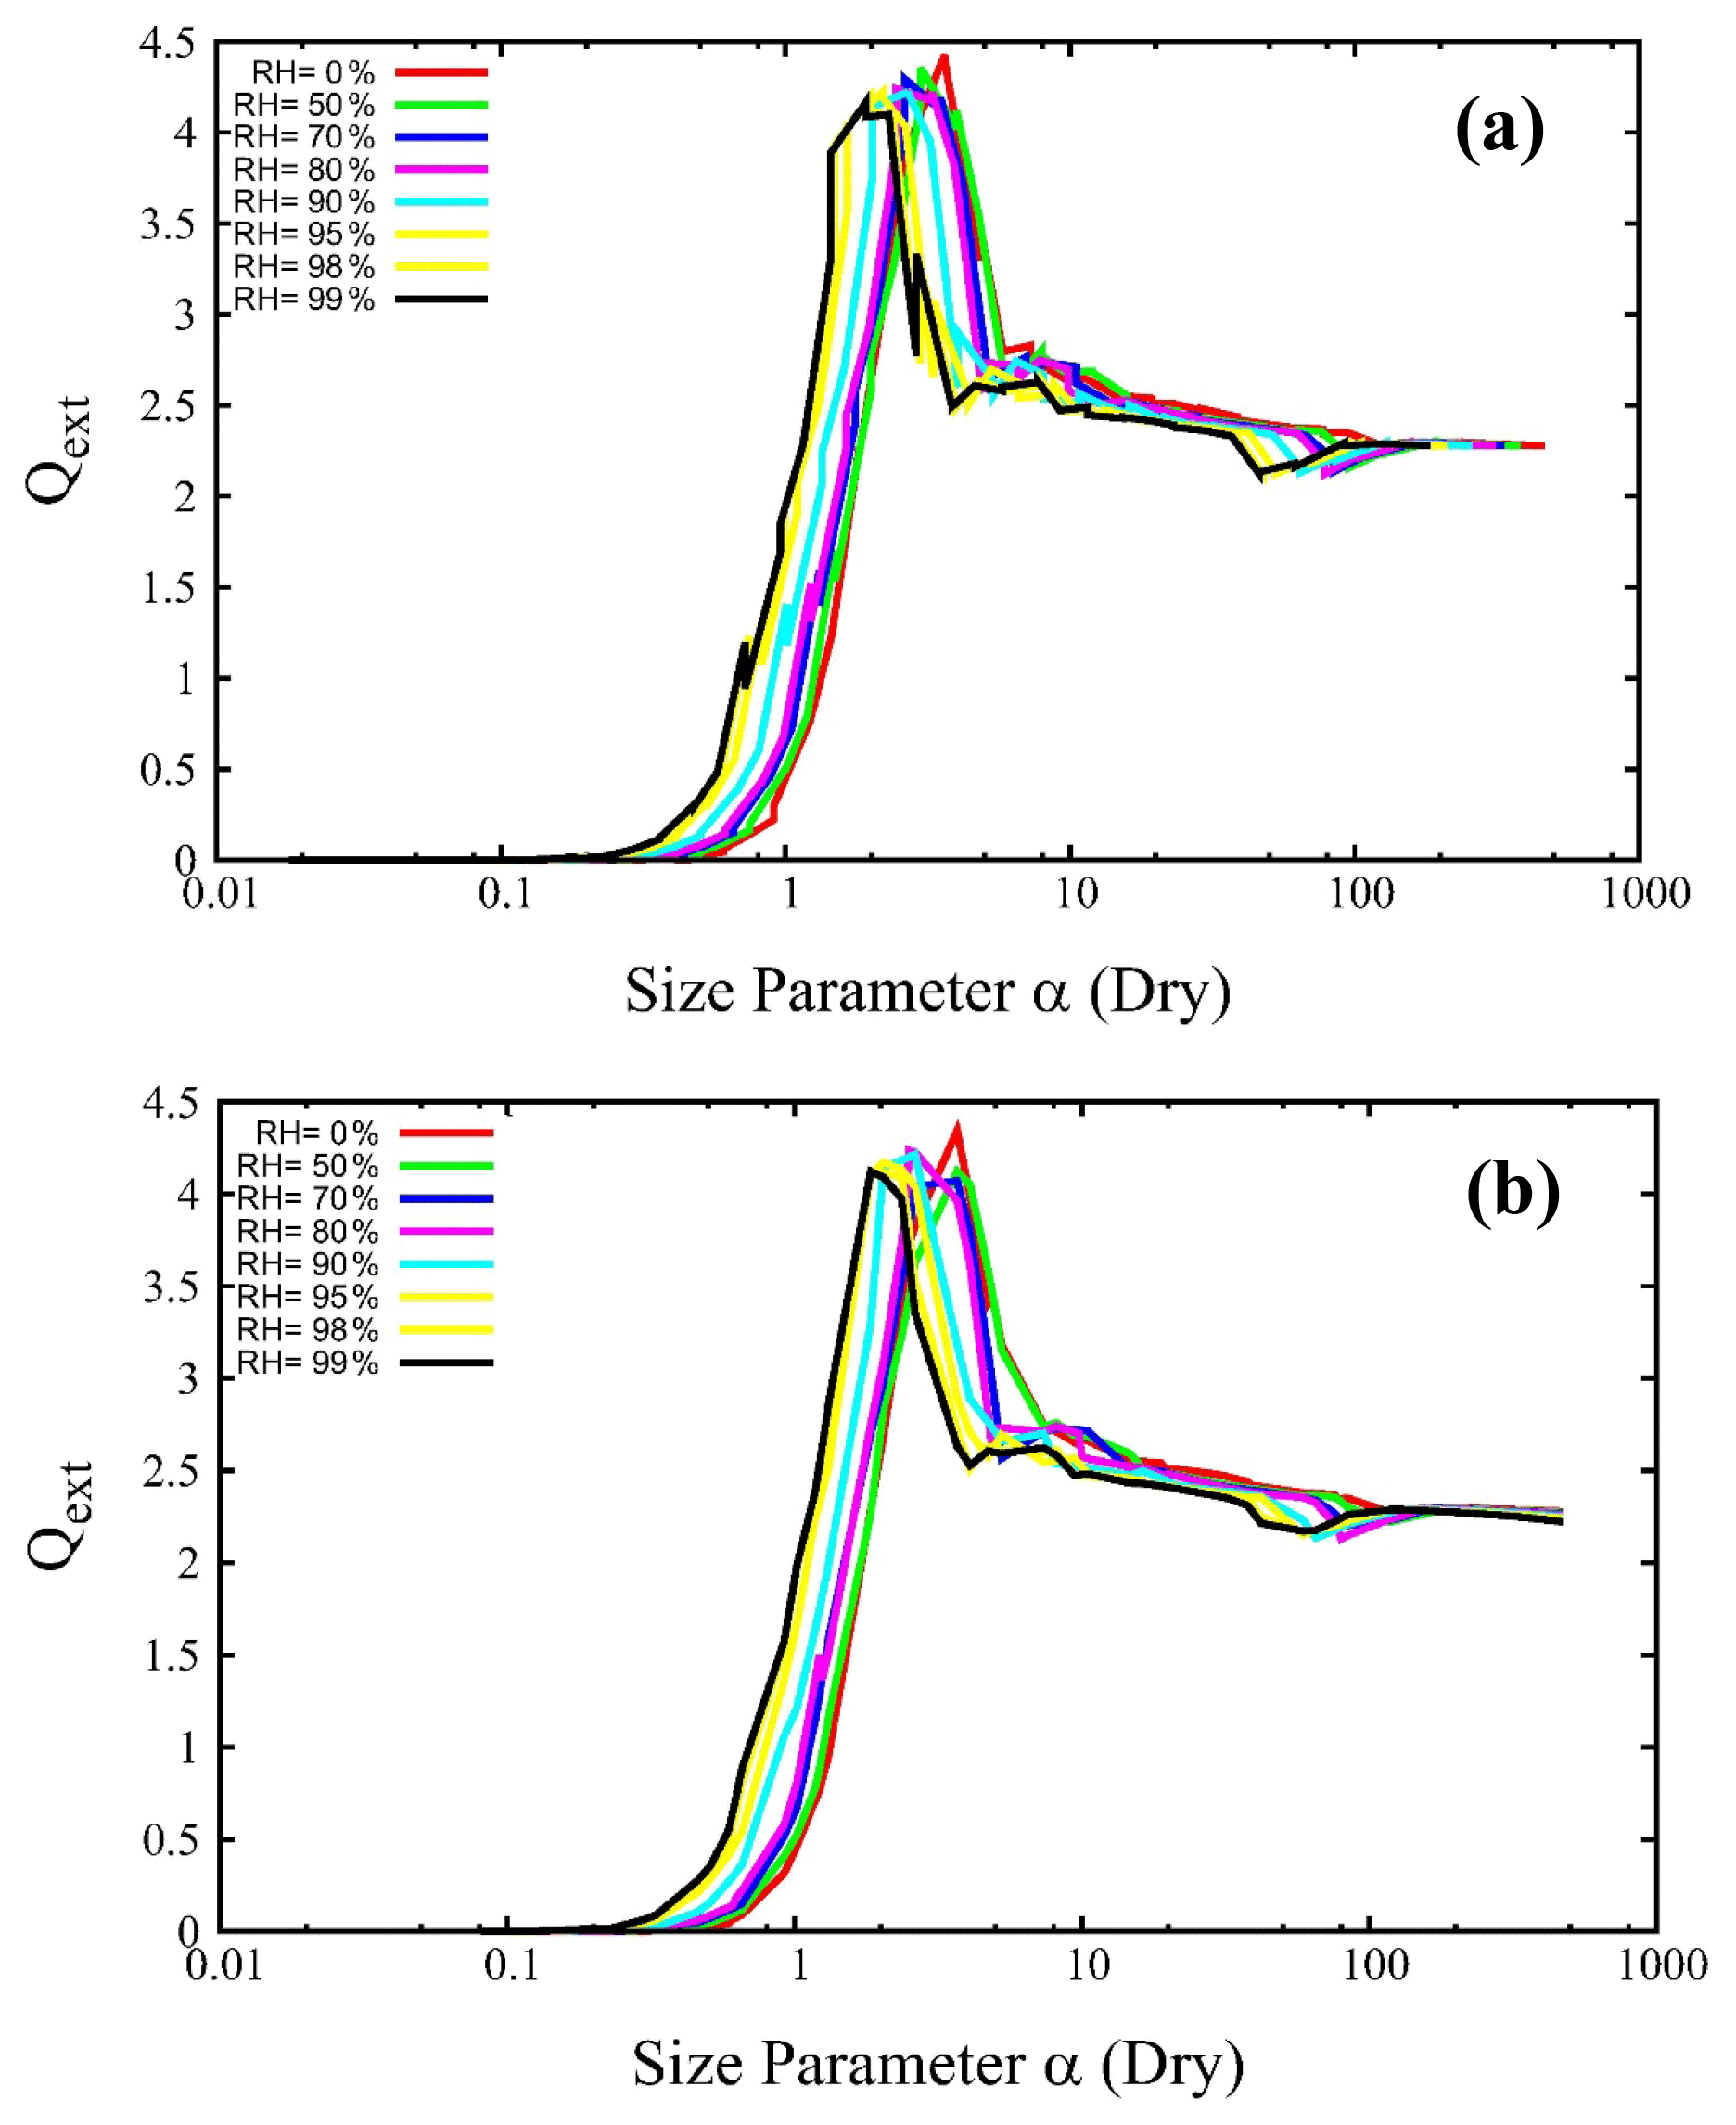
Figure 2(a) Initial and (b) interpolated Qext (extinction efficiency) vs. dry α (size parameter) for ammonium sulfate.
For dust, no water uptake, and thus no dependency on the relative humidity, has been assumed. The complex refractive index of dust is assumed to be independent of particle size and is obtained from the VECTOR model's library of refractive indices with the real part of the dust refractive index varying between 1.55 and 1.57 and the imaginary component increasing monotonically from 0.004i at 1000 nm to 0.025i at 200 nm. For organic carbon, the complex refractive index is wavelength dependent for all relative humidities and was extracted from Fast-JX, the photolysis mechanism used in GEOS-Chem. Fast-JX v7.0 calculates aerosol extinction efficiencies at five wavelengths: 200, 300, 400, 600 and 999 nm. The file jv_spec_mie.dat (http://rain.ucis.dal.ca/ctm/CHEM_INPUTS/FAST_JX/v2020-02/jv_spec_mie.dat, last access: 1 December 2021) in Fast-JX v7.0 contains the quantum yields and aerosol cross sections for photolysis. Real and imaginary parts of the refractive index of organic carbon at 98 % were obtained by linear interpolation between the indices at RHs of 95 % and 99 %. For black carbon, the dependence on relative humidity was based on hygroscopic growth factors (HGFs; the ratio of the wet particle radius to the dry particle radius) obtained from Lei et al. (2014) (Table 3). The RH-dependent refractive index (nRH) is a HGF3-weighted mean of refractive indices of pure black carbon (nBC) and pure water (nwater):
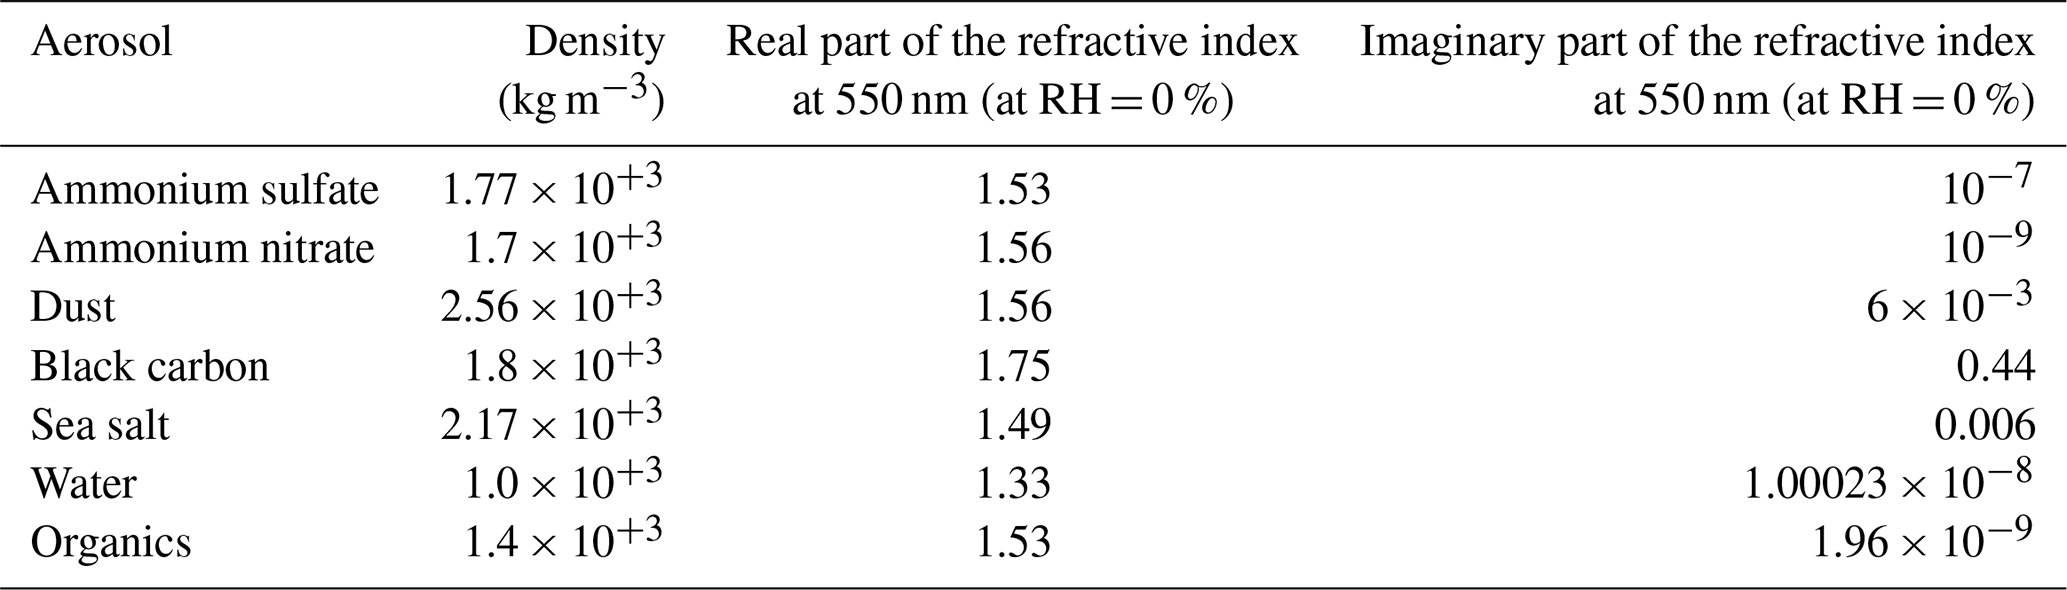
with water having a spectrally constant refractive index of 1.333 (with no imaginary component over the relevant wavelength range) and pure black carbon having a spectrally constant refractive index of 1.75–0.44i (Kou, 1996). The optical properties of the primary organics were calculated using the optical properties of secondary organics and pure water droplets and the hygroscopic growth factor of primary organics. The refractive index of each aerosol type can be found in Table 2. In order to employ the new lookup table in GEM-MACH, we developed a stand-alone FORTRAN code to interpolate the optical properties of aerosols into GEM-MACH wavelengths and size bins. The output of this offline program was used as the new lookup table for the improved version of the photolysis code discussed in this study. Here, we provide a brief description of the methods we used in our calculations.
Since the initial version of the new lookup table was calculated based on wet particle sizes, we used the hygroscopic growth factor of each aerosol type (Laskina et al., 2015; Lei et al., 2018; Zamora and Jacobson, 2013, and SOA is based on GEOS-Chem optical lookup table, jv_spec_mie.dat) at each relative humidity and the wet radius of each particle type to calculate the dry aerosol radius size.
Using the dry radius size and the wavelengths in the initial lookup table (200, 300, 400, 600, 1000 nm), the initial size parameter was calculated using
where αi is the initial size parameter, ri is the dry radius of the particle, and λi is the wavelength in the initial lookup table. Using the same formula, the size parameter for the final lookup table was calculated based on GEM-MACH average dry particle size bins (7.5, 15, 30, 60, 120, 240, 480, 960, 1920, 3840, 7680 and 15 360 nm) and wavelengths (205, 287, 302, 309, 320, 370 and 580 nm). The final lookup table components as a function of particle size were calculated by linear interpolation of GEM-MACH size parameter from the size parameter values in the initial version of the new lookup table (see Fig. 1). The initial and interpolated extinction efficiency of ammonium sulfate vs. dry aerosol size parameter is illustrated in Fig. 2. The final interpolated lookup table of extinction efficiency, single scattering albedo and asymmetry factor was used to calculate the absorption and scattering cross section and asymmetry factor of seven pure aerosol types (sea salt, black carbon, dust, ammonium sulfate, ammonium nitrate, primary organic carbon and secondary organic carbon) in GEM-MACH. The data in the lookup table are sorted by increasing size parameter values (based on the dry aerosol sizes) for each aerosol type and relative humidity; i.e., the optical properties in the lookup table depend on the water uptake for the given relative humidity.
2.3 Updating the photolysis module in the GEM-MACH inline chemical transport model
After calculating the new lookup table, we modified the MESSy-JVAL code to use the new lookup table, along with the calculated aerosol composition and size by GEM-MACH, as input for photolysis rate calculations. The new updated code uses the eight dry chemical components of GEM-MACH aerosol feedback (sulfate, nitrate, ammonium, black carbon, primary organic matter, secondary organic matter, dust and sea salt) and the data in the updated lookup table to calculate scattering and absorption optical depth and asymmetry factor of black carbon, sea salt, dust and other internally mixed components. The volume concentration of each aerosol type (m3 of each aerosol per m3 of air) was calculated using the GEM-MACH predicted mass concentration (µg kg−1) and the density (kg m−3) of each aerosol type (see Table 2). The number concentration of each aerosol (number of aerosols per 1 m3 of air) was calculated by dividing the volume concentration of the aerosol by the volume of each size bin. We used the predicted mass concentration of nitrate in GEM-MACH and the molecular weight of ammonium nitrate to calculate the mass concentration of ammonium nitrate. Finally, to conserve the mass of ammonium, and since ammonium sulfate, ammonium bisulfate and letovicite have very similar refraction indices, the remaining mass of ammonium and the mass concentration of sulfate were used to calculate the mass concentration of ammonium sulfate.
In order to implement the core-shell parameterization where the mass fraction of black carbon is less than 40 % in a particle bin in GEM-MACH, we calculated the number of particles with a black carbon core (NBC) and the mass concentration of black carbon (MBC) for those specific size bins. Using the two values, the dry black carbon core size was calculated as follows:
where rBC is the dry radius of the black carbon core of a particle and ρBC is the density of black carbon (void-free black carbon core density of 1.8 g cm−3; McMeeking et al., 2010). The total wet radius of a core-shell particle was calculated using the volume-weighted hygroscopic growth factor of the components in the core-shell particle and the total wet radius of the core (black carbon) and shell (secondary organics, ammonium sulfate and ammonium nitrate) in that particle. This information was used to calculate the size parameter of the black carbon core (αBC) and the total particle size parameter (αtotal). The absorption amplification factor for the case of black carbon core shell was calculated using the core-shell parameterization by Bond et al. (2006) with the observationally constrained maximum threshold of 1.93 (Bond et al., 2006). As described below, these parameters are used to provide an amplification factor based on previous core-shell Mie scattering calculations carried out by Bond et al. (2006).
Sea salt, dust and black carbon (when its mass fraction was >40 %) aerosols were assumed to be externally mixed at all times – their effective scattering coefficient (scac), absorption coefficient (absc) and asymmetry factors (asymc) of each of these aerosols were calculated using the elements of the lookup table and GEM-MACH's predicted concentrations for these aerosol species:
where subscript c denotes each aerosol category, for each size bin (i) in GEM-MACH (i=1 to 12), Qext is the extinction efficiency of each aerosol type, Ni is the number concentration of each aerosol type (cm−3), ri is the radius of bin i (cm), ssai is single scattering albedo of each aerosol type, ag is the asymmetry factor, and mfi is the fraction of the mass concentration of each aerosol type to the total mass concentration of all particles (the asymmetry factor was weighted by mass fraction for pure particles). In the case where the mass fraction of black carbon for a particle size bin was less than 40 %, the effective scattering and absorption coefficient of black carbon was calculated using
where rBC is the radius of black carbon core particle and amp is the absorption amplification factor by Bond et al. (2006), based on the black carbon core and shell size parameters. For the fourth aerosol category in each GEM-MACH size bin (volume-averaged internally mixed particles), we calculated the volume fraction (vf) of each component (ammonium sulfate, ammonium nitrate, primary and secondary organics) to the total volume of the internally mixed particles:
where vi is the volume concentration of each aerosol in the internally mixed particles, IM stands for the internally mixed particles, AS is ammonium sulfate, AN is ammonium nitrate, OC is secondary organic matter, and PC is primary organic matter. Equations (11) to (13) were used to calculate the effective scattering and absorption coefficients and asymmetry factor of internally mixed particles:
where the indices correspond to each aerosol type inside the internally mixed particles (ammonium sulfate, ammonium nitrate, secondary organic carbon, primary organic carbon). Note that the calculations using Eqs. (4) to (8) and (11) to (13) were done for each horizontal grid point, vertical level, wavelength and relative humidity.
We performed a linear interpolation of the relative humidity in the lookup table for all the aerosol types, with the exception of dust aerosol (which had no water uptake), to calculate the scattering and absorption coefficients at each given relative humidity in GEM-MACH. Scattering and absorption optical depth for each model layer and aerosol category were calculated by the following formula:
where τsca and τabs are the scattering and absorption optical depth of each aerosol category and dz is the vertical level thickness. The total scattering and absorption optical depth at each vertical level for each aerosol category (black carbon, sea salt, dust and internally mixed particles) was calculated using
In the above summations, c represents each aerosol category. Integrating the total scattering and absorption optical depth through the entire column at each grid point and for each wavelength (λ) gives the total modeled AOD at that wavelength. This information was used to calculate J values for photolysis reactions depending on the attenuation of the radiation stream by particles.
2.4 Simulation setup and emissions
For this study, we used GEM-MACH v2.4, with 12-bin average size distribution of particles, and online aerosol feedbacks between weather and air quality (Makar et al., 2015a, b). The model domain covers most of continental Canada and the United States with a horizontal grid spacing of 10 km, 80 hybrid vertical levels with a model top at 0.1 hPa, 15 min operator splitting time step and a 1 h output time step (Fig. 3). The meteorological initial and boundary conditions for our 10 km horizontal resolution simulations were from the operational Regional Deterministic Prediction System, ECCC's operational numerical weather predictions system (RDPS, Caron and Anselmo, 2014). The chemical boundary conditions are 3-month mean climatology from the global chemical transport model MOZART-4 (Model for Ozone and Related chemical Tracers, version 4; Emmons et al., 2010).
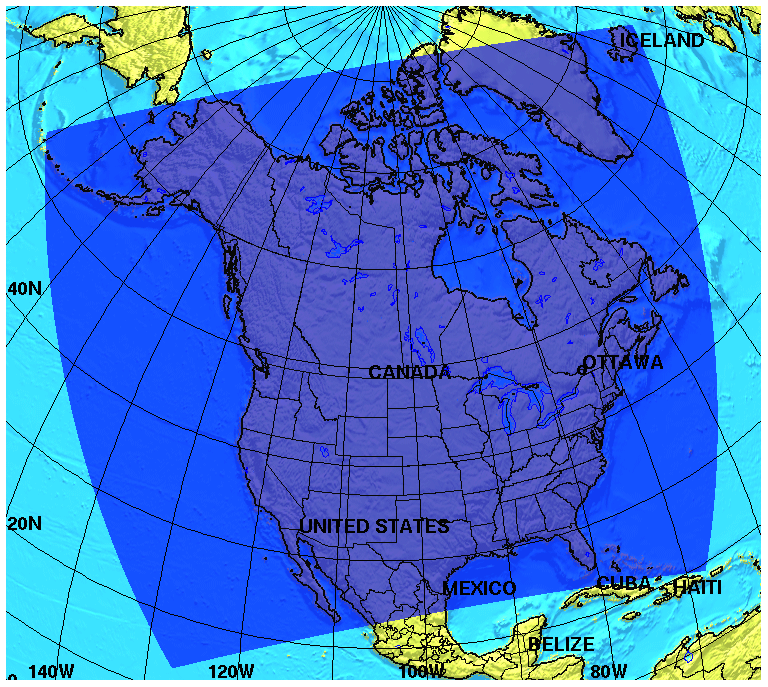
Figure 3GEM-MACH model North American domain, with 10 km × 10 km horizontal grid resolution.
The Canadian anthropogenic emissions used in our simulations were obtained from the Canadian Air Pollutant Emissions Inventory (ECCC, 2021a), including the 2015 Canadian area and point source emissions and 2013 Canadian transportation (on-road and off-road) emissions. A projected 2017 US anthropogenic emissions inventory was obtained from the US Environmental Protection Agency (EPA) 2011 air emissions modeling version 6.3 platform (EPA, 2021a; Eyth et al., 2013) and the 2008 Mexican inventory was obtained from the EPA's 2011 air emissions modeling version 6.2 platform (EPA, 2021b). The SMOKE (Sparse Matrix Operator Kerner Emissions; SMOKE, 2021) was used to prepare hourly gridded emissions files for GEM-MACH from these three national annual inventories. The North American wildfire emissions for the 2018 fire season were produced by the Canadian Forest Fire Emissions Prediction System (CFFEPS) developed by the Canadian Forest Service (CFS) of Natural Resources Canada. The CFFEPS model consists of a fire-growth model, a fire emissions model and a thermodynamic model to calculate fuel consumption, fire energy, the height of a smoke plume and emissions (Anderson et al., 2011; Chen et al., 2019). CFFEPS uses the Canadian Forest Fire Danger Rating System (CFFDRS), including the Canadian Fire Weather Index (FWI) system (Van Wagner, 1987) to provide input data on fuel moisture, and the Canadian Forest Fire Behaviour Prediction (FBP) system (Forestry Canada Fire Danger Group, 1992) for predictions of surface, crown and total fuel consumption. Smoke emissions input data for CFFEPS are collected by the Canadian Wildland Fire Information System (CWFIS, 2020; Lee et al., 2002). The model has been integrated into the ECCC FireWork air quality forecast system (Pavlovic et al., 2016) and has been operational since May 2019. The version of CFFEPS used in this work is described elsewhere (Makar et al., 2021).
2.5 Observations
Measurement data from MAIAC (Multi-Angle Implementation of Atmospheric Correction; Lyapustin et al., 2018), VIIRS (Visible Infrared Imaging Radiometer Suite; Hillger et al., 2013), the MERRA-2 reanalysis (Modern-Era Retrospective analysis for Research and Applications – version 2, GMAO, 2015) and AERONET ground-based measurements were used in this study to evaluate the modifications in the photolysis module in GEM-MACH.
MAIAC is an advanced algorithm which produces global AOD from MODIS (Moderate Resolution Imaging Spectroradiometer) Terra and Aqua satellite data. NASA's Terra and Aqua satellites are in polar orbits. The MODIS instruments have a global coverage of 1–2 d in 36 spectral bands between 0.405 and 14.385 µm. For the purpose of this study, we used MAIAC gridded daily average AOD data at 550 nm, with 1 km spatial resolution (Lyapustin and Wang, 2018). VIIRS is one of the Earth-observing instruments aboard the Suomi National Polar-Orbiting Partnership (Suomi NPP) satellite. Level 2 VIIRS AOD data at 550 nm with a spatial resolution of 6 km at nadir were used in this study (Kondragunta, et al., 2012). The MERRA-2 atmospheric reanalysis assimilation system produced by NASA's Global Modeling and Assimilation Office (GMAO) is the second and updated version of the original MERRA atmospheric reanalysis (Rienecker et al., 2011; Gelaro et al., 2017). MERRA-2 includes aerosol reanalysis using GEOS-5 coupled with the Goddard Chemistry, Aerosol, Radiation and Transport model (GOCART; Chin et al., 2002; Colarco et al., 2010). It uses the Goddard Aerosol Assimilation System (GAAS) along with standard meteorological parameters (Buchard et al., 2015, 2016, 2017). Quality-controlled AOD at 550 nm is assimilated every 3 h by MERRA-2 into GEOS-5/GOCART modeling system (Randles et al., 2017). The MERRA-2 reanalysis products use several satellite and ground-based measurement data, including MODIS Aqua and Terra, MISR and AERONET measurements. The monthly MERRA-2 aerosol optical depth analysis v5.12.4 data in this study (GMAO, 2015) were obtained from the Goddard Earth Sciences Data and Information Services Centre (GIOVANNI, 2020) platform, with a spatial resolution of 0.625∘ × 0.5∘ longitude by latitude.
For ground-based measurements, we used quality assured AERONET Sun photometer measurements of AOD at 500 nm for North American sites (Fig. 4). The Sun triplet measurements are performed every 15 min for older model 4 instruments and every 3 min for newer model 5 and CE318-T instruments (Giles et al., 2019). The AERONET data used in this study are cloud screened according to the AERONET V3 algorithm described in Giles et al. (2019). We used the Ångström exponents provided by the Sun photometer within AERONET data to evaluate the model AOD at 580 nm. The Ångström exponent (AE) represents the wavelength (λ) dependency of AOD, provides basic information about the size distribution of aerosols and is calculated by the following formula:
To calculate AOD at 580 nm, we used a variation of the above formula:
where AOD1 and AOD2 are the aerosol optical depth at 500 and 580 nm, and λ1 and λ2 are 500 and 580 nm wavelengths, respectively. We used (440–675 nm) Ångström exponent to obtain the observed AOD at 580 nm, which was used to compare with GEM-MACH output AOD calculated as described in Sect. 2.3.

Figure 4North American AERONET sites. AOD data from these stations are used in this study.
2.6 Simulation plan
We performed two simulations for June 2018 with the previous and improved versions of MESSy-JVAL and compared the results with AERONET measurements, to investigate the effects of the modifications of the photolysis module. In addition, we carried out an additional set of six simulations with the improved version of MESSy-JVAL for the months of January 2018 and June 2018. These simulations included different configurations for AOD calculations and interactive weather feedback in the GEM-MACH model and were used to evaluate the effects of AOD calculations and the online aerosol feedback on the photolysis rates over the entire North American domain and over specific industrial and urban areas. A list of all the simulations is given in Table 4. The spatial and temporal resolutions are the same (as described in Sect. 2.4) for all the simulations.
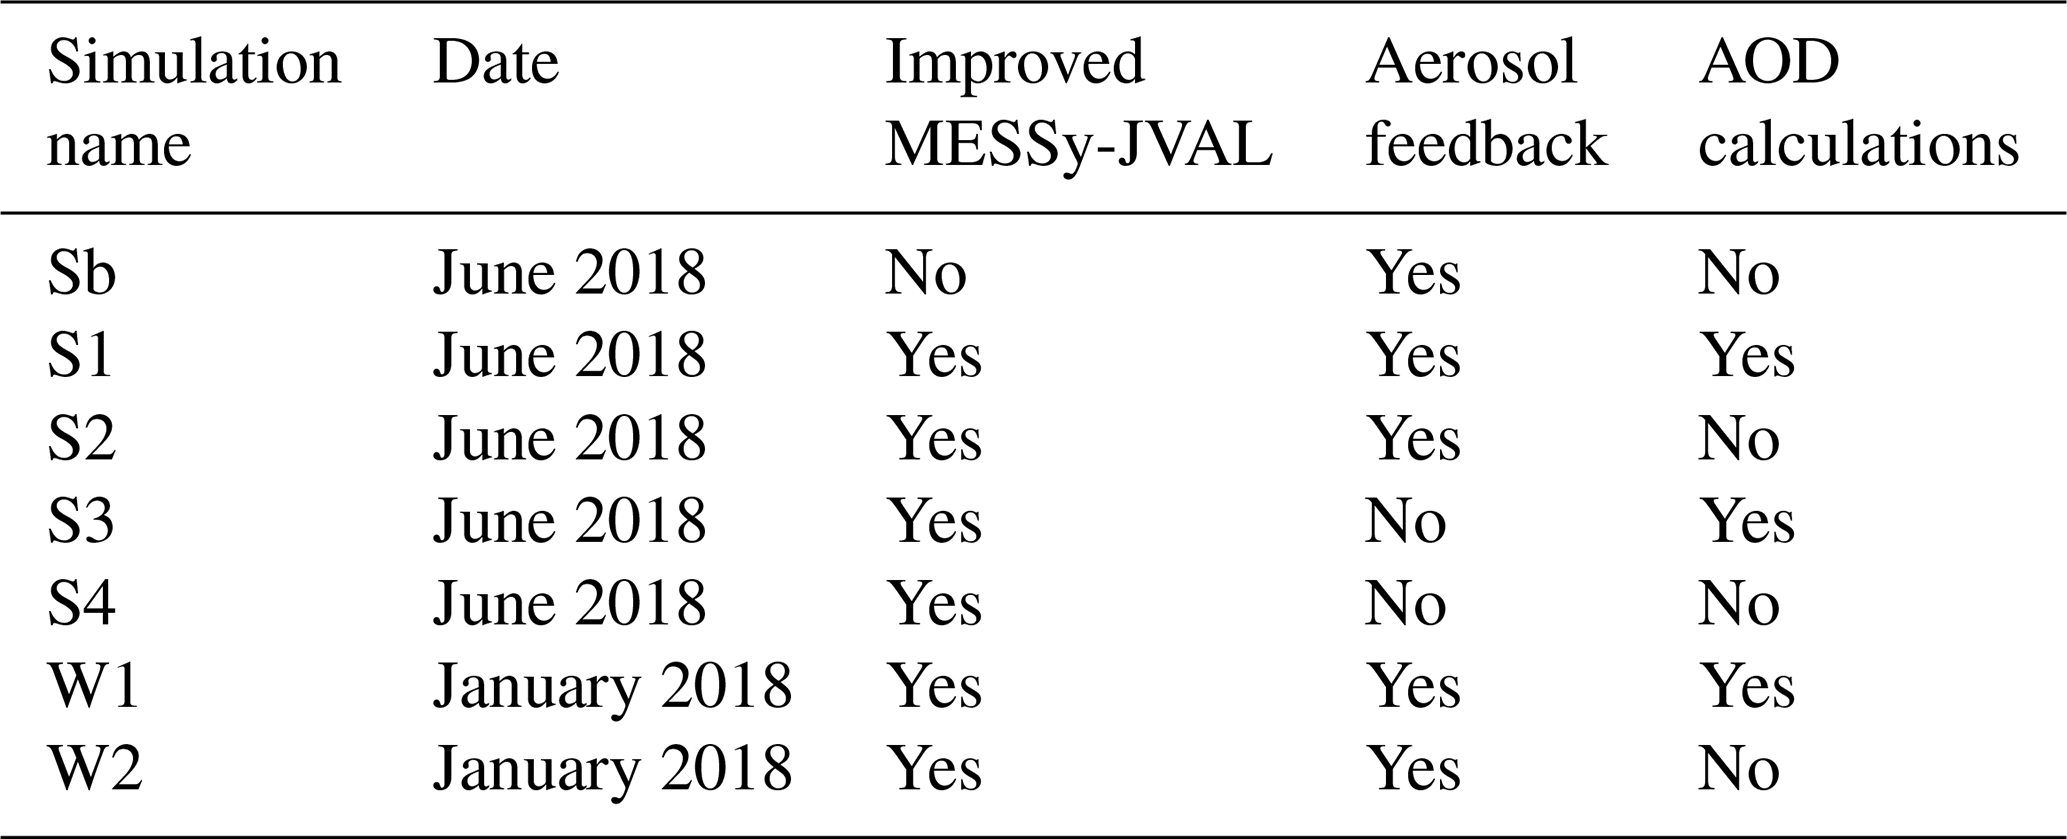
Note that in the “no-feedback” simulations, aerosol optical (and cloud condensation nucleation) properties come from default climatological properties used in the GEM weather forecast model (Makar et al., 2015a, b). That is, our “no-feedback” simulation is not a “no-aerosol” simulation – rather, the “no-feedback” simulation makes use of spatially invariant, “typical” optical properties of our weather forecast model. Having “no AOD” in this case means that model aerosol AOD had not been calculated since it is not used in the feedback code. Further, the aerosol feedback on meteorology code developed in a previous study for the GEM radiative transfer scheme (Makar et al., 2015a, b). In the feedback mode, GEM-MACH uses a separate Mie calculation for generating a lookup table online, using the particle mass size distribution predicted internally by MACH at each time step but with a single typical complex refractive index. In contrast, our photolysis rate calculations and the AODs we calculate in the current work are decoupled from this feedback portion of the model. Our next step in this work is to further modify the GEM radiation code to include the particle chemical composition online and our hybrid particle mixing state assumptions as an alternative to the existing AOD calculation within the feedback portion of the code.
3.1 Comparison of base and improved MESSy-JVAL
In this section, the results of two simulations with the GEM-MACH model for the month of June 2018 are compared to AERONET Sun photometer measurements of AOD at 500 nm at four North American sites (shown in Fig. 4): simulation Sb with the previous version on MESSy-JVAL (base) and simulation S1 with the improved photolysis module (see Table 4). The simulated GEM-MACH AOD output was compared with AERONET Sun photometer measurements of AOD at 580 nm for all North American sites in Fig. 4. As mentioned in Sect. 2.5, we used (at 440–675 nm) the Ångström exponent to obtain the AERONET AOD at 580 nm. The statistical analysis of the output from the two GEM-MACH simulations (base and improved) and AERONET AOD at 580 nm for June 2018 at four Canadian sites – Egbert, Fort McKay, Saturna Island and Toronto – are shown in Fig. 5. As shown in these plots, the normalized mean bias (NMB), which represents the mean paired differences between the model and measurements normalized by the mean measurements, ranges within ±13 % for the improved version and 0 %–150 % for the base version. The NMB calculations from the improved version show an overprediction of AOD in Saturna Island and an underprediction of AOD in Toronto, Fort McKay and Egbert, whereas the base version shows a significant overprediction of AOD for all four sites. The root mean square error (RMSE) is significantly smaller in the improved version, with less variability around the mean as shown in the standard deviation (σ) plots. The correlation coefficient plots show better results with the improved version of MESSy-JVAL for all four sites. We calculated a correlation relation of R=0.17 for the base run and R=0.37 for the improved version for all North American AERONET sites.
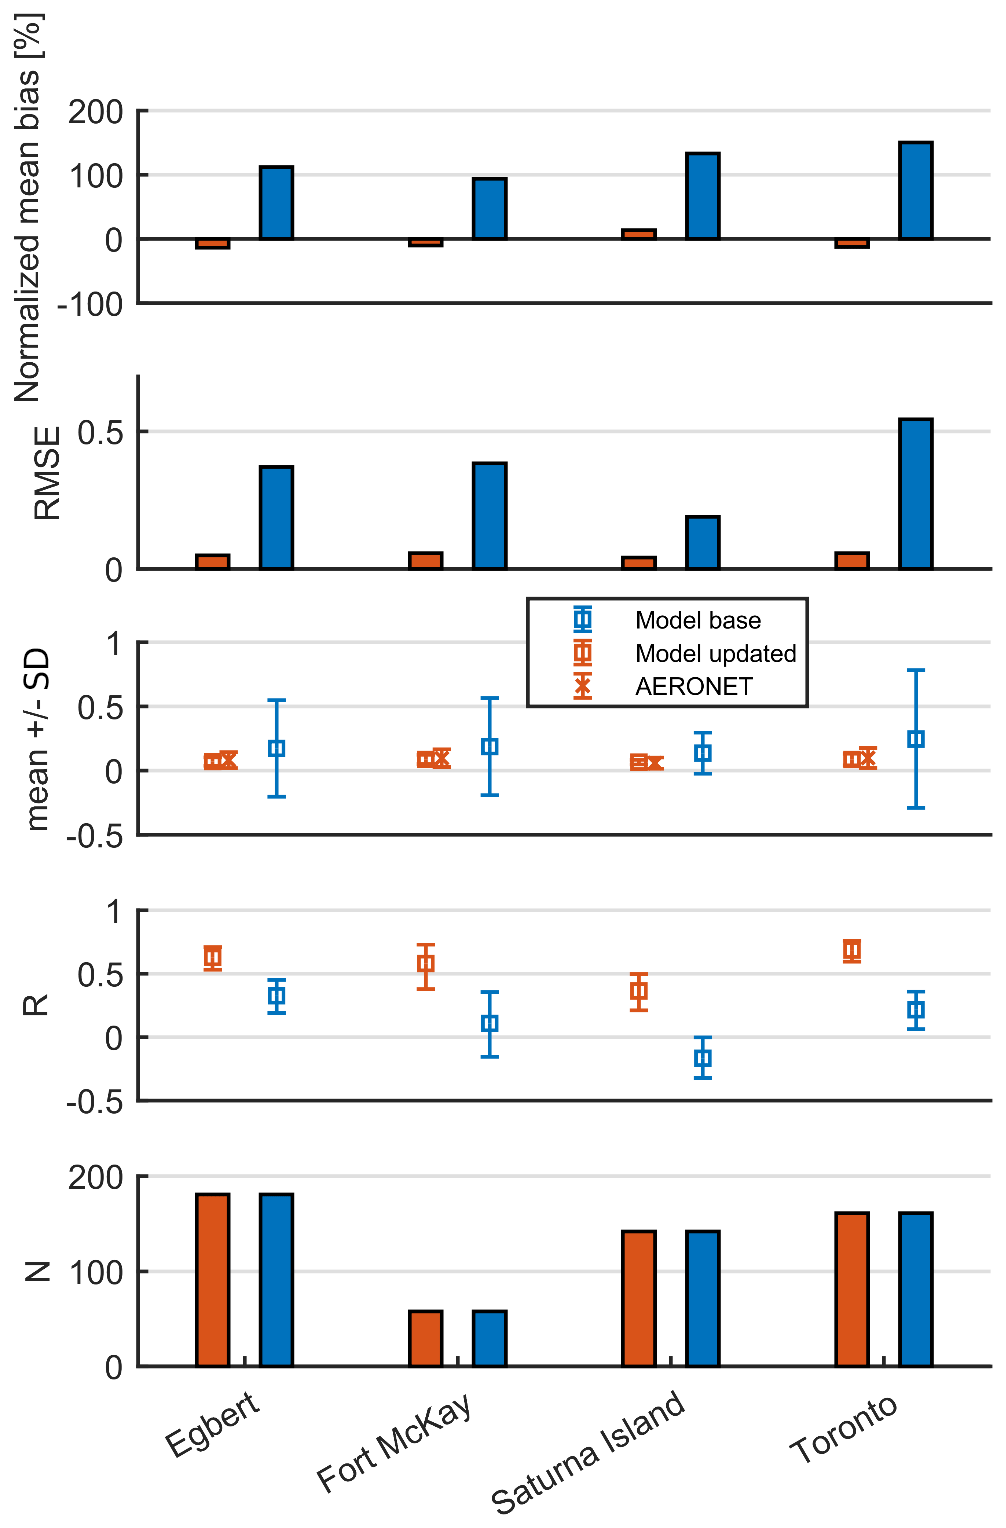
Figure 5Statistical scores of GEM-MACH AOD with the previous (base) and the improved version of MESSy-JVAL vs. AERONET AOD at 580 nm in June 2018 at four Canadian AERONET sites: Egbert (44.23∘ N, −79.78∘ W), Fort McKay (57.18∘ N, −111.64∘ W), Saturna Island (48.78∘ N, −123.13∘ W) and Toronto (43.79∘ N, −79.47∘ W).
The base MESSY module uses a climatology for aerosol number density with one fixed vertical profile for grid cells over land and another fixed vertical profile over water (see Table 1). The uniformity of the fixed profiles does not account for the real atmospheric variability resulting in the larger differences between model and observed aerosol optical depths for the base MESSY version.
3.2 Evaluation of the improved MESSY-JVAL
In this section, we evaluate the GEM-MACH output with the improved photolysis module against the observations and assess the effects of (1) AOD calculations (vs. an assumed aerosol optical depth of zero) and (2) interactive aerosol feedback with the GEM model, on the resulting calculated photolysis rates (see Table 4).
3.2.1 Comparison with observations
As described in Sect. 2.6, we performed six simulations for the months of January and June 2018, using the GEM-MACH model with the updated lookup table and photolysis module. We compared the simulated GEM-MACH AOD with AERONET Sun photometer measurements of AOD at 580 nm (converted from AOD at 500 nm using the 440–675 nm Ångström exponent) for the entire simulation period (January and June 2018) and for all North American sites in Fig. 4.

Figure 6Time series of hourly AERONET and GEM-MACH AOD at 580 nm at the Fort McKay (57.18∘ N, −111.64∘ W) and Toronto (43.79∘ N, −79.47∘ W) AERONET stations. (a, b) June 2018, (c, d) January 2018. The zero simulated values of AOD (black dots on the x axis) represent no calculation of molecular dissociation by sunlight in the model during nighttime hours.
Figure 6 illustrates the time series of AERONET and GEM-MACH hourly AOD output at 580 nm for the Fort McKay and Toronto AERONET sites. The output from simulations S1 (with AOD calculations and online aerosol feedbacks, June 2018) and W1 (with AOD calculations and online aerosol feedbacks, January 2018) were used to plot these time series.
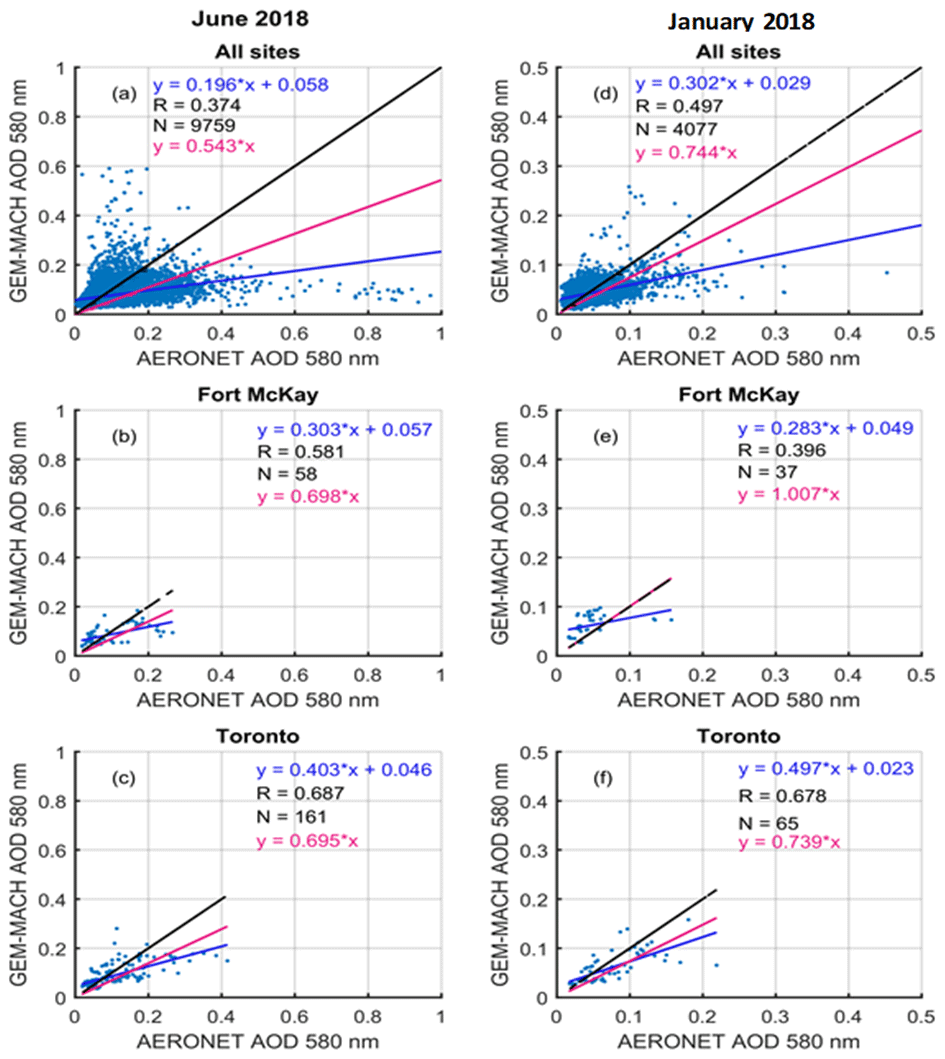
Figure 7Scatter plots of AERONET AOD vs. GEM-MACH AOD at 580 nm for all North American sites, Fort McKay (57.18∘ N, −111.64∘ W) and Toronto (43.79∘ N, −79.47∘ W) AERONET stations. Correlation coefficient (R) is calculated for the line with dynamic intercept (blue line). (a, b, c) June 2018, (d, e, f) January 2018. The blue line represents the linear fit and the red line is the zero-intercept linear fit. The 1:1 line is shown in black.
As shown in this figure, the sample size for Toronto is larger than that for Fort McKay for both seasons. During the sampling period in the summer of 2018, there was an instrument malfunction at Fort McKay from 19 June to 20 August, which led to it having a smaller number of data points at this site compared to Toronto. As shown in these time series, the maximum value of the modeled AOD was underestimated compared to AERONET data for both sites and both simulation periods. For example, the maximum AERONET AODs for the month of June in Fort McKay and Toronto were ∼0.27 and ∼0.42, respectively, whereas the GEM-MACH AODs (simulations S1 and W1) were ∼0.19 and ∼0.29 for those sites.
Scatter plots of AERONET AOD vs. GEM-MACH AOD (from simulations S1 and W1) at 580 nm for all North American sites, Fort McKay and Toronto AERONET stations are shown in Fig. 7. The total number of measurements is N=9759 for summer and N=4077 for winter for all AERONET sites. As shown in the top row of Fig. 7, the correlation coefficient (R) between the model and measurements is 0.37 for summer and 0.49 for winter. There is a higher correlation for Toronto compared to Fort McKay for both seasons.
The statistical scores of GEM-MACH vs. AERONET AOD at 580 nm for January and June 2018 at four Canadian AERONET sites – Egbert, Fort McKay, Saturna Island and Toronto – are shown in Fig. 8. It should be noted that the number of coincident data points is considerably smaller in winter. As shown in these plots, the normalized mean bias (NMB) ranges within ±13 % in summer and ±32 % in winter. The NMB calculations show an overprediction of AOD in Saturna Island for both seasons and Fort McKay in winter, whereas there is an underprediction of AOD in Toronto and Egbert for both seasons. The root mean square error (RMSE) plots show a better fit of the model AOD to measurements in winter season. The standard deviation (σ) plots show more variability around the mean in AERONET measurements for both seasons compared to model values.
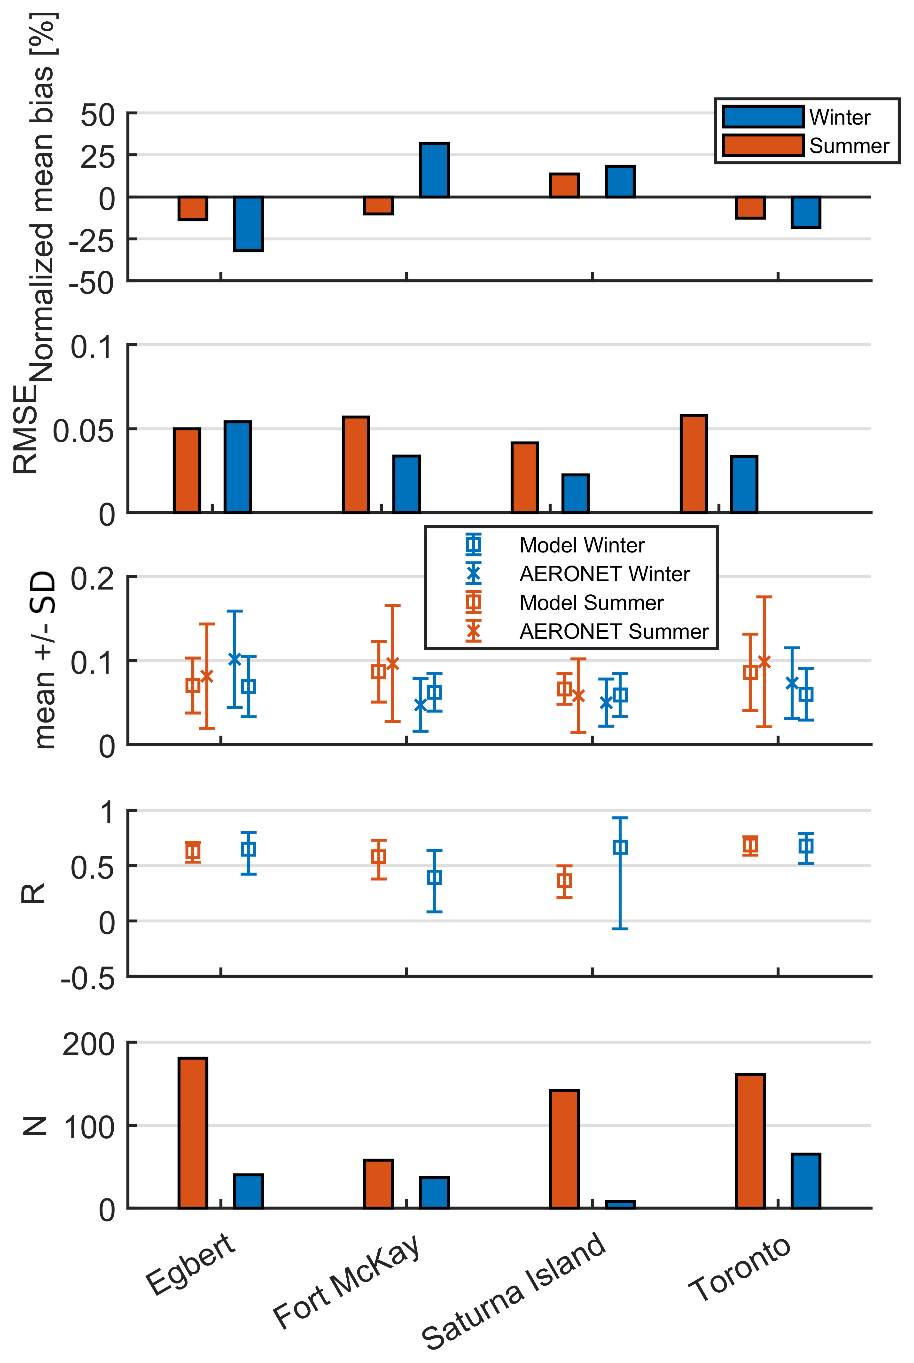
Figure 8Statistical analysis of GEM-MACH AOD vs. AERONET AOD at 580 nm in January and June 2018 at four Canadian AERONET sites: Egbert (44.23∘ N, −79.78∘ W), Fort McKay (57.18∘ N, −111.64∘ W), Saturna Island (48.78∘ N, −123.13∘ W) and Toronto (43.79∘ N, −79.47∘ W).
Figure 9 shows the monthly averaged daytime AOD at 580 nm from GEM-MACH simulations and MERRA-2 reanalysis. The total monthly averaged aerosol Ångström parameter (470–870 nm) and Eq. (20) were used to calculate MERRA-2 AOD at 580 nm (with different scales in summer and winter plots). As shown in the summer plots, GEM-MACH captured four major forest fire events during the month of June 2018: the Lac La Loche forest fire in Saskatchewan (25 June 2018), La Plata County's 416 fire in Colorado (1 June 2018), Ute Park fire in New Mexico (1 June 2018) and Gila National Forest fire in New Mexico (May–July 2018). Higher values of AOD over the Pacific Ocean over the month of January 2018 can be seen on both GEM-MACH and MERRA-2 plots. As shown in Fig. 9d, there is an AOD hotspot over central Alberta in January which was not captured by GEM-MACH (Fig. 9b). The location of the hotspot in central Alberta in the winter season in the MERRA-2 product is coincident with the location of coal-fired power plants and oil refinery emissions of SO2. This could be the result of different SO2 emissions used in MERRA-2 and GEM-MACH models, or an overprediction error when sulfate aerosol is retrieved over a snow covered surface. Over the common domain, there is an underestimation of monthly average AOD in the GEM-MACH model compared to MERRA-2 for both seasons.
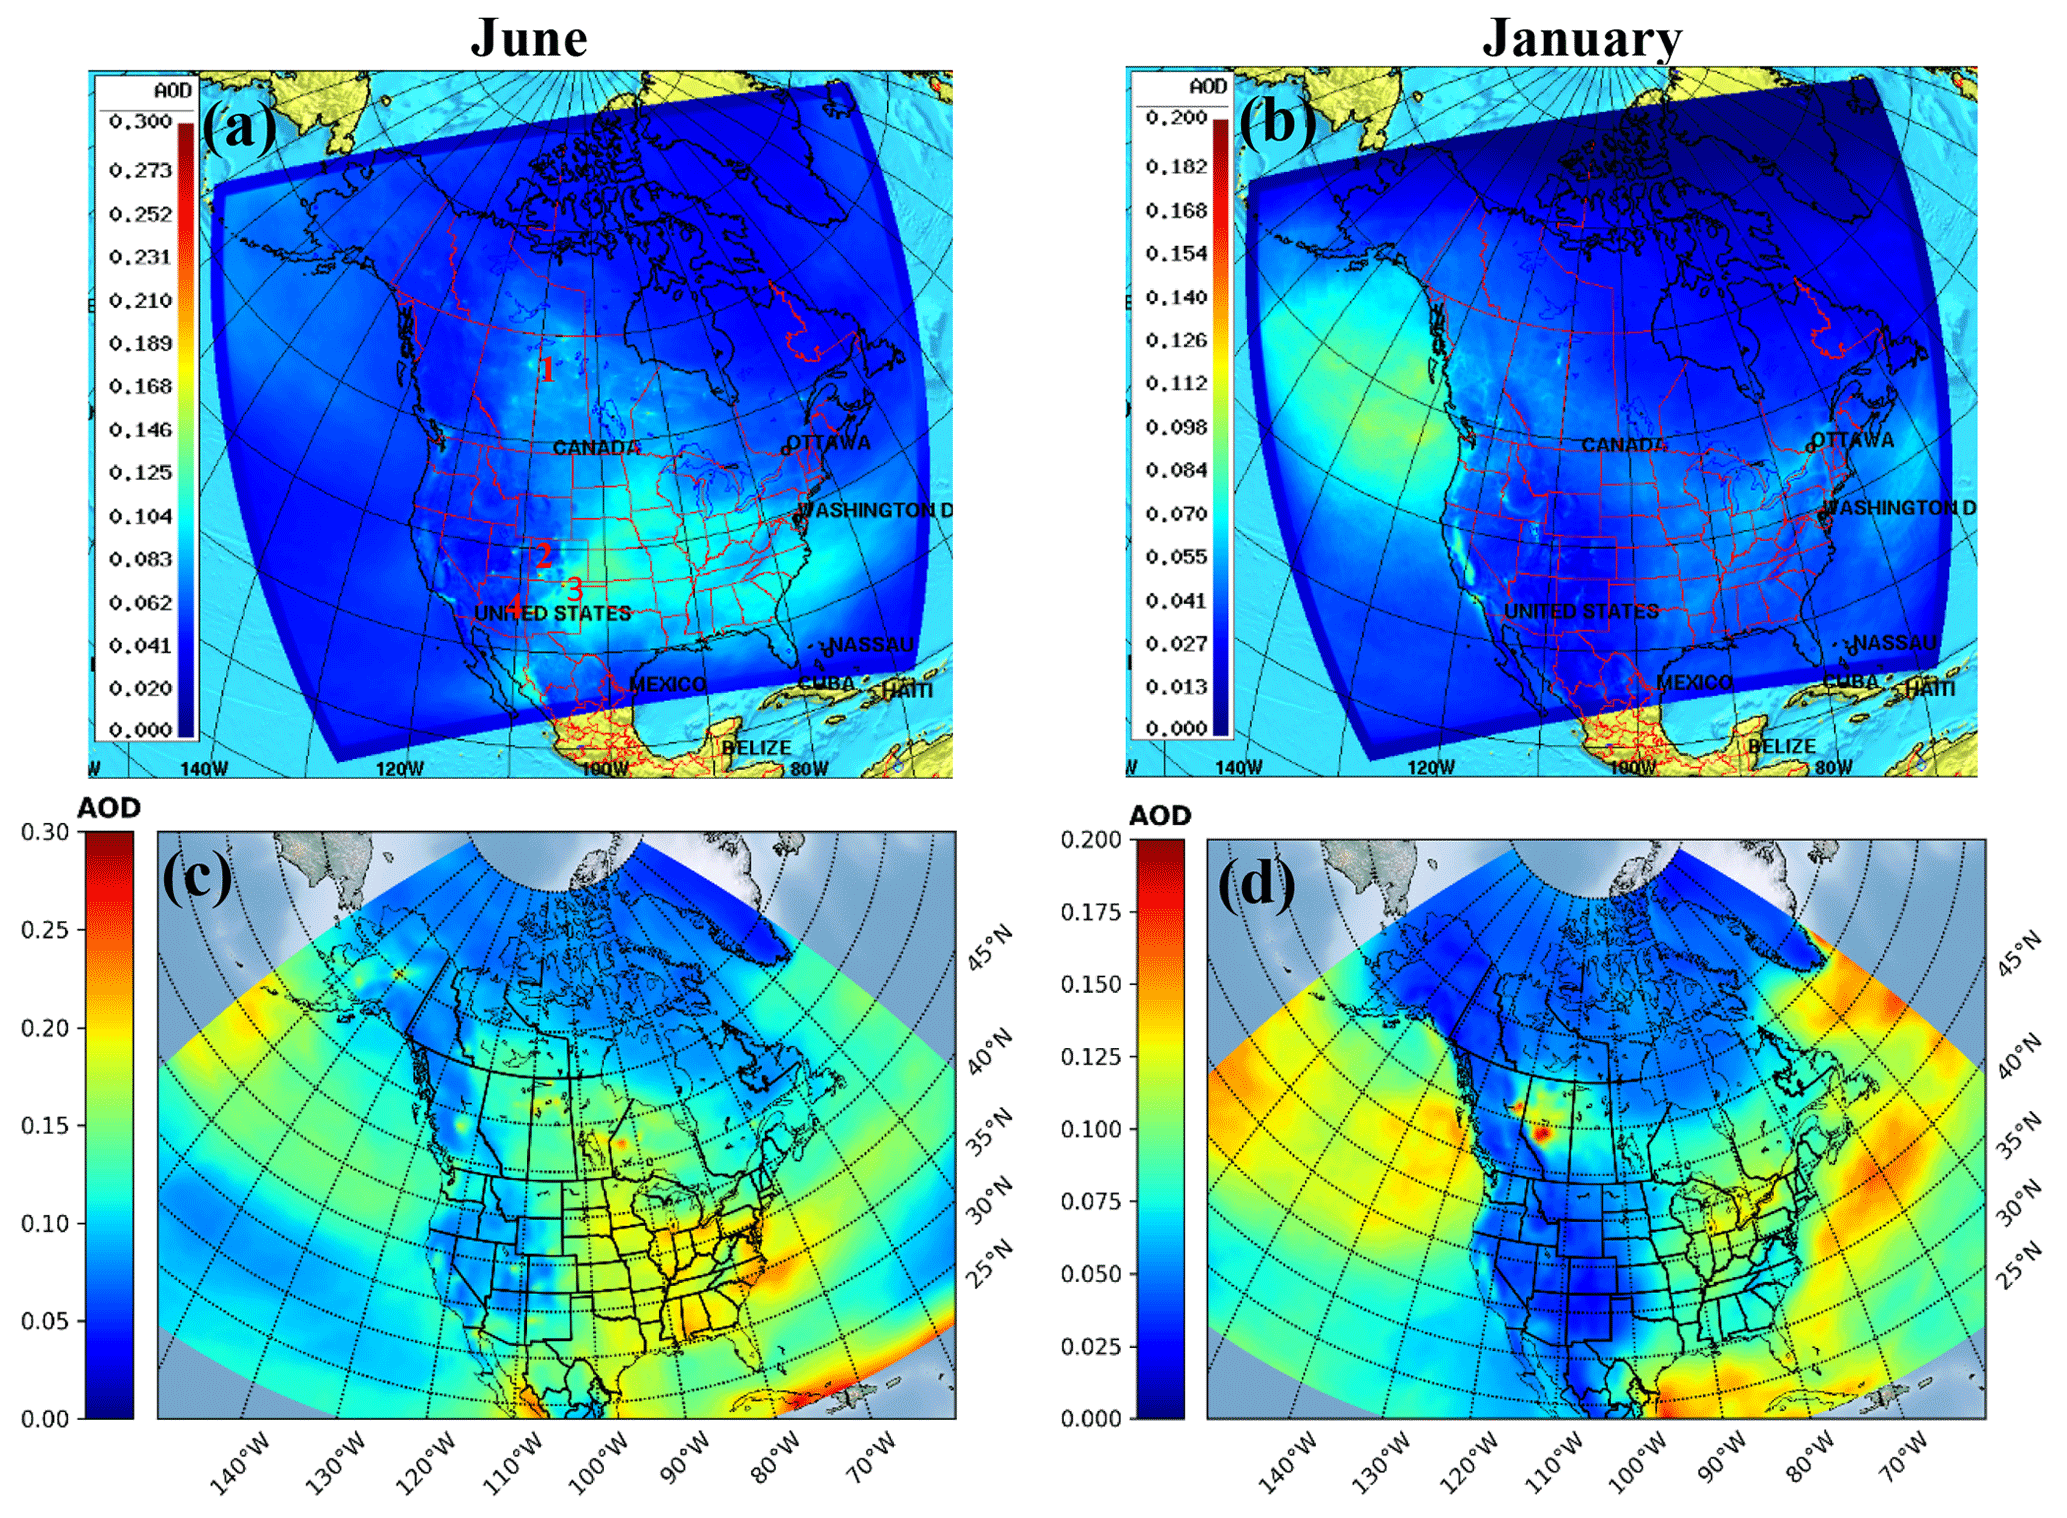
Figure 9Monthly average daytime AOD at 580 nm from GEM-MACH and MERRA-2 model. Left column: June 2018 (a) GEM-MACH AOD (c) MERRA-2 AOD. Right column: January 2018 (b) GEM-MACH AOD (d) MERRA-2 AOD. Four major forest fire events in June 2018 shown in GEM-MACH output (a): (1) Lac La Loche forest fire, (2) 416 fire, (3) Ute Park fire and (4) Gila National Forest fire.
3.2.2 Sensitivity test to AOD calculations and aerosol feedback
In this section, we evaluate the impacts of AOD calculations on photolysis rates calculations with the improved photolysis module in the GEM-MACH model. We also assess the effects of the model-generated aerosols on the radiative transfer and cloud formation processes in GEM-MACH through the comparisons of the optical properties of aerosols in the “feedback” mode (Makar et al., 2015a, b) vs. the “no-feedback” mode, in which the feedback mechanisms (interactions between meteorology and chemistry) have been disabled and the model uses climatological parameterizations for the aerosol direct and indirect effects.
Figure 10 shows the monthly average percentage difference in photolysis rate coefficients (J(O1D) and J(NO2)) with and without AOD calculations in the photolysis module in GEM-MACH model. The top two panels are the simulation outputs with online aerosol feedback between weather and air quality in the model. We used the output from simulations S1 and S2 to calculate the percentage difference in photolysis rates in Fig. 10a and b, and the output from simulations W1 and W2 in Fig. 10c and d. The percentage difference in summer (top row) and winter (second row) ranges from −10 % to 10 % and the spatial distribution of the changes does not vary significantly between J(O1D) and J(NO2). The bottom row of Fig. 10 shows the monthly average percentage difference in J(O1D) and J(NO2) at the lowest model level (June 2018) with and without AOD calculations. The output from simulations S3 and S4 was used in Fig. 10e and f, meaning there is no online aerosol feedback in these simulations. As shown in Fig. 10e and f, there is not a significant change in monthly averaged photolysis rates (−0.1 % to 0.1 %) with no online aerosol feedback on weather in the model (Fig. 10e and f). The increase in the photolysis rate differences, and the less-organized structure of these changes over the domain in simulations with the online aerosol feedbacks, is due to the presence of the direct and indirect effects from meteorological changes, such as changes in cloud patterns, and amplified chemistry perturbations due to weather feedback. The hotspots of greatest difference in Fig. 10f reflect the direct effects on aerosol with no weather feedback in these simulations.
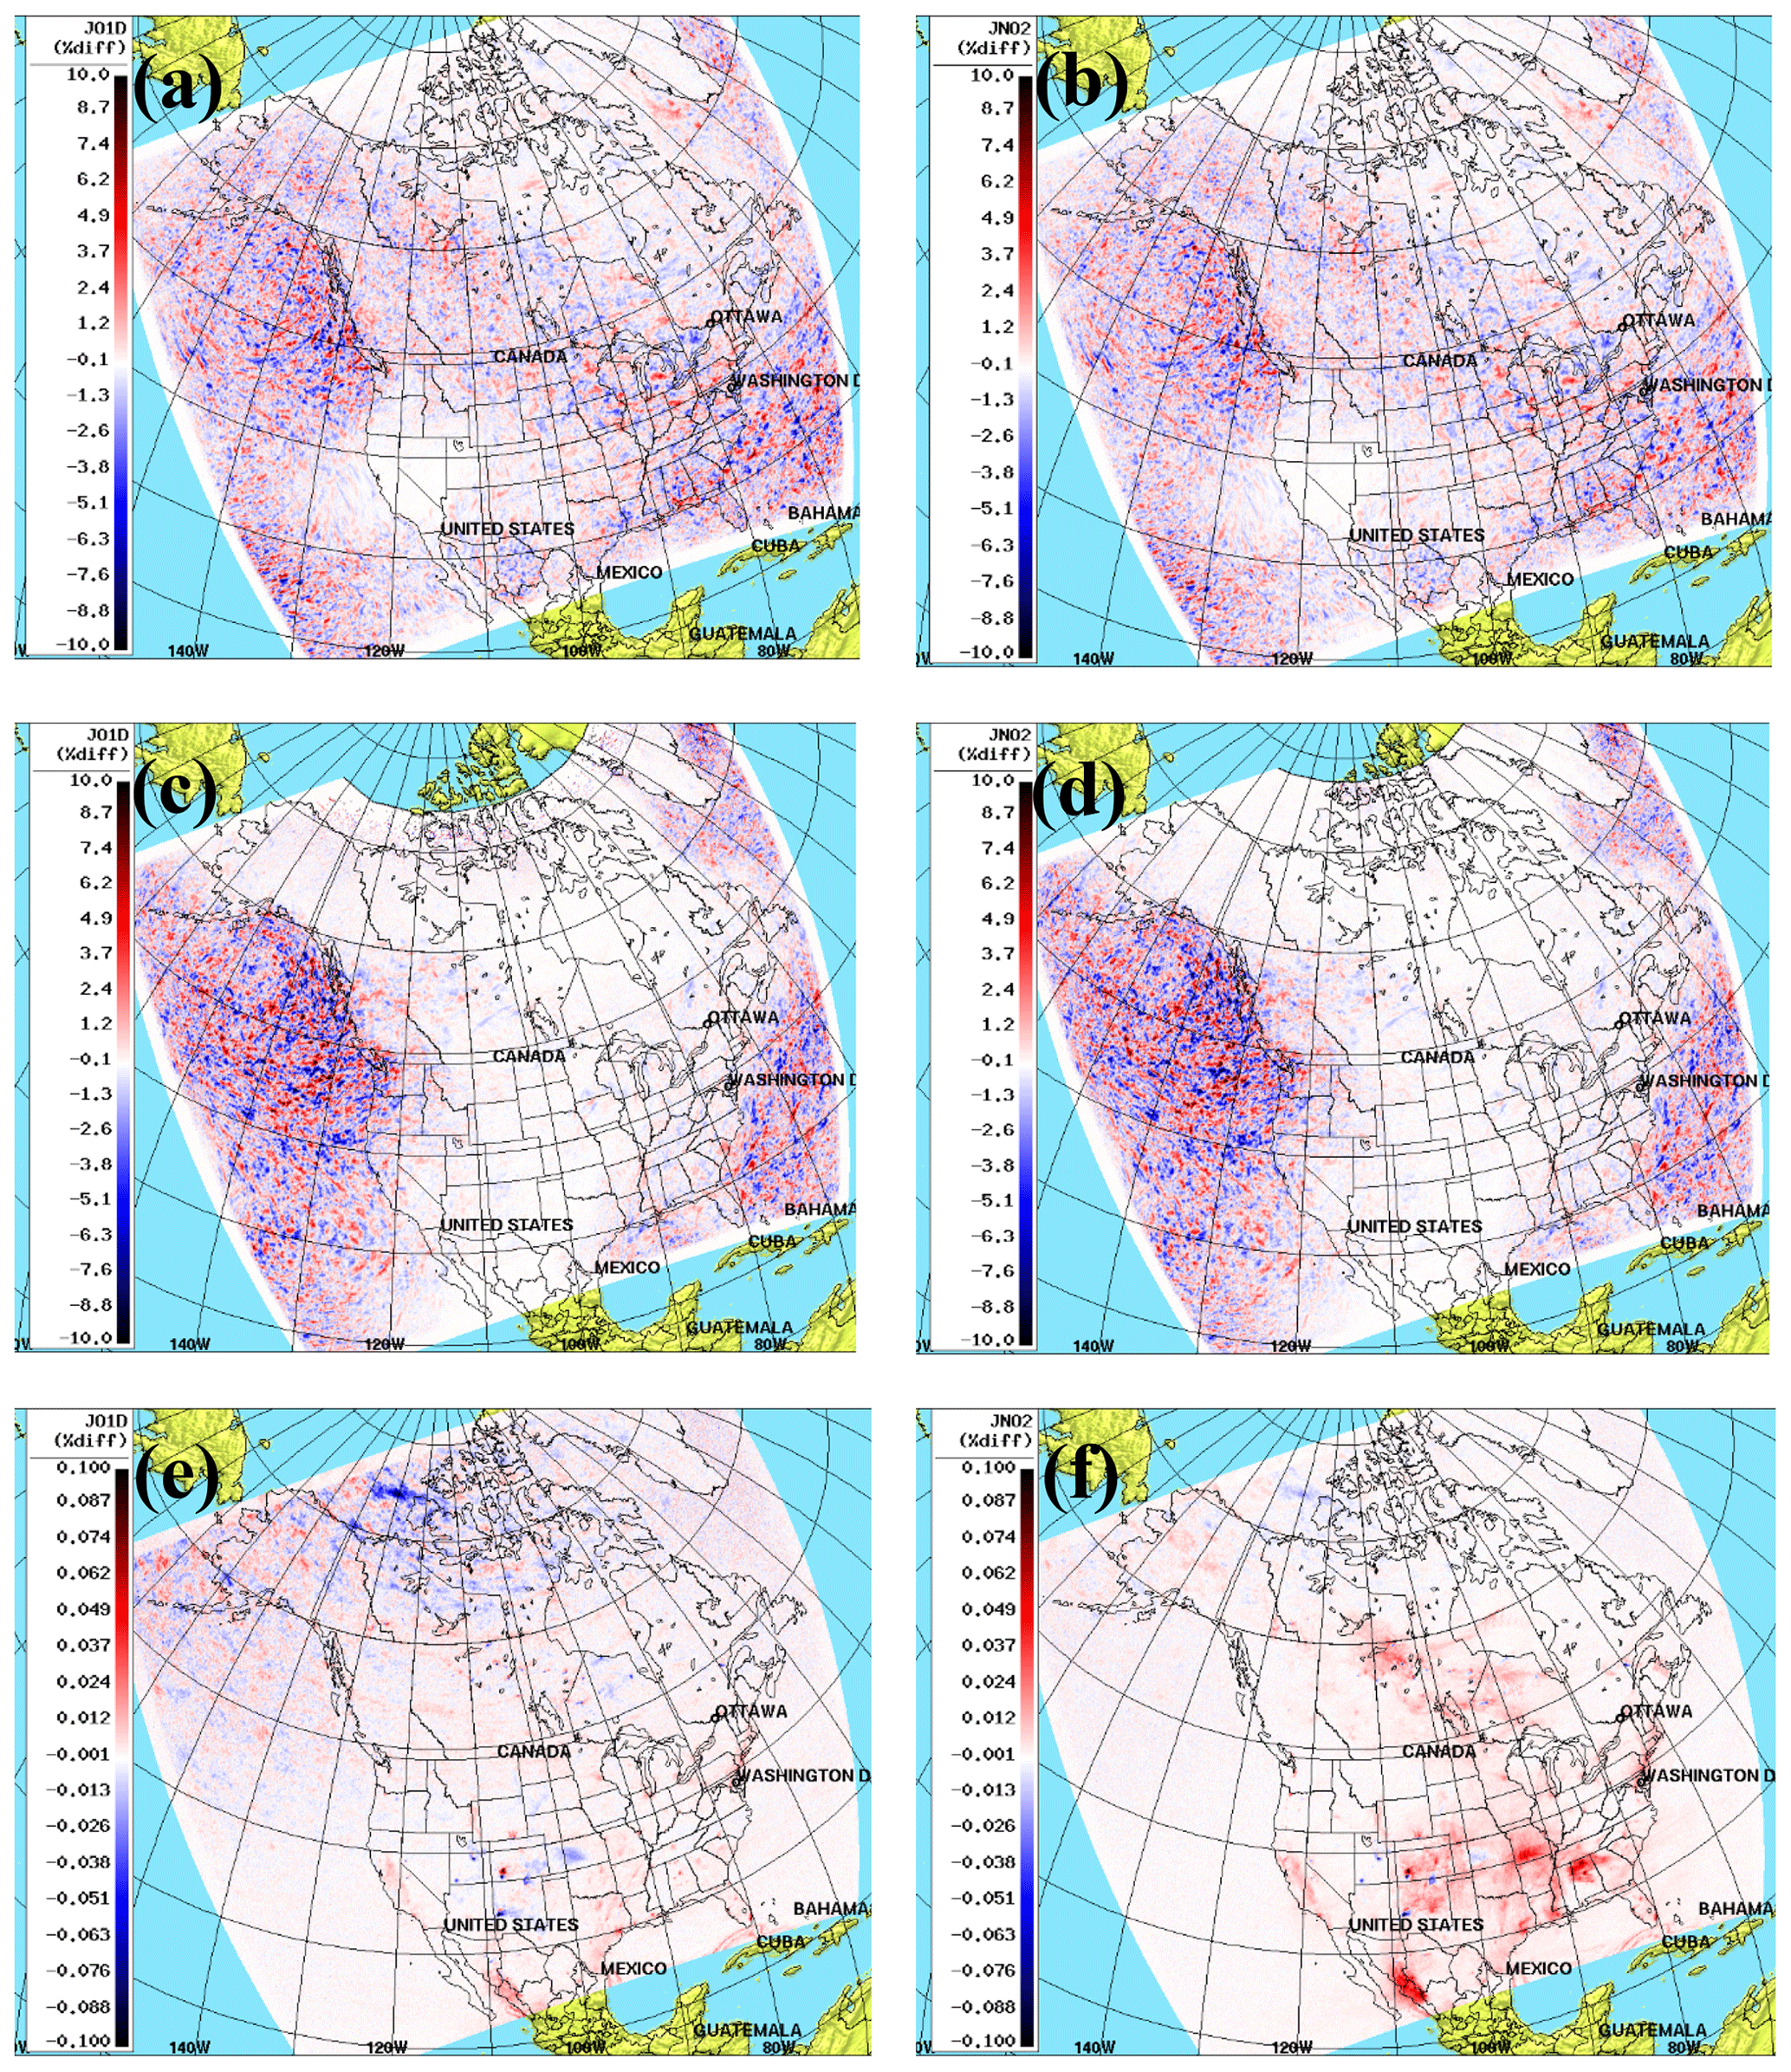
Figure 10Percentage difference in daytime monthly averaged photolysis rates (J(O1D) and J(NO2)) at the lowest model level, with and without AOD calculations. (a, b) June 2018 with online interactive aerosol feedback. (c, d) January 2018 with online interactive aerosol feedback. (e, f) June 2018 without online interactive aerosol feedback.
Figure 11 is the monthly average percentage difference in AOD, number mixing ratio of clouds in the boundary layer at three heights, J(O1D) at the lowest model level and J(NO2) at the lowest model level for June 2018 with and without interactive aerosol feedback on weather in the model (simulations S1 and S3). This figure shows the effects of the interactive online aerosol feedback on the output of the photolysis module. Note that in both simulations we used AOD calculations in the photolysis module. As shown in this figure, AOD changes from −30 % to 30 % and J values from −40 % to 40 % with and without the GEM-MACH predicted aerosol concentrations in optical properties and photolysis rate calculations. The decrease of J values over the continent, might be due to the increase in the cloud droplet density and/or in-cloud formation of aerosols in the simulations with interactive aerosol feedback in the model. As we can see in Fig. 11b, c and d, the moist marine air masses have the greatest impact on J-value change likely due to changes in low clouds. The areas impacted are mostly over the ocean or along ocean boundaries (northeast US/Canada, Northwest Territories, North Pacific). Over land, in convective air masses, there is less impact on J values averaged over a region. These changes in humidity impact low clouds which, in turn, impact the radiative transfer and photolysis rates. The results from Figs. 10 and 11 suggest that the impacts of aerosol feedbacks as parameterized in the model are considerably greater than the impacts of the AOD calculations in the model.

Figure 11Percentage difference in daytime monthly average (June 2018) of (a) AOD, (b–d) number mixing ratio of clouds at 120, 900 m and 2 km above ground level, respectively, (e) JO1D at the lowest model level and (f) JNO2 at the lowest model level, with and without online aerosol feedbacks.
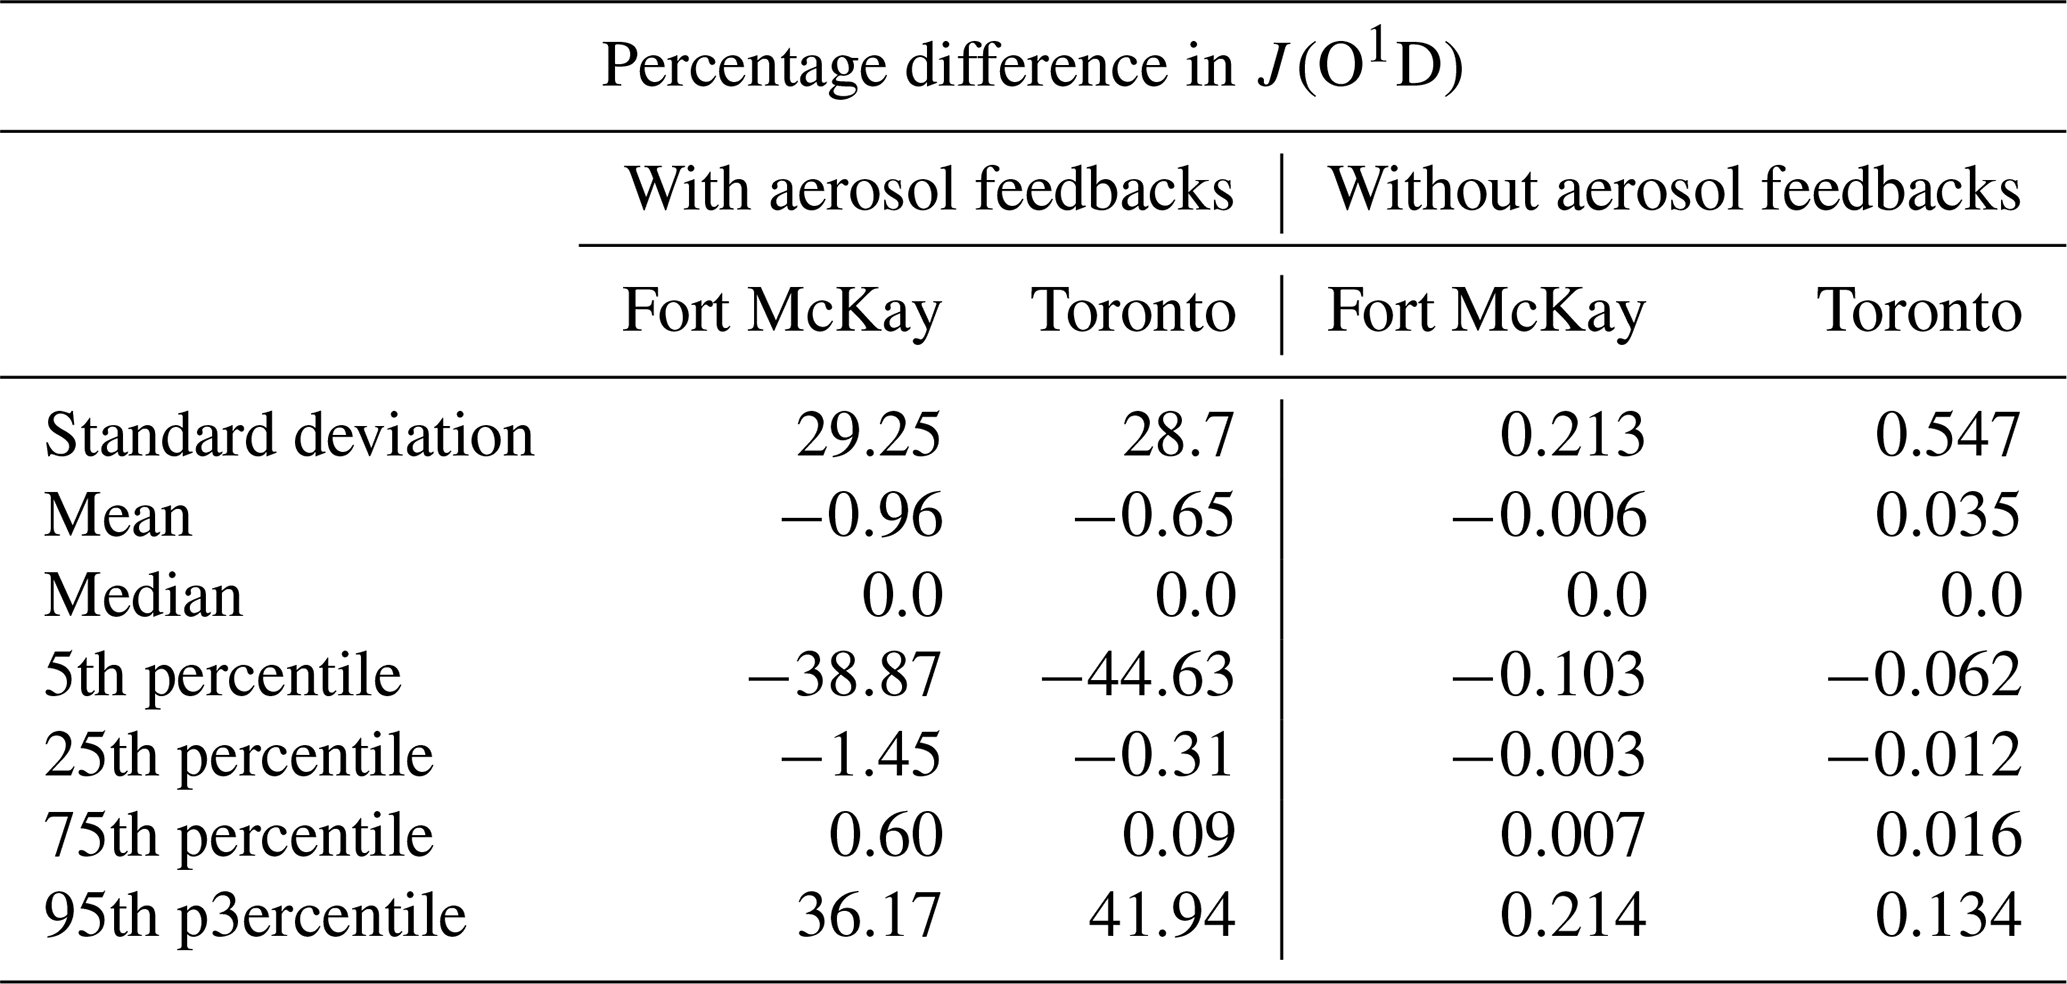
Histograms and the statistical scores of hourly percentage difference in J(O1D) at the Fort McKay and Toronto AERONET stations at the lowest model level, with and without AOD calculations in June 2018 are shown in Fig. 12 and Table 5. With the interactive aerosol feedbacks in the model (simulations S1 and S2), the standard deviation for the Fort McKay and Toronto stations are 29.3 and 28.7, respectively, showing the average of approximately 29 % change in J(O1D) around the mean, with more frequent changes within ±10 % for both stations. The 95th percentile shows that 95 % of the data points (percentage difference in J(O1D) values) are below ∼36.2 % for Fort McKay and ∼42 % for Toronto (Fig. 12a, b). In the cases without the online aerosol feedback in the model (simulations S3 and S4), the standard deviation for both stations is considerably smaller (0.55 for Toronto and 0.21 for Fort McKay) and the values of percentage difference in J(O1D) are more clustered around the mean (Fig. 12c, d). The more-organized changes in photolysis rates in the no-feedback case are due to the inclusion of only the direct effect of photolysis on aerosols, whereas the effect of clouds and in-cloud formation of aerosols in the feedback case leads to more variability in the photolysis rate changes between simulations S1 and S2.

Figure 12Histograms of percentage difference of hourly JO1D output for June 2018 at the Toronto and Fort McKay AERONET stations at the lowest model level, with and without AOD calculations. Panels (a, b) are with aerosol feedbacks, and panels (c, d) are without aerosol feedbacks. Nighttime data (JO1D = 0) were omitted from the analysis.
Table 5Statistical scores of percentage difference of J(O1D), with and without AOD calculations at the Fort McKay and Toronto AERONET stations from the 1-month GEM-MACH J(O1D) output at the lowest model level in June 2018.
3.2.3 Case study: Lac La Loche forest fire
In order to evaluate the impacts of the modifications of the photolysis calculations on air quality under high-pollutant-flux emissions conditions, we study a forest fire case in the Lac La Loche area in the northwestern corner of the province of Saskatchewan in Canada on 25 June 2018 (Fig. 13).
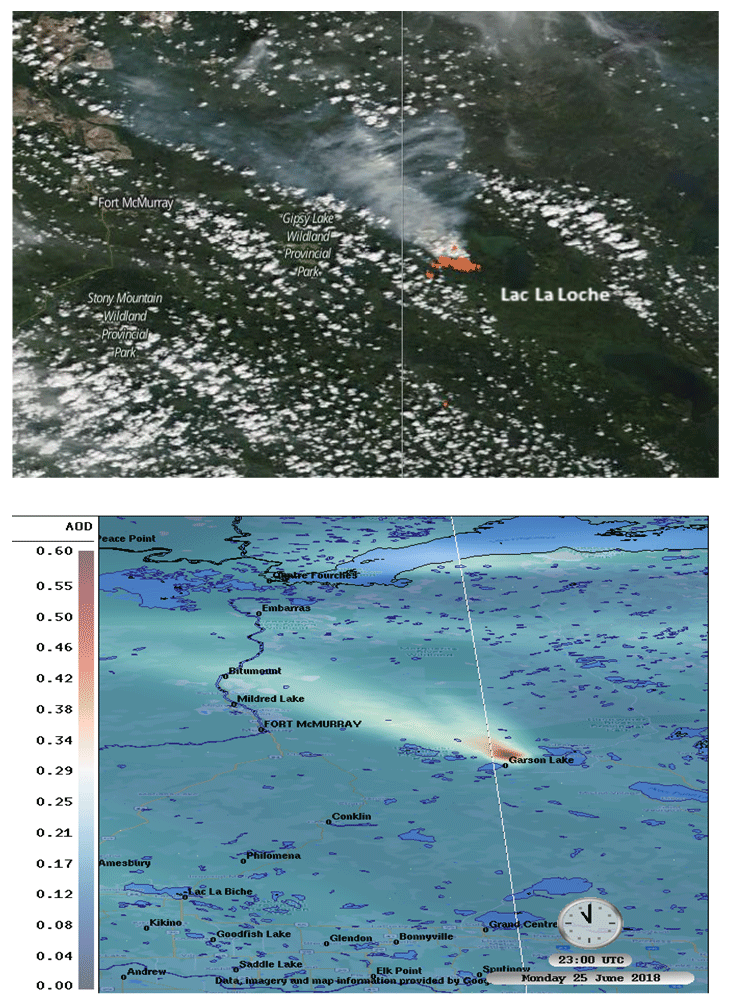
Figure 13Lac La Loche forest fire on 25 June 2018. Top: overlay layer: MODIS Terra thermal anomalies (day and night), over MODIS Terra true color corrected reflectance (image from https://worldview.earthdata.nasa.gov, last access: 1 June 2021). Bottom: GEM-MACH AOD at 580 nm at 23:00 UTC.
Figure 14a shows the daily AOD at 550 nm from MAIAC, Fig. 14b is the daily AOD at 550 nm from VIIRS, and Fig. 14c is GEM-MACH AOD at 580 nm over La Loche area at 23:00 UTC on 25 June 2018. Both MAIAC and VIIRS plots (Fig. 14b and c) show two areas of maxima; one is directly over the forest fire plume, similar to the hotspot on GEM-MACH plot (Fig. 14c), and a weaker hotspot is over the northeast of the major forest fire plume, which is more intensified compared to the GEM-MACH secondary hotspot. The aging of the major fire plume downwind is evident in all three plots. The maximum GEM-MACH AOD (0.625) is underestimated compared to the MAIAC (maximum of 3) and VIIRS (maximum of 1.7). One possible explanation for the underestimation in both primary and secondary hotspots could be the potential deficiencies in modeled biomass burning emissions or aerosol processes in this simulation. Curci et al. (2015) suggest that AOD underpredictions may be a common problem for current air quality models. Other studies, e.g., Pan et al. (2020) and Johnson et al. (2016), show underestimations of modeled AOD over biomass burning areas, which could be related to the shortcomings in biomass burning processes in air quality models.

Figure 14Lac La Loche forest fire, 25 June 2018 (a) MAIAC daily AOD at 550 nm, (b) VIIRS daily AOD at 550 nm and (c) GEM-MACH AOD at 580 nm and horizontal wind bars at 23:00 UTC. The color bar scale on VIIRS and GEM-MACH plots (b, c) show the true maximum values. The maximum AOD value in the MAIAC plot (maximum of 3) was scaled down to illustrate the fire plume. The cross sections in Figs. 15, 16 and 17 are plotted along the black line in panel (c).
Figure 15 shows the aerosol concentrations and photolysis rates cross sections over the solid black line in Fig. 15c. There are multiple injected fire plumes and they move off in different directions as a result of different plumes reaching different heights in the atmosphere as well as variation over time. The model captures the branch moving toward Fort McKay but not the branches that move farther north. Only the branch traveling to Fort McKay is shown in the vertical cross section. While this aged plume still has character originating from the forest fire, it does not originate from all the fire emissions near Lac La Loche. As shown in Fig. 15a, O3 is impacted by titration below the PBL (planetary boundary layer), and there is a low concentration of ozone right above the fire plume. Higher concentrations of O3 can be seen downwind below the PBL. As the fire plume continues to dilute with distance downwind, the NOx concentration in the boundary layer (not shown) decreases and eventually reaches an optimal concentration range for efficient ozone production. This is illustrated in Fig. 15a as ozone increases to near 80 ppbv about 170 km downwind from the fire. Figure 15b shows the depletion of hydroxyl radical (OH) in the fire plume below the PBL and a maxima above the boundary layer, where there is a high concentration of O3 and low concentration of VOC (volatile organic compound) to deplete OH. The increase in OH downwind from the fire plume is in response to the O3 increase, reaching a maximum value of µg kg−1 (∼7.5 × 10⁶ molecules cm−3) in the upper boundary layer ∼700–800 hPa. The increase in OH concentration results in delayed production of secondary aerosol components. The PM2.5 predicted in the forest fire plume (Fig. 15c) reached a maximum value of 65 µg m−3 near the surface and remained above 10 µg m−3 up to 800 hPa. As shown in Fig. 15d, the fire plume was predicted to penetrate above the boundary layer height due to the black carbon plume mixing up to 600 hPa. The black carbon concentration decay with distance illustrates the extent of dilution of directly emitted PM2.5 components as it mixes horizontally. As shown in Fig. 15e, the concentration of SOA increases downwind from the fire plume. Similarly, the concentration of nitrate (Fig. 15f) increases downwind between 900 hPa and the boundary layer due to secondary production and the long-lived nature of nitrate. The attenuation of radiation by the fresh fire plume is illustrated by the decrease in J(NO2) below the PBL from 1.26 × 10⁻² s−1 at ∼700 hPa to 4.52 × 10⁻³ s−1 at the surface and J(O1D) from 1.83 × 10⁻⁵ s−1 at ∼700 hPa to 5.48 × 10⁻⁶ s−1 at the surface (Fig. 15g and h). The photolysis rates decrease with distance is due to the attenuation of radiation by the directly emitted fire PM2.5 components.
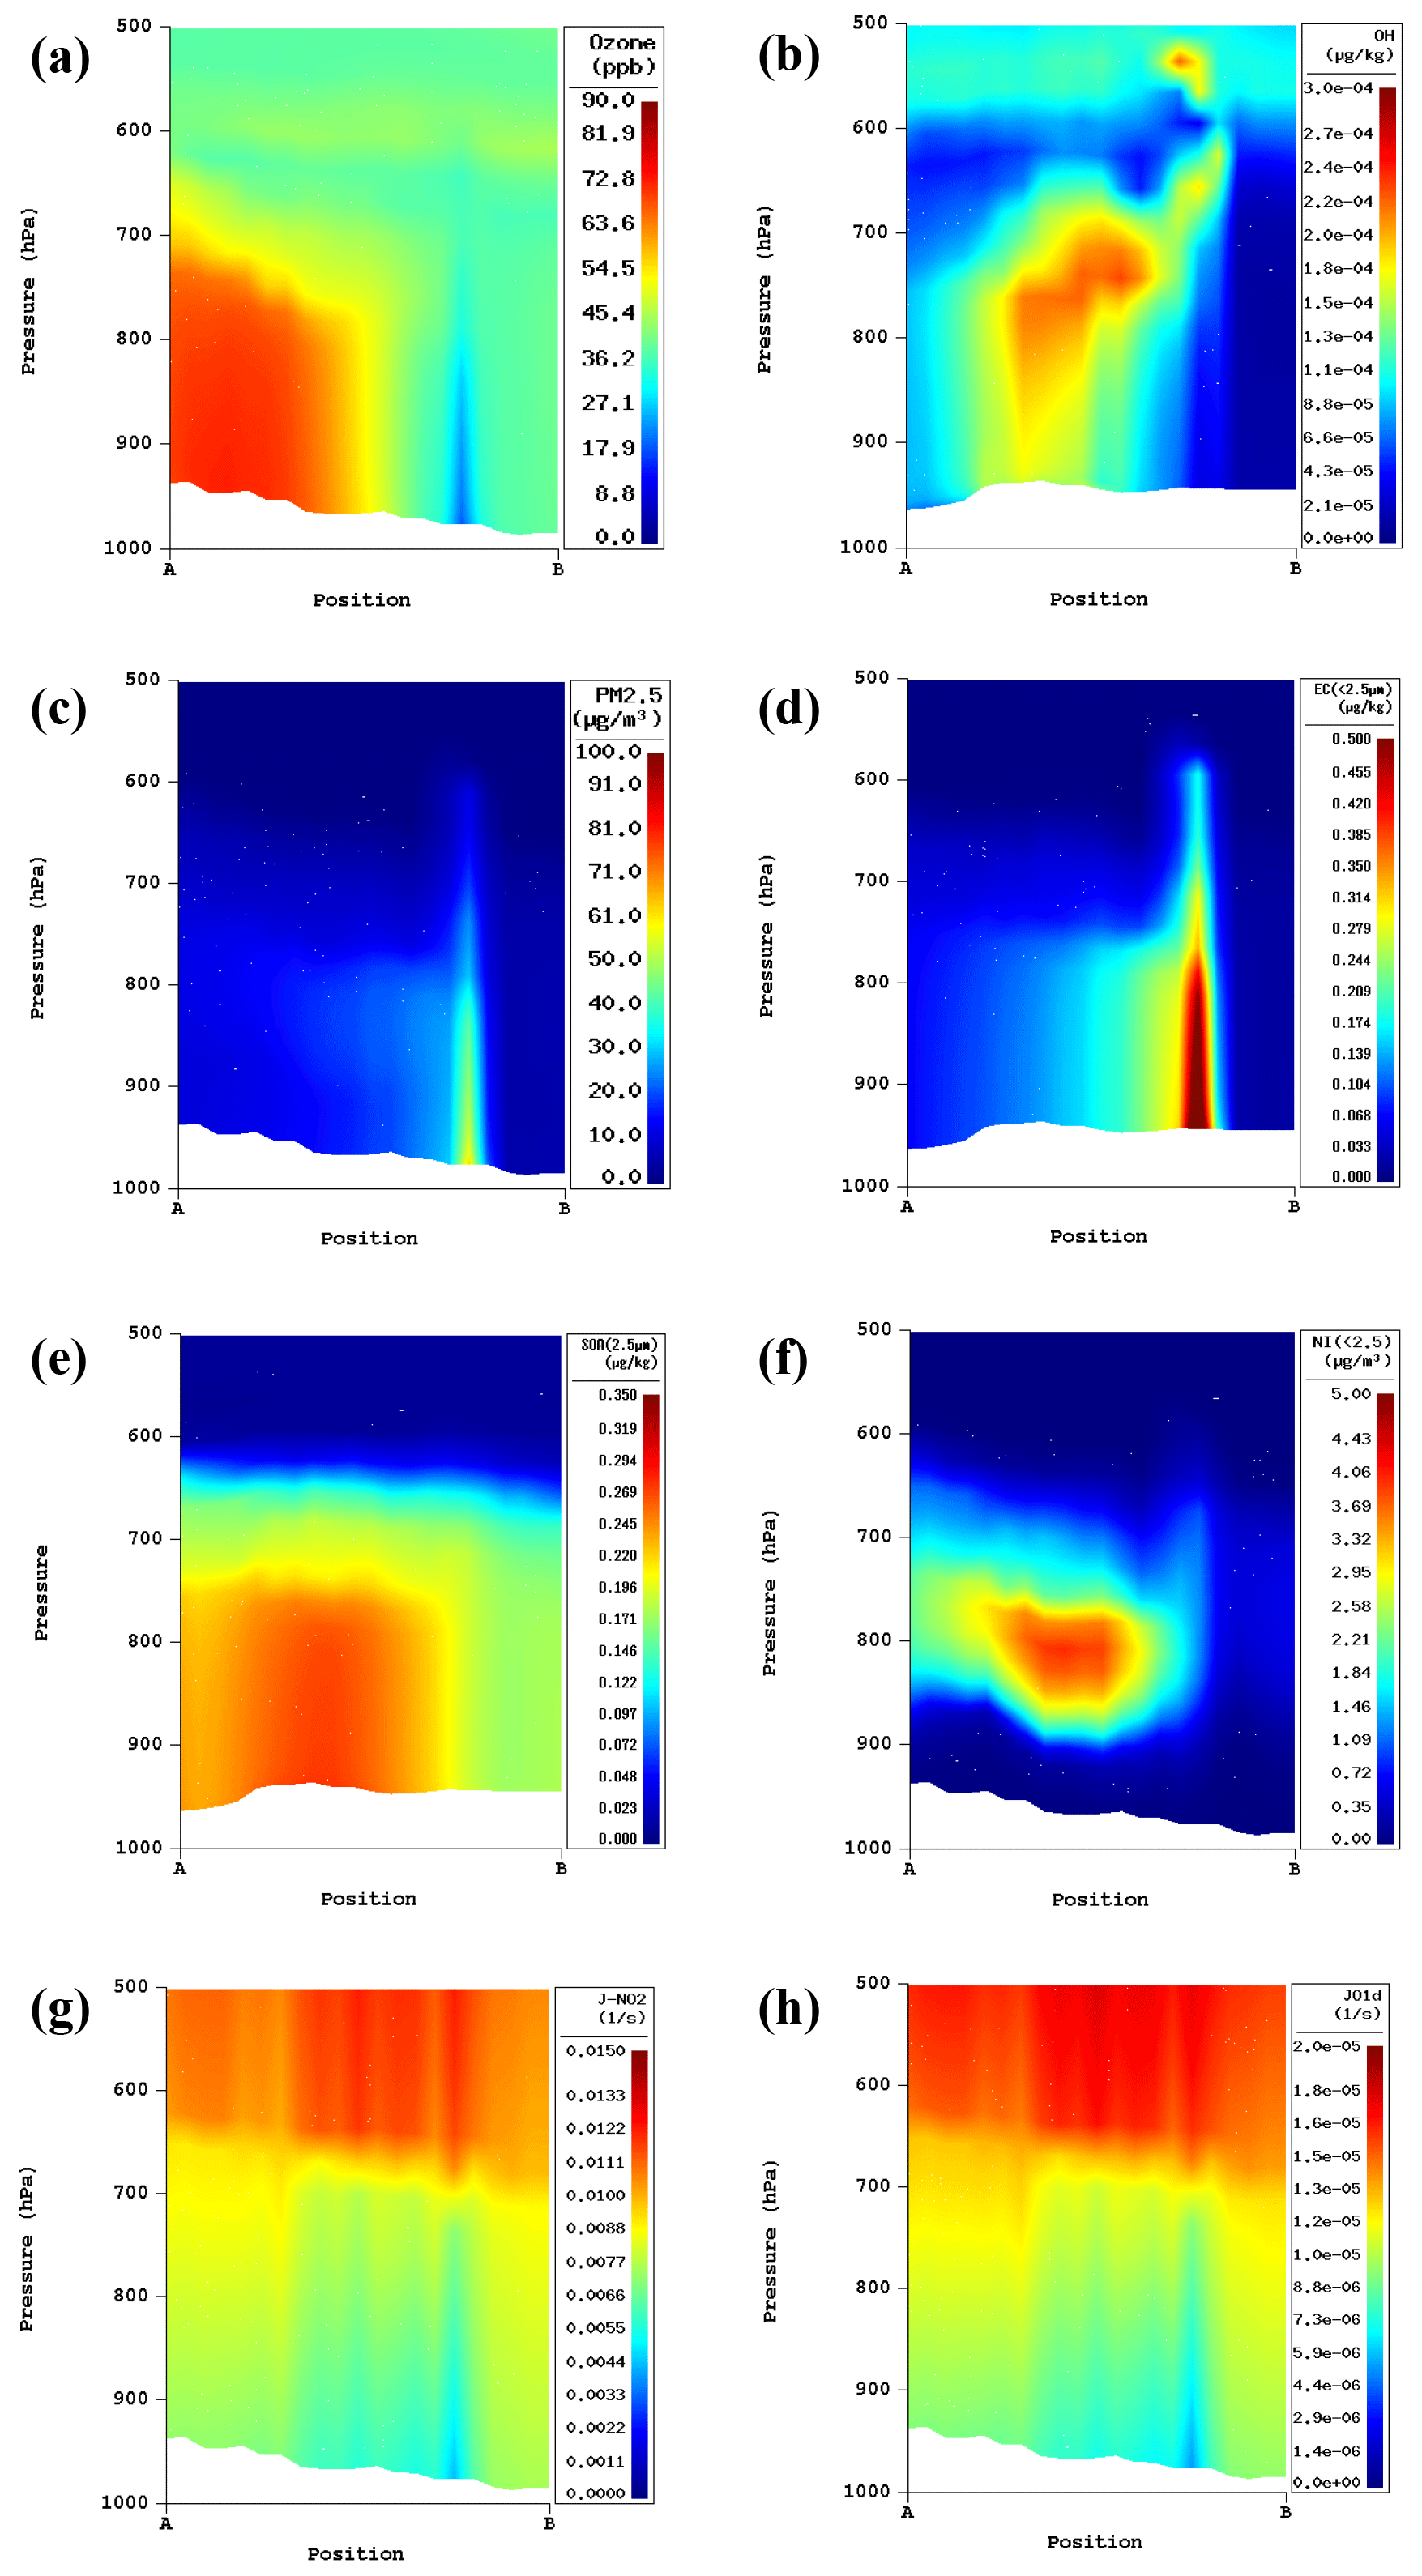
Figure 15Cross sections of gas and aerosol concentrations and photolysis rates with aerosol feedbacks over the line shown in Fig. 14c, Lac La Loche forest fire on 25 June 2018 at 23:00 UTC: (a) ozone (ppb), (b) hydroxyl radical (µg kg−1), (c) PM2.5 (µg m−3), (d) EC (<2.5 µm, µg kg−1), (e) nitrate (<2.5 µm, µg m−3), (f) SOA (<2.5 µm, µg kg−1), (g) J(NO2) (s−1), (h) J(O1D) (s−1).
In order to evaluate the effects of aerosol optical properties in aerosol concentrations and photolysis rates in Lac La Loche fire event, we calculated the percentage difference in aerosol concentrations and photolysis rates with and without AOD calculations (simulations S1 and S2). Figure 16 shows the percentage difference of aerosol concentrations and photolysis rates cross sections with and without AOD calculations over the Lac La Loche forest fire event on 25 June 2018 (solid black line in Fig. 15c). Figure 16a shows the reduction of O3 in the fresh fire plume below the PBL due to the decrease in J(O1D), reaching a difference close to 1 % to 6 % from the surface up to the mid-boundary layer. The OH radical concentration difference (Fig. 16b) responds to the O3 change and decreases by 10 % to 20 % from the surface up to the boundary level, due to the AOD feedback on the photolysis rates. This affects the rate of production of secondary aerosol components such as nitrate (Fig. 16f) and secondary organic material (Fig. 16e), although there is a small decrease of up to 7 % in nitrate concentration in the fresh plume. There is a reduction in J(NO2) and J(O1D) (Fig. 16g and h) in the fire plume below the boundary layer. As shown in Fig. 16c and d, after including AOD calculations in the model, the concentrations of PM2.5 and black carbon decrease by 5 % in the fire plume from the surface to 900 hPa and increase by 5 % above 900 hPa and below the boundary layer. The changes in black carbon concentration (±5 %) in Fig. 16d at the surface up to the mid-boundary layer are mostly due to aerosol feedbacks on meteorology.
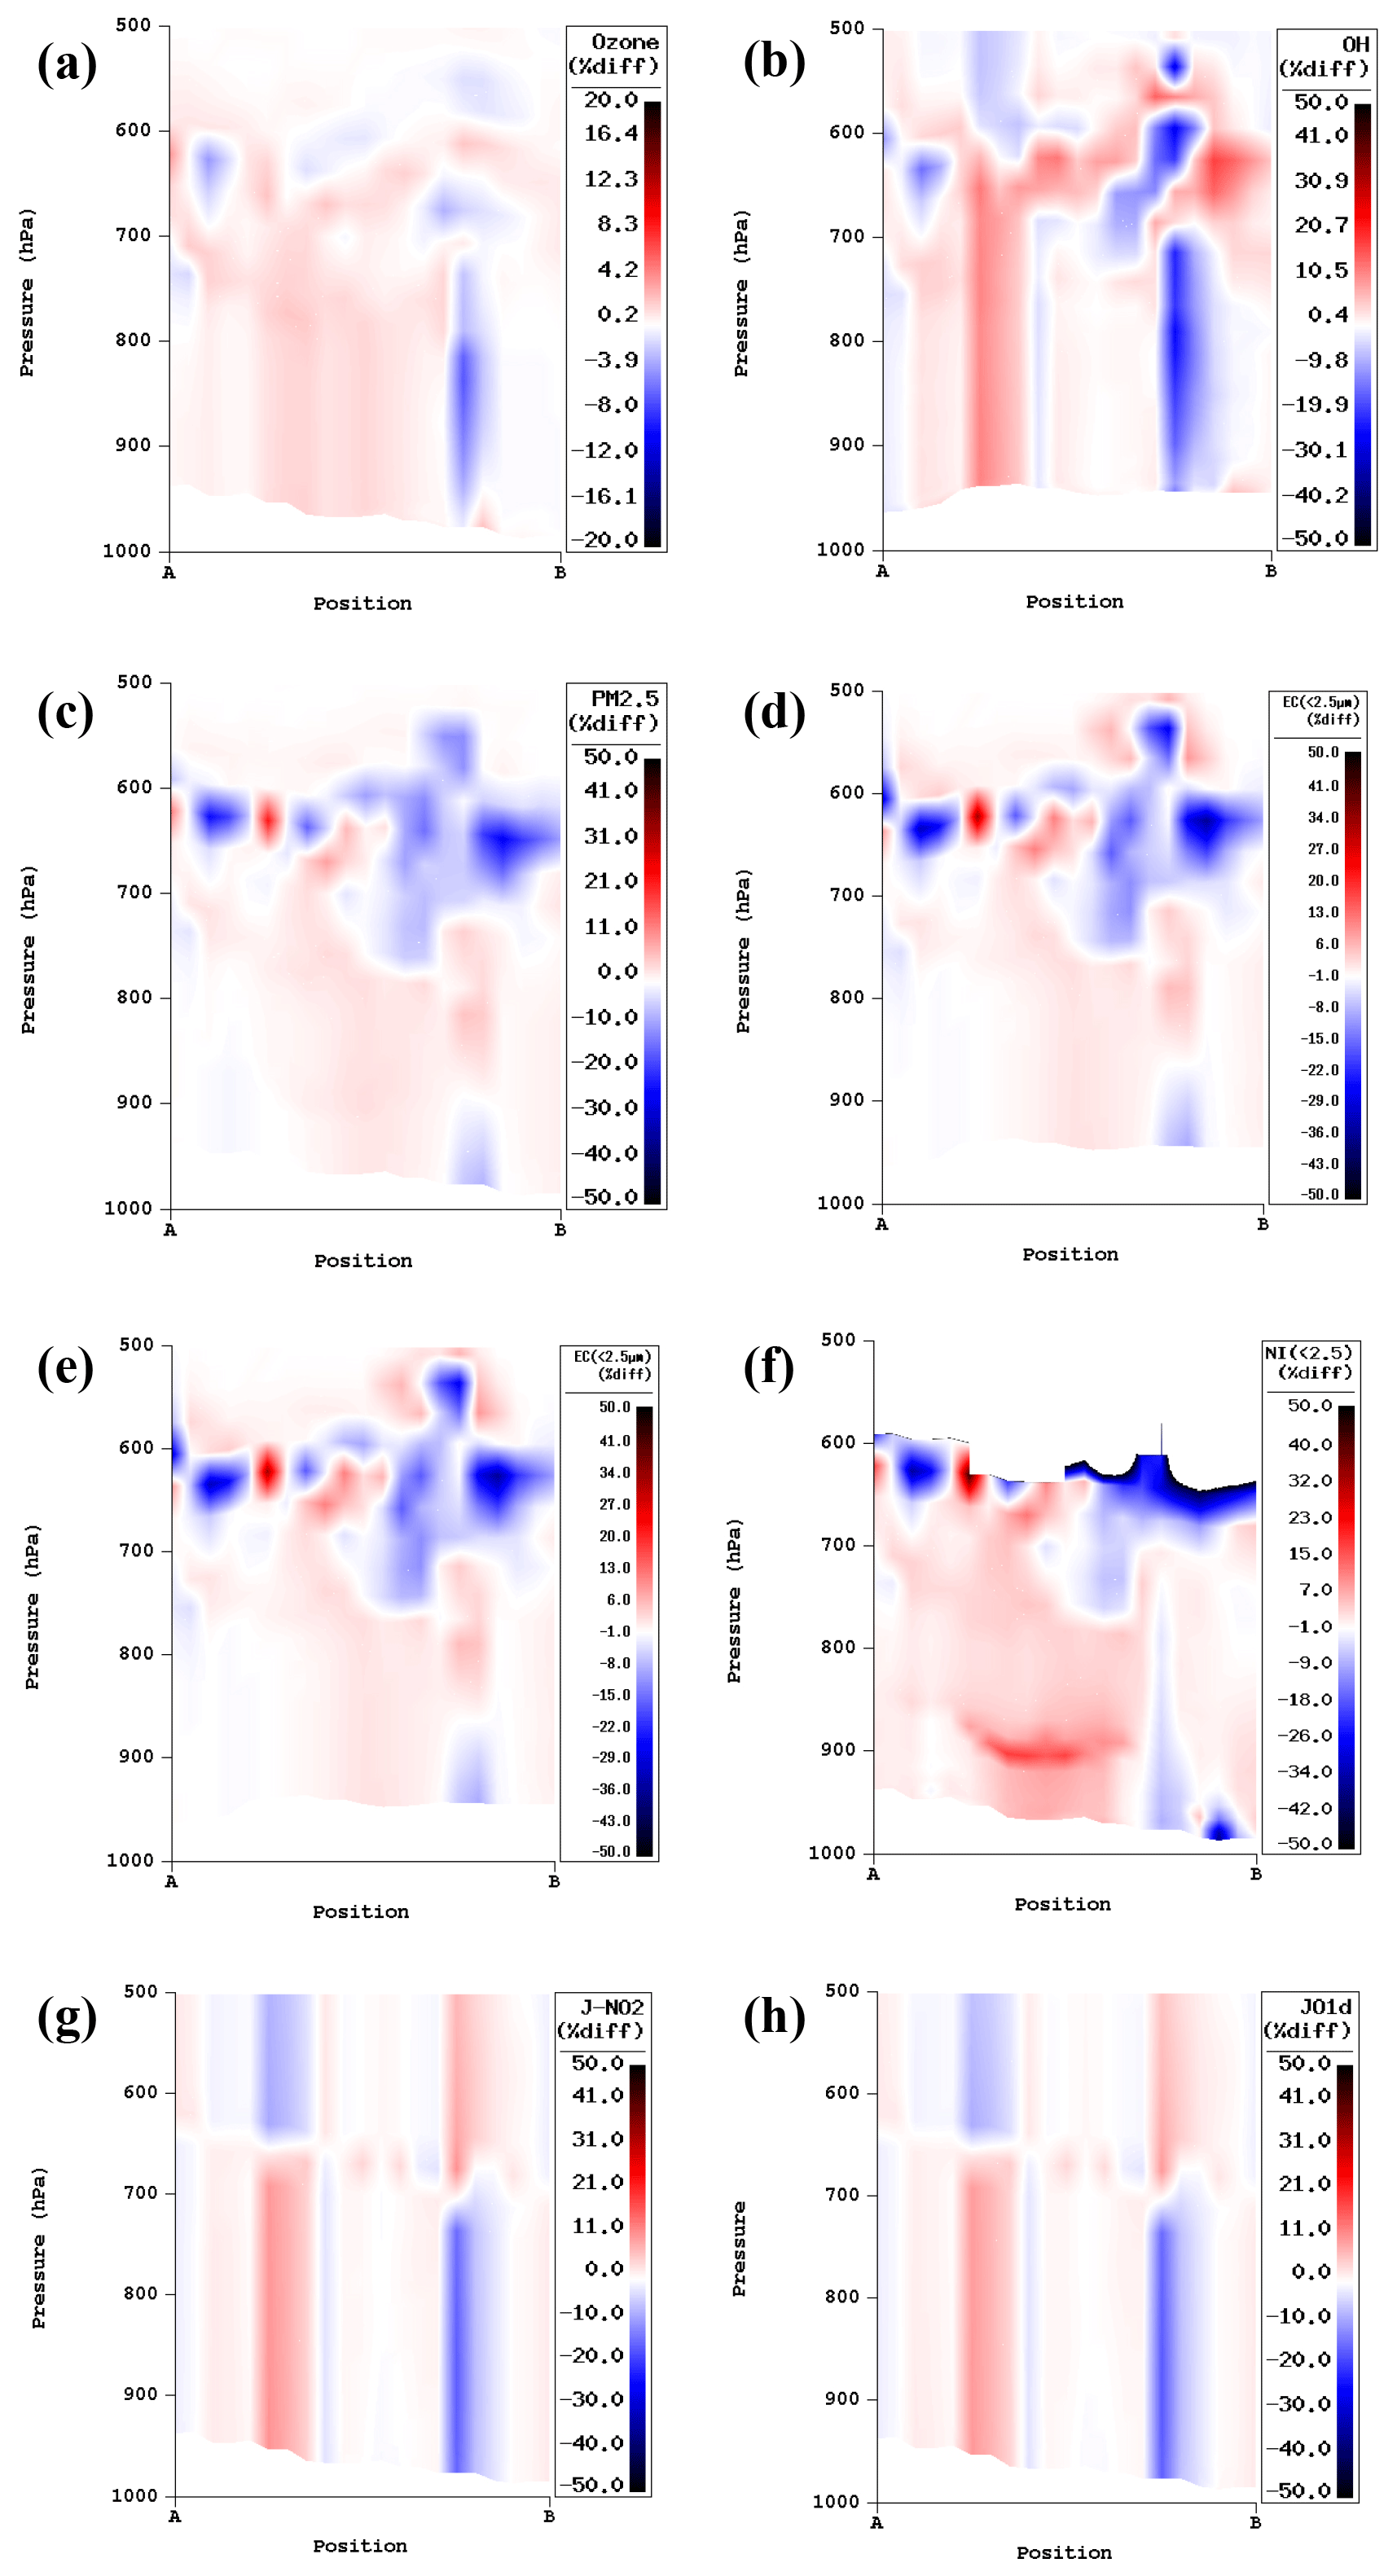
Figure 16Cross sections of percentage difference in gas and aerosol concentrations and photolysis rates with and without AOD calculations (with aerosol feedbacks) over the line shown in Fig. 14c, Lac La Loche forest fire on 25 June 2018 at 23:00 UTC: (a) ozone (ppb), (b) hydroxyl radical (µg kg−1), (c) PM2.5 (µg m−3), (d) EC (<2.5 µm, µg kg−1), (e) nitrate (<2.5 µm, µg m−3), (f) SOA (<2.5 µm, µg kg−1), (g) J(NO2) (s−1), (h) J(O1D) (s−1).
Figure 17 is the percentage difference in aerosol concentrations and photolysis rates, with and without AOD calculations and no aerosol feedbacks in the model (simulations S3 and S4). As shown in Fig. 17c, d and e, without the interactive aerosol feedbacks in the model, there is an insignificant difference (−0.2 % to 0.2 %) in PM2.5, black carbon and SOA concentrations compared to the difference in concentrations from simulations S1 and S2 (−50 % to 50 % with aerosol feedbacks). Similarly, there is −1 % to 1 % difference in O3 concentrations (Fig. 17a) from simulations S3 and S4. The variability in the production of OH (Fig. 17b) by the photolysis of O3 is more considerable (−5 % to 5 %). The decrease in the OH concentration with primary-aerosol-component photolysis attenuation results in lower secondary aerosol production downwind, which, in turn, slowly counters the primary aerosol attenuation and increases the photolysis rates (maximum of <1 %). The increased photolysis difference results in a positive difference between the ozone and OH concentrations. The predicted OH increases downwind reaching a maximum of 1 %.
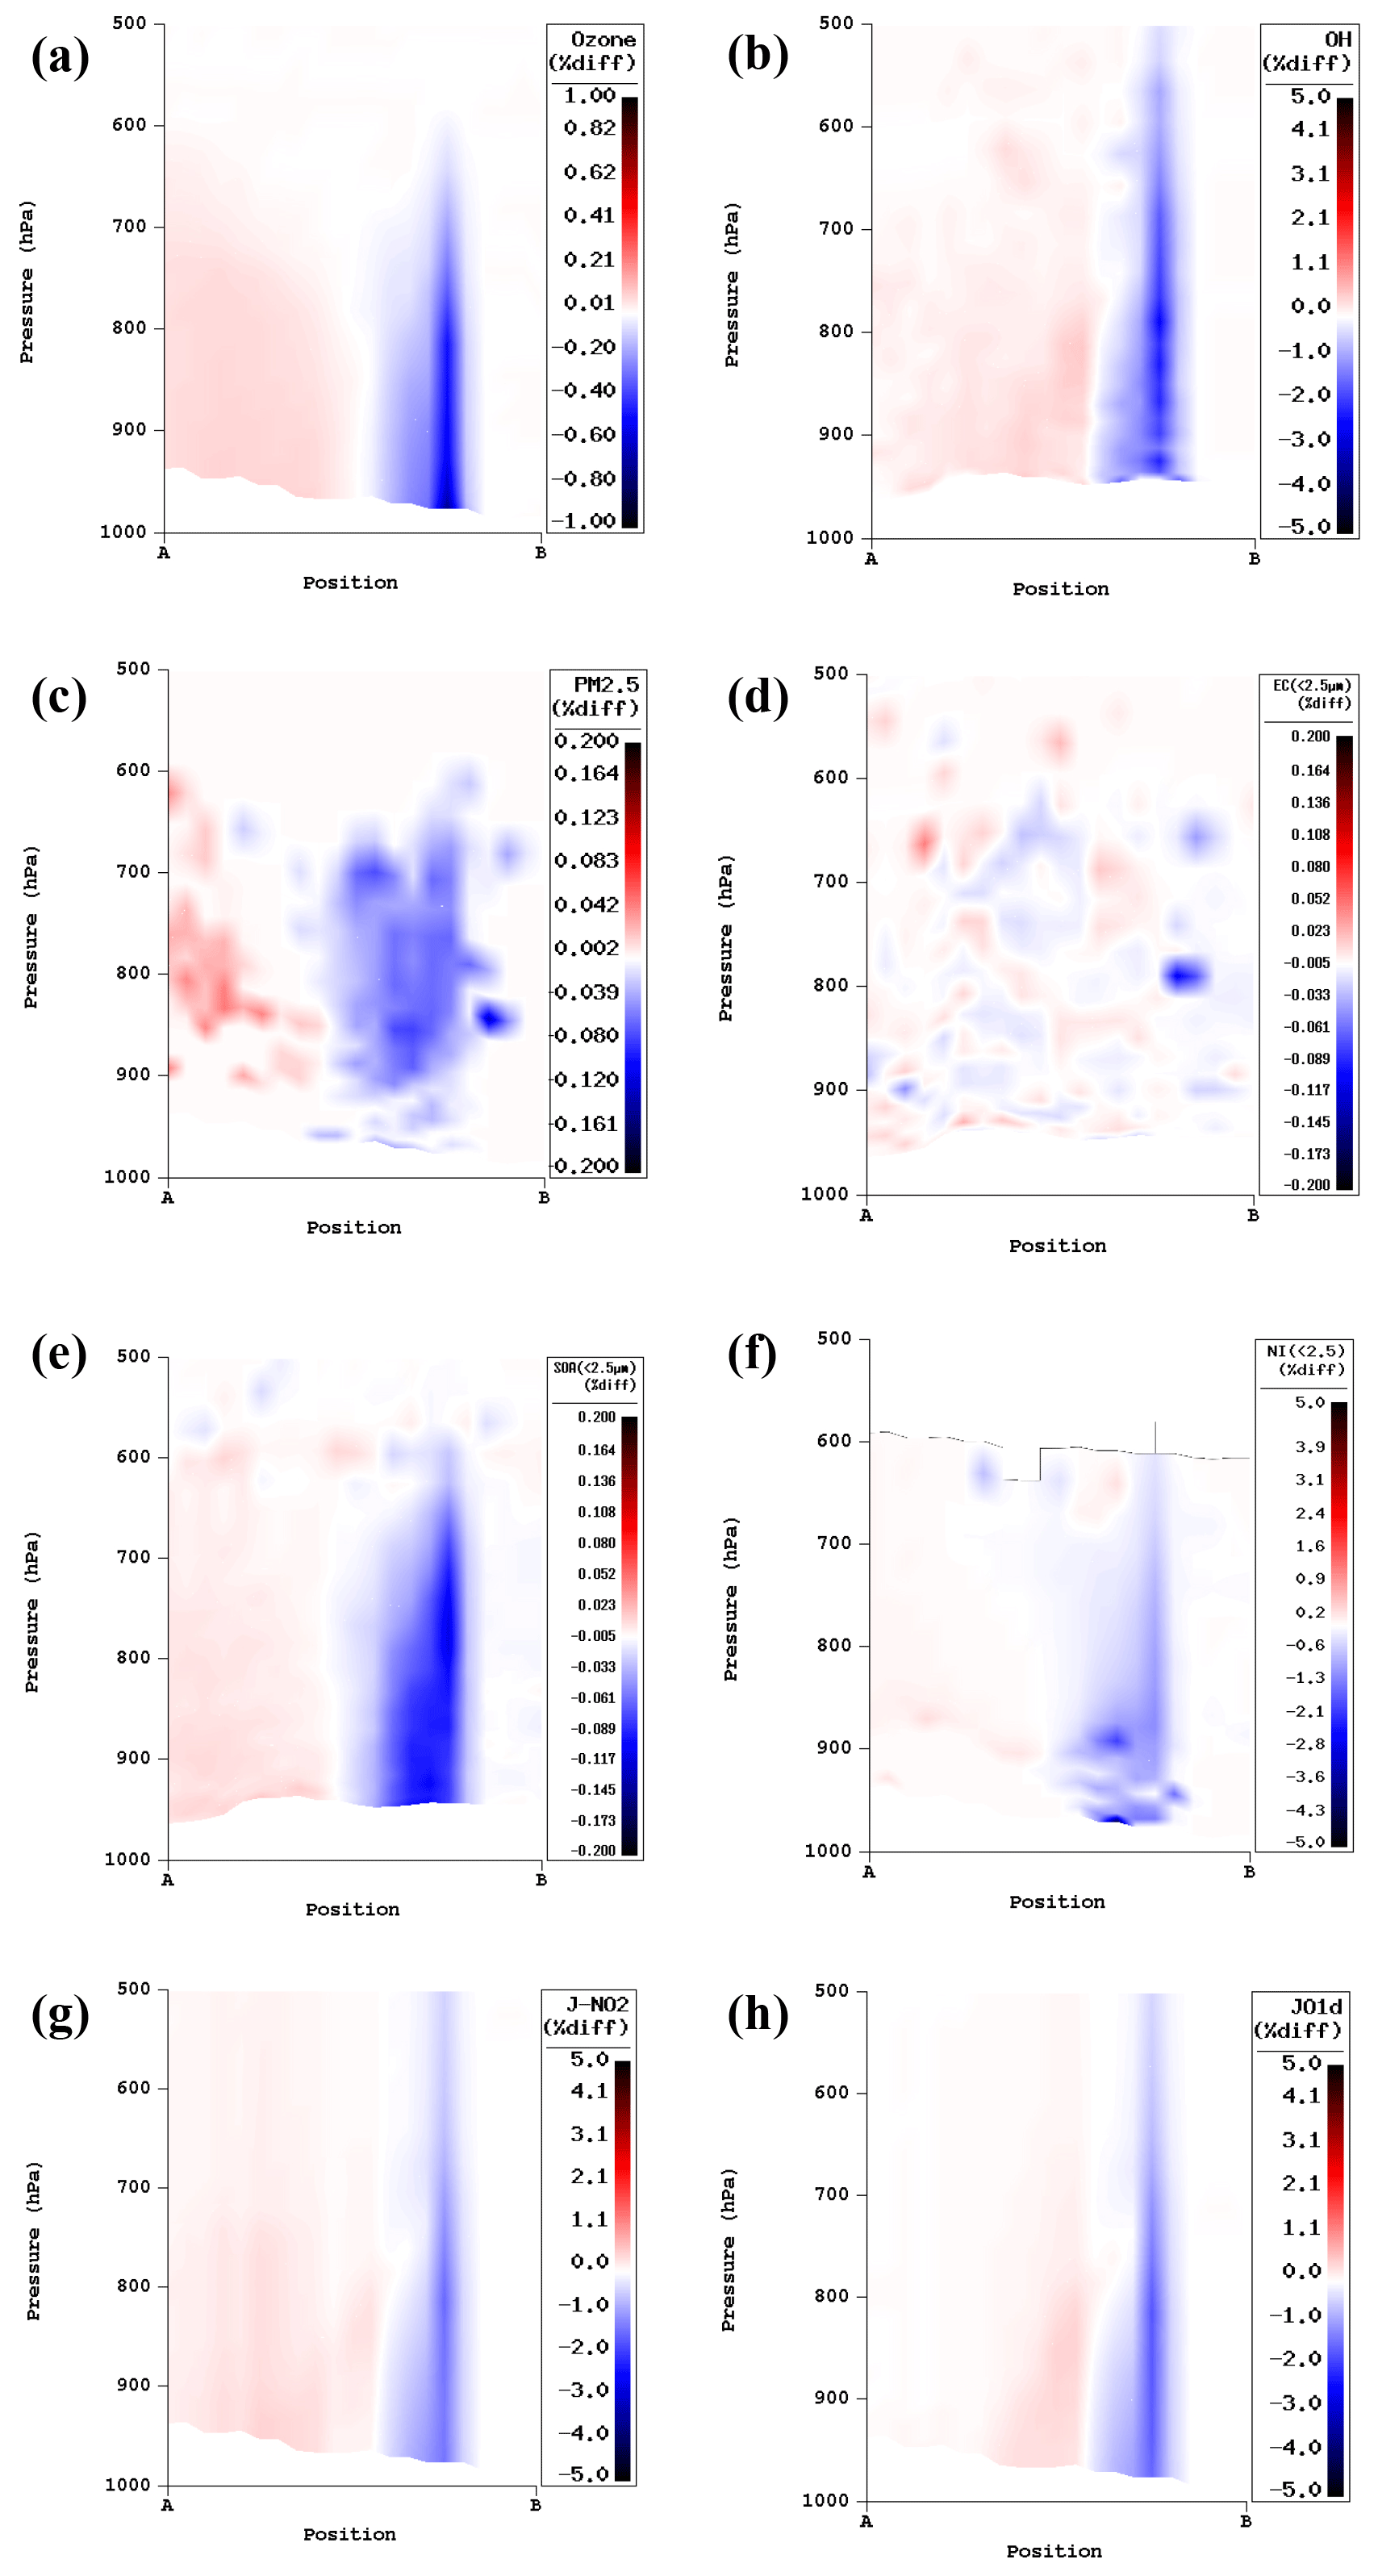
Figure 17Cross sections of percentage difference in aerosol concentrations and photolysis rates with and without AOD calculations (no aerosol feedbacks) over the line shown in Fig. 14c, Lac La Loche forest fire on 25 June 2018 at 23:00 UTC: (a) ozone (ppb), (b) hydroxyl radical (µg kg−1), (c) PM2.5 (µg m−3), (d) EC (<2.5 µm, µg kg−1), (e) nitrate (<2.5 µm, µg m−3), (f) SOA (<2.5 µm, µg kg−1), (g) J(NO2) (s−1), (h) J(O1D) (s−1).
A new lookup table for aerosol optical properties based on a Mie scattering code was calculated and adopted within an improved version of the photolysis module in the GEM-MACH in-line chemical transport model, by interpolating the optical properties of aerosols into GEM-MACH wavelengths and size bins. The modified version of the photolysis module makes use of online interactive aerosol feedback for radiative transfer calculations. Additionally, for particle size bins with black carbon mass fraction of less than 40 %, a lensing correction factor to the black carbon absorption efficiency based on Bond et al. (2006) core-shell parameterizations was applied. The comparison of the improved version of MESSy-JVAL with the previous version showed significant improvements in the model performance with the implementation of the new photolysis module and adopting the online interactive aerosol concentrations in GEM-MACH. The calculated correlation coefficient, R, between the 1-month hourly (June 2018) model and AERONET measurements for all North American sites was 0.17 with the previous offline version of MESSY-JVAL and 0.37 with the improved version of the photolysis module.
A series of simulations using the improved photolysis module was performed for 2 months, January 2018 and June 2018, and the results were compared with MAIAC gridded daily average AOD data, level 2 VIIRS AOD data, reanalysis products (MERRA-2) and ground-based measurements (AERONET). The monthly averaged AOD from the GEM-MACH output with the improved version of MESSy_JVAL showed an underprediction of AOD over the common domain for both seasons. Detailed evaluations of AOD calculations over all North American AERONET sites for 2 months were performed and the model output was compared with observed AOD at each individual site. Model comparisons with observations at four Canadian AERONET sites showed good correlation with observations for both seasons. However, the correlation coefficient, R, shows better results for AERONET stations located further south in the domain with a similar number of paired data points, e.g., Toronto (43.79∘ N, −79.47∘ W) and Egbert (44.23∘ N, −79.78∘ W) vs. Saturna Island (48.78∘ N, −123.13∘ W) in summer and Fort McKay (57.18∘ N, −111.64∘ W) in winter. Similarly, the NMB calculations show an overprediction of AOD in Saturna Island for both seasons and Fort McKay in winter, whereas there is an underprediction of AOD in Toronto and Egbert for both seasons. In addition, we calculated a higher correlation coefficient between the model and measurements for urban AERONET sites for both simulation periods (e.g., Toronto vs. Fort McKay). Further investigation of the aerosol processes and emissions at these sites is needed to assess the effects of different climatological and meteorological conditions on photolysis rate calculations.
The sensitivity test to aerosol feedback demonstrates the effects of the model-predicted aerosol distribution in the modified photolysis rate calculations. As shown in this study, there was up to ±40 % change in monthly averaged photolysis rate calculations with and without online aerosol feedback in the model, whereas with no aerosol feedback in the model this change is very small (−0.1 % to 0.1 %) between the runs with and without AOD calculations. The sensitivity tests to AOD calculations show a monthly average change of ±10 % in photolysis rate coefficients over the North American domain, while as shown in the forest fire case study this number can be as high as ±50 % in the fire plume. This study also showed the impact of aerosol feedbacks as parameterized in the model to be considerably greater than the effects of the AOD calculations (by a factor of 3 to 4) on the photolysis rates over the entire domain. Furthermore, this study highlights the importance of model simulations of AOD where satellite observations are obscured by cloud cover.
The work carried out here made use of a domain using a 10 × 10 km grid cell size. In future work under the Oil Sands Monitoring Program, we intend to examine the impacts of the new photolysis code within a higher resolution of a 2.5 × 2.5 km grid cell size domain. This new model capability will also enable us to use model-predicted AOD on regional scales over the boreal forest to assess future improvements in biogenic VOC emissions and SOA processes in GEM-MACH, by comparing with clear-sky satellite-derived AOD.
GEM-MACH, the atmospheric chemistry library for the GEM numerical atmospheric model (© 2007–2013, Air Quality Research Division and National Prediction Operations Division, Environment and Climate Change Canada), is a free software which can be redistributed and/or modified under the terms of the GNU Lesser General Public License as published by the Free Software Foundation – either version 2.1 of the license or any later version. The modified MACH (chemistry) code with the improved photolysis module can be downloaded from the Zenodo website: https://doi.org/10.5281/zenodo.5042514 (Majdzadeh et al., 2021). The GEM (meteorology) code (CMC, 2021) is available to download from https://github.com/mfvalin?tab=repositories (last access: 25 June 2021). The executable for GEM-MACH is obtained by providing the chemistry library to GEM when generating its executable. Many of the emissions data used in our model are available online at the ECCC web page at http://donnees.ec.gc.ca/data/air/monitor/source-emissions-monitoring-oil-sands-region/source-emissions-oil-sands-region/?lang=en (last access: 16 March 2021; ECCC, 2021b) and more recent updates may be obtained by contacting Junhua Zhang or Mike Moran (junhua.zhang@ec.gc.ca; mike.moran@ec.gc.ca). The CFFEPS v2.03 [code] is available at: https://doi.org/10.5281/zenodo.2579383 (Anderson and cast of thousands, 2019). The model output is available upon request to Craig Stroud (craig.stroud@ec.gc.ca). The AERONET version 3 AOD datasets are publicly available from the AERONET website (https://aeronet.gsfc.nasa.gov/, last access: 5 February 2020; AERONET, 2020). The monthly MERRA-2 aerosol optical depth analysis v5.12.4 (GMAO, 2015) was obtained from the publicly accessible Goddard Earth Sciences Data and Information Services Centre platform (https://giovanni.gsfc.nasa.gov/giovanni/, last access: 1 October 2020; GIOVANNI, 2020). The MAIAC data were obtained from NASA's Land Processes Distributed Active Archive Center (LP DAAC) located at the USGS Earth Resources Observation and Science (EROS) Center (https://doi.org/10.5067/MODIS/MCD19A2.006, Lyapustin and Wang, 2018). The VIIRS data were obtained from NOAA's (National Oceanic and Atmospheric Administration) Comprehensive Large Array-Data Stewardship System (CLASS; https://www.avl.class.noaa.gov/saa/products/welcome, last access: 31 August 2021; Kondragunta et al., 2012).
CAS and MM were responsible for the design, calculations and methodology of this study. MM developed and implemented the improved code into the photolysis module in GEM-MACH, performed the analysis of the model output and wrote the manuscript under the supervision of CAS, with assistance from PAM. CS was responsible for the satellite (MAIAC and VIIRS) data retrieval and plotting, and the calculation of the initial version of the updated lookup table for aerosol optical properties based on the model developed by CM. AA provided support with GEM-MACH model and CFFEPS emissions. MDM contributed emissions data used in the modeling. IA and XZ provided and performed data analysis with AERONET measurements. JC developed the previous offline version of the photolysis module in GEM-MACH and is the lead developer of the ECCC FireWork system.
The contact author has declared that neither they nor their co-authors have any competing interests.
Publisher’s note: Copernicus Publications remains neutral with regard to jurisdictional claims in published maps and institutional affiliations.
The authors thank Balbir Pabla, Verica Savić-Jovčić, Philip Cheung and Shuzhan Ren of Air Quality Research Division of Environment and Climate Change Canada for their expertise and contributions in this project. We thank the NASA AERONET program for supporting the AOD observation data in this project. The data assimilation products used in this study were produced with the GIOVANNI online data system, developed and maintained by the NASA GES DISC (https://giovanni.gsfc.nasa.gov/giovanni/, last access: 1 October 2020). The MAIAC data were obtained from NASA's Land Processes Distributed Active Archive Center (LP DAAC) located at the USGS Earth Resources Observation and Science (EROS) Center, and the VIIRS data were obtained from NOAA's (National Oceanic and Atmospheric Administration) Comprehensive Large Array-Data Stewardship System (CLASS). We acknowledge the mission scientists and Principal Investigators for the satellite and reanalysis data used in this research effort. This work is fully funded under the Oil Sands Monitoring (OSM) program. It is independent of any position of the OSM program.
This research has been supported by the Oil Sands Monitoring Program (grant no. A-PD-6; Integrated Atmospheric Deposition Monitoring).
This paper was edited by Fiona O'Connor and reviewed by two anonymous referees.
AERONET: AERONET, NASA [data set], available at: https://aeronet.gsfc.nasa.gov/, last access: 5 February 2020
Alvarado, M. J., Lonsdale, C. R., Yokelson, R. J., Akagi, S. K., Coe, H., Craven, J. S., Fischer, E. V., McMeeking, G. R., Seinfeld, J. H., Soni, T., Taylor, J. W., Weise, D. R., and Wold, C. E.: Investigating the links between ozone and organic aerosol chemistry in a biomass burning plume from a prescribed fire in California chaparral, Atmos. Chem. Phys., 15, 6667–6688, https://doi.org/10.5194/acp-15-6667-2015, 2015.
Alvarado, M. J., Lonsdale, C. R., Macintyre, H. L., Bian, H., Chin, M., Ridley, D. A., Heald, C. L., Thornhill, K. L., Anderson, B. E., Cubison, M. J., Jimenez, J. L., Kondo, Y., Sahu, L. K., Dibb, J. E., and Wang, C.: Evaluating model parameterizations of submicron aerosol scattering and absorption with in situ data from ARCTAS 2008, Atmos. Chem. Phys., 16, 9435–9455, https://doi.org/10.5194/acp-16-9435-2016, 2016.
Anderson, B. E., Cofer, W. R., Bagwell, D. R., Barrick, J. W., Hudgins, C. H., and Brunke, K. E.: Airborne observations of aircraft aerosol emissions 1: total non-volatile particle emission indices, Geophys. Res. Lett., 25, 1689–1692, 1998.
Anderson, K. and cast of thousands: CFFEPS v2.03, Canadian Forest Service, Natural Resources Canada, Zenodo [code], https://doi.org/10.5281/zenodo.2579383, 2019.
Anderson, K. R., Pankratz, A., and Mooney, C.: A thermodynamic approach to estimating smoke plume heights, in Ninth Symposium on Fire and Forest Meteorology, American Meteorological Society, Palm Springs, CA, USA, available at: https://cfs.nrcan.gc.ca/publications?id=33463 (last access: 22 October 2020), 2011.
Barnaba, F., Putaud, J. P., Gruening, C., dell'Acqua, A., and Dos Santos, S.: Annual cycle in co-located in situ, total-column, and height-resolved aerosol observations in the Po Valley (Italy): Implications for ground-level particulate matter mass concentration estimation from remote sensing, J. Geophys. Res., 115, D19209, https://doi.org/10.1029/2009JD013002, 2010.
Bohren, C. F. and Huffman, D. R.: Absorption and scattering of light by small particles, Wiley, New York, https://doi.org/10.1002/9783527618156, 1983.
Bond, T. C. and Bergstrom, R. W.: Light Absorption by Carbonaceous Particles: An Investigative Review, Aerosol Sci. Tech., 40, 27–67, https://doi.org/10.1080/02786820500421521, 2006.
Bond, T. C., Habib, G., and Bergstrom, R. W.: Limitations in the enhancement of visible light absorption due to mixing state, J. Geophys. Res., 111, D20211, https://doi.org/10.1029/2006JD007315, 2006.
Bozzo, A., Benedetti, A., Flemming, J., Kipling, Z., and Rémy, S.: An aerosol climatology for global models based on the tropospheric aerosol scheme in the Integrated Forecasting System of ECMWF, Geosci. Model Dev., 13, 1007–1034, https://doi.org/10.5194/gmd-13-1007-2020, 2020.
Braslau, N. and Dave, J. N.: Effect of aerosols on the transfer of solar energy through realistic model atmospheres. Part I: Non-absorbing aerosols, J. Appl. Meteor., 12, 601–615, 1973.
Buchard, V., da Silva, A. M., Colarco, P. R., Darmenov, A., Randles, C. A., Govindaraju, R., Torres, O., Campbell, J., and Spurr, R.: Using the OMI aerosol index and absorption aerosol optical depth to evaluate the NASA MERRA Aerosol Reanalysis, Atmos. Chem. Phys., 15, 5743–5760, https://doi.org/10.5194/acp-15-5743-2015, 2015.
Buchard, V., da Silva, A. M., Randles, C. A., Colarco, P., Ferrare, R., Hair, J., Hostetler, C., Tackett, J., and Winker, D.: Evaluation of the surface PM2.5 in version 1 of the NASA MERRA Aerosol Reanalysis over the United States, Atmos. Environ., 125, 100–111, https://doi.org/10.1016/j.atmosenv.2015.11.004, 2016.
Buchard, V., Randles, C. A., da Silva, A. M., Darmenov, A, Colarco, P. R., Govindaraju, R., Ferrare, R., Hair, J., Beyersdorf, A. J., Ziemba, L. D., and Yu, H.: The MERRA-2 Aerosol Reanalysis, 1980 Onward. Part II: Evaluation and Case Studies, J. Climate, 30, 6851–6872, https://doi.org/10.1175/JCLI-D-16-0613.1, 2017.
Canadian Meteorological Centre (CMC): gemdyn and rpnphy repositories, GitHub [code], available at: https://github.com/mfvalin?tab=repositories, last access: 25 June 2021.
Canadian Wildland Fire Information System (CWFIS): Canadian Wildland Fire Information System, CWFIS [data set], available at: http://cwfis.cfs.nrcan.gc.ca, last access: 1 December 2020.
Caron, J.-F. and Anselmo, D.: Regional Deterministic Prediction System (RDPS) Technical Note, Environment Canada, Dorval, Quebec, Canada, 40 pp., available at: http://collaboration.cmc.ec.gc.ca/cmc/cmoi/product_guide/docs/lib/technote_rdps-400_20141118_e.pdf (last access: 15 June 2018), 2014.
Chang, J., Brost, R. A., Isaksen, I. S. A., Madronich, S, Middleton, P., Stockwell, W. R., and Walcek, C. J.: A three-dimensional Eulerian acid deposition model: Physical concepts and formation, J. Geophys. Res., 92, 14681–14700, https://doi.org/10.1029/JD092iD12p14681, 1987.
Charron, M., Polavarapu, S., Buehner, M., Vaillancourt, P. A., Charette, C., Roch, M., Morneau, J., Garand, L., Aparicio, J. M., MacPherson, S., Pellerin, S., St-James, J., and Heilliette, S.: The Stratospheric Extension of the Canadian Global Deterministic Medium-Range Weather Forecasting System and Its Impact on Tropospheric Forecasts, Mon. Weather Rev., 140, 1924–1944, https://doi.org/10.1175/MWR-D-11-00097.1, 2012.
Chen, J., Anderson, K., Pavlovic, R., Moran, M. D., Englefield, P., Thompson, D. K., Munoz-Alpizar, R., and Landry, H.: The FireWork v2.0 air quality forecast system with biomass burning emissions from the Canadian Forest Fire Emissions Prediction System v2.03, Geosci. Model Dev., 12, 3283–3310, https://doi.org/10.5194/gmd-12-3283-2019, 2019.
Chen J., Pendlebury, D., Gravel, S., Stroud, C., Ivanova, I., DeGranpré, J., and Plummer, D.: Development and Current Status of the GEM-MACH-Global Modelling System at the Environment and Climate Change Canada, in: Air Pollution Modeling and its Application XXVI, ITM 2018, edited by: Mensink C., Gong W., and Hakami A., Springer Proceedings in Complexity, Springer, Cham, https://doi.org/10.1007/978-3-030-22055-6_18, 2020.
Chin, M., Ginoux, P., Kinne, S., Torres, O., Holben, B. N., Duncan, B. N., Martin, R. V., Logan, J. A., Higurashi, A., and Nakajima, T.: Tropospheric aerosol optical thickness from the GOCART model and comparisons with satellite and sun photometer measurements, J. Atmos. Sci., 59, 461–483, https://doi.org/10.1175/1520-0469(2002)059<0461:TAOTFT>2.0.CO;2, 2002.
Colarco, P., da Silva, A., Chin, M., and Diehl, T.: Online simulations of global aerosol distributions in the NASA GEOS-4 model and comparisons to satellite and ground-based aerosol optical depth, J. Geophys. Res., 115, D14207, https://doi.org/10.1029/2009JD012820, 2010.
Côté, J., Gravel, S., Méthot, A., Patoine, A., Roch, M., and Staniforth, A.: The operational CMC/MRB global environmental multiscale (GEM) model. Part 1: design considerations and formulation, Mon. Weather Rev., 126, 1373–1395, 1998a.
Côté, J., Desmarais, J.-G., Gravel, S., Méthot, A., Patoine, A., Roch, M., and Staniforth, A.: The operational CMC-MRB global environment multiscale (GEM) model. Part II: results, Mon. Weather Rev., 126, 1397–1418, 1998b.
Curci, G., Hogrefe, C., Bianconi, R., Im, U., Balzarini, A., Baró, R., Brunner, D., Forkel, R., Giordano, L., Hirtl, M., Honzak, L., Jimenez-Guerrero, P., Knote, C., Langer, M., Makar, P., Pirovano, G., Camaño, J., García, R., Syrakov, D., and Galmarini, S.: Uncertainties of simulated aerosol optical properties induced by assumptions on aerosol physical and chemical properties: An AQMEII-2 perspective, Atmos. Environ., 115, 541–552, https://doi.org/10.1016/j.atmosenv.2014.09.009, 2015.
Dave, J. V.: Development of programs for computing characteristics of ultraviolet radiation, Final Report under Contract NAS 5-21680, NASA Report CR-139134, National Aeronautics and Space Administration, Goddard Space Flight Center, Greenbelt, Maryland, NTIS # N75-10746/6SL, 27 pp., 1972.
DeMore, W. B., Sander, S. P., Molina, M. J., Golden, D. M., Hampson, R. F., Kurylo, M. J., Howard, C. J., and Ravishankara, A. R.: Chemical Kinetics and Photochemical Data for Use in Stratospheric Modeling, Evaluation Number 8, National Aeronautics and Space Administration, Jet Propulsion Laboratory, California Institute of Technology, Pasadena, California, 266 pp., 1988.
Dorsey, N. E: Properties of ordinary water-substance in all its phase: water vapor, water and all the ices, Am. Chem. Soc., Monograph Series, no. 81, Reinhold Pub. Corp., New York, 332–338, OCoLC: 571486966, 1940.
Emmons, L. K., Walters, S., Hess, P. G., Lamarque, J.-F., Pfister, G. G., Fillmore, D., Granier, C., Guenther, A., Kinnison, D., Laepple, T., Orlando, J., Tie, X., Tyndall, G., Wiedinmyer, C., Baughcum, S. L., and Kloster, S.: Description and evaluation of the Model for Ozone and Related chemical Tracers, version 4 (MOZART-4), Geosci. Model Dev., 3, 43–67, https://doi.org/10.5194/gmd-3-43-2010, 2010.
Environment and Climate Change Canada (ECCC): Air Pollutant Emissions Inventory (APEI), ECCC [data set] available at: https://www.canada.ca/en/environment-climate-change/services/pollutants/air-emissions-inventory-overview.html, last access: 16 March 2021a.
Environment and Climate Change Canada (ECCC): Source Emissions, Oil Sands Region, ECCC [data set], available at http://donnees.ec.gc.ca/data/air/monitor/source-emissions-monitoring-oil-sands-region/source-emissions-oil-sands-region/?lang=en, last access: 16 March 2021b.
Escribano, J., Gallardo, L., Rondanelli, R., and Choi, Y.-S.: Satellite retrievals of aerosol optical depth over a subtropical urban area: The role of stratification and surface reflectance, Aerosol Air Qual. Res., 14, 596–607, 2014.
Eyth, A., Mason, R., and Zubrow, A.: Development and Status of EPA's 2011 Modeling Platform, 12th CMAS Conference, Chapel Hill, North Carolina, 28–30 October 2013, available at: https://www.cmascenter.org/conference//2013/slides/eyth_development_status_2013.pptx (last access: 1 December 2020), 2013.
Forestry Canada Fire Danger Group: Development and structure of the Canadian Forest Fire Behavior Prediction System, Forestry Canada, Science and Sustainable Development Directorate, Ottawa, Ont. Inf. Rep, ST-X-3, 63 pp., 1992.
Fung, C. S., Misra, P. K., Bloxam, R., and Wong S.: A numerical experiment on the relative importance of H2O2 and O3 in aqueous conversion of SO2 to SO, Atmos. Environ., 25A, 411–423, 1991.
Gan, C.-M., Pleim, J., Mathur, R., Hogrefe, C., Long, C. N., Xing, J., Roselle, S., and Wei, C.: Assessment of the effect of air pollution controls on trends in shortwave radiation over the United States from 1995 through 2010 from multiple observation networks, Atmos. Chem. Phys., 14, 1701–1715, https://doi.org/10.5194/acp-14-1701-2014, 2014a.
Gan, C.-M., Binkowski, F., Pleim, J., Wong, D., Mathur, R., and Gilliam, R.: Assessment of the Aerosol Optics Component of the Coupled WRF-CMAQ Model using CARES Field Campaign data and a Single Column Model, Atmos. Environ., 115, 670–682, https://doi.org/10.1016/j.atmosenv.2014.11.028, 2014b.
Gan, C.-M., Pleim, J., Mathur, R., Hogrefe, C., Long, C. N., Xing, J., Wong, D., Gilliam, R., and Wei, C.: Assessment of long-term WRF–CMAQ simulations for understanding direct aerosol effects on radiation “brightening” in the United States, Atmos. Chem. Phys., 15, 12193–12209, https://doi.org/10.5194/acp-15-12193-2015, 2015.
Gelaro, R., McCarty, W., Suárez, M. J., Todling, R., Molod, A., Takacs, L., Randles, C. A., Darmenov, A., Bosilovich, M. G., Reichle, R., Wargan, K., Coy, L., Cullather, R., Draper, C., Akella, S., Buchard, V., Conaty, A., da Silva, A. M., Gu, W., Kim, G-.K., Koster, R., Lucchesi, R., Merkova, D., Nielsen, J. E., Partyka, G., Pawson, S., Putman, W., Rienecker, M., Schubert, S. D., Sienkiewicz, M., and Zhao, B.: The Modern-Era Retrospective Analysis for Research and Applications, Version 2 (MERRA-2), J. Climate, 30, 5419–5454, https://doi.org/10.1175/JCLI-D-16-0758.1, 2017.
Giles, D. M., Sinyuk, A., Sorokin, M. G., Schafer, J. S., Smirnov, A., Slutsker, I., Eck, T. F., Holben, B. N., Lewis, J. R., Campbell, J. R., Welton, E. J., Korkin, S. V., and Lyapustin, A. I.: Advancements in the Aerosol Robotic Network (AERONET) Version 3 database – automated near-real-time quality control algorithm with improved cloud screening for Sun photometer aerosol optical depth (AOD) measurements, Atmos. Meas. Tech., 12, 169–209, https://doi.org/10.5194/amt-12-169-2019, 2019.
Giovanni: Giovanni, NASA [data set], available at: https://giovanni.gsfc.nasa.gov/giovanni/, last access: 1 October 2020
Girard, C., Plante, A., Desgagné, M., Mctaggart-Cowan, R., Côté, J., Charron, M., Gravel, S., Lee, V., Patoine, A., Qaddouri, A., Roch, M., Spacek, L., Tanguay, M., Vaillancourt, P. A., and Zadra, A.: Staggered vertical discretization of the canadian environmental multiscale (GEM) model using a coordinate of the log-hydrostatic-pressure type, Mon. Weather Rev., 142, 1183–1196, 2014.
Global Modeling and Assimilation Office (GMAO): MERRA-2 tavgM_2d_aer_Nx: 2d, Monthly mean, Time-averaged, Single-Level, Assimilation, Aerosol Diagnostics V5.12.4, Greenbelt, MD, USA, Goddard Earth Sciences Data and Information Services Center (GES DISC) [data set], https://doi.org/10.5067/FH9A0MLJPC7N, 2015.
Gong, S. L., Barrie, L. A., and Lazare, M.: Canadian Aerosol Module (CAM), a size-segregated simulation of atmospheric aerosol processes for climate and air quality models 2, Global sea-salt aerosol and its budgets, J. Geophys. Res., 107, 4779, https://doi.org/10.1029/2001JD002004, 2003a.
Gong, S. L., Barrie, L. A., Blanchet, J.-P., von Salzen, K., Lohmann, U., Lesins, G., Spacek, L., Zhang, L. M., Girard, E., Lin, H., Leaitch, R., Leighton, H., Chylek, P., and Huang, P.: Canadian Aerosol Module: a size-segregated simulation of atmospheric aerosol processes for climate and air quality models, 1. Module development, J. Geophys. Res. 108, 4007, https://doi.org/10.1029/2001JD002002, 2003b.
Gong, W., Dastoor, A. P., Bouchet, V. S., Gong, S. L., Makar, P. A., Moran, M. D., Pabla, B., Menard, S., Crevier, L.-P., Cousineau, S., and Venkatesh, S.: Cloud processing of gases and aerosols in a regional air quality model (AURAMS), Atmos. Res., 82, 248–275, 2006.
Gong, W., Makar, P. A., Zhang, J., Milbrandt, J., and Gravel, S.: Modelling aerosol-cloud- meteorology interaction: a case study with a fully coupled air-quality model (GEM-MACH), Atmos. Environ., 115, 695–715, https://doi.org/10.1016/j.atmosenv.2015.05.062, 2015.
Gosse, S. F., Wang, M., Labrie, D., and Chylek, P.: Imaginary part of the refractive index of sulfates and nitrates in the 0.7–2.6-µm spectral region, Appl. Opt., 36, 3622–3634, 1997.
Hansen, J. E. and Travis, L. D.: Light scattering in planetary atmospheres, Space. Sci. Rev., 16, 527–610, 1974.
Healy, R. M., Riemer, N., Wenger, J. C., Murphy, M., West, M., Poulain, L., Wiedensohler, A., O'Connor, I. P., McGillicuddy, E., Sodeau, J. R., and Evans, G. J.: Single particle diversity and mixing state measurements, Atmos. Chem. Phys., 14, 6289–6299, https://doi.org/10.5194/acp-14-6289-2014, 2014.
Hillger, D., Kopp, T., Lee, T., Lindsey, D., Seaman, C., Miller, S., Solbrig, J., Kidder, S., Bachmeier, S., Jasmin, T., and Rink, T.: First-light imagery from Suomi NPP VIIRS, B. Am. Meteorol. Soc., 94, 1019–1029, 2013.
IPCC: Global warming of 1.5 ∘C. An IPCC Special Report on the impacts of global warming of 1.5 ∘C above pre-industrial levels and related global greenhouse gas emission pathways, in the context of strengthening the global response to the threat of climate change, sustainable development, and efforts to eradicate poverty, edited by: Masson-Delmotte, V., Zhai, P., Pörtner, H. O., Roberts, D., Skea, J., Shukla, P. R., Pirani, A., Moufouma-Okia, W., Péan, C., Pidcock, R., Connors, S., Matthews, J. B. R., Chen, Y., Zhou, X., Gomis, M. I., Lonnoy, E., Maycock, T., Tignor, M., Waterfield T., in press, 2018.
Jacob, D. J., Crawford, J. H., Maring, H., Clarke, A. D., Dibb, J. E., Emmons, L. K., Ferrare, R. A., Hostetler, C. A., Russell, P. B., Singh, H. B., Thompson, A. M., Shaw, G. E., McCauley, E., Pederson, J. R., and Fisher, J. A.: The Arctic Research of the Composition of the Troposphere from Aircraft and Satellites (ARCTAS) mission: design, execution, and first results, Atmos. Chem. Phys., 10, 5191–5212, https://doi.org/10.5194/acp-10-5191-2010, 2010.
Jacobson, M. Z.: A physically-based treatment of elemental carbon optics: Implications for global direct forcing of aerosols, Geophys. Res. Lett., 27, 217–220, https://doi.org/10.1029/1999GL010968, 2000.
Jacobson, M. Z.: Strong radiative heating due to the mixing state of black carbon in atmospheric aerosols, Nature, 409, 695–697, https://doi.org/10.1038/35055518, 2001.
Jacobson, M. Z.: Fundamentals of Atmospheric Modeling, 2nd edn., Cambridge University Press, Cambridge, https://doi.org/10.1017/CBO9781139165389, 2005.
Jeong, G.-R.: Weather effects of aerosols in the global forecast model, Atmosphere, 11, 850, https://doi.org/10.3390/atmos11080850, 2020.
Jöckel, P., Sander, R., Kerkweg, A., Tost, H., and Lelieveld, J.: Technical Note: The Modular Earth Submodel System (MESSy) – a new approach towards Earth System Modeling, Atmos. Chem. Phys., 5, 433–444, https://doi.org/10.5194/acp-5-433-2005, 2005.
Johnson, B. T., Haywood, J. M., Langridge, J. M., Darbyshire, E., Morgan, W. T., Szpek, K., Brooke, J. K., Marenco, F., Coe, H., Artaxo, P., Longo, K. M., Mulcahy, J. P., Mann, G. W., Dalvi, M., and Bellouin, N.: Evaluation of biomass burning aerosols in the HadGEM3 climate model with observations from the SAMBBA field campaign, Atmos. Chem. Phys., 16, 14657–14685, https://doi.org/10.5194/acp-16-14657-2016, 2016.
Kelly, J., Makar, P. A., and Plummer, D. A.: Projections of mid-century summer air-quality for North America: effects of changes in climate and precursor emissions, Atmos. Chem. Phys., 12, 5367–5390, https://doi.org/10.5194/acp-12-5367-2012, 2012.
Kondragunta, S., Laszlo, I., Qiu, S., and NOAA JPSS Program Office: NOAA JPSS Visible Infrared Imaging Radiometer Suite (VIIRS) Aerosol Optical Thickness (AOT) and Particle Size Parameter (APSP) Environmental Data Record (EDR) from IDPS, NOAA National Centers for Environmental Information [data set], available at: https://www.avl.class.noaa.gov/saa/products/welcome (last access: 31 August 2021), 2012.
Kou, L.: Black carbon: Atmospheric measurements and radiative effect, PhD thesis, Dalhousie Univ., Halifax, NS, 144 pp., available at: http://hdl.handle.net/10222/55517 (last access: 1 December 2021), 1996.
Landgraf, J. and Crutzen, P. J.: An efficient method for online calculations of photolysis and heating rates, J. Atmos. Sci., 55, 863–878, 1998.
Laskina, O., Morris H. S., Grandquist, J. R., Qin, Z., Stone, E. A., Tivanski, A. V., and Grassian, V. H.: Size Matters in the Water Uptake and Hygroscopic Growth of Atmospherically Relevant Multicomponent Aerosol Particles, J. Phys. Chem. A., 119, 4489–4497, https://doi.org/10.1021/jp510268p, 2015.
Latimer, R. N. C. and Martin, R. V.: Interpretation of measured aerosol mass scattering efficiency over North America using a chemical transport model, Atmos. Chem. Phys., 19, 2635–2653, https://doi.org/10.5194/acp-19-2635-2019, 2019.
Lee, B. S., Alexander, M., Hawkes, B., Lynham, T. J., Stocks, B., and Englefield, P.: Information Systems in Support of Wildland Fire Management Decision Making in Canada, Comput. Electron. Agr., 37, 185–198, https://doi.org/10.1016/S0168-1699(02)00120-5, 2002.
Lei, T., Zuend, A., Wang, W. G., Zhang, Y. H., and Ge, M. F.: Hygroscopicity of organic compounds from biomass burning and their influence on the water uptake of mixed organic ammonium sulfate aerosols, Atmos. Chem. Phys., 14, 11165–11183, https://doi.org/10.5194/acp-14-11165-2014, 2014.
Lei, T., Zuend, A., Cheng, Y., Su, H., Wang, W., and Ge, M.: Hygroscopicity of organic surrogate compounds from biomass burning and their effect on the efflorescence of ammonium sulfate in mixed aerosol particles, Atmos. Chem. Phys., 18, 1045–1064, https://doi.org/10.5194/acp-18-1045-2018, 2018.
Li, J. and Barker, H. W.: A Radiation Algorithm with Correlated-k Distribution. Part I: Local Thermal Equilibrium, J. Atmos. Sci., 62, 286–309, 2005.
Liu, D., Whitehead, J., and Alfarra, M.: Black-carbon absorption enhancement in the atmosphere determined by particle mixing state, Nat. Geosci., 10, 184–188, https://doi.org/10.1038/ngeo2901, 2017.
Lurmann, F. W., Lloyd, A. C., and Atkinson, R.: A chemical mechanism for use in long range transport/acid deposition computer modeling, J. Geophys. Res., 91, 10905–10936, 1986.
Lyapustin, A. and Wang, Y.: MCD19A2 MODIS/Terra+Aqua Land Aerosol Optical Depth Daily L2G Global 1 km SIN Grid V006, NASA EOSDIS Land Processes DAAC [data set], https://doi.org/10.5067/MODIS/MCD19A2.006, 2018.
Lyapustin, A., Wang, Y., Korkin, S., and Huang, D.: MODIS Collection 6 MAIAC algorithm, Atmos. Meas. Tech., 11, 5741–5765, https://doi.org/10.5194/amt-11-5741-2018, 2018.
Majdzadeh, M., Stroud, C. A., and GEM-MACH Development Team: GEM-MACH: Aerosol Effect (with Core-Shell Parameterization) on MESSy-JVAL Photolysis, Zenodo [code], https://doi.org/10.5281/zenodo.5042514, 2021.
Makar, P. A., Bouchet, V. S., and Nenes, A.: Inorganic Chemistry Calculations using HETV – A Vectorized Solver for the SONONH system based on the ISORROPIA Algorithms, Atmos. Environ., 37, 2279–2294, 2003.
Makar, P. A., Gong,W., Milbrandt, J., Hogrefe, C., Zhang, Y., Curci,G., Zabkar, R., Im, U., Balzarini, A., Baro, R., Bianconi, R., Cheung, P., Forkel, R., Gravel, S., Hirtl, H., Honzak, L., Hou, A., Jimenz-Guerrero, P., Langer, M., Moran, M. D., Pabla, B., Perez, J. L., Pirovano, G., San Jose, R., Tuccella, P., Werhahn, J., Zhang, J., and Galmarini, S.: Feedbacks between air pollution and weather, part 1: Effects on weather, Atmos. Environ., 115, 442–469, 2015a.
Makar, P. A., Gong, W., Hogrefe, C., Zhang, Y., Curci, G., Zabkar, R., Milbrandt, J., Im, U., Balzarini, A., Baro, R., Bianconi, R., Cheung, P., Forkel, R., Gravel, S., Hirtl, H., Honzak, L., Hou, A., Jimenz-Guerrero, P., Langer, M., Moran, M. D., Pabla, B., Perez, J. L., Pirovano, G., San Jose, R., Tuccella, P., Werhahn, J., Zhang, J., and Galmarini S.: Feedbacks between air pollution and weather, part 2: Effects on chemistry, Atmos. Environ., 15, 499–526, 2015b.
Makar, P. A., Akingunola, A., Aherne, J., Cole, A. S., Aklilu, Y.-A., Zhang, J., Wong, I., Hayden, K., Li, S.-M., Kirk, J., Scott, K., Moran, M. D., Robichaud, A., Cathcart, H., Baratzedah, P., Pabla, B., Cheung, P., Zheng, Q., and Jeffries, D. S.: Estimates of exceedances of critical loads for acidifying deposition in Alberta and Saskatchewan, Atmos. Chem. Phys., 18, 9897–9927, https://doi.org/10.5194/acp-18-9897-2018, 2018.
Makar, P. A., Akingunola, A., Chen, J., Pabla, B., Gong, W., Stroud, C., Sioris, C., Anderson, K., Cheung, P., Zhang, J., and Milbrandt, J.: Forest-fire aerosol–weather feedbacks over western North America using a high-resolution, online coupled air-quality model, Atmos. Chem. Phys., 21, 10557–10587, https://doi.org/10.5194/acp-21-10557-2021, 2021.
Markovic, M., Jones, C., Vaillancourt, P., Paquin, D., Winger, K., and Paquin-Ricard, D.: An evaluation of the surface radiation budget over North America for a suite of regional climate models against surface station observations, Clim. Dynam., 31, 779–794, https://doi.org/10.1007/s00382-008-0378-6, 2008.
Mätzler, C.: MATLAB functions for Mie scattering and absorption, Version 2, Res. Rep. 2002-11, Inst. für Angew. Phys., Bern, available at: http://www.atmo.arizona.edu/students/courselinks/spring08/atmo336s1/courses/spring09/atmo656b/maetzler_mie_v2.pdf (last access: 1 October 2020), 2002.
McLinden, C. A., McConnell, J. C., Griffioen, E., and McElroy, C. T.: A vector radiative-transfer model for the Odin/OSIRIS project, Can. J. Phys., 80, 375–393, 2002.
McMeeking, G. R., Hamburger, T., Liu, D., Flynn, M., Morgan, W. T., Northway, M., Highwood, E. J., Krejci, R., Allan, J. D., Minikin, A., and Coe, H.: Black carbon measurements in the boundary layer over western and northern Europe, Atmos. Chem. Phys., 10, 9393–9414, https://doi.org/10.5194/acp-10-9393-2010, 2010.
Moran M. D., Ménard, S., Talbot, D., Huang, P., Makar, P. A., Gong, W., Landry, H., Gravel, S., Gong, S., Crevier, L.-P., Kallaur, A., and Sassi, M.: Particulate-matter forecasting with GEMMACH15, a new Canadian air-quality forecast model, in: Air Pollution Modelling and Its Application XX, edited by: Steyn, D. G. and Rao, S. T., Springer, Dordrecht, 289–292, https://doi.org/10.1007/978-90-481-3812-8, 2010
Pan, X., Ichoku, C., Chin, M., Bian, H., Darmenov, A., Colarco, P., Ellison, L., Kucsera, T., da Silva, A., Wang, J., Oda, T., and Cui, G.: Six global biomass burning emission datasets: intercomparison and application in one global aerosol model, Atmos. Chem. Phys., 20, 969–994, https://doi.org/10.5194/acp-20-969-2020, 2020.
Pavlovic, R., Chen, J., Anderson, K., Moran, M. D., Beaulieu, P. A., Davignon, D., and Cousineau, S.: The FireWork air quality forecast system with near-real-time biomass burning emissions: Recent developments and evaluation of performance for the 2015 North American wildfire season, J. Air Waste Manage., 66, 819–841, 2016.
Péré, C., Mallet, M., Bessagnet, B., and Pont, V.: Evidence of the aerosol core-shell mixing state over Europe during the heat wave of summer 2003 by using CHIMERE simulations and AERONET inversions, Geophys. Res. Lett., 36, L09807, https://doi.org/10.1029/2009GL037334, 2009.
Peterson, J. T.: Calculated actinic fluxes (290–700 nm) for air pollution photochemistry applications, US Environmental Protection Agency Report Number: EPA-600/4-76-025, 55 pp., 1976.
Randles, C. A., da Silva, A. M., Buchard, V., Colarco, P. R., Darmenov, A., Govindaraju, R., Smirnov, A., Holben, B., Ferrare, R., Hair, J., Shinozuka, Y., and Flynn, C. J.: The MERRA-2 Aerosol Reanalysis, 1980 Onward. Part I: System Description and Data Assimilation Evaluation, J. Climate, 30, 6823–6850, https://doi.org/10.1175/JCLI-D-16-0609.1, 2017.
Riemer, N., Ault, A. P., West, M., Craig, R. L., and Curtis, J. H.: Aerosol mixing state: Measurements, modeling, and impacts, Rev. Geophys., 57, 187–249, https://doi.org/10.1029/2018RG000615, 2019.
Rienecker, M. M., Suarez, M. J., Gelaro, R., Todling, R., Bacmeister, J., Liu, E., Bosilovich, M. G., Schubert, S. D., Takacs, L., Kim, G-K., Bloom, S., Chen, J., Collins, D., Conaty, A., da Silva, A., Gu, W., Joiner, J., Koster, R. D., Lucchesi, R., Molod, A., Owens, T., Pawson, S., Pegion, P., Redder, C. R., Reichle, R., Robertson, F. R., Ruddick, A. G., Sienkiewicz, M., and Woollen, J.: MERRA: NASA's Modern-Era Retrospective Analysis for Research and Applications, J. Climate, 24, 3624–3648, https://doi.org/10.1175/JCLI-D-11-00015.1, 2011.
Sander, R., Baumgaertner, A., Gromov, S., Harder, H., Jöckel, P., Kerkweg, A., Kubistin, D., Regelin, E., Riede, H., Sandu, A., Taraborrelli, D., Tost, H., and Xie, Z.-Q.: The atmospheric chemistry box model CAABA/MECCA-3.0, Geosci. Model Dev., 4, 373–380, https://doi.org/10.5194/gmd-4-373-2011, 2011.
Sander, R., Jöckel, P., Kirner, O., Kunert, A. T., Landgraf, J., and Pozzer, A.: The photolysis module JVAL-14, compatible with the MESSy standard, and the JVal PreProcessor (JVPP), Geosci. Model Dev., 7, 2653–2662, https://doi.org/10.5194/gmd-7-2653-2014, 2014.
Schuster, G. L., Lin, B., and Dubovik, O.: Remote sensing of aerosol water uptake, Geophys. Res. Lett., 36, L03814, https://doi.org/10.1029/2008GL036576, 2009.
Shettle, E. P. and Fenn, R. W.: Models for the aerosols of the lower atmosphere and the effects of humidity variations on their optical properties, Air Force Geophysics Laboratory, AFGL Technical Report 79-0214, Environmental Research Papers, No. 676, Bedford, Massachusetts, 1979.
Slingo, A.: A GCM parameterization for the shortwave radiative properties of water clouds, J. Atmos. Sci., 46, 1419–1427, 1989.
SMOKE: Sparse Matrix Operator Kerner Emissions Modeling System, SMOKE [data set], available at: https://cmascenter.org/smoke/, last access: 16 March 2021.
Stevens, R., and Dastoor, A.: A Review of the Representation of Aerosol Mixing State in Atmospheric Models, Atmosphere, 10, 168, https://doi.org/10.3390/atmos10040168, 2019.
Tang, I. N.: Chemical and size effects of hygroscopic aerosols on light scattering coefficients, J. Geophys. Res., 101, 19245–19250, 1996.
Tang, I. N. and Munkelwitz, H. R.: Water activities, densities, and refractive indices of aqueous sulfates and sodium nitrate droplets of atmospheric importance, J. Geophys. Res., 99, 18801–18808, 1994.
Tang, I. N., Wong, W. T., and Munkelwitz, H. R.: The relative importance of atmospheric sulfates and nitrates in visibility reduction, Atmos. Env., 15, 2463–2471, 1981.
Tombette, M., Chazette, P., Sportisse, B., and Roustan, Y.: Simulation of aerosol optical properties over Europe with a 3-D size-resolved aerosol model: comparisons with AERONET data, Atmos. Chem. Phys., 8, 7115–7132, https://doi.org/10.5194/acp-8-7115-2008, 2008.
Toon, O. B. and Pollack, J. B.: A Global Average Model of Atmospheric Aerosols for Radiative Transfer Calculations, J. Appl. Meteor., 15, 225–246, https://doi.org/10.1175/1520-0450(1976)015<0225:AGAMOA>2.0.CO;2, 1976.
Toon, O. B., Pollack, J. B., and Khare, B. N.: The optical constants of several atmospheric aerosol species: Ammonium sulfate, aluminum oxide, and sodium chloride, J. Geophys. Res., 81, 5733–5748, 1976.
United States Environmental Protection Agency (EPA): 2011 air emissions modeling version 6.3 platform, EPA [data set], available at: https://www.epa.gov/air-emissions-modeling/2011-version-63-platform, last access: 16 March 2021a.
United States Environmental Protection Agency (EPA): 2011 air emissions modeling version 6.2 platform, EPA [data set], available at: https://www.epa.gov/air-emissions-modeling/2011-version-62-platform, last access: 16 March 2021b.
Van Wagner, C. E.: Development and structure of the Canadian Forest Fire Weather Index System, Can. For. Serv., Ottawa, Ont. For. Tech. Rep., 35, 37 pp., available at: https://d1ied5g1xfgpx8.cloudfront.net/pdfs/19927.pdf, 1987.
Yamamoto, G. and Tanaka, M.: Increase of global albedo due to air pollution, J. Atmos. Sci., 29, 1405–1412, 1972.
Zamora, I. R. and Jacobson, M. Z.: Measuring and modeling the hygroscopic growth of two humic substances in mixed aerosol particles of atmospheric relevance, Atmos. Chem. Phys., 13, 8973–8989, https://doi.org/10.5194/acp-13-8973-2013, 2013.
Zhang, L., Gong, S., Padro, J., and Barrie, L.: A size-segregated particle dry deposition scheme for an atmospheric aerosol module, Atmos. Environ., 35, 549–560, 2001.