the Creative Commons Attribution 4.0 License.
the Creative Commons Attribution 4.0 License.
 | 12 Jan 2022
The sensitivity of simulated aerosol climatic impact to domain size using regional model (WRF-Chem v3.6)
Xiaodong Wang
Chun Zhao
Mingyue Xu
Qiuyan Du
Jianqiu Zheng
Yun Bi
Shengfu Lin
Yali Luo
Domain size can have significant impact on regional modeling results, but few studies examined the sensitivities of simulated aerosol impact to regional domain size. This study investigates the regional modeling sensitivities of aerosol impact on the East Asian summer monsoon (EASM) to domain size. The simulations with two different domain sizes demonstrate consistently that aerosols induce the cooling of the lower troposphere that leads to the anticyclone circulation anomalies and thus the weakening of EASM moisture transport. The aerosol-induced adjustment of monsoonal circulation results in an alternate increase and decrease pattern of precipitation over China. Domain size has a great influence on the simulated meteorological fields. For example, the simulation with larger domain size produces weaker EASM circulation, which also affects aerosol distributions significantly. This leads to the difference of simulated strength and area extent of aerosol-induced changes of lower-tropospheric temperature and pressure, which further results in different distributions of circulation and precipitation anomalies over China. For example, over southeastern China, aerosols induce the increase (decrease) of precipitation from the smaller-domain (larger-domain) simulation. Different domain sizes consistently simulate an aerosol-induced increase in precipitation around 30∘ N over eastern China. This study highlights the important influence of domain size on regional modeling results of aerosol impact on circulation and precipitation, which may not be limited to East Asia. More generally, this study also implies that proper modeling of meteorological fields with appropriate domain size is one of the keys to simulating robust aerosol climatic impact.
- Article
(20613 KB) - Full-text XML
-
Supplement
(1931 KB) - BibTeX
- EndNote


-
Domain size has a great influence on the simulated meteorological fields and aerosol distribution during the East Asian summer monsoon (EASM).
-
Regional simulations with different domain sizes demonstrate consistently that aerosols weaken EASM moisture transport.
-
Different domain sizes result in different strengths of aerosol-induced changes of temperature and thus circulation and rainfall over China.
As one of the forcings of climate change, aerosols contribute the largest uncertainty to the total radiative forcing estimate, and they have attracted more and more attention since the 1980s (IPCC, 2013; Li et al., 2019). Aerosols can absorb and scatter solar radiation through aerosol–radiation interactions, affect the regional radiation budget, and amplify its impact through atmospheric mixing and circulation (e.g., Schwartz, 1996; Rinke et al., 2004; Kim et al., 2007; Z. Li et al., 2010; Zhao et al., 2011, 2012, 2014; Myhre et al., 2013; Kuniyal and Guleria, 2019; Zhang et al., 2020). Serving as cloud condensation nuclei or ice nuclei, aerosols can change the microscopic and macroscopic characteristics of clouds and affect the climate, which is called aerosol–cloud interactions (Twomey, 1977; Albrecht, 1989; Ackerman et al., 2000; Fan et al., 2012, 2013, 2016). There are also some other possible aerosol–cloud–precipitation interactions that may amplify or dampen this effect (Rosenfeld et al., 2008, 2014; Tao et al., 2012; Fan et al., 2015, 2018).
Due to the large population and the rapid economic development in last few decades, East Asia has encountered large aerosol loading and suffered from severe air pollution caused by various emission sources (e.g., Chan and Yao, 2008; X. Y. Zhang et al., 2012; Li et al., 2017; An et al., 2019). Moreover, East Asia is within the monsoon region, and its weather and climate systems are more complicated, which makes the study of aerosol effects more challenging (Ding and Chan, 2005; Ding, 2007; Li et al., 2016, 2019; Wu et al., 2016). In recent decades, the East Asian summer monsoon (EASM) and the associated precipitation in eastern China have shown strong inter-decadal changes (Ding et al., 2008, 2013; Zhou et al., 2009; Zhu et al., 2011; Zhang, 2015), which has a significant impact on agriculture, economy, and human life (An et al., 2015). Many factors may be related to the inter-decadal variability of the EASM, such as extraterrestrial natural forcing, internal dynamical feedbacks within the climate system, and changes in atmospheric composition (e.g., greenhouse gases and aerosols) and surface conditions (land cover change or urbanization) related to anthropogenic factors (Ding et al., 2008a, b; H. Li et al., 2010; Song and Zhou, 2014; Xiao and Duan, 2016; Jiang et al., 2017). As one of the forcing factors, aerosols have attracted many people to study their effect on the weather and climate of East Asia (Cowan and Cai, 2011; H. Zhang et al., 2012; Guo et al., 2013; Jiang et al., 2013, 2017; Wu et al., 2013; Song et al., 2014; Li et al., 2015, 2018; Wang et al., 2015, 2017; Chen et al., 2016; Kim et al., 2016; Xie et al., 2016; Dong et al., 2019).
Numerous studies have used global climate models to study the impact of anthropogenic aerosols on the EASM climate and understand the mechanisms underneath (e.g., Guo et al., 2013; Jiang et al., 2013, 2017; Song et al., 2014; Yan et al., 2015; Chen et al., 2016; Wang et al., 2017; Li et al., 2018; Dong et al., 2019). The global modeling results have shown that aerosols tend to reduce the land–sea thermal contrast, weaken the EASM, and thereby reduce the rainfall over China (e.g., Guo et al., 2013; Jiang et al., 2013; Song et al., 2014; Wang et al., 2017; Li et al., 2018; Dong et al., 2019). The reduction of monsoon precipitation over China may reduce the release of latent heat from condensation in the upper troposphere and further weaken the EASM (e.g., Jiang et al., 2013; Li et al., 2019). Jiang et al. (2013) used the CAM5 (the Community Atmospheric Model version 5) model to study the effect of different aerosol types on clouds and precipitation during the EASM and found that all anthropogenic aerosols suppressed the precipitation in northern China and enhanced the precipitation in southern China and the adjacent ocean areas. Through analyzing the CMIP5 (Coupled Model Intercomparison Program phase 5) modeling results, Song et al. (2014) examined the contributions of different forcings (aerosol forcing, greenhouse gas forcing, and natural forcing) to the weakening of EASM circulation during 1958–2001. They found that aerosol forcing played a major role.
Global climate models have been widely used for investigating aerosol impact. However, there are still large uncertainties with the results at regional scale, partly because it is still not possible to accurately describe the regional-scale monsoon rainband and aerosol distributions with relatively lower model horizontal resolution (H. M. Li et al., 2010; Guo et al., 2013; Jiang et al., 2013; Song et al., 2014; Li et al., 2018; Dong et al., 2019). In comparison, regional models often have relatively higher horizontal resolution and can better capture regional features of weather and climate systems and aerosol distributions, and therefore has been used to investigate aerosol regional climatic impact recently (e.g., Zhang et al., 2009; Stanelle et al., 2010; Zhao et al., 2011, 2012; Wu et al., 2013; Wang et al., 2015; Crippa et al., 2017; Zhuang et al., 2018). For example, Crippa et al. (2017) found that the enhanced resolution (from 60 to 12 km) can improve the regional model performance of meteorological fields and aerosol optical depth (AOD). Using the regional model (RegCCMS), Wang et al. (2015) found that aerosol–cloud interaction decreased the auto-conversion rates of cloud water to rain water and increased the liquid water path of clouds in eastern China, which further strengthened the cooling of the lower atmosphere caused by aerosol–radiation interaction and suppressed the convective precipitation. Wu et al. (2013), with the regional model (WRF-Chem), found that the aerosol heating effect caused the cloud to move northward over eastern China and led to the increased precipitation in the north.
Although regional models at higher horizontal resolution may better capture regional features of wind, cloud, precipitation, and aerosols, they also introduce additional uncertainties on modeling regional aerosol climatic impact resulting from the lateral boundary conditions of regional simulation. Previous studies have found that the domain size of the regional model could significantly influence the simulation results (e.g., Warner et al., 1997; Leduc and Laprise, 2009; Leduc et al., 2011; Bhaskaran et al., 2012; Diaconescu et al., 2013; Di Luca et al., 2015; Giorgi, 2019). For example, Bhaskaran et al. (2012) studied the sensitivity of the simulated hydrological cycle to the regional domain size over the Indian subcontinent. They found that the simulations with smaller domains produced the increased precipitation and evapotranspiration on seasonal mean and the higher number of moderate precipitation days relative to the ones with larger domains. Different distributions of cloud, precipitation, and winds from the simulations with different domain sizes may lead to different aerosol distributions and the associated climatic impact. Previous studies have found that aerosol impact on precipitation, clouds, and circulation would be significantly different under different weather and climate conditions (e.g., Wu et al., 2013; Wang et al., 2015; Xie et al., 2016). In addition, Seth and Giorgi (1998) found that the smaller-domain simulation produced better precipitation when compared with the observations but resulted in an unrealistic response to the internal forcing. This indicates that the simulation domain size may also affect the aerosol impact on large-scale circulation. Therefore, the regional simulation with increased domain size may be preferable to reflect the overall aerosol impact on large-scale circulation and climate system without strict constraint from boundary forcing (e.g., Seth and Giorgi, 1998; Leduc and Laprise, 2009; Xue et al., 2014), but the increased domain size may make the simulation deviate from the forcing as in the reanalysis.
As far as we know, there are few studies examining the sensitivities of regional modeling results of aerosol impact to domain size. Although it can be expected that domain size will play a role, it is unknown to what extent and how domain size can affect modeling results of aerosol climatic impact. Therefore, in this study, the regional online-coupled meteorology and chemistry model WRF-Chem (Weather Research and Forecasting model coupled with Chemistry) (Grell et al., 2005; Skamarock et al., 2008) is used to study the aerosol impact on the EASM system with the focus on the modeling sensitivities to regional domain size. WRF-Chem has been widely used for studying aerosol meteorological and climatic impact over East Asia (e.g., A. J. Ding et al., 2013; Wu et al., 2013; Gao et al., 2014; Chen et al., 2014; Zhao et al., 2014; Huang et al., 2016; Liu et al., 2016; Petäjä et al., 2016; B. Zhao et al., 2017). The investigation of aerosol impact under different simulated meteorological fields due to different domain sizes may also help understand the different modeling results about the aerosol impact on EASM from previous studies. The study is organized as follows. Section 2 describes the numerical experiments and methods. The results and discussions are presented in Sect. 3. A summary is provided in Sect. 4.
2.1 WRF-Chem
In this study, the version of WRF-Chem updated by the University of Science and Technology of China (USTC version of WRF-Chem) is used. The model simulates the emission, transport, mixing, and chemical transformation of trace gases and aerosols simultaneously with the meteorology, and can be used for investigation of regional-scale air quality and interactions between meteorology and chemistry. Compared with the publicly released version, the USTC version of WRF-Chem includes a few additional functions, such as the diagnosis of radiative forcing of aerosol species, optimized Kain–Fritsch (KF) convection scheme, aerosol–snow interaction, land surface coupled biogenic volatile organic compound (VOC) emission, etc. (Zhao et al., 2013a, b, 2014, 2016; Zhang et al., 2021; Hu et al., 2019; Du et al., 2020), all of which may have important impacts on modeling aerosols and their climatic impact.
The Model for Simulating Aerosol Interactions and Chemistry (MOSAIC) aerosol module coupled with the CBM-Z (carbon bond mechanism) photochemical mechanism in WRF-Chem is selected in this study (Zaveri and Peters, 1999; Zaveri et al., 2008). MOSAIC uses a sectional approach to represent aerosol size distributions with four or eight discrete size bins in the current version of WRF-Chem (Fast et al., 2006). To reduce the computational cost, four discrete size bins are selected in this study. All major aerosol components including sulfate, nitrate, ammonium, black carbon, organic matter, sea salt, mineral dust, and other inorganic matter (OIN) are simulated in the model. The MOSAIC aerosol scheme includes physical and chemical processes of nucleation, condensation, coagulation, aqueous-phase chemistry, and water uptake by aerosols. Dry deposition of aerosol mass and number is simulated following the approach of Binkowski and Shankar (1995), which includes both turbulent diffusion and gravitational settling. Wet removal of aerosols by grid-resolved stratiform clouds and precipitation includes in-cloud removal (rainout) and below-cloud removal (washout) by impaction and interception, following Easter et al. (2004) and Chapman et al. (2009). In this study, cloud-ice-borne aerosols are not explicitly treated in the model, but the removal of aerosols by the droplet freezing process is considered. Convective transport and wet removal of aerosols by cumulus clouds is coupled with the Kain–Fritsch cumulus scheme as in Zhao et al. (2013b). Aerosol radiative feedback is coupled with the Rapid Radiative Transfer Model (RRTMG) (Mlawer et al., 1997; Iacono et al., 2000) for both SW and LW radiation as implemented by Zhao et al. (2011). The optical properties and direct radiative forcing of individual aerosol species in the atmosphere are diagnosed following the methodology described in Zhao et al. (2013a).
2.2 Numerical experiments
Four sets of experiments, CTRL-L, CTRL-S, CLEAN-L, and CLEAN-S, with different simulation domain sizes or emission configurations are conducted as explained and listed in Table 1. The control experiments (CTRL-S and CTRL-L) use a standard anthropogenic emission dataset (described in Sect. 2.3), while the clean simulations (CLEAN-S and CLEAN-L) apply a factor of 0.1 on the standard emissions within the small domain to represent a clean atmosphere condition over East Asia (Fig. 1). The CTRL-L and CTRL-S (CLEAN-L and CLEAN-S) represent the simulations with large and small domain sizes, respectively, as shown in Fig. 1. The aerosol impact can be calculated by the difference between the CTRL and CLEAN simulations for each simulation domain. The comparison of aerosol impact between the large and small simulation domains implies the sensitivity of aerosol impact to domain size. Besides these experiments, another set of experiments, NoRA-S, is conducted to isolate aerosol–radiation and aerosol–cloud interactions for further understanding the mechanisms of aerosol impact, which is also listed in Table 1. The horizontal resolution of 30 km is selected for both simulation domains with the consideration of the balance of computational efficiency and modeling performance, particularly for the larger domain. The comparable horizontal resolutions have also been widely used for investigating aerosol impact on regional climate (e.g., Zhang et al., 2009; Stanelle et al., 2010; Zhao et al., 2011, 2012; Chen et al., 2014; Wang et al., 2015).
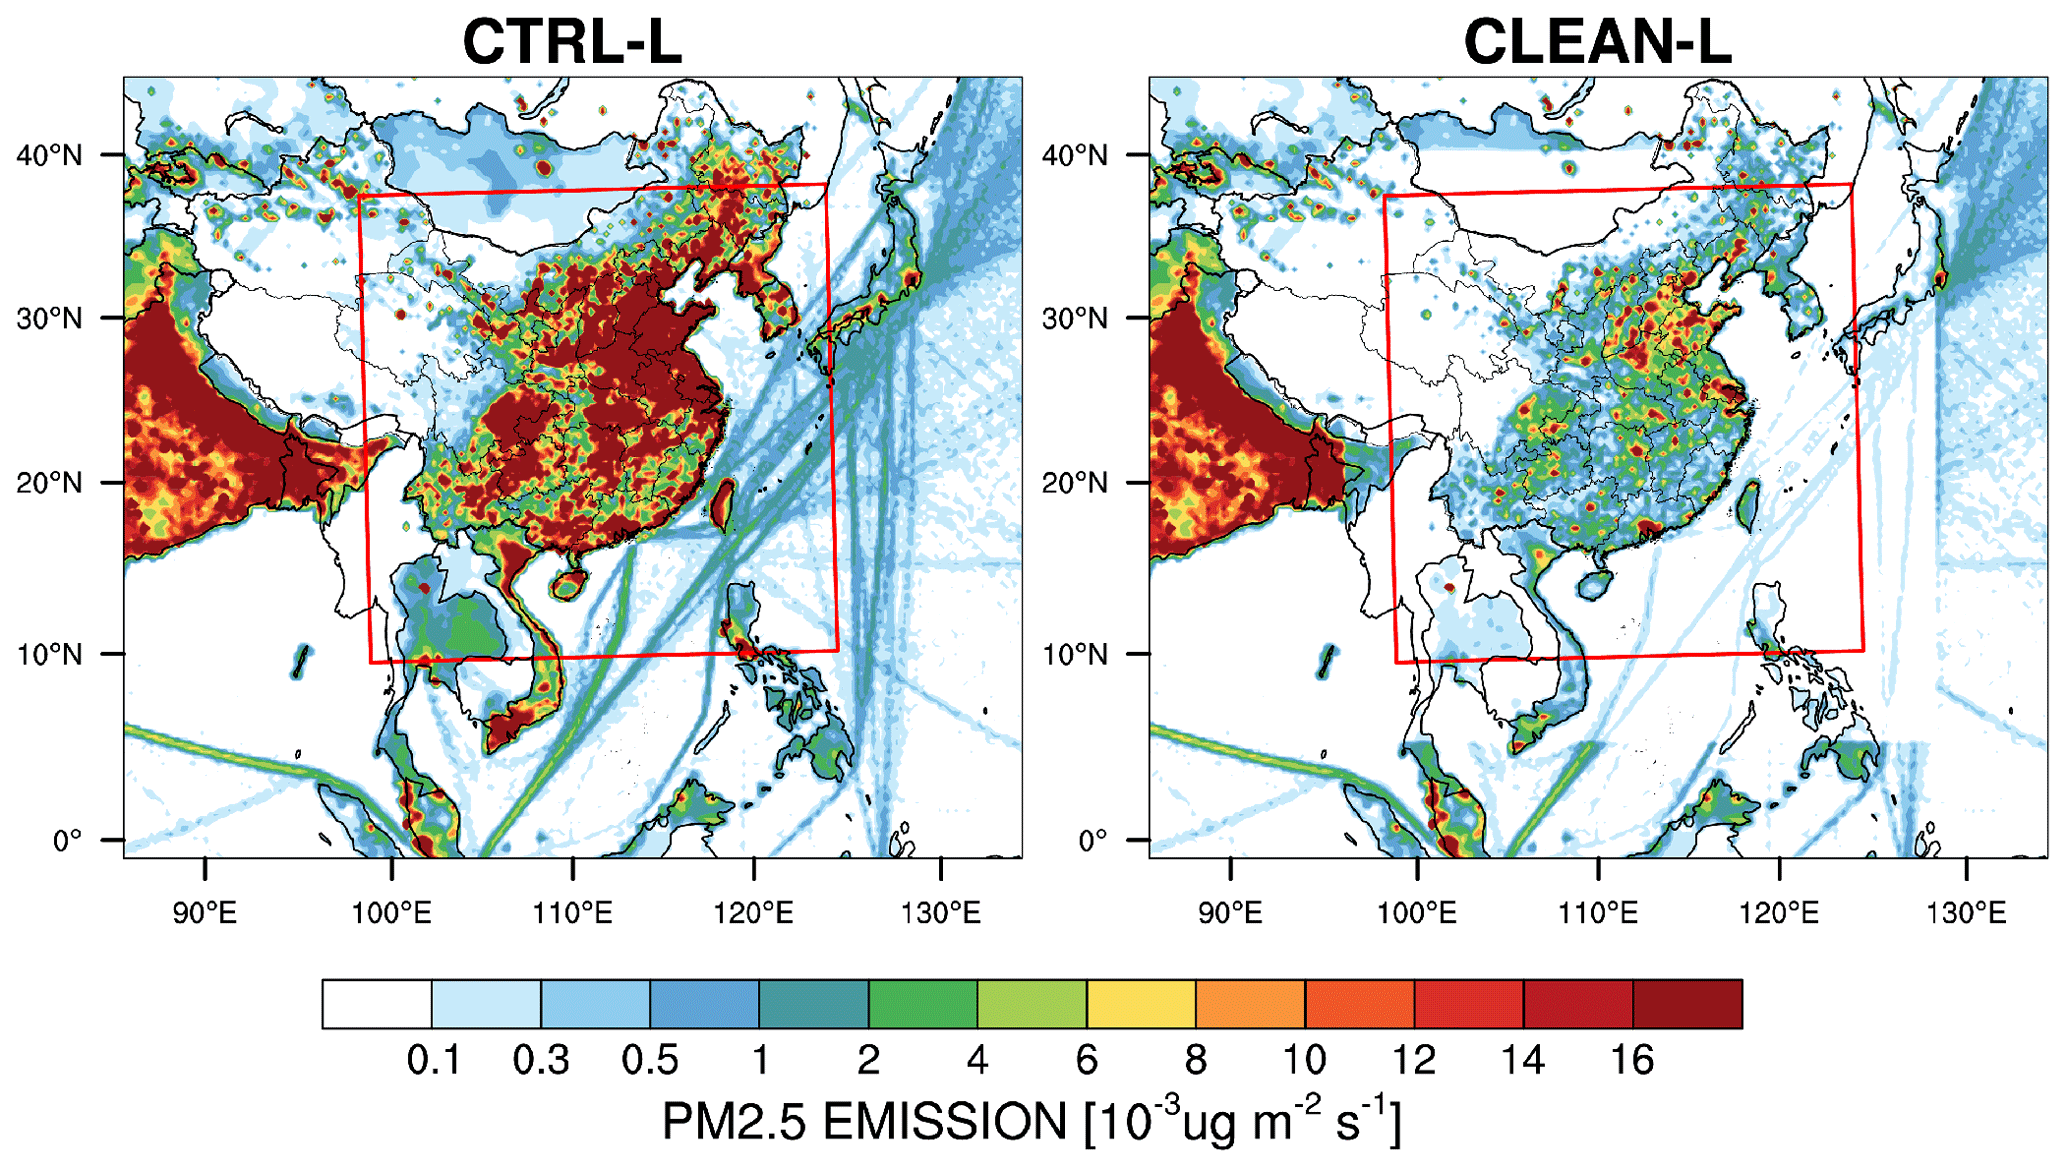
Figure 1Spatial distributions of anthropogenic emissions of primary PM2.5 averaged for June and July for the simulation domains. The red box in the large simulation domain represents the small domain.
All the WRF-Chem experiments select the Morrison two-moment microphysics (Morrison et al., 2009), Kain–Fritsch cumulus scheme (Kain, 2004), unified Noah land-surface model, Rapid Radiative Transfer Model (RRTMG) longwave and shortwave radiation schemes (Iacono et al., 2008), and MYNN planetary boundary layer (PBL) scheme (Nakanishi and Niino, 2006, 2009). Following Du et al. (2020), the PBL mixing coefficient is modified to simulate better PBL mixing of aerosols. Five ensemble simulations are performed for each experiment by changing the simulation initial time at 00:00 UTC from 12 to 16 May 2017 (i.e., the five ensemble simulations start at 00:00 UTC of 12, 13, 14, 15, and 16 May, respectively). The averaged results from five ensembles are analyzed to reduce the influence of modeling internal variability. The simulations run continuously through all of June and July 2017. The analysis focuses on the simulation results for 1 June to 31 July 2017. The meteorological initial and lateral boundary conditions are derived from National Centers for Environmental Prediction (NCEP) Final (FNL) Operational Global Analysis data (NCEP, 2000) with a horizontal resolution of 1∘ × 1∘ and a temporal resolution of 6 h. The chemical initial and boundary conditions are provided by a quasi-global WRF-Chem simulation for the same time period. The quasi-global WRF-Chem simulation is performed at 1∘ × 1∘ horizontal resolution with 360×130 grid cells (60∘ S–70∘ N, 180∘ W–180∘ E). More details about the general configuration of a quasi-global WRF-Chem simulation can be found in Zhao et al. (2013b) and Hu et al. (2016). The simulation configuration is summarized in Table 2.

2.3 Emissions
Biomass burning emissions are obtained from the Fire Inventory (FINN) of the National Center for Atmospheric Research with hourly temporal resolution and 1 km horizontal resolution (Wiedinmyer et al., 2011), and the injection heights follow Dentener et al. (2006) for the Aerosol Comparison between Observations and Models (AeroCom) project. The natural dust emission fluxes are calculated based on the adjusted GOCART dust emission scheme (Ginoux et al., 2001; Zhao et al., 2010), and the emitted dust particles are distributed into the MOSAIC aerosol size bins following a theoretical expression based on the physics of scale-invariant fragmentation of brittle materials derived by Kok (2011). More details about the dust emission scheme coupled with MOSAIC aerosol scheme in WRF-Chem can be found in Zhao et al. (2010, 2013b). Sea-salt emission follows Zhao et al. (2013a), which includes the correction of particles with radius less than 0.2 µm and the dependence of sea-salt emission on sea surface temperature. Anthropogenic emissions are obtained from the Multi-resolution Emission Inventory for China (MEIC) at 0.1∘ × 0.1∘ horizontal resolution and with monthly temporal resolution for 2015 (Li et al., 2017; Zheng et al., 2018), except that the emissions outside of China are from the Hemispheric Transport of Air Pollution version 2 (HTAPv2) at 0.1∘ × 0.1∘ horizontal resolution and with monthly temporal resolution for the year 2010 (Janssens-Maenhout et al., 2015) (Fig. 1). As discussed above, the anthropogenic emission in the CLEAN experiments has a factor of 0.1 of that in the CTRL experiment. In addition, in the CLEAN-L experiment, only the emissions in the small-domain area (denoted by the red box) are adjusted. In this way, the emission reduction from the simulations with both domains are made consistent.
2.4 Observations and reanalysis
Although the aims of this study do not include evaluating the simulation results to determine the optimal model configuration for the experiments, some observations and reanalysis datasets are still used to provide the references for the key fields. The comparison with these references can demonstrate whether the simulation results are acceptable for further analysis. The MISR (Multi-angle Imaging SpectroRadiometer, instrument on board the NASA Terra platform) retrieval dataset is used as a reference of spatial distribution of AOD (Diner et al., 1998; Martonchik et al., 2004). When showing the comparison between the MISR retrieved and the simulated AOD, the simulation results are sampled from 10:00–11:00 local time (LT) for averaging and at the locations of the retrievals because the Terra platform passes over the Equator at about 10:45 LT (Diner et al., 2001). The precipitation datasets of CMA (National Meteorological Information Center of China Meteorological Administration) and CMORPH (Climate Prediction Center MORPHing technique) are used as the references for spatial and temporal variations of precipitation during the simulation period. The CMORPH dataset is a global precipitation reanalysis dataset that is derived from geostationary satellite IR imagery (Joyce et al., 2004). The CMA rainfall was measured by tipping buckets, self-recording siphon rain gauges, or automatic rain gauges and was subject to strict quality control. The European Centre for Medium-Range Weather Forecasts (ECMWF) Reanalysis v5 (ERA5) is used as a reference for wind fields (Hersbach et al., 2020).
3.1 Sensitivity of simulated meteorological fields to domain size
Figure 2 shows the spatial distributions of precipitation and moisture transport at 700 hPa over the small domain averaged for June and July 2017 from the observation and reanalysis, and the simulations of CLEAN-S and CLEAN-L. The observation and reanalysis show that the southwesterly transports large amounts of moisture into eastern China. The convergence of large amounts of moisture results in heavy precipitation over southern China and its adjacent ocean. Due to the gradual weakening of northeastward moisture transport and the blocking effect of western mountains, precipitation becomes much weaker over northern and western China. Compared with the CMORPH observation and ERA5 reanalysis (Fig. 2), CLEAN-S can reasonably produce the spatial distributions of precipitation and moisture transport at 700 hPa, with slight underestimation of meridional moisture transport over eastern China. It is evident that the meridional moisture transport over southern China becomes weaker with the increasing domain size, and the eastward transport becomes stronger. In addition, the overall southwesterly moisture transport shifts to the east. This leads to a decrease in precipitation over eastern China and an increase over the East China Sea. Compared with the observations of hourly precipitation from the CMA stations over eastern China (Fig. S1 in the Supplement), both the CLEAN-S and CLEAN-L experiments can generally reproduce the daily variation of precipitation over eastern China, although the CLEAN-L simulated precipitation is lower, consistent with its weaker moisture transport over the region.

Figure 2Mean precipitation rate (mm/day) and 700 hPa moisture transport (g/m2 s) over the small domain for the two months of June and July 2017 from (a) CMORPH and ERA5 reanalysis, (b) CLEAN-S simulation, and (c) CLEAN-L simulation. The red box (20–42∘ N, 105–122∘ E) represents the focus area of analysis in follow. (a) Precipitation data come from CMORPH, and the 700 hPa moisture transport field data are obtained by processing ERA5 reanalysis.
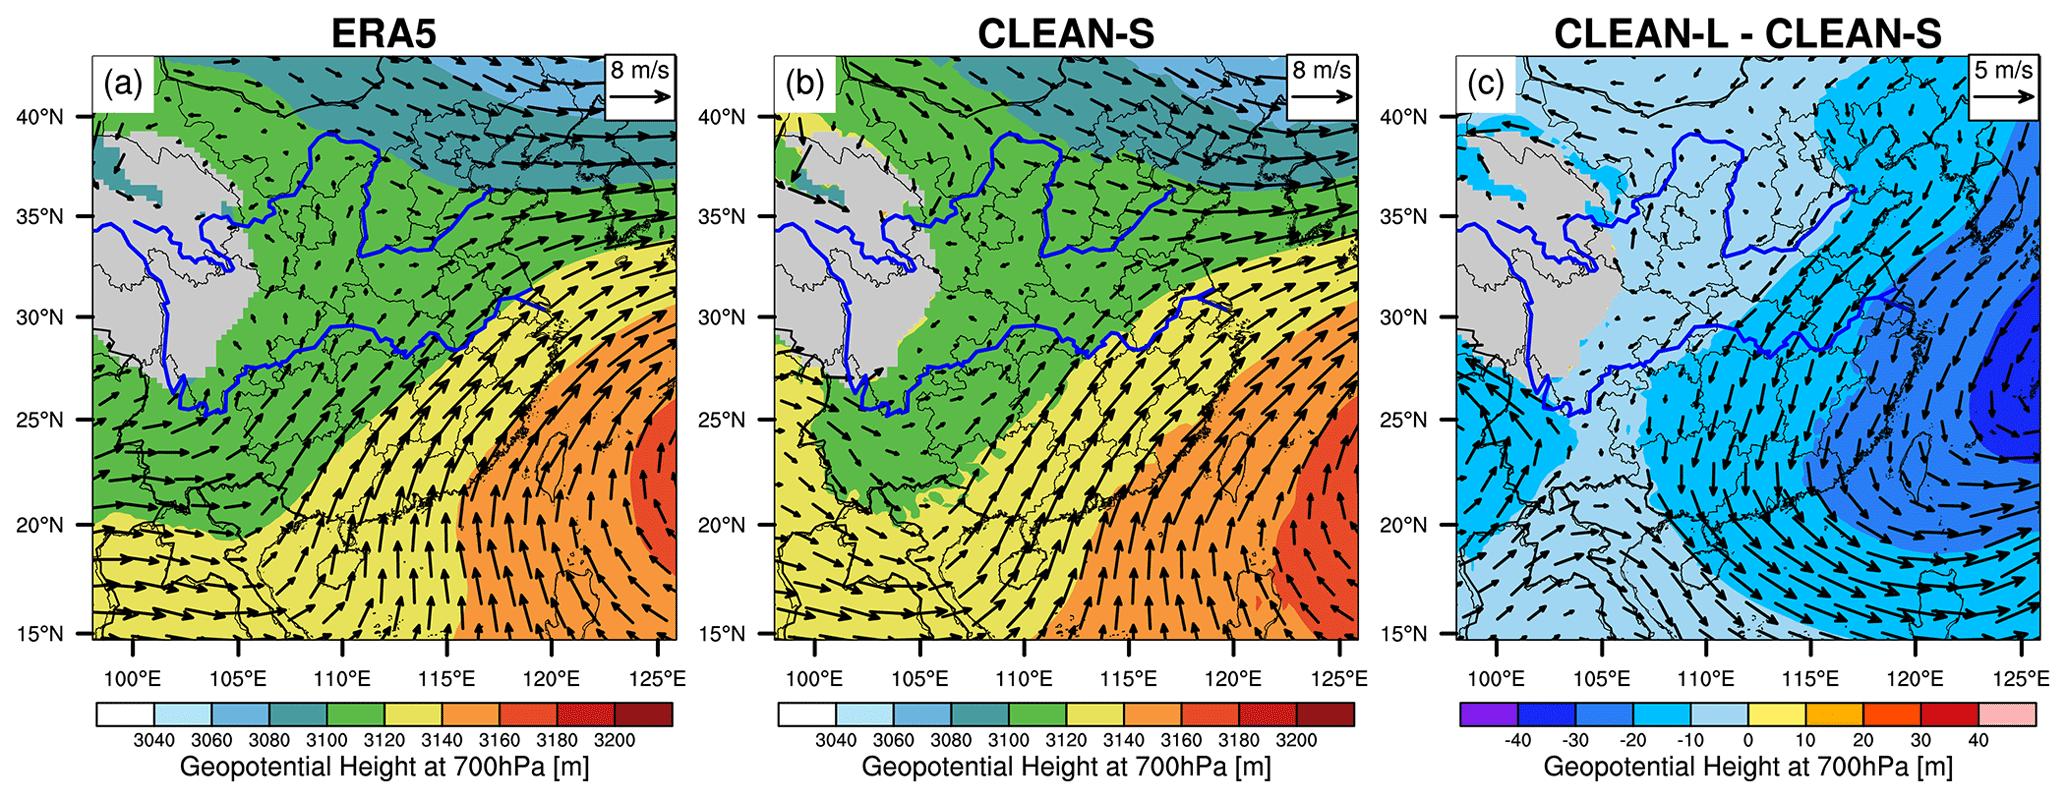
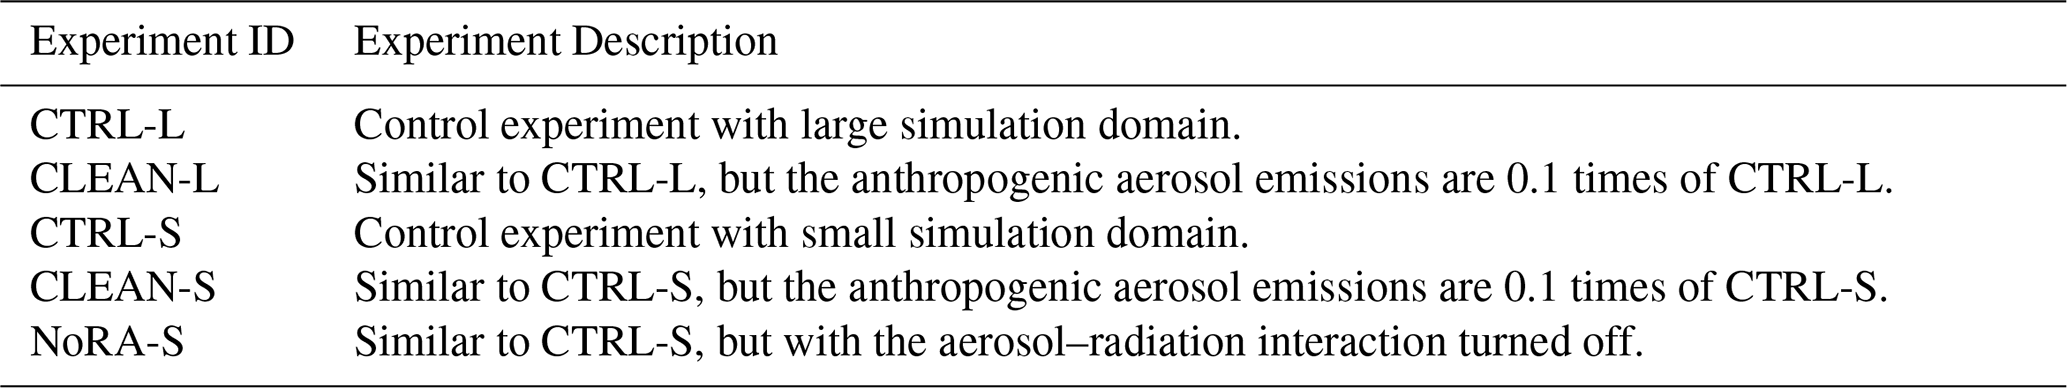
Figure 3Spatial distributions of mean geopotential height and wind fields at 700 hPa of June and July 2017 from (a) ERA5, (b) CLEAN-S, and (c) difference between CLEAN-L and CLEAN-S.
The difference in moisture transport between the simulations with different domain sizes results from their difference in geopotential height and wind circulation. Figure 3 shows the spatial distributions of geopotential height (GPH) and wind field at 700 hPa from the ERA5 reanalysis and the CLEAN-S simulation, and of the difference between CLEAN-L and CLEAN-S. The comparison with the ERA5 reanalysis shows that the CLEAN-S can simulate well the distributions of GPH and wind fields at 700 hPa. The spatial distribution of wind fields is generally consistent with that of moisture transport (Fig. 2) and is largely controlled by the West Pacific sub-tropical high (WPSH). Compared to CLEAN-S, CLEAN-L simulates lower GPH at 700 hPa and produces an anomalous lower pressure center on the East China Sea, which indicates the weaker WPSH with increasing domain size. This causes the southwestward wind anomalies over China, which weakens the monsoon-driven northeastward moisture transport. Over the South China Sea, the westerly anomalies enhance the eastward transport of moisture.
The impact of domain size is not only on the horizontal distribution of wind fields but also on the vertical circulation. Figure 4 shows the cross section of meridional temperature anomalies and wind averaged for 105 and 122∘ E from the ERA5 reanalysis and the CLEAN-S simulation during June to July, and of the difference of temperature (not meridional temperature anomalies) and wind between CLEAN-L and CLEAN-S. The meridional temperature anomalies are calculated by subtracting the mean temperature in this latitude range (as shown in Fig. 4) at each pressure level. First of all, CLEAN-S can generally reproduce the temperature gradient and wind circulation from the ERA5 reanalysis. A relatively large meridional temperature gradient exists between 700 and 200 hPa, where the temperature is higher over the south. Below 700 hPa, the temperature gradient is relatively weaker and the temperature is higher over the north. Along with this distribution of temperature gradient, meridional wind blows from the south and the north and converges at the latitude around 34∘ N, which generates strong upward motion in the area of 20–35∘ N. This is consistent with the spatial distributions of precipitation and moisture transport (Fig. 2). Compared with the CLEAN-S experiment, the CLEAN-L experiment produces larger meridional temperature gradient between 700 and 200 hPa and weaker gradient below 850 hPa. The circulation from CLEAN-L is generally consistent with CLEAN-S, but the southerly wind from CLEAN-L is weaker and the northerly wind is stronger. This results in an overall northerly wind anomaly from CLEAN-L compared with CLEAN-S, along with a southward shift of wind convergence from 34 to 32∘ N. It is also noteworthy that the upward motion is weakened around 22–38∘ N and strengthened to the south of 20∘ N due to the increased domain size.
Figure 4(a, b) The cross section of meridional temperature anomalies and wind averaged for 105 and 122∘ E from the ERA5 reanalysis and the CLEAN-S simulation during June to July, and (c) the difference of temperature (not meridional temperature anomalies) between CLEAN-L and CLEAN-S. The meridional temperature anomalies are calculated by subtracting the mean temperature in this latitude range at each pressure level.
3.2 Sensitivity of simulated aerosol characteristics to domain size
Figure 5 shows the spatial distributions of AOD averaged for June and July of 2017 from the CTRL-S simulation, and of the difference between CTRL-L and CTRL-S. Relatively high AOD (> 0.6) exists in the Sichuan Basin and the northern China plain. AOD over east-central China and southern China is relatively lower (0.2–0.5), which is in line with previous studies (e.g., Luo et al., 2014; Qi et al., 2013). In general, CTRL-S captures the spatial distribution of retrieved AOD from MISR (Fig. S2 in the Supplement). Compared with the CTRL-S experiment, CTRL-L simulates a similar spatial pattern of AOD but produces higher AOD in southern China and lower AOD in most areas of northern China. To explore the reasons of difference between the two simulations, Fig. 6 shows the spatial distributions of column-integrated PM2.5 mass and water content in aerosols averaged in June and July 2017 and of the difference between CTRL-L and CTRL-S. The CTRL-S simulation shows high PM2.5 mass loading over the northern China plain, which is consistent with the spatial distribution of AOD (Fig. 5). The PM2.5 mass loading also shows high values over northwestern China, which is not shown in the spatial distribution of AOD. This is mainly due to the high mass loading of dust over northwestern China (Fig. S3 in the Supplement), and the water content associated with dust is relatively small.
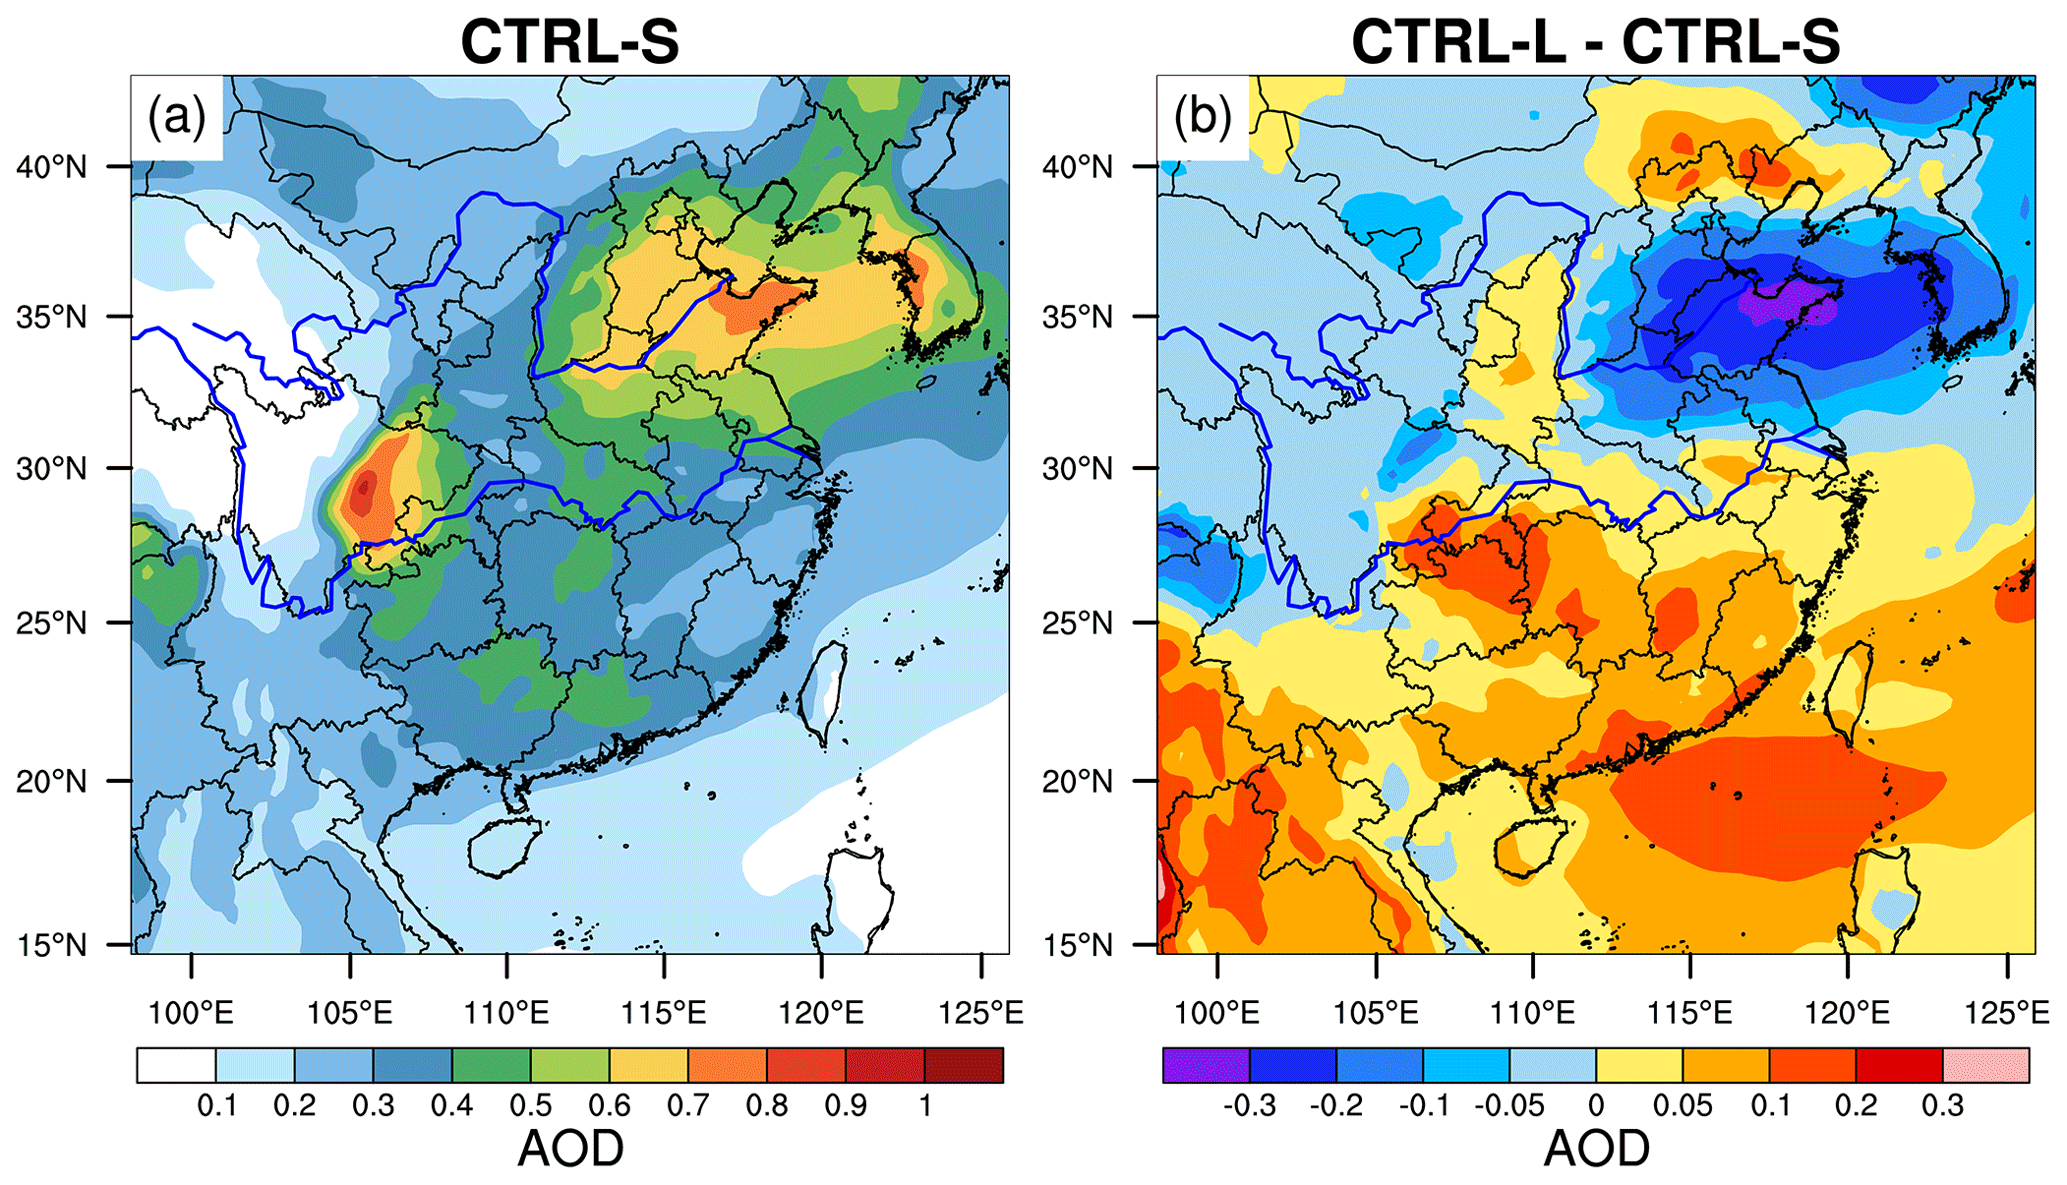
Figure 5The spatial distributions of AOD for June and July 2017 from the CTRL-S simulation, and the difference between CTRL-L and CTRL-S.
CTRL-L simulates higher PM2.5 mass loading over southeastern China and lower values over northern China, which is consistent with AOD. The difference of water content in aerosols shows a similar pattern. The analysis shows that the difference of PM2.5 mass loading over northern China is mainly due to the difference of dust, while the difference over southeastern China is due to anthropogenic aerosols (Fig. S3). The reduction of dust mass loading over northern China from CTRL-L is primarily due to its weakening of westerlies over northwestern China compared to CTRL-S (Fig. 3), which results in less transport of dust into the downwind region. The increase in aerosol mass loading over southeastern China in CTRL-L is partly due to its less wet scavenging associated with weak precipitation (Fig. 2). The weakening of northward transport of aerosols (Fig. 3) also contributes to the increase in PM2.5 mass loading over southern China in CTRL-L. Besides the change of dry aerosol mass loading, the change of water content in aerosols between the two experiments also contributes to the change in AOD, which results from the difference of both dry aerosol mass and moisture.
Figure 7 shows the latitude–height cross section of total PM2.5 averaged between 105 and 122∘ E for June and July 2017 from the CTRL-S experiment, and of the difference between CTRL-L and CTRL-S. The latitudinal distribution of aerosols is consistent with its spatial pattern, with high aerosol mass concentration over northern China. The mass concentration gradually decreases from the surface to the free atmosphere. The mass concentration around 500 hPa over northern China can reach 5 µg/m3 that is comparable to the surface concentration over southern China. In general, CTRL-L simulates higher aerosol mass concentration over southern China and lower aerosol mass concentration over northern China from the surface to about 500 hPa. At 32–36∘ N, CTRL-L simulates lower aerosol mass concentration near the surface and higher values between 700 and 850 hPa, likely due to the difference in aerosol wet scavenging and transport between the two experiments. The difference in horizontal and vertical distributions of aerosols and also the circulation patterns between the two experiments may lead to the difference in simulating aerosol impact on EASM.

Figure 6The spatial distributions of column integrated total (a) PM2.5 concentration and (c) water content in aerosols averaged for June and July 2017 from the CTRL-S simulation, and (b, d) the difference between CTRL-L and CTRL-S.
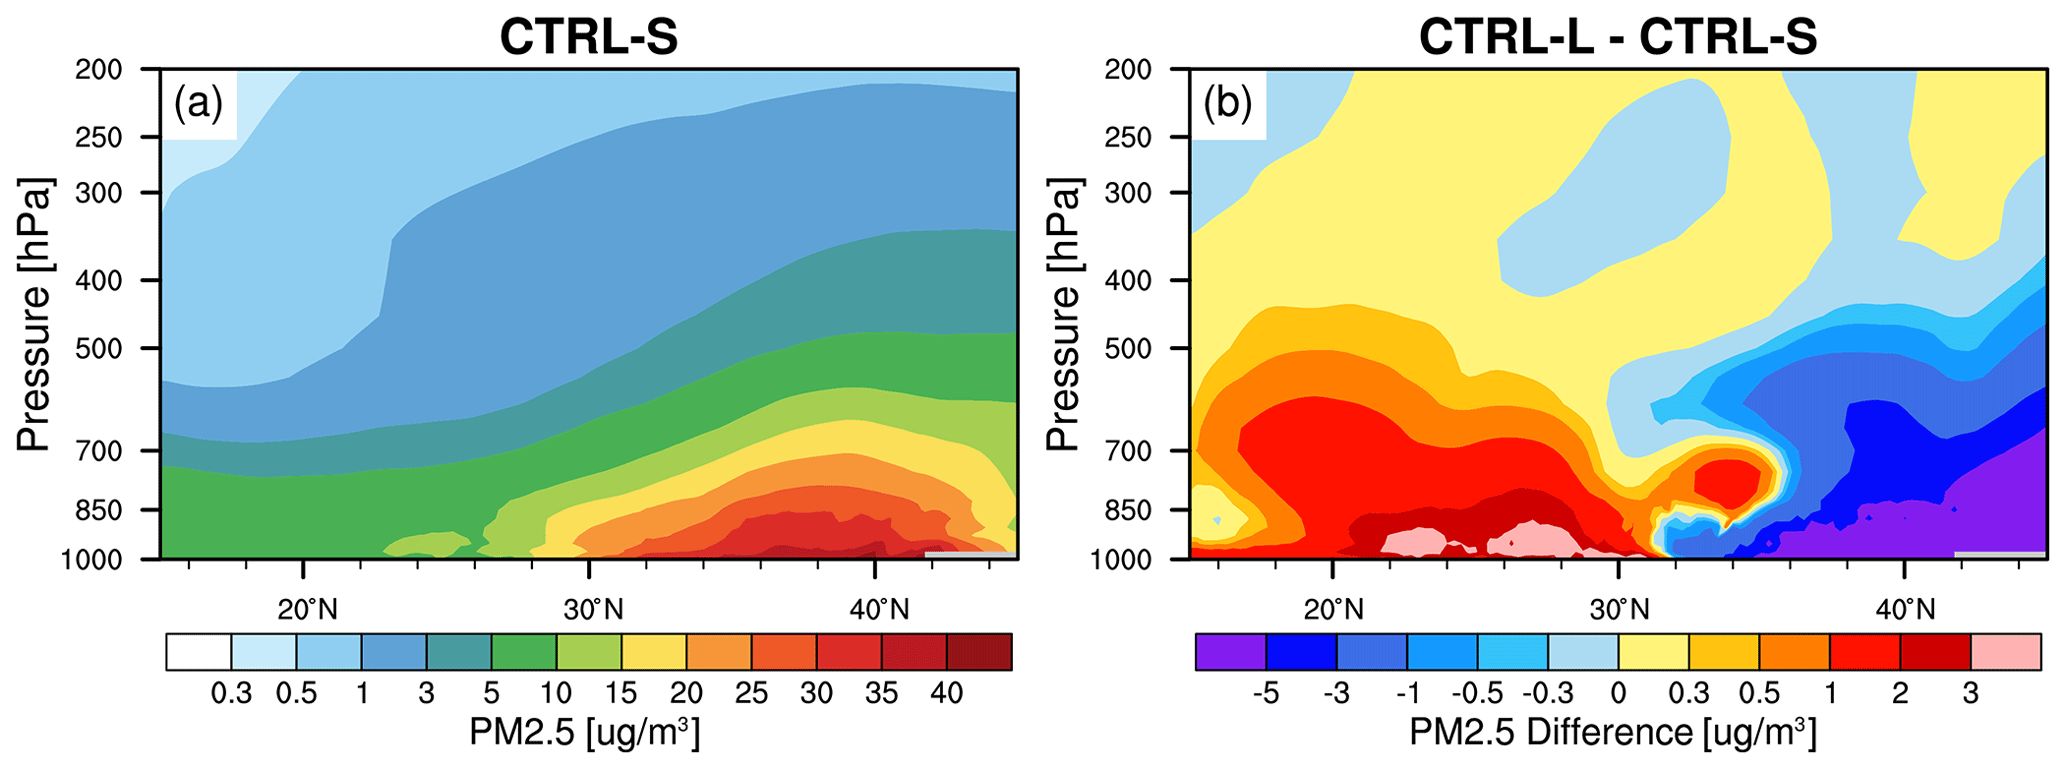
Figure 7The latitude–height cross section of (a) total PM2.5 averaged between 105 and 122∘ E for June and July 2017 from the CTRL-S experiment, and (b) the difference between CTRL-L and CTRL-S.
3.3 Sensitivity of aerosol impact to domain size
Before studying the sensitivity of aerosol impact to domain size, the impact of aerosols on precipitation and circulation from the small-domain experiments is first investigated. Figure 8 shows the spatial distributions of aerosol-induced difference (CTRL-CLEAN) of precipitation and moisture transport at 700 hPa averaged for June and July 2017 from the small-domain simulations. The dominant effect is that aerosols weaken the southwesterlies and reduces the moisture transport over central and southern China (primarily between 105–115∘ E). Along the coast of southeastern China, the moisture transport is enhanced slightly. Over China, aerosols induce an alternate increase-and-decrease pattern (denoted as “”) of precipitation changes; i.e., precipitation increases in the south of 25∘ N, north of 40∘ N, and around 30∘ N, and decreases at 25–30 and 32–40∘ N. This weakening of monsoonal circulation at the lower troposphere is found mainly due to the cooling of the lower troposphere and thus the increase in surface pressure by aerosols (Fig. 9). The temperature averaged for the lower troposphere (below 500 hPa) is reduced by aerosols over China, which results in a positive pressure anomaly center in southwestern China. This leads to an anticyclone anomaly as shown in Fig. 8, which weakens the monsoonal southwesterlies between 105–115∘ E.
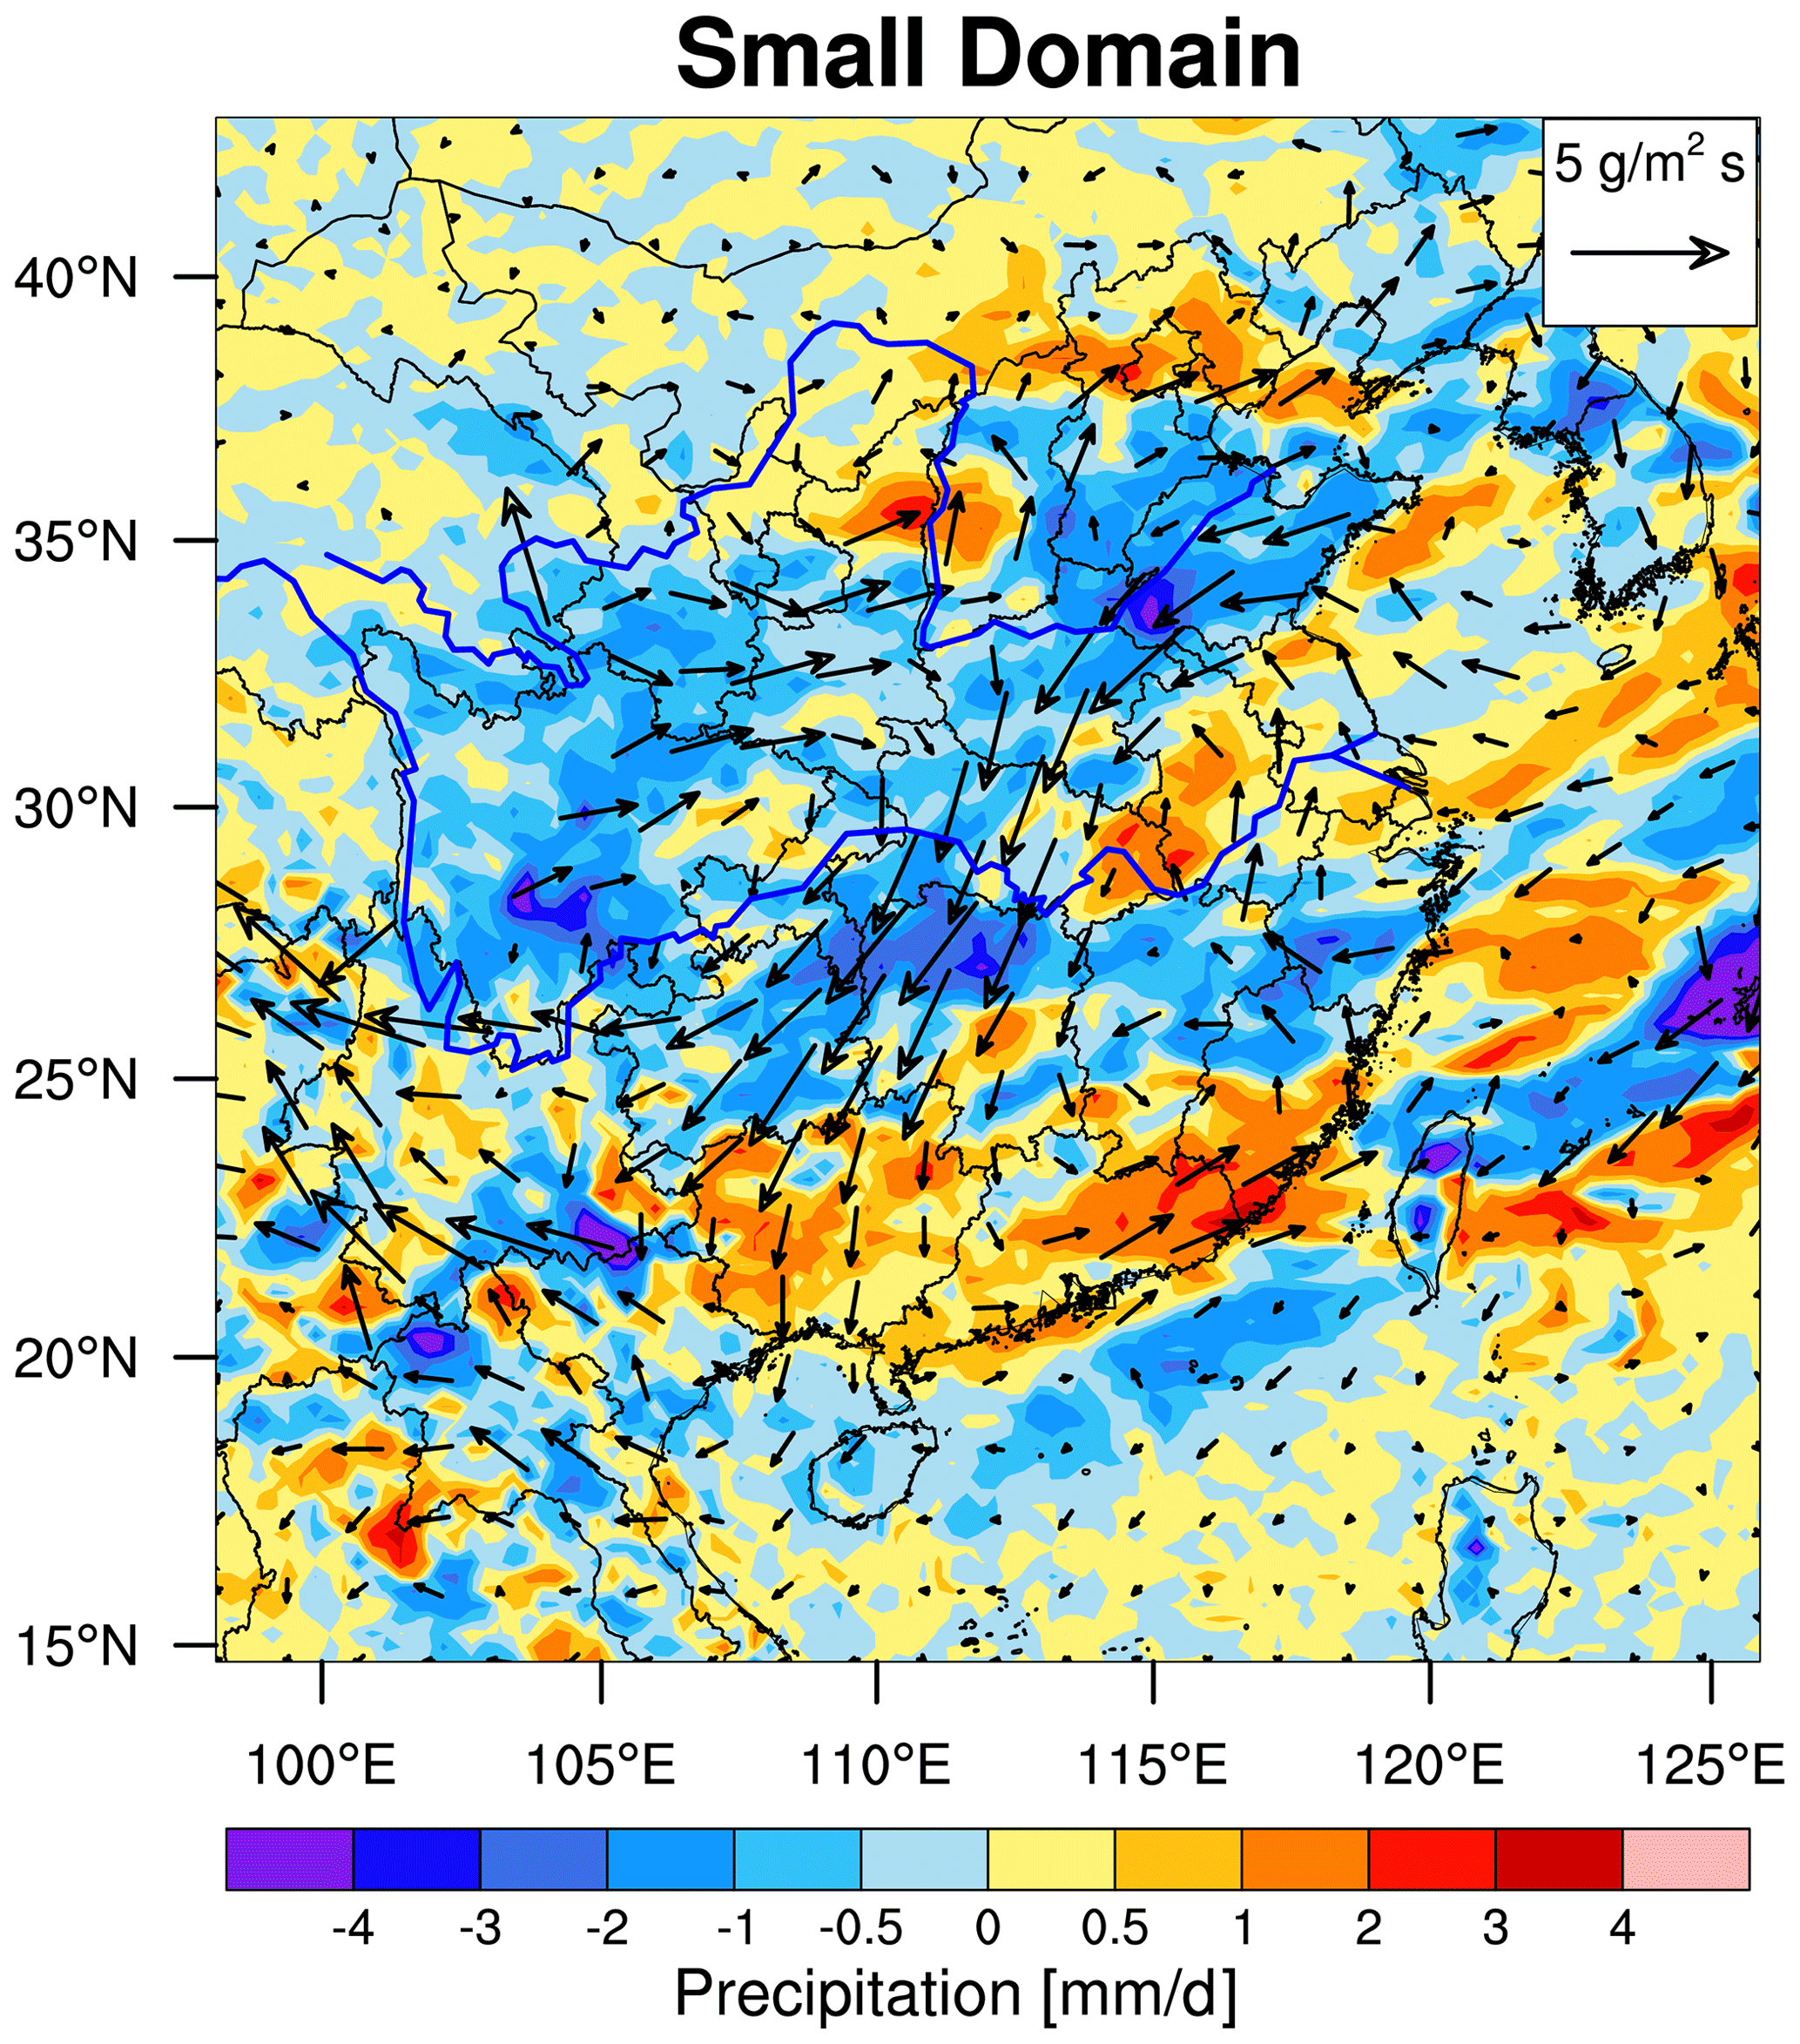
Figure 8The spatial distributions of aerosol-induced difference (CTRL-CLEAN) of precipitation and moisture transport at 700 hPa averaged for June and July 2017 from the small-domain simulations.
In order to further understand the mechanisms of aerosol impact and isolate aerosol–radiation and aerosol–cloud interactions, another set of numerical experiments (NoRA-S) with the small domain is conducted, similar to CTRL-S but with the aerosol–radiation interaction turned off. The difference of results between NoRA-S and CLEAN-S (NoRA-S minus CLEAN-S) is interpreted as the impact of aerosol–cloud interaction, while the difference of results between CTRL-S and NoRA-S (CTRL-S minus NoRA-S) is interpreted as the impact of aerosol–radiation interaction. Figure 10 shows the spatial distributions of the impact of aerosol–cloud and aerosol–radiation interactions on (a, d) tropospheric temperature averaged below 500 hPa, (b, e) surface pressure, and (c, f) precipitation and moisture transport. The aerosol–cloud interaction significantly reduces the lower-tropospheric temperature (Fig. 10a) over a large area of southern China (to the south of 32∘ N) mainly due to its increase in cloud amounts (Fig. S4a in the Supplement) over this area, which results in an increase in surface pressure in this area (Fig. 10b). Similarly, aerosol–cloud interaction also increases cloud amounts over northeastern China and its adjacent ocean (Fig. S4a) and thus reduces the lower-tropospheric temperature and increases the surface pressure over the area. The surface pressure over the Yellow River Basin is reduced slightly by aerosol–cloud interaction, which may be due to the reduction of cloud amounts (Fig. S4a) and the increase in lower-tropospheric temperature. Although the experiments can generally demonstrate that aerosol–cloud interaction can largely affect cloud amount, lower-tropospheric temperature, and surface pressure, please note that the co-locations of the changes of cloud, temperature, and surface pressure may not be simply straightforward. For example, in a fully coupled system, the cloud change due to aerosols would also adjust the temperature through the release of latent heat in the atmosphere. In addition, the change of temperature would also modulate the circulation and further feedback to the distributions of cloud and temperature. The difference between NoRA-S and CLEAN-S over northwestern China is due to the dust–radiation interaction that is included in CLEAN-S but not in NoRA-S. The analysis of this study focuses on the impact of anthropogenic aerosols. The combined effect of two anti-cyclone anomalies due to the two positive pressure anomalies at the lower-troposphere results in the southward wind anomalies over the ocean and the northward wind anomalies over northern China, while the changes of circulations in other areas of China are negligible.
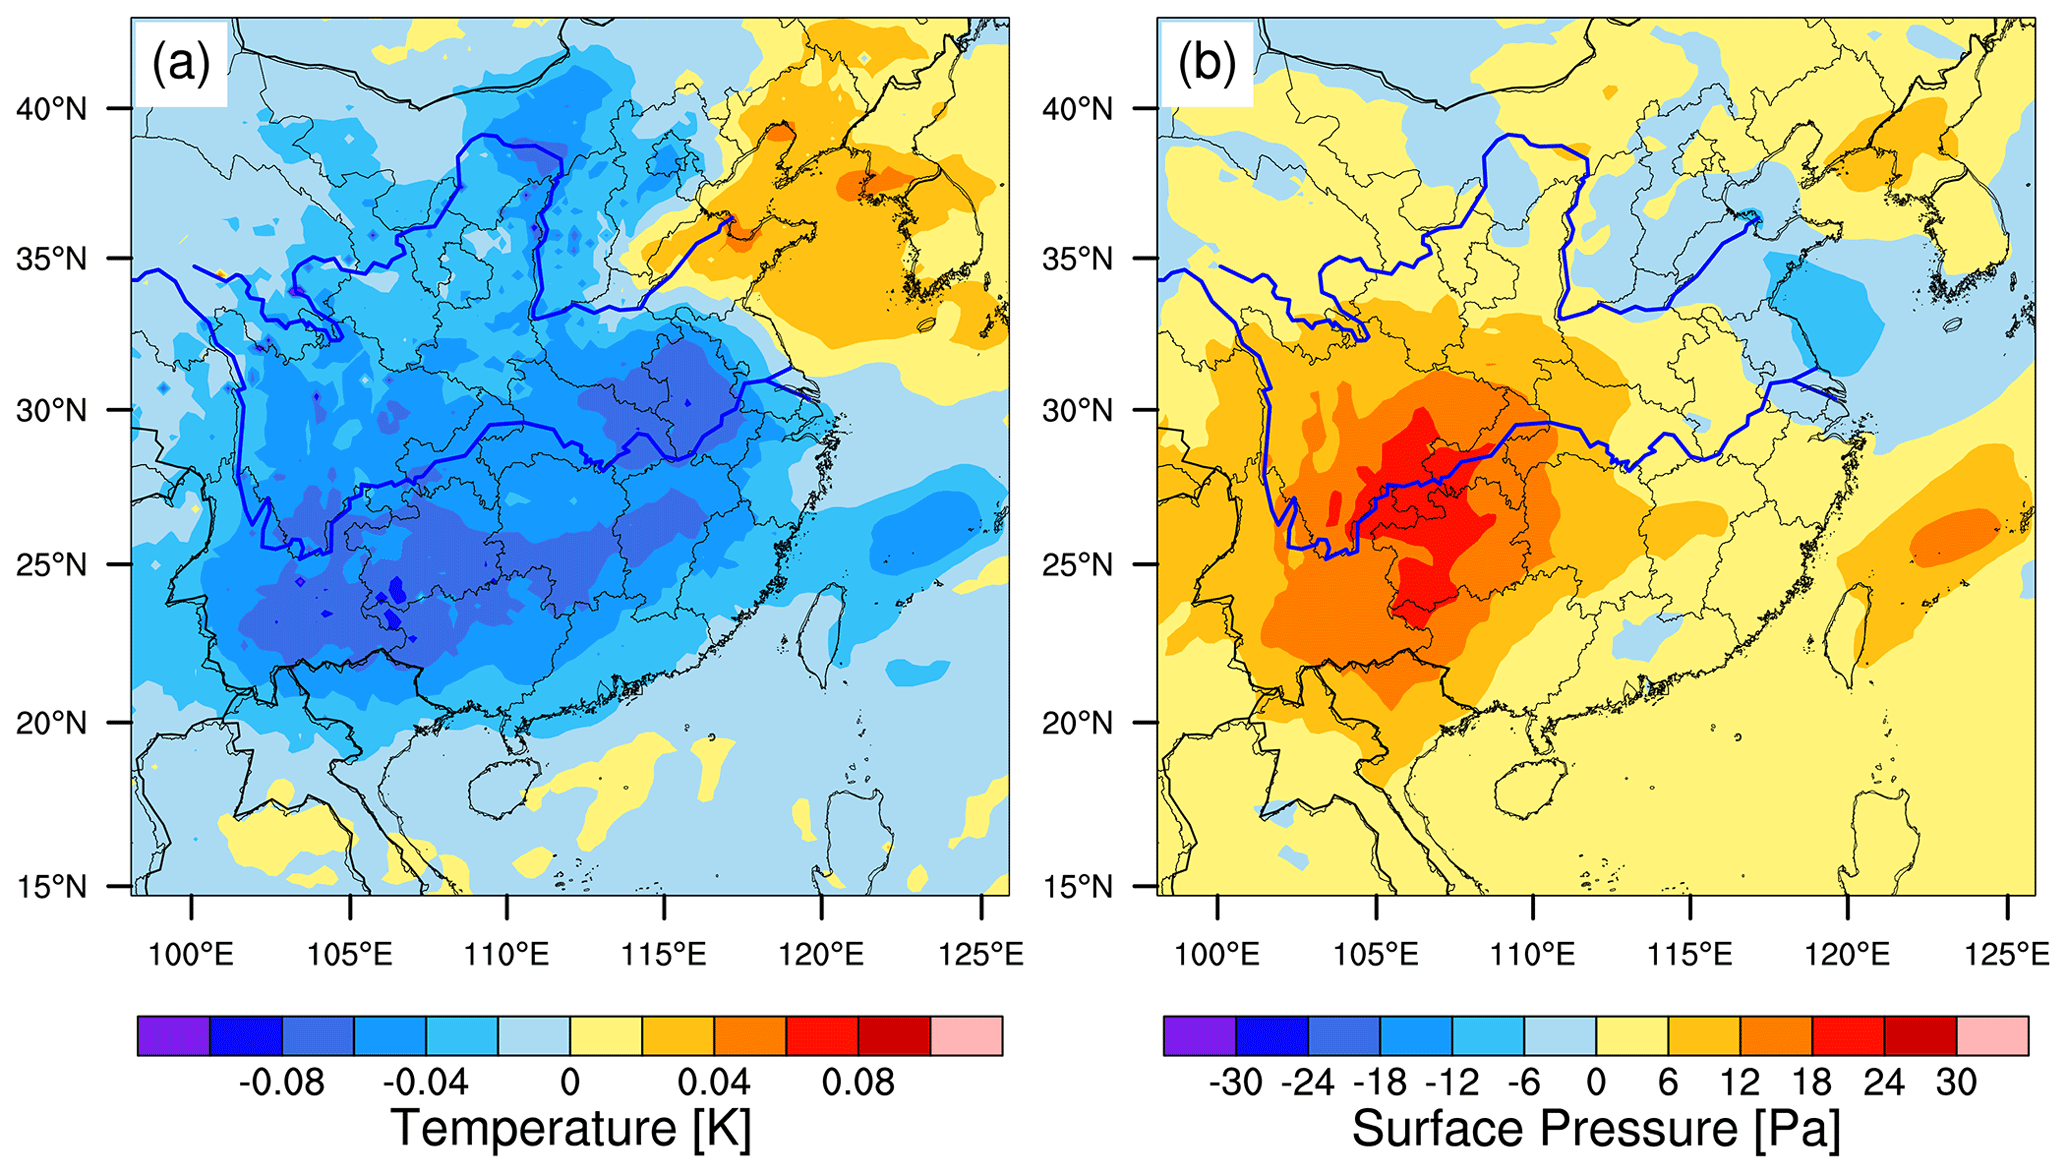
Figure 9The spatial distributions of aerosol-induced difference (CTRL-CLEAN) of (a) atmosphere temperature below 500 hPa and (b) surface pressure averaged for June and July 2017 from the small-domain simulations. Atmospheric temperature is weight-averaged by the layer thickness below 500 hPa.

Figure 10The spatial distributions of aerosol–cloud interactions induced difference of (a) atmosphere temperature below 500 hPa, (b) surface pressure and (c) precipitation and moisture transport at 700 hPa averaged for June and July 2017 from the small-domain simulations. And the spatial distributions of aerosol–radiation interactions induced difference of (d) atmosphere temperature below 500 hPa, (e) surface pressure, and (f) precipitation and moisture transport at 700 hPa averaged for June and July of 2017 from the small-domain simulations.
The primary impact of aerosol–radiation interaction on lower-atmospheric temperature is the positive temperature anomaly over the Yellow Ocean and over central China and the negative temperature anomaly over the Yellow River Basin and southwestern China, which is the combined effect from the aerosol cooling and heating at the surface and in the atmosphere, respectively, and the adjustment of cloud distributions (Figs. S4b and S5). The two positive temperature anomaly centers lead to two negative pressure anomaly centers and thus a large cyclone circulation anomaly over the region of eastern China. Therefore, it can be noted that the influence of aerosol–cloud and aerosol–radiation interactions on monsoonal circulations is counteracted over the ocean and over northern China, which results in relatively small changes of monsoonal circulation over the ocean and over northern China (Fig. 8). The overall aerosol impact is shown as the weakening of the monsoonal circulation over central and southern China (Fig. 8), which is mainly contributed by the aerosol–radiation interaction.
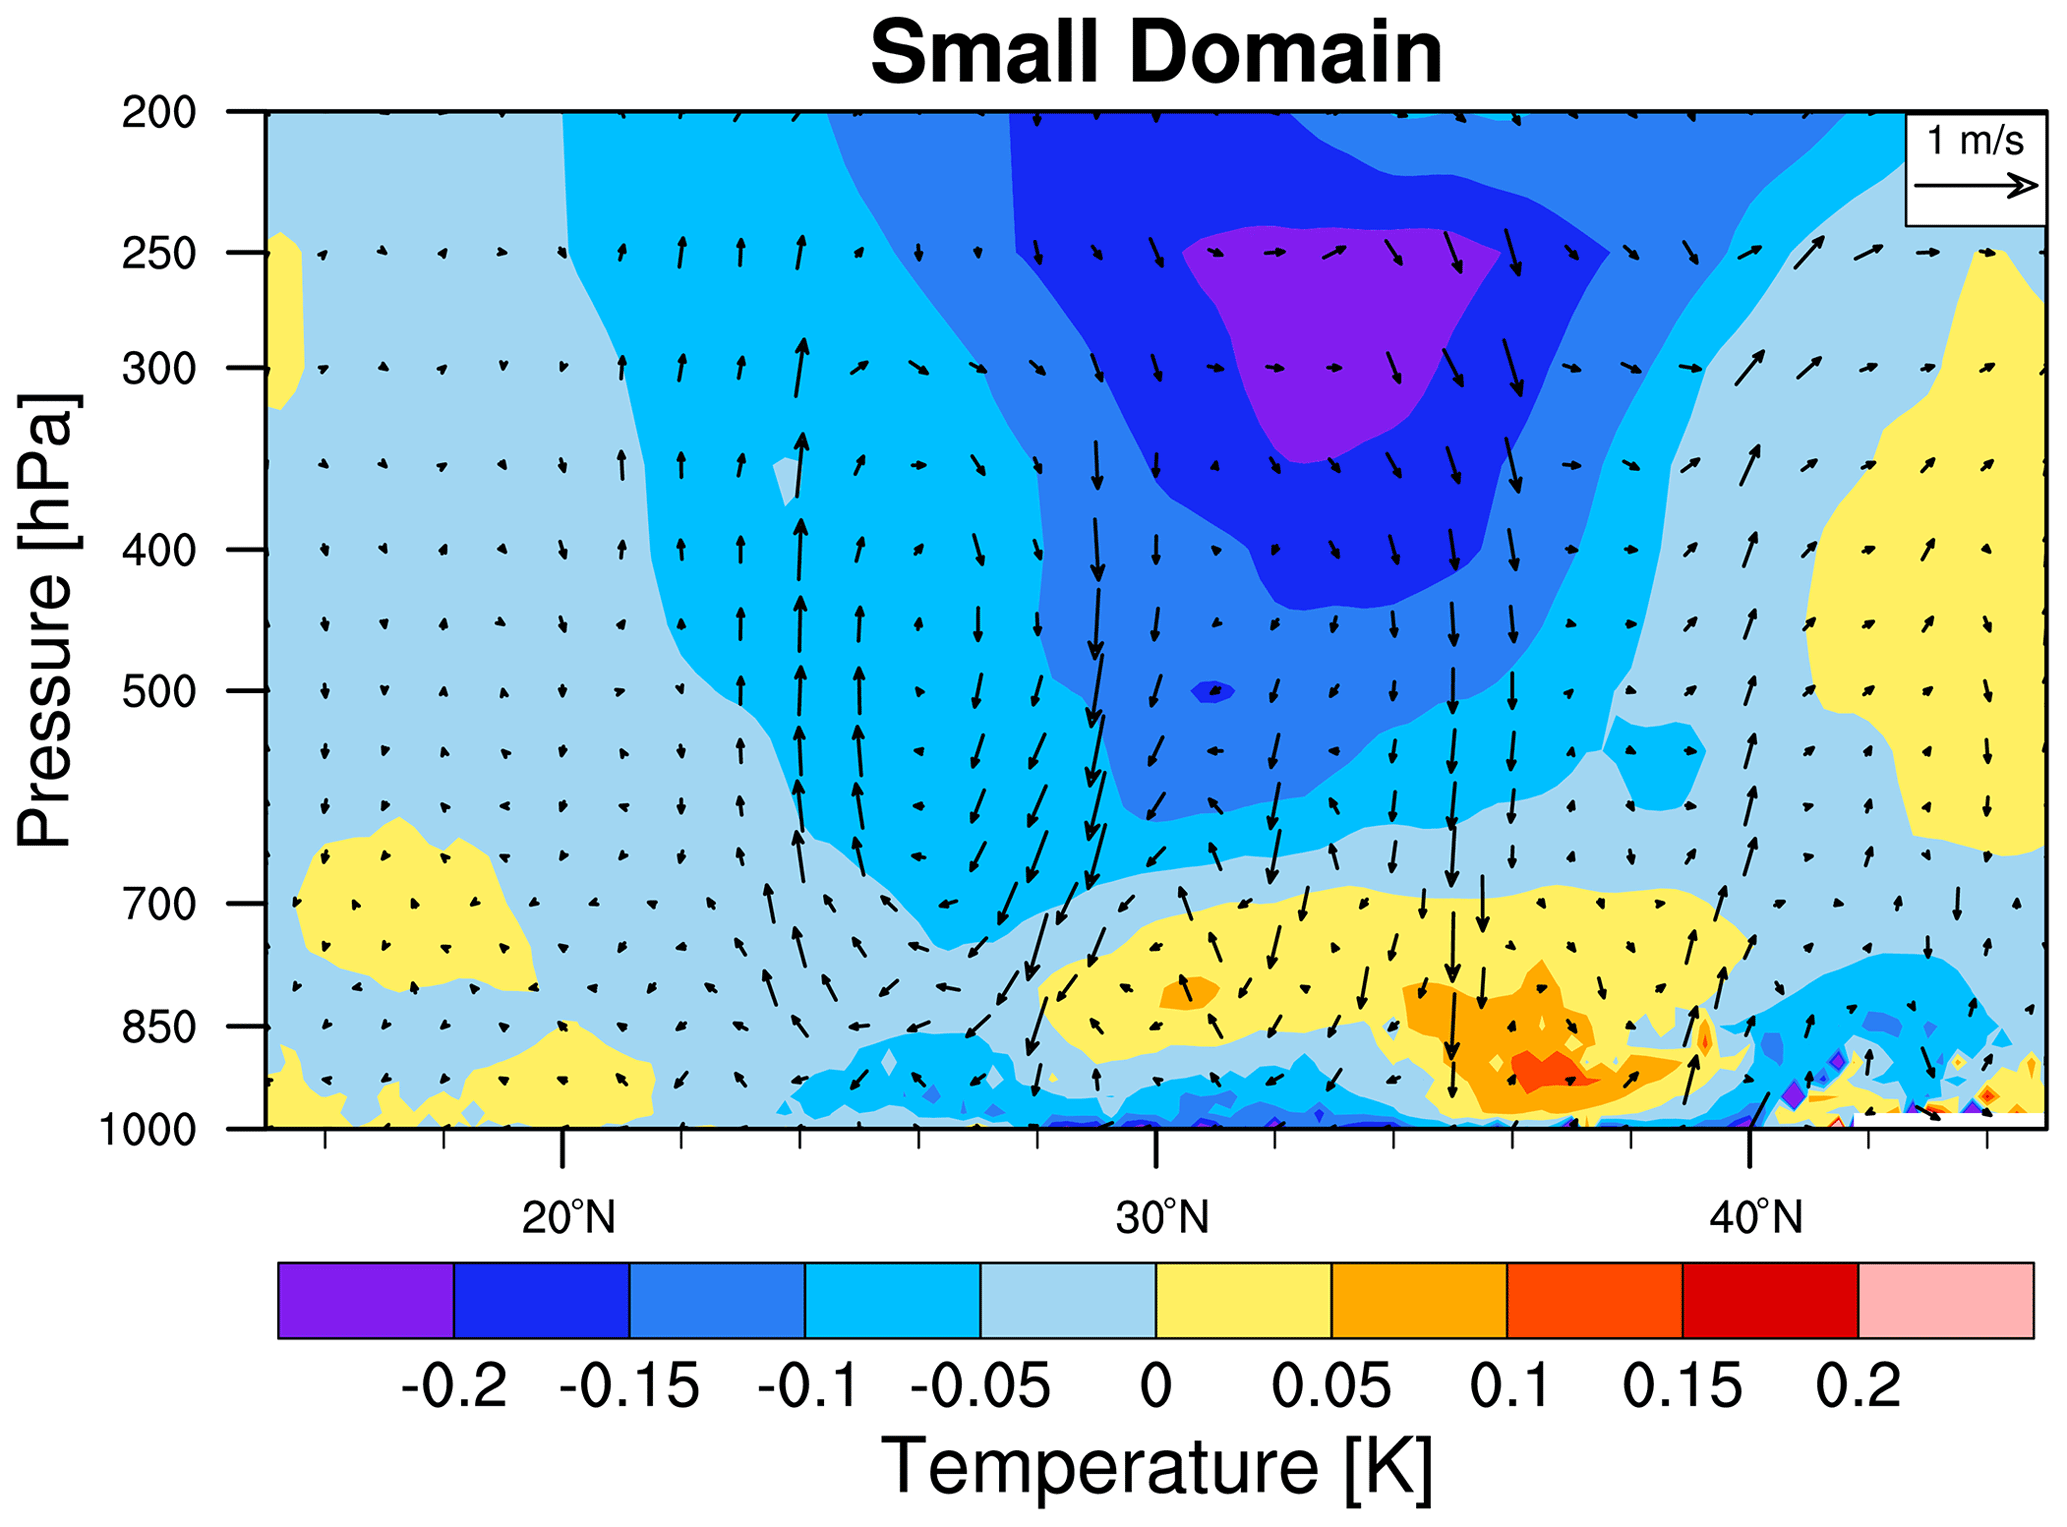
Figure 11The latitude-pressure cross section of aerosol-induced difference (CTRL-CLEAN) of temperature and wind averaged between 105 and 122∘ E for June and July 2017 from the small-domain simulation.
Figure 11 shows the latitude–pressure cross section of aerosol-induced difference (CTRL-CLEAN) of temperature and wind averaged between 105 and 122∘ E for June and July 2017 from the small-domain simulation. The pattern of precipitation change corresponds well to the change of wind circulation. The weakening of monsoonal southwesterlies results in a sinking airflow anomaly around 28∘ N and the compensating upward anomaly around 24∘ N in the south of China, and also a downdraft around 35∘ N and an updraft around 40∘ N in northern China. These two sinking airflows correspond to the reduced precipitation between 25 and 30∘ N and between 32 and 40∘ N, respectively (Fig. 8), while these updrafts correspond to the increasing precipitation between 22 and 25∘ N and between 32 and 40∘ N. There is also weak upward compensating airflow around 30∘ N, leading to the slight increase in precipitation in the area (Fig. 8). It is noteworthy that aerosols lead to an abnormal cooling center around 33∘ N between 400 and 200 hPa. This is mainly because of less solar radiation entering the atmosphere due to aerosol–radiation and aerosol–cloud interactions, and also weaker monsoonal airflow that leads to less release of latent heat from cloud and precipitation (Fig. S6 in the Supplement). This cooling anomaly center also strengthens the downdraft anomalies on both its sides, further weakening the monsoonal circulation.
In order to explore the sensitivity of aerosol impact to domain size, similar to Fig. 8, Fig. 12 shows the results from the large-domain simulations. One consistent signal between the simulations with different domain sizes is that aerosols weaken the southwesterlies and reduce the moisture transport over central and southern China. The difference is that this weakening is not only over the inland areas of China but also extends to over the South China Sea. The weakening of monsoon airflow is broader with the increasing domain size, which may be due to its weaker monsoon airflow (Fig. 3) and less constraint from the lateral boundary conditions in the large-domain simulation. Another consistent signal between the two sets of simulations with different domain sizes is that aerosols induce a similar “” pattern of precipitation changes over the domain, except that the areas with precipitation reduction become broader. This leads to the precipitation reduction over almost the entire region between 20–40∘ N over China except the area around 30∘ N with increasing precipitation. The increases in precipitation on the two sides of the precipitation reduction area shift southward to the South China Sea and northward to the north of 40∘ N, respectively.
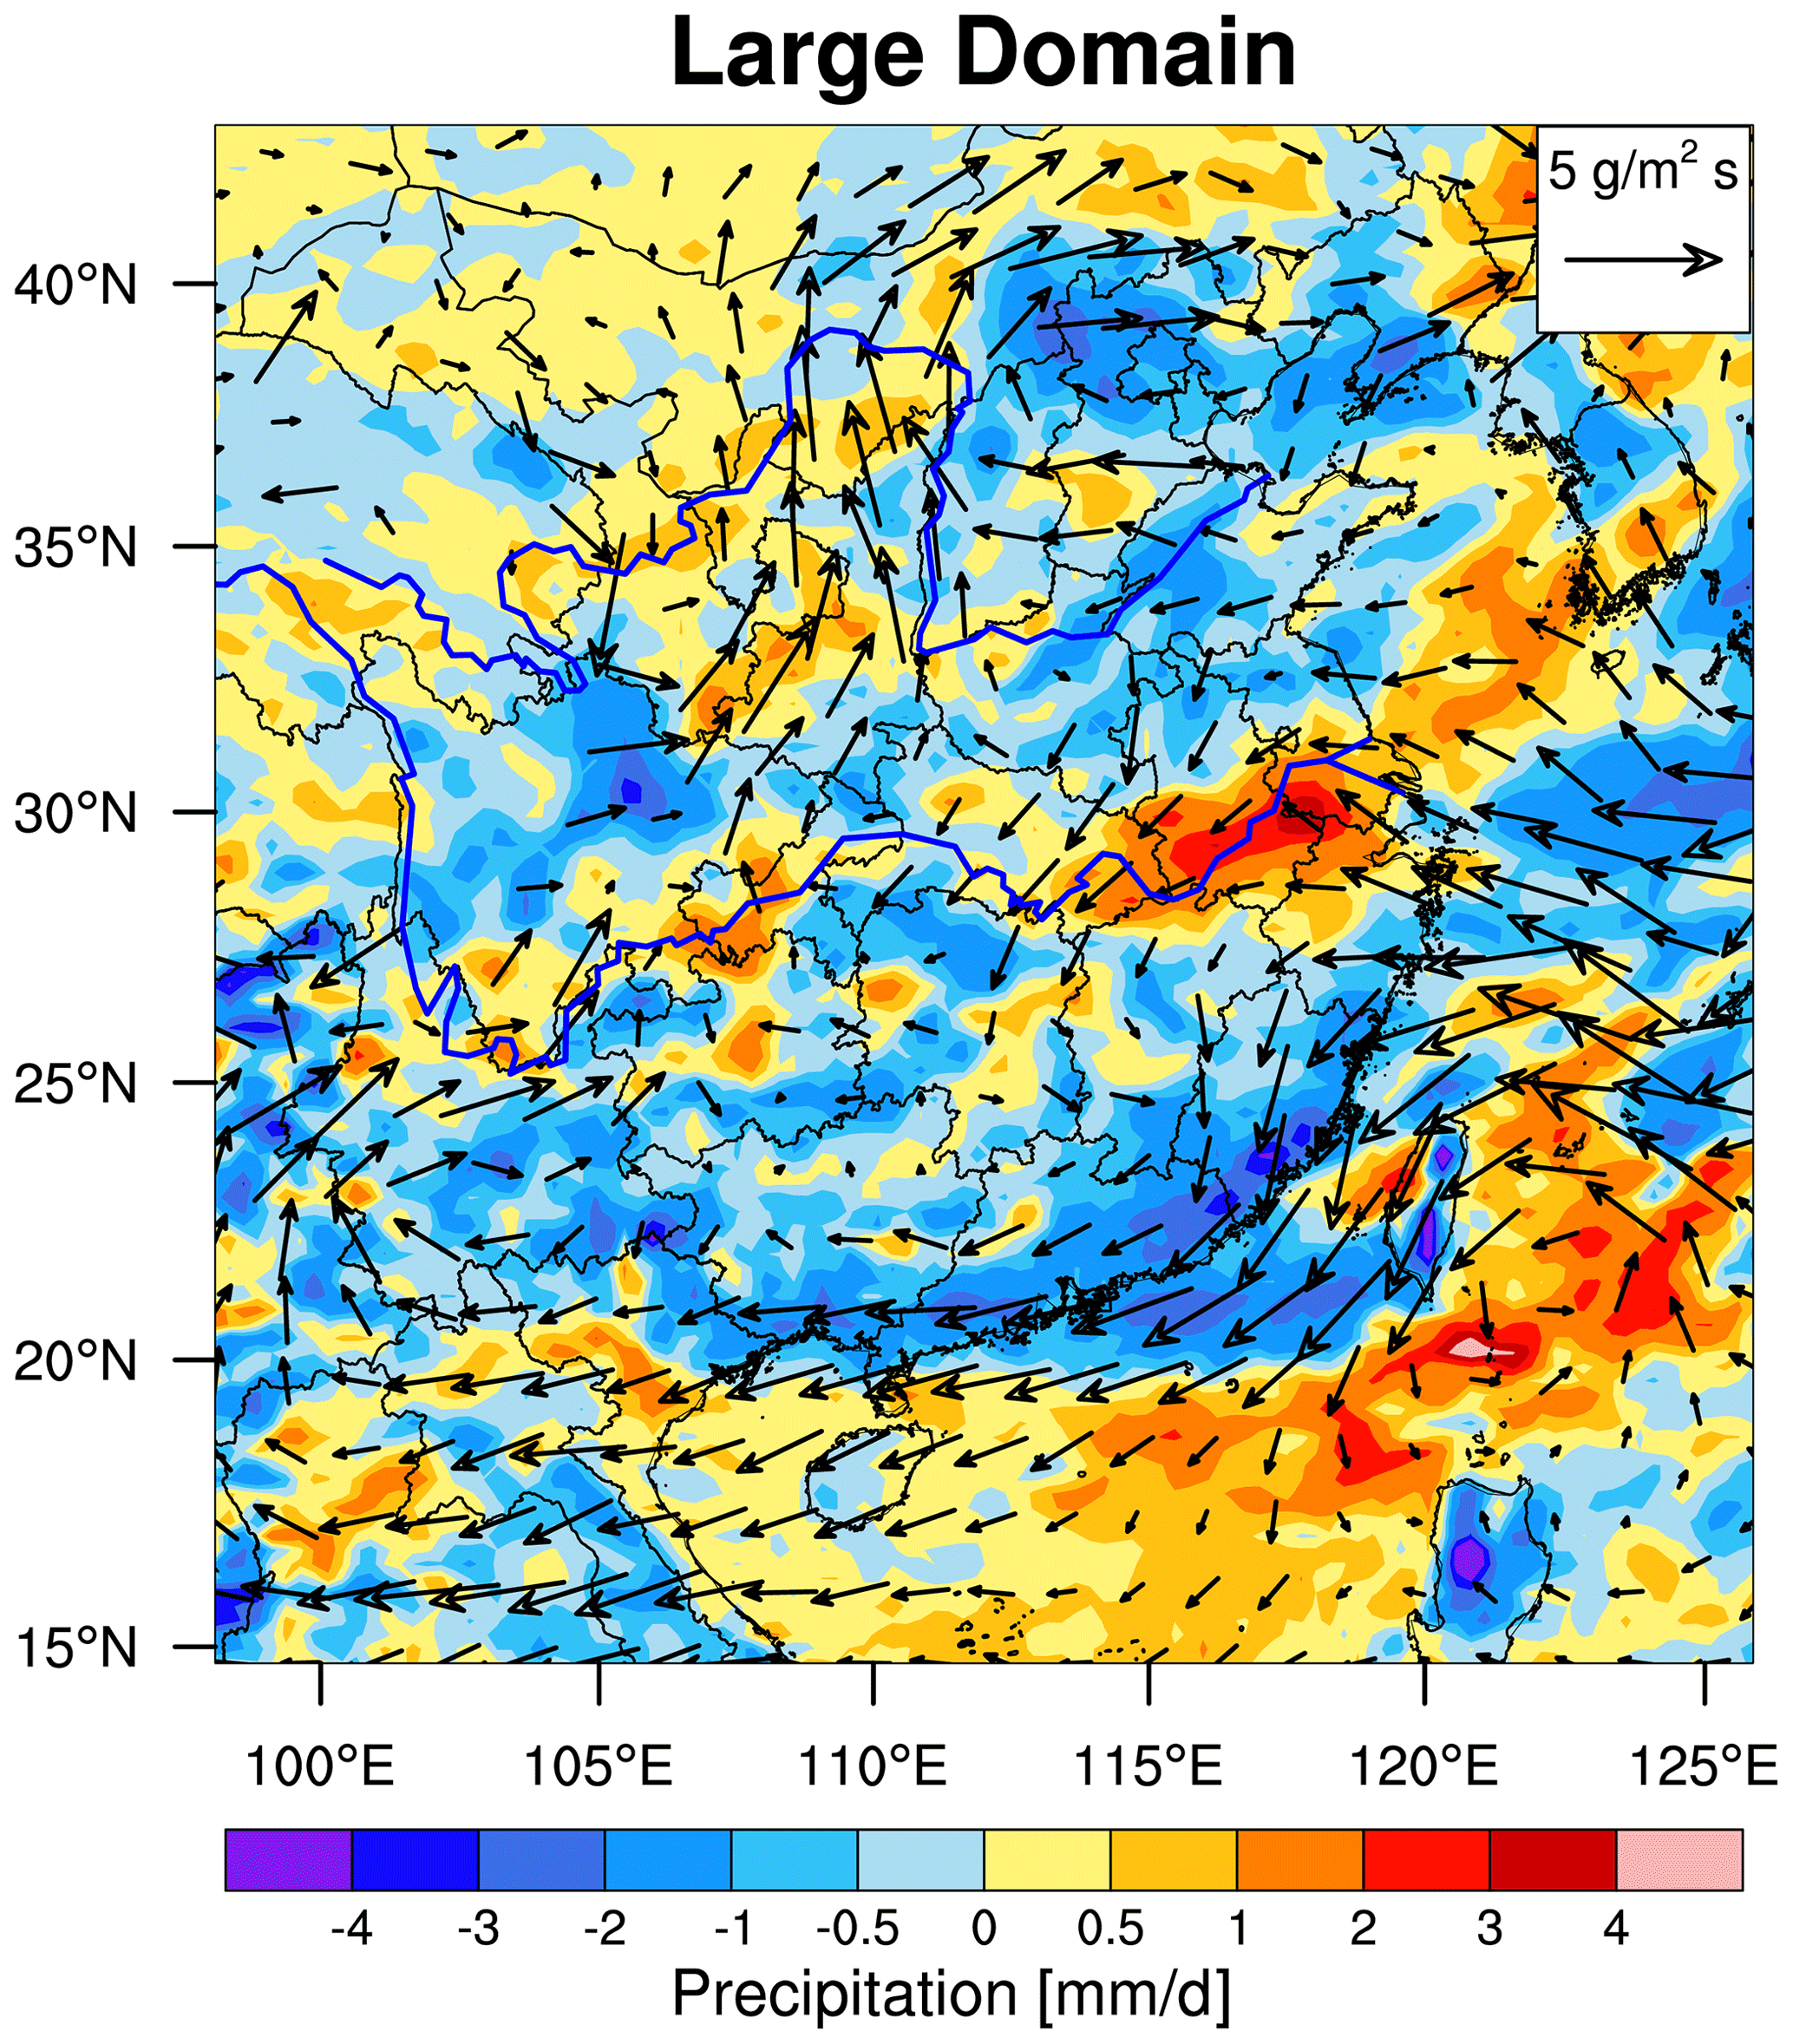
Figure 12The same as Fig. 8, but from the large-domain simulation.
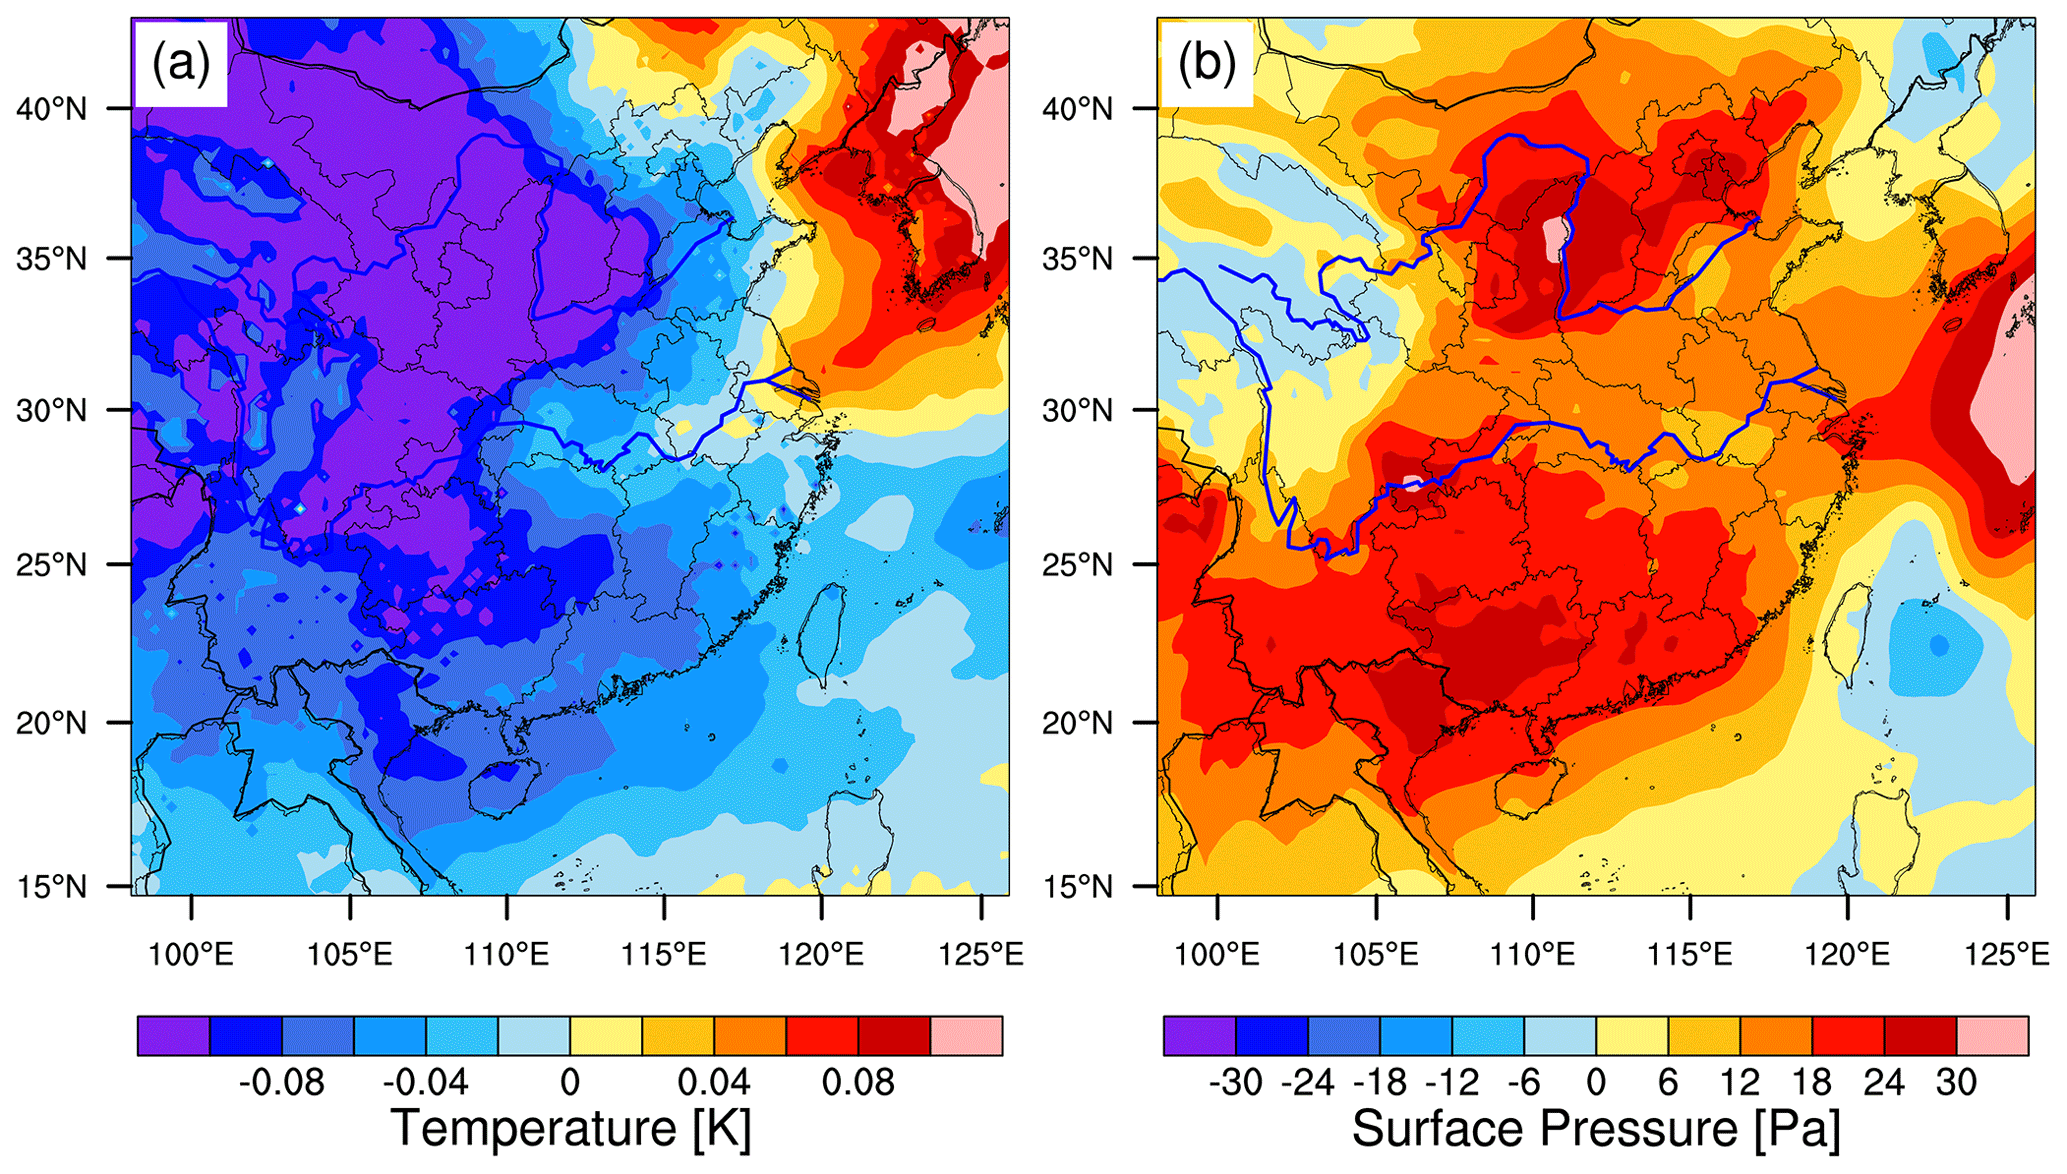
Figure 13Same as Fig. 9, but from the large-domain simulation.
Similar to the small-domain simulation, the weakening of monsoonal airflow in the large-domain simulation is also due to the abnormal positive lower-level pressure that is caused by the lower-tropospheric cooling (Fig. 13), which can also be explained by the effects of aerosol–radiation and aerosol–cloud interactions (Figs. S7 and S8 in the Supplement). However, compared with the small-domain simulation (Fig. 9), the cooling anomaly of lower-tropospheric temperature and thus the positive anomaly of lower-level pressure covers a broader area from the large-domain simulation. The two aerosol-induced cooling centers over China lead to two positive lower-level pressure anomaly centers that result in a large anti-cycle circulation anomaly (Fig. 12), which weakens the monsoonal southwesterly airflow over southern China and the South China Sea and also slightly enhances the southwesterly over western China. Again, the pattern of precipitation change corresponds well to the change of wind circulation (Fig. 14). With larger domain size, aerosols lead to a broader area (between 20–40∘ N) of abnormal cooling in the troposphere up to 200 hPa. The single cooling center in the small-domain simulation is split into two centers, one around 30∘ N at 250 hPa and another around 36∘ N at 700 hPa. The weakening of the background circulation and broader cooling area lead to the broader sinking airflow over the region, which results in the broader area of reduced precipitation compared with the small-domain simulation (Figs. 8 and 12). The increasing precipitation around 30∘ N also resulted from the compensating updraft around 30∘ N.
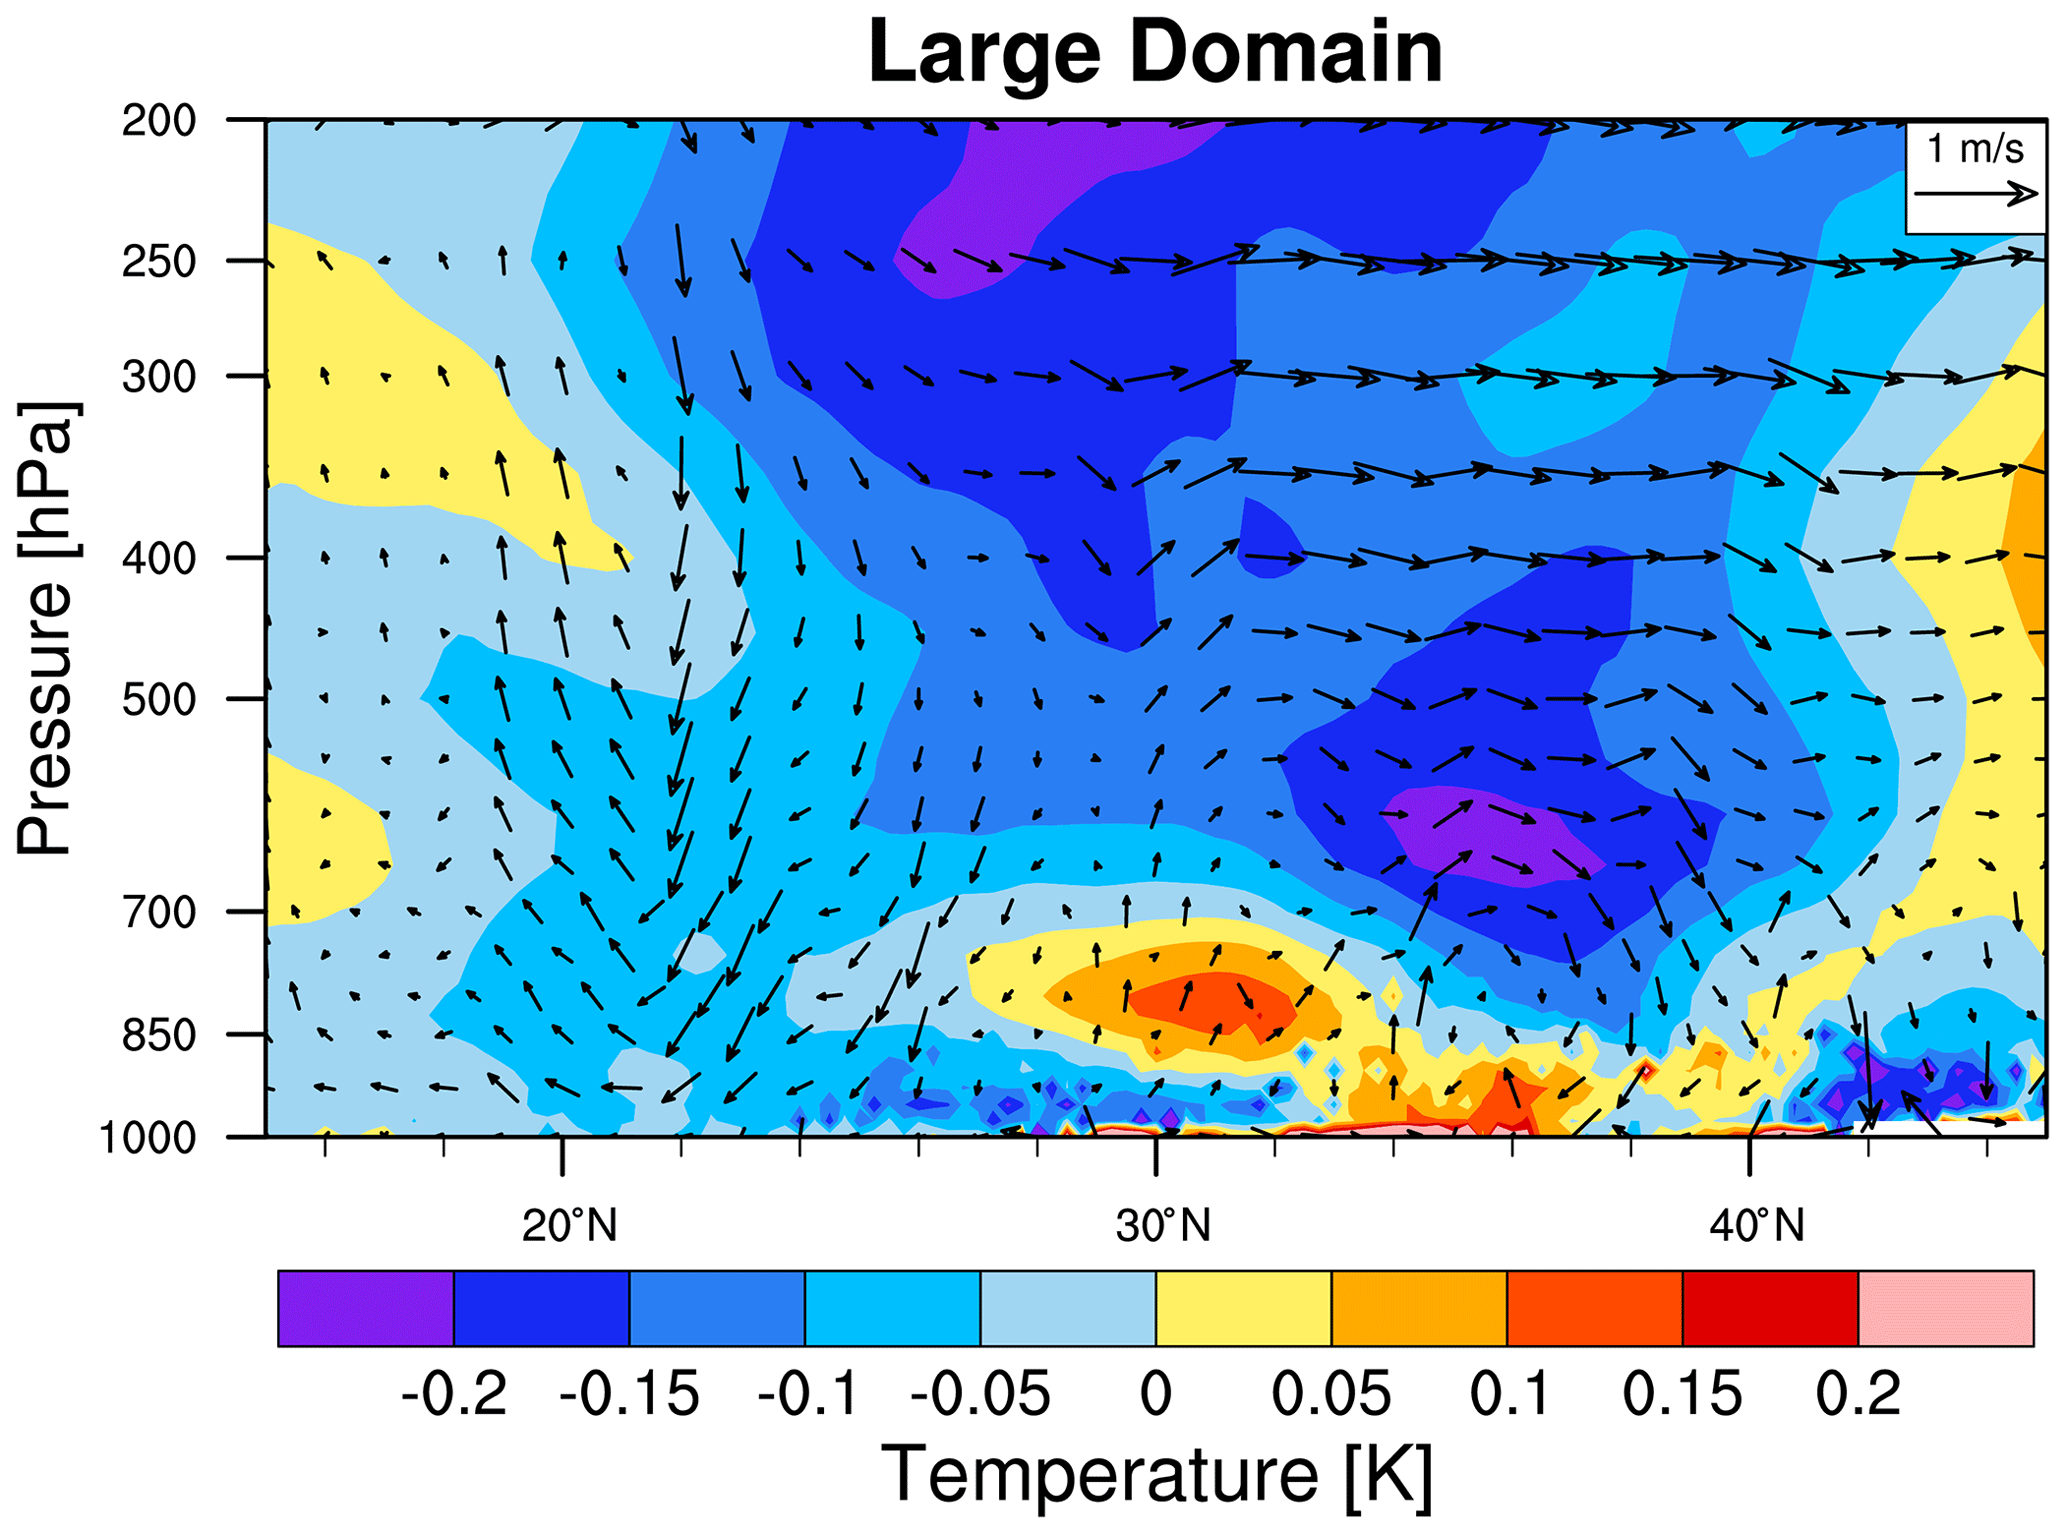
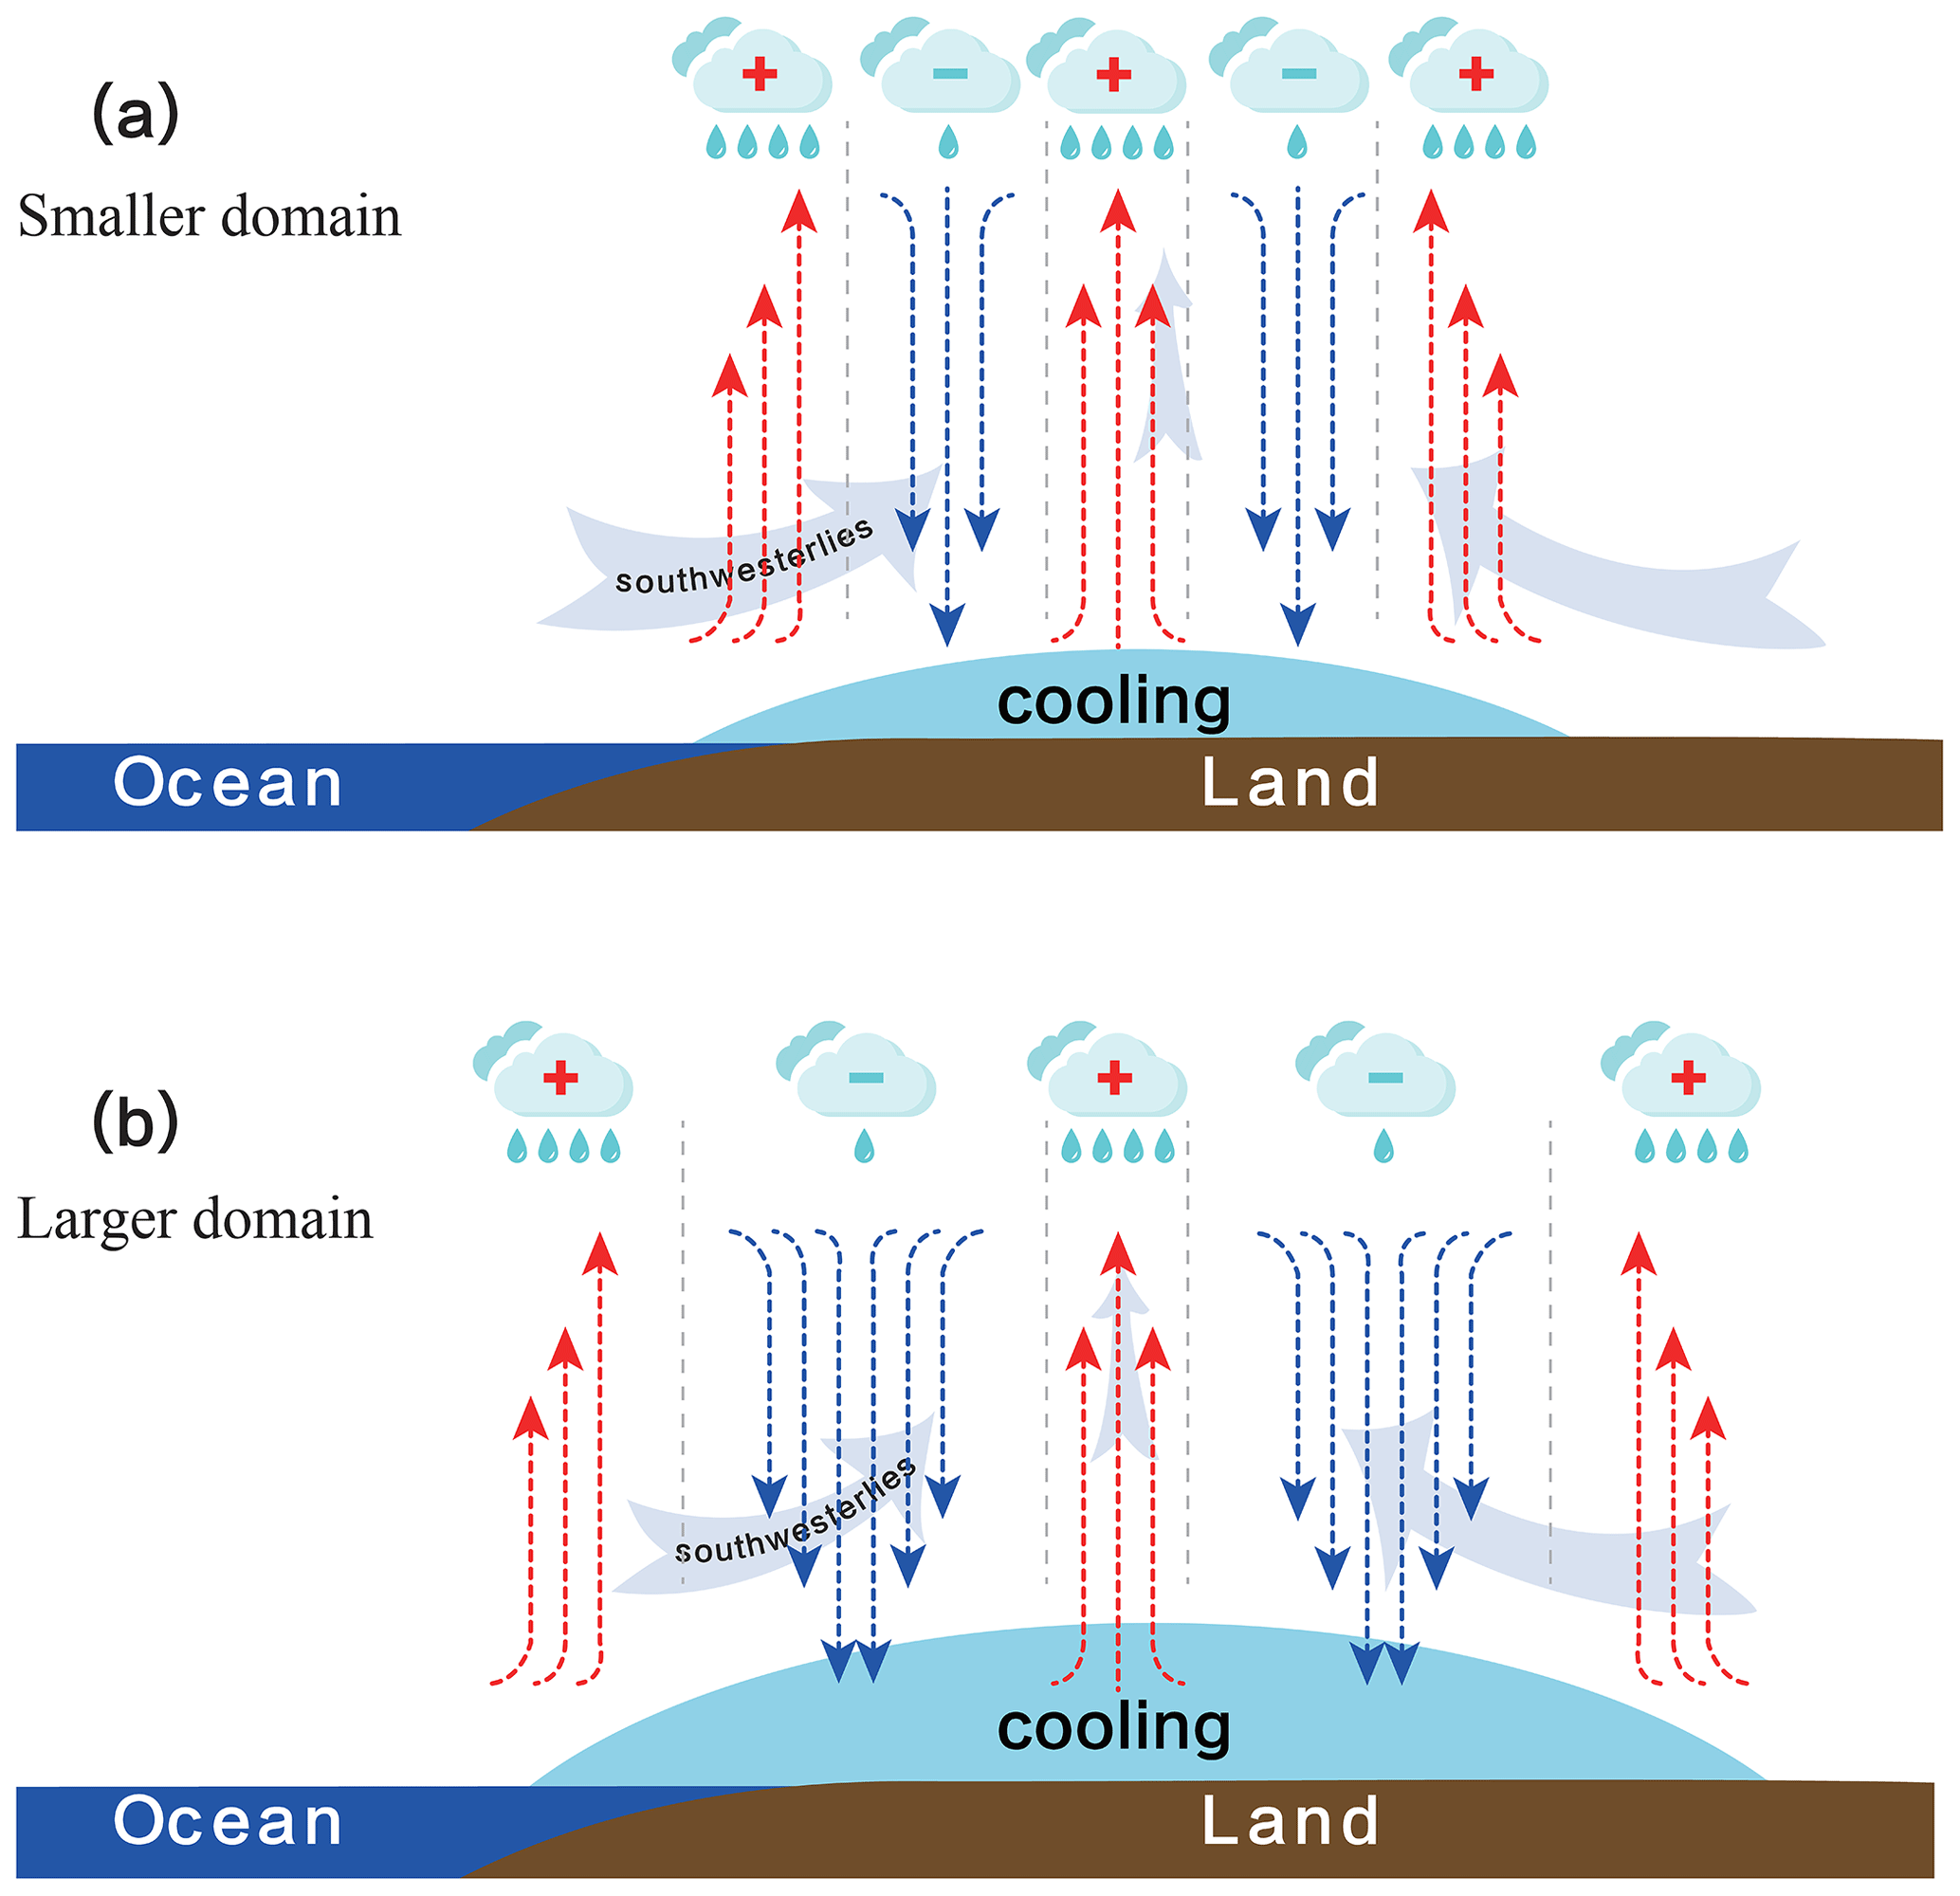
Figure 15The schematic plot of aerosol impact in the (a) small-domain simulation and (b) large-domain simulation over East Asia. The light blue shadow area represents the extent of the aerosol-induced decrease in lower tropospheric temperature and increase in surface pressure. The red (blue) vector dash lines represent updraft (downdraft) anomalies. The “+” (“−”) above the region indicates the aerosol-induced increase (decrease) in precipitation.
Due to the importance of domain size on regional modeling results and few studies that examined the sensitivities of regional modeling results of aerosol impact to domain size, this study applies the WRF-Chem model to simulate the anthropogenic aerosol impact on EASM circulation and precipitation, focusing on the modeling sensitivities to regional domain size. The influence of domain size on meteorological fields, aerosol characteristics, and aerosol impact is investigated.
First of all, the domain size has a great influence on the simulated meteorological fields. From the smaller domain simulation, the circulation and precipitation are in good agreement with the reanalysis data and observations. The larger domain simulation produces a weaker and southward-shifting EASM system, which results in the precipitation decreasing in southern China and increasing in the adjacent ocean. The changes of circulation and precipitation also lead to the increase in aerosol mass loading in southern China and the decrease in northern China in the larger domain simulation. The deviation of atmospheric fields, particularly the circulation between the simulations with different domains, is partly due to their different constraint from lateral boundary conditions. With fewer constraints of boundary forcing, the larger domain simulation may produce negative bias in precipitation over the Yangtze River Basin and positive bias in moisture transport over the South China Sea as reported by previous studies. The uncertainties in moisture transport prescribed in the lateral boundary conditions from the reanalysis over a larger domain may also contribute to the biases (e.g., Wang and Yang, 2008; Huang and Gao, 2018). Previous studies found that, with a larger simulation domain including more areas of ocean, without considering the interaction between the atmosphere and the ocean (i.e., with prescribed SST from the reanalysis), the artificial positive feedback between precipitation and surface latent heat flux may overestimate the precipitation over the subtropical Western North Pacific (WNP) and inhibit the westward expansion of the WNP subtropical high (e.g., Cha and Lee, 2009; Lee and Cha, 2020).
In terms of the climatic impact of anthropogenic aerosols on EASM, as shown in the schematic figure (Fig. 15), aerosols induce the cooling of the lower troposphere over China through aerosol–radiation and aerosol–cloud interactions, which leads to an increase in regional pressure in the lower atmosphere. The regional positive pressure anomalies result in the anti-cyclone circulation anomalies and thus weaken the summer monsoonal northeastward moisture transport, which is consistent with previous studies (e.g., Y. Q. Jiang et al., 2013; Song et al., 2014; T. Wang et al., 2015; Xie et al., 2016). The weakening of monsoonal circulation leads to several sinking airflows and compensating updrafts that correspond well to the regions with the decrease and increase in precipitation, respectively, showing a spatial pattern of “” for precipitation change. The difference in aerosol impact from the numerical experiments with different domain sizes is mainly determined by their different simulated strengths and the area extent of the aerosol-induced lower-tropospheric negative temperature anomalies. Compared with the smaller-domain simulation, the larger-domain simulation with weaker monsoonal circulation generates a broader area with negative temperature and positive pressure anomalies in the lower troposphere, which results in broader sinking airflows and thus broader areas of precipitation reduction over China. This could lead to the opposite signals of precipitation change due to aerosols over China. For example, over southeastern China, the precipitation increased (decreased) in the smaller-domain (larger-domain) simulation. The consistent signal of aerosol impact between the simulations with different domain sizes is the increasing precipitation around 30∘ N that resulted from the compensating updraft over the region.
Although the modeling results of aerosol impact in this study may have some uncertainties associated with physical and chemical processes, emissions, and horizontal resolutions (e.g., Di Luca et al., 2015; Crippa et al., 2019), it highlights the impact of simulation domain size on regional modeling aerosol impact on monsoonal circulation and precipitation, which may not be limited to the region of East Asia. Uncertainties in modeling aerosol climatic impact are often investigated with the focus on aerosol characteristics such as their distributions and properties. This study adds another layer of complexity (impact of domain size) to regional modeling of aerosol climatic impact. More specifically, on the one hand, larger-domain simulation may allow better aerosol feedbacks on weather and climate systems without strong lateral boundary constraints (e.g., Seth and Giorgi, 1998; Leduc and Laprise, 2009; Diaconescu et al., 2013), but it may produce biased meteorological fields compared to smaller-domain simulation, which can then significantly influence the modeling results of aerosol impact. On the other hand, although the simulation with smaller domain produces better large-scale circulation compared to the reanalysis, the lateral boundary condition may also have stronger constraint on aerosol feedbacks to large-scale circulation. Therefore, unlike meteorological fields or aerosol properties, there is no direct observation or reanalysis that can be used as the references to evaluate aerosol impact (Di Luca et al., 2015; Crippa et al., 2017), and it is difficult to determine the optimal configuration of the simulation domain in this study. It may be the key to improve the simulated meteorological fields with larger regional domains or global domains in order to model robust aerosol climatic impact. More generally, this study also highlights the impact of background meteorological fields (without aerosol effect) on simulated aerosol impact. Proper modeling of background meteorological fields is one of the keys to simulate reliable aerosol climatic impact. The model inter-comparison study of aerosol climatic impact should also focus on the diversity of simulated background meteorological fields besides aerosol characteristics.
The release version of WRF-Chem can be downloaded from http://www2.mmm.ucar.edu/wrf/users/download/get_source.html (last access: January 2022, Grell et al., 2005). The code of updated USTC version of WRF-Chem is available at https://doi.org/10.5281/zenodo.4663508 (Zhao and Zhang, 2021) or contact chunzhao@ustc.edu.cn. The dataset from the European Centre for Medium-Range Weather Forecasts (ECMWF) Reanalysis v5 (ERA5) can be downloaded from https://rda.ucar.edu/datasets/ds633.1/ (last access: August 2021, Hersbach et al., 2018). The CMORPH data can be downloaded from https://ftp.cpc.ncep.noaa.gov/precip/CMORPH_V1.0/CRT/0.25deg-DLY_00Z/2017/ (last access: August 2021, Xie et al., 2019).
The supplement related to this article is available online at: https://doi.org/10.5194/gmd-15-199-2022-supplement.
XW and CZ designed the experiments and conducted and analyzed the simulations. All authors contributed to the discussion and final version of the paper.
The contact author has declared that neither they nor their co-authors have any competing interests.
Publisher's note: Copernicus Publications remains neutral with regard to jurisdictional claims in published maps and institutional affiliations.
The study used the computing resources from the High-Performance Computing Center of University of Science and Technology of China (USTC) and the TH-2 of National Supercomputer Center in Guangzhou (NSCC-GZ).
This research was supported by the National Basic Research Program of China (grant no. 2018YFC1507400),National Natural Science Foundation of China (grant nos. 42061134009, 41775146, 91837310), the USTC Research Funds of the Double First-Class Initiative (grant no. YD2080002007), Fundamental Research Funds for the Central Universities (grant no. WK2080000101), and the Strategic Priority Research Program of Chinese Academy of Sciences (grant no. XDB41000000).
This paper was edited by Axel Lauer and reviewed by two anonymous referees.
Ackerman, A. S., Toon, O. B., Stevens, D. E., Heymsfield, A. J., Ramanathan, V., and Welton, E. J.: Reduction of tropical cloudiness by soot, Science, 288, 1042–1047, https://doi.org/10.1126/science.288.5468.1042, 2018.
Albrecht, B. A.: Aerosols, Cloud Microphysics, and Fractional Cloudiness, Science, 245, 1227–1230, https://doi.org/10.1126/science.245.4923.1227, 1989.
An, Z. S., Wu, G. X., Li, J. P., Sun, Y. B., Liu, Y. M., Zhou, W. J., Cai, Y., Duan, A., Li, L., Mao, J., Cheng, H., Shi, Z., Tan, L, Yan, H., Ao, H., Chang, H., and Feng, J.: Global Monsoon Dynamics and Climate Change, Annu. Rev. Earth Pl. Sc., 43, 29–77, https://doi.org/10.1146/annurev-earth-060313-054623, 2015.
An, Z., Huang, R.-J., Zhang, R., Tie, X., Li, G., Cao, J., Zhou, W., Shi, Z., Han, Y., and Gu, Z.: Severe haze in northern China: A synergy of anthropogenic emissions and atmospheric processes, P. Natl. Acad. Sci. USA, 116, 8657–8666, https://doi.org/10.1073/pnas.1900125116, 2019.
Bhaskaran, B., Ramachandran, A., Jones, R., and Moufouma-Okia, W.: Regional climate model applications on sub-regional scales over the Indian monsoon region: The role of domain size on downscaling uncertainty, J. Geophys. Res.-Atmos., 117, D10113, https://doi.org/10.1029/2012jd017956, 2012.
Binkowski, F. S. and Shankar, U.: The Regional Particulate Matter Model .1. Model description and preliminary results, J. Geophys. Res.-Atmos., 100, 26191–26209, https://doi.org/10.1029/95jd02093, 1995.
Cha, D. H. and Lee, D. K.: Reduction of systematic errors in regional climate simulations of the summer monsoon over East Asia and the western North Pacific by applying the spectral nudging technique, J. Geophys. Res.-Atmos., 114, 14108, https://doi.org/10.1029/2008jd011176, 2009.
Chan, C. K. and Yao, X.: Air pollution in mega cities in China, Atmos. Environ., 42, 1–42, https://doi.org/10.1016/j.atmosenv.2007.09.003, 2008.
Chapman, E. G., Gustafson Jr., W. I., Easter, R. C., Barnard, J. C., Ghan, S. J., Pekour, M. S., and Fast, J. D.: Coupling aerosol-cloud-radiative processes in the WRF-Chem model: Investigating the radiative impact of elevated point sources, Atmos. Chem. Phys., 9, 945–964, https://doi.org/10.5194/acp-9-945-2009, 2009.
Chen, J. P., Chen, I. J., and Tsai, I. C.: Dynamic Feedback of Aerosol Effects on the East Asian Summer Monsoon, J. Climate, 29, 6137-6149, https://doi.org/10.1175/Jcli-D-15-0758.1, 2016.
Chen, S., Zhao, C., Qian, Y., Leung, L. R., Huang, J., Huang, Z., Bi, J., Zhang, W., Shi, J., and Yang, L.: Regional modeling of dust mass balance and radiative forcing over East Asia using WRF-Chem, Aeolian Res., 15, 15–30, https://doi.org/10.1016/j.aeolia.2014.02.001, 2014.
Cowan, T. and Cai, W.: The impact of Asian and non-Asian anthropogenic aerosols on 20th century Asian summer monsoon, Geophys. Res. Lett., 38, L11703, https://doi.org/10.1029/2011gl047268, 2011.
Crippa, P., Sullivan, R. C., Thota, A., and Pryor, S. C.: The impact of resolution on meteorological, chemical and aerosol properties in regional simulations with WRF-Chem, Atmos. Chem. Phys., 17, 1511–1528, https://doi.org/10.5194/acp-17-1511-2017, 2017.
Crippa, P., Sullivan, R. C., Thota, A., and Pryor, S. C.: Sensitivity of simulated aerosol properties over eastern North America to WRF-Chem parameterizations, J. Geophys. Res.-Atmos., 124, 3365–3383, https://doi.org/10.1029/2018JD029900, 2019.
Davies, T.: Lateral boundary conditions for limited area models, Q. J. Roy. Meteor. Soc., 140, 185–196, https://doi.org/10.1002/qj.2127, 2014.
Dentener, F., Kinne, S., Bond, T., Boucher, O., Cofala, J., Generoso, S., Ginoux, P., Gong, S., Hoelzemann, J. J., Ito, A., Marelli, L., Penner, J. E., Putaud, J.-P., Textor, C., Schulz, M., van der Werf, G. R., and Wilson, J.: Emissions of primary aerosol and precursor gases in the years 2000 and 1750 prescribed data-sets for AeroCom, Atmos. Chem. Phys., 6, 4321–4344, https://doi.org/10.5194/acp-6-4321-2006, 2006.
Diaconescu, E. and Laprise, R.: Can added value be expected in RCM-simulated large scales?, Clim. Dynam., 41, 1769–1800, https://doi.org/10.1007/s00382-012-1649-9, 2013.
Di Luca, A., de Elía, R., and Laprise, R.: Challenges in the Quest for Added Value of Regional Climate Dynamical Downscaling, Curr. Clim. Change Rep., 1, 10–21, https://doi.org/10.1007/s40641-015-0003-9, 2015.
Diner, D. J., Beckert, J. C., Reilly, T. H., Bruegge, C. J., Conel, J. E., Kahn, R. A., Martonchik, J. V., Ackerman, T. P., Davies, R., and Gerstl, S. A.: Multi-angle Imaging SpectroRadiometer (MISR) instrument description and experiment overview, IEEE T. Geosci. Remote S., 36, 1072–1087, https://doi.org/10.1109/36.700992, 1998.
Diner, D., Abdou, W., Bruegge, C., Conel, J., Crean, K., Gaitley, B., Helmlinger, M., Kahn, R., Martonchik, J., and Pilorz, S.: MISR aerosol optical depth retrievals over southern Africa during the SAFARI-2000 dry season campaign, Geophys. Res. Lett., 28, 3127–3130, https://doi.org/10.1029/2001gl013188, 2001.
Ding, A. J., Fu, C. B., Yang, X. Q., Sun, J. N., Petäjä, T., Kerminen, V.-M., Wang, T., Xie, Y., Herrmann, E., Zheng, L. F., Nie, W., Liu, Q., Wei, X. L., and Kulmala, M.: Intense atmospheric pollution modifies weather: a case of mixed biomass burning with fossil fuel combustion pollution in eastern China, Atmos. Chem. Phys., 13, 10545–10554, https://doi.org/10.5194/acp-13-10545-2013, 2013.
Ding, Y., Sun, Y., Liu, Y., Si, D., Wang, Z., Zhu, Y., Liu, Y., Song, Y., and Zhang, J.: Interdecadal and Interannual Variabilities of the Asian Summer Monsoon and Its Projection of Future Change, Chinese J. Atmos. Sci., 37, 253–280, https://doi.org/10.1080/16742834.2019.1648168, 2013.
Ding, Y. H.: The variability of the Asian summer monsoon, J. Meteorol. Soc. Jpn, 85b, 21–54, https://doi.org/10.2151/jmsj.85B.21, 2007.
Ding, Y. and Chan, J. C. L.: The East Asian summer monsoon: an overview, Meteorol. Atmos. Phys., 89, 117–142, https://doi.org/10.1007/s00703-005-0125-z, 2005.
Ding, Y. H., Wang, Z. Y., and Sun, Y.: Inter-decadal variation of the summer precipitation in East China and its association with decreasing Asian summer monsoon, Part I: Observed evidences, Int. J. Climatol., 28, 1139–1161, https://doi.org/10.1002/joc.1615, 2008a.
Ding, Y. H., Sun, Y., Wang, Z. Y., Zhu, Y. X., and Song, Y. F.: Inter-decadal variation of the summer precipitation in China and its association with decreasing Asian summer monsoon Part II: Possible causes, Int. J. Climatol., 29, 1926–1944, https://doi.org/10.1002/joc.1759, 2008b.
Dong, B. W., Wilcox, L. J., Highwood, E. J., and Sutton, R. T.: Impacts of recent decadal changes in Asian aerosols on the East Asian summer monsoon: roles of aerosol-radiation and aerosol-cloud interactions, Clim. Dynam., 53, 3235–3256, https://doi.org/10.1007/s00382-019-04698-0, 2019.
Du, Q., Zhao, C., Zhang, M., Dong, X., Chen, Y., Liu, Z., Hu, Z., Zhang, Q., Li, Y., Yuan, R., and Miao, S.: Modeling diurnal variation of surface PM2.5 concentrations over East China with WRF-Chem: impacts from boundary-layer mixing and anthropogenic emission, Atmos. Chem. Phys., 20, 2839–2863, https://doi.org/10.5194/acp-20-2839-2020, 2020.
Easter, R. C., Ghan, S. J., Zhang, Y., Saylor, R. D., Chapman, E. G., Laulainen, N. S., Abdul-Razzak, H., Leung, L. R., Bian, X., and Zaveri, R. A.: MIRAGE: Model description and evaluation of aerosols and trace gases, J. Geophys. Res.-Atmos., 109, D20210, https://doi.org/10.1029/2004JD004571, 2004.
Fan, J., Rosenfeld, D., Zhang, Y., Giangrande, S. E., Li, Z., Machado, L. A., Martin, S. T., Yang, Y., Wang, J., and Artaxo, P.: Substantial convection and precipitation enhancements by ultrafine aerosol particles, Science, 359, 411–418, https://doi.org/10.1126/science.aan846, 2018.
Fan, J. W., Rosenfeld, D., Ding, Y. N., Leung, L. R., and Li, Z. Q.: Potential aerosol indirect effects on atmospheric circulation and radiative forcing through deep convection, Geophys. Res. Lett., 39, L09806, https://doi.org/10.1029/2012gl051851, 2012.
Fan, J. W., Leung, L. R., Rosenfeld, D., Chen, Q., Li, Z. Q., Zhang, J. Q., and Yan, H. R.: Microphysical effects determine macrophysical response for aerosol impacts on deep convective clouds, P. Natl. Acad. Sci. USA, 110, E4581–E4590, https://doi.org/10.1073/pnas.1316830110, 2013.
Fan, J. W., Rosenfeld, D., Yang, Y., Zhao, C., Leung, L. R., and Li, Z. Q.: Substantial contribution of anthropogenic air pollution to catastrophic floods in Southwest China, Geophys. Res. Lett., 42, 6066–6075, https://doi.org/10.1002/2015gl064479, 2015.
Fan, J. W., Wang, Y., Rosenfeld, D., and Liu, X. H.: Review of Aerosol-Cloud Interactions: Mechanisms, Significance, and Challenges, J. Atmos. Sci., 73, 4221–4252, https://doi.org/10.1175/Jas-D-16-0037.1, 2016.
Fast, J. D., Gustafson Jr, W. I., Easter, R. C., Zaveri, R. A., Barnard, J. C., Chapman, E. G., Grell, G. A., and Peckham, S. E.: Evolution of ozone, particulates, and aerosol direct radiative forcing in the vicinity of Houston using a fully coupled meteorology-chemistry-aerosol model, J. Geophys. Res.-Atmos., 111, D21305, https://doi.org/10.1029/2005JD006721, 2006.
Gao, Y., Zhao, C., Liu, X. H., Zhang, M. G., and Leung, L. R.: WRF-Chem simulations of aerosols and anthropogenic aerosol radiative forcing in East Asia, Atmos. Environ., 92, 250–266, https://doi.org/10.1016/j.atmosenv.2014.04.038, 2014.
Ginoux, P., Chin, M., Tegen, I., Prospero, J. M., Holben, B., Dubovik, O., and Lin, S. J.: Sources and distributions of dust aerosols simulated with the GOCART model, J. Geophys. Res.-Atmos., 106, 20255–20273, https://doi.org/10.1029/2000jd000053, 2001.
Giorgi, F.: Thirty Years of Regional Climate Modeling: Where Are We and Where Are We Going next?, J. Geophys. Res.-Atmos., 124, 5696–5723, https://doi.org/10.1029/2018jd030094, 2019.
Grell, G. A., Peckham, S. E., Schmitz, R., McKeen, S. A., Frost, G., Skamarock, W. C., and Eder, B.: Fully coupled “online” chemistry within the WRF model, Atmos. Environ., 39, 6957–6975, https://doi.org/10.1016/j.atmosenv.2005.04.027, 2005.
Guo, L., Highwood, E. J., Shaffrey, L. C., and Turner, A. G.: The effect of regional changes in anthropogenic aerosols on rainfall of the East Asian Summer Monsoon, Atmos. Chem. Phys., 13, 1521–1534, https://doi.org/10.5194/acp-13-1521-2013, 2013.
Hersbach, H., Bell, B., Berrisford, P., Biavati, G., Horányi, A., Muñoz Sabater, J., Nicolas, J., Peubey, C., Radu, R., Rozum, I., Schepers, D., Simmons, A., Soci, C., Dee, D., Thépaut, J-N. : ERA5 hourly data on single levels from 1979 to present, Copernicus Climate Change Service (C3S) Climate Data Store (CDS) [data set], https://doi.org/10.24381/cds.adbb2d47, 2018.
Hersbach, H., Bell, B., Berrisford, P., Hirahara, S., Horányi, A., Muñoz-Sabater, J., Nicolas, J., Peubey, C., Radu, R., Schepers, D., Simmons, A., Soci, C., Abdalla, S., Abellan, X., Balsamo, G., Bechtold, P., Biavati, G., Bidlot, J., Bonavita, M., De Chiara, G., Dahlgren, P., Dee, D., Diamantakis, M., Dragani, R., Flemming, J., Forbes, R., Fuentes, M., Geer, A., Haimberger, L., Healy, S., Hogan, R. J., Hólm, E., Janisková, M., Keeley, S., Laloyaux, P., Lopez, P., Lupu, C., Radnoti, G., de Rosnay, P., Rozum, I., Vamborg, F., Villaume, S., and Thépaut, J.-N.: The ERA5 global reanalysis, Q. J. Roy. Meteor. Soc., 146, 1999–2049, https://doi.org/10.1002/qj.3803, 2020.
Hu, Z., Zhao, C., Huang, J., Leung, L. R., Qian, Y., Yu, H., Huang, L., and Kalashnikova, O. V.: Trans-Pacific transport and evolution of aerosols: evaluation of quasi-global WRF-Chem simulation with multiple observations, Geosci. Model Dev., 9, 1725–1746, https://doi.org/10.5194/gmd-9-1725-2016, 2016.
Hu, Z., Huang, J., Zhao, C., Bi, J., Jin, Q., Qian, Y., Leung, L. R., Feng, T., Chen, S., and Ma, J.: Modeling the contributions of Northern Hemisphere dust sources to dust outflow from East Asia, Atmos. Environ., 202, 234–243, https://doi.org/10.1016/j.atmosenv.2019.01.022, 2019.
Huang, D. L. and Gao, S. B.: Impact of different reanalysis data on WRF dynamical downscaling over China, Atmos. Res., 200, 25–35, https://doi.org/10.1016/j.atmosres.2017.09.017, 2018.
Huang, X., Ding, A., Liu, L., Liu, Q., Ding, K., Niu, X., Nie, W., Xu, Z., Chi, X., Wang, M., Sun, J., Guo, W., and Fu, C.: Effects of aerosol–radiation interaction on precipitation during biomass-burning season in East China, Atmos. Chem. Phys., 16, 10063–10082, https://doi.org/10.5194/acp-16-10063-2016, 2016.
Iacono, M. J., Mlawer, E. J., Clough, S. A., and Morcrette, J. J.: Impact of an improved longwave radiation model, RRTM, on the energy budget and thermodynamic properties of the NCAR community climate model, CCM3, J. Geophys. Res.-Atmos., 105, 14873–14890, https://doi.org/10.1029/2000jd900091, 2000.
Iacono, M. J., Delamere, J. S., Mlawer, E. J., Shephard, M. W., Clough, S. A., and Collins, W. D.: Radiative forcing by long-lived greenhouse gases: Calculations with the AER radiative transfer models, J. Geophys. Res.-Atmos., 113, D13103, https://doi.org/10.1029/2008jd009944, 2008.
IPCC: Climate Change 2013: The Physical Science Basis. Contribution of Working Group I to the Fifth Assessment Report of the Intergovernmental Panel on Climate Change, edited by: Stocker, T. F., Qin, D., Plattner, G.-K., Tignor, M., Allen, S. K., Boschung, J., Nauels, A., Xia, Y., Bex, V., and Midgley, P. M., Cambridge University Press, Cambridge, United Kingdom and New York, NY, USA, 1535 pp., 2013.
Janssens-Maenhout, G., Crippa, M., Guizzardi, D., Dentener, F., Muntean, M., Pouliot, G., Keating, T., Zhang, Q., Kurokawa, J., Wankmüller, R., Denier van der Gon, H., Kuenen, J. J. P., Klimont, Z., Frost, G., Darras, S., Koffi, B., and Li, M.: HTAP_v2.2: a mosaic of regional and global emission grid maps for 2008 and 2010 to study hemispheric transport of air pollution, Atmos. Chem. Phys., 15, 11411–11432, https://doi.org/10.5194/acp-15-11411-2015, 2015.
Jiang, Y. Q., Liu, X. H., Yang, X. Q., and Wang, M. H.: A numerical study of the effect of different aerosol types on East Asian summer clouds and precipitation, Atmos. Environ., 70, 51–63, https://doi.org/10.1016/j.atmosenv.2012.12.039, 2013.
Jiang, Z. H., Huo, F., Ma, H. Y., Song, J., and Dai, A. G.: Impact of Chinese Urbanization and Aerosol Emissions on the East Asian Summer Monsoon, J. Climate, 30, 1019–1039, https://doi.org/10.1175/Jcli-D-15-0593.1, 2017.
Joyce, R. J., Janowiak, J. E., Arkin, P. A., and Xie, P. P.: CMORPH: A method that produces global precipitation estimates from passive microwave and infrared data at high spatial and temporal resolution, J. Hydrometeorol., 5, 487-503, https://doi.org/10.1175/1525-7541(2004)005<0487:Camtpg>2.0.Co;2, 2004.
Kain, J. S.: The Kain-Fritsch convective parameterization: An update, J. Appl. Meteorol., 43, 170–181, https://doi.org/10.1175/1520-0450(2004)043<0170:Tkcpau>2.0.Co;2, 2004.
Kim, M. J., Yeh, S. W., and Park, R. J.: Effects of sulfate aerosol forcing on East Asian summer monsoon for 1985-2010, Geophys. Res. Lett., 43, 1364–1372, https://doi.org/10.1002/2015gl067124, 2016.
Kim, M. K., Lau, W. K. M., Kim, K. M., and Lee, W. S.: A GCM study of effects of radiative forcing of sulfate aerosol on large scale circulation and rainfall in East Asia during boreal spring, Geophys. Res. Lett., 34, 2007GL031683, https://doi.org/10.1029/2007gl031683, 2007.
Kok, J. F.: A scaling theory for the size distribution of emitted dust aerosols suggests climate models underestimate the size of the global dust cycle, P. Natl. Acad. Sci. USA, 108, 1016–1021, https://doi.org/10.1073/pnas.1014798108, 2011.
Kuniyal, J. C. and Guleria, R. P.: The current state of aerosol-radiation interactions: A mini review, J. Aerosol Sci., 130, 45–54, https://doi.org/10.1016/j.jaerosci.2018.12.010, 2019.
Leduc, M. and Laprise, R.: Regional climate model sensitivity to domain size, Clim. Dynam., 32, 833–854, https://doi.org/10.1007/s00382-008-0400-z, 2009.
Leduc, M., Laprise, R., Moretti-Poisson, M., and Morin, J. P.: Sensitivity to domain size of mid-latitude summer simulations with a regional climate model, Clim. Dynam., 37, 343–356, https://doi.org/10.1007/s00382-011-1008-2, 2011.
Lee, D. K. and Cha, D. H.: Regional climate modeling for Asia, Geosci. Lett., 7, https://doi.org/10.1186/s40562-020-00162-8, 2020.
Li, H. M., Dai, A. G., Zhou, T. J., and Lu, J.: Responses of East Asian summer monsoon to historical SST and atmospheric forcing during 1950-2000, Clim. Dynam., 34, 501–514, https://doi.org/10.1007/s00382-008-0482-7, 2010.
Li, M., Liu, H., Geng, G., Hong, C., Liu, F., Song, Y., Tong, D., Zheng, B., Cui, H., and Man, H.: Anthropogenic emission inventories in China: a review, National Sci. Rev., 4, 834–866, https://doi.org/10.1093/nsr/nwx150, 2017.
Li, X. Q., Ting, M. F., Li, C. H., and Henderson, N.: Mechanisms of Asian Summer Monsoon Changes in Response to Anthropogenic Forcing in CMIP5 Models, J. Climate, 28, 4107–4125, https://doi.org/10.1175/Jcli-D-14-00559.1, 2015.
Li, X. Q., Ting, M. F., and Lee, D. E.: Fast Adjustments of the Asian Summer Monsoon to Anthropogenic Aerosols, Geophys. Res. Lett., 45, 1001–1010, https://doi.org/10.1002/2017gl076667, 2018.
Li, Z., Lau, W. M., Ramanathan, V., Wu, G., Ding, Y., Manoj, M., Liu, J., Qian, Y., Li, J., and Zhou, T.: Aerosol and monsoon climate interactions over Asia, Rev. Geophys., 54, 866–929, https://doi.org/10.1002/2015RG000500, 2016.
Li, Z., Wang, Y., Guo, J., Zhao, C., Cribb, M. C., Dong, X., Fan, J., Gong, D., Huang, J., and Jiang, M.: East Asian study of tropospheric aerosols and their impact on regional clouds, precipitation, and climate (EAST-AIRCPC), J. Geophys. Res.-Atmos., 124, 13026–13054, https://doi.org/10.1029/2019JD030758, 2019.
Li, Z. Q., Lee, K. H., Wang, Y. S., Xin, J. Y., and Hao, W. M.: First observation-based estimates of cloud-free aerosol radiative forcing across China, J. Geophys. Res.-Atmos., 115, D00K18, https://doi.org/10.1029/2009jd013306, 2010.
Liu, J. Z., Li, J., and Li, W. F.: Temporal Patterns in Fine Particulate Matter Time Series in Beijing: A Calendar View, Sci. Rep., 6, 32221, https://doi.org/10.1038/srep32221, 2016.
Luo, Y. X., Zheng, X. B., Zhao, T. L., and Chen, J.: A climatology of aerosol optical depth over China from recent 10 years of MODIS remote sensing data, Int. J. Climatol., 34, 863–870, https://doi.org/10.1002/joc.3728, 2014.
Martonchik, J. V., Diner, D. J., Kahn, R., Gaitley, B., and Holben, B. N.: Comparison of MISR and AERONET aerosol optical depths over desert sites, Geophys. Res. Lett., 31, L16102, https://doi.org/10.1029/2004GL019807, 2004.
Morrison, H., Thompson, G., and Tatarskii, V., Impact of Cloud Microphysics on the Development of Trailing Stratiform Precipitation in a Simulated Squall Line: Comparison of One- and Two-Moment Schemes, Mon. Weather Rev., 137, 991–1007, https://doi.org/10.1175/2008mwr2556.1, 2009.
Mlawer, E. J., Taubman, S. J., Brown, P. D., Iacono, M. J., and Clough, S. A., Radiative transfer for inhomogeneous atmospheres: RRTM, a validated correlated-k model for the longwave, J. Geophys. Res.-Atmos., 102, 16663–16682, https://doi.org/10.1029/97jd00237, 1997.
Myhre, G., Shindell, D., Bréon, F.-M., Collins, W., Fuglestvedt, J., Huang, J., Koch, D., Lamarque, J.-F., Lee, D., Mendoza, B., Nakajima, T., Robock, A., Stephens, G., Takemura, T., and Zhang, H.: Anthropogenic and Natural Radiative Forcing. In: Climate Change 2013: The Physical Science Basis. Contribution of Working Group I to the Fifth Assessment Report of the Intergovernmental Panel on Climate Change, Cambridge University Press, Cambridge, United Kingdom and New York, NY, USA, 2013.
Nakanishi, M. and Niino, H.: An improved mellor-yamada level-3 model: Its numerical stability and application to a regional prediction of advection fog, Bound.-Lay. Meteorol., 119, 397–407, https://doi.org/10.1007/s10546-005-9030-8, 2006.
Nakanishi, M. and Niino, H.: Development of an Improved Turbulence Closure Model for the Atmospheric Boundary Layer, J. Meteorol. Soc. Jpn., 87, 895–912, https://doi.org/10.2151/jmsj.87.895, 2009.
National Centers for Environmental Prediction/National Weather Service/NOAA/U.S. Department of Commerce: NCEP FNL Operational Model Global Tropospheric Analyses, continuing from July 1999, Research Data Archive at the National Center for Atmospheric Research, Computational and Information Systems Laboratory [data set], https://doi.org/10.5065/D6M043C6, 2000.
Petäjä, T., Järvi, L., Kerminen, V.-M., Ding, A., Sun, J., Nie, W., Kujansuu, J., Virkkula, A., Yang, X., and Fu, C.: Enhanced air pollution via aerosol-boundary layer feedback in China, Sci. Rep., 6, 1–6, https://doi.org/10.1038/srep18998, 2016.
Qi, Y. L., Ge, J. M., and Huang, J. P.: Spatial and temporal distribution of MODIS and MISR aerosol optical depth over northern China and comparison with AERONET, Chinese Sci. Bull., 58, 2497–2506, https://doi.org/10.1007/s11434-013-5678-5, 2013.
Rinke, A., Dethloff, K., and Fortmann, M.: Regional climate effects of Arctic Haze, Geophys. Res. Lett., 31, https://doi.org/10.1029/2004gl020318, 2004.
Rosenfeld, D., Lohmann, U., Raga, G. B., O'Dowd, C. D., Kulmala, M., Fuzzi, S., Reissell, A., and Andreae, M. O.: Flood or drought: How do aerosols affect precipitation?, Science, 321, 1309–1313, https://doi.org/10.1126/science.1160606, 2008.
Rosenfeld, D., Andreae, M. O., Asmi, A., Chin, M., de Leeuw, G., Donovan, D. P., Kahn, R., Kinne, S., Kivekäs, N., and Kulmala, M.: Global observations of aerosol-cloud-precipitation-climate interactions, Rev. Geophys., 52, 750–808, https://doi.org/10.1002/2013rg000441, 2014.
Schwartz, S. E.: The Whitehouse effect – Shortwave radiative forcing of climate by anthropogenic aerosols: An overview, J. Aerosol Sci., 27, 359–382, https://doi.org/10.1016/0021-8502(95)00533-1, 1996.
Seth, A. and Giorgi, F.: The effects of domain choice on summer precipitation simulation and sensitivity in a regional climate model, J. Climate, 11, 2698–2712, https://doi.org/10.1175/1520-0442(1998)011<2698:Teodco>2.0.Co;2, 1998.
Skamarock, W. C., Klemp, J. B., Dudhia, J., Gill, D. O., Barker, D., Duda, M. G., and Powers, J. G.: A Description of the Advanced Research WRF Version 3 (No. NCAR/TN-475+STR), University Corporation for Atmospheric Research [data set], https://https://doi.org/10.5065/D68S4MVH, 2008.
Song, F. F. and Zhou, T. J.: The Climatology and Interannual Variability of East Asian Summer Monsoon in CMIP5 Coupled Models: Does Air-Sea Coupling Improve the Simulations?, J. Climate, 27, 8761–8777, https://doi.org/10.1175/Jcli-D-14-00396.1, 2014.
Song, F. F., Zhou, T. J., and Qian, Y.: Responses of East Asian summer monsoon to natural and anthropogenic forcings in the 17 latest CMIP5 models, Geophys. Res. Lett., 41, 596–603, https://doi.org/10.1002/2013gl058705, 2014.
Stanelle, T., Vogel, B., Vogel, H., Bäumer, D., and Kottmeier, C.: Feedback between dust particles and atmospheric processes over West Africa during dust episodes in March 2006 and June 2007, Atmos. Chem. Phys., 10, 10771–10788, https://doi.org/10.5194/acp-10-10771-2010, 2010.
Tao, W. K., Chen, J. P., Li, Z. Q., Wang, C., and Zhang, C. D.: Impact of Aerosols on Convective Clouds and Precipitation, Rev. Geophys., 50, RG2001, https://doi.org/10.1029/2011rg000369, 2012.
Twomey, S.: The influence of pollution on the shortwave albedo of clouds, J. Atmos. Sci., 34, 1149–1152, https://doi.org/10.1175/1520-0469(1977)034<1149:TIOPOT>2.0.CO;2, 1977.
Wang, B. and Yang, H. W.: Hydrological issues in lateral boundary conditions for regional climate modeling: simulation of east asian summer monsoon in 1998, Clim. Dynam., 31, 477–490, https://doi.org/10.1007/s00382-008-0385-7, 2008.
Wang, Q. Y., Wang, Z. L., and Zhang, H.: Impact of anthropogenic aerosols from global, East Asian, and non-East Asian sources on East Asian summer monsoon system, Atmos. Res., 183, 224–236, https://doi.org/10.1016/j.atmosres.2016.08.023, 2017.
Wang, T., Wang, H. J., Otterå, O. H., Gao, Y. Q., Suo, L. L., Furevik, T., and Yu, L.: Anthropogenic agent implicated as a prime driver of shift in precipitation in eastern China in the late 1970s, Atmos. Chem. Phys., 13, 12433–12450, https://doi.org/10.5194/acp-13-12433-2013, 2013.
Wang, T., Zhuang, B., Li, S., Liu, J., Xie, M., Yin, C., Zhang, Y., Yuan, C., Zhu, J., and Ji, L.: The interactions between anthropogenic aerosols and the East Asian summer monsoon using RegCCMS, J. Geophys. Res.-Atmos., 120, 5602–5621, https://doi.org/10.1002/2014jd022877, 2015.
Warner, T. T., Peterson, R. A., and Treadon, R. E.: A tutorial on lateral boundary conditions as a basic and potentially serious limitation to regional numerical weather prediction, B. Am. Meteorol. Soc., 78, 2599–2617, https://doi.org/10.1175/1520-0477(1997)078<2599:Atolbc>2.0.Co;2, 1997.
Wiedinmyer, C., Akagi, S. K., Yokelson, R. J., Emmons, L. K., Al-Saadi, J. A., Orlando, J. J., and Soja, A. J.: The Fire INventory from NCAR (FINN): a high resolution global model to estimate the emissions from open burning, Geosci. Model Dev., 4, 625–641, https://doi.org/10.5194/gmd-4-625-2011, 2011.
Wu, G., Z. Li, C. Fu, X. Zhang, R. Zhang, R. Zhang, T. Zhou, J. Li, J. Li and D. Zhou: Advances in studying interactions between aerosols and monsoon in China, Science China-Earth Sci., 59, 1–16, https://doi.org/10.1007/s11430-015-5198-z, 2016.
Wu, L. T., Su, H., and Jiang, J. H.: Regional simulation of aerosol impacts on precipitation during the East Asian summer monsoon, J. Geophys. Res.-Atmos., 118, 6454–6467, https://doi.org/10.1002/jgrd.50527, 2013.
Xiao, Z. X., and Duan, A. M.: Impacts of Tibetan Plateau Snow Cover on the Interannual Variability of the East Asian Summer Monsoon, J. Climate, 29, 8495–8514, https://doi.org/10.1175/Jcli-D-16-0029.1, 2016.
Xie, X., Wang, H., Liu, X., Li, J., Wang, Z., and Liu, Y.: Distinct effects of anthropogenic aerosols on the East Asian summermonsoon between multidecadal strong and weakmonsoon stages, J. Geophys. Res.-Atmos., 121, 7026–7040, https://doi.org/10.1002/2015jd024228, 2016.
Xie, P., Joyce, R., Wu, S., Yoo, S.-H., Yarosh, Y., Sun, F., and Lin, R.: NOAA CDR Program (2019): NOAA Climate Data Record (CDR) of CPC Morphing Technique (CMORPH) High Resolution Global Precipitation Estimates, Version 1 [0.25deg-DLY_00Z], NOAA National Centers for Environmental Information [data set], https://doi.org/10.25921/w9va-q159, 2019.
Xue, Y. K., Janjic, Z., Dudhia, J., Vasic, R., and De Sales, F.: A review on regional dynamical downscaling in intraseasonal to seasonal simulation/prediction and major factors that affect downscaling ability, Atmos. Res., 147, 68–85, https://doi.org/10.1016/j.atmosres.2014.05.001, 2014.
Yan, H., Qian, Y., Zhao, C., Wang, H., Wang, M., Yang, B., Liu, X., and Fu, Q.: A new approach to modeling aerosol effects on East Asian climate: Parametric uncertainties associated with emissions, cloud microphysics, and their interactions, J. Geophys. Res.-Atmos., 120, 8905–8924, https://doi.org/10.1002/2015jd023442, 2015.
Zaveri, R. A. and Peters, L. K.: A new lumped structure photochemical mechanism for large-scale applications, J. Geophys. Res.-Atmos., 104, 30387–30415, https://doi.org/10.1029/1999jd900876, 1999.
Zaveri, R. A., Easter, R. C., Fast, J. D., and Peters, L. K.: Model for Simulating Aerosol Interactions and Chemistry (MOSAIC), J. Geophys. Res.-Atmos., 113, https://doi.org/10.1029/2007jd008782, 2008.
Zhang, D. F., Zakey, A. S., Gao, X. J., Giorgi, F., and Solmon, F.: Simulation of dust aerosol and its regional feedbacks over East Asia using a regional climate model, Atmos. Chem. Phys., 9, 1095–1110, https://doi.org/10.5194/acp-9-1095-2009, 2009.
Zhang, H., Wang, Z., Wang, Z., Liu, Q., Gong, S., Zhang, X., Shen, Z., Lu, P., Wei, X., and Che, H.: Simulation of direct radiative forcing of aerosols and their effects on East Asian climate using an interactive AGCM-aerosol coupled system, Clim. Dynam., 38, 1675–1693, https://doi.org/10.1007/s00382-011-1131-0, 2012.
Zhang, M., Zhao, C., Cong, Z., Du, Q., Xu, M., Chen, Y., Chen, M., Li, R., Fu, Y., Zhong, L., Kang, S., Zhao, D., and Yang, Y.: Impact of topography on black carbon transport to the southern Tibetan Plateau during the pre-monsoon season and its climatic implication, Atmos. Chem. Phys., 20, 5923–5943, https://doi.org/10.5194/acp-20-5923-2020, 2020.
Zhang, R. H.: Changes in East Asian summer monsoon and summer rainfall over eastern China during recent decades, Sci. Bull., 60, 1222–1224, https://doi.org/10.1007/s11434-015-0824-x, 2015.
Zhang, X. Y., Wang, Y. Q., Niu, T., Zhang, X. C., Gong, S. L., Zhang, Y. M., and Sun, J. Y.: Corrigendum to “Atmospheric aerosol compositions in China: spatial/temporal variability, chemical signature, regional haze distribution and comparisons with global aerosols” published in Atmos. Chem. Phys., 12, 779–799, 2012, Atmos. Chem. Phys., 12, 6273–6273, https://doi.org/10.5194/acp-12-6273-2012, 2012.
Zhao, B., K.-N. Liou, Y. Gu, Q. Li, J. H. Jiang, H. Su, C. He, H.-L. R. Tseng, S. Wang and R. Liu: Enhanced PM2.5 pollution in China due to aerosol-cloud interactions, Sci. Rep., 7, 4453, https://doi.org/10.1038/s41598-017-04096-8, 2017.
Zhao, C. and Zhang, M. S.: mszhang96/wrfchem_ustc: WRF-Chem_MEGANv3.0 (v1.0), Zenodo [code], https://doi.org/10.5281/zenodo.4663508, 2021.
Zhao, C., Liu, X., Leung, L. R., Johnson, B., McFarlane, S. A., Gustafson Jr., W. I., Fast, J. D., and Easter, R.: The spatial distribution of mineral dust and its shortwave radiative forcing over North Africa: modeling sensitivities to dust emissions and aerosol size treatments, Atmos. Chem. Phys., 10, 8821–8838, https://doi.org/10.5194/acp-10-8821-2010, 2010.
Zhao, C., Liu, X., Ruby Leung, L., and Hagos, S.: Radiative impact of mineral dust on monsoon precipitation variability over West Africa, Atmos. Chem. Phys., 11, 1879–1893, https://doi.org/10.5194/acp-11-1879-2011, 2011.
Zhao, C., Liu, X., and Leung, L. R.: Impact of the Desert dust on the summer monsoon system over Southwestern North America, Atmos. Chem. Phys., 12, 3717–3731, https://doi.org/10.5194/acp-12-3717-2012, 2012.
Zhao, C., Chen, S., Leung, L. R., Qian, Y., Kok, J. F., Zaveri, R. A., and Huang, J.: Uncertainty in modeling dust mass balance and radiative forcing from size parameterization, Atmos. Chem. Phys., 13, 10733–10753, https://doi.org/10.5194/acp-13-10733-2013, 2013a.
Zhao, C., Leung, L. R., Easter, R., Hand, J., and Avise, J.: Characterization of speciated aerosol direct radiative forcing over California, J. Geophys. Res.-Atmos., 118, 2372–2388, https://doi.org/10.1029/2012jd018364, 2013b.
Zhao, C., Hu, Z., Qian, Y., Ruby Leung, L., Huang, J., Huang, M., Jin, J., Flanner, M. G., Zhang, R., Wang, H., Yan, H., Lu, Z., and Streets, D. G.: Simulating black carbon and dust and their radiative forcing in seasonal snow: a case study over North China with field campaign measurements, Atmos. Chem. Phys., 14, 11475–11491, https://doi.org/10.5194/acp-14-11475-2014, 2014.
Zhao, C., Huang, M., Fast, J. D., Berg, L. K., Qian, Y., Guenther, A., Gu, D., Shrivastava, M., Liu, Y., Walters, S., Pfister, G., Jin, J., Shilling, J. E., and Warneke, C.: Sensitivity of biogenic volatile organic compounds to land surface parameterizations and vegetation distributions in California, Geosci. Model Dev., 9, 1959–1976, https://doi.org/10.5194/gmd-9-1959-2016, 2016.
Zhang, M., Zhao, C., Yang, Y., Du, Q., Shen, Y., Lin, S., Gu, D., Su, W., and Liu, C.: Modeling sensitivities of BVOCs to different versions of MEGAN emission schemes in WRF-Chem (v3.6) and its impacts over eastern China, Geosci. Model Dev., 14, 6155–6175, https://doi.org/10.5194/gmd-14-6155-2021, 2021.
Zheng, B., Tong, D., Li, M., Liu, F., Hong, C., Geng, G., Li, H., Li, X., Peng, L., Qi, J., Yan, L., Zhang, Y., Zhao, H., Zheng, Y., He, K., and Zhang, Q.: Trends in China's anthropogenic emissions since 2010 as the consequence of clean air actions, Atmos. Chem. Phys., 18, 14095–14111, https://doi.org/10.5194/acp-18-14095-2018, 2018.
Zhou, T. J., Gong, D. Y., Li, J., and Li, B.: Detecting and understanding the multi-decadal variability of the East Asian Summer Monsoon – Recent progress and state of affairs, Meteorol. Z., 18, 455–467, https://doi.org/10.1127/0941-2948/2009/0396, 2009.
Zhu, Y. L., Wang, H. J., Zhou, W., and Ma, J. H.: Recent changes in the summer precipitation pattern in East China and the background circulation, Clim. Dynam., 36, 1463–1473, https://doi.org/10.1007/s00382-010-0852-9, 2011.
Zhuang, B. L., Li, S., Wang, T. J., Liu, J., Chen, H. M., Chen, P. L., Li, M. M., and Xie, M.: Interaction between the Black Carbon Aerosol Warming Effect and East Asian Monsoon Using RegCM4, J. Climate, 31, 9367–9388, https://doi.org/10.1175/Jcli-D-17-0767.1, 2018.