the Creative Commons Attribution 4.0 License.
the Creative Commons Attribution 4.0 License.
 | 03 Mar 2022
Extreme events representation in CMCC-CM2 standard and high-resolution general circulation models
Enrico Scoccimarro
Daniele Peano
Silvio Gualdi
Alessio Bellucci
Tomas Lovato
Pier Giuseppe Fogli
Antonio Navarra
The recent advancements in climate modeling partially build on the improvement of horizontal resolution in different components of the simulating system. A higher resolution is expected to provide a better representation of the climate variability, and in this work we are particularly interested in the potential improvements in representing extreme events of high temperature and precipitation. The two versions of the Centro Euro-Mediterraneo sui Cambiamenti Climatici (CMCC-CM2) model used here adopt the highest horizontal resolutions available within the last family of the global coupled climate models developed at CMCC to participate in the Coupled Model Intercomparison Projects, Phase 6 (CMIP6) effort.
The main aim of this study is to document the ability of the CMCC-CM2 models to represent the spatial distribution of extreme events of temperature and precipitation, under the historical period, comparing model results to observations, the European Centre for Medium-Range Weather Forecasts (ECMWF) reanalysis (ERA5), multi-source weighted-ensemble precipitation (MSWEP) and Climate Hazards Group infrared precipitation with station data (CHIRPS) observations. For a more detailed evaluation we use both 6-hourly and daily time series, to compute indices representative of intense and extreme conditions.
In terms of mean climate, the two models are able to realistically reproduce the main patterns of temperature and precipitation. The high resolution version (∘ horizontal resolution) of the atmospheric model provides better results than the standard resolution one (1°), not only in terms of means but also in terms of intense and extreme events of temperature defined at daily and 6-hourly frequencies. This is also the case of average and intense precipitation. On the other hand the extreme precipitation is not improved by the adoption of a higher horizontal resolution.
- Article
(12781 KB) - Full-text XML
-
Supplement
(7134 KB) - BibTeX
- EndNote


An extreme climate event can have an impact on human activities, either as direct and indirect damages and, unfortunately also as loss of human life. For this reason it is very relevant to investigate the ability of general circulation models (GCMs) to simulate extreme events and to understand how the changing climate is influencing their distribution, frequency and location. Simulations of GCMs under the historical climate radiative forcing have been assessed in previous generations of the Coupled Model Intercomparison Projects (CMIP; Flato et al., 2013) and, more recently for CMIP6 (Eyring et al., 2016). Within CMIP6 the High Resolution Model Intercomparison Project protocol (HighResMIP, Haarsma et al., 2016) was designed to understand the role of the horizontal resolution in improved process representation in all components of the climate system. In this paper, we present an analysis based on two versions of the GCM developed at the Centro Euro-Mediterraneo sui Cambiamenti Climatici (CMCC-CM, Cherchi et al., 2019) that we use for two simulations of the historical climate (1950–2014) differing only in their atmospheric horizontal resolution: HR with a horizontal resolution of 1∘ and VHR with a resolution of of a degree. The two models are described in detail in the next section.
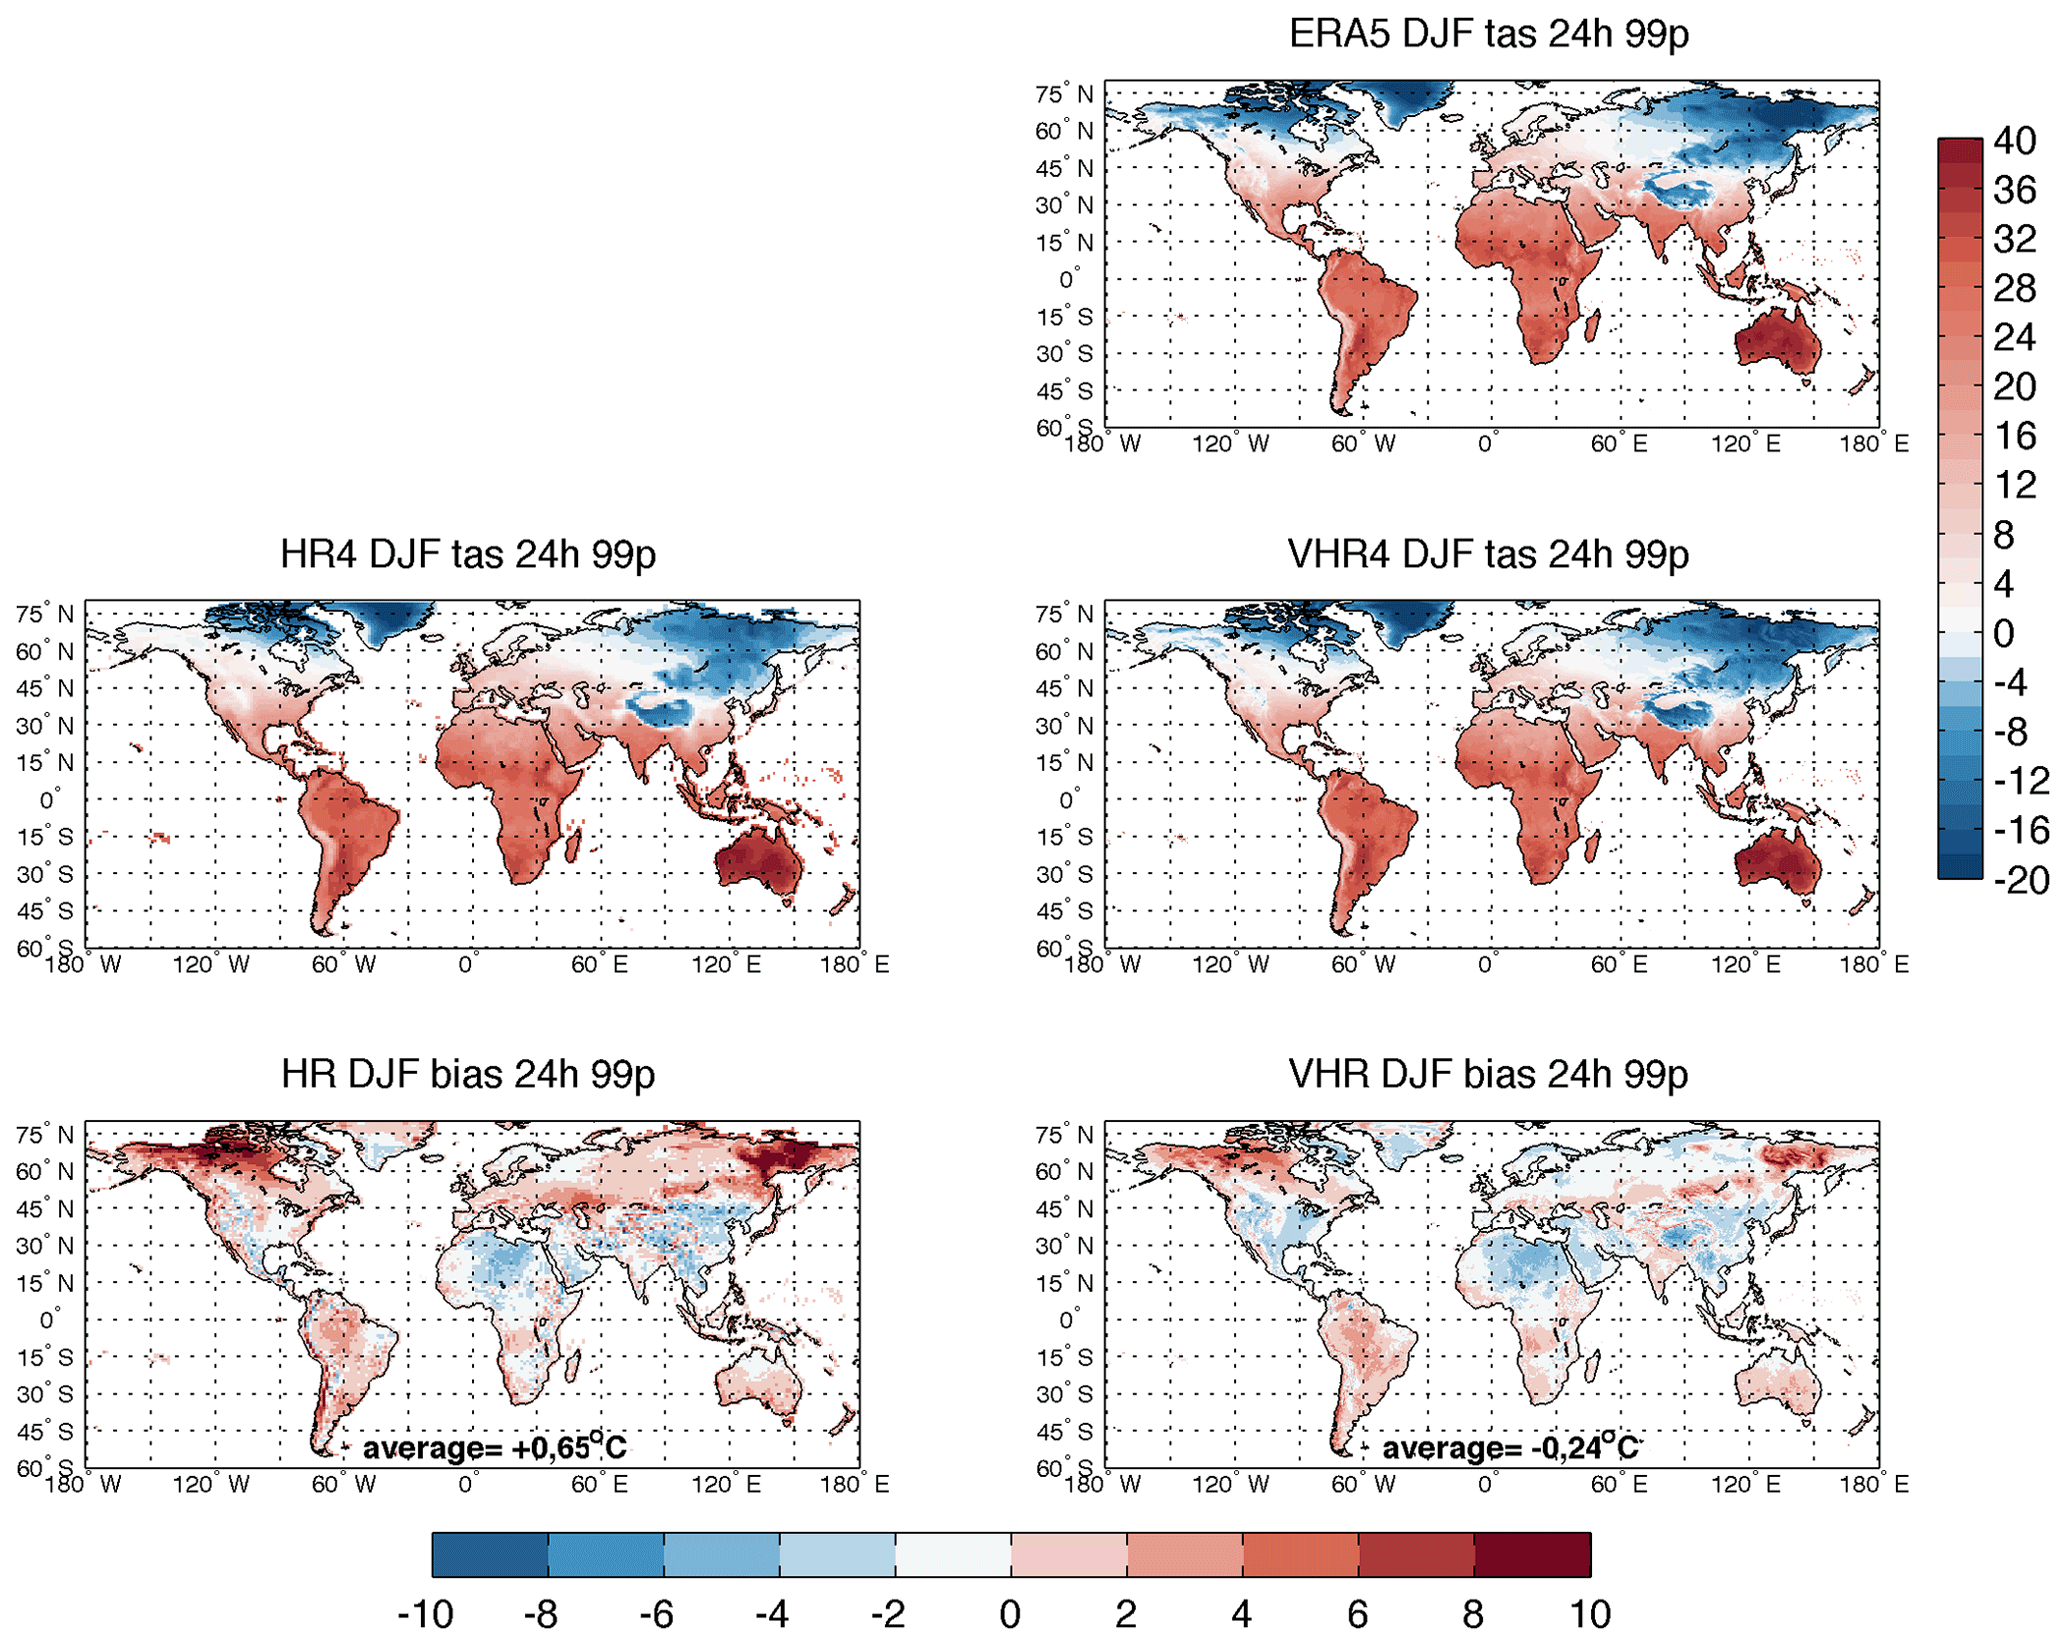
Figure 1Winter (December, January, February, DJF) extreme temperature (99th percentile, 99p) computed at the daily frequency. Upper panel shows ERA5 results. Central panels show model results (HR on the left and VHR on the right) and lower panels show the relative model bias. Units are [∘C]. Vertical color bar refers to the three upper panels, while the horizontal color bar refers to the two bottom panels.
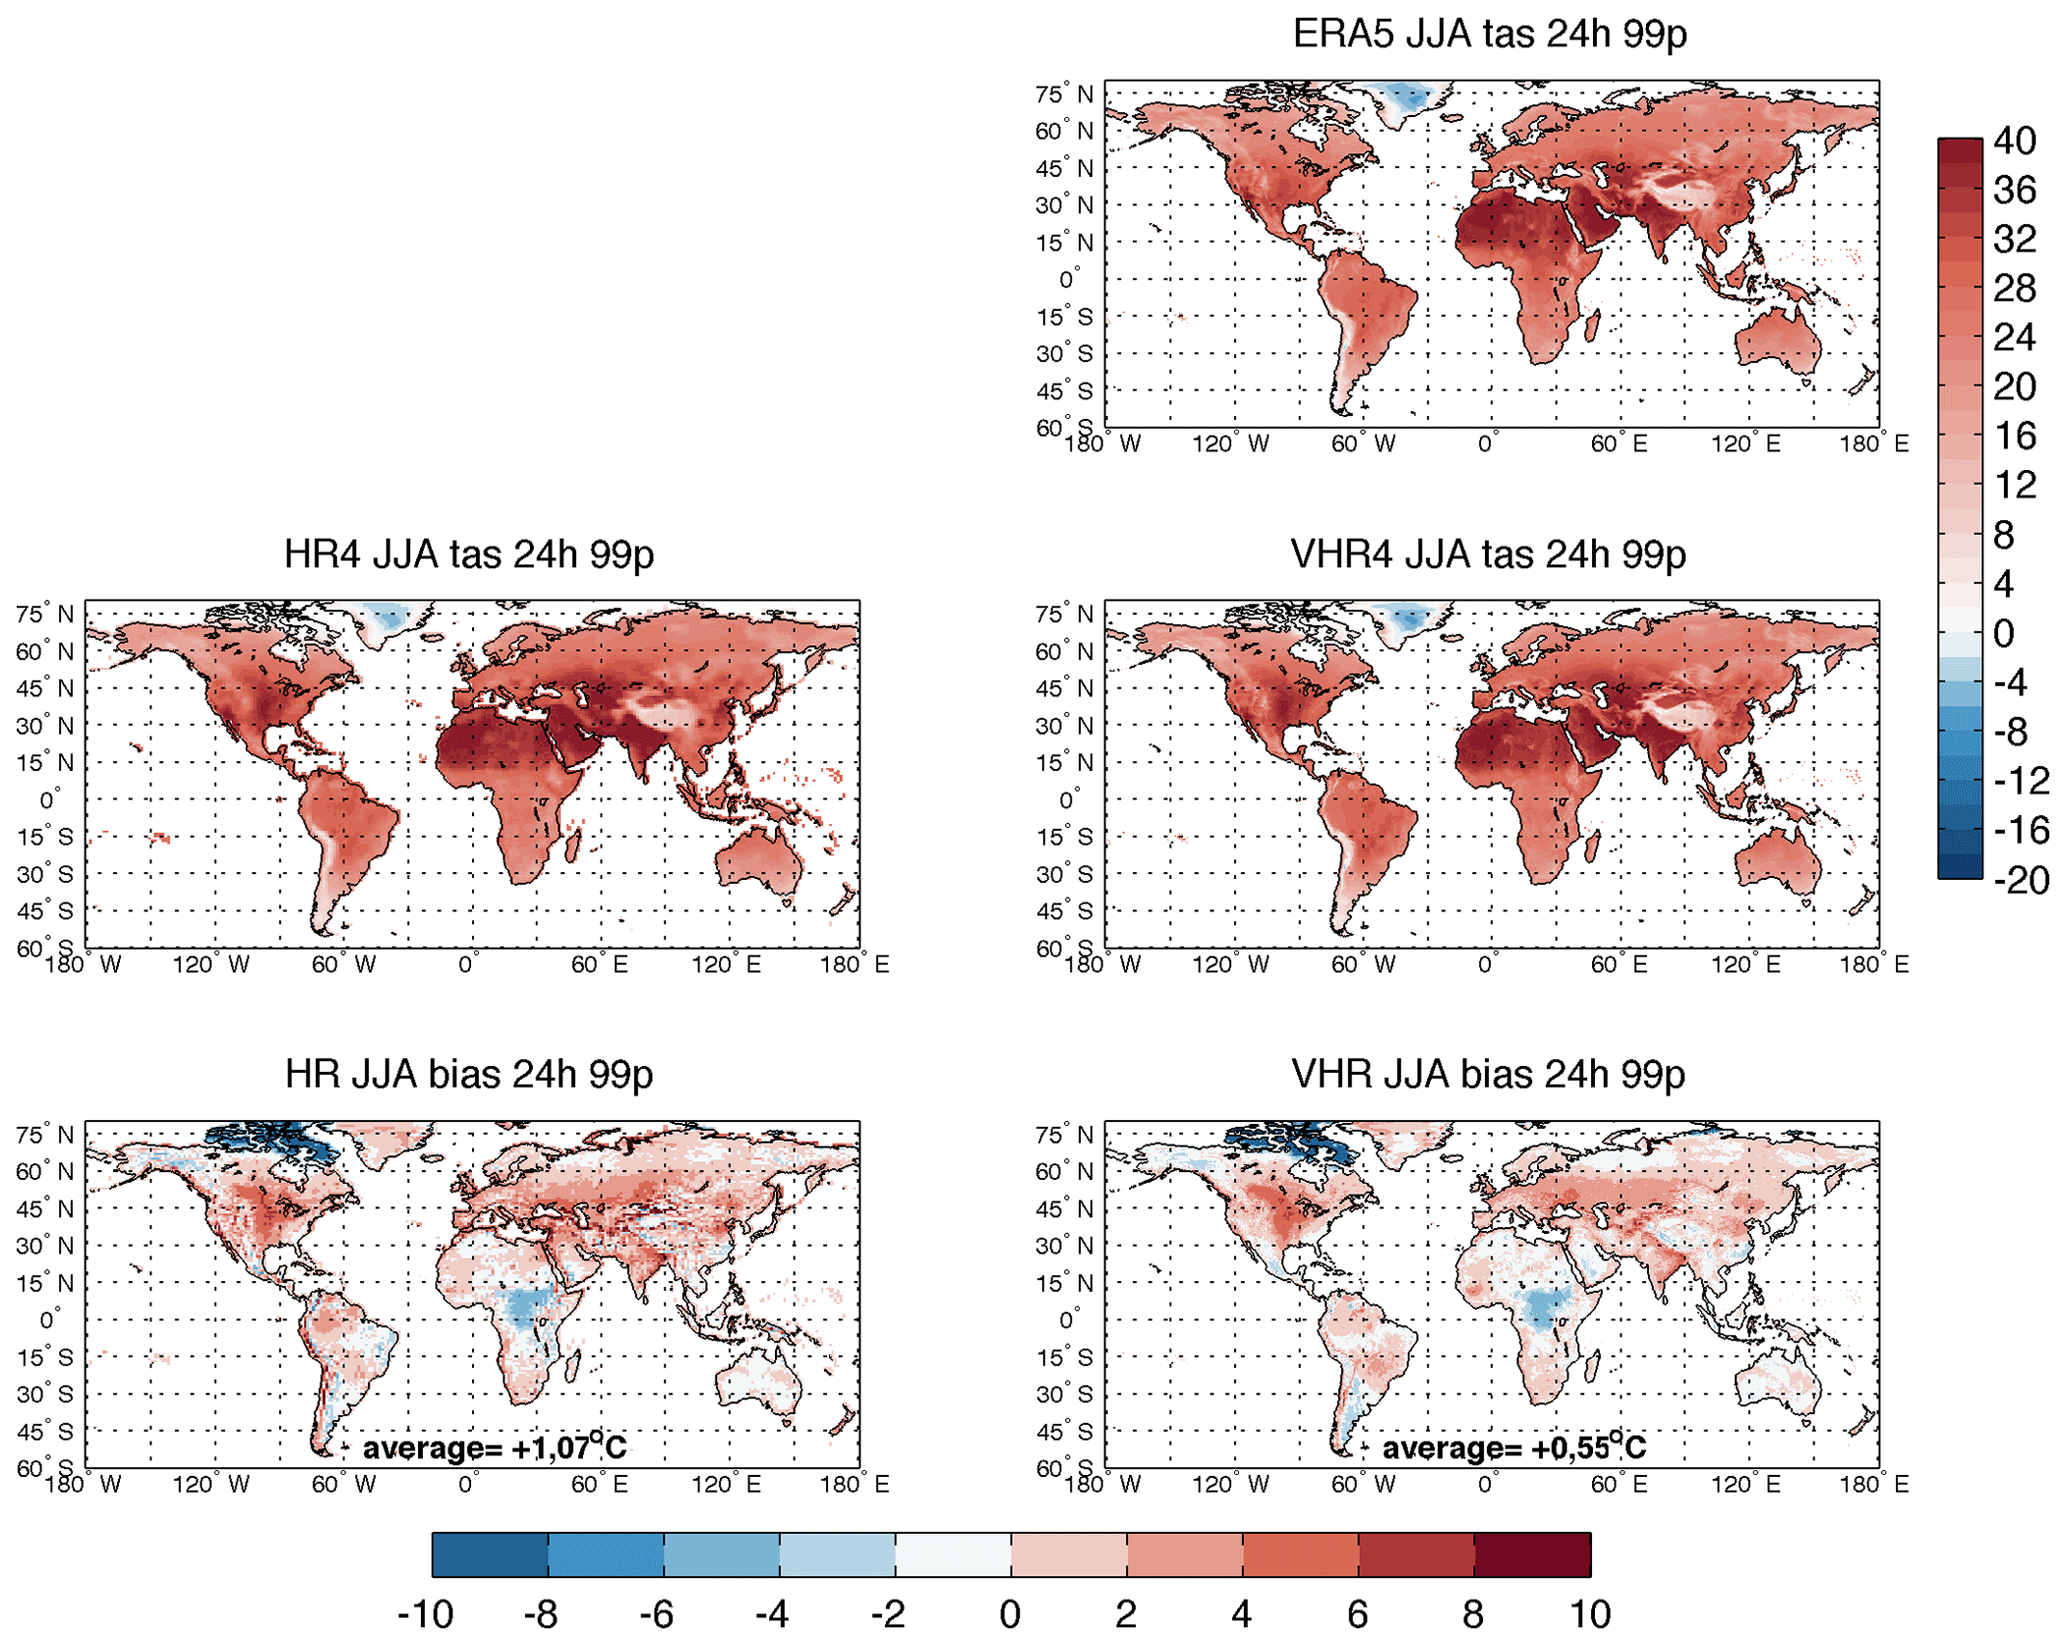
Figure 2Summer (June, July, August, JJA) extreme temperature (99th percentile, 99p) computed at the daily frequency. Upper panel shows ERA5 results. Central panels show model results (HR on the left and VHR on the right) and lower panels show the relative model bias. Units are [∘C]. Vertical color bar refers to the three upper panels, while the horizontal color bar refers to the two bottom panels.
The difference between the results obtained with the two versions of the model allows us to evaluate the impact of the model HR on the temporal distribution of temperature and precipitation events compared to observations. It has been shown that the HR can affect the representation of extreme events in state-of-the-art climate models (Van Haren et al., 2015; Iles et al., 2020). Furthermore, Demory et al. (2020) have shown that high-resolution models, when implemented with a resolution similar to VHR, achieve SKILLS comparable to state-of-the-art regional climate models in reproducing precipitation distributions over Europe. However, most of the analyses on extreme events employ relatively low frequency data (typically daily), and short-duration high-intensity precipitation events can easily escape detection if high-frequency data are not used (Meredith et al., 2020; Scoccimarro et al., 2015).
Regarding the extremely high temperature representation, based on data at the daily frequency it has been shown that GCMs tend to have warm bias over most land areas (Li et al., 2021) and the HR plays a minor role in affecting the bias, with respect to the role played in the extreme precipitation representation (Kharin et al., 2013; Wei et al., 2019).
Regarding the extreme precipitation representation in GCMs, based on simulations from a single model, some improvement in SKILL at higher resolution for some measures of extreme precipitation over certain regions of the globe have been found in the past (Wehner et al., 2014; Kopparla et al., 2013). Only recently, multi-model assessments on this topic have been done, confirming that increasing the horizontal resolution to of a degree (the highest adopted by the model object of this study), the magnitude of simulated daily (Bador et al., 2020) and sub-daily precipitation (Wehner et al., 2021) extremes is increased. On the other hand this is not associated with a systematic improvement in the simulation of precipitation extremes when compared to observations and, quantitatively, at the global scale the intensification of precipitation extremes at increased resolution varies substantially from model to model (Bador et al., 2020). Also, for grid point GCMs (as opposed to spectral GCMs), the fraction of land precipitation increases, largely due to better resolution of orography (Vannière et al., 2019; Terai et al., 2018; Demory et al., 2014).
In this paper we present both a daily and a high-frequency analysis using 6-hourly data from the experiments, comparing model results to data from a reanalysis dataset with comparable horizontal resolution (ERA5, Hersbach et al., 2020) and two observational precipitation datasets, such as multi-source weighted-ensemble precipitation (MSWEP) (Beck et al., 2019) and Climate Hazards Group infrared precipitation with station data (CHIRPS) (Funk et al., 2015). The importance of evaluating extreme events at the sub-daily scale resides in the importance of such events on human health and over both urban and rural environments (Wehner et al., 2021).
The work is organized as follows: Sect. 2 describes the data and the methodology adopted, Sects. 3 and 4 describe the evaluation of model ability in representing the distribution of temperature and precipitation events, respectively, and Sect. 5 summarizes and concludes the work.
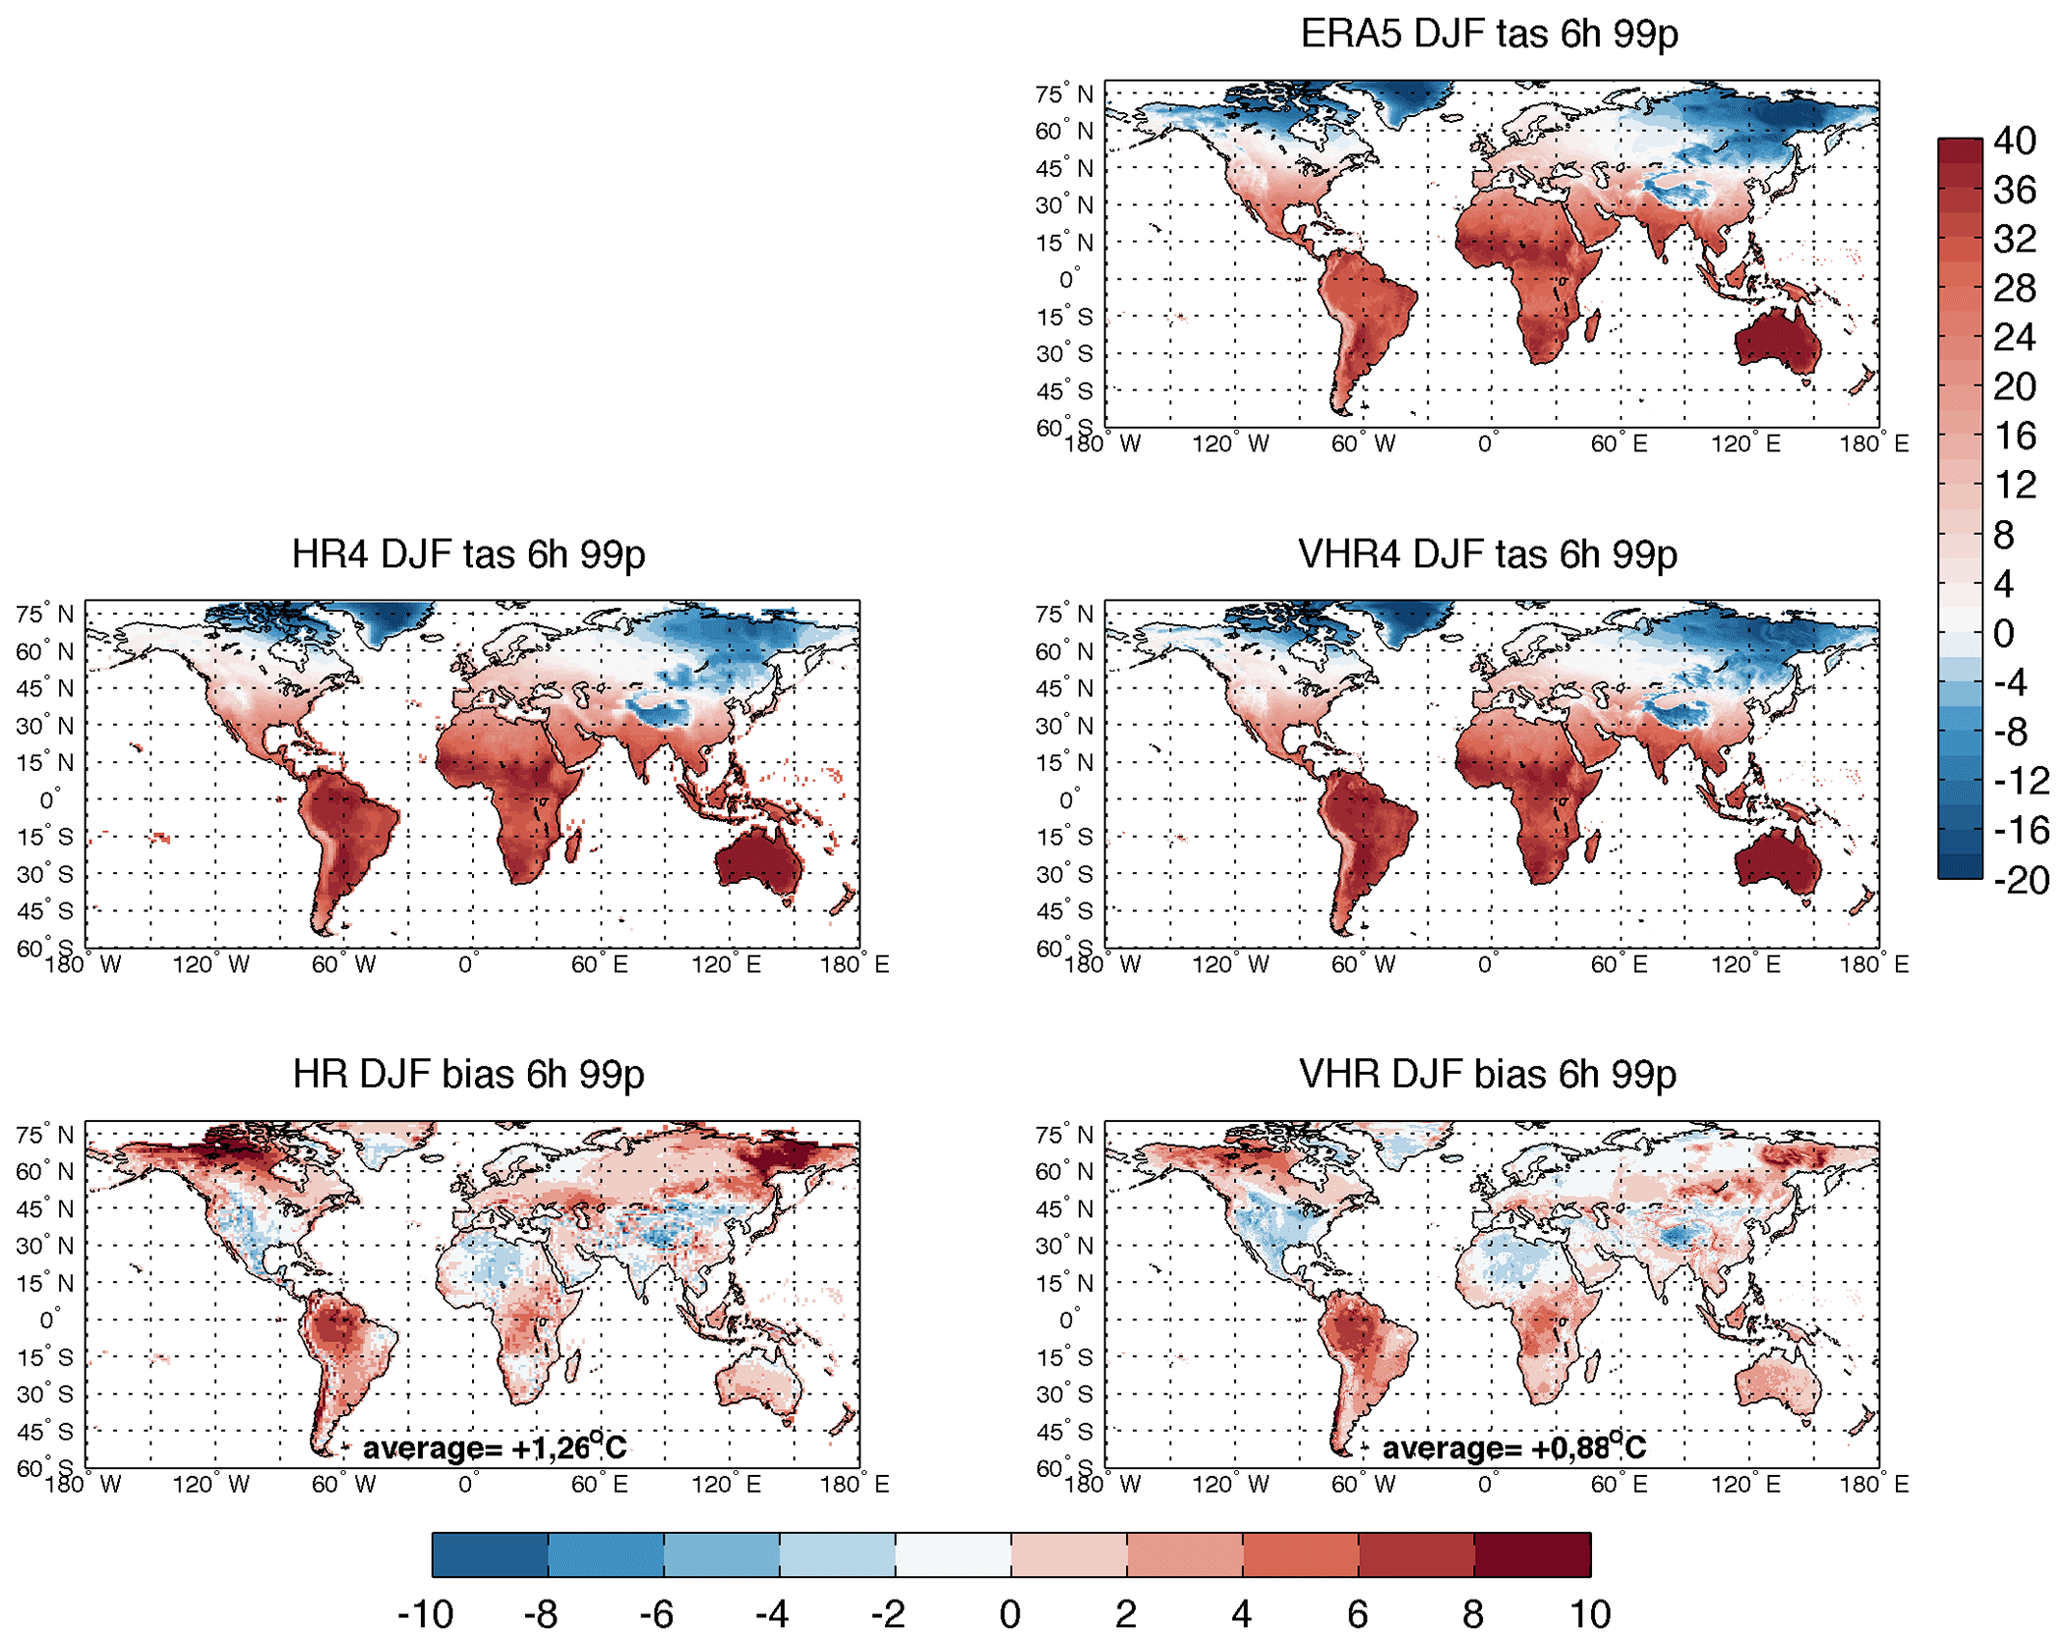
Figure 3Winter (DJF) extreme temperature (99th percentile, 99p) computed at the 6-hourly frequency. Upper panel shows ERA5 results. Central panels show model results (HR on the left and VHR on the right) and lower panels show the relative model bias. Units are [∘C]. Vertical color bar refers to the three upper panels, while the horizontal color bar refers to the two bottom panels.
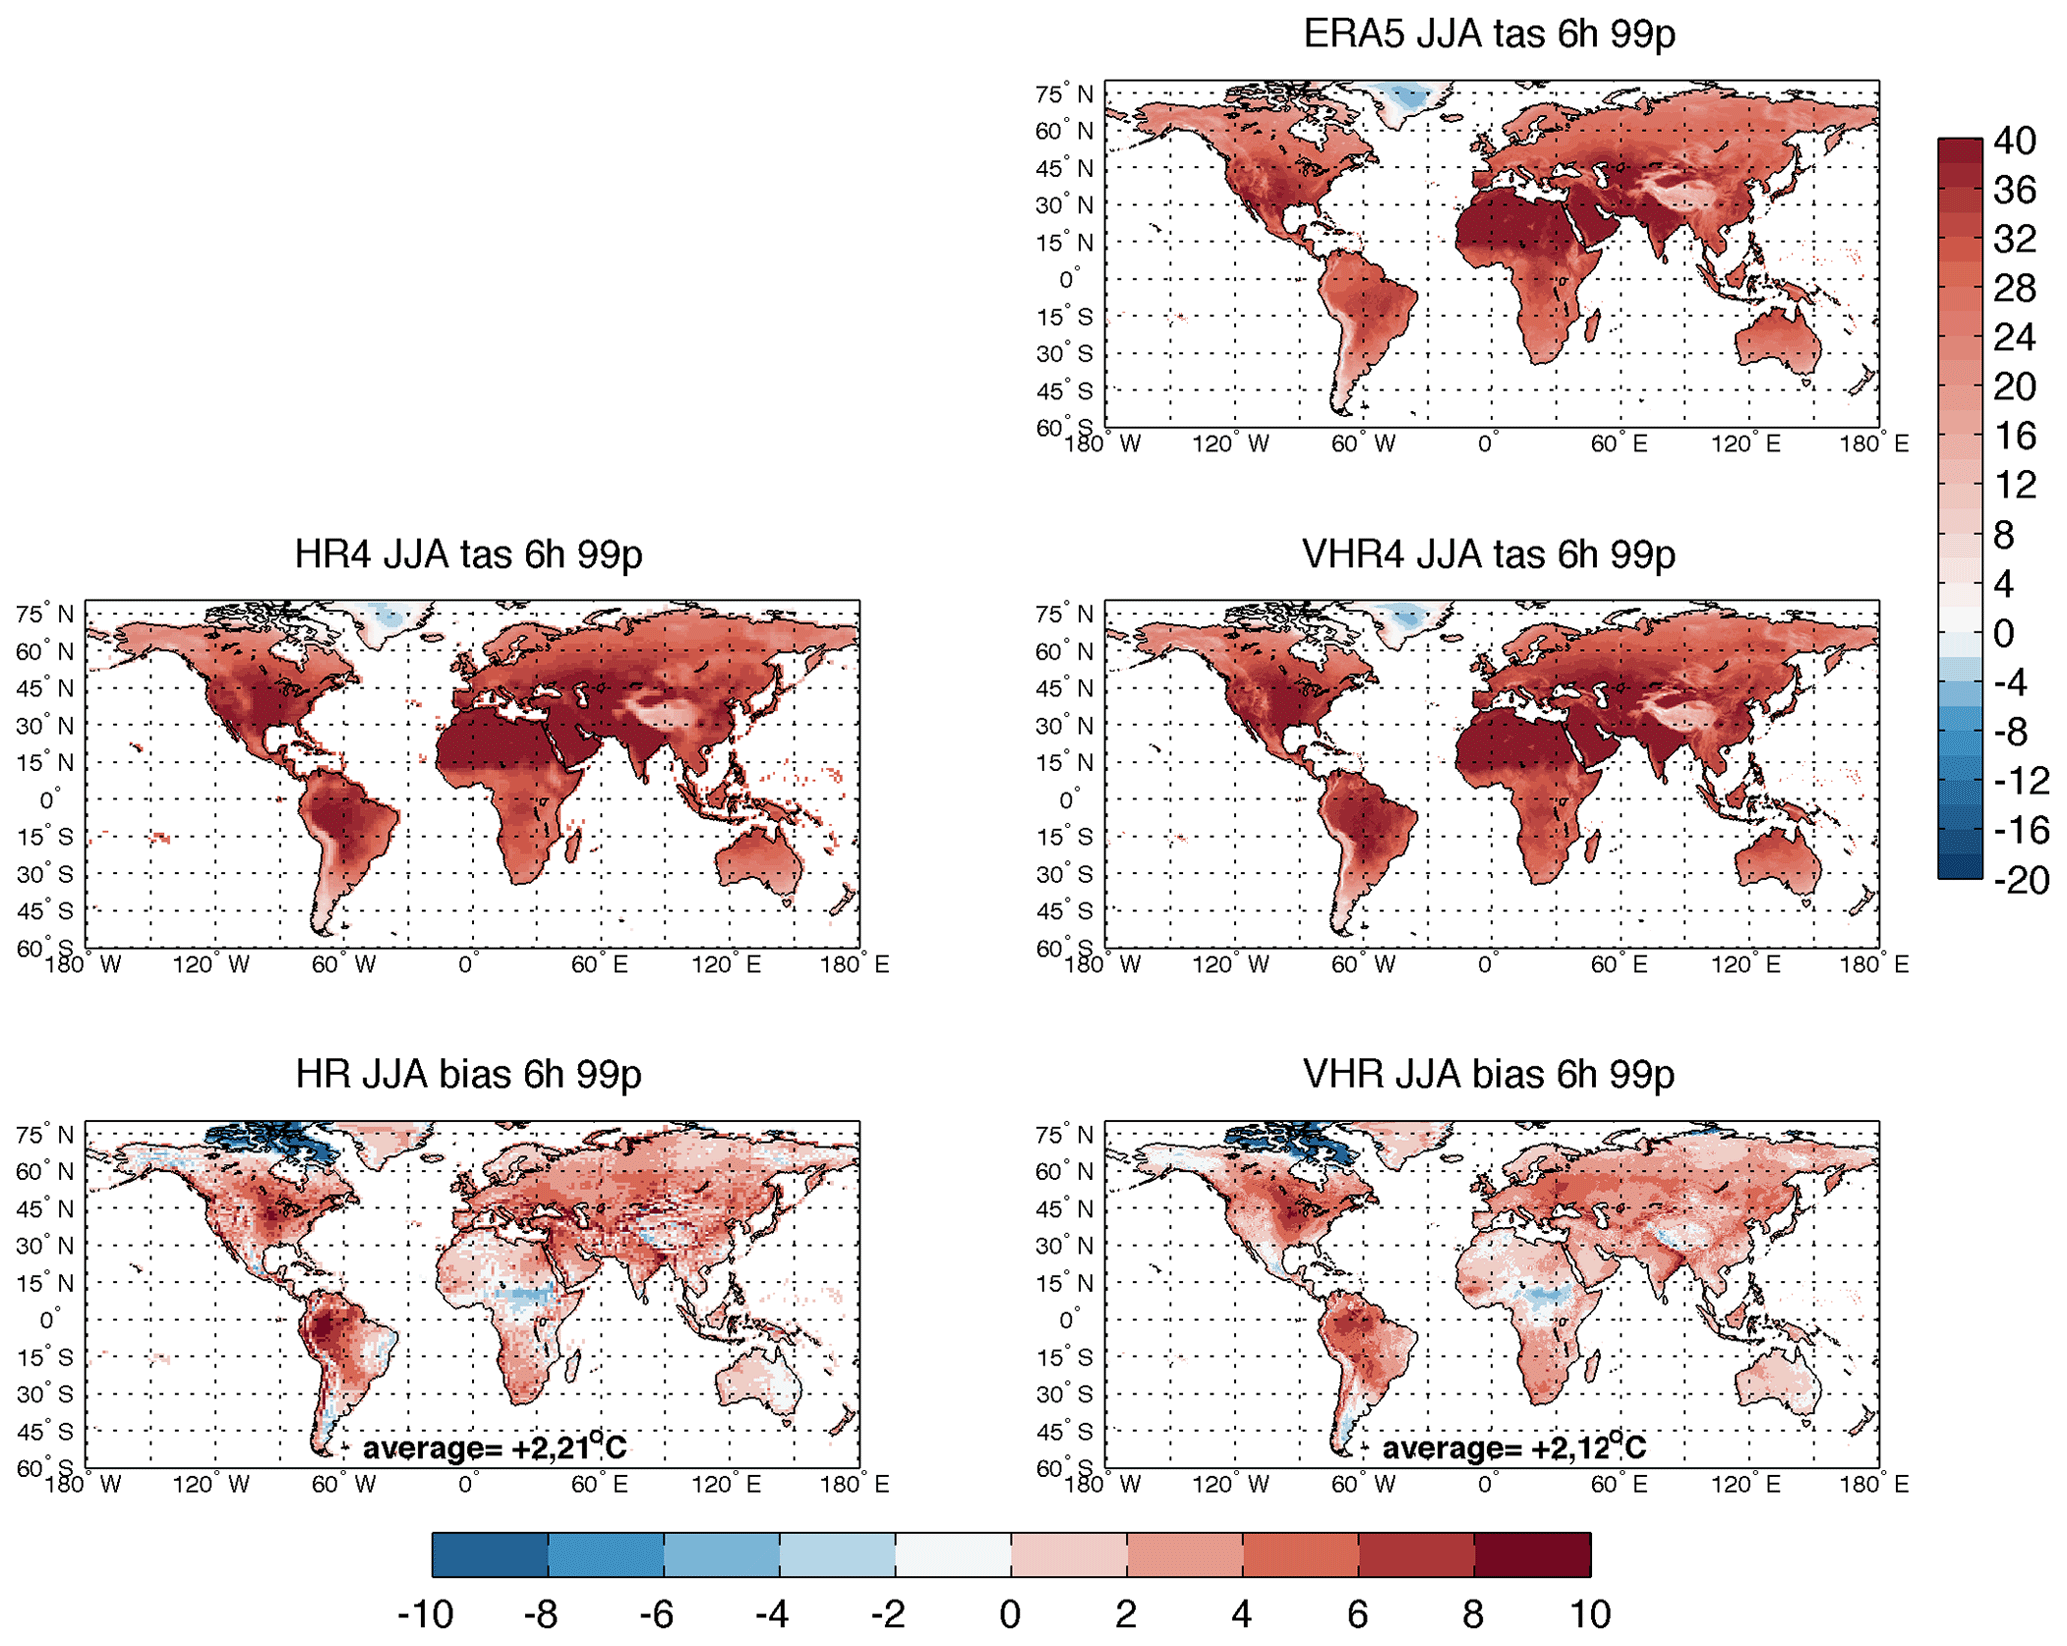
Figure 4Summer (JJA) extreme temperature (99th percentile, 99p) computed at the 6-hourly frequency. Upper panel shows ERA5 results. Central panels show model results (HR on the left and VHR on the right) and lower panels show the relative model bias. Units are [∘C]. Vertical color bar refers to the three upper panels, while the horizontal color bar refers to the two bottom panels.

Figure 5Winter (DJF) extreme precipitation (99th percentile, 99p) computed at the daily frequency. Upper panel shows MSWEP observational results. Central panels show model results (HR on the left and VHR on the right) and lower panels show the relative model bias. Units are [mm d−1]. Vertical color bar refers to the three upper panels, while the horizontal color bar refers to the two bottom panels.
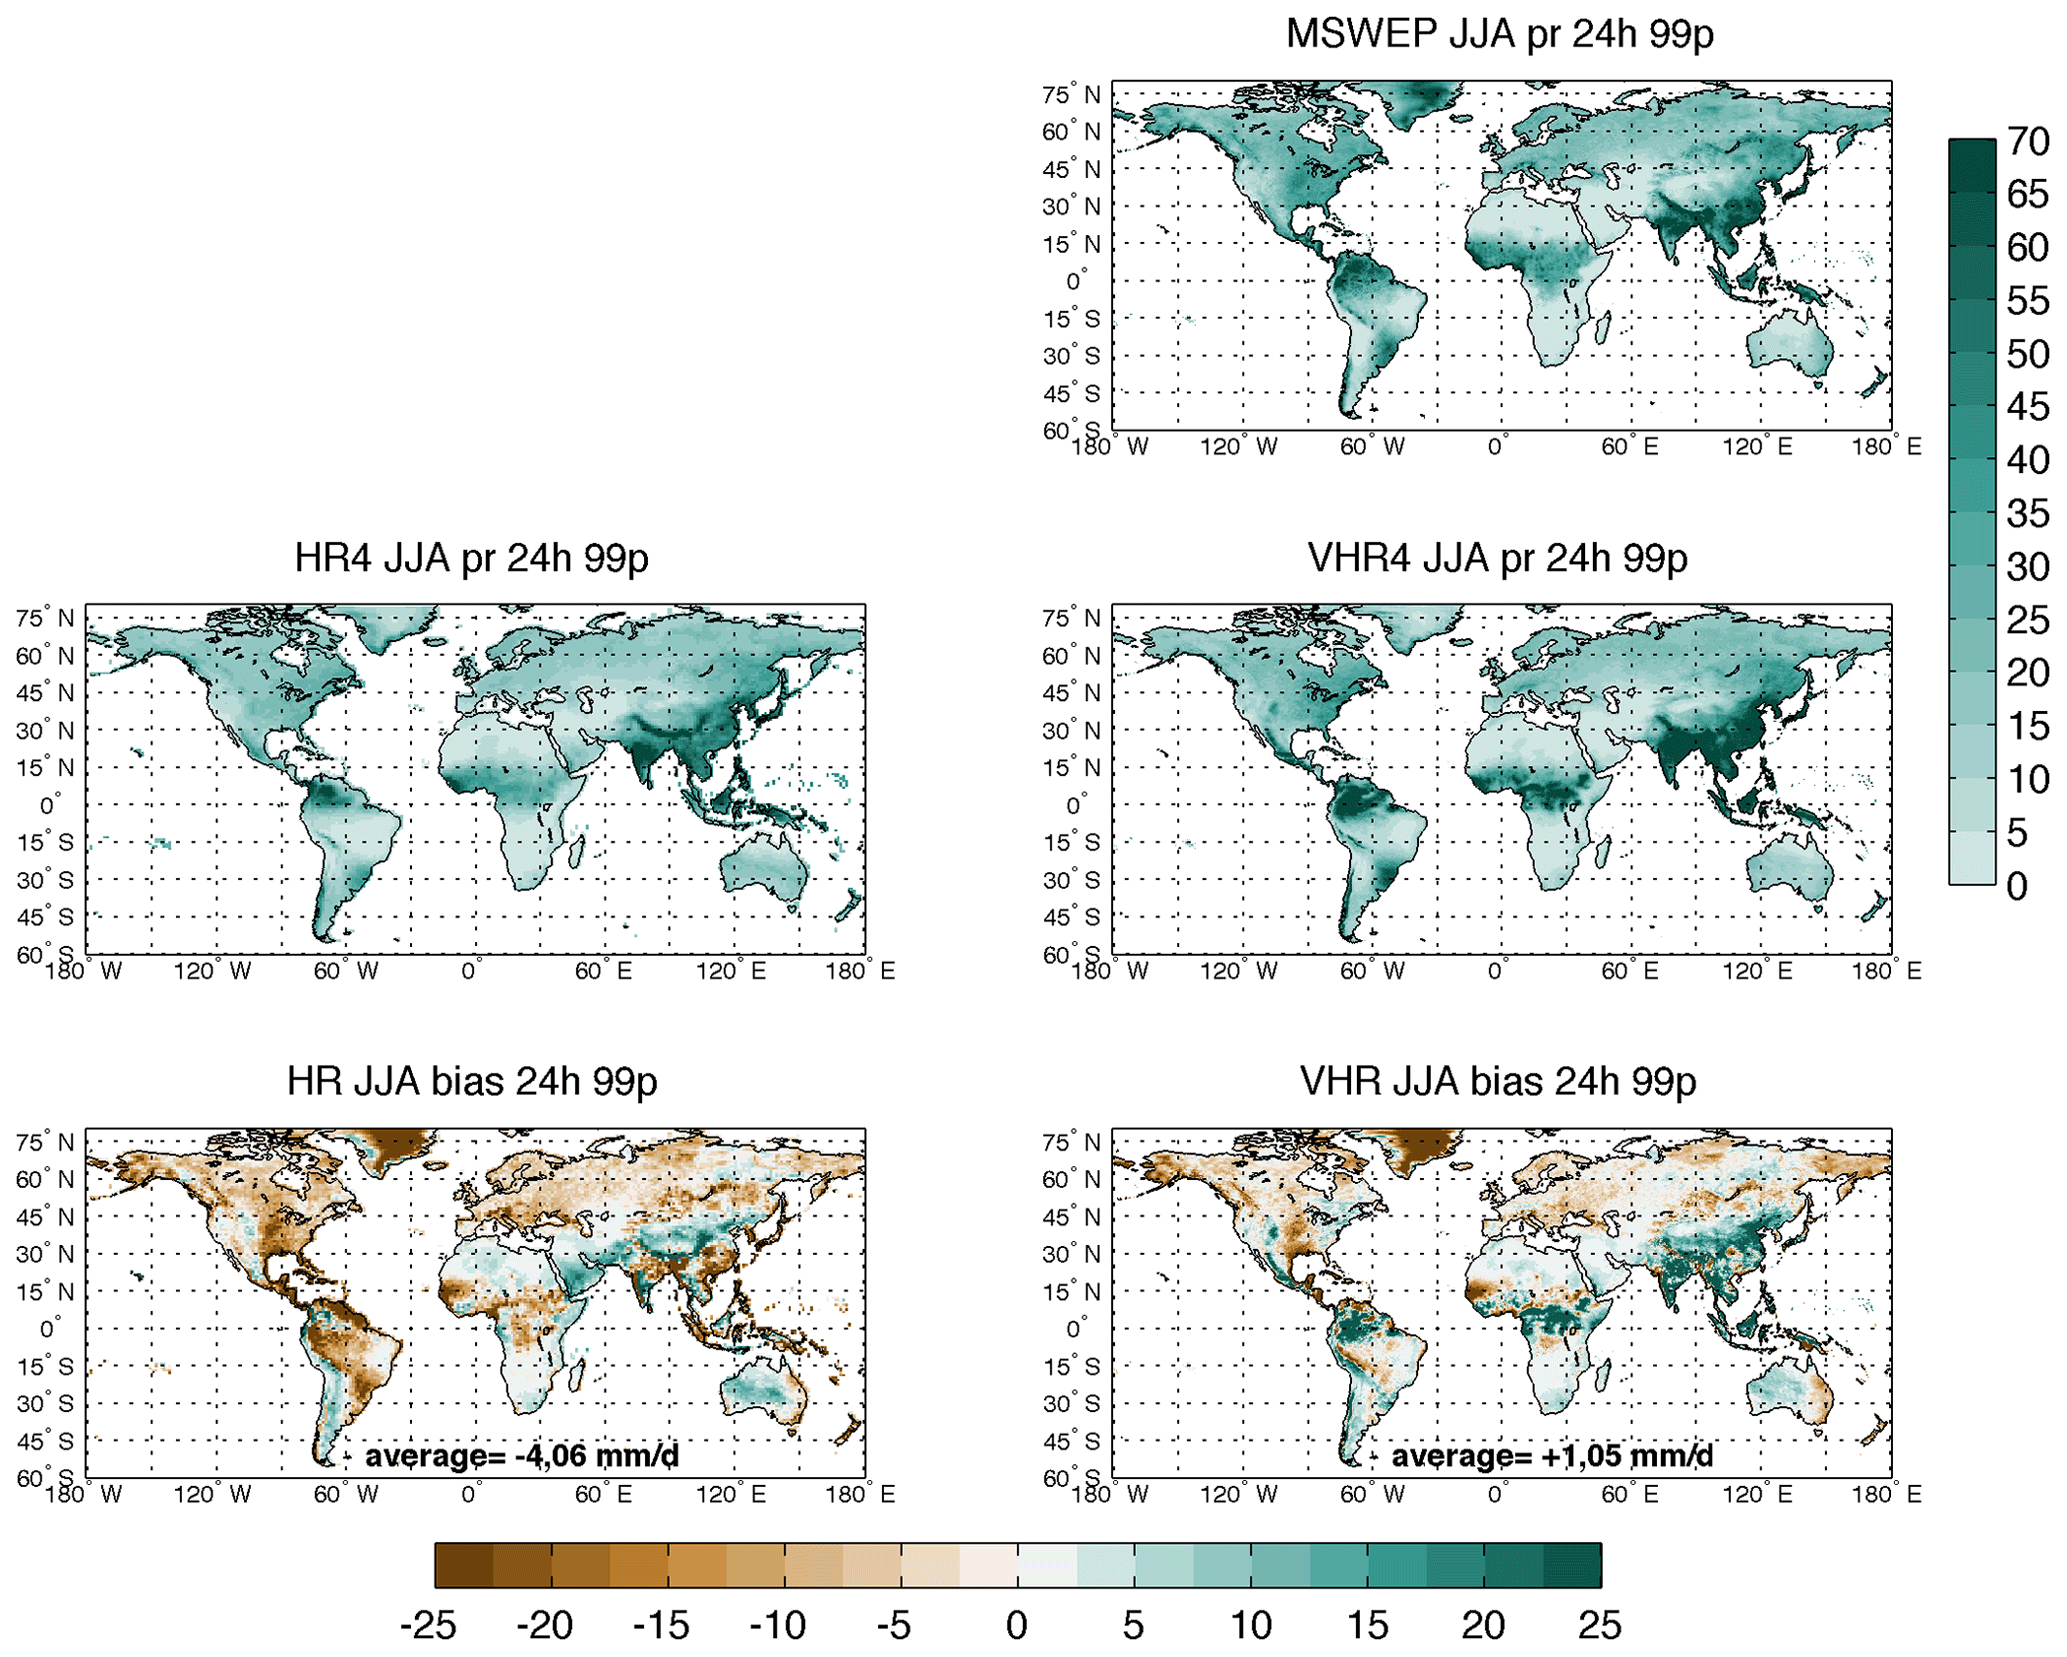
Figure 6Summer (JJA) extreme precipitation (99th percentile, 99p) computed at the daily frequency. Upper panel shows MSWEP observational results. Central panels show model results (HR on the left and VHR on the right) and lower panels show the relative model bias. Units are [mm d−1]. Vertical color bar refers to the three upper panels, while the horizontal color bar refers to the two bottom panels.
2.1 Numerical experiments
The CMCC general circulation model has been developed in several configurations (Cherchi et al., 2019). The model uses as atmospheric module the community atmosphere model (CAM) atmospheric component (CAM4, Neale et al., 2010) in its grid point configuration. We will not go in a detailed description here, but since it is worthwhile to mention for our discussion on precipitation biases, the deep convection scheme is the one developed by Zhang and McFarlane (1995), modified following Richter and Rasch (2008) and Raymond and Blith (1986, 1992). The scheme is based on a plume ensemble approach where it is assumed that an ensemble of convective scale updrafts may exist whenever the atmosphere is conditionally unstable in the lower troposphere. Moist convection occurs only when there is convective available potential energy (CAPE) for which parcel ascent from the sub-cloud layer acts to destroy the CAPE at an exponential rate using a specified adjustment time scale. In other words the deep convection scheme is triggered based on a minimum positive threshold of CAPE,the same as in the standard version of the CAM5 model (Wang and Zhang, 2013). The two models that are the object of this study differ only in the horizontal resolution of their atmospheric component (CAM4) that is one degree in HR, the standard resolution one, and ∘ in VHR, the high resolution one. The ocean and sea-ice components are the same in HR and VHR models: a ∘ HR version for both ocean (NEMO3.6, Madec and the NEMO team, 2016) and sea-ice (CICE4, Hunke and Lipscomb, 2008). The land model (CLM4.5, Oleson et al., 2013) is implemented with the atmospheric model grid. The basis of the coupling between the different components is described in Fogli and Iovino (2014). The single components of the coupled model are described in detail in Cherchi et al. (2019); additional studies based on last generation CMCC GCMs can be found in Scoccimarro et al. (2017a, 2020), Bellucci et al. (2021). No changes are applied in terms of parameterization choices and relative tuning parameters moving from HR to VHR to be compliant with the HighResMIP protocol. Also, the two model versions use the same number of vertical levels in both atmosphere (26) and ocean (50) components. The complete set of experiments run with these two models is described in Haarsma et al. (2016). In the current analysis we investigate the hist-1950 HighResMIP experiment as described in Sect. 2.3.
2.2 Reanalyses and observations for comparison
The model performance in representing the temperature distribution is evaluated by comparing results to the European Centre for Medium Range Weather Forecasts (ECMWF) reanalyses (ERA5, Hersbach et al., 2020; Andersson and Thepaut, 2008), with 137 hybrid sigma/pressure (model) levels in the vertical, and the top level at 0.01 hPa. The temperature data used in the paper (2m temperature, hereafter “temperature”) can be obtained from the Copernicus Data Store (CDS) at https://cds.climate.copernicus.eu (last access: 15 July 2021) up to hourly frequency. The HR in ERA5 is about 0.28∘, close to the one of the higher (VHR) resolution model employed here (∘). It is important to note that the improvement of ERA5 with respect to the previous ERA-Interim (Dee et al., 2011) product is due not only to the increased resolution but also to the addition of new integrated observation and aircraft data covering the recent decades, assimilated by the 4D-Var algorithm. Since there are many known issues with ERA5 precipitation (Rivoire et al., 2021; Hu and Franzke, 2020; Crosset et al., 2020), for the evaluation of the model performance in representing the precipitation distribution, we build on MSWEP version 2 observational dataset (Beck et al., 2019): The MSWEP global precipitation dataset is available at a 3-hourly temporal resolution, covering the period from 1979 to the near present, with a horizontal resolution of 0.1∘. The dataset takes advantage of the complementary strengths of gauge-based, satellite-based, and reanalysis-based data to provide reliable precipitation estimates over the globe.
Since we aim to characterize different types of extreme events, we consider both 6-hourly and daily time series for the computation of the percentiles (see Sect. 2.3) for the chosen climate parameters.
For a more exhaustive evaluation of the precipitation distribution, we also take advantage of the CHIRPS daily observational dataset. The version 2.0 of the CHIRPS database comprises a quasi-global (50∘ S–50∘ N, 180∘ E–180∘ W) domain, at ∘ resolution, and 1981 to near present gridded precipitation daily time series. This dataset merges three types of information: global climatology, satellite estimates, and in situ observations (Funk et al., 2015).
2.3 Methodology
The period used to compare the simulated temperature (tas = temperature of the air at the surface) distribution to the observations is 1950–2014. On the other hand, due to the shorter period available for the MSWEP and CHIRPS datasets, the precipitation (pr) distribution is evaluated over the common period between the observations and the historical model run 1981–2014. This time period is sufficiently long to capture the temporal variability at the global scale (Schindler et al., 2015). Typically, the warm extremes are computed based on maximum daily temperatures, but in this work we want to verify the potential improvements induced by the increased resolution in the representation of extreme temperature events defined at two different time frequencies (daily and 6-hourly). For this reason we investigate the distribution of daily and 6-hourly average temperature (tas), instead of maximum daily temperature.
Model averages and 99th/90th percentile (99p/90p hereafter) are computed on the native grid and then the results are compared to ERA5 or observational datasets, linearly interpolating the reanalysis (or observations) on the model grid. The kind of interpolation introduces very little differences in the fields (not shown). We denote events belonging to the 99p as “extreme events” and the ones belonging to the 90p as “intense events” (Scoccimarro et al., 2016). Two seasons are considered, December to February (DJF) and June to August (JJA) representative of the boreal winter and summer, respectively.
Temperature percentiles computed at the daily time frequency are obtained based on a sample of 5850 (90 d × 65 years) events, while the percentiles computed at the 6-hourly time frequency are obtained based on a sample of 23 400 (90 d × 65 years × 4; 6-hourly data in a day) events. Precipitation percentiles computed at the daily time frequency are obtained based on a sample of 3060 (90 d × 34 years) events, while the percentiles computed at the 6-hourly time frequency are obtained based on a sample of 12 240 (90 d × 34 years × 4; 6-hourly data in a day) events.
Temperature related parameters are expressed in degrees Celsius [∘C], and precipitation related parameters in [mm d−1]. When expressed as % fraction (Fig. S17 only) the precipitation is shown only for regions where the seasonal average of precipitation is higher than 0.5 mm d−1 to avoid misleading percentual differences over dry domains (Scoccimarro et al., 2013). The comparison with CHIRPS precipitation data is performed at the daily frequency only.
In this section modeled extreme temperature is compared to the ERA5 reanalysis. Figure 1 shows the DJF 99th percentile of ERA5 temperature time series (upper panel) at the daily frequency, together with model results (central panels), and relative biases (lower panels). Figure 2 shows the JJA season results following the same structure while Figs. 3 and 4 refer to 6-hourly statistics. Higher values for extreme events appear when focusing on the 6-hourly results, with maximum differences (up to 5 ∘C) along the Tropics and in particular over Central America, western India and Equatorial Africa during DJF (Fig. 1 compared to Fig. 3, upper panels) and over northern Africa, Saudi Arabia and western USA during JJA (Fig. 2 compared to Fig. 4, upper panels).
The daily based extreme temperature bias is shown in Figs. 1 (for DJF) and 2 (for JJA) for the HR and VHR models in the lower panels. The large positive DJF bias shown by the HR model at the high latitudes in the Northern Hemisphere, reaching 9 ∘C over Alaska, northern Canada and eastern Siberia (Fig. 1 lower left panel), is significantly reduced in the VHR model (Fig. 1, lower right panel). Also the positive HR bias in DJF over eastern Europe is more than halved in VHR, while the DJF negative biases over northern Africa and the Tibetan Plateau worsen moving to the higher resolution. The positive extreme temperature bias between 30 and 60∘ N shown by the HR model during JJA (Fig. 2 lower left panel) is partially reduced in VHR especially over Europe and Asia. Similarly, the 5 to 7 ∘C positive JJA bias over the western coast of South America in HR is halved in VHR. On the other hand, the negative JJA bias of about −8∘C over northeast Canada shown by the HR model is even worse in the VHR version, where a larger portion of the domain is subject to a bias of about −10∘C. This negative bias is also consistent with the tendency of the two versions of the CMCC-CM2 model to overestimate the sea-ice cover during summer over the Northern Hemisphere (not shown).
Moving to the 6-hourly based extreme events, the fraction of land affected by a positive bias higher than 5 ∘C is more pronounced compared to the daily statistics, especially for the HR model during JJA (Fig. 4). The positive bias over the northwestern part of South America, during JJA, reaches 9 ∘C in HR and is only partially reduced in VHR; during the same season the positive bias of the same order of magnitude over central and eastern USA is not improved by the increased resolution. Similar patterns, but less pronounced, are reflected on the average temperature, as shown in Supplement Figs. S1–S2, and intense events representation (Figs. S7–S10).
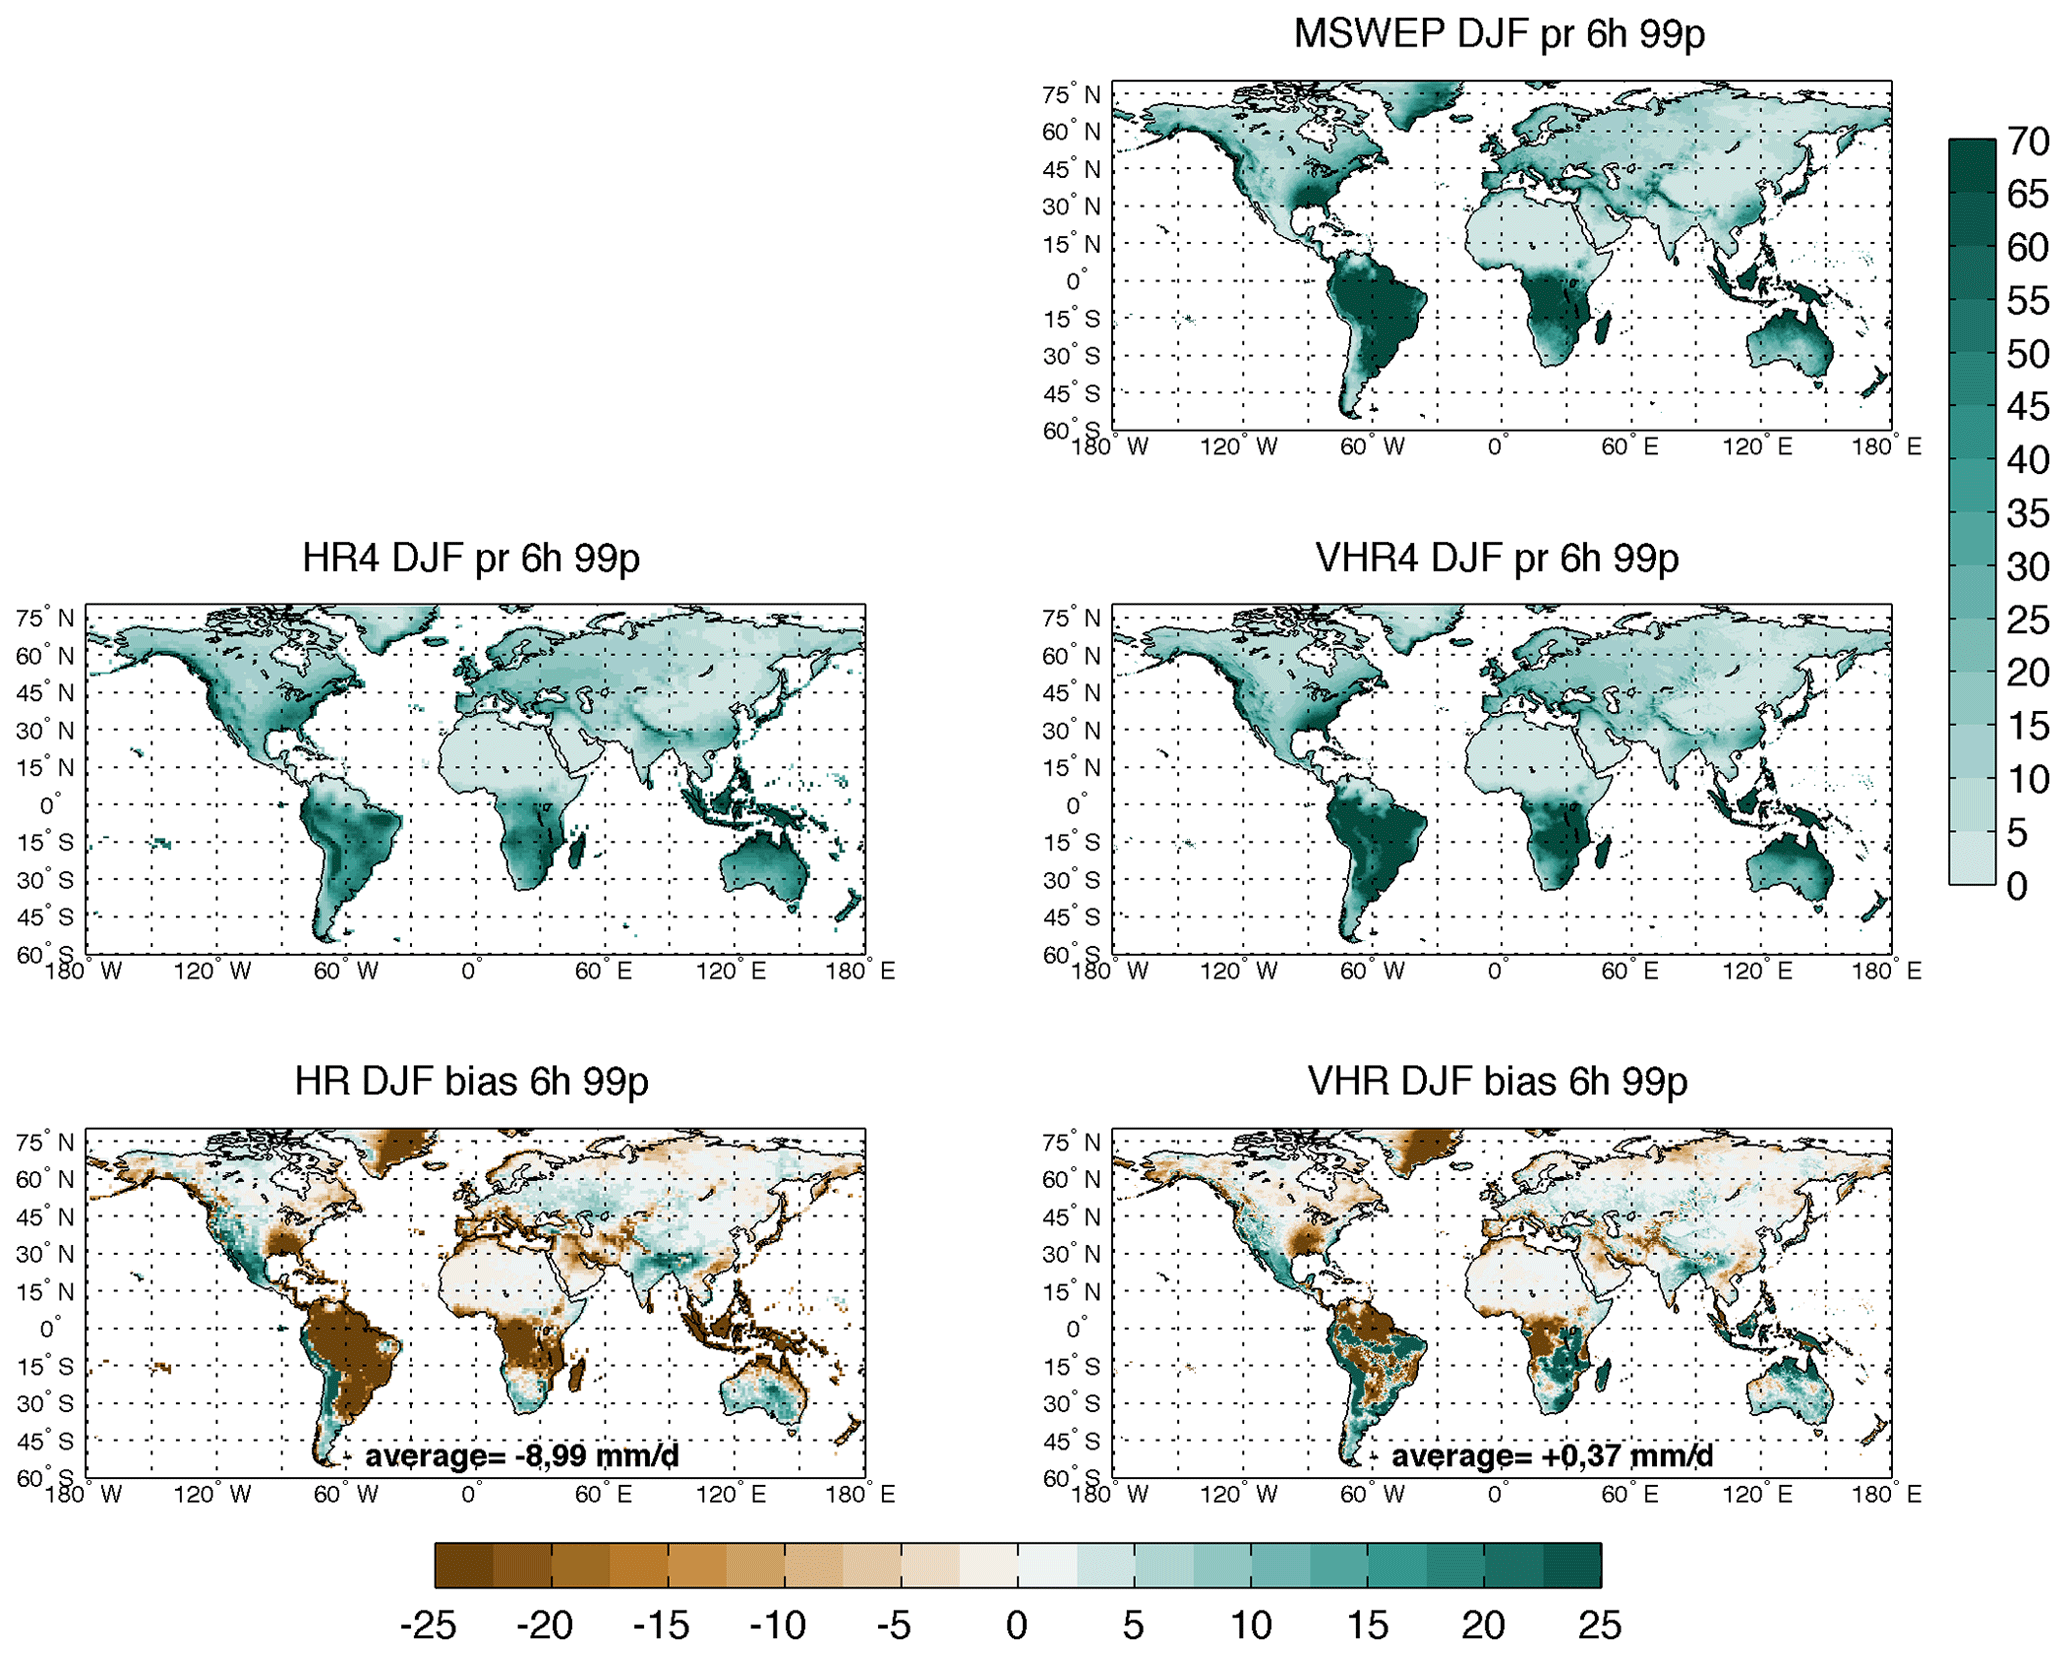
Figure 7Winter (DJF) extreme precipitation (99th percentile, 99p) computed at the 6-hourly frequency. Upper panel shows MSWEP observational results. Central panels show model results (HR on the left and VHR on the right) and lower panels show the relative model bias. Units are [mm d−1]. Vertical color bar refers to the three upper panels, while the horizontal color bar refers to the two bottom panels.
Following the same structure as in the previous section, the model extreme precipitation is here compared to the MSWEP observations (from Figs. 5 to 8) for both daily and 6-hourly statistics, and then to the CHIRPS dataset (Figs. 9 and 10) for daily statistics only. Figure 5 shows the MSWEP DJF seasonal extreme precipitation (upper panel) during the historical period and the modeled results (central panels) together with the relative biases (lower panels). Figure 6 shows the same 99p parameter but for JJA, computed based on daily time series. Figures 7 (for DJF) and 8 (for JJA), instead, show the 99p computed based on 6-hourly time series. The higher extreme events magnitude associated with the 6-hourly results (Figs. 7 and 8, upper panel) compared to the daily statistics (Figs. 5 and 6, upper panel) is visible almost everywhere, but it is more pronounced over the Tropics. In fact this is where convective processes are expected, and it is well known that convective precipitation tends to be short-lived, while long duration intense events (from 12 h to 3 d) are often associated with synoptic weather systems and tend to have larger spatial scales (Chan et al., 2014; Scoccimarro et al., 2015).
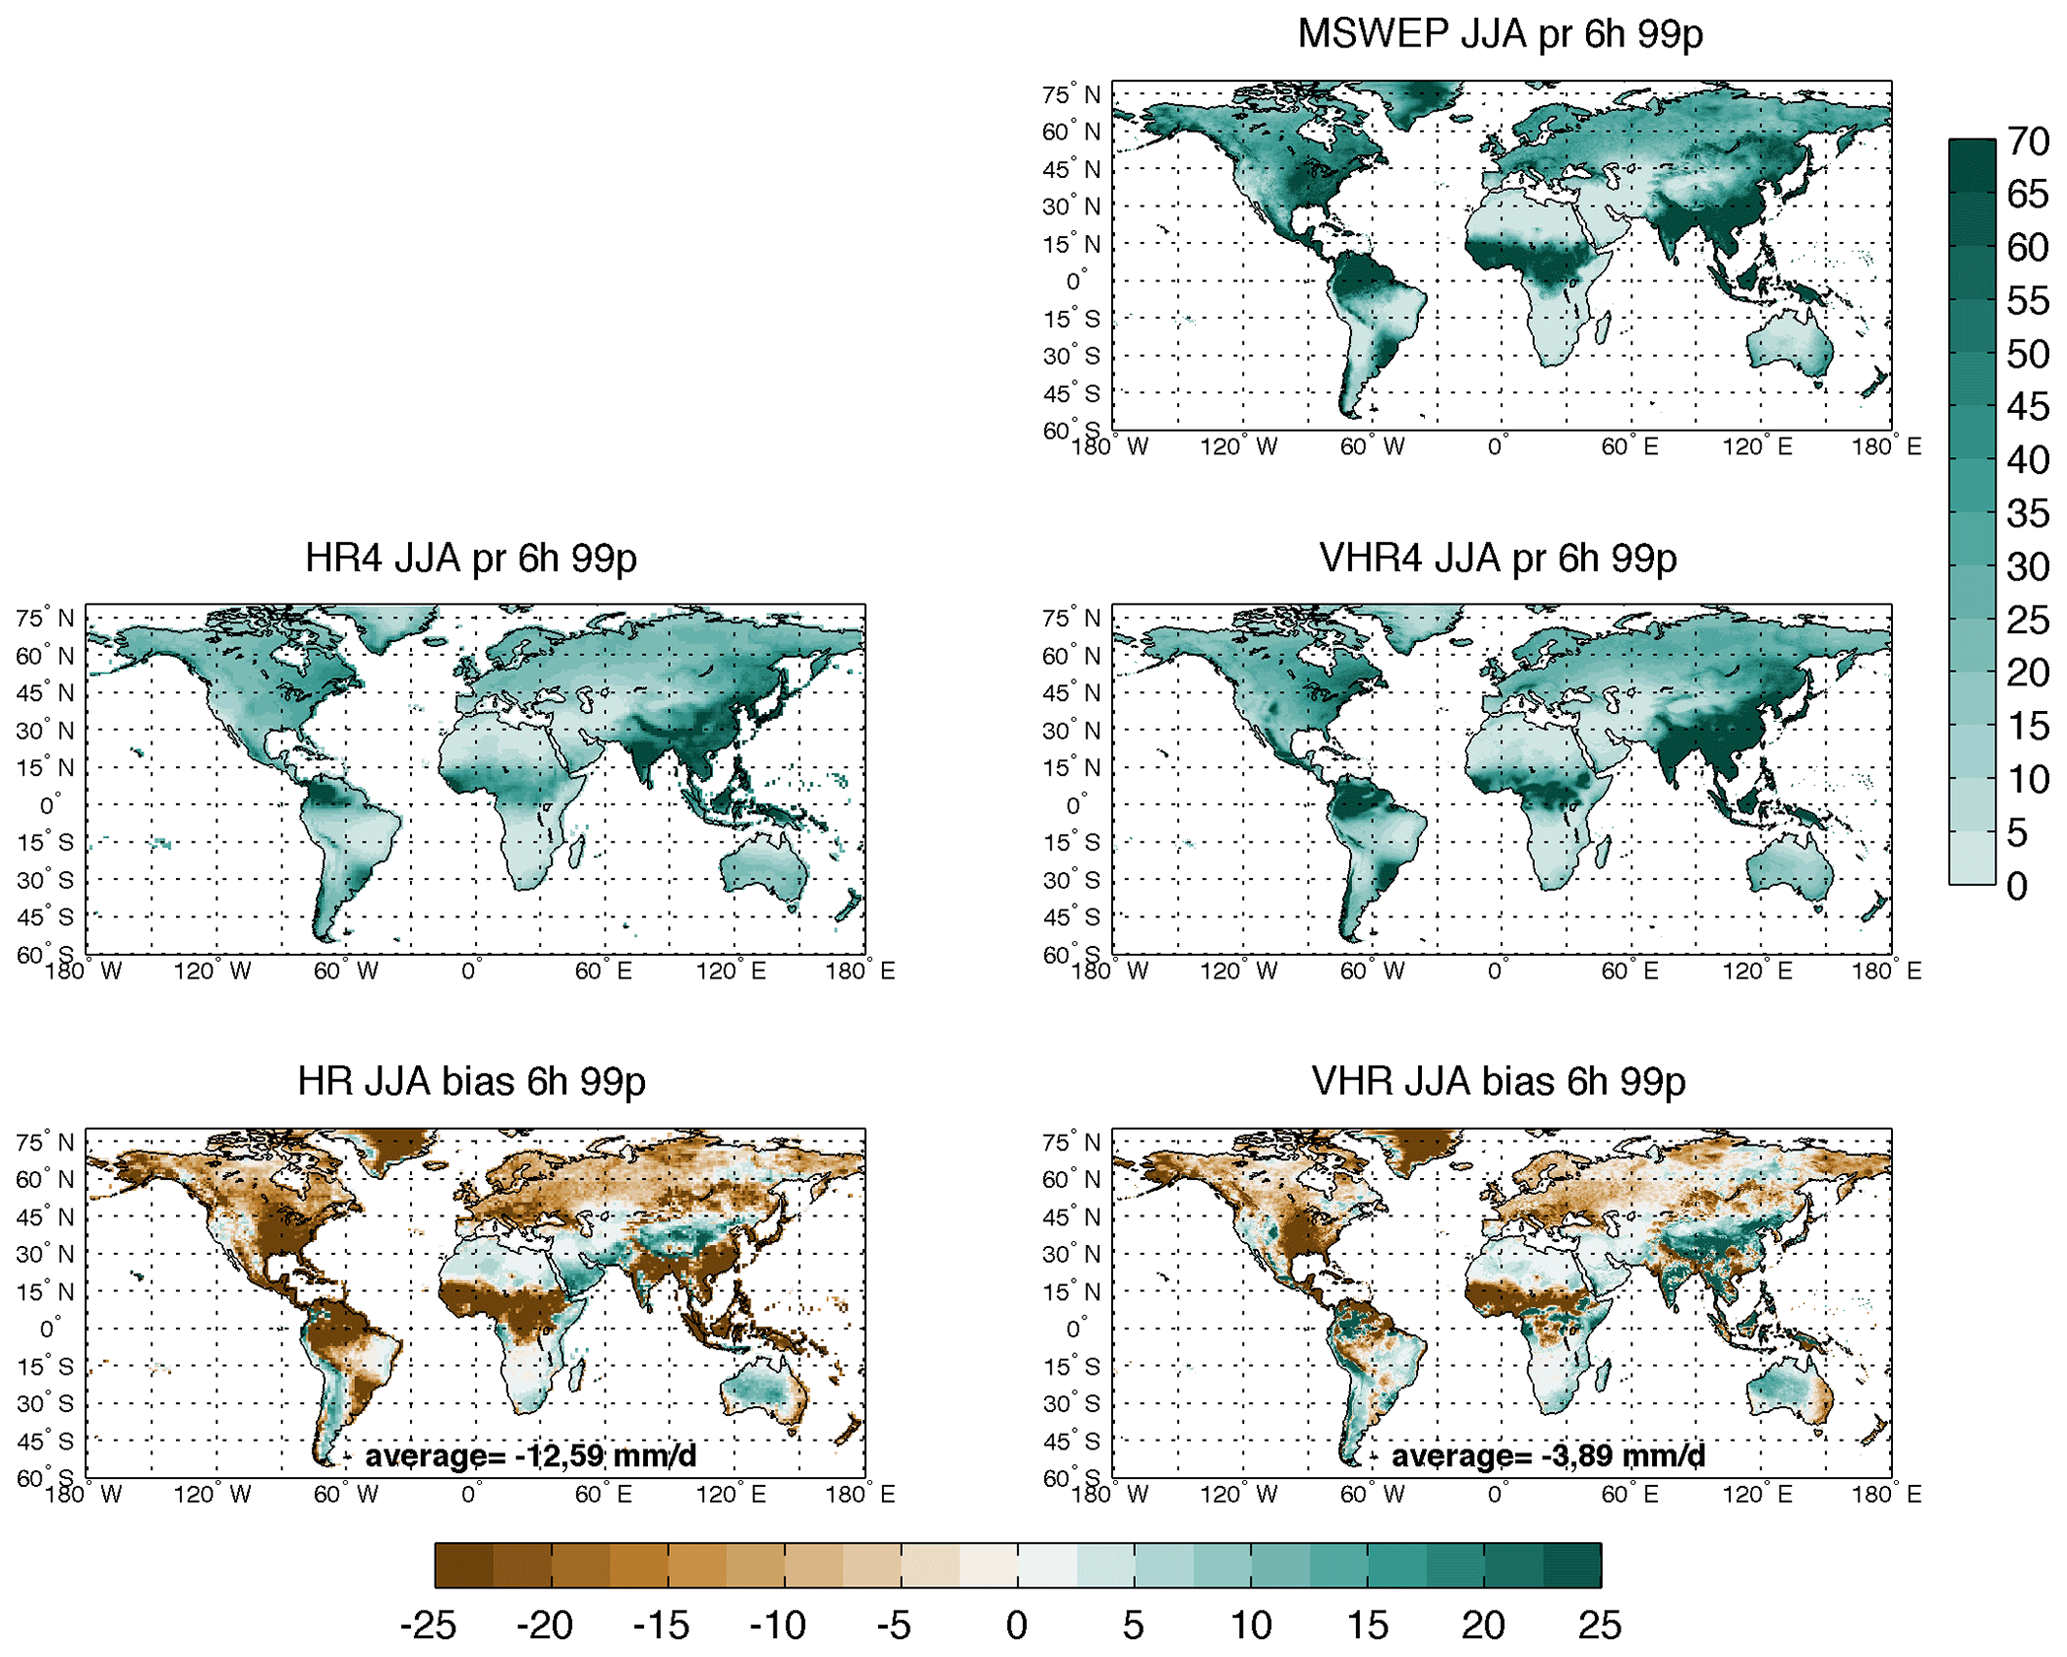
Figure 8Summer (JJA) extreme precipitation (99th percentile, 99p) computed at the 6-hourly frequency. Upper panel shows MSWEP observational results. Central panels show model results (HR on the left and VHR on the right) and lower panels show the relative model bias. Units are [mm d−1]. Vertical color bar refers to the three upper panels, while the horizontal color bar refers to the two bottom panels.
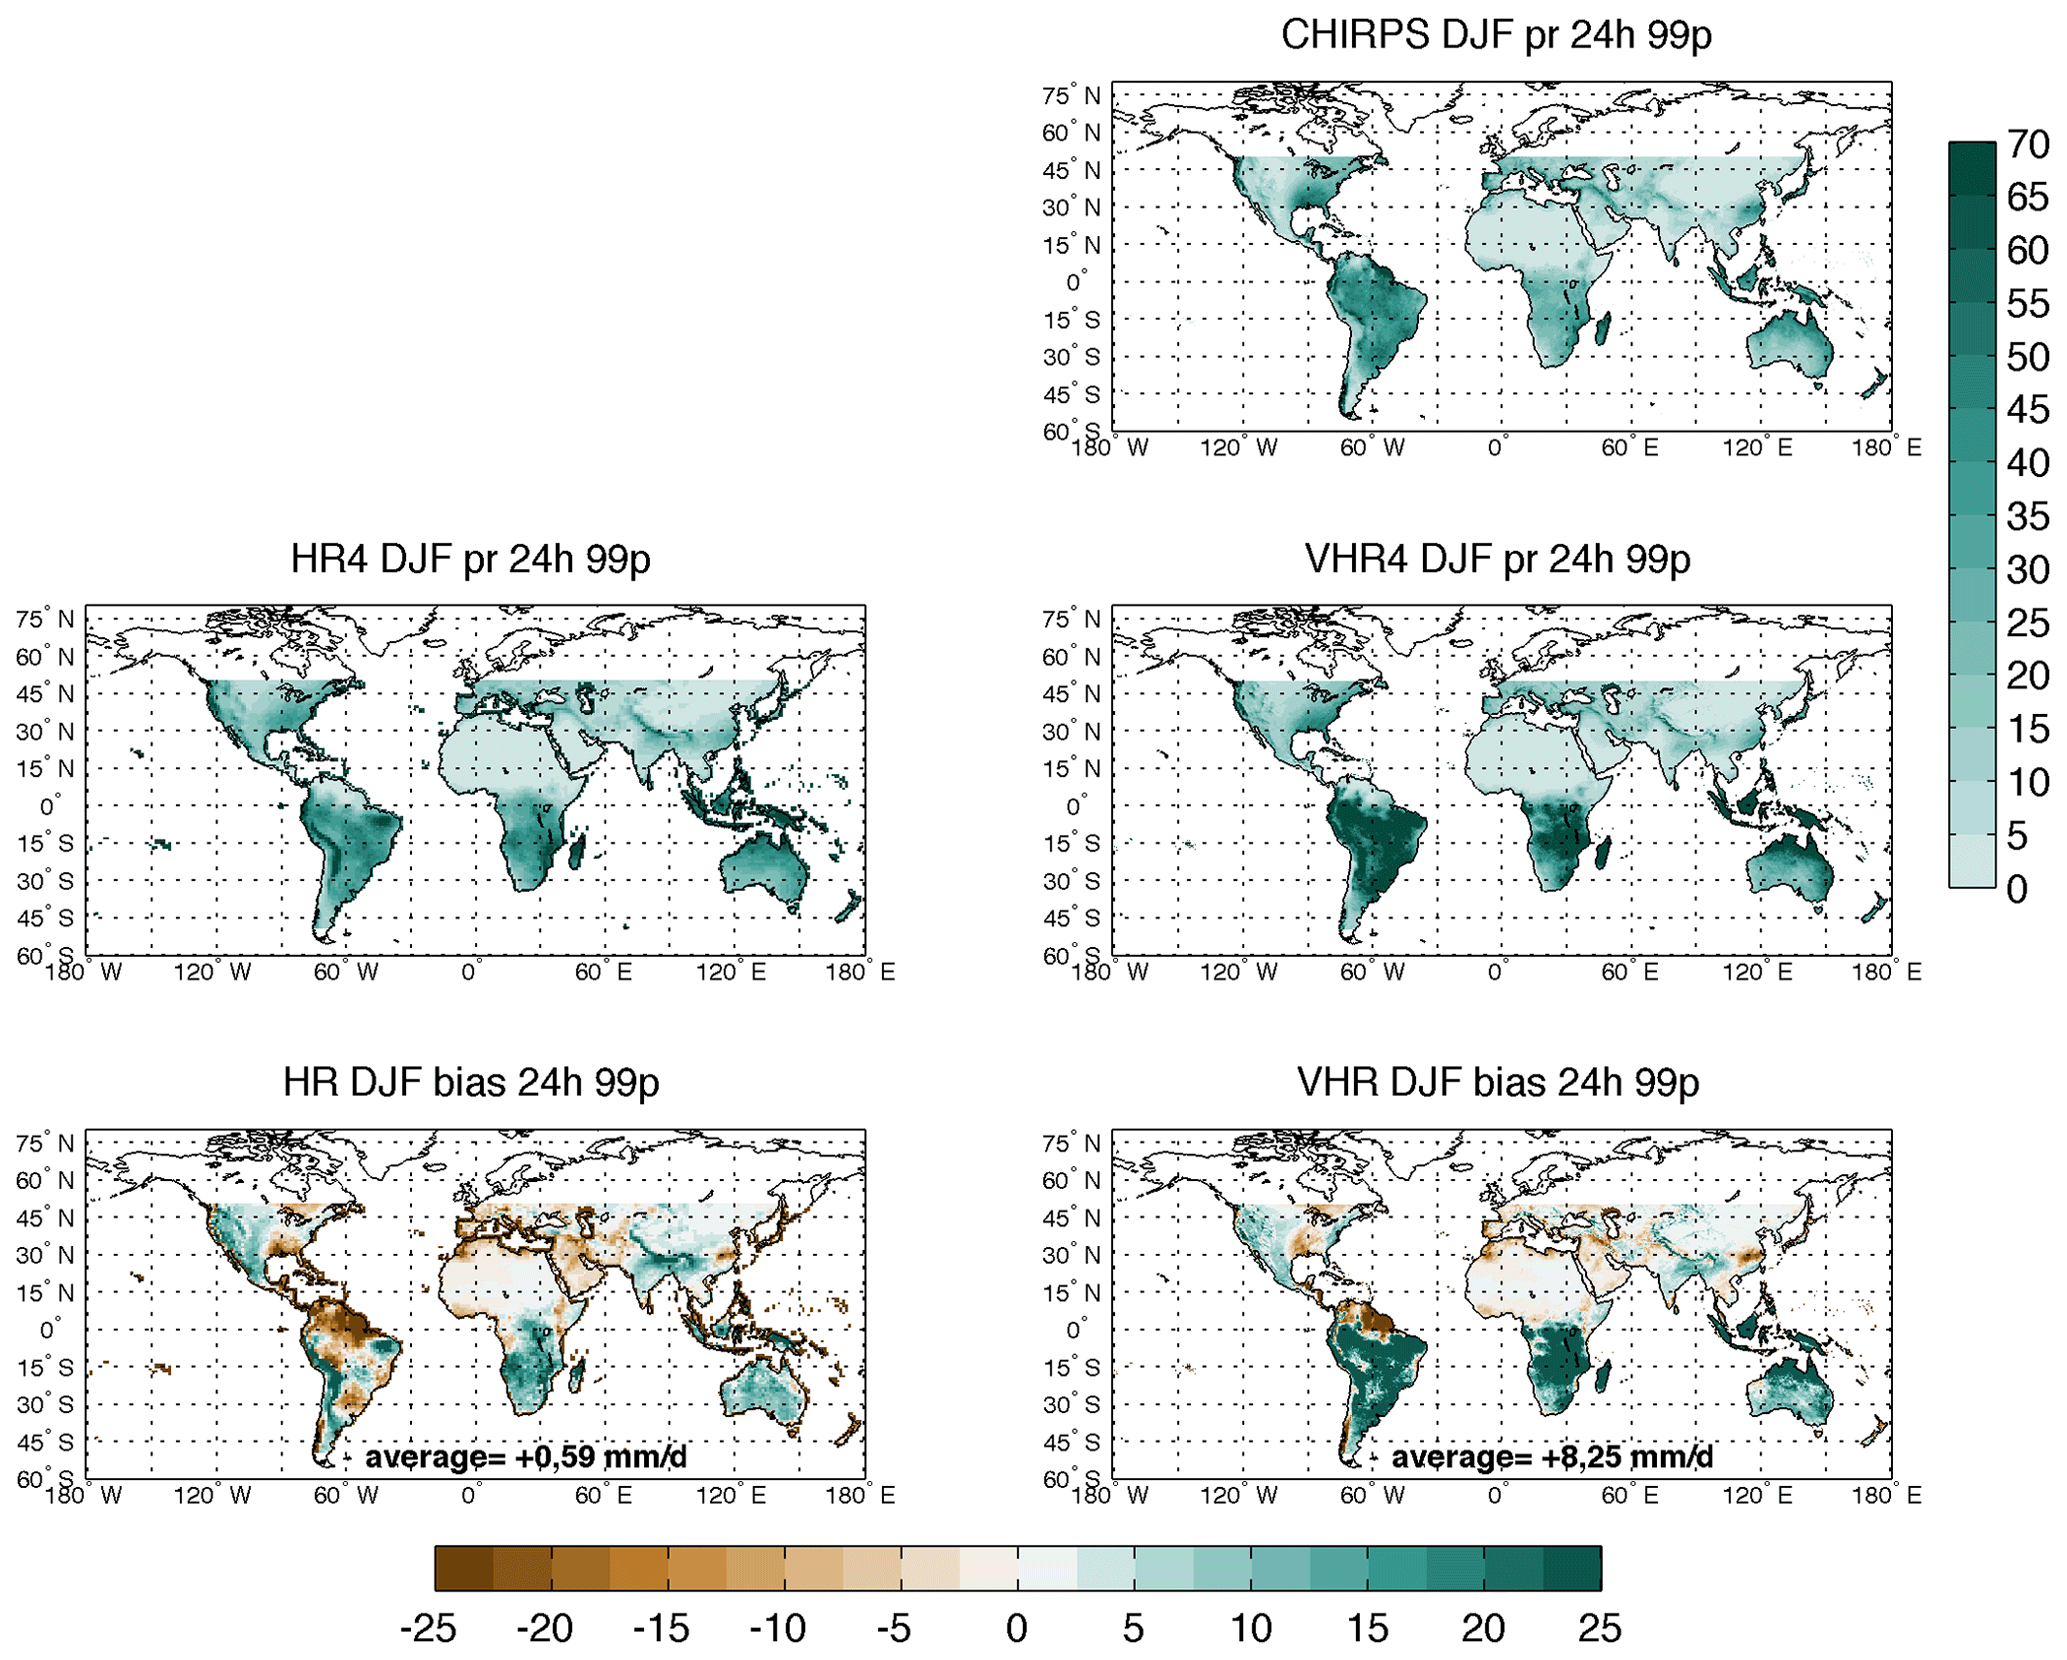
Figure 9Same as Fig. 5 but based on CHIRPS observations. Winter (DJF) extreme precipitation (99th percentile, 99p) computed at the daily frequency. Upper panel shows CHIRPS observational results. Central panels show model results (HR on the left and VHR on the right) and lower panels show the relative model bias. Units are [mm d−1]. Vertical color bar refers to the three upper panels, while the horizontal color bar refers to the two bottom panels.
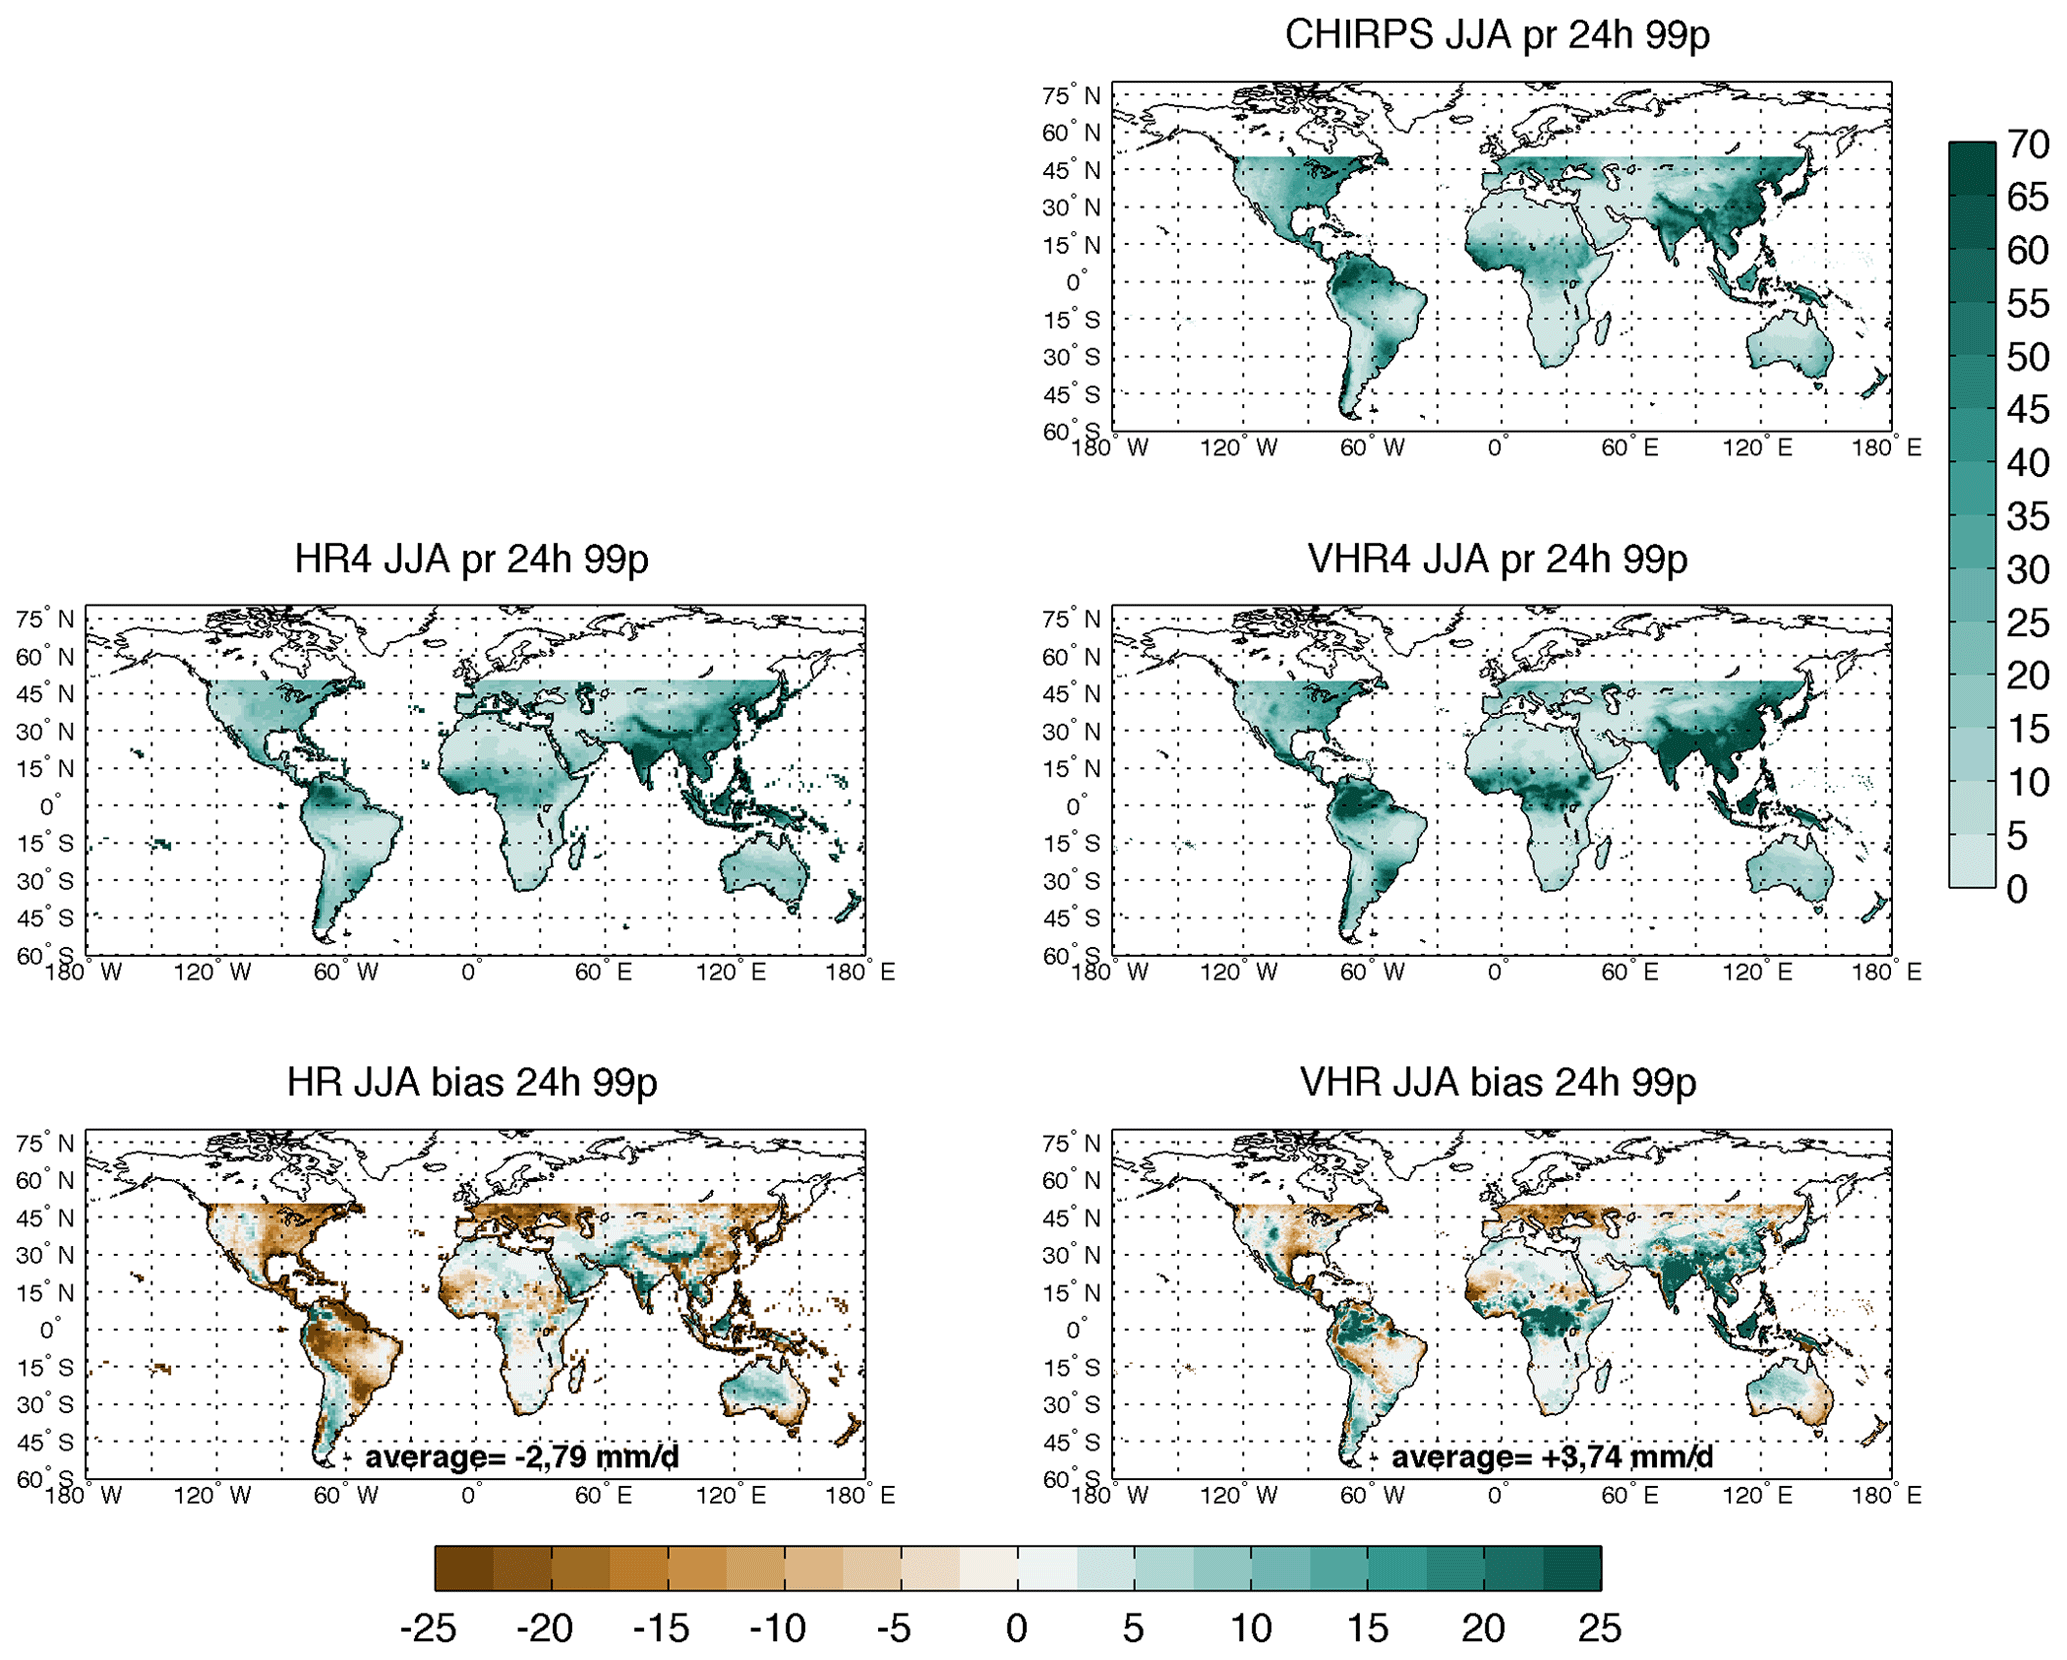
Figure 10Same as Fig. 6 but based on CHIRPS observation. Summer (JJA) extreme precipitation (99th percentile, 99p) computed at the daily frequency. Upper panel shows CHIRPS observational results. Central panels show model results (HR on the left and VHR on the right) and lower panels show the relative model bias. Units are [mm d−1]. Vertical color bar refers to the three upper panels, while the horizontal color bar refers to the two bottom panels.
In terms of average precipitation the VHR model shows less pronounced biases with respect to the HR model (Figs. S3 and S4 for DJF and JJA, respectively based on MSWEP and Figs. S5 and S6 for the same seasons based on CHIRPS). In particular, during DJF, the negative bias over the northern part of South America is reduced from about 4 to 2 mm d−1, while the positive bias over western USA, South Africa and Australia is almost halved. During JJA, the bias tends to be less pronounced in both models, and the differences between the two are mainly located over Peru, Bolivia and Brazil ranging from about −3 mm d−1 of the HR model to values closer to zero, even positive, over a small portion of the domain in the VHR model.
A different behavior is found focusing on daily extreme precipitation events. No particular differences between high and low resolution biases are found north of 30∘ N during winter (Fig. 5), while the VHR model tends to overestimate the 99th percentile of daily precipitation distribution in both seasons within the Tropics (Figs. 5 and 6). Similar patterns emerge for the 6-hourly based extreme precipitation (Fig. 6), but with a less pronounced overestimate in VHR over the Tropics, compared to the HR results. The intense events are better represented by the VHR model compared to the HR one, especially during winter in the Southern Hemisphere (Fig. S11, lower panels), where the 8 mm d−1 HR positive bias over Australia and South Africa is halved in VHR. This is consistent with the better representation of the DJF average precipitation in the VHR model (Fig. S3), suggesting that the bad representation of DJF extreme precipitation in VHR (Fig. 5) is mainly due to a much too pronounced stretching of the right part of the precipitation distribution.
To corroborate our results in terms of precipitation biases, we computed the same statistics obtained from MSWEP, using the CHIRPS observational daily dataset for averages (Figs. S5 and S6) and extreme events (Figs. 9 and 10). The biases computed with respect to the CHIRPS dataset are very similar to what we already described based on MSWEP, but with a slightly increased magnitude (Fig. 9 compared to Fig. 5) for extreme events in both models, especially during DJF, along the Tropics.
The worsening of the extreme precipitation bias moving from the HR to the VHR model along the Tropics, especially in the Southern Hemisphere during JJA, is also associated with a deterioration of the representation of the fraction of precipitation associated with extreme events with respect to the total precipitation: this metric is obtained by accumulating the water of all the events more intense than the 99p, and normalizing it by the total amount of precipitation in the considered period (season by season). Figure S17 shows that both models capture this metric reasonably well in both seasons compared to MSWEP, but the VHR model tends to overestimate such amounts over the Southern Hemisphere, except for the Australian domain. In particular, the strong positive bias of DJF average precipitation over Australia (up to 4 mm d−1, Fig. S3, lower panels) cannot be attributed to the positive (higher than 15 mm d−1, Fig. 5 lower panels) bias found for extreme events, but must be associated with a right shift of the remaining part of the precipitation distribution, more pronounced for the non-extreme events as partially confirmed by the positive bias in the 90p metric over the same season (Fig. S11).
The CMCC-CM2-HR4 and CMCC-CM2-VHR4 models are state-of-the-art fully coupled climate models, participating in different Model Intercomparison Projects within the 6th Coupled Model Intercomparison Project (CMIP6). The CMCC-CM2-HR4 presents a horizontal resolution typical of most of the models involved in CMIP6 , while CMCC-CM2-VHR4 has a horizontal resolution standard for the models involved in the High-Resolution Model Intercomparison Project (HighResMIP). In this paper we highlight the ability of the two models to represent extreme climate conditions, based on daily and 6-hourly time series, comparing temperature and precipitation modeled distributions to the observed ones. In order to have a gridded dataset representative of the observed climate at the daily and 6-hourly time frequencies, we used ERA5 reanalysis for temperature and MSWEP observations for precipitation. For the precipitation analysis we also reinforce our investigation on the basis of the CHIRPS daily observations.
It is well known that the representation of extreme precipitation indices is more dependent on the horizontal resolution than what we would expect for extreme temperature indices (Wei et al., 2019). On average, the highest resolution CMCC model (VHR) is better than the lower resolution model (HR) in representing average, intense (90p) and extreme (99p) events of temperature both in terms of patterns and magnitude. This is true for daily and 6-hourly based statistics. Also VHR results are quite in agreement with CMIP6 multi-member average of daily intense and extreme temperature indices (Scoccimarro and Navarra, 2021). The described differences between the computed daily and 6-hourly biases in temperature statistics are very similar for HR and VHR models. This result suggests that a higher horizontal resolution is not sufficient to improve the representation of extreme temperature events at the highest time frequency considered. Consequently, the worsening of model biases in high frequency (6-hourly) temperature statistics is derived from deficiencies of the current version of model components and parameterizations in representing high-frequency processes.
Regarding the precipitation distribution, the VHR model performs better in representing averages and intense events, but more pronounced biases appear in VHR compared to HR when focusing on extreme events, with a more evident degradation in the daily compared to the 6-hourly statistics. This latter result reduces the confidence usually attributed to the highest horizontal resolution in modeling extreme precipitation, and is consistent with single model analysis based on the CAM5.1 atmospheric model (Wehner et al., 2014) suggesting a positive bias over most of the globe in the representation of extreme events at ∘ horizontal resolution. This is also in agreement with recent findings (Bador et al., 2020) suggesting that highest resolution models tend to produce more pronounced extremes than lower resolution ones. In addition many of them show lower SKILL in representing observed patterns, both in terms of intensity and spatial distribution, at the higher resolution, compared to the corresponding lower resolution version.
This emphasizes the need to focus not only on the horizontal resolution to improve the model ability in representing the climate system, but also on physics and tuning. It is important to note that in the model object of this analysis the tuning parameters were kept constant, moving from the HR to the VHR version, in order to be compliant with the HigResMIP protocol.
The different biases, obtained based on daily and 6-hourly time frequencies, also suggest that for the set-up of model physics and tuning we need to consider the event distributions at different time frequencies, to take into account the representation of the different processes responsible for the extreme conditions emerging at the different frequencies (Scoccimarro et al., 2015).
The poor performance of climate models in representing extreme precipitation was not improved in the last CMIP6 generation models, compared to the previous CMIP5 generation (Scoccimarro and Gualdi, 2020). In the present work we have shown that this lack is even more evident when moving to the highest resolution version of the CMCC-CM2 model adopted for HighResMIP, consistent with multi-model analyses performed at the same horizontal resolution (Bador et al., 2020): GCMs whose parameterizations were not retuned at higher resolution lead to worse results. The high-resolution version of the model tends to overestimate extreme precipitation in the wet and warm regions, consistent with findings based on experiments carried out with the CAM5 atmospheric model at the same resolutions (Wehner et al., 2014), highlighting once again the importance of an extensive model tuning at high resolution. In addition it is important to note that moving from the standard to the high resolution of CMCC-CM2, the model behaves consistently with the models participating to the HighResMIP project: a tendency to an increased fraction of land precipitation in the highest resolution, and the same tendency for the fraction of land precipitation caused by moisture convergence (Vennière et al., 2019). Also, in the CMCC-CM2 model, the orographic precipitation captures most of the change of precipitation due to resolution, consistent with most of the HighResMIP models (Vennière et al., 2019).
In principle, the horizontal resolution increase should improve the representation of extreme storms, such as tropical cyclones (Scoccimarro and Gualdi, 2020) and for this reason also the representation of the associated short-term extreme precipitation should improve, but this is not the case for the model object of this study, and it is also confirmed by recent analysis on the same topic (Wehner et al., 2021).
The code relative to the CMCC-CM2-HR4 and the CMCC-CM2-VHR4 climate models are available on the Zenodo repository (DOI: https://doi.org/10.5281/zenodo.5499856, Scoccimarro et al., 2021). The data relative to the two models are available through the Earth System Grid Federation (ESGF) data portal (https:// doi.org/10.22033/ESGF/CMIP6.1359, Scoccimarro et al., 2017b and https://doi.org/10.22033/ESGF/CMIP6.1367 Scoccimarro et al., 2017c, respectively). The ERA5 results are available through the Copernicus data portal (https://climate.copernicus.eu, last access: 15 July 2021, Hersbach, 2020). The CHIRPS observational dataset is available through the data storage of the University of California in Santa Barbara (https://doi.org/10.15780/G2RP4Q, Funk, 2015).
The supplement related to this article is available online at: https://doi.org/10.5194/gmd-15-1841-2022-supplement.
ES, AB and DP implemented the two model versions and ran the simulations. PGF supported the implementation of the Aerosol input management routines. TL prepared the radiative forcing files and supported the model output postprocessing. SG and AN supported the CMCC-CM2 model implementation phase. ES prepared the article with contributions from all co-authors.
The contact author has declared that neither they nor their co-authors have any competing interests.
Publisher’s note: Copernicus Publications remains neutral with regard to jurisdictional claims in published maps and institutional affiliations.
This paper was edited by Sophie Valcke and reviewed by two anonymous referees.
Andersson E. and Thépaut, J. N.: ECMWF's 4D-Var data assimilation system – the genesis and ten years in operations, ECMWF Newsl., 115, 8–12, 2008.
Bador, M., Boé, J., Terray, L., Alexander, L. V., Bellucci, A., Haarsma, R., Koenigk, T., Moine, M.-P., Lohmann, K., Putrasahan, D. A., Roberts, C., Roberts, M., Scoccimarro, E., Schiemann, R., Seddon, J., Senan, R., Valcke, S., and Vanniere, B.: Impact of higher spatial atmospheric resolution on precipitation extremes over land in global climate models, J. Geophys. Res.-Atmos, 125, e2019JD032184, https://doi.org/10.1029/2019JD032184, 2020.
Beck, H. E., Wood, E. F., Pan, M., Fisher, C. K., Miralles, D. G., van Dijk, A. I. J. M., McVicar, T. R., and Adler, R. F.: MSWEP V2 Global 3-Hourly 0.1∘ Precipitation: Methodology and Quantitative Assessment, B. Am. Meteorol. Soc., 100, 473–500, 2019.
Bellucci, A., Athanasiadis, P. J., Scoccimarro, E., Ruggieri, P., Gualdi, S., Fedele, G., Haarsma, R. J., Garcia-Serrano, J., Castrillo, M., Putrahasan, D., Sanchez-Gomez, E., Moine, M.-P., Roberts, C. D., Roberts, M. J., Seddon, J., and Vidale, P. L.: Air-Sea interaction over the Gulf Stream in an ensemble of HighResMIP present climate simulations, Clim. Dynam., 56, 2093–2111, https://doi.org/10.1007/s00382-020-05573-z, 2021.
Chan, S. C., Kendon, E. J., Fowler, H. J., Blenkinsop, S., Roberts, N. M., and Ferro, C. A. T.: The Value of High-Resolution Met Office Regional Climate Models in the Simulation of Multihourly Precipitation Extremes, J. Climate, 27, 6155–6174, 2014.
Cherchi, A., Lovato, T., Fogli, P. G., Peano, D., Gualdi, S., Masina, S., Scoccimarro, E., Materia, S., Iovino, D., and Navarra, A.: Global mean climate and main patterns of variability in the CMCC-CM2 coupled model, J. Adv. Model. Earth Sy., 11, 185–209, https://doi.org/10.1029/2018MS001369, 2019.
Crossett, C. C., Betts, A. K., Dupigny-Giroux, L. A. L., and Bomblies, A.: Evaluation of Daily Precipitation from the ERA5 Global Reanalysis against GHCN Observations in the Northeastern United States, Climate, 8, 148, https://doi.org/10.3390/cli8120148, 2020.
Dee, D. P., Uppala, S. M., Simmons, A. J., Berrisford, P., Poli, P., Kobayashi, S., Andrae, U., Balmaseda, M. A., Balsamo, G., Bauer, P., Bechtold, P., Beljaars, A. C. M., van de Berg, L., Bidlot, J., Bormann, N., Delsol, C., Dragani, R., Fuentes, M., Geer, A. J., Haimberger, L., Healy, S. B., Hersbach, H., Hólm, E. V., Isaksen, L., Kållberg, P., Köhler, M., Matricardi, M., McNally, A. P., Monge-Sanz, B. M., Morcrette, J.-J., Park, B.-K., Peubey, C., de Rosnay, P., Tavolato, C., Thépaut, J.-N., and Vitart, F.: The ERA-Interim reanalysis: configuration and performance of the data assimilation system, Q. J. Roy. Meteor. Soc., 137, 553–597, 2011.
Demory, M.-E., Vidale, P. L., Roberts, M. J., Berrisford, P., Strachan, J., Schiemann, R., and Mizielinski, M. S.: The role of horizontal resolution in simulating drivers of the global hydrological cycle, Clim. Dynam., 42, 2201–2225, https://doi.org/10.1007/s00382-013-1924-4, 2014.
Demory, M.-E., Berthou, S., Fernández, J., Sørland, S. L., Brogli, R., Roberts, M. J., Beyerle, U., Seddon, J., Haarsma, R., Schär, C., Buonomo, E., Christensen, O. B., Ciarlò, J. M., Fealy, R., Nikulin, G., Peano, D., Putrasahan, D., Roberts, C. D., Senan, R., Steger, C., Teichmann, C., and Vautard, R.: European daily precipitation according to EURO-CORDEX regional climate models (RCMs) and high-resolution global climate models (GCMs) from the High-Resolution Model Intercomparison Project (HighResMIP), Geosci. Model Dev., 13, 5485–5506, https://doi.org/10.5194/gmd-13-5485-2020, 2020.
Eyring, V., Bony, S., Meehl, G. A., Senior, C. A., Stevens, B., Stouffer, R. J., and Taylor, K. E.: Overview of the Coupled Model Intercomparison Project Phase 6 (CMIP6) experimental design and organization, Geosci. Model Dev., 9, 1937–1958, https://doi.org/10.5194/gmd-9-1937-2016, 2016.
Flato, G., Marotzke, J., Abiodun, B., Braconnot, P., Chou, S. C., Collins, W. J., Cox, P., Driouech, F., Emori, S., Eyring, V., and Forest, C.: Evaluation of climate models. Climate change 2013: The physical science basis, Contribution of Working Group I to the Fifth Assessment Report of the Intergovernmental Panel on Climate Change, 5, 741–866, 2013.
Fogli, P. G. and Iovino, D.: CMCC-CESM-NEMO: toward the new CMCC Earth System Model, CMCC Research Papers, RP0248, 15 pp., https://papers.ssrn.com/sol3/papers.cfm?abstract_id=2603176 (last access: 15 July 2021), 2014.
Funk, C.: Climate Hazards Group, Climate Hazards Center [data set], https://doi.org/10.15780/G2RP4Q, 2015.
Funk, C., Peterson P., Landsfeld M., Pedreros D., Verdin J., Shukla S., Husak G., Rowland J., Harrison L., Hoell A., and Michaelsen J.: The climate hazards infrared precipitation with stations – a new environmental record for monitoring extremes, Sci. Data, 2, 150066, https://doi.org/10.1038/sdata.2015.66, 2015.
Haarsma, R. J., Roberts, M. J., Vidale, P. L., Senior, C. A., Bellucci, A., Bao, Q., Chang, P., Corti, S., Fučkar, N. S., Guemas, V., von Hardenberg, J., Hazeleger, W., Kodama, C., Koenigk, T., Leung, L. R., Lu, J., Luo, J.-J., Mao, J., Mizielinski, M. S., Mizuta, R., Nobre, P., Satoh, M., Scoccimarro, E., Semmler, T., Small, J., and von Storch, J.-S.: High Resolution Model Intercomparison Project (HighResMIP v1.0) for CMIP6, Geosci. Model Dev., 9, 4185–4208, https://doi.org/10.5194/gmd-9-4185-2016, 2016.
Hersbach, H., Bell, B., Berrisford, P., Hirahara, S., Horányi, A., Muñoz-Sabater, J., Nicolas, J., Peubey, C., Radu, R., Schepers, D., Simmons, A., Soci, C., Abdalla, S., Abellan, X., Balsamo, G., Bechtold, P., Biavati, G., Bidlot, J., Bonavita, M., Chiara, G., Dahlgren, P., Dee, D., Diamantakis, M., Dragani, R., Flemming, J., Forbes, R., Fuentes, M., Geer, A., Haimberger, L., Healy, S., Hogan, R. J., Hólm, E., Janisková, M., Keeley, S., Laloyaux, P., Lopez, P., Lupu, C., Radnoti, G., Rosnay, P., Rozum, I., Vamborg, F., Villaume, S., Thepaut, J.-N.: The ERA5 global reanalysis, Q. J. Roy. Meteor. Soc., 146, 1999–2049, https://doi.org/10.1002/qj.3803, 2020.
Hu, G. and Franzke, C. L. E.: Evaluation of daily precipitation extremes in reanalysis and gridded observation based data sets over Germany, Geophys. Res. Lett., 47, e2020GL089624, https://doi.org/10.1029/2020GL089624, 2020.
Hunke, E. and Lipscomb, W.: CICE: The Los Alamos sea ice model, documentation and software, version 4.0, Los Alamos National Laboratory, Technical Report, Los Alamos NM, LA-CC-06-012, 76, 2008.
Iles, C. E., Vautard, R., Strachan, J., Joussaume, S., Eggen, B. R., and Hewitt, C. D.: The benefits of increasing resolution in global and regional climate simulations for European climate extremes, Geosci. Model Dev., 13, 5583–5607, https://doi.org/10.5194/gmd-13-5583-2020, 2020.
Kharin, V. V., Zwiers, F. W., Zhang, X., and Wehner, M.: Changes in temperature and precipitation extremes in the CMIP5 ensemble, Climatic Change, 119, 345–357, https://doi.org/10.1007/s10584-013-0705-8, 2013.
Kopparla, P., Fischer, E. M., Hannay, C., and Knutti, R.: Improved simulation of extreme precipitation in a high-resolution atmosphere model, Geophys. Res. Lett., 40, 5803–5808, https://doi.org/10.1002/2013GL057866, 2013.
Li, C., Zwiers, F., Zhang, X., Li, G., Sun, Y., and Wehner, M.: Changes in Annual Extremes of Daily Temperature and Precipitation in CMIP6 Models, J. Climate, 34, 3441–3460, 2021.
Madec, G. and the NEMO team: NEMO ocean engine – Version 3.6, Tech. Rep., no. 27 Pôle de Modélisation, Institut Pierre-Simon Laplace (IPSL), France, NEMO ocean engine, NEMO System Team, Scientific Notes of Climate Modelling Center, 27, Institut Pierre-Simon Laplace (IPSL), ISSN 1288-1619, https://doi.org/10.5281/zenodo.1464816, 2016.
Meredith, E. P., Ulbrich, U., and Rust, H. W.: Subhourly rainfall in a convection-permitting model, Environ. Res. Lett., 15, 034031, https://doi.org/10.1088/1748-9326/ab6787, 2020.
Neale, R. B. , Richter, J. H., Conley, A. J., Park, S., Lauritzen, P. H., Gettelman, A., Williamson, D. L., Rasch, P. J., Vavrus, S. J., Taylor, M. A., Collins, W. D., Zhang, M., and Lin, S.: Description of the NCAR Community Atmosphere Model (CAM4.0), NCAR Tech. Note, NCAR/TN-4851STR, 212 pp., 2010.
Oleson, K. W., Lawrence, D. M., Bonan, G. B., Drewniak, B., Huang, M., Koven, C. D., Levis, S., Li, F., Riley, W. J., Subin, Z. M., Swenson, S. C., and Thornton, P. E.: Technical description of version 4.5 of the Community Land Model (CLM), NCAR Technical Note, NCAR/TN-503+STR, 2013.
Raymond, D. J. and Blyth, A. M.: A stochastic mixing model for non-precipitating cumulus clouds, J. Atmos. Sci., 43, 2708–2718, 1986.
Raymond, D. J. and Blyth, A. M.: Extension of the stochastic mixing model to cumulonimbus clouds, J. Atmos. Sci., 49, 1968–1983, 1992.
Richter, J. H. and Rasch, P. J.: Effects of convective momentum transport on the atmospheric circulation in the community atmosphere model, version 3, J. Climate, 21, 1487–1499, 2008.
Rivoire, P., Martius, O., and Naveau, P.: A comparison of moderate and extreme ERA-5 daily precipitation with two observational data sets, Earth and Space Science, 8, e2020EA001633, https://doi.org/10.1029/2020EA001633, 2021.
Schindler A., Toreti, A., Zampieri, M., Scoccimarro, E., Gualdi, S., Fukutome, S., Xoplaki, E., and Luterbacher, J.: On the internal variability of simulated daily precipitation, J. Climate, 28, 3624–3630, https://doi.org/10.1175/JCLI-D-14-00745.1, 2015.
Scoccimarro, E. and Gualdi, S.: Heavy Daily Precipitation Events in the CMIP6 Worst-Case Scenario: Projected Twenty-First-Century Changes, J. Climate, 33, 7631–7642, https://doi.org/10.1175/JCLI-D-19-0940.1, 2020.
Scoccimarro, E. and Navarra, A.: Precipitation and temperature extremes in a changing climate, in: Hydrometeorological Extreme Events and Public Health, 1st edn., chap. 2, edited by: Matthies, F., Wiley book, 320 pp., ISBN 978-1-119-25930-5, 2021.
Scoccimarro, E., Gualdi, S., Bellucci, A., Zampieri, M., and Navarra, A.: Heavy precipitation events in a warmer climate: results from CMIP5 models, J. Climate, 26, 7902–7911, https://doi.org/10.1175/JCLI-D-12-00850.1, 2013.
Scoccimarro, E., Villarini, G., Vichi, M., Zampieri, M., Fogli, P. G., Bellucci, A., and Gualdi, S.: Projected changes in intense precipitation over Europe at the daily and sub-daily time scales, J. Climate, 28, 6193–6203, https://doi.org/10.1175/JCLI-D-14-00779.1, 2015.
Scoccimarro, E., Gualdi, S., Bellucci, A., Zampieri, M., and Navarra, A.: Heavy precipitation events over the Euro-Mediterranean region in a warmer climate: results from CMIP5 models, Reg. Environ. Change, 16, 595–602, https://doi.org/10.1007/s10113-014-0712-y, 2016.
Scoccimarro, E., Fogli, P. G., Reed, K., Gualdi, S., Masina, S., and Navarra, A.: Tropical cyclone interaction with the ocean: the role of high frequency (sub-daily) coupled processes, J. Climate, 30, 145–162, https://doi.org/10.1175/JCLI-D-16-0292.1, 2017a.
Scoccimarro, E., Bellucci, A., and Peano, D.: CMCC CMCC-CM2-HR4 model output prepared for CMIP6 HighResMIP hist-1950, Earth System Grid Federation [data set], https://doi.org/10.22033/ESGF/CMIP6.1359, 2017b.
Scoccimarro, E., Bellucci, A., and Peano, D.: CMCC CMCC-CM2-VHR4 model output prepared for CMIP6 HighResMIP, Earth System Grid Federation [data set], https://doi.org/10.22033/ESGF/CMIP6.1367, 2017c.
Scoccimarro, E., Gualdi, S., Bellucci, A., Peano, D., Cherchi, A., Vecchi, G. A., and Navarra, A.: The typhoon-induced drying of the Maritime Continent, PNAS, 117, 3983–3988, https://doi.org/10.1073/pnas.1915364117, 2020.
Scoccimarro, E., Peano, D., Gualdi, S., Bellucci, A., Lovato, T., Fogli, P. G., and Navarra, A.: CMCC-Foundation/CMCC-CM2-HighResMIP: CMCC-CM2-HighResMIP code for CMIP6 (cmip6-code), Zenodo [data set], https://doi.org/10.5281/zenodo.5499856, 2021.
Terai, C. R., Caldwell, P. M., Klein, S. A. Tang, Q., and Branstetter, M. L.: The atmospheric hydrologic cycle in the ACME v0.3 model, Clim. Dynam., 50, 3251–3279, https://doi.org/10.1007/s00382-017-3803-x, 2018.
Van Haren, R., Haarsma, R. J., de Vries, H., van Oldenborgh, G. J., and Hazeleger, W.: Resolution dependence of circulation forcedfuture central European summer drying, Environ. Res. Lett., 10, 055002, https://doi.org/10.1088/1748-9326/10/5/055002, 2015.
Vannière, B., Vidale, P. L., Demory, M.-E., Schiemann, R., Roberts, M. J., Roberts, C. D., Matsueda, M., Terray, L., Koenigk, T., and Senan, R.: Multi-model evaluation of the sensitivity of the global energy budget and hydrological cycle to resolution, Clim. Dynam., 52, 6817–6846, https://doi.org/10.1007/s00382-018-4547-y, 2019.
Wang, X. and Zhang, M.: An analysis of parameterization interactions and sensitivity of single-column model simulations to convection schemes in CAM4 and CAM5, J. Geophys. Res.-Atmos., 118, 8869–8880, https://doi.org/10.1002/jgrd.50690, 2013.
Wehner, M. F., Reed, K. A., Li, F., Bacmeister, P. J., Chen, C. T., Paciorek, C., Gleckler, P. J., Sperber, K. R., Collins, W. D., Gettelman, A., and Jablonowski, C.: The effect of horizontal resolution on simulation quality in the Community Atmospheric Model, CAM5.1, J. Adv. Model. Earth Sy., 6, 980–997, https://doi.org/10.1002/2013MS000276, 2014.
Wehner, M., Lee, J., Risser, M., Ullrich, P., Gleckler, P., and Collins, W. D.: Evaluation of extreme sub-daily precipitation in high-resolution global climate model simulations, Philos. Tr. R. Soc. A., 379, 20190545, https://doi.org/10.1098/rsta.2019.0545, 2021.
Wei, L., Xin, X., Xiao, C., Li, Y., Wu, Y., and Tang, H.: Performance of BCC-CSM Models with Different Horizontal Resolutions in Simulating Extreme Climate Events in China, J. Meteor. Res., 33, 720–733, https://doi.org/10.1007/s13351-019-8159-1, 2019.
Zhang, G. J. and McFarlane, N. A.: Sensitivity of climate simulations to the parameterization of cumulus convection in the Canadian Climate Centre general circulation model, Atmos. Ocean, 33, 407–446, 1995.