the Creative Commons Attribution 4.0 License.
the Creative Commons Attribution 4.0 License.
 | 02 Mar 2022
CARDAMOM-FluxVal version 1.0: a FLUXNET-based validation system for CARDAMOM carbon and water flux estimates
A. Anthony Bloom
Shuang Ma
Paul Levine
Alexander Norton
Nicholas C. Parazoo
John T. Reager
John Worden
Gregory R. Quetin
T. Luke Smallman
Mathew Williams
Sassan Saatchi
Land–atmosphere carbon and water exchanges have large uncertainty in terrestrial biosphere models (TBMs). Using observations to reduce TBM structural and parametric errors and uncertainty is a critical priority for both understanding and accurately predicting carbon and water fluxes. Recent implementations of the Bayesian CARbon DAta–MOdel fraMework (CARDAMOM) have yielded key insights into ecosystem carbon and water cycling. CARDAMOM estimates parameters for an associated TBM of intermediate complexity (Data Assimilation Linked Ecosystem Carbon – DALEC). These CARDAMOM analyses – informed by co-located C and H2O flux observations – have exhibited considerable skill in both representing the variability of assimilated observations and predicting withheld observations. CARDAMOM and DALEC have been continuously developed to accommodate new scientific challenges and an expanding variety of observational constraints. However, so far there has been no concerted effort to globally and systematically validate CARDAMOM performance across individual model–data fusion configurations. Here we use the FLUXNET 2015 dataset – an ensemble of 200+ eddy covariance flux tower sites – to formulate a concerted benchmarking framework for CARDAMOM carbon (photosynthesis and net C exchange) and water (evapotranspiration) flux estimates (CARDAMOM-FluxVal version 1.0). We present a concise set of skill metrics to evaluate CARDAMOM performance against both assimilated and withheld FLUXNET 2015 photosynthesis, net CO2 exchange, and evapotranspiration estimates. We further demonstrate the potential for tailored CARDAMOM evaluations by categorizing performance in terms of (i) individual land-cover types, (ii) monthly, annual, and mean fluxes, and (iii) length of assimilation data. The CARDAMOM benchmarking system – along with the CARDAMOM driver files provided – can be readily repeated to support both the intercomparison between existing CARDAMOM model configurations and the formulation, development, and testing of new CARDAMOM model structures.
- Article
(1960 KB) - Full-text XML
-
Supplement
(1677 KB) - BibTeX
- EndNote


Terrestrial biosphere models (TBMs) are a key tool to understanding and resolving the state of terrestrial ecosystems and their sensitivity to climate. Of particular importance are land–atmosphere CO2 fluxes, as the land biosphere is currently a net sink absorbing nearly a third of anthropogenically emitted CO2 (Friedlingstein et al., 2020). However, despite the importance of TBMs in understanding the role of terrestrial ecosystems in the Earth system, model structural uncertainty and parametric uncertainty remain major sources of error and bias impacting terrestrial carbon cycle modeling (Bonan et al., 2019; Quetin et al., 2020), presenting a major challenge to robust prediction of the magnitude of the land sink in coming decades (Booth et al., 2012; Arora et al., 2020). Improved representation and expression of the ecosystem processes of carbon, water, and energy exchanges from and to the atmosphere can improve empirical modeling or data-driven predictions of the key components of the land surface and Earth system and reduce uncertainties (Jung et al., 2020, 2019; Reich, 2010; Tramontana et al., 2016). Model–data fusion (MDF) approaches merging terrestrial biosphere models with observations (Fox et al., 2009; Hill et al., 2012; Keenan et al., 2012; MacBean et al., 2016; Xiao et al., 2014) improve biogeochemical model accuracy and skill by incorporating data from field-based measurements and satellite-based remote sensing observations as well as their associated uncertainties into model calibration. MDF hence offers a much-needed capability to reconcile uncertain model processes with the ever-increasing volume of Earth observation datasets (Caldararu et al., 2012; Quetin et al., 2020; Richardson et al., 2011; Rowland et al., 2014; Smallman et al., 2017). Specifically, data-constrained processes should improve the accuracy of estimates of global plant and soil C dynamics, as well as their exchanges with each other and with the atmosphere, and enable quantification of their uncertainty (Bloom et al., 2016). MDF representations of terrestrial ecosystem C cycling combines the advantage of having a process-based, mathematically refined expression of the ecosystem C budget and parameter estimation that takes external constraints with their uncertainties into consideration. Contingent on the accuracy of a particular model's C cycle mechanisms, MDF can improve simulation results – relative to both assimilated datasets and withheld data from validation – due to improved parameter estimates of biogeochemical processes that may be introduced or influenced by external forcing (Bloom et al., 2020).
The CARbon DAta–MOdel fraMework (CARDAMOM) MDF system approach has been applied to a range of scales and with a wide range of in situ and satellite datasets to (i) constrain terrestrial C cycle states and processes within a Bayesian model–data fusion framework and (ii) diagnose these analyses to address questions or test hypotheses on the current and evolving state of the terrestrial C balance (Bloom et al., 2016; Smallman et al., 2017; Yin et al., 2020; Exbrayat et al., 2019; Quetin et al., 2020; Bloom et al., 2020, amongst others). The Data Assimilation Linked Ecosystem Carbon (DALEC; Williams et al., 2005) model is a key component of the CARDAMOM framework describing the ecosystem carbon and water cycles. The DALEC model has multiple versions varying in structural complexity and process representation (Famiglietti et al., 2021), including alternate forms of climate sensitive phenology (Smallman et al., 2017), time-dependent autotrophic respiration processes (Rowland et al., 2014), an array of hydrological representations (Bloom et al., 2016; Bloom and Williams, 2015; Exbrayat et al., 2019; Fox et al., 2009; Quetin et al., 2020; Rowland et al., 2014; Smallman and Williams, 2019; Spadavecchia et al., 2011), expanded representation of heterotrophic respiration sensitivity to climate, and explicit representations of ecosystem-level water use efficiency (Bloom et al., 2020) among other model structures.
Invariably, observations play a critical role in (i) informing uncertain processes and reducing model error, (ii) providing a quantitative metric for validating model performance, and (iii) motivating subsequent model process representations. In particular, FLUXNET – an ensemble of C and H2O flux estimates from 200+ eddy covariance flux tower sites – has been instrumental in the calibration and validation of land surface models (Williams et al., 2009). As one of the most complete and sophisticated field-based databases of land surface fluxes, FLUXNET provides gap-filled measurements of tower-based micrometeorology and eddy covariance estimates of exchanges of carbon dioxide, water vapor, and energy between the biosphere and atmosphere (Schwalm et al., 2010; Pastorello et al., 2020). With the increasing availability (in terms of both spatial coverage and record length) of eddy covariance measurements over participating FLUXNET sites, data-driven methods, or data assimilation models, have become popular and delivered progressively more accurate retrieval results with the aid of remote sensing data for large-scale studies (Anderson et al., 2007; Gonsamo et al., 2012; Velpuri et al., 2013). Gross primary productivity (GPP) and net ecosystem exchange (NEE) are two of the key fluxes in the terrestrial C cycle related to plant growth and the net C sink through vegetation, but they are difficult to measure due to the complications between processes in the biosphere (Gilmanov et al., 2003; Wang et al., 2006). Evapotranspiration (ET) is another key measure related to water, energy, and carbon fluxes quantifying the combined process of transpiration, soil evaporation, and canopy-intercepted rainfall evaporation. The FLUXNET dataset in its entirety is particularly well suited for benchmarking and validating CARDAMOM C and H2O flux estimates, and a number of CARDAMOM–DALEC implementations across FLUXNET sites have demonstrated the scientific and technical merits of assimilating and predicting withheld observations (Bloom and Williams, 2015; Famiglietti et al., 2021; Smallman et al., 2017).
Overall, systemically challenging existing CARDAMOM model structures against observations – and using these outcomes to formulate new model structures – is a necessary process for advancing understanding and prediction of terrestrial C and H2O fluxes. Among some of the key questions motivating CARDAMOM model–data fusion development decisions are the following: when trained with observations, do CARDAMOM models improve representation of principal carbon and water dynamics across terrestrial ecosystems? Which CARDAMOM model structures or model–data fusion configurations exhibit optimal predictive skill against withheld flux observations? For a given CARDAMOM model structure, is the predictive skill constant, regardless of the training or prediction window, or the length of calibration period correlated with prediction error? Which model parameters or processes are key to the improvement of predictive skill? These questions have continually motivated – and will continue to motivate – the development of CARDAMOM model structures and associated model–data fusion configurations. Consequently, systematic and easily repeatable evaluations of CARDAMOM outputs against a broad set of C and H2O flux observations would amount to an indispensable strategy for supporting CARDAMOM model developments.
Here, we present CARDAMOM-FluxVal version 1.0, a concerted FLUXNET-based validation framework to support a global evaluation of CARDAMOM model–data fusion approaches. CARDAMOM-FluxVal provides a validation test bed for benchmarking CARDAMOM model structures against FLUXNET 2015 GPP, NEE, and ET datasets. To demonstrate the operation of the validation framework, we present quantitative assessments of the performance of two example CARDAMOM model configurations – one solely trained by satellite and inventory datasets and the other trained with an additional constraint using observations from FLUXNET sites. The methodology is described in Sect. 2. In Sect. 3, we present a concise set of validation metrics (against assimilated and withheld FLUXNET observations) and further evaluate performance sensitivity to the choice of constraining variables, temporal length of data assimilation, and particular land-cover types. Finally, in Sect. 4 we summarize the strengths and limitations of our CARDAMOM validation approach and outline its potential applications for (i) benchmarking and intercomparing current and future CARDAMOM configurations, and (ii) we provide recommendations and guidance to conduct scientific investigations.
The method section includes descriptions of the CARDAMOM implementation across FLUXNET 2015 sites (Sect. 2.1), satellite and inventory-based observations used for assimilation (Sect. 2.2), and the statistical measures used in model validation and extended evaluations (Sect. 2.3).
2.1 CARDAMOM implementation across FLUXNET 2015 sites
The components needed to configure CARDAMOM at each FLUXNET site namely include (a) time series of meteorological forcing variables for the DALEC model, (b) a collection of observational constraints on DALEC states and fluxes, and (c) additional attributes relating to CARDAMOM prior probability and likelihood functions (Bloom et al., 2020). At each site, we built stand-alone CARDAMOM “driver” files, which consist of (i) 2001–2015 ERA-Interim meteorological forcings from the nearest 0.5∘ grid based on each site's latitude and longitude value and (ii) FLUXNET and ancillary observations, including leaf area and biomass (see Sect. 2.2 and Fig. S1). We configured the CARDAMOM model across all FLUXNET 2015 sites during the period of 2001–2015 (204 sites in total, see Sect. 2.2). The observational time span for each site is from a few months to 15 years, depending on the site characteristics. We chose to implement CARDAMOM for the entirety of the 2001–2015 period at each site in order to exclude the effect of varying CARDAMOM simulation lengths in the subsequent CARDAMOM evaluations. A summary of all FLUXNET 2015 sites used in CARDAMOM-FluxVal here is included in the Supplement (Table S5). The aforementioned datasets amount to baseline datasets for the entire CARDAMOM-FluxVal (version 1.0) system. The CARDAMOM-FluxVal driver files are available in the Supplement (Table S6).
At each FLUXNET site, we used CARDAMOM Bayesian model–data fusion methodology (Bloom et al., 2020) to calibrate the DALEC model parameters and initial conditions and to validate DALEC model simulations against a subset of withheld data. In particular, the observations assimilated into CARDAMOM were used to optimize DALEC model parameters and initial conditions in order to statistically minimize model–data mismatches. The observations withheld from CARDAMOM were used to validate DALEC carbon and water fluxes outside the training window, i.e., in the absence of data constraints. Depending on the scientific or technical objectives, the CARDAMOM-FluxVal analyses can be configured to exclude any subset of FLUXNET or ancillary data for validation purposes. To exemplify both the assimilation and validation aspects of CARDAMOM-FluxVal, we opted for two distinct CARDAMOM configurations (Fig. 1).
-
CARDAMOM analysis A1. The CARDAMOM DALEC model is constrained by the first 50 % of FLUXNET data at each site; 50 % of FLUXNET data are withheld for validation.
-
CARDAMOM analysis A2. The CARDAMOM DALEC model is constrained by 0 % of FLUXNET data at each site; 100 % of FLUXNET data are withheld for validation.
In both A1 and A2, we used the same ancillary data (satellite-based leaf area index, biomass), cost function configurations, and DALEC model version. For the sake of brevity, the cost function and DALEC model version are described in the Supplement. To configure the A1 scenario, we split the FLUXNET data from each of the site into two periods based on data acquisition time for tower sites with valid observations for the study period from 2001 to 2015.
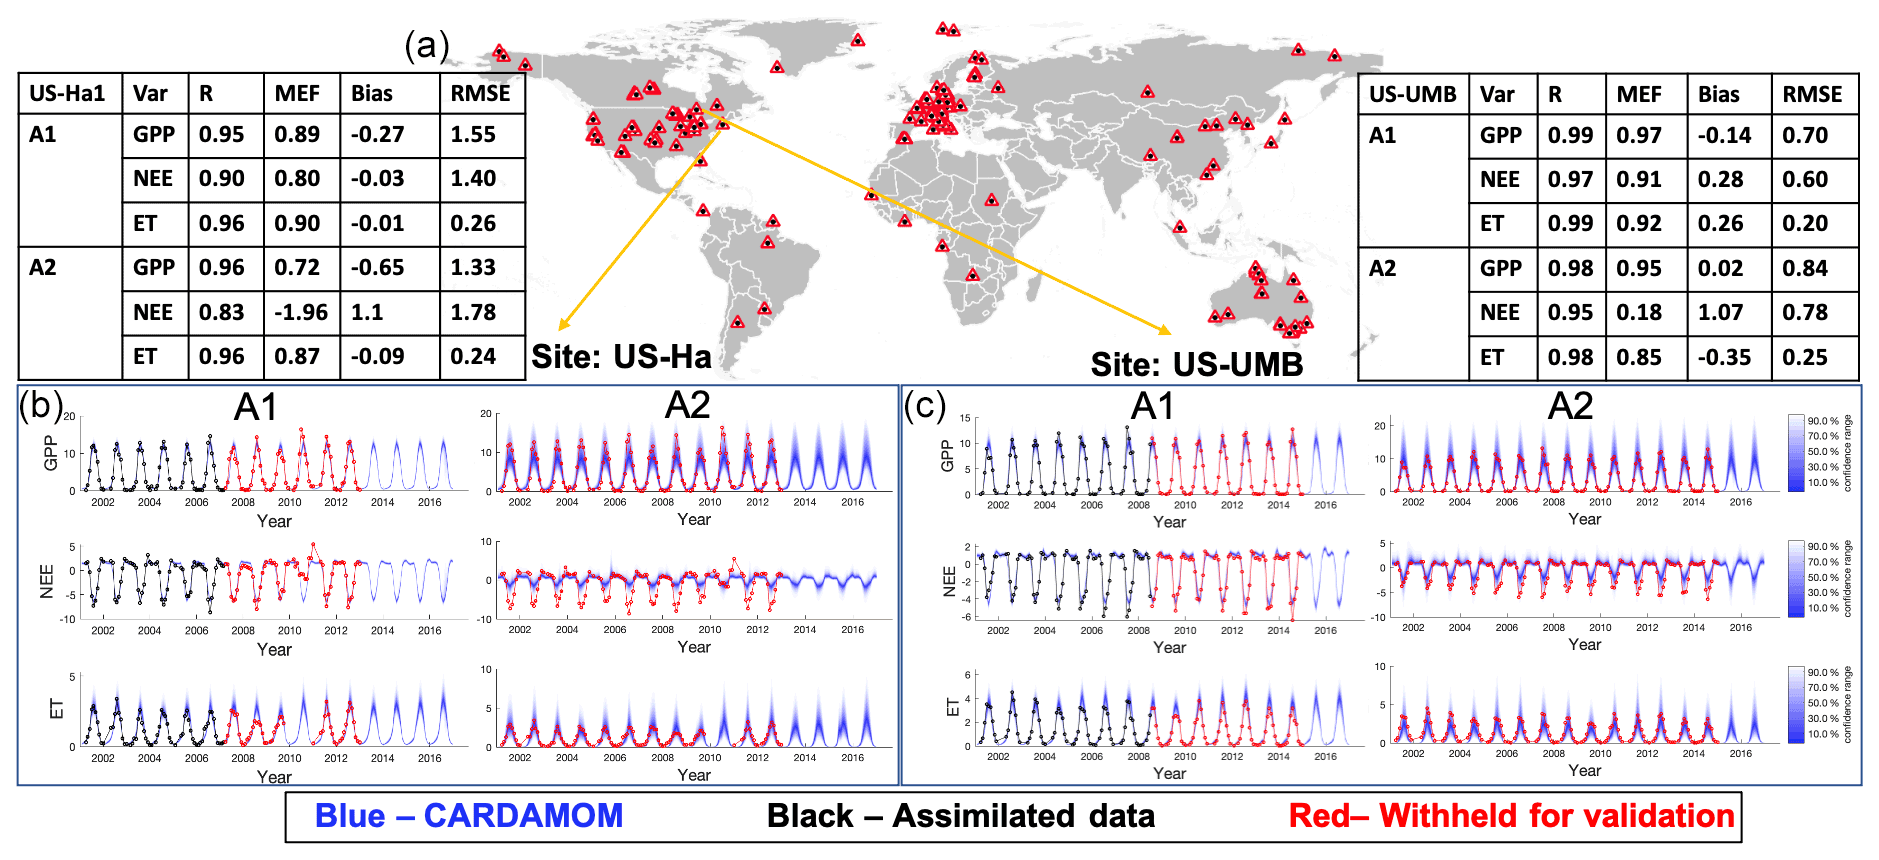
Figure 1Performance of CARDAMOM model simulations (with 50 % of FLUXNET data, Analysis 1 – A1; no FLUXNET data, Analysis 2 – A2). (a) Spatial distribution of FLUXNET tower sites (Tier-1 data). (b) The same time series for the US-Ha site; note that blue lines in GPP, NEE, and ET time series are outputs from model simulations. (c) Time series of CARDAMOM simulations for the US-UMB site; the observed time series from flux towers are also plotted for comparison. Black lines are the first 50 % of FLUXNET observations used for data assimilation, while the red lines are the remaining 50 % of FLUXNET observations used for validation. The validation metrics in the tables are all from the prediction window for the two selected sites.
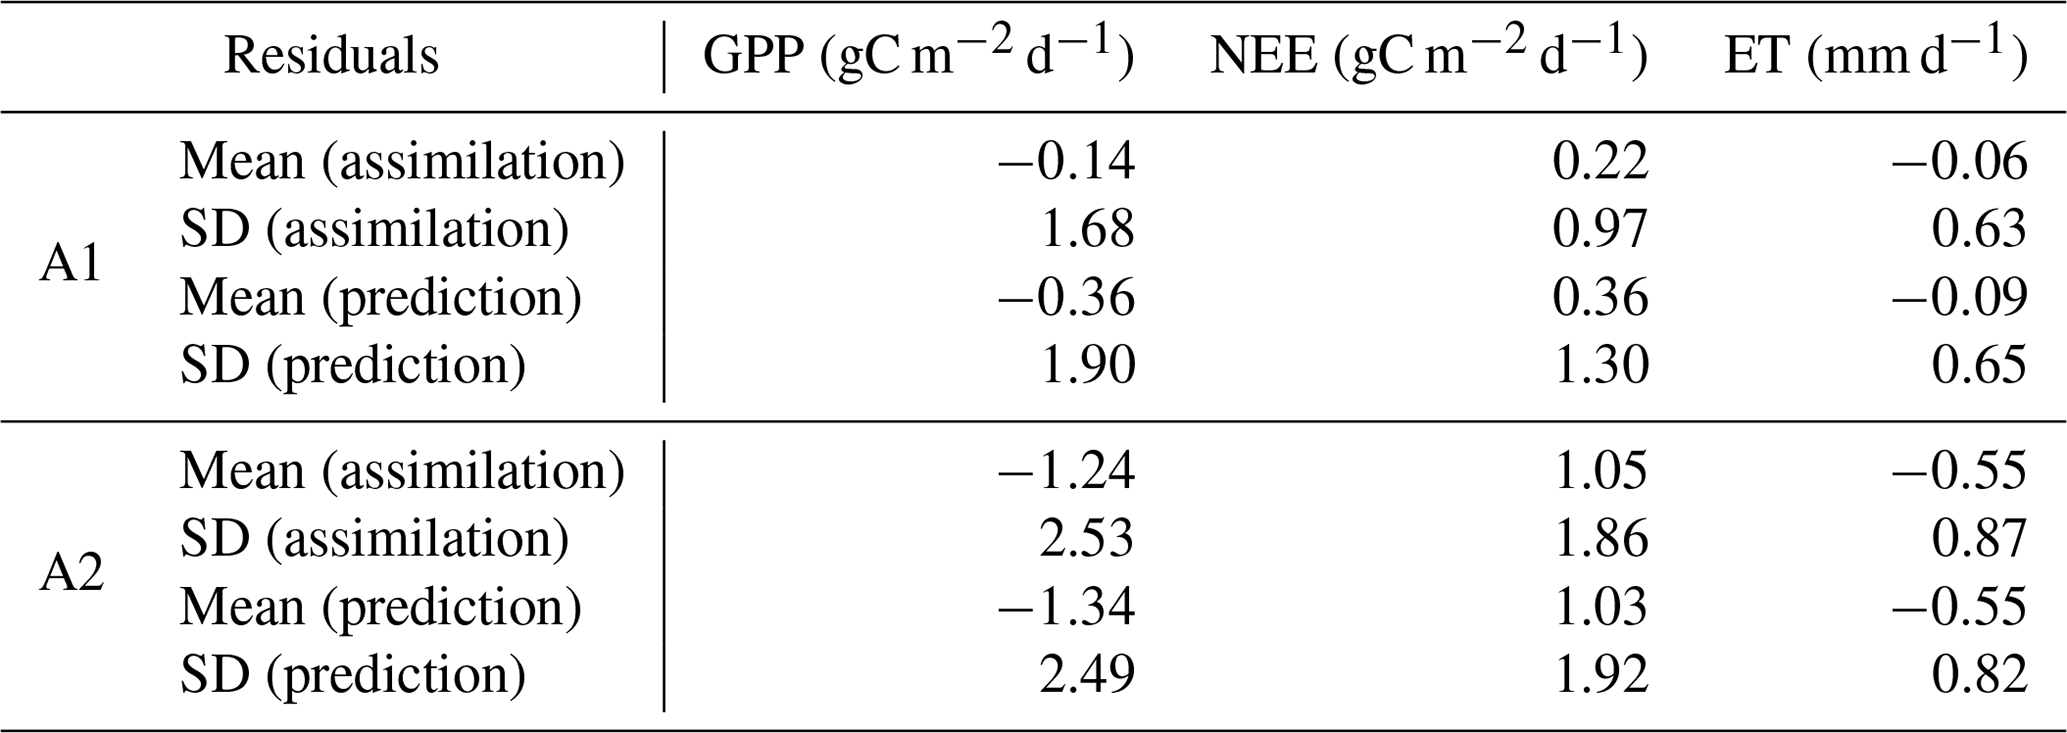
Table 1Monthly-based residuals in assimilation and prediction windows (Fig. 1).
2.2 Observations
A common set of observations is assimilated into both the A1 and A2 analyses; these consist of (1) time series of monthly Moderate Imaging Spectroradiometer (MODIS) leaf area index (LAI) from the MOD15A2H product (Myneni et al., 2015) for the period of 2001–2016 and (2) a single estimate of the global aboveground and belowground biomass (ABGB) in 2015 produced from a combination of field plots, airborne lidar, and satellite data using the machine learning approach (Yu, 2013). To find corresponding mapped values that match FLUXNET data measurements, we aggregated the mapping products (MODIS LAI and ABGB) from their original resolutions to 1 km spatial resolution and extract LAI and ABGB values at all FLUXNET locations.
For the A1, we also included the gap-filled monthly flux measurements from the FLUXNET 2015 dataset (Pastorello et al., 2020) that includes ecosystem-scale data on CO2, water, and energy exchange between the biosphere and the atmosphere, as well as other meteorological and biological measurements collected at sites from the multiple regional flux networks (https://fluxnet.fluxdata.org/data/fluxnet2015-dataset/, last access: February 2020). We used all 204 CC-BY-4.0 (Tier-1) sites to study the data assimilation using GPP, NEE, and ET together as inputs (Table S1). The pre-processing of FLUXNET tower measurements includes a quality check to filter out bad-quality monthly data and the removal of data points where the recorded measurements show constant values throughout the observational period.
2.3 Summary metrics and extended validation
Our summary metrics consist of GPP, ET, and NEE evaluated on a monthly basis, annual basis, and at site level. We selected four statistical metrics to evaluate the model accuracy, parameter correlations, and residuals (Table S2). The Pearson's linear correlation coefficient (R) is the ratio of covariance between the modeled simulations and observations to the product of standard deviations from model simulations and observations (0<R<1 represents a positive correlation between model output and observed values, while −1<R<0 means the model outputs have a negative correlation between model output and observed values). The Nash and Sutcliffe model efficiency (MEF) quantifies the model's predictive capacity (Nash and Sutcliffe, 1970; Tramontana et al., 2016). A 0<MEF<1 indicates that the model's predictive capacity is better than the mean of observations, with a value of 1 meaning perfect predictions, while MEF<0 means the mean values of the observations are better than the model predictions. Bias is defined as the mean of the residual values for model predictions and observed data. A value of bias near zero indicates an unbiased estimation for model predictions. The root mean square error (RMSE) is the square root of the average over squared residuals (prediction errors), and the model predictions are more accurate when RMSE is closer to 0.
For the extended evaluation, we grouped the FLUXNET 2015 sites within six time window categories: data with 1:1 assimilation-to-prediction time ranges spanning <1 year, 1–2 years, 2–3 years, 3–4 years, 4–5 years, and >5 years (all time ranges are either assimilation or prediction lengths). The number of sites varies from 17 to 67 for different categories (Table S3), with the most sites (67) having the range of 1–2 years and the fewest sites (17) having the range of 4–5 years. We evaluated CARDAMOM performance across 12 land-cover types that comprise the FLUXNET 2015 sites included in this study (Table S3). In summary, ENF (evergreen needleleaf forest) and GRA (grasslands) have more than 30 tower sites, while SNO (snow) and CSH (closed shrublands) have only one and two sites globally. Assuming that the CARDAMOM model has valid outputs for GPP, NEE, and ET across different land-cover types, we evaluated the influence of land-cover types on the prediction accuracies.
We tested the importance of model parameters for the retrievals of GPP, NEE, and ET by calculating each parameter's correlations with the model residuals. A total of 36 model parameters (model description in the Supplement) were tested and attributed to six groups based on their relative contributions to different biophysical processes (Table S4). We tested the correlations between model parameters and retrieval residuals using the R metric for independent validation datasets.
3.1 Summary metrics for CARDAMOM FLUXNET validation
We found good agreements between median model outputs from CARDAMOM–DALEC and site-based FLUXNET observations (GPP, NEE, and ET; Fig. 2) for the A1 scenario. Generally, data samples used in the assimilation window show better agreements between observations and simulations (i.e., higher MEF and lower RMSE) than the data in the prediction window. Monthly-based comparisons, due to the seasonal variation in each variable, have a wider data range than the range of site-level data. The MEF metrics show that GPP has the best simulation results in both the assimilation and prediction windows relative to NEE and ET. Furthermore, NEE presents a better MEF in the assimilation window than ET but is worse than ET in the prediction window. The same pattern is clearer in the site-level scatter plots when we only compare the long-term average observations for each FLUXNET site. In the A1 scenario, we obtained the highest MEF in the site-level comparison during the assimilation window (e.g., NEE; Fig. 2) but the lowest MEF during the prediction window, indicating that the assimilation procedure may be overfitting to the observations.
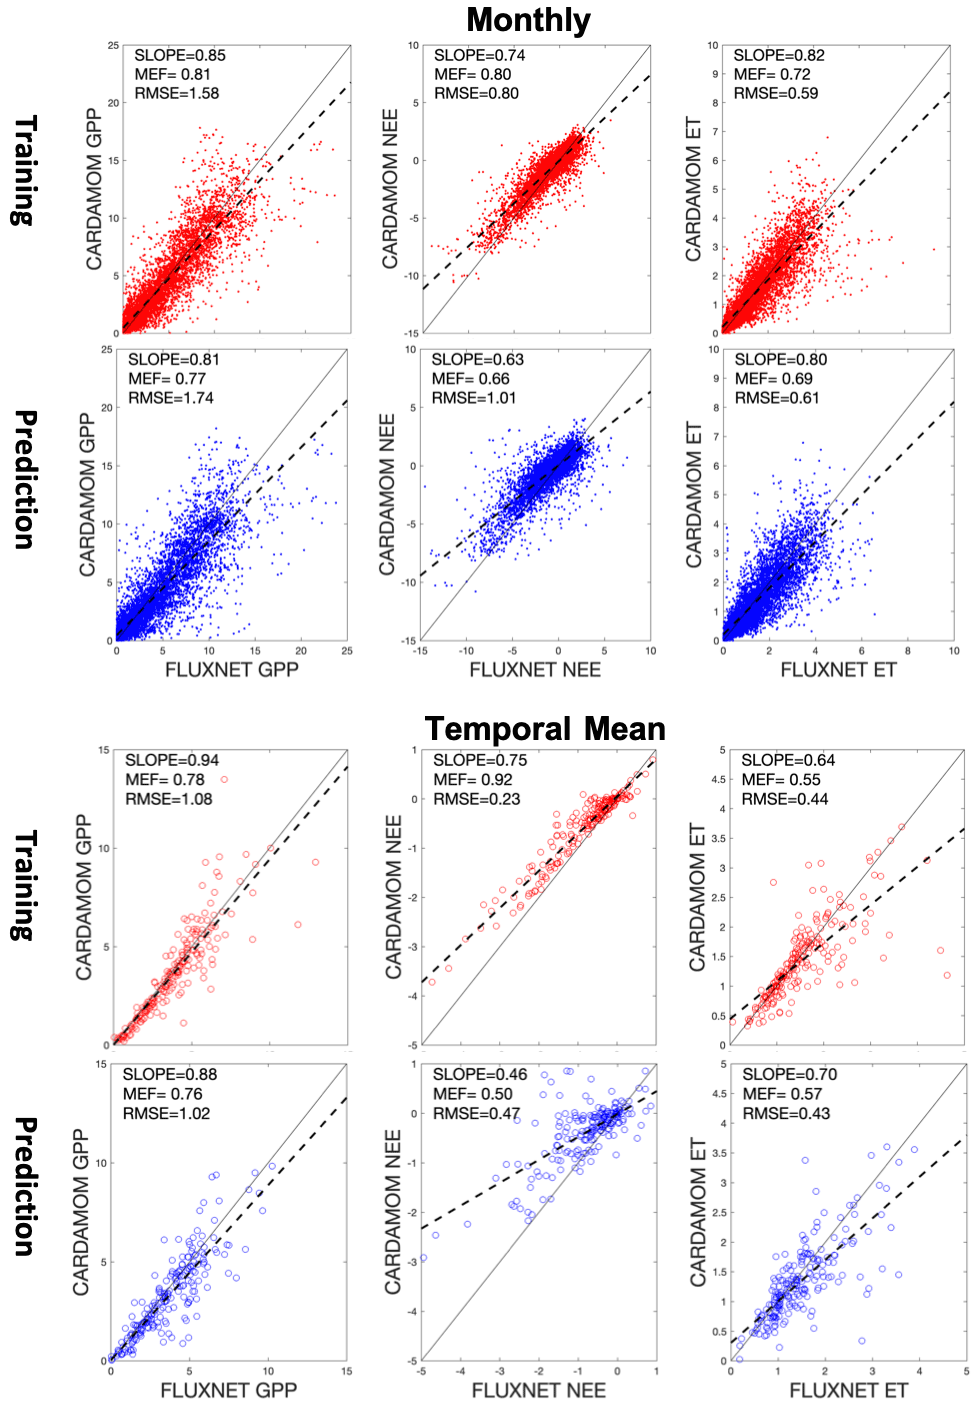
Figure 2Scatter plots of CARDAMOM outputs (GPP, NEE, and ET) versus observations from FLUXNET data (A1 scenario). Scatter plots in red are results from the assimilation window, and the scatter plots in blue are for the prediction window. We plotted the data both from a monthly basis (top two panels) and at site level using the long-term averages (bottom two panels) for comparison.
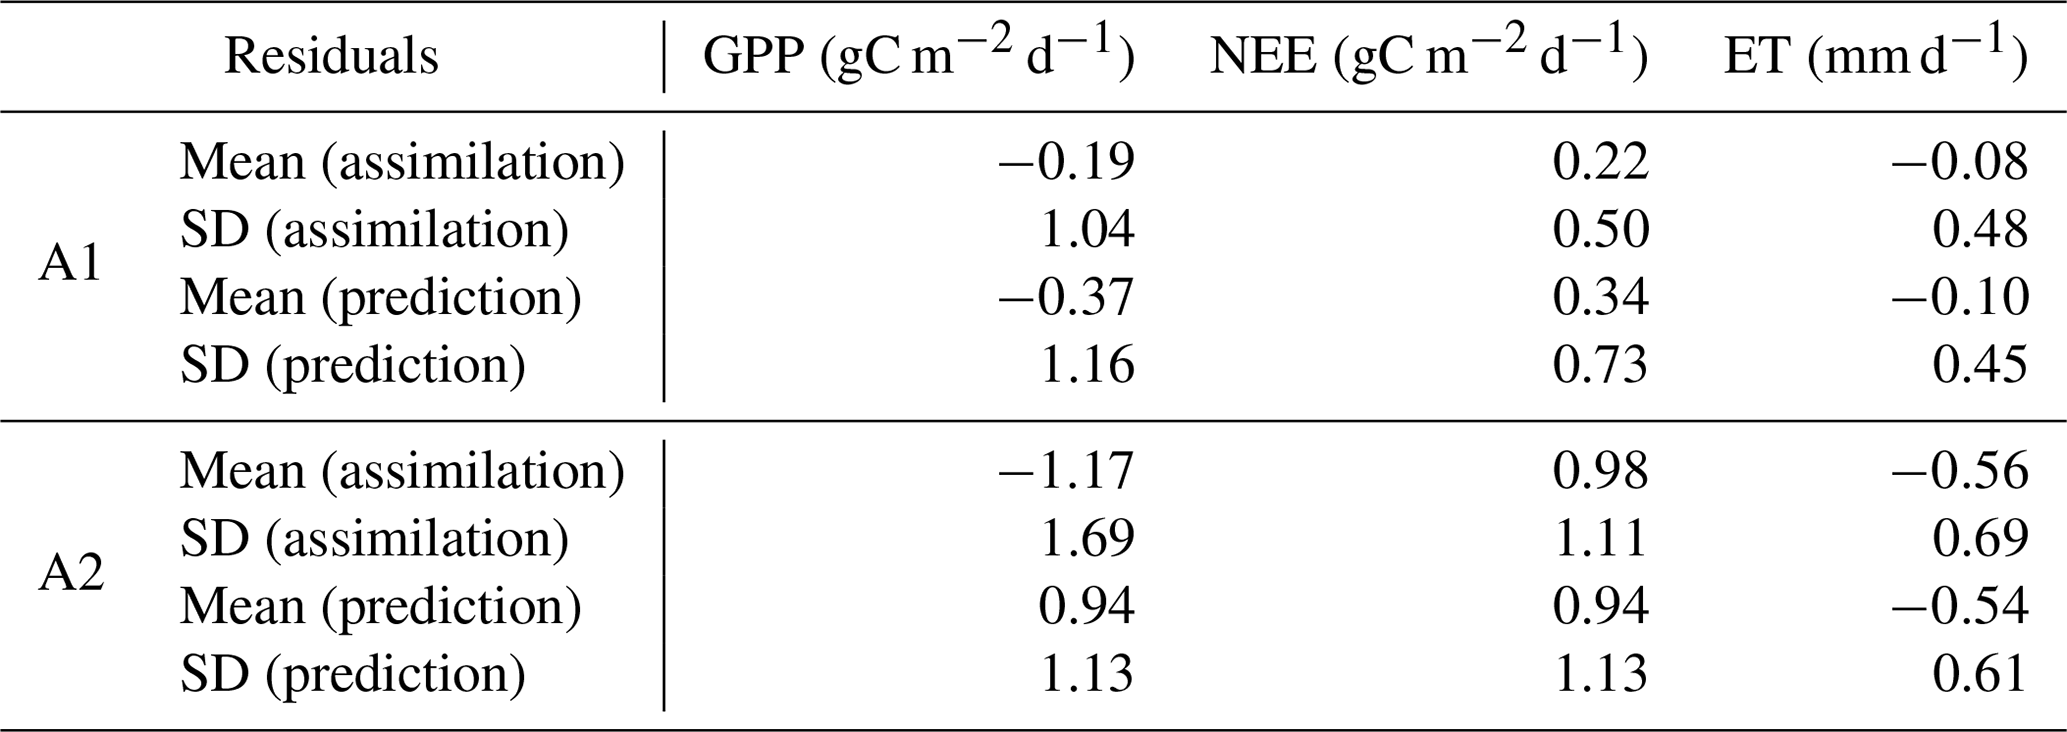
Table 2Annual-based residuals in assimilation and prediction windows (Fig. 2).
The model–data residual analysis shows that it is possible to improve the cross-validated model outputs and reduce biases and structure errors with assimilation of FLUXNET observations (Figs. 3–4, S2–S4). Histograms of monthly-based residuals at the monthly timescale over all sites (Fig. 3) show that A1 gives less-biased model residuals than the outputs of A2. In general, A1 shows a positive NEE bias of 0.36 gC m−2 d−1 and negative GPP and ET biases of 0.36 gC m−2 d−1 and 0.09 gC mm d−1, respectively, while A2 shows much larger biases (NEE bias: +1.03 gC m−2 d−1, GPP bias: −1.34 gC m−2 d−1, ET biases: −0.55 mm d−1). Annual-based distributions (Fig. S2) of model retrieval residuals show patterns similar to monthly residuals, except that A1 shows tighter distributions around zero due to the average of seasonal variations. The temporal average of site-level histograms (Fig. 4) preserves spatial characteristics of the model retrieval residuals. Unsurprisingly, A2 has more outliers than A1 at the site-level scale. Predicted absolute values (GPP, NEE, and ET) instead of residuals show a wider range of distributions (Fig. S3) for A1 than A2, suggesting that A1 runs capture more spatial and temporal variability with higher accuracies and lower biases. The comparisons of second-order distribution (standard deviation of distribution) provide additional evidence that A1 has ranges closer to the observed distributions (Fig. S4).
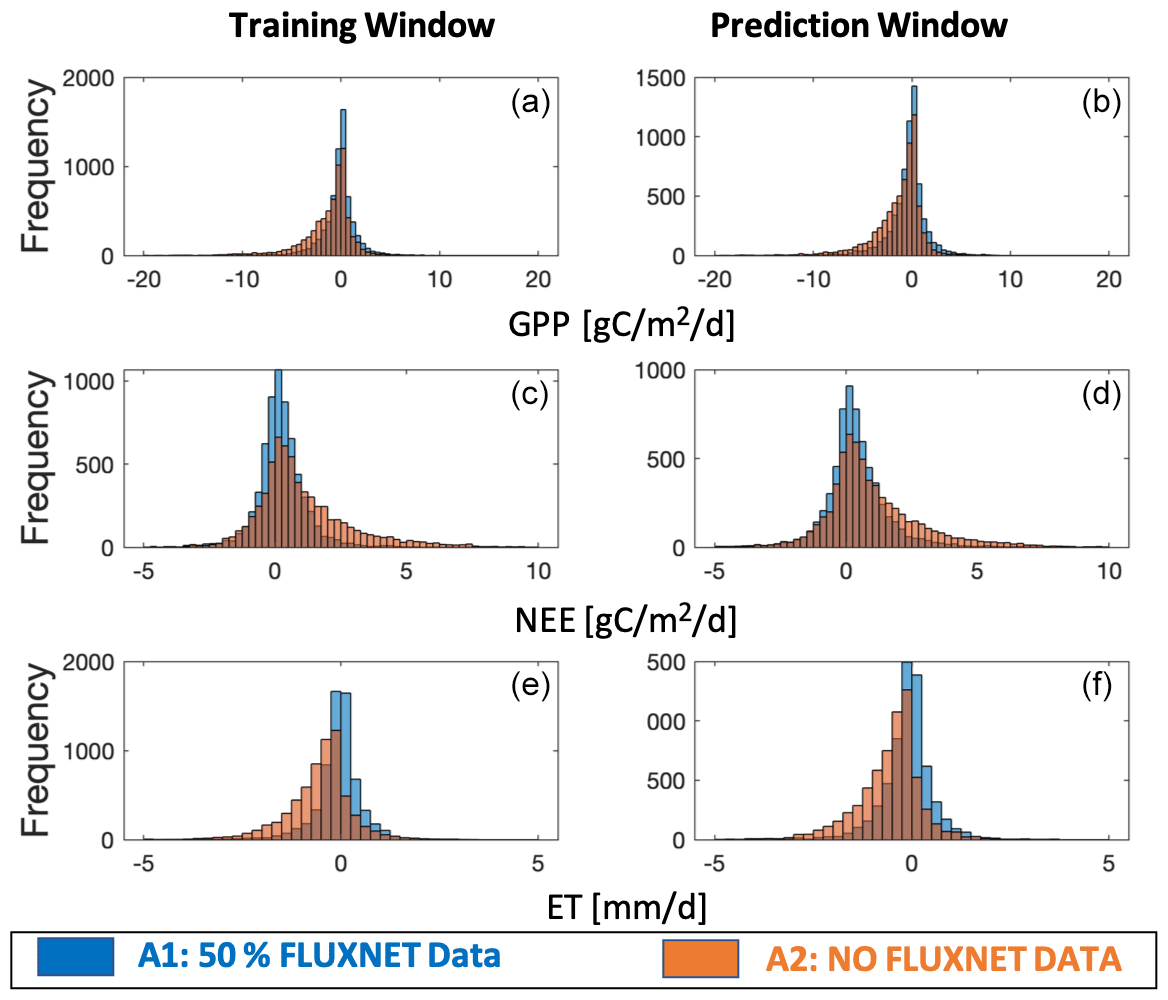
Figure 3Histogram of monthly-based residuals over all sites for the assimilation window (a, c, e) and prediction window (b, d, f). Residuals are the differences between model outputs (GPP, NEE, and ET) and observations (GPP, NEE, and ET measured at tower sites). Two different CARDAMOM runs are shown as A1 and A2 (A1 means model simulations using 50 % FLUXNET data as constraints; A2 means baseline model simulations with no FLUXNET data).
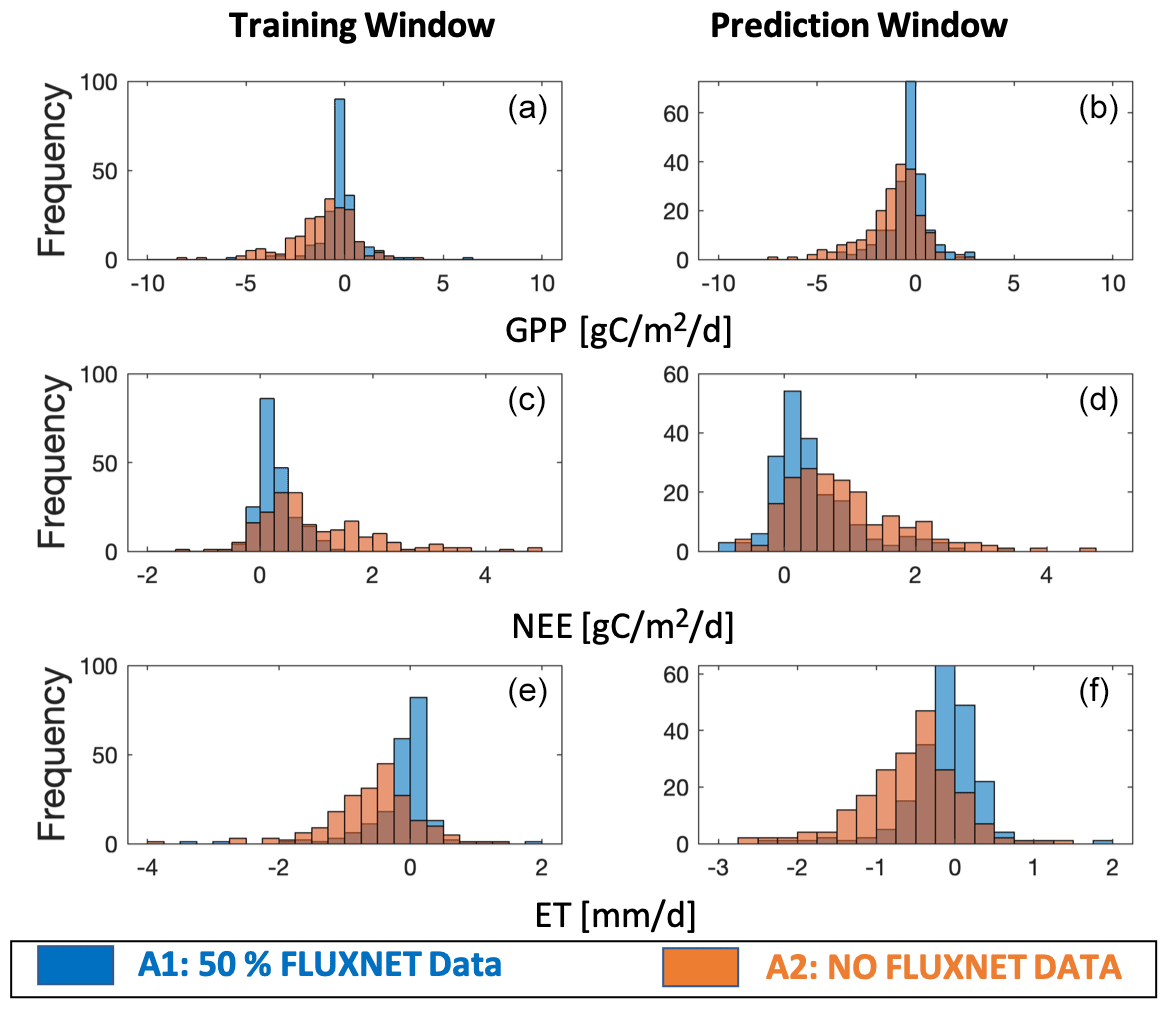
Figure 4Histogram of site-level residuals over all sites for the assimilation window (a, c, e) and prediction window (b, d, f). Residuals are the differences between model outputs (GPP, NEE, and ET) and observations (GPP, NEE, and ET measured at tower sites). Two different CARDAMOM runs are shown as A1 and A2 (A1 means model simulations using 50 % FLUXNET data as constraints; A2 means baseline model simulations with no FLUXNET constraints).
Table 3Site-level residuals in assimilation and prediction windows (Fig. 3).

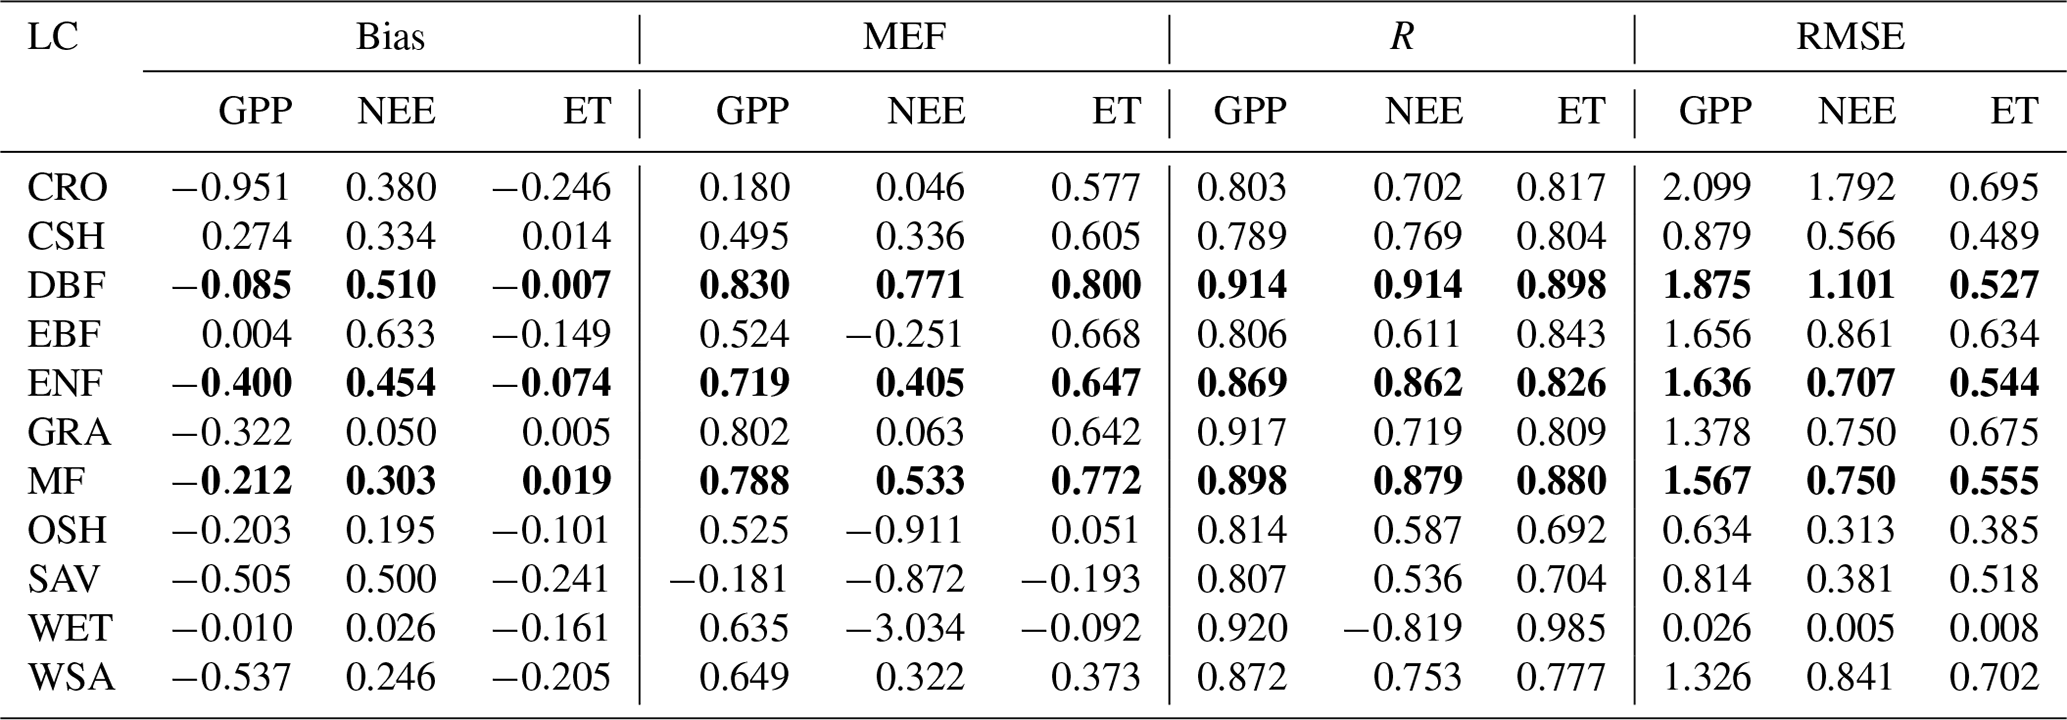
Table 4The bias, MEF, R, and RMSE of GPP (unit: gC m−2 d−1), NEE (unit: gC m−2 d−1), and ET (unit: mm d−1) assimilation versus the flux tower data for different land-cover types. Text in bold shows the land-cover types that have the most accurate predictions.
The constrained runs of the CARDAMOM model (A1) show substantial improvements in both matching the FLUXNET observations and reducing the model output uncertainties (Fig. 1). In other words, the added value of data in A1 – relative to A2 – leads to more accurate predictions of GPP and ET, as well as reasonable NEE. Two well-studied long-term research sites (US-Ha and US-UMB) in the United States show that the model outputs of A1 capture the stronger seasonality of NEE compared to the outputs of A2 (Fig. 1b and c), which shows weaker seasonality patterns. Especially during the peak of growing seasons, NEE has a strong land C sink observed from tower sites, but model outputs of A2 are systematically lower in terms of C sink magnitudes. Both A1 and A2 can capture seasonal changes in GPP and ET within the model-estimated confidence intervals (CIs). However, the CI bounds are significantly reduced for A1 (e.g., the 90 % CI bound of ET from A2 is ∼ ±2.5 mm d−1 during the peak growing seasons, and it is reduced to ∼ ±1.5 mm d−1 for A1 at the selected US tower sites) due to the data assimilation process using site-level observations.
3.2 Extended assessment of CARDAMOM performance
The CARDAMOM-simulated fluxes are more sensitive to certain ecosystem parameters than others (Fig. 5). Results show that the modeled GPP is mostly correlated with the model parameters C1 (canopy efficiency), A1 (autotrophic respiration), and W1 (underlying water use efficiency; see the Supplement for parameter details); these three parameters stand out as they are positively related to GPP variation with Pearson's R greater than 0.1, while the R values for all other parameters are near zero. For the NEE output, parameter I6 (soil organic carbon – SOC) is the most negatively correlated factor with NEE, and parameter T6 (soil organic matter – SOM – turnover rate) is the most positively correlated. However, none of the R values for NEE have a magnitude >0.1. The output of ET is also correlated with three parameters: W1 (underlying water use efficiency), W2 (runoff coefficient), and W5 (radiation coefficient), with W1 being negatively correlated with ET and the other two positively correlated. All three parameters stand out as substantially different from all other model parameters, indicating the crucial impact of these parameters on the ET output. As expected, the A1 experiment shows reduced uncertainty in a few estimated parameters when compared to the A2 experiment, indicating that the additional use of observational data imposes constraints on model parameters as well (Fig. S5).
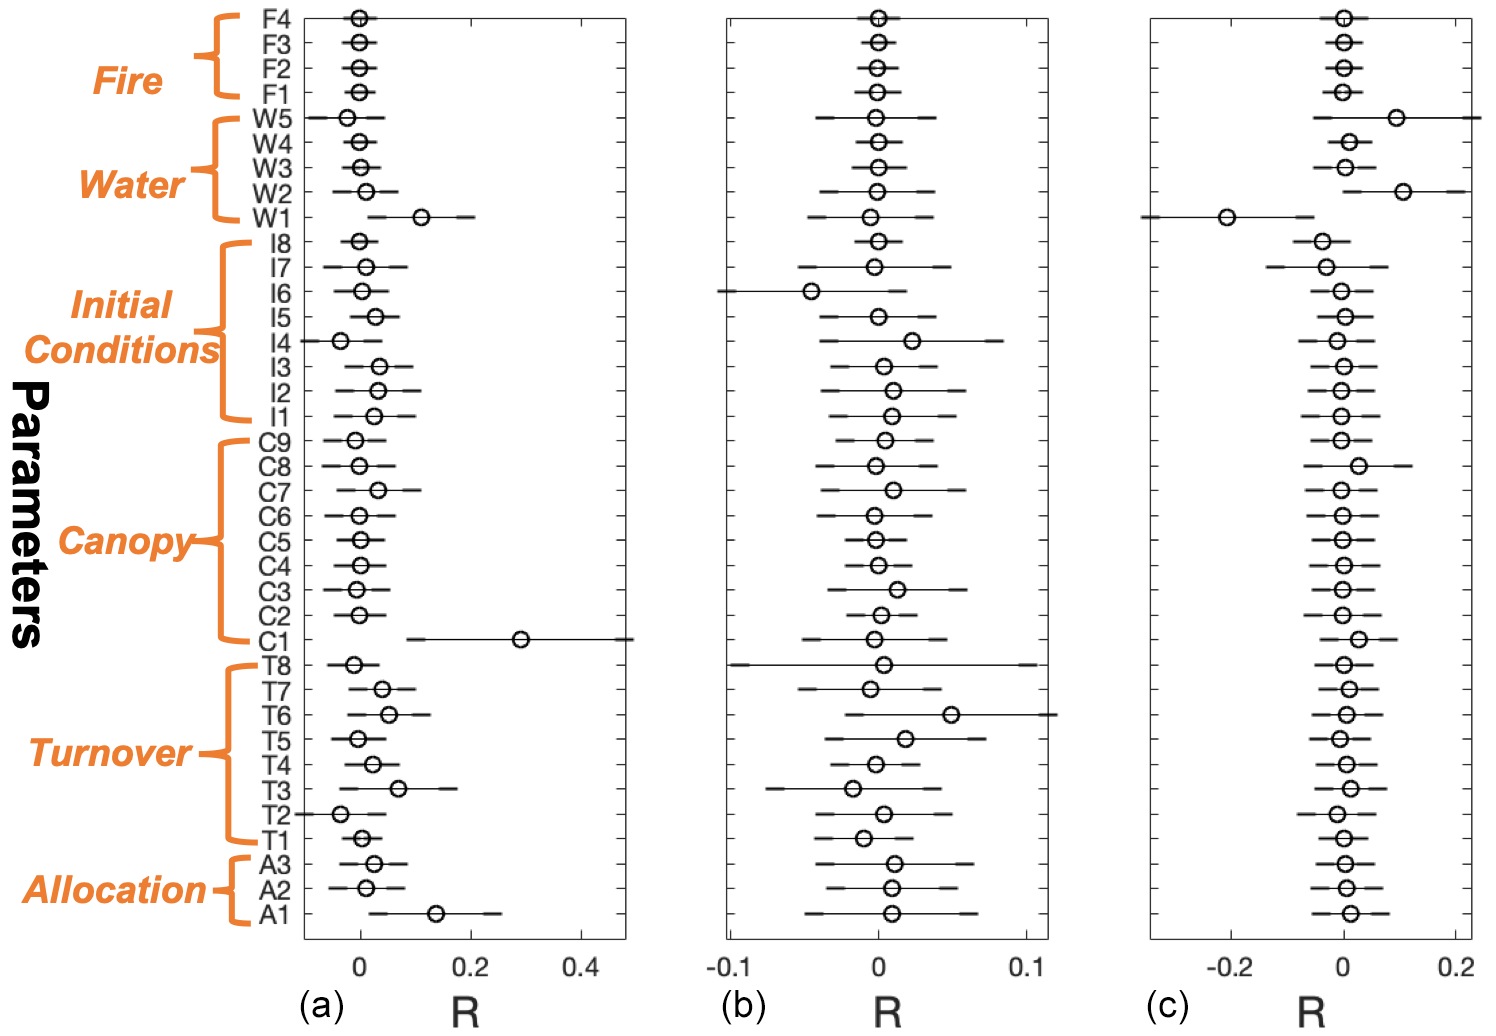
Figure 5Correlations between the site-level model parameters and residuals of GPP (left column), NEE (central column), and ET (right column) over all sites in the prediction window. Parameters are described in Table S2.
Based on the major land-cover types classified at the FLUXNET tower sites, we investigated the effects of land cover on the performance of CARDAMOM model retrieval. Results show that the forest types, except the evergreen broadleaf forest, generally have more accurate predictions than non-forest types (Fig. 6). The three major types of forests – deciduous broadleaf forest (DBF), evergreen needleleaf forest (ENF), and mixed forest (MF) – all have high R (>0.8) and MEF (>0.6) values. The relatively small uncertainty ranges (<0.1 for R) also indicate the stable performance of these forest types. The evergreen broadleaf forest (EBF) in the tropics, though fewer sites are available (half of DBF and one-third of ENF), exhibits the difficulties in retrievals with lower performance values and higher uncertainty ranges.
For non-forest sites, the retrieval accuracy varies from site to site (Fig. 6) and has large uncertainties. In particular, savannas, woody savannas, and closed shrublands are the three land-cover types showing the least accuracy and highest uncertainty, significantly in the NEE and ET retrievals (with R∼0.6 and MEF being negative). Other herbaceous vegetation types, including grasslands and crops, have generally better retrievals than spatially heterogeneous land-cover types, such as savannas, but are not as good as retrievals over extratropical forests (Smallman and Williams, 2019).
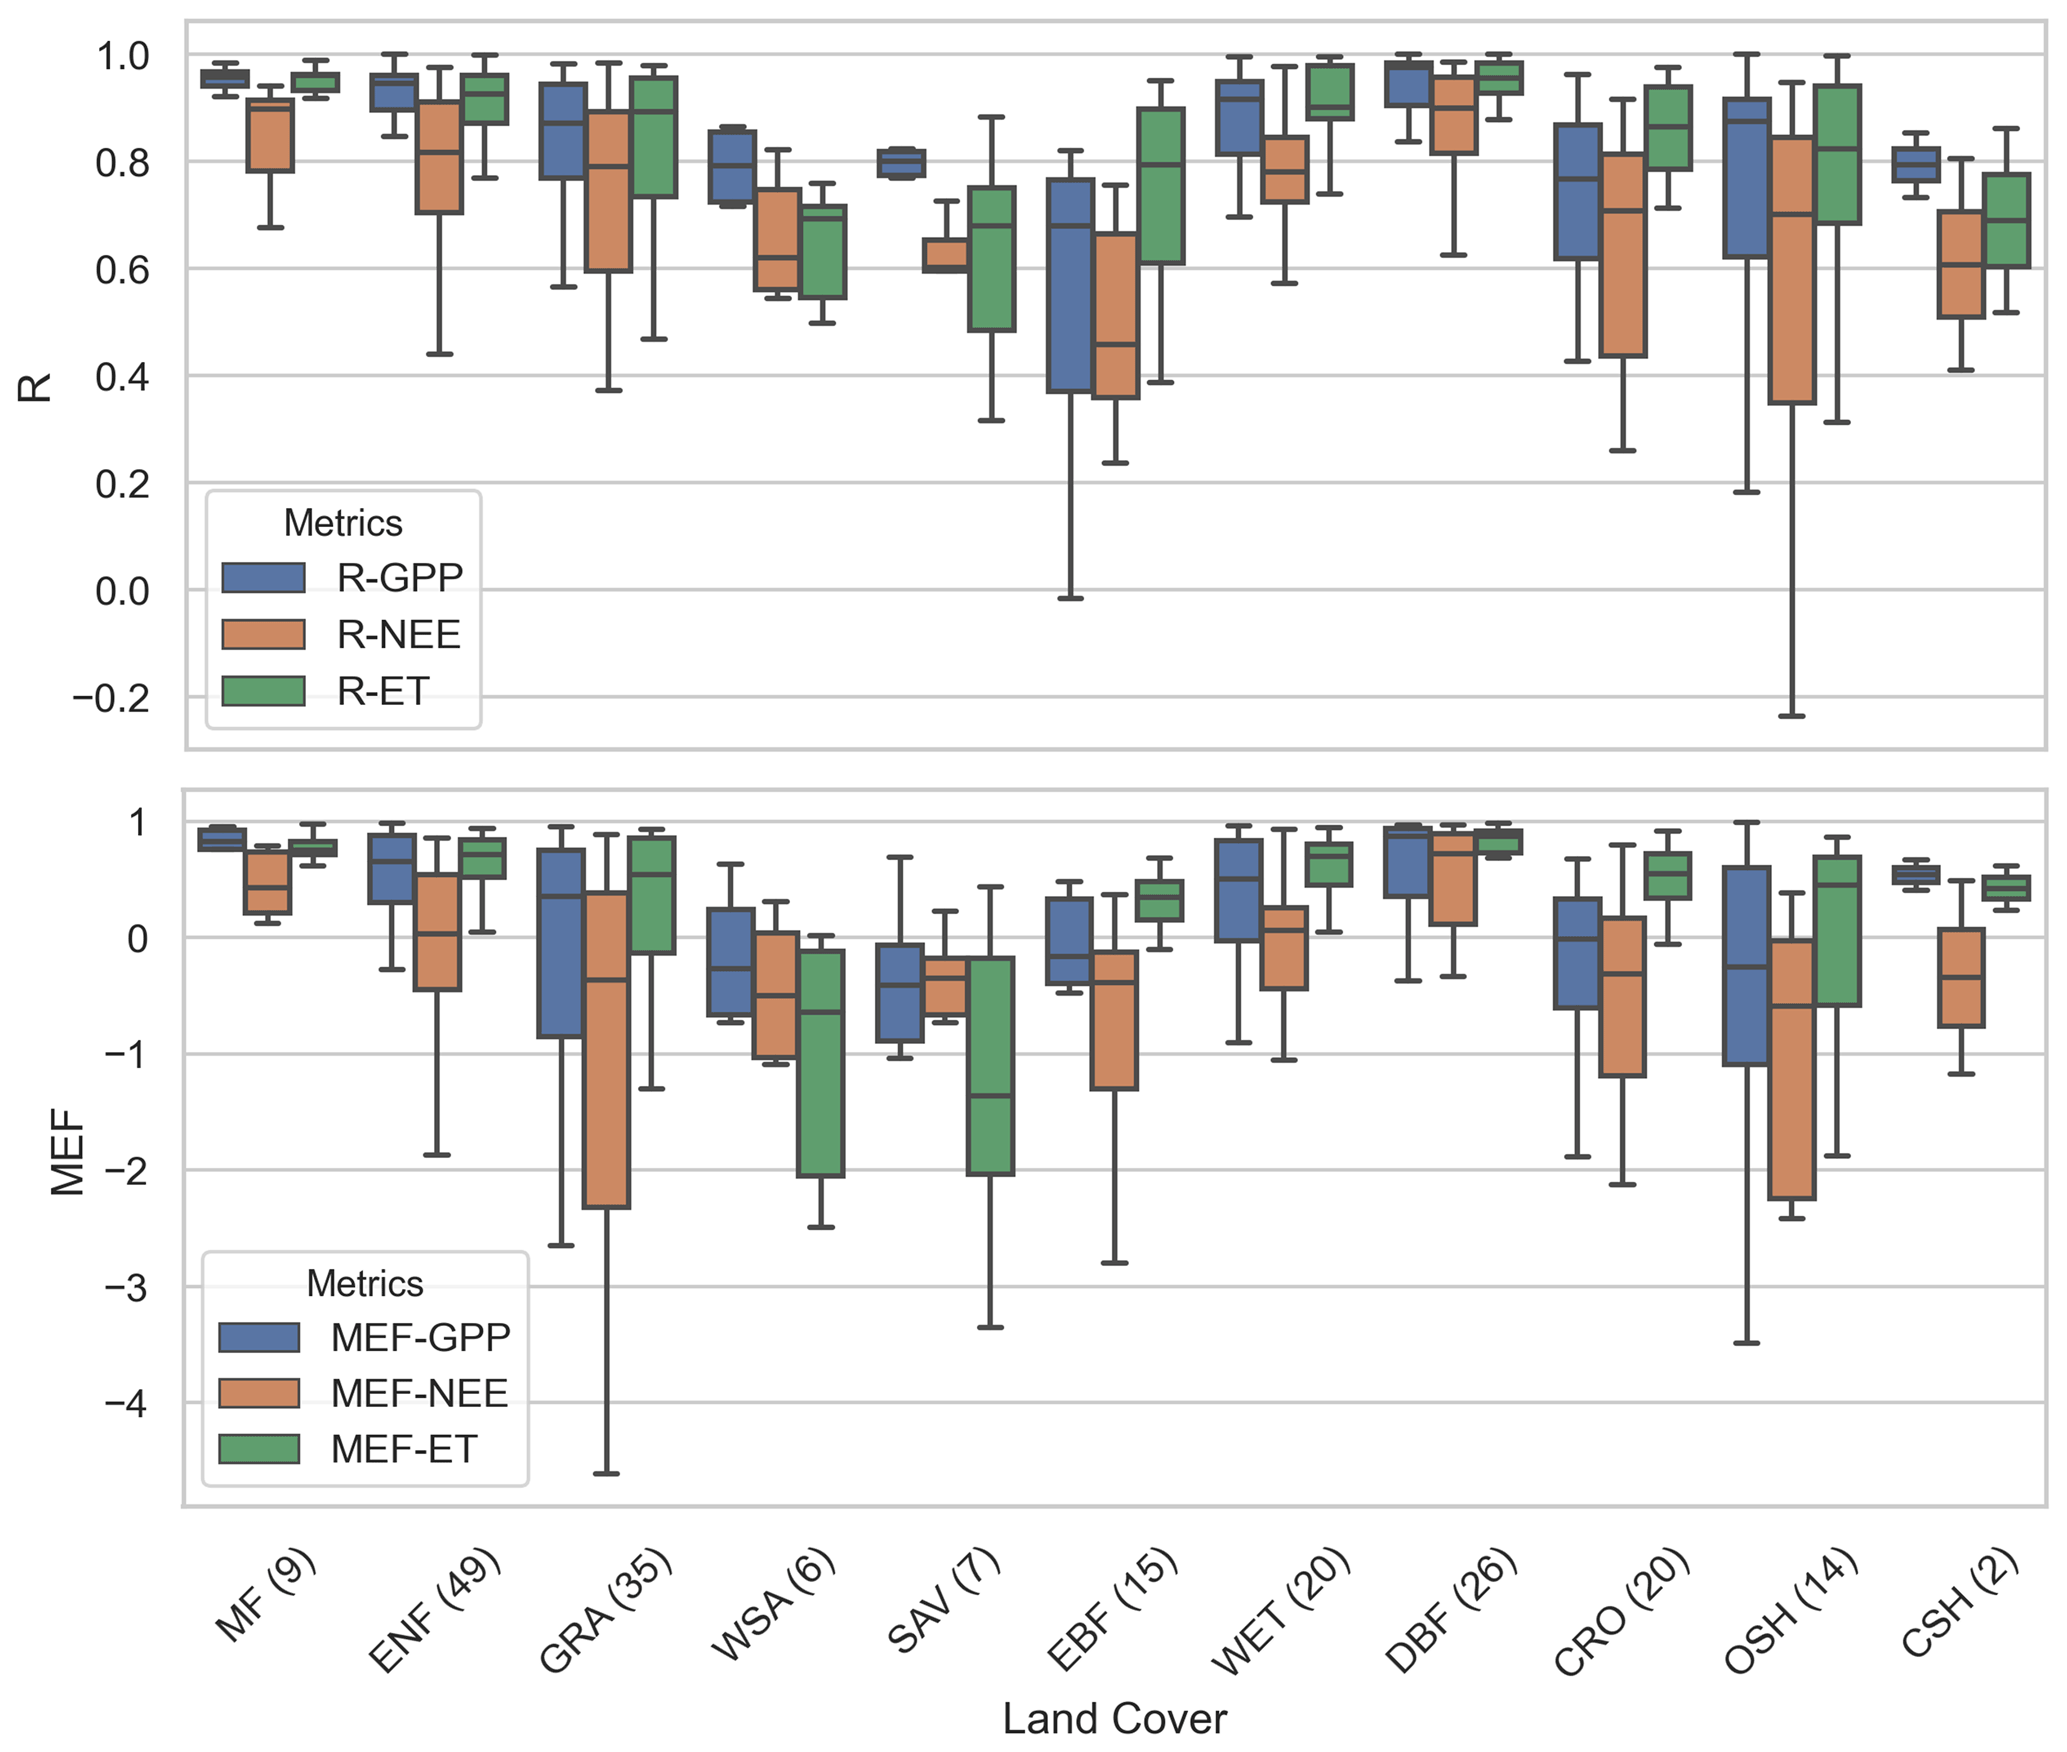
Figure 6Box plots of correlation metrics (R and MEF) for CARDAMOM outputs (GPP, NEE, or ET) versus FLUXNET tower measurements with different land-cover types (A1 scenario, prediction window). The full names of land-cover types can be found in Table S3. The number in parentheses (x axis) indicates the total available tower sites for each land-cover type.
The FLUXNET dataset has various lengths of observations in time (Table S3). Separating the results by the length of assimilations, we show that the CARDAMOM model has slightly better predictions of GPP, NEE, and ET when the assimilation period is longer (Fig. 7). The metric MEF for GPP and NEE increases from values below zeros to the maximum positive when the assimilation period reaches 4–5 years. The median of MEF of ET always stays positive, but also has a maximum value at the length of 4–5 years for data assimilation. Meanwhile, the R values show relatively small changes for different lengths of data assimilation, and most values are above 0.8, indicating reasonable assimilations for GPP, NEE, and ET in general. There is a slightly degraded performance in R (a decrease by <0.1) and MEF (a decrease by 0.2–0.3) for the longest assimilation period (>5 years), probably due to the increased size of FLUXNET sites, resulting in the inclusion of certain sites (e.g., tropical forests and/or woody savannas) with known bad performances compared to others. For the sites with record lengths of 2–3 years, the percentage of the non-forest plant functional type (PFT; grassland) is higher than other year ranges. The lack of non-forest sites could possibly be the cause of the worst performance for this length of observations. With long assimilation windows, there is also a general trend of reduced uncertainty for both NEE and ET predictions. GPP has a reduction in uncertainty for longer training windows until 4–5 years and increases for the longest assimilation period (>5 years).
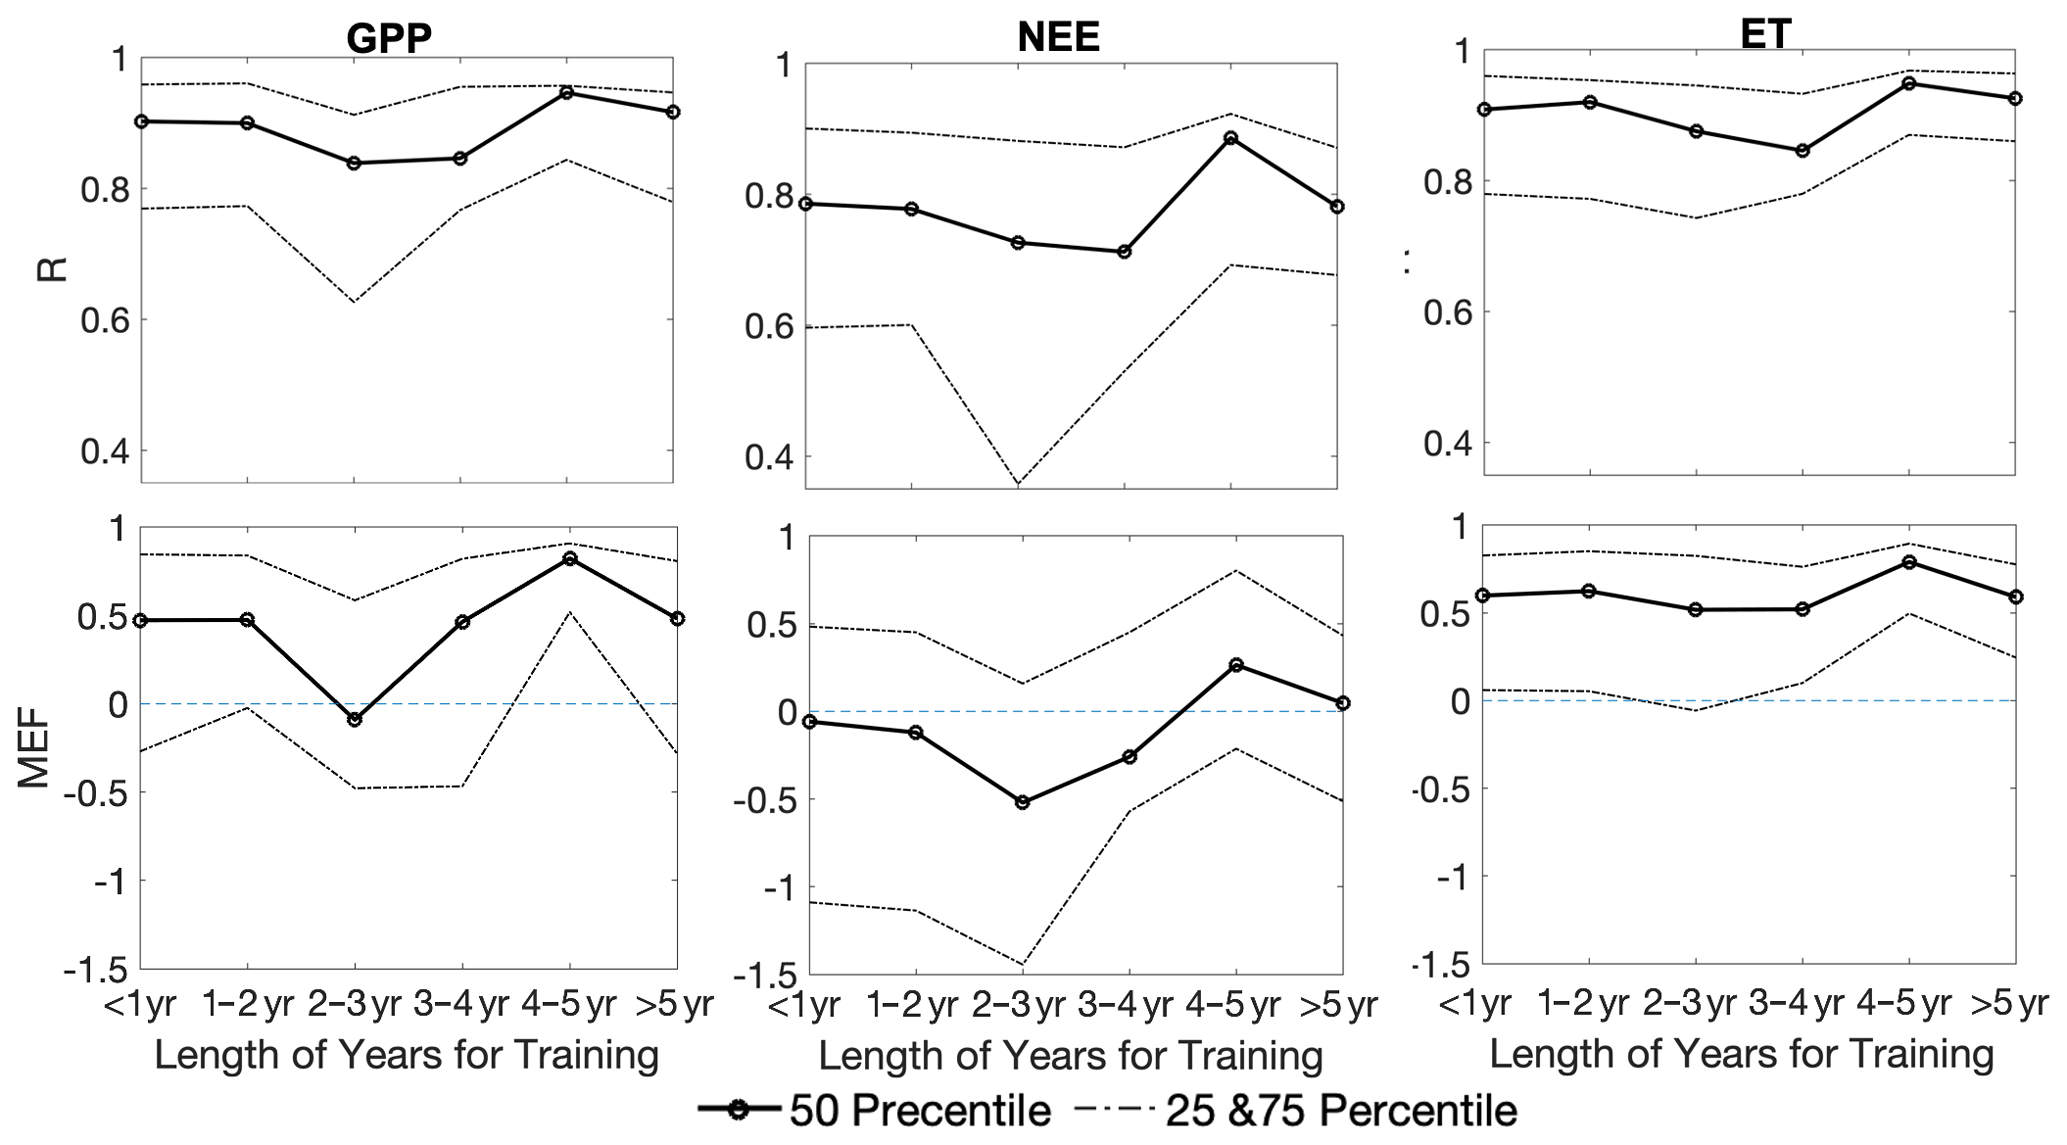
Figure 7Correlation metrics (R and MEF) changing with different assimilation periods for CARDAMOM outputs (GPP, NEE, or ET) versus FLUXNET tower measurements. The solid lines are the 50th percentile of the R and MEF, and the dashed lines represent the 25th and 75th percentiles.
4.1 Assessing CARDAMOM performance
The FLUXNET-based validation approach has provided some key insights on the skill of CARDAMOM-based C and H2O flux estimates. (1) The data assimilation using FLUXNET inputs (A1) captures missing seasonal variations in the original model with lower biases and less uncertainty compared to the model solely constrained by satellite and inventory datasets (A2). (2) The increased lengths of data assimilation can progressively improve the model performance and reduce the predictive uncertainties in all tested flux variables. (3) Land-cover types still exhibit influences on the model prediction accuracy, even though the parameters were locally adjusted in the assimilation process, consistent with earlier studies using global parametrization (Smallman and Williams, 2019). (4) Certain parameters (i.e., C1, A1, and W1) show more distinct correlations with model outputs, suggesting that improved prior constraints on a subset of parameters could further improve the retrieval accuracies of the corresponding outputs. (5) The validation results also highlight the fact that more work should be focused on tropical vegetation, with both the humid forests and savanna regions exhibiting the worst performance; the lack of regular seasonal cycles may also hamper accurate retrievals for CARDAMOM and other models (Quetin et al., 2020).
The aforementioned insights are key for identifying seasonal and interannual limitations in CARDAMOM model performance, limitations (or lack thereof) in the ability of CARDAMOM model structures to predict C and H2O fluxes on a range of timescales, and limitations of CARDAMOM across specific biomes or land-cover types. The results can be further used to target future CARDAMOM model developments towards identifying weaknesses in improving predictive skill. With more spatially explicit products becoming available for assimilation into CARDAMOM – such as satellite-based constraints on GPP and NEE (Quetin et al., 2020) – this study based on FLUXNET sites can also provide a quantitative characterization of CARDAMOM model structure.
4.2 Limitations of FLUXNET validation approach
One noteworthy caveat is the spatial resolution representation errors in the DALEC meteorological forcing. Specifically, the meteorological data used in this study are from the ECMWF ERA-Interim dataset projected at a 0.5∘ resolution. The disagreement in spatial resolution may be a confounding factor for CARDAMOM FLUXNET predictions. Implementing CARDAMOM using a finer-resolution meteorological forcing will help to reduce the uncertainty caused by spatial ambiguities (see Supplement Sect. S2 for replacing meteorological forcing data). Potential approaches for future versions of CARDAMOM-FluxVal include (i) using gap-filled products from FLUXNET sites to configure CARDAMOM simulations and/or (ii) transitioning to ERA5 meteorological forcing. However, the current version has not rigorously tested the new meteorological forcing datasets. And the improvement of all drivers to a finer resolution requires modification of other ancillary datasets that are used to determine variables such as CO2 concentration, burned area, and vapor pressure deficit (VPD) (Table S6), which is an ongoing effort for the new CARDAMOM version.
We also note that scarcity of tropical tower sites across the FLUXNET 2015 dataset (Schimel et al., 2015) may ultimately lead to biased assessments of CARDAMOM model structures. The possible heterogeneity for non-forest tower sites also causes more uncertainty in observed variables as well as the meteorological forcing due to resolution issues. On the other hand, our PFT-level analysis could also reveal potential model structure limitations in simulating certain PFTs with reasonable assumptions, which needs further attention when the caveat due to observational uncertainty is ruled out. While we advocate for the use of global summary metrics to assess model structure, we also recommend that users of this validation approach recognize the variable representation of biomes and vegetation classes in the available observational datasets. In addition to extended analyses (Sect. 3.2), we also recommend projecting validation assessments into climate space (Reichstein et al., 2003).
4.3 Applications
The summary metrics (Sect. 3.1) provide an easily reproducible set of statistics for the validation framework for monthly and interannual CARDAMOM carbon and water flux estimates. While our results show the importance of observational constraints (in this study, FLUXNET data), the CARDAMOM validation system can be readily applied to test additional configurations (alternative models, cost function parameters, datasets assimilated, and assimilation–prediction configurations). With a number of parametric and structural variations in existing CARDAMOM framework model structures (Famiglietti et al., 2021) – as well as anticipated variations among ongoing CARDAMOM developments – we highlight the need for a concerted and easily repeatable validation system. In particular, we recommend the use of the CARDAMOM-FluxVal validation approach for three categories of CARDAMOM developments.
-
DALEC model structures. The growing diversity of DALEC models (Famiglietti et al., 2021) provides a unique opportunity for determining which model structures and process representations best predict assimilated or withheld carbon and water fluxes. Further investigations can also be conducted with the exclusion and/or adaptation of ecological and dynamic constraints (Bloom and Williams, 2015; Smallman et al., 2021). Models of similar complexity as DALEC can also be used.
-
CARDAMOM cost function. Model–data error characterization in the CARDAMOM multi-objective optimization approach discussed in Bloom et al. (2020) is inherently limited. The FLUXNET validation approach can be used (i) for quantitative characterization of DALEC (or alternate model) accuracy and precision based on error characterization choices and (ii) to test potential improvements in error characterizations, such as optimizable uncertainty coefficients and the error models (Norton and Uryasev, 2019; Schoups and Vrugt, 2010). These analyses can be further extended to quantify the added value of individual data streams (e.g., by sequential removal of individual observation types).
-
CARDAMOM MDF algorithms. CARDAMOM employs an adaptive Metropolis–Hastings Markov chain Monte Carlo. The validation framework can be used to quantify the effectiveness of DALEC predictions using faster methods (e.g., optimal estimation; Rodgers, 2000) or previously established optimization algorithms (Fox et al., 2009). Experiments could be expanded to include dedicated studies for comparing the effectiveness of CARDAMOM analyses against non-CARDAMOM model–data fusion efforts (Bacour et al., 2019; Liu et al., 2021; MacBean et al., 2016) and machine learning methodologies (Jung et al., 2020, 2019, 2017; Tramontana et al., 2016).
We anticipate that the CARDAMOM FLUXNET validation framework will provide a much-needed quantitative benchmark to support and inform future CARDAMOM framework developments. Specifically, validation and intercomparison experiments can span well beyond the two CARDAMOM configurations presented in this study (A1 and A2) and can be adapted to suit individual needs for CARDAMOM developments or scientific investigations.
The CARDAMOM code used in this paper is available at https://github.com/CARDAMOM-framework/CARDAMOM_v2.2 (last access: June 2021). CARDAMOM-FluxVal version 1.0 code and driver datasets (including the CARDAMOM version used in this analysis) are tagged in the GitHub link. The code, along with the full output datasets, is permanently stored in Yang et al. (2021) (DOI: https://doi.org/10.5281/zenodo.4904195). Instructions on the code implementation are provided in the Supplement (Sect. S2).
The supplement related to this article is available online at: https://doi.org/10.5194/gmd-15-1789-2022-supplement.
AB and YY designed the research framework and performed the model validation using FLUXNET data. YY and SM tested the integrity and validity of the code and model. LX and SaS provided the global biomass data. PL, AN, NCP, JTR, JW, GRQ, TLS, and MW provided expertise on modeling and assisted with paper revision. All authors contributed to the writing of the final paper.
The contact author has declared that neither they nor their co-authors have any competing interests.
Publisher's note: Copernicus Publications remains neutral with regard to jurisdictional claims in published maps and institutional affiliations.
This work was carried out at the Jet Propulsion Laboratory, California Institute of Technology, under a contract with the National Aeronautics and Space Administration. We acknowledge Alexandra Konings from Stanford University for thorough paper feedback and review.
This work was carried out at the Jet Propulsion Laboratory, California Institute of Technology, under a contract with the National Aeronautics and Space Administration.
This paper was edited by Carlos Sierra and reviewed by two anonymous referees.
Anderson, M. C., Kustas, W. P., and Norman, J. M.: Upscaling Flux Observations from Local to Continental Scales Using Thermal Remote Sensing, Agron. J., 99, 240–254, https://doi.org/10.2134/agronj2005.0096S, 2007.
Arora, V. K., Katavouta, A., Williams, R. G., Jones, C. D., Brovkin, V., Friedlingstein, P., Schwinger, J., Bopp, L., Boucher, O., Cadule, P., Chamberlain, M. A., Christian, J. R., Delire, C., Fisher, R. A., Hajima, T., Ilyina, T., Joetzjer, E., Kawamiya, M., Koven, C. D., Krasting, J. P., Law, R. M., Lawrence, D. M., Lenton, A., Lindsay, K., Pongratz, J., Raddatz, T., Séférian, R., Tachiiri, K., Tjiputra, J. F., Wiltshire, A., Wu, T., and Ziehn, T.: Carbon–concentration and carbon–climate feedbacks in CMIP6 models and their comparison to CMIP5 models, Biogeosciences, 17, 4173–4222, https://doi.org/10.5194/bg-17-4173-2020, 2020.
Bacour, C., Maignan, F., Peylin, P., MacBean, N., Bastrikov, V., Joiner, J., Köhler, P., Guanter, L., and Frankenberg, C.: Differences Between OCO-2 and GOME-2 SIF Products From a Model-Data Fusion Perspective, J. Geophys. Res.-Biogeo., 124, 3143–3157, https://doi.org/10.1029/2018JG004938, 2019.
Bloom, A. A. and Williams, M.: Constraining ecosystem carbon dynamics in a data-limited world: integrating ecological “common sense” in a model–data fusion framework, Biogeosciences, 12, 1299–1315, https://doi.org/10.5194/bg-12-1299-2015, 2015.
Bloom, A. A., Exbrayat, J.-F., Velde, I. R. van der, Feng, L., and Williams, M.: The decadal state of the terrestrial carbon cycle: Global retrievals of terrestrial carbon allocation, pools, and residence times, P. Natl. Acad. Sci. USA, 113, 1285–1290, https://doi.org/10.1073/pnas.1515160113, 2016.
Bloom, A. A., Bowman, K. W., Liu, J., Konings, A. G., Worden, J. R., Parazoo, N. C., Meyer, V., Reager, J. T., Worden, H. M., Jiang, Z., Quetin, G. R., Smallman, T. L., Exbrayat, J.-F., Yin, Y., Saatchi, S. S., Williams, M., and Schimel, D. S.: Lagged effects regulate the inter-annual variability of the tropical carbon balance, Biogeosciences, 17, 6393–6422, https://doi.org/10.5194/bg-17-6393-2020, 2020.
Bonan, G. B., Lombardozzi, D. L., Wieder, W. R., Oleson, K. W., Lawrence, D. M., Hoffman, F. M., and Collier, N.: Model Structure and Climate Data Uncertainty in Historical Simulations of the Terrestrial Carbon Cycle (1850–2014), Global Biogeochem. Cy., 33, 1310–1326, https://doi.org/10.1029/2019GB006175, 2019.
Booth, B. B. B., Jones, C. D., Collins, M., Totterdell, I. J., Cox, P. M., Sitch, S., Huntingford, C., Betts, R. A., Harris, G. R., and Lloyd, J.: High sensitivity of future global warming to land carbon cycle processes, Environ. Res. Lett., 7, 024002, https://doi.org/10.1088/1748-9326/7/2/024002, 2012.
Caldararu, S., Palmer, P. I., and Purves, D. W.: Inferring Amazon leaf demography from satellite observations of leaf area index, Biogeosciences, 9, 1389–1404, https://doi.org/10.5194/bg-9-1389-2012, 2012.
Exbrayat, J.-F., Bloom, A. A., Carvalhais, N., Fischer, R., Huth, A., MacBean, N., and Williams, M.: Understanding the Land Carbon Cycle with Space Data: Current Status and Prospects, Surv. Geophys., 40, 735–755, https://doi.org/10.1007/s10712-019-09506-2, 2019.
Famiglietti, C. A., Smallman, T. L., Levine, P. A., Flack-Prain, S., Quetin, G. R., Meyer, V., Parazoo, N. C., Stettz, S. G., Yang, Y., Bonal, D., Bloom, A. A., Williams, M., and Konings, A. G.: Optimal model complexity for terrestrial carbon cycle prediction, Biogeosciences, 18, 2727–2754, https://doi.org/10.5194/bg-18-2727-2021, 2021.
Fox, A., Williams, M., Richardson, A. D., Cameron, D., Gove, J. H., Quaife, T., Ricciuto, D., Reichstein, M., Tomelleri, E., Trudinger, C. M., and Van Wijk, M. T.: The REFLEX project: Comparing different algorithms and implementations for the inversion of a terrestrial ecosystem model against eddy covariance data, Agric. Forest Meteorol., 149, 1597–1615, https://doi.org/10.1016/j.agrformet.2009.05.002, 2009.
Friedlingstein, P., O'Sullivan, M., Jones, M. W., Andrew, R. M., Hauck, J., Olsen, A., Peters, G. P., Peters, W., Pongratz, J., Sitch, S., Le Quéré, C., Canadell, J. G., Ciais, P., Jackson, R. B., Alin, S., Aragão, L. E. O. C., Arneth, A., Arora, V., Bates, N. R., Becker, M., Benoit-Cattin, A., Bittig, H. C., Bopp, L., Bultan, S., Chandra, N., Chevallier, F., Chini, L. P., Evans, W., Florentie, L., Forster, P. M., Gasser, T., Gehlen, M., Gilfillan, D., Gkritzalis, T., Gregor, L., Gruber, N., Harris, I., Hartung, K., Haverd, V., Houghton, R. A., Ilyina, T., Jain, A. K., Joetzjer, E., Kadono, K., Kato, E., Kitidis, V., Korsbakken, J. I., Landschützer, P., Lefèvre, N., Lenton, A., Lienert, S., Liu, Z., Lombardozzi, D., Marland, G., Metzl, N., Munro, D. R., Nabel, J. E. M. S., Nakaoka, S.-I., Niwa, Y., O'Brien, K., Ono, T., Palmer, P. I., Pierrot, D., Poulter, B., Resplandy, L., Robertson, E., Rödenbeck, C., Schwinger, J., Séférian, R., Skjelvan, I., Smith, A. J. P., Sutton, A. J., Tanhua, T., Tans, P. P., Tian, H., Tilbrook, B., van der Werf, G., Vuichard, N., Walker, A. P., Wanninkhof, R., Watson, A. J., Willis, D., Wiltshire, A. J., Yuan, W., Yue, X., and Zaehle, S.: Global Carbon Budget 2020, Earth Syst. Sci. Data, 12, 3269–3340, https://doi.org/10.5194/essd-12-3269-2020, 2020.
Gilmanov, T. G., Verma, S. B., Sims, P. L., Meyers, T. P., Bradford, J. A., Burba, G. G., and Suyker, A. E.: Gross primary production and light response parameters of four Southern Plains ecosystems estimated using long-term CO2-flux tower measurements, Global Biogeochem. Cy., 17, 1071, https://doi.org/10.1029/2002GB002023, 2003.
Gonsamo, A., Chen, J. M., Wu, C., and Dragoni, D.: Predicting deciduous forest carbon uptake phenology by upscaling FLUXNET measurements using remote sensing data, Agric. Forest Meteorol., 165, 127–135, https://doi.org/10.1016/j.agrformet.2012.06.006, 2012.
Hill, T. C., Ryan, E., and Williams, M.: The use of CO2 flux time series for parameter and carbon stock estimation in carbon cycle research, Glob. Change Biol., 18, 179–193, https://doi.org/10.1111/j.1365-2486.2011.02511.x, 2012.
Jung, M., Reichstein, M., Schwalm, C. R., Huntingford, C., Sitch, S., Ahlström, A., Arneth, A., Camps-Valls, G., Ciais, P., Friedlingstein, P., Gans, F., Ichii, K., Jain, A. K., Kato, E., Papale, D., Poulter, B., Raduly, B., Rödenbeck, C., Tramontana, G., Viovy, N., Wang, Y.-P., Weber, U., Zaehle, S., and Zeng, N.: Compensatory water effects link yearly global land CO2 sink changes to temperature, Nature, 541, 516–520, https://doi.org/10.1038/nature20780, 2017.
Jung, M., Koirala, S., Weber, U., Ichii, K., Gans, F., Camps-Valls, G., Papale, D., Schwalm, C., Tramontana, G., and Reichstein, M.: The FLUXCOM ensemble of global land-atmosphere energy fluxes, Sci. Data, 6, 74, https://doi.org/10.1038/s41597-019-0076-8, 2019.
Jung, M., Schwalm, C., Migliavacca, M., Walther, S., Camps-Valls, G., Koirala, S., Anthoni, P., Besnard, S., Bodesheim, P., Carvalhais, N., Chevallier, F., Gans, F., Goll, D. S., Haverd, V., Köhler, P., Ichii, K., Jain, A. K., Liu, J., Lombardozzi, D., Nabel, J. E. M. S., Nelson, J. A., O'Sullivan, M., Pallandt, M., Papale, D., Peters, W., Pongratz, J., Rödenbeck, C., Sitch, S., Tramontana, G., Walker, A., Weber, U., and Reichstein, M.: Scaling carbon fluxes from eddy covariance sites to globe: synthesis and evaluation of the FLUXCOM approach, Biogeosciences, 17, 1343–1365, https://doi.org/10.5194/bg-17-1343-2020, 2020.
Keenan, T. F., Davidson, E., Moffat, A. M., Munger, W., and Richardson, A. D.: Using model-data fusion to interpret past trends, and quantify uncertainties in future projections, of terrestrial ecosystem carbon cycling, Glob. Change Biol., 18, 2555–2569, https://doi.org/10.1111/j.1365-2486.2012.02684.x, 2012.
Liu, Y., Holtzman, N. M., and Konings, A. G.: Global ecosystem-scale plant hydraulic traits retrieved using model–data fusion, Hydrol. Earth Syst. Sci., 25, 2399–2417, https://doi.org/10.5194/hess-25-2399-2021, 2021.
MacBean, N., Peylin, P., Chevallier, F., Scholze, M., and Schürmann, G.: Consistent assimilation of multiple data streams in a carbon cycle data assimilation system, Geosci. Model Dev., 9, 3569–3588, https://doi.org/10.5194/gmd-9-3569-2016, 2016.
Myneni, R., Knyazikhin, Y., and Park, T.: MOD15A2H MODIS/terra leaf area index/FPAR 8-day L4 global 500 m SIN grid V006, NASA EOSDIS Land Process, DAAC [data set], https://doi.org/10.5067/MODIS/MOD15A2H.006, 2015.
Nash, J. E. and Sutcliffe, J. V.: River flow forecasting through conceptual models part I – A discussion of principles, J. Hydrol., 10, 282–290, https://doi.org/10.1016/0022-1694(70)90255-6, 1970.
Norton, M. and Uryasev, S.: Maximization of AUC and Buffered AUC in binary classification, Math. Program., 174, 575–612, https://doi.org/10.1007/s10107-018-1312-2, 2019.
Pastorello, G., Trotta, C., Canfora, E., Chu, H., Christianson, D., Cheah, Y.-W., Poindexter, C., Chen, J., Elbashandy, A., Humphrey, M., Isaac, P., Polidori, D., Ribeca, A., van Ingen, C., Zhang, L., Amiro, B., Ammann, C., Arain, M. A., Ardö, J., Arkebauer, T., Arndt, S. K., Arriga, N., Aubinet, M., Aurela, M., Baldocchi, D., Barr, A., Beamesderfer, E., Marchesini, L. B., Bergeron, O., Beringer, J., Bernhofer, C., Berveiller, D., Billesbach, D., Black, T. A., Blanken, P. D., Bohrer, G., Boike, J., Bolstad, P. V., Bonal, D., Bonnefond, J.-M., Bowling, D. R., Bracho, R., Brodeur, J., Brümmer, C., Buchmann, N., Burban, B., Burns, S. P., Buysse, P., Cale, P., Cavagna, M., Cellier, P., Chen, S., Chini, I., Christensen, T. R., Cleverly, J., Collalti, A., Consalvo, C., Cook, B. D., Cook, D., Coursolle, C., Cremonese, E., Curtis, P. S., D'Andrea, E., da Rocha, H., Dai, X., Davis, K. J., De Cinti, B., de Grandcourt, A., De Ligne, A., De Oliveira, R. C., Delpierre, N., Desai, A. R., Di Bella, C. M., di Tommasi, P., Dolman, H., Domingo, F., Dong, G., Dore, S., Duce, P., Dufrêne, E., Dunn, A., Dušek, J., Eamus, D., Eichelmann, U., ElKhidir, H. A. M., Eugster, W., Ewenz, C. M., Ewers, B., Famulari, D., Fares, S., Feigenwinter, I., Feitz, A., Fensholt, R., Filippa, G., Fischer, M., Frank, J., Galvagno, M., Gharun, M., Gianelle, D., et al.: The FLUXNET2015 dataset and the ONEFlux processing pipeline for eddy covariance data, Sci. Data, 7, 225, https://doi.org/10.1038/s41597-020-0534-3, 2020.
Quetin, G. R., Bloom, A. A., Bowman, K. W., and Konings, A. G.: Carbon Flux Variability From a Relatively Simple Ecosystem Model With Assimilated Data Is Consistent With Terrestrial Biosphere Model Estimates, J. Adv. Model. Earth Syst., 12, e2019MS001889, https://doi.org/10.1029/2019MS001889, 2020.
Reich, P. B.: The Carbon Dioxide Exchange, Science, 329, 774–775, https://doi.org/10.1126/science.1194353, 2010.
Reichstein, M., Rey, A., Freibauer, A., Tenhunen, J., Valentini, R., Banza, J., Casals, P., Cheng, Y., Grünzweig, J. M., Irvine, J., Jof- fre, R., Law, B. E., Loustau, D., Miglietta, F., Oechel, W., Ourcival, J.-M., Pereira, J. S., Peressotti, A., Ponti, F., Qi, Y., Rambal, S., Rayment, M., Romanya, J., Rossi, F., Tedeschi, V., Tirone, G., Xu, M., and Yakir, D.: Modeling temporal and large-scale spatial variability of soil respiration from soil water availability, temperature and vegetation productivity indices, Global Biogeochem. Cy., 17, 1104, https://doi.org/10.1029/2003GB002035, 2003.
Richardson, A. D., Dail, D. B., and Hollinger, D. Y.: Leaf area index uncertainty estimates for model–data fusion applications, Agric. Forest Meteorol., 151, 1287–1292, https://doi.org/10.1016/j.agrformet.2011.05.009, 2011.
Rodgers, C. D.: Inverse Methods For Atmospheric Sounding: Theory And Practice, World Scientific, 256 pp., https://doi.org/10.1142/3171, 2000.
Rowland, L., Malhi, Y., Silva-Espejo, J. E., Farfán-Amézquita, F., Halladay, K., Doughty, C. E., Meir, P., and Phillips, O. L.: The sensitivity of wood production to seasonal and interannual variations in climate in a lowland Amazonian rainforest, Oecologia, 174, 295–306, https://doi.org/10.1007/s00442-013-2766-9, 2014.
Schimel, D., Pavlick, R., Fisher, J. B., Asner, G. P., Saatchi, S., Townsend, P., Miller, C., Frankenberg, C., Hibbard, K., and Cox, P.: Observing terrestrial ecosystems and the carbon cycle from space, Glob. Change Biol., 21, 1762–1776, https://doi.org/10.1111/gcb.12822, 2015.
Schoups, G. and Vrugt, J. A.: A formal likelihood function for parameter and predictive inference of hydrologic models with correlated, heteroscedastic, and non-Gaussian errors, Water Resour. Res., 46, W10530, https://doi.org/10.1029/2009WR008933, 2010.
Schwalm, C. R., Williams, C. A., Schaefer, K., Arneth, A., Bonal, D., Buchmann, N., Chen, J., Law, B. E., Lindroth, A., Luyssaert, S., Reichstein, M., and Richardson, A. D.: Assimilation exceeds respiration sensitivity to drought: A FLUXNET synthesis, Glob. Change Biol., 16, 657–670, https://doi.org/10.1111/j.1365-2486.2009.01991.x, 2010.
Smallman, T. L. and Williams, M.: Description and validation of an intermediate complexity model for ecosystem photosynthesis and evapotranspiration: ACM-GPP-ETv1, Geosci. Model Dev., 12, 2227–2253, https://doi.org/10.5194/gmd-12-2227-2019, 2019.
Smallman, T. L., Exbrayat, J.-F., Mencuccini, M., Bloom, A. A., and Williams, M.: Assimilation of repeated woody biomass observations constrains decadal ecosystem carbon cycle uncertainty in aggrading forests, J. Geophys. Res.-Biogeo., 122, 528–545, https://doi.org/10.1002/2016JG003520, 2017.
Smallman, T. L., Milodowski, D. T., Neto, E. S., Koren, G., Ometto, J., and Williams, M.: Parameter uncertainty dominates C-cycle forecast errors over most of Brazil for the 21st century, Earth Syst. Dynam., 12, 1191–1237, https://doi.org/10.5194/esd-12-1191-2021, 2021.
Spadavecchia, L., Williams, M., and Law, B. E.: Uncertainty in predictions of forest carbon dynamics: separating driver error from model error, Ecol. Appl., 21, 1506–1522, https://doi.org/10.1890/09-1183.1, 2011.
Tramontana, G., Jung, M., Schwalm, C. R., Ichii, K., Camps-Valls, G., Ráduly, B., Reichstein, M., Arain, M. A., Cescatti, A., Kiely, G., Merbold, L., Serrano-Ortiz, P., Sickert, S., Wolf, S., and Papale, D.: Predicting carbon dioxide and energy fluxes across global FLUXNET sites with regression algorithms, Biogeosciences, 13, 4291–4313, https://doi.org/10.5194/bg-13-4291-2016, 2016.
Velpuri, N. M., Senay, G. B., Singh, R. K., Bohms, S., and Verdin, J. P.: A comprehensive evaluation of two MODIS evapotranspiration products over the conterminous United States: Using point and gridded FLUXNET and water balance ET, Remote Sens. Environ., 139, 35–49, https://doi.org/10.1016/j.rse.2013.07.013, 2013.
Wang, W., Davis, K. J., Cook, B. D., Butler, M. P., and Ricciuto, D. M.: Decomposing CO2 fluxes measured over a mixed ecosystem at a tall tower and extending to a region: A case study, J. Geophys. Res.-Biogeo., 111, G02005, https://doi.org/10.1029/2005JG000093, 2006.
Williams, M., Schwarz, P. A., Law, B. E., Irvine, J., and Kurpius, M. R.: An improved analysis of forest carbon dynamics using data assimilation, Glob. Change Biol., 11, 89–105, https://doi.org/10.1111/j.1365-2486.2004.00891.x, 2005.
Williams, M., Richardson, A. D., Reichstein, M., Stoy, P. C., Peylin, P., Verbeeck, H., Carvalhais, N., Jung, M., Hollinger, D. Y., Kattge, J., Leuning, R., Luo, Y., Tomelleri, E., Trudinger, C. M., and Wang, Y.-P.: Improving land surface models with FLUXNET data, Biogeosciences, 6, 1341–1359, https://doi.org/10.5194/bg-6-1341-2009, 2009.
Xiao, J., Davis, K. J., Urban, N. M., and Keller, K.: Uncertainty in model parameters and regional carbon fluxes: A model-data fusion approach, Agric. Forest Meteorol., 189–190, 175–186, https://doi.org/10.1016/j.agrformet.2014.01.022, 2014.
Yang, Y., Bloom, A. A., Ma, S., Levine, P., Norton, A., Parazoo, N. C., Reager, J. T., Worden, J., Quetin, G. R., Smallman, T. L., Williams, M., Xu, L., and Saatchi, S.: CARDAMOM-FluxVal Version 1.0, Zenodo [data set], https://doi.org/10.5281/zenodo.4904195, 2021.
Yin, Y., Bloom, A. A., Worden, J., Saatchi, S., Yang, Y., Williams, M., Liu, J., Jiang, Z., Worden, H., Bowman, K., Frankenberg, C., and Schimel, D.: Fire decline in dry tropical ecosystems enhances decadal land carbon sink, 11, 1900, https://doi.org/10.1038/s41467-020-15852-2, 2020.
Yu, Y.: Global Distribution of Carbon Stock in Live Woody Vegetation, PhD Dissertation, University of California, Los Angeles, 122 pp., https://escholarship.org/content/qt75q1z61j/qt75q1z61j_noSplash_890063699a1f1ca04d5f5fc862db3fe7.pdf (last access: May 2021), 2013.