the Creative Commons Attribution 4.0 License.
the Creative Commons Attribution 4.0 License.
 | 07 Dec 2021
The effect of accounting for public holidays on the skills of the atmospheric composition model SILAM v.5.7
Rostislav Kouznetsov
Mikhail Sofiev
This study quantifies the impact of emission changes during public holidays on air quality (AQ) and analyses the added value of accounting for the holidays in AQ modelling. Spatial and temporal distributions of atmospheric concentrations of the major air pollutants (the main focus was on NO2, but we also included O3, CO, PM2.5, and SO2) were considered at the European scale for all public holidays of 2018. Particular attention was paid to the events with the most pronounced continental- or regional-scale impact: Christmas and New Year, Easter, May Day vacations, and the last days of Ramadan. The simulations were performed with the chemistry transport model SILAM v.5.7 (System for Integrated modeLling of Atmospheric coMposition). Three model runs were made: the baseline with no treatment of holidays, the run considering holidays as Sundays, and the run forcing 80 % reduction in emissions during holidays for the weekday-sensitive sectors. The emission scaling was applied on a country basis. The model predictions were compared with in situ observations collected by the European Environment Agency. The experiment showed that even conservative treatment of official holidays has a large positive impact on NOx (up to 30 % of reduction in the bias inhomogeneity during the holiday days) and improves the CO, PM2.5, and O3 predictions. In many cases, the sensitivity simulations suggested a greater emission reduction than the level of Sundays. An individual consideration of the holiday events in different countries may further improve their representation in the models: specific diurnal pattern of emissions, additional emission due to fireworks, and different driving patterns.
- Article
(2948 KB) - Full-text XML
-
Supplement
(2969 KB) - BibTeX
- EndNote


Air quality (AQ) and its temporal and spatial changes are determined by human activities via the release of various air pollutants (Derwent and Hjellbrekke, 2012; Fu et al., 2020; Hassan et al., 2013; Karl et al., 2019; Kukkonen et al., 2020; Lehtomäki et al., 2018; Shi et al., 2019) and modulated by meteorological conditions (Jacob and Winner, 2009; Jhun et al., 2015; Singh et al., 2013; Sofiev et al., 2020).
The ability of atmospheric composition models to follow the temporal variability of air pollution critically depends on the representation of temporal emission profiles by inventories used by the models. Arguably the most difficult task in this context is to reproduce the variations originating from rare irregular events. Changes in human behaviour during non-working days of various type (Beirle et al., 2003; de Foy et al., 2020, 2016; Elansky, 2020; Gour et al., 2013; Hassan et al., 2013; Xu et al., 2017; Zou et al., 2019; Rozbicka and Rozbicki, 2016), including some religious ceremonies (Dasari et al., 2020), cultural practices (Khezri et al., 2015; Nodehi et al., 2018; Ye et al., 2016), celebratory events, and festivities (Hoyos et al., 2020; Jiang et al., 2015; Lai and Brimblecombe, 2017; Retama et al., 2019), cause large variations in emissions of air pollutants, which are hard to quantify and generalize. However, the weekend and (some) holiday effects have certain similarities, which might allow drawing an analogy between weekday vs. weekend and holiday vs. non-holiday pollution levels.
The majority of currently available emission inventories are built as gridded yearly or monthly totals for the key primary pollutants (Frost et al., 2013; Granier et al., 2019, 2011), (https://eccad.aeris-data.fr/, last access: 20 October 2021). Temporal variations at shorter timescales have received less attention, but their impact on AQ itself and the model's ability to reproduce the observed concentrations have been considered in several studies (Fu et al., 2013; Gioli et al., 2015; Guevara et al., 2017, 2021; Iriti et al., 2020; McGraw et al., 2010). In particular a crucial role of spatial and temporal resolution of emission inventories for the model's skill scores has been demonstrated (Frost et al., 2013; Gioli et al., 2015; Zhao et al., 2015; Zhou et al., 2020).
Many observation-based studies have been focused on the effects of weekends and, sometimes, specific holidays on pollutant concentrations (Chen et al., 2019; Forster and Solomon, 2003). Lonati et al. (2006) examined the weekend effect on particulate matter (PM10 and PM2.5) emissions from traffic sources in the city of Milan. The research indicated that concentrations of these compounds in the urban area were lower than the levels on weekdays. Gour et al. (2013) considered differences in pollution levels during weekends and on weekdays in Delhi and showed that the patterns follow the working activities of weekends and weekdays. Parra and Franco (2016), pointed out that the concentration of NO2, NOx, CO, and PM2.5 on working days is higher than that at weekends but the concentration of O3 on working days is lower than that of the weekend, due to ozone titration. In 2017, Ding et al. (2017) reported that during the Chinese New Year the NOx emissions are usually lower by about 10 % reflecting the lower business and industrial activities. In a recent study, Hua et al. (2021) estimated the holiday effect on PM2.5 and NO2 levels in Beijing by a generalized additive model at 34 air quality monitoring stations during the five heating seasons from 2014 to 2019. According to their results, the holiday effect was much stronger than the weekend effects with increasing PM2.5 by 2 % to 30 % but decreasing NO2 concentrations.
Khalil et al. (2016) analysed hourly measurements of NOx, non-methane hydrocarbons (NMHCs), ozone (O3), sulfur dioxide (SO2), PM2.5, and PM10 collected in the coastal town of Yanbu, Saudi Arabia, during weekends, Eid, Ramadan, and the Hajj periods and demonstrated that the ozone concentrations remained practically the same over these holidays despite the precursor levels being significantly lower. They reported a substantial increase in night-time emissions during Ramadan due to the shift in human activities to night-time.
The fireworks and bonfires during Christmas and New Year of 2013 and 2014 were recognized as the main sources of PM2.5 in Mexico city by Retama et al. (2019). Singh et al. (2019) also considered the impact of fireworks on air quality, visibility, and human health and reported significant changes in the pollutant concentrations and a decrease in visibility. Yao et al. (2019) studied air quality trends and firework impact in Shanghai during spring festivals from 2013 to 2017. A decreasing trend in PM2.5 in this study revealed the positive effect of the firework regulation on air quality.
Recently, various methods based on observed data and models have been applied to measure the impact of the COVID-19 lockdown on air pollution. These studies investigated the role of transport and industry sectors on pollutant concentrations during the lockdown (Fan et al., 2021; Grivas et al., 2020; Huang et al., 2020; Menut et al., 2020; Sharma et al., 2020; Wang and Su, 2020).
The above works showed that the effects of isolated events, such as public holidays, can be substantial. Yet their analysis at large scales (e.g. a continent and a full year) is missing, and a systematic approach to their incorporation into AQ models is yet to be developed.
The goal of the current paper is to address this gap and to take the first step towards incorporation of the public holidays into the regular atmospheric composition and air quality modelling in Europe. We quantified the added value of a comparatively primitive and conservative way of including official holidays into temporal profiles of the emission of air pollutants. Secondly, a sensitivity study was performed demonstrating the extent of the necessary adjustments and potential benefits of a more detailed region-specific analysis of each specific holiday event.
The paper is organized as follows. The next section presents the methodology of the study: information on the European holidays, ways of their incorporation into the emission temporal profiles, the atmospheric composition model SILAM v.5.7 (System for Integrated modeLling of Atmospheric coMposition), and its setup, as well as the statistical measures quantifying the holiday effect. The Results section presents the outcome of the annual SILAM computations for 2018 and the impact of the holiday information on the model skills. The Discussion section compares the outcome with other studies and demonstrates the sensitivity of the results to the changes in the holiday emission representation.
2.1 European holidays
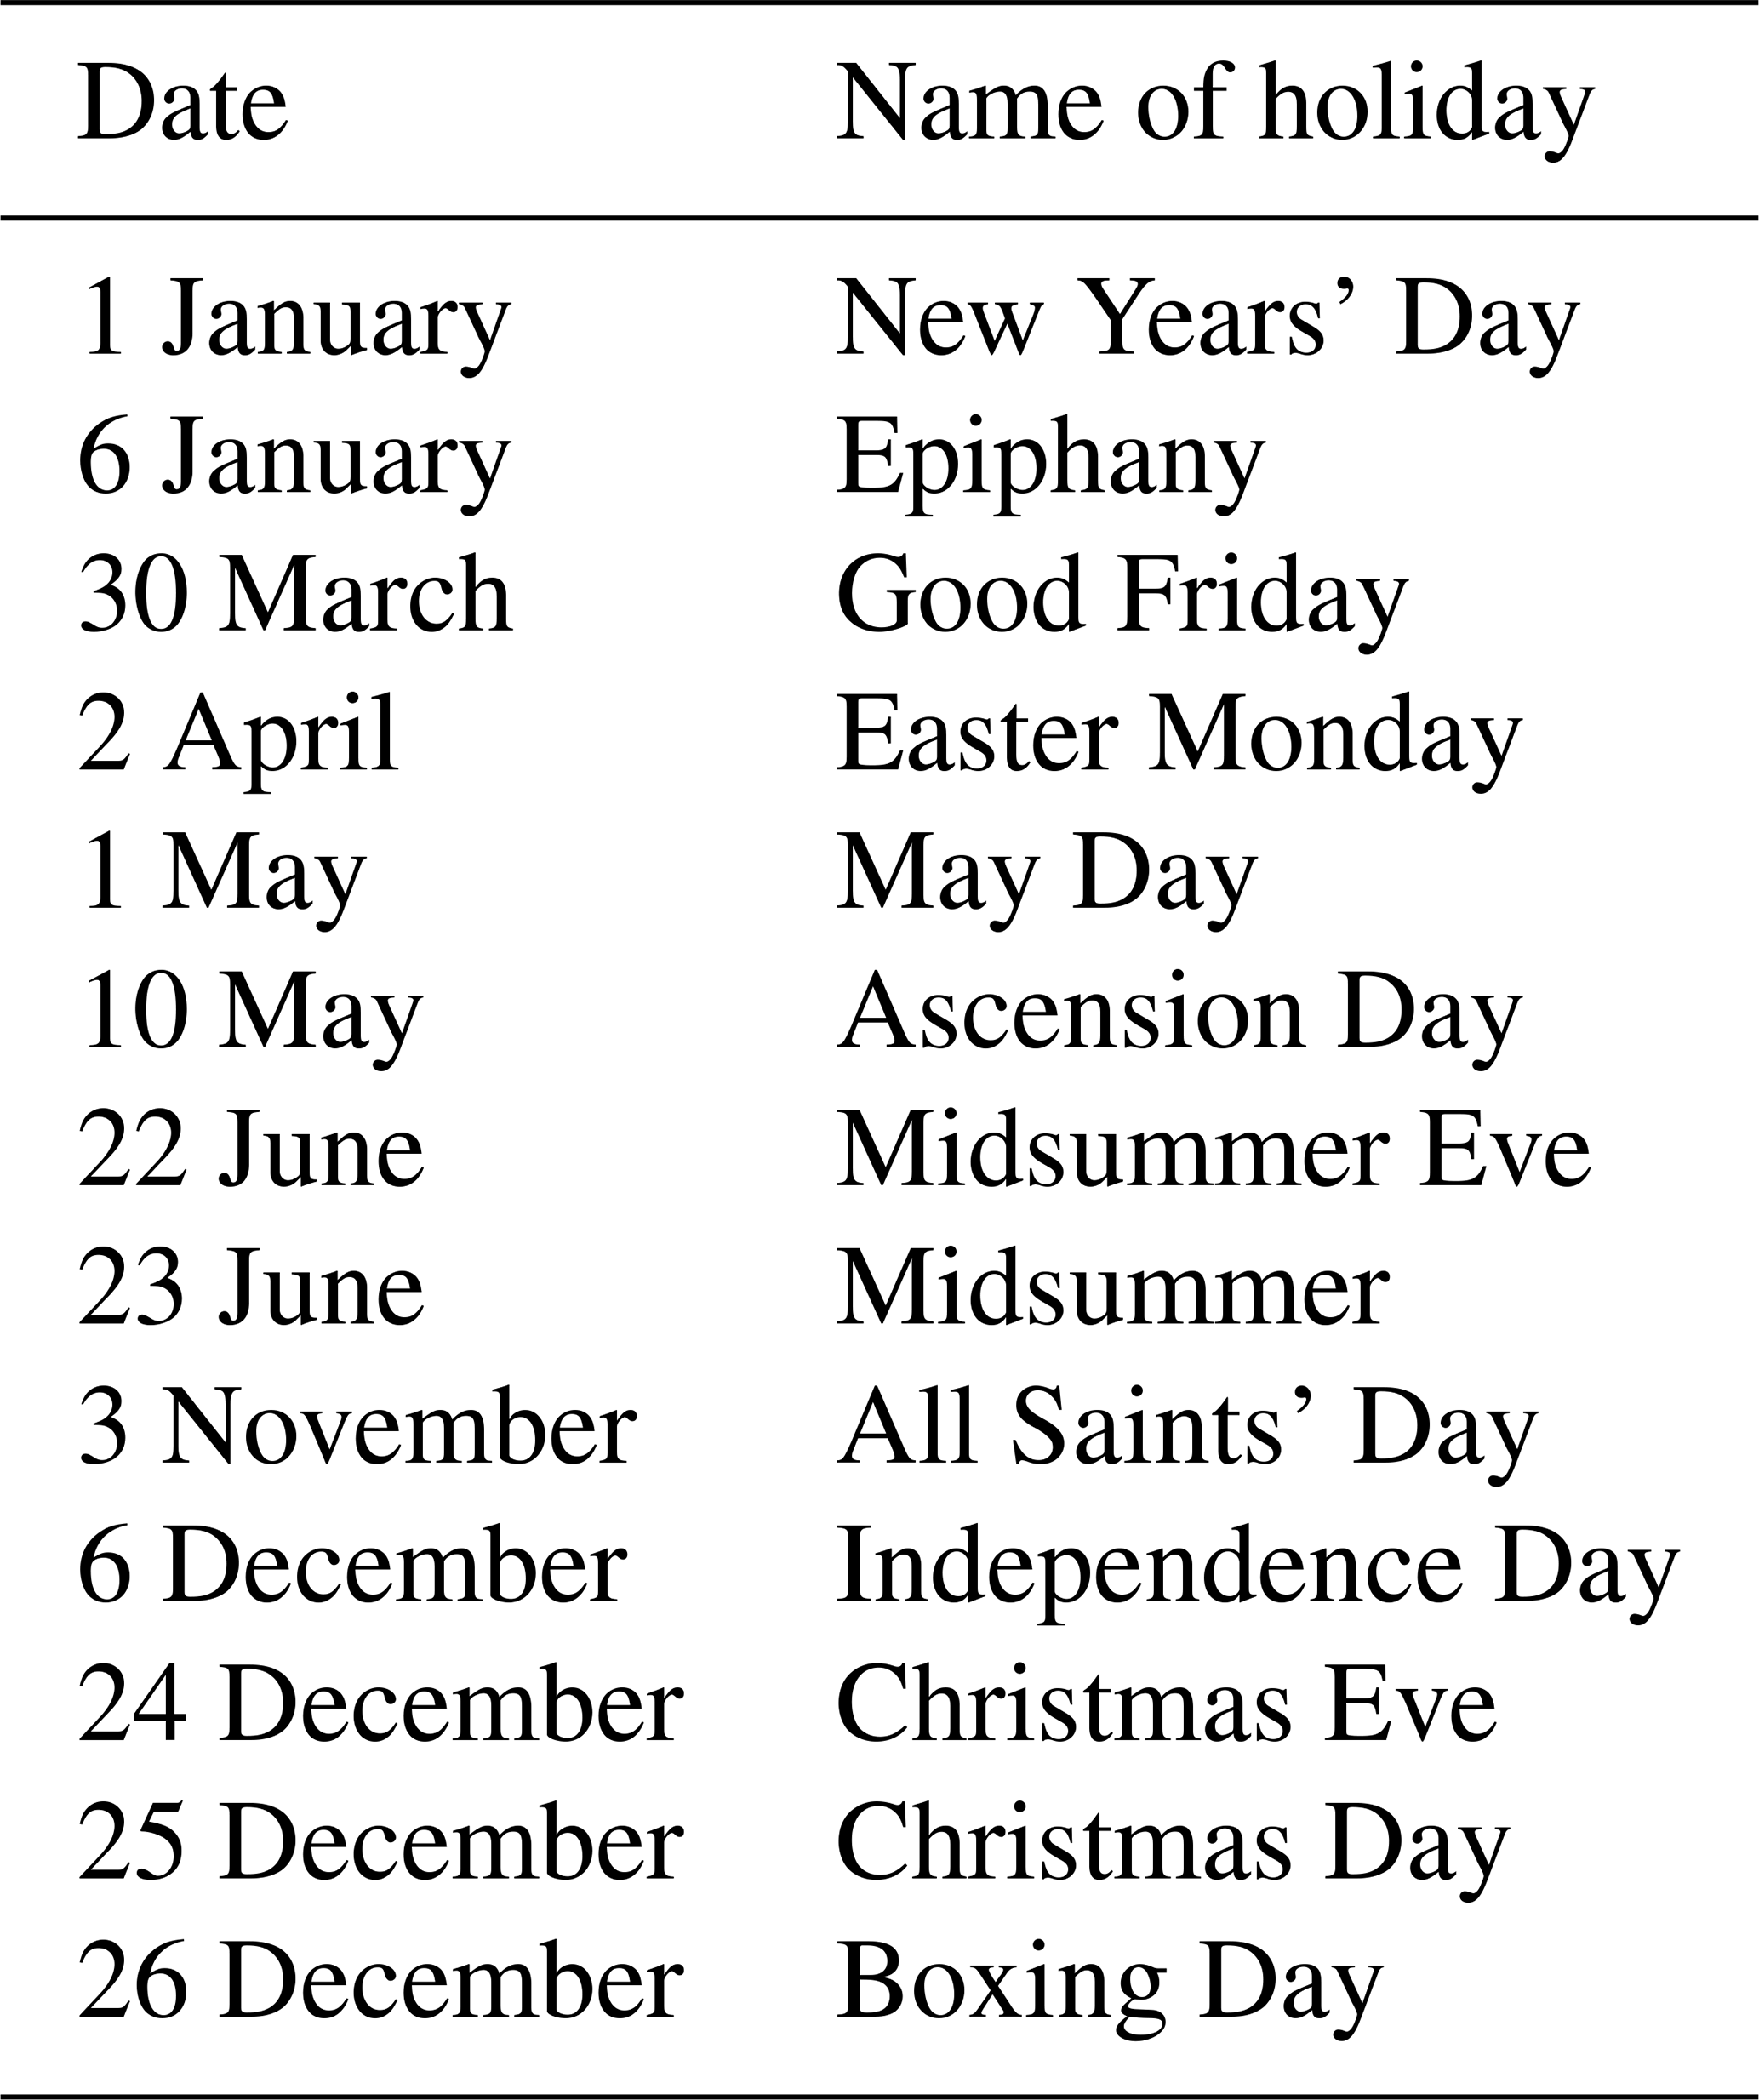
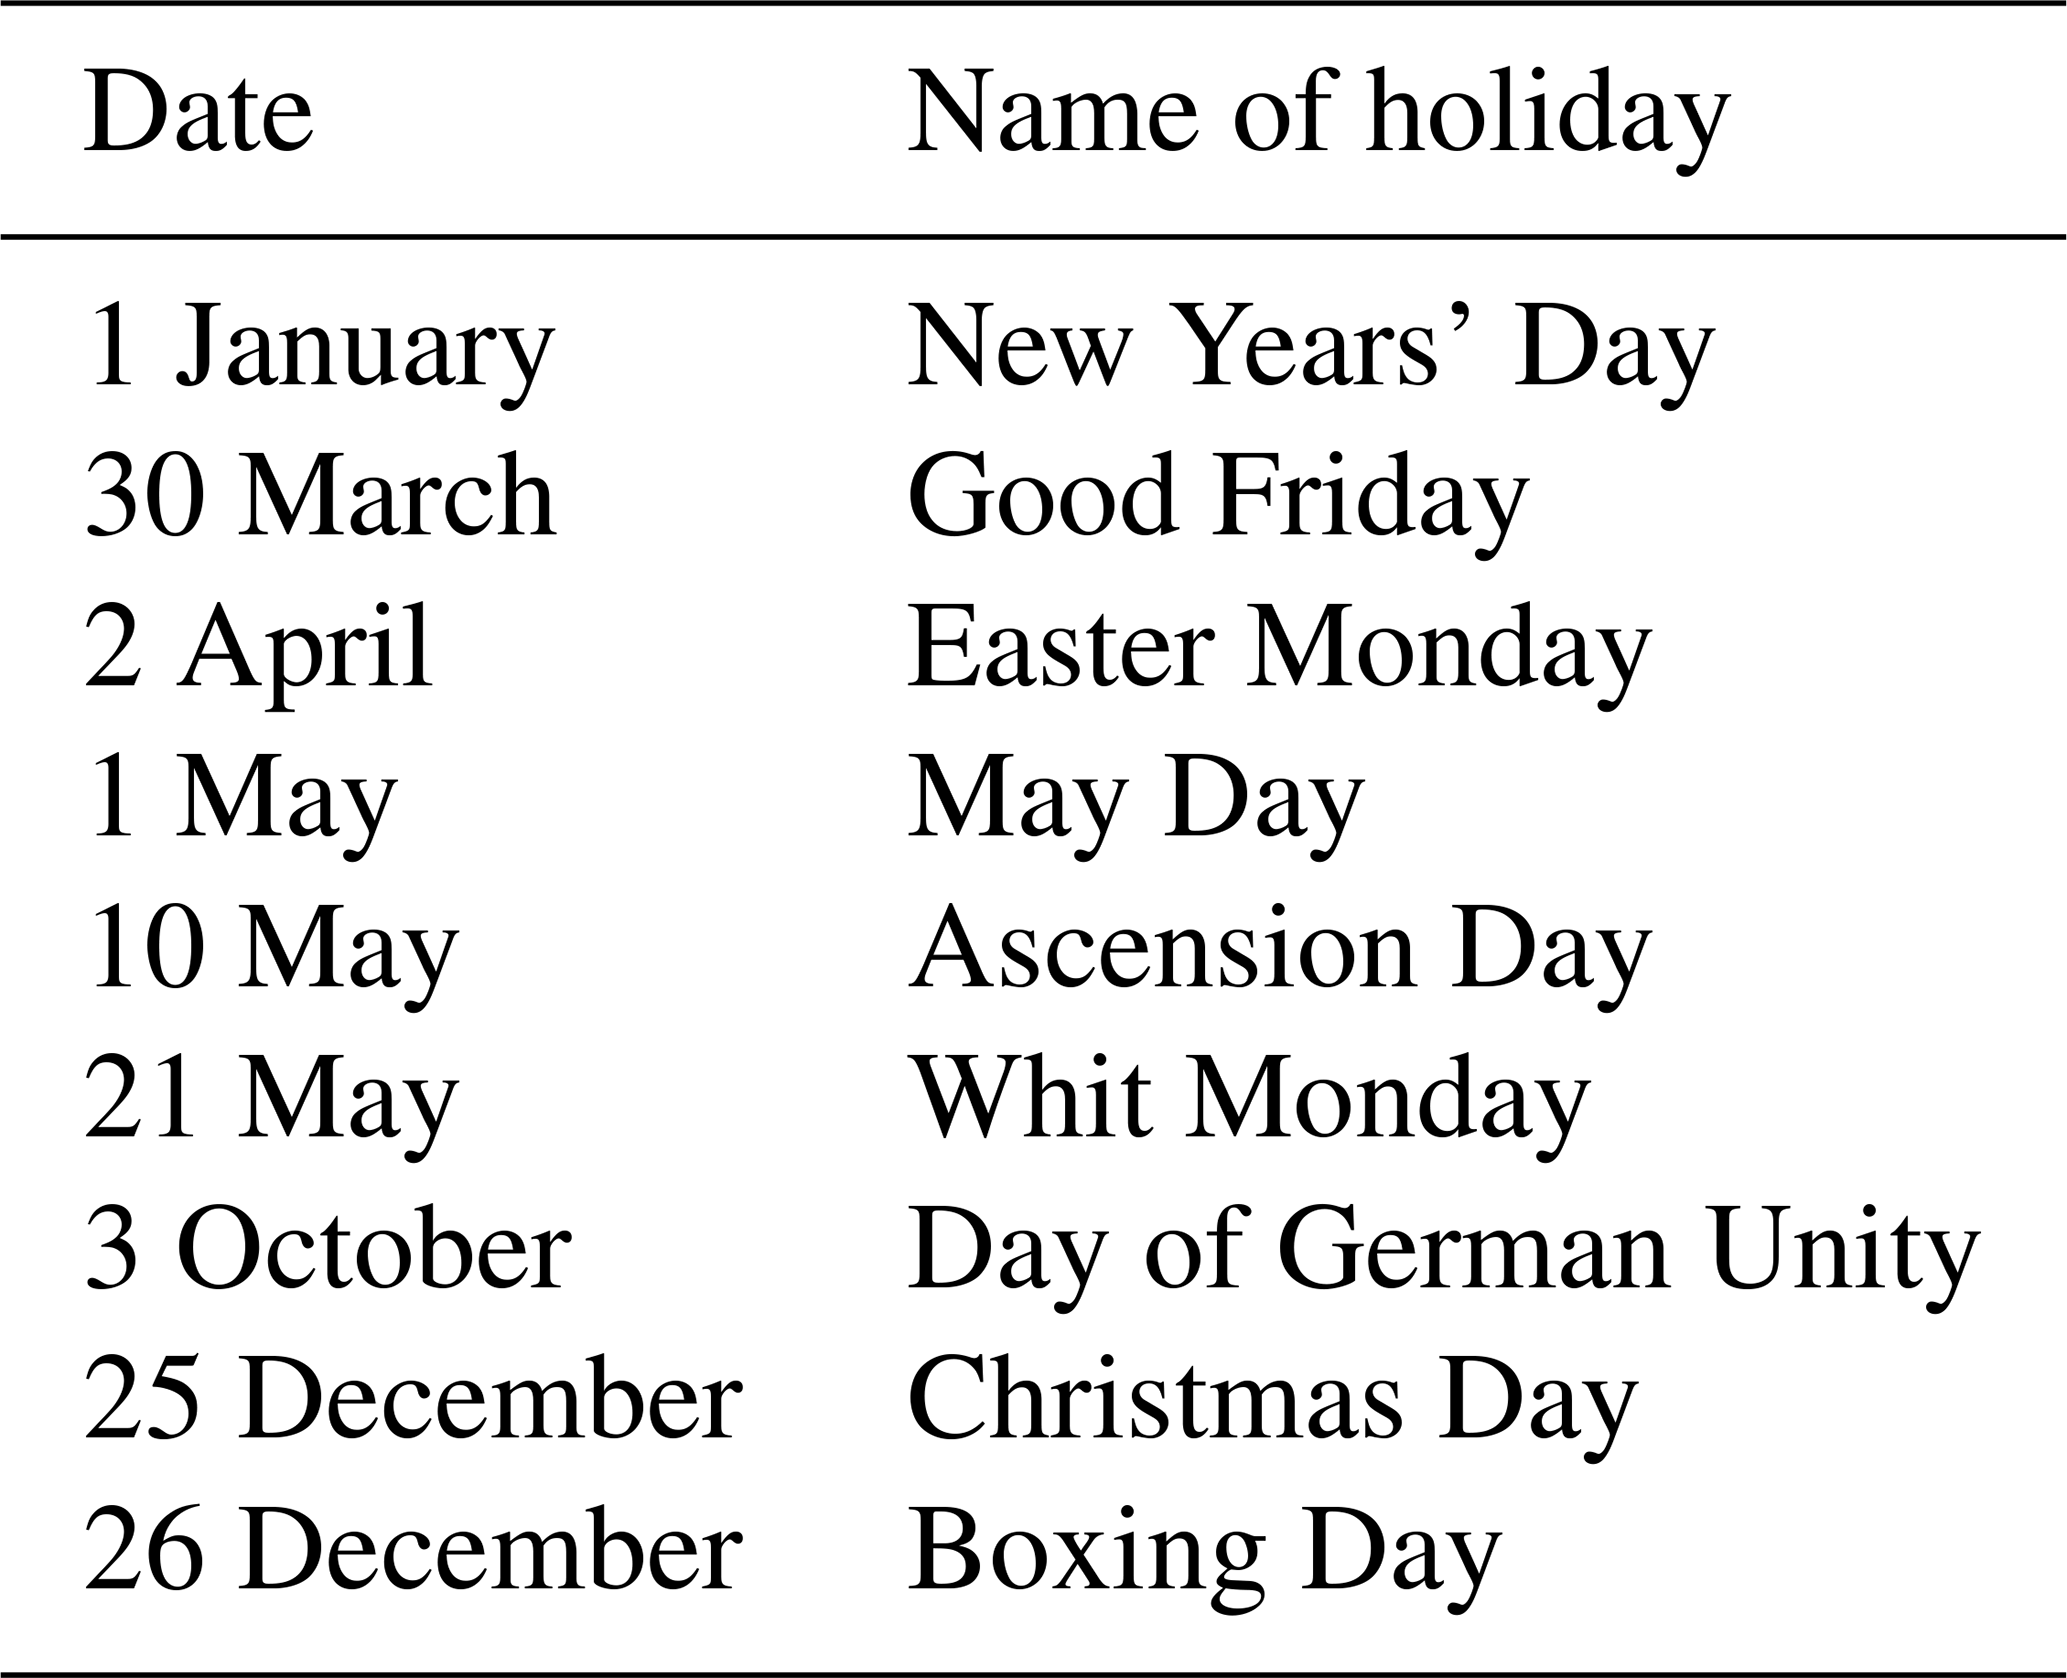
We collected a list of official holidays in Europe from the Calendarific global holidays API (https://calendarific.com/api-documentation?v = 2, last access: 20 October 2021) for the full year of 2018. We regarded the events marked with “national holiday”, “local holiday”, or “common local holiday” as holidays (see examples for some European countries in Tables 1–3). Since the Sunday emission scaling was applied country-wise, the “local” or “common local” holidays might sometimes cover wider territories than they should. However, it was not possible to accommodate higher level of detail technically, and the choice was between missing some local/regional holidays and covering wider areas than needed for some events. Since “religious” and “observance” holidays were not considered, we preferred to include the others. The maximum possible error does not exceed 10 % because in 2018 national holidays accounted for ∼800 country days, whereas common local and local were ∼60 and ∼80 country days, respectively.
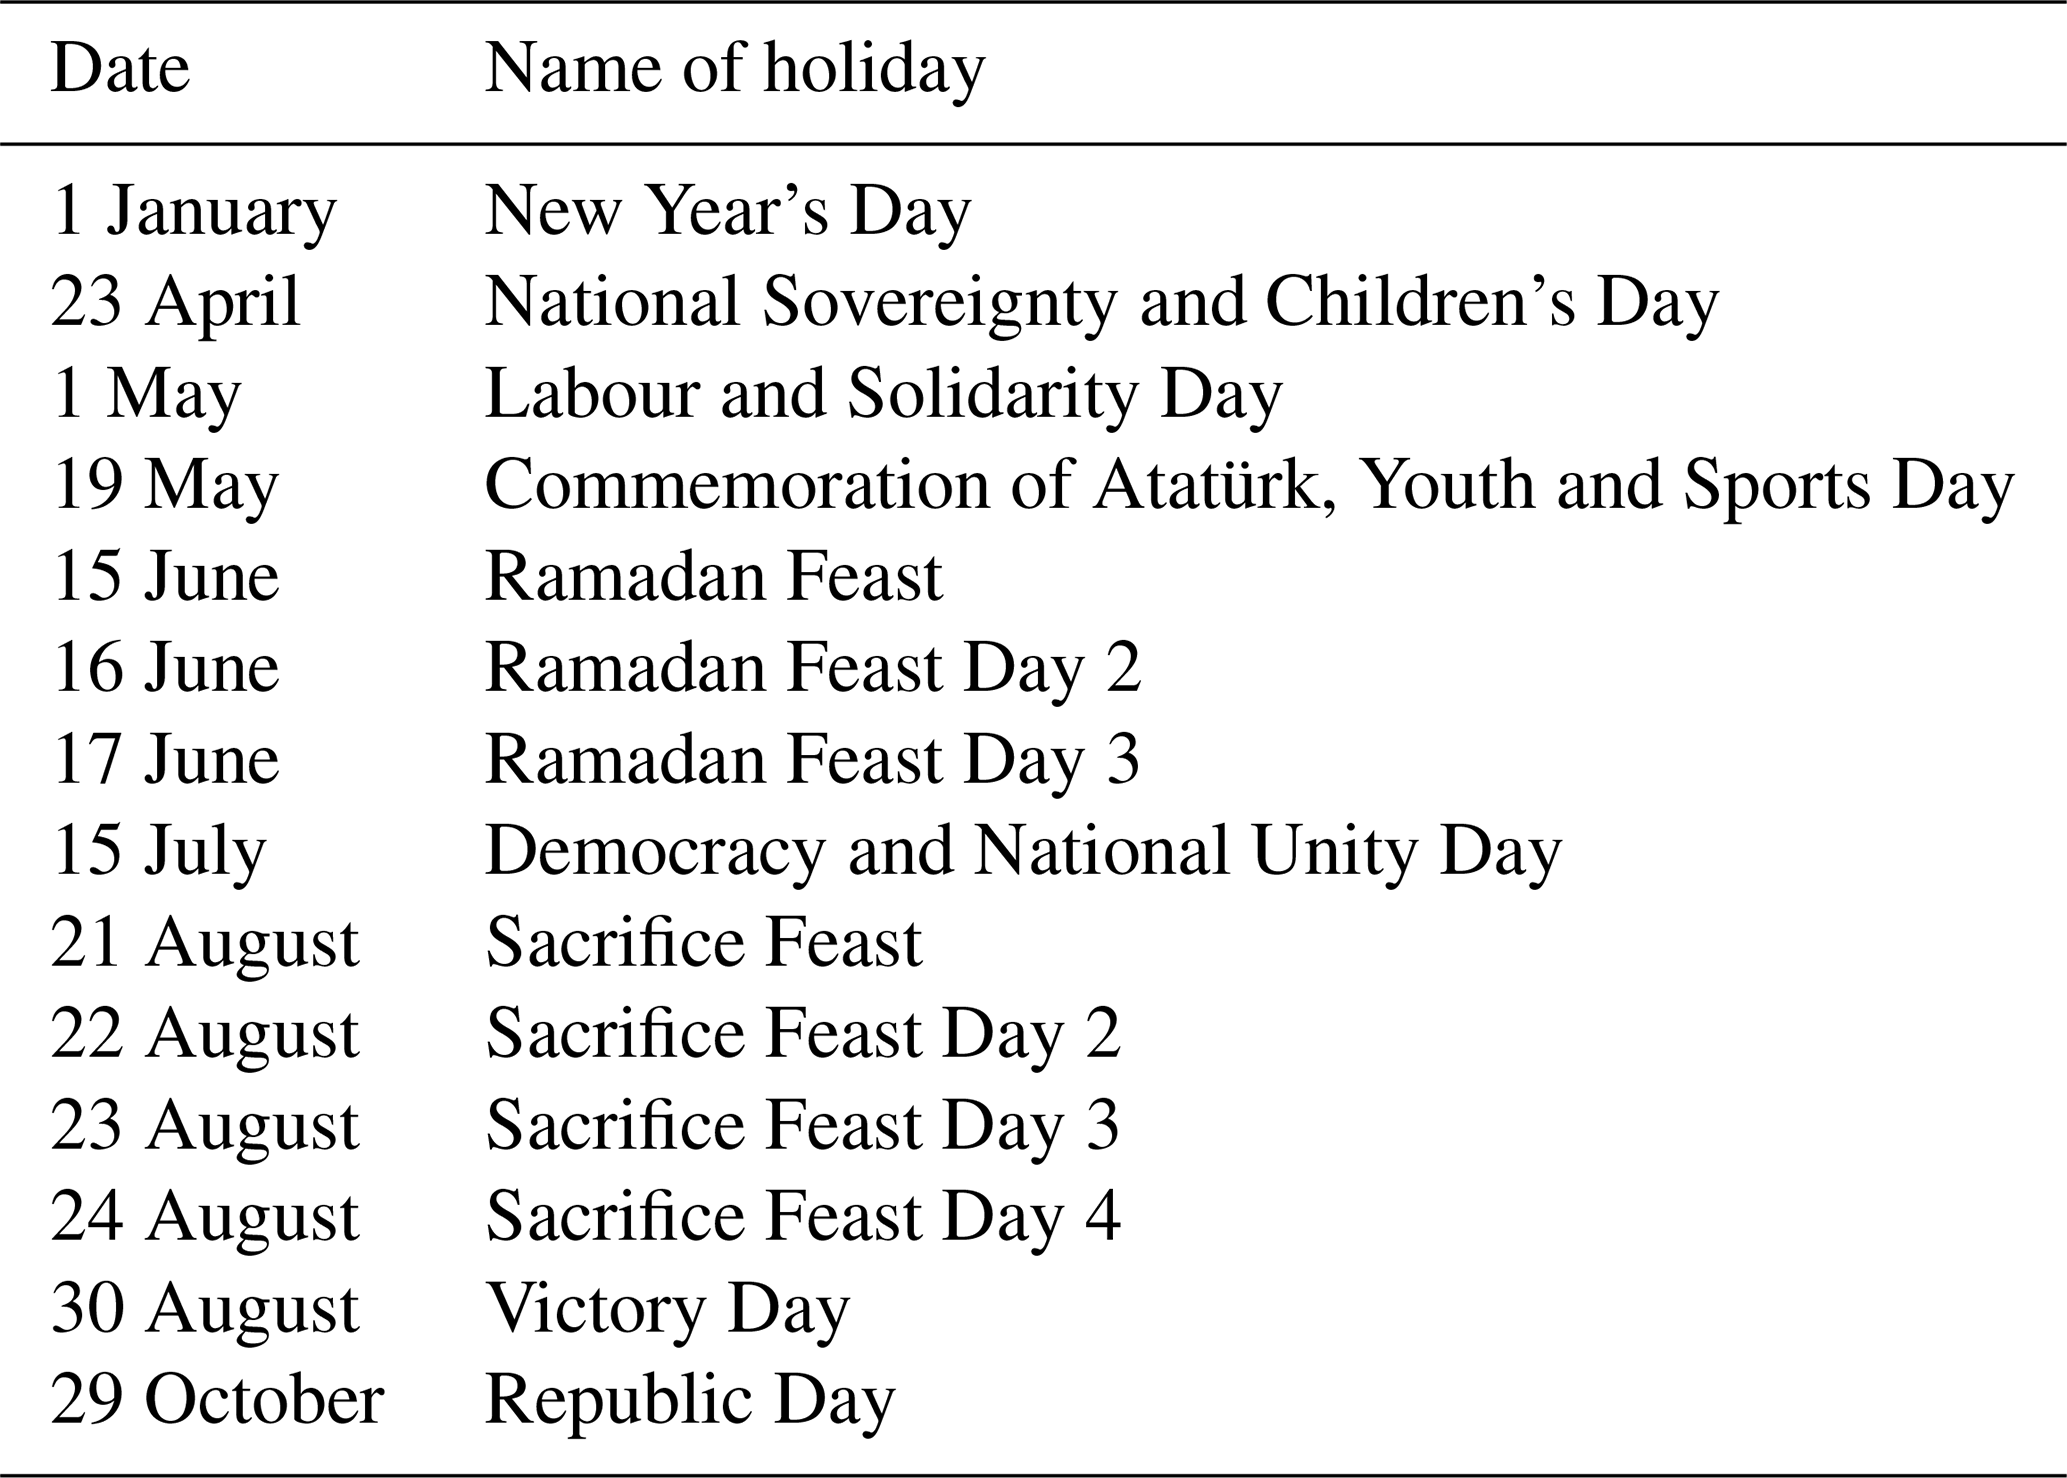
The model computations included all holidays in 2018 but, for the sake of brevity, the analysis below will concentrate on the Christmas and New Year weeks, Easter, and May Day (analysed at the European scale) and the Festival of Breaking the Feast at the last days of Ramadan (Eid al-Fitr, analysed for Turkey).
2.2 Atmospheric composition model SILAM
SILAM (System for Integrated modeLling of Atmospheric coMposition, http://silam.fmi.fi/, last access: 20 October 2021) is an offline 3D chemical transport model (Sofiev et al., 2015a), also used for emergency decision support (Sofiev et al., 2006) and inverse atmospheric composition problems (Sofiev, 2019; Vira and Sofiev, 2012). The model incorporates Eulerian and Lagrangian dispersion frameworks and a variety of chemical/physical transformation modules covering the troposphere and the stratosphere (Carslaw et al., 1995; Damski et al., 2007; Gery et al., 1989; Kouznetsov and Sofiev, 2012; Sofiev, 2002, 2000; Sofiev et al., 2010; Yarwood et al., 2005). SILAM features a mass-conservative positive–definite advection scheme based on principles laid down by Galperin et al. (1996). The model can be run with various resolutions and coverages starting from a kilometre scale over a limited area and up to the whole globe (Brasseur et al., 2019; Kouznetsov et al., 2020; Petersen et al., 2019; Sofiev et al., 2020, 2015b; Xian et al., 2019). The vertical structure of the modelling domain consists of stacked layers starting from the surface. The layers can be defined either in z or hybrid sigma–pressure coordinates. The model can be driven with a variety of numerical weather prediction or climate models.
2.3 Simulation setup
The simulations were performed for the whole year of 2018 for the European domain with the setup following the operational configuration of SILAM in the Copernicus Atmospheric Monitoring Service (CAMS) regional air quality forecasts, as of November 2020 (https://atmosphere.copernicus.eu, last access: 20 October 2021). The only exception was a twice coarser grid resolution to reduce the computational costs (Table 4).
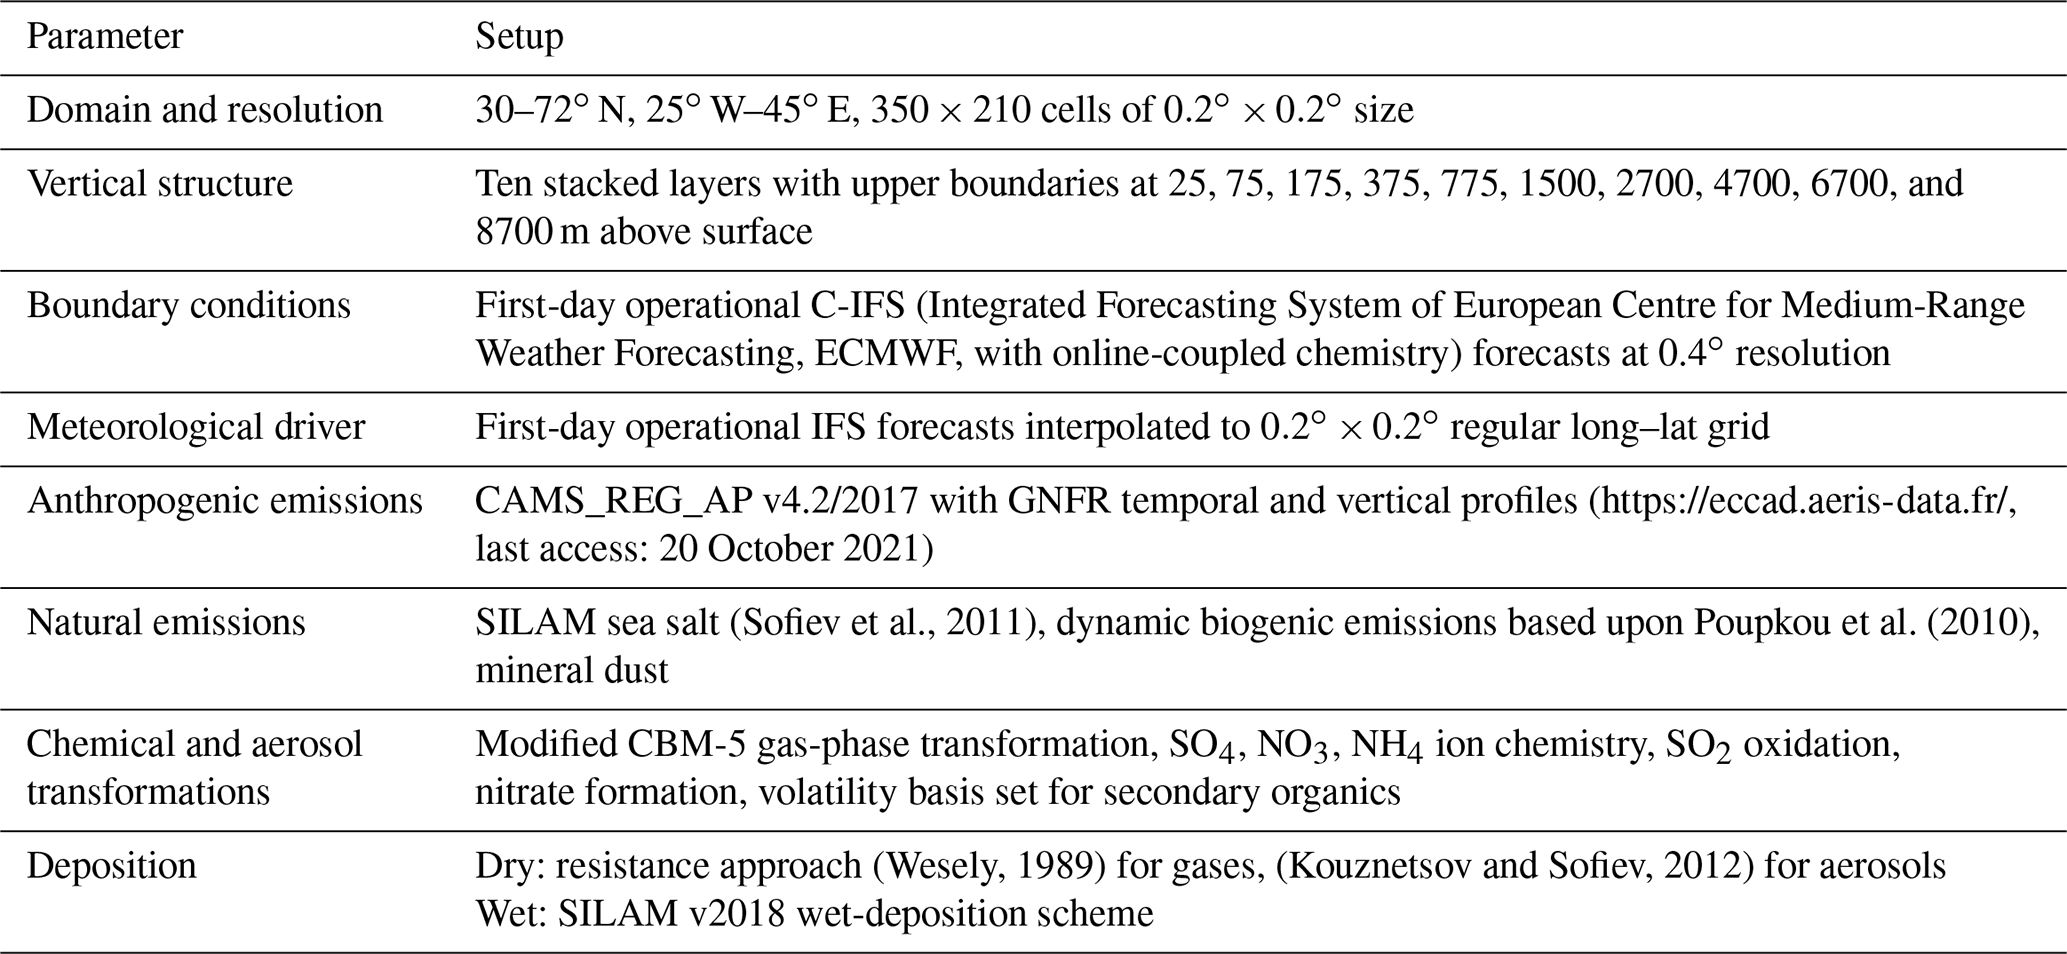
The anthropogenic emissions in the CAMS_REG_AP v4.2 inventory were used as maps of annual totals separately for each country and 16 GNFR sectors (Gridded Nomenclature For Reporting, European Environment Agency, 2013). To obtain the hourly emissions, the annual means were scaled with three temporal profiles, defined separately for each sector, corresponding to month of year (MOY), day of week (DOW), and hour of day (HOD) (Granier et al., 2019). In the CAMS-regional operational setup, the anthropogenic emissions are used without accounting for public holidays.
To assess the sensitivity of pollutant concentrations during holidays, three SILAM runs were made: the baseline with no special holiday treatment (hereinafter, the BL case) and with the holiday days regarded as Sundays (the HS case) and a sensitivity test run with 80 % of emission reduction during holidays (the R3 case). The emission scaling for the HS and R3 cases were applied only to the sectors affected by the DOW profile. The R3 case was constructed for the Discussion section as a definite low boundary of the possible holiday effect with no realistic scenario behind it. Technically, the emissions were adjusted by altering the DOW scaling coefficients for dates and countries where the holidays occur. For the HS case the coefficients were set to their Sunday values, and for the R3 case they were forced to 0.2. The DOW coefficients for the affected sectors are shown in Fig. 1. Other sectors (D_Fugitives, G_Shipping, H_Aviation, I_OffRoad, J_Waste, K_AgriculturalLivestock, and L_AgriculturalOther) have unity DOW coefficients for all three cases.
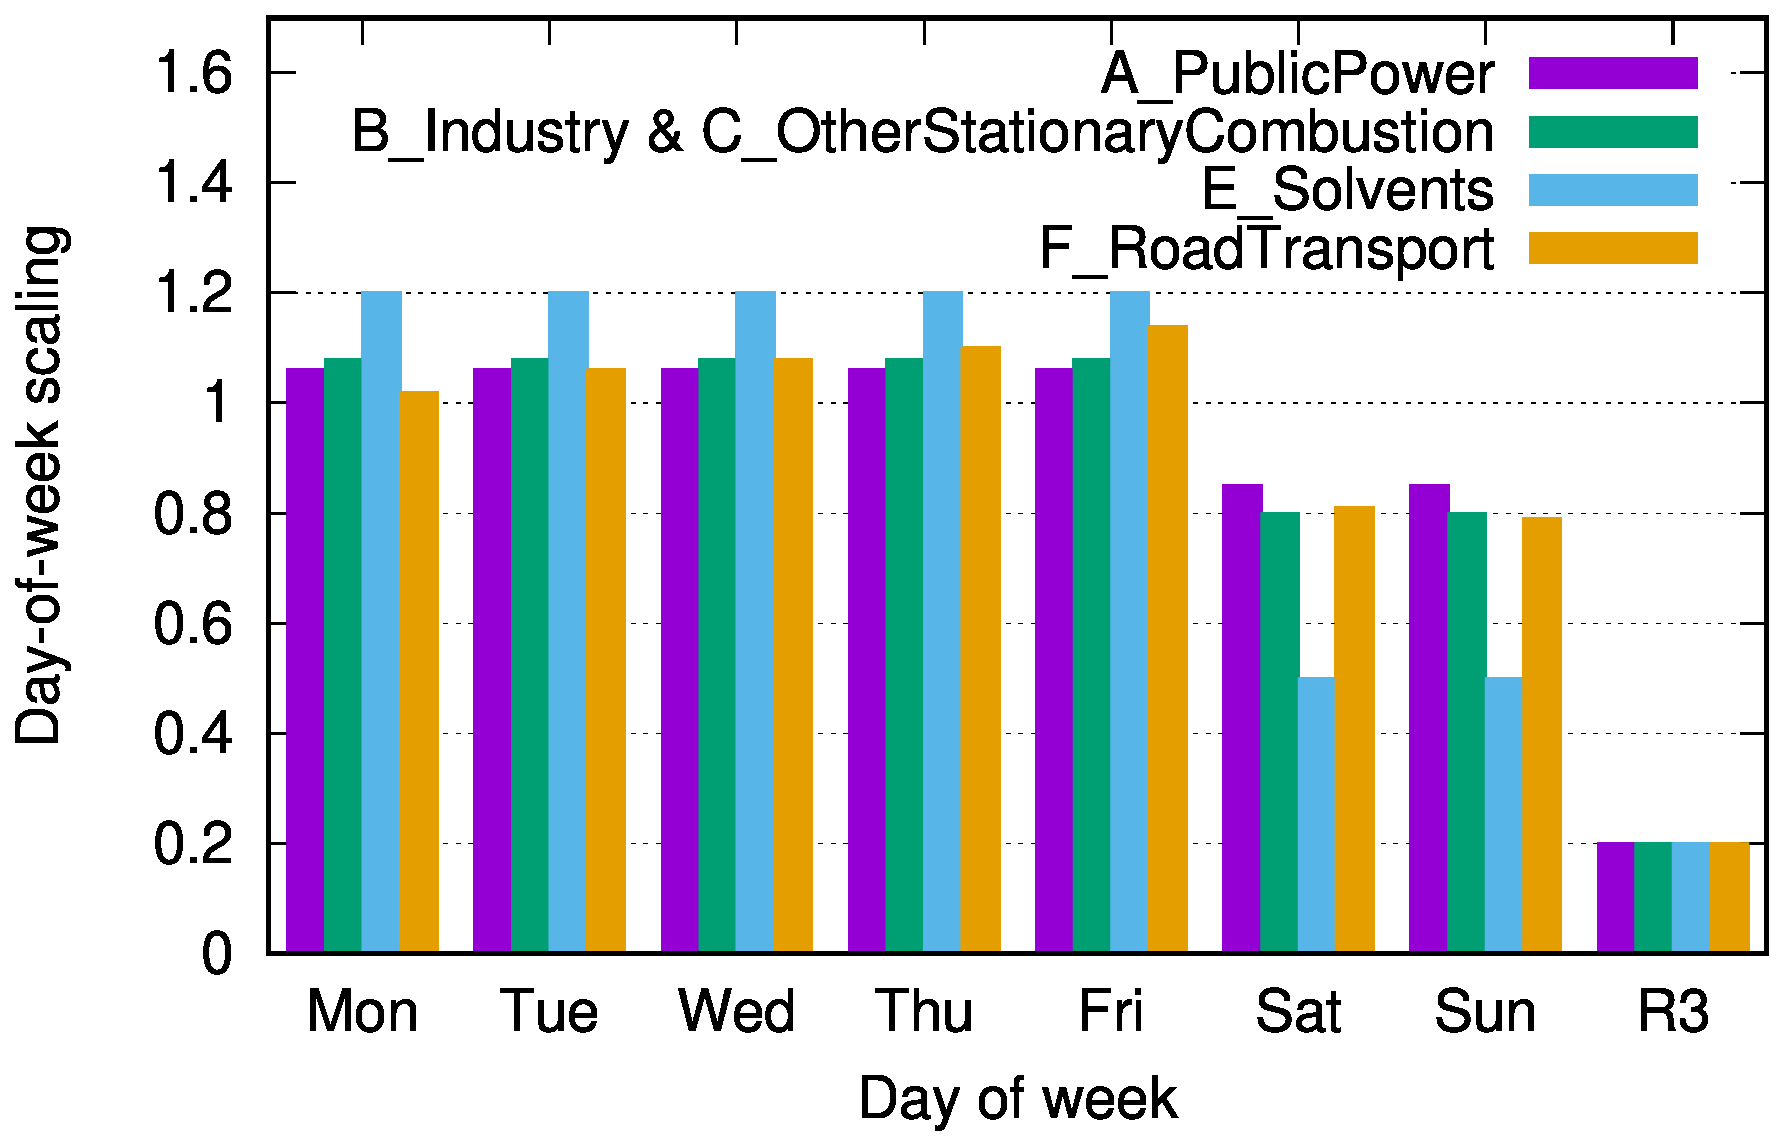
Figure 1Day-of-week coefficients for the affected sectors. R3 is the value forced for national holidays for the R3 case.
For an evaluation of the simulations, we used the hourly data of the AQ monitoring stations downloaded from the European Environmental Agency portal (EEA, http://discomap.eea.europa.eu/map/fme/AirQualityExport.htm, last access: 20 October 2021). Since we focus on regional-scale effects, a subset of representative stations was selected, namely, the stations classified from 1 to 7 according to the Joly and Peuch (2012) classification. This dataset is also used for the operational CAMS-regional evaluation (751 stations over the European domain). For the Ramadan analysis, only Turkish stations were used, with no classification-related filtering applied to maintain a sufficient number of stations in the analysis.
The effect of holidays was considered for the main pollutants observed by the EEA network: PM2.5, SO2, CO, NO2, NOx, and O3. Five statistics were considered following the CAMS evaluation standards: bias, fractional bias (FracB), Pearson correlation coefficient (corr), RMSE, and fractional gross error (FGerr).
We considered the effect of holidays at two temporal scales. The short-term impact was analysed for the 1–2-week-long period centred around each holiday day. For each day of this period, the spatial statistics were computed across the observational stations, and the evolution of these statistics from day to day was compared between the SILAM runs. The long-term longitudinal effect was analysed at an annual level for the whole of 2018, and attention was given to the temporal statistics computed for the stations time series.
Since the diurnal profile of emission during the holidays is unknown and probably specific to each event and country, the current study mainly used daily averaging of both observational and model data for computations of the statistics.
Assessing the effect of holidays on the model skills is not straightforward because the emission error during holidays (e.g. too high NOx emissions) can offset the general underestimation of the emission in the region as well as the model internal uncertainties. As a result, the model results without the holiday effect may be even better than with it – but for wrong reason. To avoid this problem, we considered the variability of the time series of the model skills as the main measure of success. For instance, a correctly represented holiday effect would lead to the same model bias during the holiday day as before and after. A quantitative measure of success is therefore the ratio R of the standard deviations of the HS and BL runs:
where P is one of the above CAMS spatial model skills and standard deviation is taken from among the daily values of this skill. The positive effect of the holiday emission scaling would mean R<1, whereas R>1 indicates that the actual emission moved into the opposite direction of that suggested by the Sunday scaling coefficients.
4.1 Overall short-term impact of public holidays
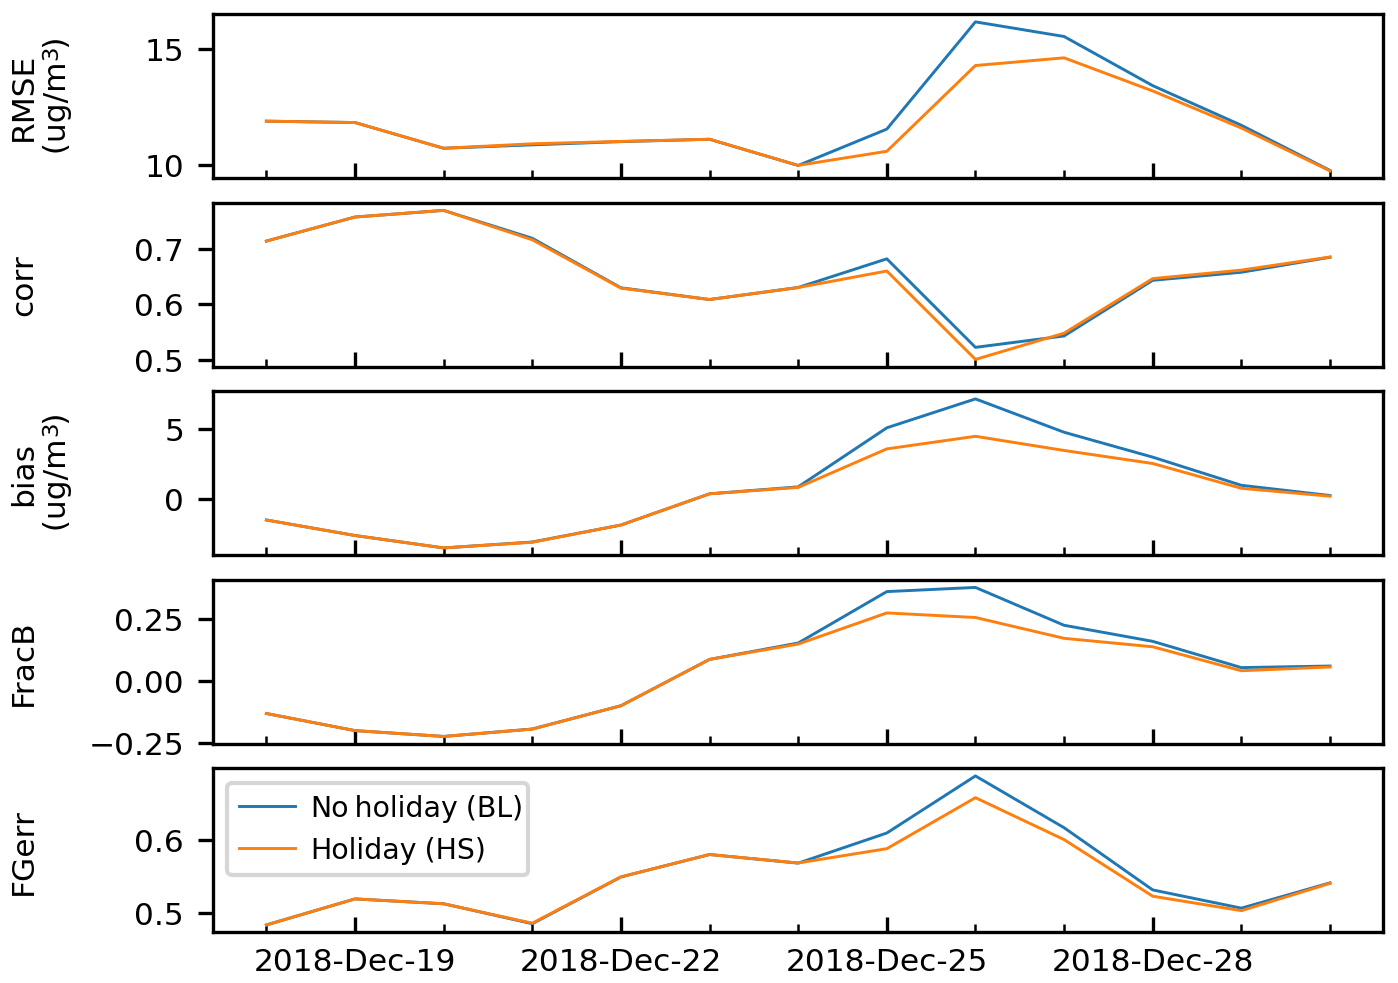
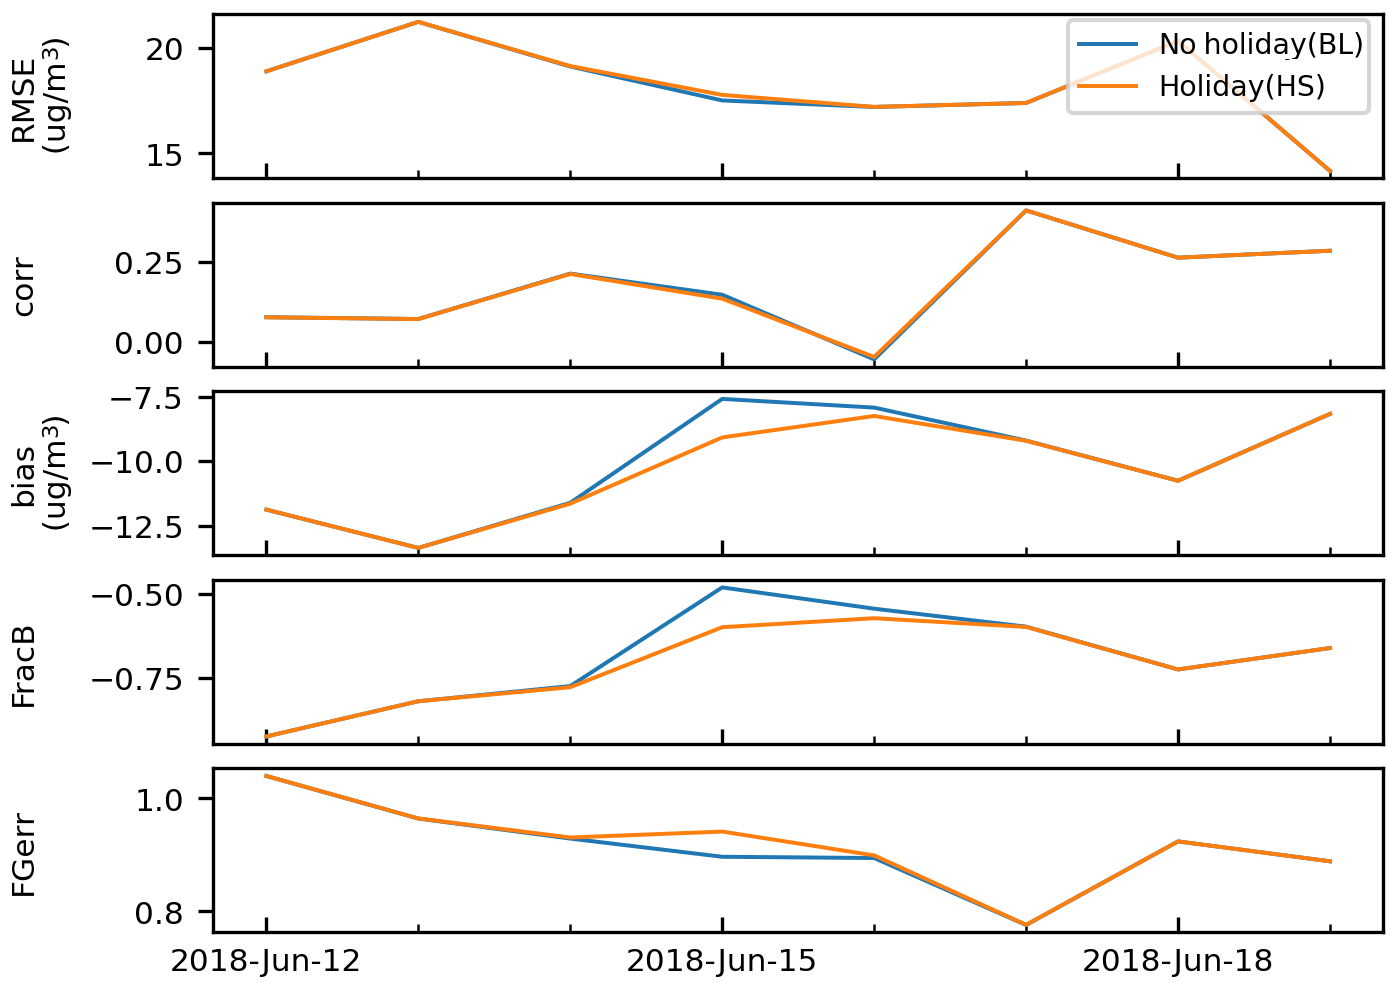
The summary of the simulations is presented in Fig. 2 for the main holidays of 2018 and all considered pollutants. The physical meaning of the R criterion (Eq. 1) is illustrated in Fig. 3, which shows a substantial “jump” in all model skills at or around Christmas Day. Before and after that day the skill values are similar. The HS run exhibits less of a jump than the BL case, which indicates that the model–measurement agreement is more homogeneous. The ratio of the standard deviations of the skills R from Eq. (1) is presented in Fig. 2 for all skills and all species.
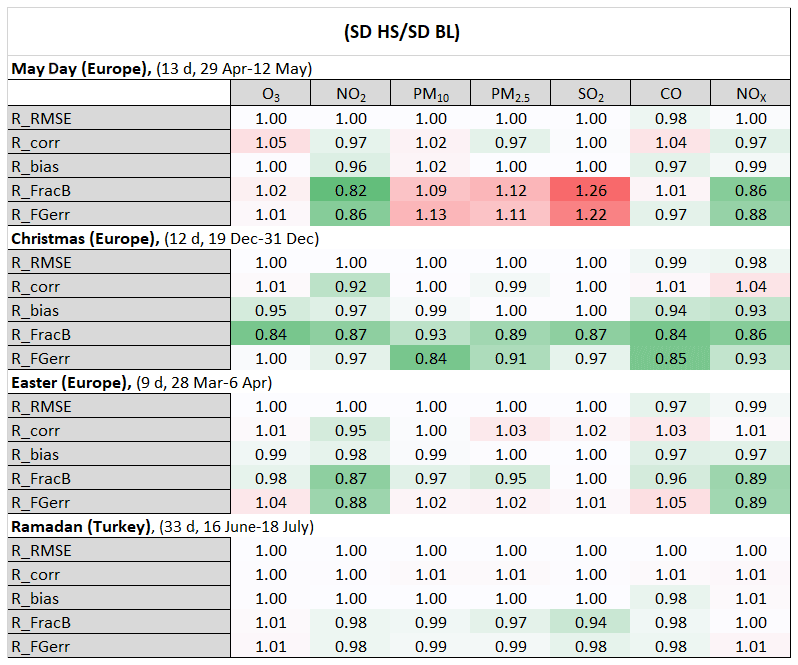
Figure 2Summary of the R value for the main European holidays in 2018 for the considered air pollutants (the effect of Ramadan is assessed for Turkey only).
The effect, expectedly, varies between the quality metrics and species. Thus, the least sensitive parameter is RMSE, whereas the spatial correlation coefficient showed mixed signals in loose connection with other parameters. The most sensitive parameters are bias, fractional bias, and fractional gross error, which are also the most important for the study.
The majority of metrics and cases showed a clear positive effect of accommodating the holiday emission changes in the model simulations. The most significant changes were obtained for NO2 and NOx, where the flattening of, e.g., fractional bias time series could be as large as 10 %–20 %. It reflects the major role of the changes in the traffic intensity (mostly, reduction) during holidays. Carbon monoxide generally followed the NOx patterns but with a lower effect due to a large background level and the contribution from the sources with weak or no weekly variation in the intensity. Changes in O3 and SO2 were very limited, except for Christmas when they also showed a more homogeneous bias of the HS run.
Intriguingly, the effect for PM2.5 and PM10 was significant for fractional bias and fractional gross error (but small for bias) and partly detrimental. It indicates that the Sunday profiles for primary PM and, possibly, NH3 emission may be not suitable for holidays. Domestic activities, seemingly adding little to NOx emissions, may be quite significant for emission of PM and PM precursors. It was particularly evident for May Day, which is usually characterized by intense outdoor activities all over Europe.
Holiday-wise, the most significant impact was obtained for Christmas, while Easter and Ramadan (assessed for Turkish stations only) showed moderate improvement. May Day showed the mixed signal mentioned above.
4.2 Examples of specific holidays
The impact of holidays on the SILAM spatial skills was the largest for the Christmas week (Figs. 2 and 3). As expected, the Christmas period is characterized by lower emissions, which resulted in a high bias of the BL model run and almost 50 % growth of the RMSE compared to the surrounding days. The reduction in emission in the HS run improved the performance but did not eliminate the problem: the time series of the skills still exhibit strong jumps on (and around) Christmas Day. Comparison of daily-mean concentrations showed a reduction in the model bias for the HS run by ∼4.5 µg m−3 of NO2. Consequently, the RMSE was also lower, by ∼4 µg m−3. These improvements constitute about 26 % of the baseline statistics (see Figs. S1–S6 in the Supplement for other species). However, as seen from the bias time series (Fig. 3), the HS run, being a step in the right direction, incorporated only a small fraction of the actual emission reduction, which also started before and ended after Christmas Day.
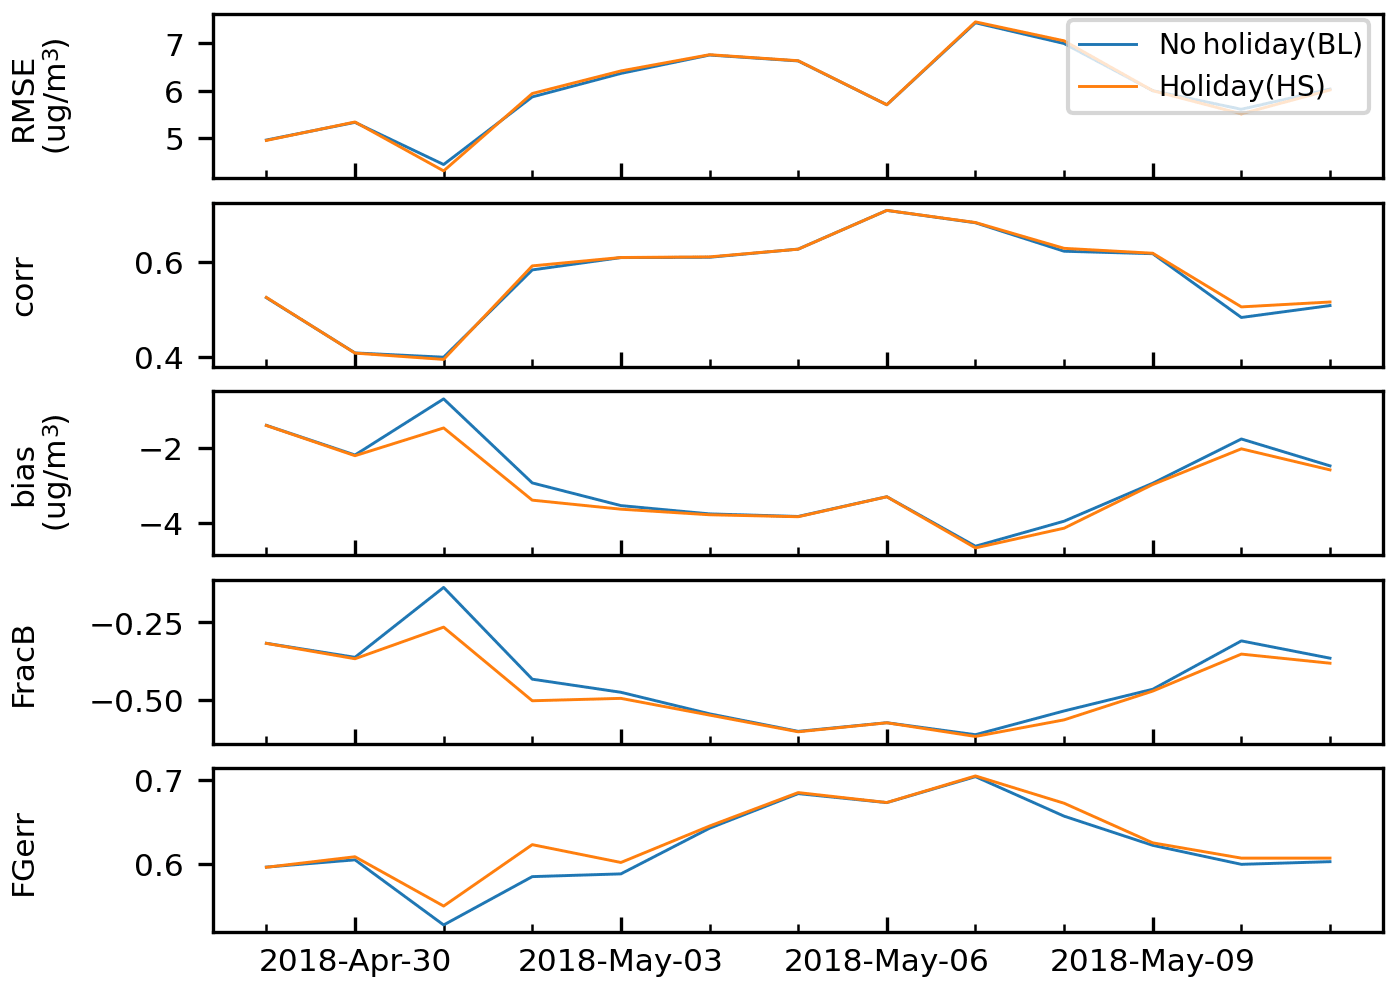
Comparing the HS and BL runs for Easter (Fig. 4), one can see a substantial improvement of the scores for the days of the event. Similarly to the winter holiday week, Easter emission reduction seems to be greater than that of Sundays but the difference is not so large (see results for other species Figs. S7–S12).

The first 10 d of May were regarded as an example of late-spring/summer vacations (there are no holidays that apply to all of Europe during summer itself). The HS run showed slightly lower values for RMSE but, similarly to Easter, initially negative bias increased further. Nevertheless, the bias time series became smoother compared to the BL one, which is an indication of the improvement: the systematic emission underestimation is a separate task, the necessity of which should not be masked by another error. Reduction in NOx resulted in a substantial improvement of the ozone scores (Figs. S13–S18). This connection was the strongest among all holidays throughout the year, owing to the active chemistry and photolysis in May.
In the Muslim countries (Turkey, Albania), the Ramadan month is not a public holiday; only working hours are reduced, which is not reflected in the HS run. Only the last 3 d of Ramadan – the Ramadan Feast – are public holidays in Turkey (Table 3, Figs. 2 and 6 for NO2, Figs. S19–S24 for other species). For these days, there are distinct differences between the BL and HS model runs. However, similarly to Easter and May Day, the model is generally low biased for NO2 in Turkey during this period; therefore the additional reduction in the concentrations is, formally speaking, not an improvement: the negative bias increases. Nevertheless, it is a step in the right direction, as seen from the reduced variations in the model skills of the HS run (Fig. 2). Due to this underestimation, it is difficult to say how conservative the Sunday-level emission reduction is for these holidays (Fig. 6).
Unlike the Christmas and Easter holidays, which exist in most European countries, the Ramadan Feast days only affect Turkish stations substantially. At the European scale, the effect is negligible.
4.3 Long-term statistics
At the annual scale, the impact of holidays on the model performance is limited. The reduction affects only the days with changed emissions and practically does not influence even the next day. The most significant impact was for the Christmas and New Year weeks, but even for them the effect faded out by the next day. According to the annual statistics, at an annual level the overall effect for NO2 for all of Europe was positive but did not exceed 1 %, which reflects the typical number of holiday days in a year (<3 %) and up to ∼30 % improvement during these days. The impact on other species was lower than that for NO2.
5.1 Impact of holiday effect on model skills: episodically significant, noticeable at an annual level
The simulations presented in the previous section confirmed that the official holidays substantially affect air quality, as also shown in the studies outlined in the Introduction. The holiday incorporation into the simulations as Sundays, being very simple technically, brings noticeable improvement of the model skills for the days with the modified emission. Since the number of such days in each year is <3 %, the overall improvement of the annual skills is within 1 %, which is quite significant at such a level of aggregation.
The suggested simple approach should be regarded as only the first step. Holidays are characterized by redistribution of emission due to changing traffic structure, a shift in activities from office areas to suburbs, etc. Incorporation of these effects can further improve the model skills but will require quantitative information on such redistribution at the European level. Several approaches towards determining these profiles have been reported (e.g. Guevara et al., 2021; Mues et al., 2014; Menut et al., 2012), but tests with SILAM showed no substantial improvement suggesting additional uncertainties in the proposed profiles. Some support can be found from traffic information, which is presently not available at continental scales (examples for two cities are provided below).
5.2 Sunday-based emission reduction for holidays is a conservative estimate
The simulations also suggested a comparatively simple way to achieve a more significant gain: the Sunday emission scaling (Fig. 1) can be amplified. In a few cases, especially for Christmas and New Year, the actual emission rates might be much lower, whereas for some events the emission of some species might increase. Thus, the New Year's Eve celebration in many countries involves fireworks, which add substantial amounts of PM. The second issue is that the Sunday diurnal profile of traffic (also other sources) is substantially different from that of the weekdays. In the present version of SILAM this difference is not accounted for, which evidently limits the model performance and the gain due to the holiday incorporation.
This is consistent with the estimates of the observation-based studies. Thus, Hua et al. (2021) also found that the holiday effect is much stronger than the weekend effects. They noticed the opposite signs for PM2.5 and NO2: an average increase of about 22 % and an average decrease of about 11 %, respectively. Similarly, Retama et al. (2019) reported a substantial effect of fireworks on PM at night and the following morning of Christmas Day and New Year's Day. Along the same lines, Rozbicka and Rozbicki (2016), demonstrated that daily mean ozone concentration and maximum ozone peaks are, respectively, 13 % and 8 % higher than those on the weekdays, which also indicates a reduction in NO2 concentrations of about 20 %. Conversely, the Nodehi et al. (2018) study showed that the Nowroz holidays (the Iranian New Year or spring festival) are characterized by a reduction in concentration of PM2.5 due to the reduction in the working activities and no massive fireworks. The reported reduction in PM2.5 concentration during the Ramadan Feast holidays is quite close to our estimates.
5.3 Regional specifics of the effect of HS and R3 emission reduction
The impact of holiday-related emission reduction varies from country to country with substantial differences visible even at a sub-country level. To highlight these peculiarities, we used the station-wise temporal correlation coefficients for hourly NO2, CO, O3, and PM2.5 concentrations (Figs. 7–9). The maps reveal a strong inhomogeneity of the effect for the Christmas and New Year weeks (Fig. 7) as well as for May Day (Fig. 8). It can dramatically vary even within a single country – as seen from the comparison of maps in Fig. 7 and the country-median correlation coefficient of Fig. 9.
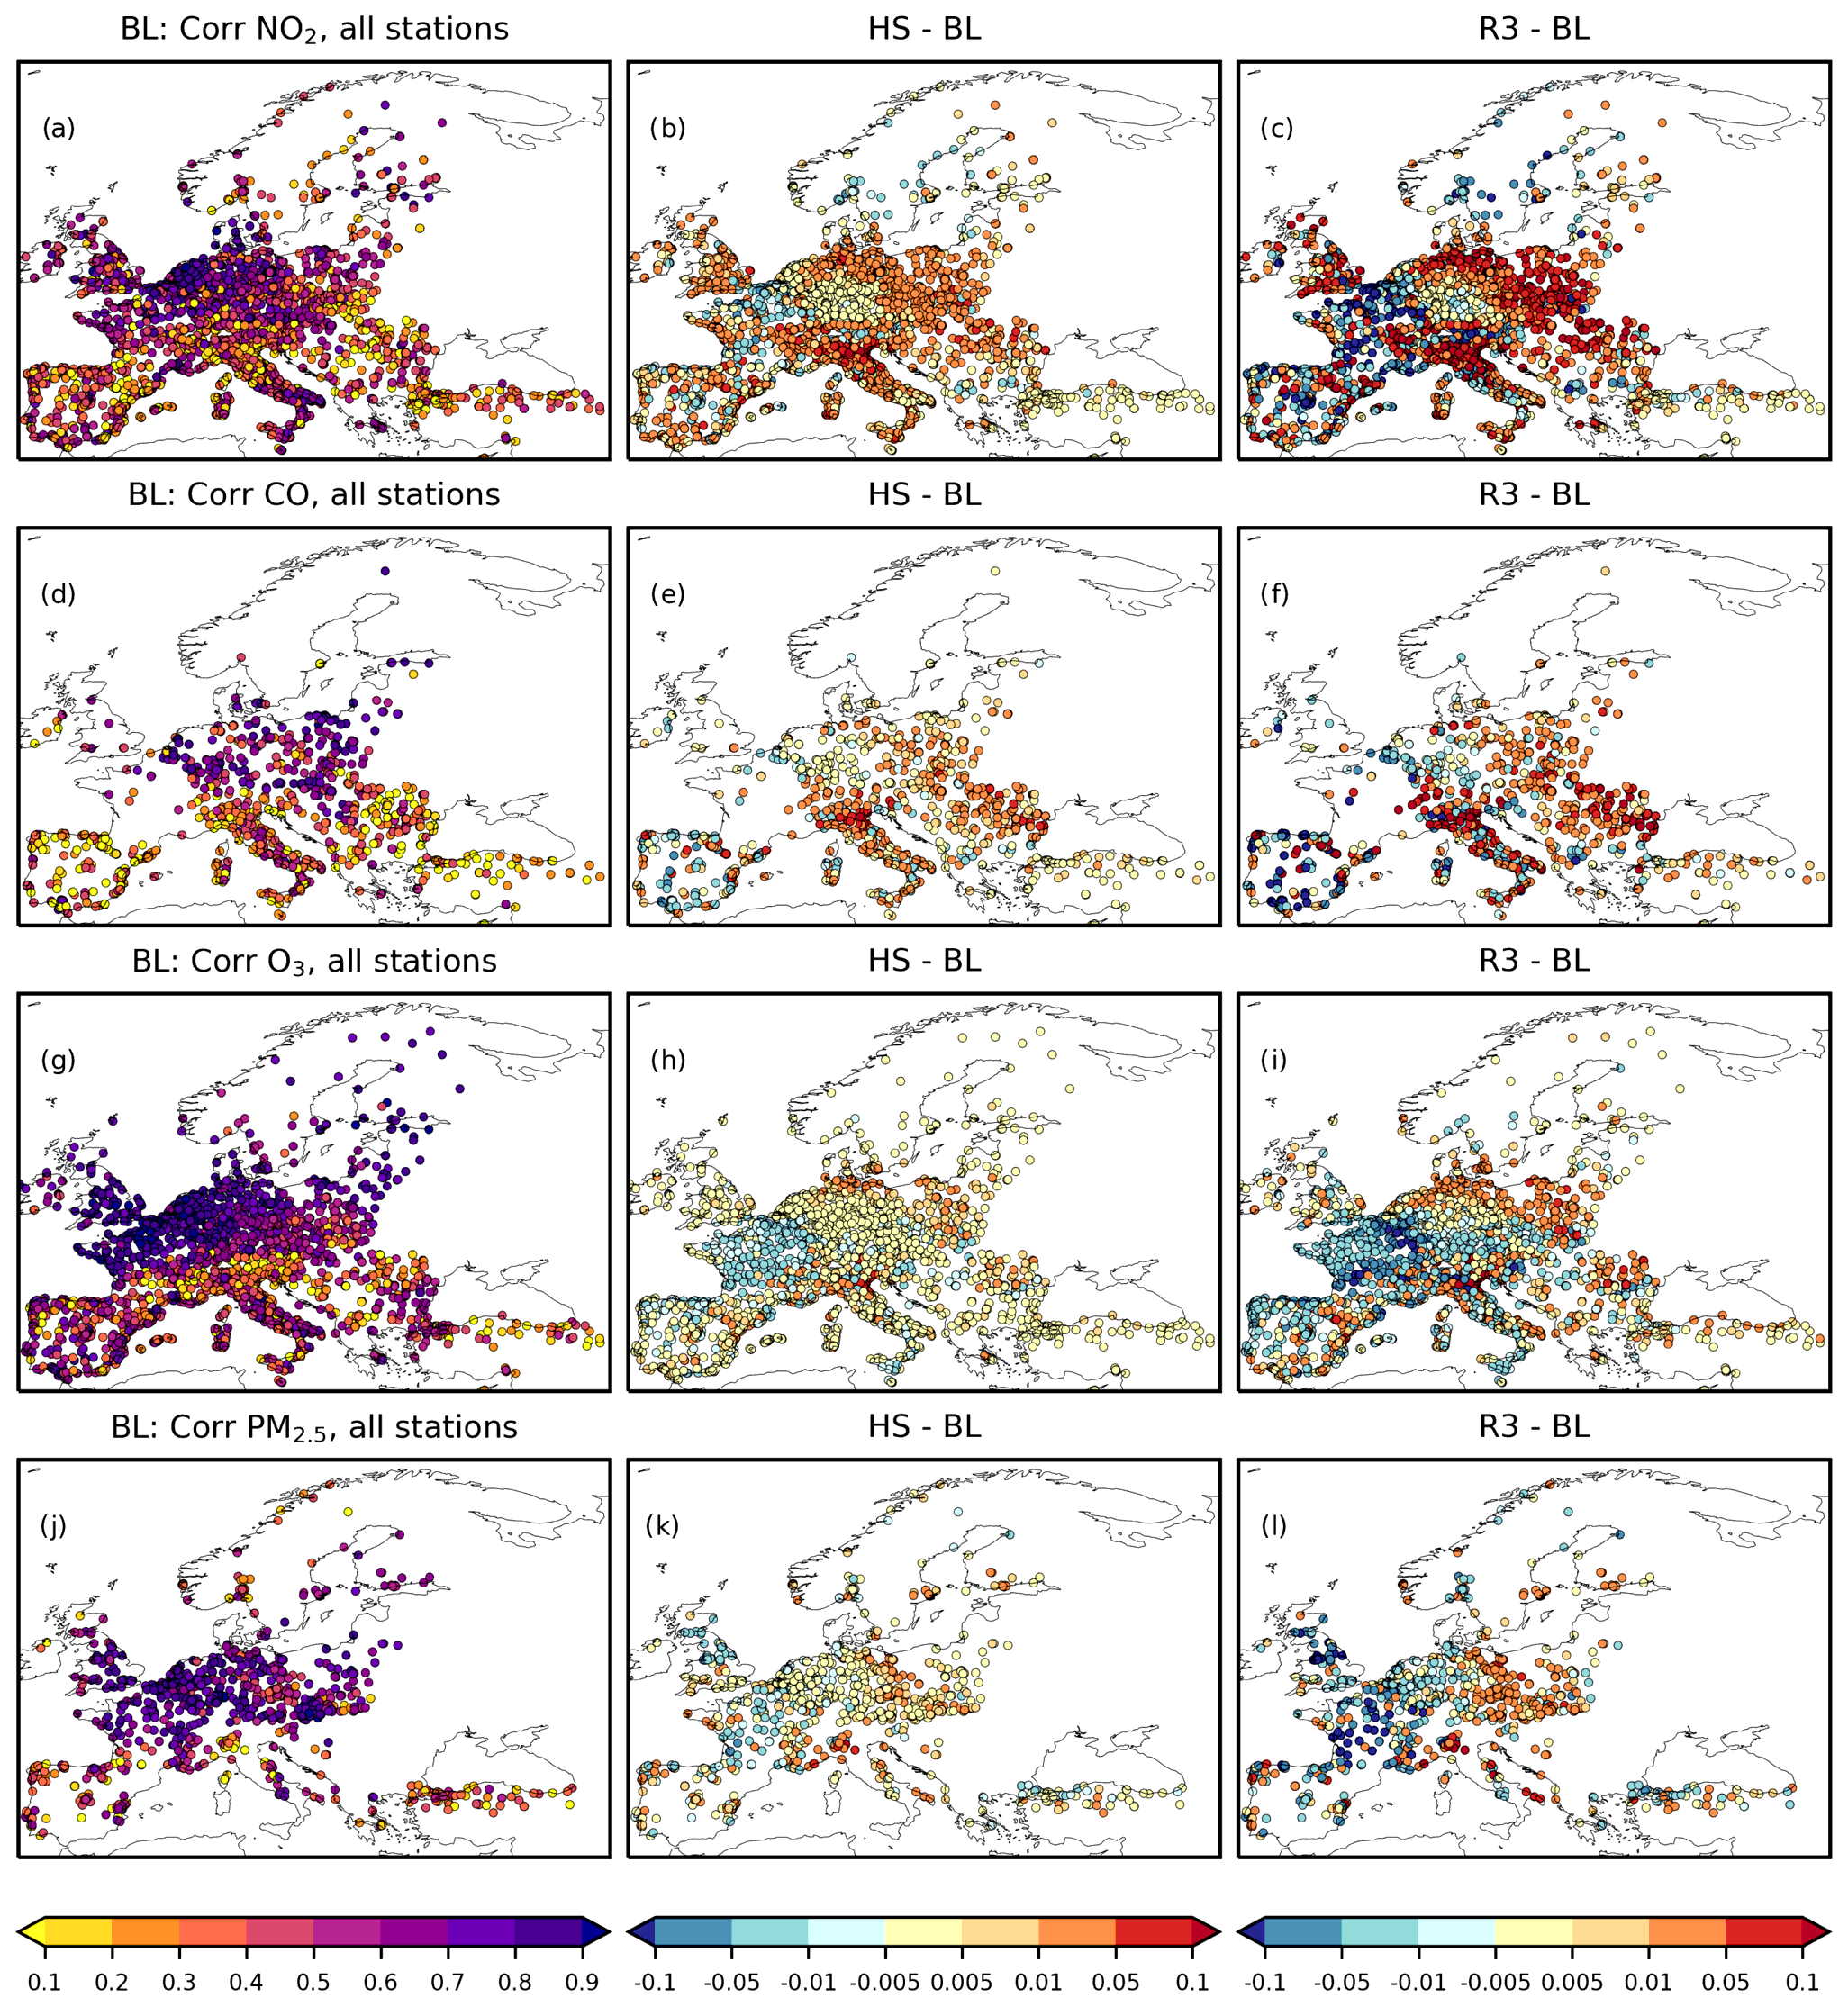
Figure 7Maps of the temporal correlation coefficient of hourly NO2, CO, O3, and PM2.5 concentrations for the EEA stations during the Christmas holidays (21–31 December 2018).
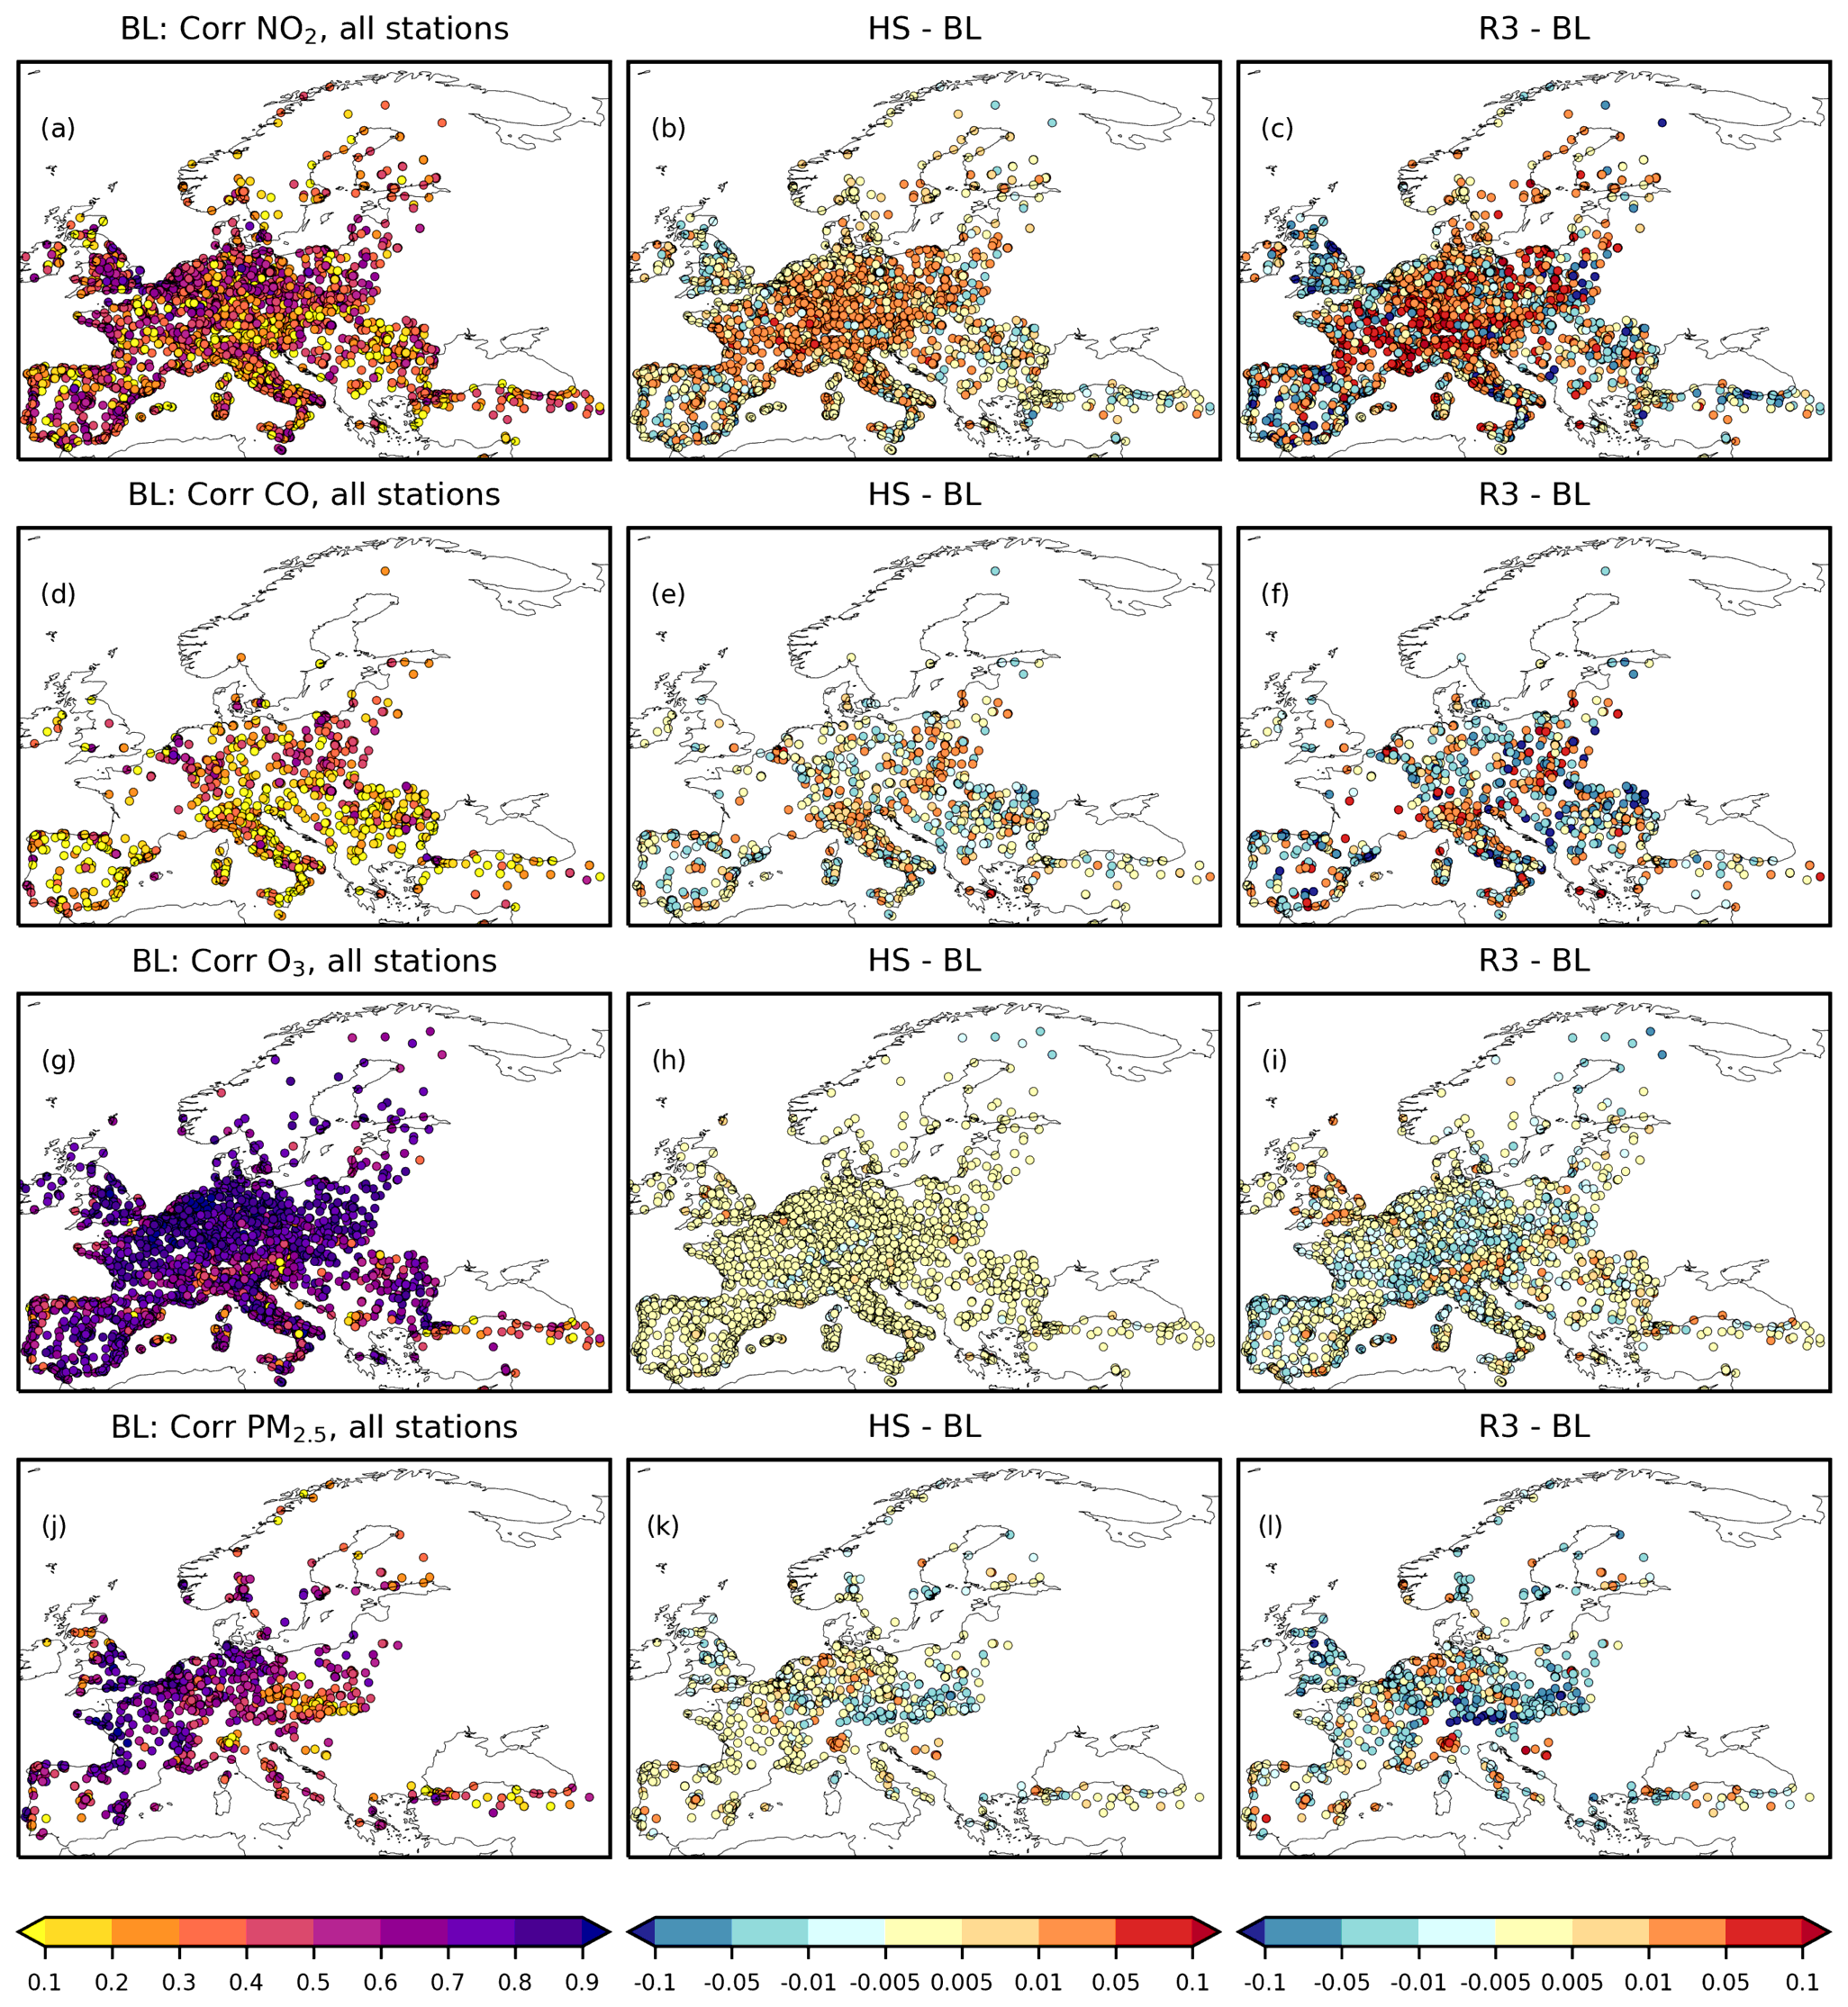
Figure 8Maps of the temporal correlation coefficient of hourly NO2, CO, O3, and PM2.5 concentrations for the EEA stations during the May Day holidays (29 April–11 May 2018).
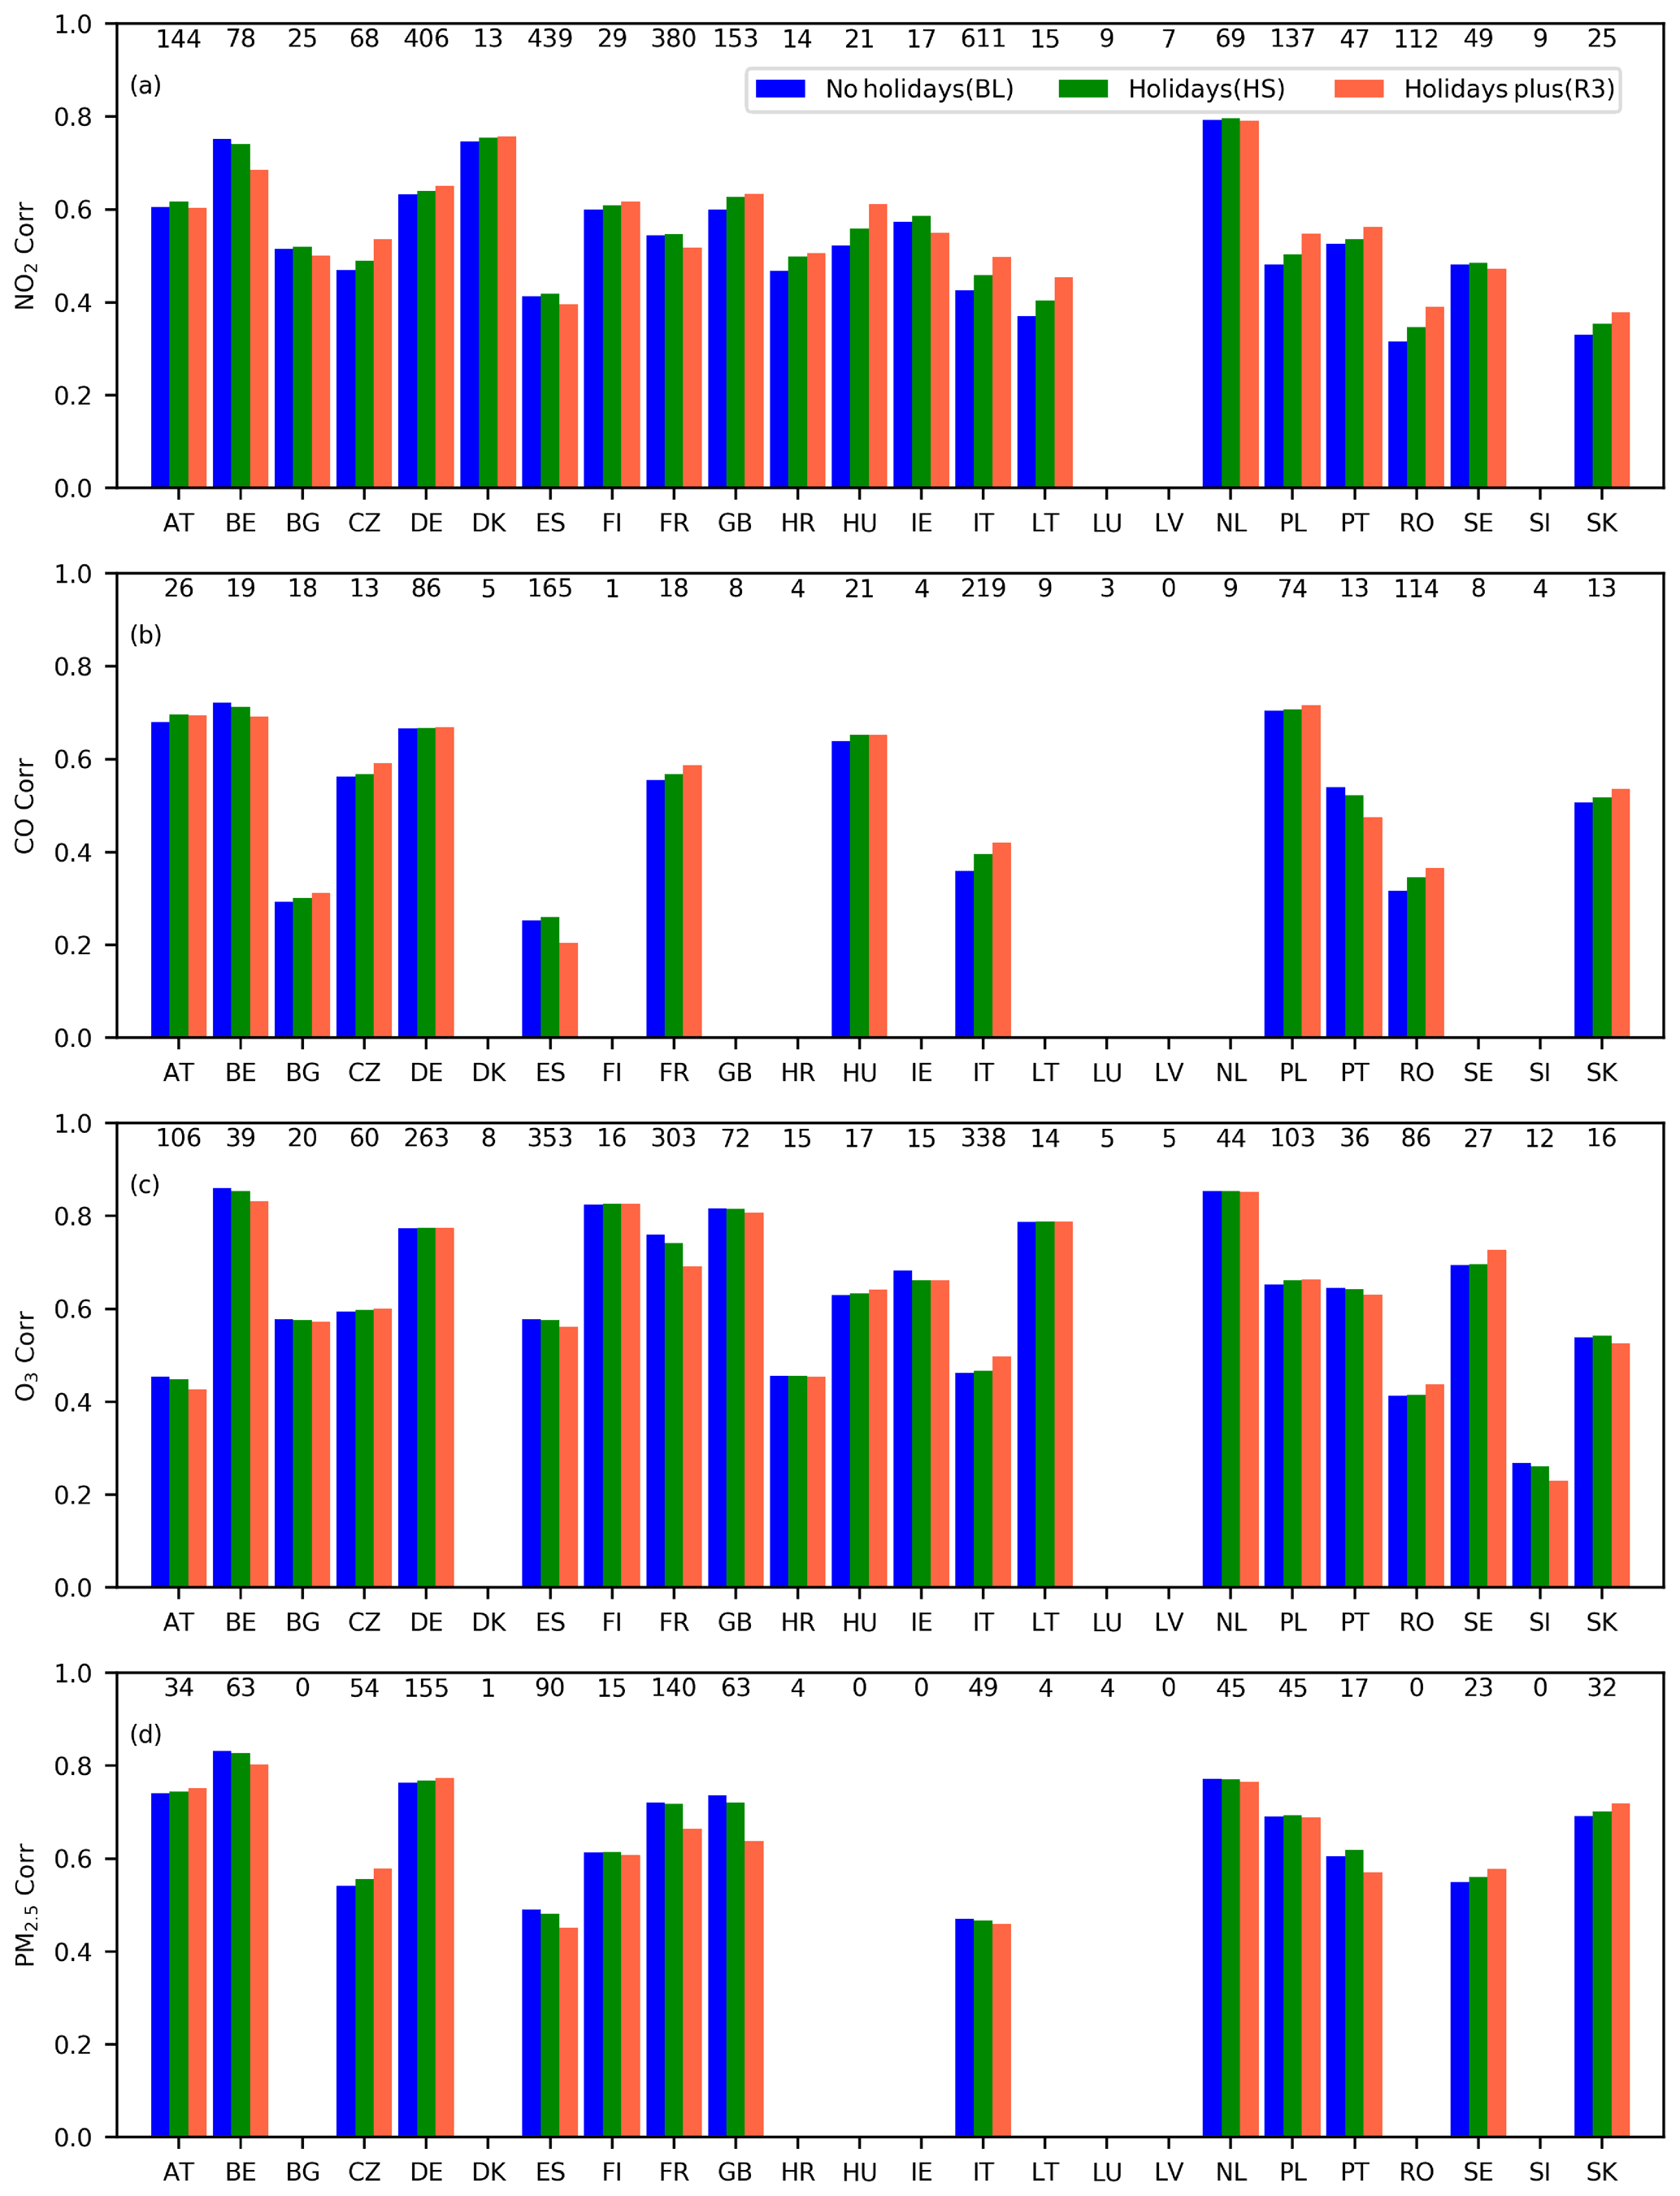
Figure 9Country-wise median change in temporal correlation coefficient during the 2 weeks of Christmas holidays (21–31 December 2018). The numbers at the top of each panel show the number of stations that reported data for the period.
In the case of NO2, correlation increases, e.g. in northern Germany, Italy, Poland, and the eastern part of Finland for both the HS and the R3 runs: reduction in emission had led to lower concentrations, which improved temporal correlation for these regions. Conversely, there was no effect or even deterioration of correlation in southern Germany, northern France, the Madrid region, etc.
Other species showed qualitatively similar patterns but lower gains and losses. Significant changes are noticeable only for CO, which is also significantly affected by traffic. Minor changes for ozone were noticeable only in winter when NOx emissions affect O3 concentrations via titration. This is consistent with the spatial statistics of Fig. 2. For PM, the effect was not unequivocal: there is a small but coherent reduction in correlation in eastern Europe in May but a neutral response or an increase for Christmas. This once again refers to the regional habits of celebrating these holidays and corroborates the overall detrimental effect on these species reported in Fig. 2. One should also keep in mind that the fireworks are used during the New Year celebration only in some countries (as suggested by the current results, in western Europe), where the HS and R3 runs are clearly inadequate for PM.
Surprisingly, for the Christmas holidays, skills over most of France are generally worse for the HS run and much worse for R3 indicating a substantially different pattern of activities during holidays, compared to those of the neighbouring countries: reduction in NOx emissions and, consequently, concentrations there do not correlate with the observed tendencies. For May Day, the specificity did not show up: correlation has noticeably increased over most of the country, similar to its neighbours. Among the hypothetical reasons for such behaviour, one could suggest more “active” habits for Christmas celebration in France than in the neighbouring countries.
The R3 run, which was planned as an overshot, showed strong improvement of temporal correlation over Christmas week in eastern Europe, central and northern Italy, and northern Germany. Therefore, one can argue that even the 5-fold emission reduction in these countries/regions might be not that much of an exaggeration.
These issues deserve a more detailed analysis accounting for the varying traffic patterns and effects on days preceding and following the official holidays.
5.4 Local traffic counts illustrate the phenomenon
As mentioned above, a lack of systematic continental-scale traffic counts precludes their usage for determining and/or verifying the assumptions of the current study. However, for a few cities the data are available and can be used as an illustration of the effect. Below we provide the time series for Helsinki and Dublin (Fig. 10). The daily traffic counts over several years corroborate/illustrate the above discussion. Indeed, for Helsinki, the May Day traffic count almost perfectly meets the Sunday number of cars 3 d before in 2019 and 1 d after in 2020. The difference between the years illustrates the COVID-19 lockdown effects in 2020.
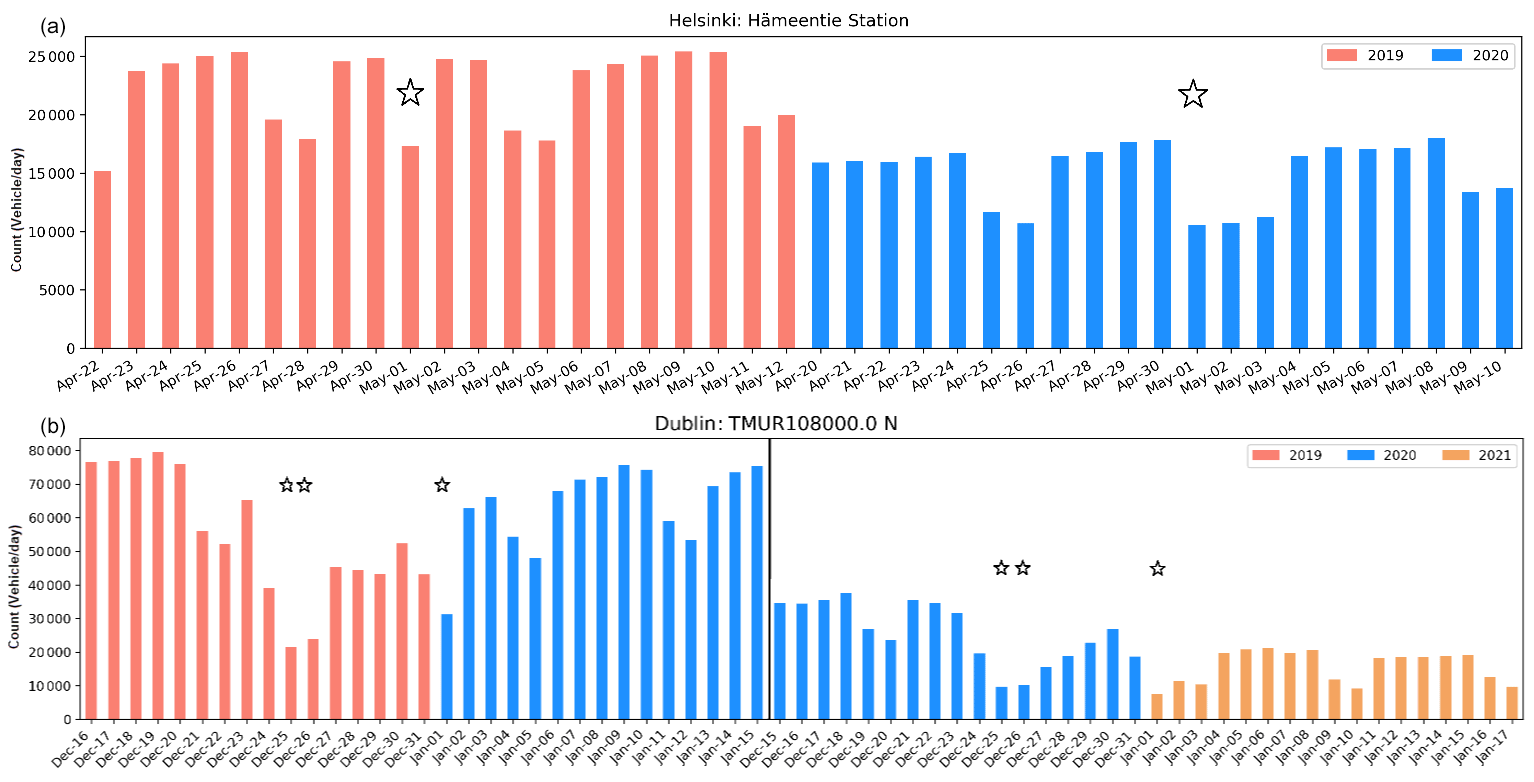
Figure 10Daily traffic count in Helsinki (a) and Dublin (b) during Christmas/New Year and May Day holidays. Stars mark the official holidays. Note that 6 January is a non-holiday day in Dublin.
For Dublin, the Christmas–New Year holidays for 2 sequential years show that for this major event the traffic reduction is at least 2 times greater than for an ordinary Sunday: almost 4 times less cars were counted on 25–26 December than on an ordinary day. Such a reduction is already comparable to the 5-fold reduction in the S3 run. The city also manifests about twice lower traffic intensity during COVID-19 lockdowns, whereas Helsinki lost about 30 % of its traffic. Finally, one can see that the traffic is not restored to normal intensity between Christmas and New Year, similar to what was noticed from the observations (Fig. 3).
Incorporating information on public holidays in emissions of the affected anthropogenic sectors leads to substantial short-term improvements of the SILAM model scores, even if done conservatively. The largest impact was found for NOx, which is controlled by the changes in the traffic intensity. Certain improvements were also found for other species, but the signal was weaker than that for NOx.
The effect of the emission reduction during holidays may look detrimental in the case of a systematic underestimation in some regions. However, in the majority of such cases the bias and other skills became more homogeneous in time manifesting a reduction in the holiday-induced errors in emission.
The sensitivity runs confirmed that the Sunday emission level, in many cases, is too conservative a proxy for the public-holiday emission. Thus, the reduction during the Christmas and New Year holidays of 2018 was closer to a factor of 4 in western Europe and possibly even stronger in eastern Europe.
The current experiment used the prescribed sector-specific diurnal profiles of emission intensity, which were the same for weekdays, weekends, and holidays. The incorporation of specific profiles for weekends and holidays might further improve the quality of the model predictions.
The proposed method of handling emission reduction in AQ models, albeit very simple and with a room for improvement, gives noticeable gains in the model performance. The method is straightforward to implement in the AQ models and can be regarded as an easy way to improve the model prediction skills for the periods of public holidays. An in-depth analysis of the specific holidays and related traditions in specific countries, such as fireworks on New Year's Eve, would, most probably, lead to further improvements of the AQ predictions.
SILAM is an open-code system and can be obtained from the GitHub open repository: https://github.com/fmidev/silam-model (last access: 22 November 2021, https://doi.org/10.5281/zenodo.5713863, rkouznetsov, 2021). The simulation results are available on request from the authors of the paper.
The supplement related to this article is available online at: https://doi.org/10.5194/gmd-14-7459-2021-supplement.
The authors jointly devised the project and developed the paper concept. YF contributed to the implementation of the research and analysis of the results and drafted the paper. RK performed the SILAM computations and contributed to the analysis. MS contributed to the analysis, drafted the Discussion section, and contributed to other sections of the paper. All authors edited the final text.
The contact author has declared that neither they nor their co-authors have any competing interests.
Publisher's note: Copernicus Publications remains neutral with regard to jurisdictional claims in published maps and institutional affiliations.
Financial support from the Academy of Finland and the Copernicus Atmospheric Monitoring Service (CAMS-50 and CAMS-61) for the SILAM development is kindly acknowledged.
This research has been supported by the Academy of Finland, GLORIA project (grant no. 310372).
This paper was edited by Jason Williams and reviewed by three anonymous referees.
Beirle, S., Platt, U., Wenig, M., and Wagner, T.: Weekly cycle of NO2 by GOME measurements: a signature of anthropogenic sources, Atmos. Chem. Phys., 3, 2225–2232, https://doi.org/10.5194/acp-3-2225-2003, 2003.
Brasseur, G. P., Xie, Y., Petersen, A. K., Bouarar, I., Flemming, J., Gauss, M., Jiang, F., Kouznetsov, R., Kranenburg, R., Mijling, B., Peuch, V.-H., Pommier, M., Segers, A., Sofiev, M., Timmermans, R., van der A, R., Walters, S., Xu, J., and Zhou, G.: Ensemble forecasts of air quality in eastern China – Part 1: Model description and implementation of the MarcoPolo–Panda prediction system, version 1, Geosci. Model Dev., 12, 33–67, https://doi.org/10.5194/gmd-12-33-2019, 2019.
Carslaw, K. S., Luo, B., and Peter, T.: An analytic expression for the composition of aqueous HNO3-H2SO4 stratospheric aerosols including gas phase removal of HNO3, Geophys. Res. Lett., 22, 1877–1880, https://doi.org/10.1029/95GL01668, 1995.
Chen, P.-Y., Tan, P.-H., Chou, C. C.-K., Lin, Y.-S., Chen, W.-N., and Shiu, C.-J.: Impacts of holiday characteristics and number of vacation days on “holiday effect” in Taipei: Implications on ozone control strategies, Atmos. Environ., 202, 357–369, https://doi.org/10.1016/j.atmosenv.2019.01.029, 2019.
Damski, J., Thölix, L., Backman, L., Taalas, P., and Kulmala, M.: FinROSE – middle atmospheric chemistry transport model, Boreal Environ. Res., 12, 535–550, 2007.
Dasari, H. P., Desamsetti, S., Langodan, S., Karumuri, R. K., Singh, S., and Hoteit, I.: Atmospheric conditions and air quality assessment over NEOM, Kingdom of Saudi Arabia, Atmos. Environ., 230, 117489, https://doi.org/10.1016/j.atmosenv.2020.117489, 2020.
de Foy, B., Lu, Z., and Streets, D. G.: Impacts of control strategies, the Great Recession and weekday variations on NO2 columns above North American cities, Atmos. Environ., 138, 74–86, https://doi.org/10.1016/j.atmosenv.2016.04.038, 2016.
de Foy, B., Brune, W. H., and Schauer, J. J.: Changes in ozone photochemical regime in Fresno, California from 1994 to 2018 deduced from changes in the weekend effect, Environ. Pollut., 263, 114380, https://doi.org/10.1016/j.envpol.2020.114380, 2020.
Derwent, R. and Hjellbrekke, A.-G.: Air Pollution by Ozone Across Europe: Handbook of Environmental Chemistry, Springer, Berlin, Heidelberg, 371 pp., 2012.
Ding, J., Miyazaki, K., van der A, R. J., Mijling, B., Kurokawa, J.-I., Cho, S., Janssens-Maenhout, G., Zhang, Q., Liu, F., and Levelt, P. F.: Intercomparison of NOx emission inventories over East Asia, Atmos. Chem. Phys., 17, 10125–10141, https://doi.org/10.5194/acp-17-10125-2017, 2017.
Elansky, N. F., Shilkin, A. V., Ponomarev, N. A., Semutnikova, E. G., and Zakharova, P. V.: Weekly patterns and weekend effects of air pollution in the Moscow megacity, Atmos. Environ., 224, 117303, https://doi.org/10.1016/j.atmosenv.2020.117303, 2020.
European Environment Agency: EMEP/EEA air pollutant emission inventory guidebook 2013: technical guidance to prepare national emission inventories, Publications Office, LU, Luxembourg, 2013.
Fan, C., Li, Z., Li, Y., Dong, J., van der A, R., and de Leeuw, G.: Variability of NO2 concentrations over China and effect on air quality derived from satellite and ground-based observations, Atmos. Chem. Phys., 21, 7723–7748, https://doi.org/10.5194/acp-21-7723-2021, 2021.
Forster, P. M. de F. and Solomon, S.: Observations of a “Weekend Effect” in Diurnal Temperature Range, P. Natl. Acad. Sci. USA, 100, 11225–11230, 2003.
Frost, G. J., Middleton, P., Tarrasón, L., Granier, C., Guenther, A., Cardenas, B., Denier van der Gon, H., Janssens-Maenhout, G., Kaiser, J. W., Keating, T., Klimont, Z., Lamarque, J.-F., Liousse, C., Nickovic, S., Ohara, T., Schultz, M. G., Skiba, U., van Aardenne, J., and Wang, Y.: New Directions: GEIA's 2020 vision for better air emissions information, Atmos. Environ., 81, 710–712, https://doi.org/10.1016/j.atmosenv.2013.08.063, 2013.
Fu, D., Song, Z., Zhang, X., Wu, Y., Duan, M., Pu, W., Ma, Z., Quan, W., Zhou, H., Che, H., and Xia, X.: Similarities and Differences in the Temporal Variability of PM2.5 and AOD Between Urban and Rural Stations in Beijing, Remote Sens., 12, 1193, https://doi.org/10.3390/rs12071193, 2020.
Fu, X., Wang, S., Zhao, B., Xing, J., Cheng, Z., Liu, H., and Hao, J.: Emission inventory of primary pollutants and chemical speciation in 2010 for the Yangtze River Delta region, China, Atmos. Environ., 70, 39–50, https://doi.org/10.1016/j.atmosenv.2012.12.034, 2013.
Galperin, M. V., Maslyaev, A. M., Pekar, M. I., and Sofiev, M.: The development of HM model in 1996, Meteorological Synthesising Centre East, Moscow, 1996.
Gery, M. W., Whitten, G. Z., Killus, J. P., and Dodge, M. C.: A photochemical kinetics mechanism for urban and regional scale computer modelling, J. Geophys. Res., 94, 12925–12956, https://doi.org/10.1029/JD094iD10p12925, 1989.
Gioli, B., Gualtieri, G., Busillo, C., Calastrini, F., Zaldei, A., and Toscano, P.: Improving high resolution emission inventories with local proxies and urban eddy covariance flux measurements, Atmos. Environ., 115, 246–256, https://doi.org/10.1016/j.atmosenv.2015.05.068, 2015.
Gour, A. A., Singh, S. K., Tyagi, S. K., and Mandal, A.: Weekday/weekend differences in air quality parameters in Delhi, India, International Journal of Research in Engineering and Technology, 1, 69–76, 2013.
Granier, C., Bessagnet, B., Bond, T., D'Angiola, A., Denier van der Gon, H., Frost, G. J., Heil, A., Kaiser, J. W., Kinne, S., Klimont, Z., Kloster, S., Lamarque, J.-F., Liousse, C., Masui, T., Meleux, F., Mieville, A., Ohara, T., Raut, J.-C., Riahi, K., Schultz, M. G., Smith, S. J., Thompson, A., van Aardenne, J., van der Werf, G. R., and van Vuuren, D. P.: Evolution of anthropogenic and biomass burning emissions of air pollutants at global and regional scales during the 1980–2010 period, Climatic Change, 109, 163–190, https://doi.org/10.1007/s10584-011-0154-1, 2011.
Granier, C., Darras, S., Denier van der Gon, H., Doubalova, J., Elguindi, N., Galle, B., Gauss, M., Guevara, M., Jalkanen, J.-P., Kuenen, J., Liousse, C., Quack, B., Simpson, D., and Sindelarova, K.: The Copernicus Atmosphere Monitoring Service global and regional emissions (April 2019 version), https://doi.org/10.24380/D0BN-KX16, 2019.
Grivas, G., Athanasopoulou, E., Kakouri, A., Bailey, J., Liakakou, E., Stavroulas, I., Kalkavouras, P., Bougiatioti, A., Kaskaoutis, D. G., Ramonet, M., Mihalopoulos, N., and Gerasopoulos, E.: Integrating In Situ Measurements and City Scale Modelling to Assess the COVID–19 Lockdown Effects on Emissions and Air Quality in Athens, Greece, Atmosphere, 11, 1174, https://doi.org/10.3390/atmos11111174, 2020.
Guevara, M., Lopez-Aparicio, S., Cuvelier, C., Tarrason, L., Clappier, A., and Thunis, P.: A benchmarking tool to screen and compare bottom-up and top-down atmospheric emission inventories, Air Qual. Atmos. Hlth., 10, 627–642, https://doi.org/10.1007/s11869-016-0456-6, 2017.
Guevara, M., Jorba, O., Tena, C., Denier van der Gon, H., Kuenen, J., Elguindi, N., Darras, S., Granier, C., and Pérez García-Pando, C.: Copernicus Atmosphere Monitoring Service TEMPOral profiles (CAMS-TEMPO): global and European emission temporal profile maps for atmospheric chemistry modelling, Earth Syst. Sci. Data, 13, 367–404, https://doi.org/10.5194/essd-13-367-2021, 2021.
Hassan, S. K., El-Abssawy, A. A., AbdEl-Maksoud, A. S., Abdou, M. H., and Khoder, M. I.: Seasonal Behaviours and Weekdays/Weekends Differences in Elemental Composition of Atmospheric Aerosols in Cairo, Egypt, Aerosol Air Qual. Res., 13, 1552–1562, https://doi.org/10.4209/aaqr.2012.12.0349, 2013.
Hoyos, C. D., Herrera-Mejía, L., Roldán-Henao, N., and Isaza, A.: Effects of fireworks on particulate matter concentration in a narrow valley: the case of the Medellín metropolitan area, Environ. Monit. Assess., 192, 6, https://doi.org/10.1007/s10661-019-7838-9, 2020.
Hua, J., Zhang, Y., de Foy, B., Mei, X., Shang, J., and Feng, C.: Competing PM2.5 and NO2 holiday effects in the Beijing area vary locally due to differences in residential coal burning and traffic patterns, Sci. Total Environ., 750, 141575, https://doi.org/10.1016/j.scitotenv.2020.141575, 2021.
Huang, X., Ding, A., Gao, J., Zheng, B., Zhou, D., Qi, X., Tang, R., Wang, J., Ren, C., Nie, W., Chi, X., Xu, Z., Chen, L., Li, Y., Che, F., Pang, N., Wang, H., Tong, D., Qin, W., Cheng, W., Liu, W., Fu, Q., Liu, B., Chai, F., Davis, S. J., Zhang, Q., and He, K.: Enhanced secondary pollution offset reduction of primary emissions during COVID-19 lockdown in China, Natl. Sci. Rev., 8, 137, https://doi.org/10.1093/nsr/nwaa137, 2020.
Iriti, M., Piscitelli, P., Missoni, E., and Miani, A.: Air Pollution and Health: The Need for a Medical Reading of Environmental Monitoring Data, Int. J. Env. Res. Pub. He., 17, 2174, https://doi.org/10.3390/ijerph17072174, 2020.
Jacob, D. J. and Winner, D. A.: Effect of climate change on air quality, Atmos. Environ., 43, 51–63, https://doi.org/10.1016/j.atmosenv.2008.09.051, 2009.
Jhun, I., Coull, B. A., Schwartz, J., Hubbell, B., and Koutrakis, P.: The impact of weather changes on air quality and health in the United States in 1994–2012, Environ. Res. Lett., 10, 084009, https://doi.org/10.1088/1748-9326/10/8/084009, 2015.
Jiang, Q., Sun, Y. L., Wang, Z., and Yin, Y.: Aerosol composition and sources during the Chinese Spring Festival: fireworks, secondary aerosol, and holiday effects, Atmos. Chem. Phys., 15, 6023–6034, https://doi.org/10.5194/acp-15-6023-2015, 2015.
Joly, M. and Peuch, V.-H.: Objective classification of air quality monitoring sites over Europe, Atmos. Environ., 47, 111–123, https://doi.org/10.1016/j.atmosenv.2011.11.025, 2012.
Karl, M., Bieser, J., Geyer, B., Matthias, V., Jalkanen, J.-P., Johansson, L., and Fridell, E.: Impact of a nitrogen emission control area (NECA) on the future air quality and nitrogen deposition to seawater in the Baltic Sea region, Atmos. Chem. Phys., 19, 1721–1752, https://doi.org/10.5194/acp-19-1721-2019, 2019.
Khalil, M. A. K., Butenhoff, C. L., Porter, W. C., Almazroui, M., Alkhalaf, A., and Al-Sahafi, M. S.: Air quality in Yanbu, Saudi Arabia, J. Air Waste Ma., 66, 341–355, https://doi.org/10.1080/10962247.2015.1129999, 2016.
Khezri, B., Chan, Y. Y., Tiong, L. Y. D., and Webster, R. D.: Annual air pollution caused by the Hungry Ghost Festival, Environ. Sci.-Proc. Imp., 17, 1578–1586, https://doi.org/10.1039/C5EM00312A, 2015.
Kouznetsov, R. and Sofiev, M.: A methodology for evaluation of vertical dispersion and dry deposition of atmospheric aerosols, J. Geophys. Res., 117, D01202, https://doi.org/10.1029/2011JD016366, 2012.
Kouznetsov, R., Sofiev, M., Vira, J., and Stiller, G.: Simulating age of air and the distribution of SF6 in the stratosphere with the SILAM model, Atmos. Chem. Phys., 20, 5837–5859, https://doi.org/10.5194/acp-20-5837-2020, 2020.
Kukkonen, J., López-Aparicio, S., Segersson, D., Geels, C., Kangas, L., Kauhaniemi, M., Maragkidou, A., Jensen, A., Assmuth, T., Karppinen, A., Sofiev, M., Hellén, H., Riikonen, K., Nikmo, J., Kousa, A., Niemi, J. V., Karvosenoja, N., Santos, G. S., Sundvor, I., Im, U., Christensen, J. H., Nielsen, O.-K., Plejdrup, M. S., Nøjgaard, J. K., Omstedt, G., Andersson, C., Forsberg, B., and Brandt, J.: The influence of residential wood combustion on the concentrations of PM2.5 in four Nordic cities, Atmos. Chem. Phys., 20, 4333–4365, https://doi.org/10.5194/acp-20-4333-2020, 2020.
Lai, Y. and Brimblecombe, P.: Regulatory effects on particulate pollution in the early hours of Chinese New Year, 2015, Environ. Monit. Assess., 189, 467, https://doi.org/10.1007/s10661-017-6167-0, 2017.
Lehtomäki, H., Korhonen, A., Asikainen, A., Karvosenoja, N., Kupiainen, K., Paunu, V.-V., Savolahti, M., Sofiev, M., Palamarchuk, Y., Karppinen, A., Kukkonen, J., and Hänninen, O.: Health impacts of ambient air pollution in Finland, Int. J. Env. Res. Pub. He., 15, 736, https://doi.org/10.3390/ijerph15040736, 2018.
Lonati, G., Giugliano, M., and Cernuschi, S.: The role of traffic emissions from weekends' and weekdays' fine PM data in Milan, Atmos. Environ., 40, 5998–6011, https://doi.org/10.1016/j.atmosenv.2005.12.033, 2006.
McGraw, J., Haas, P., Young, L., and Evens, A.: Greenhouse gas emissions in Chicago: Emissions inventories and reduction strategies for Chicago and its metropolitan region, J. Great Lakes Res., 36, 106–114, https://doi.org/10.1016/j.jglr.2009.11.010, 2010.
Menut, L., Goussebaile, A., Bessagnet, B., Khvorostiyanov, D., and Ung, A.: Impact of realistic hourly emissions profiles on air pollutants concentrations modelled with CHIMERE, Atmos. Environ., 49, 233–244, https://doi.org/10.1016/j.atmosenv.2011.11.057, 2012.
Menut, L., Bessagnet, B., Siour, G., Mailler, S., Pennel, R., and Cholakian, A.: Impact of lockdown measures to combat Covid-19 on air quality over western Europe, Sci. Total Environ., 741, 140426–140426, https://doi.org/10.1016/j.scitotenv.2020.140426, 2020.
Mues, A., Kuenen, J., Hendriks, C., Manders, A., Segers, A., Scholz, Y., Hueglin, C., Builtjes, P., and Schaap, M.: Sensitivity of air pollution simulations with LOTOS-EUROS to the temporal distribution of anthropogenic emissions, Atmos. Chem. Phys., 14, 939–955, https://doi.org/10.5194/acp-14-939-2014, 2014.
Nodehi, R. N., Hashemi, S. Y., and Azimi, F.: The effect of national events and holidays on ambient PM2.5 concentrations, Journal of Air Pollution and Health, 3, 109–118, 2018.
Parra, R. and Franco, E.: Identifying the Ozone Weekend Effect in the air quality of the northern Andean region of Ecuador, WIT Trans. Ecol. Environ., 207, 169–180, 2016.
Petersen, A. K., Brasseur, G. P., Bouarar, I., Flemming, J., Gauss, M., Jiang, F., Kouznetsov, R., Kranenburg, R., Mijling, B., Peuch, V.-H., Pommier, M., Segers, A., Sofiev, M., Timmermans, R., van der A, R., Walters, S., Xie, Y., Xu, J., and Zhou, G.: Ensemble forecasts of air quality in eastern China – Part 2: Evaluation of the MarcoPolo–Panda prediction system, version 1, Geosci. Model Dev., 12, 1241–1266, https://doi.org/10.5194/gmd-12-1241-2019, 2019.
Poupkou, A., Giannaros, T., Markakis, K., Kioutsioukis, I., Curci, G., Melas, D., and Zerefos, C.: A model for European Biogenic Volatile Organic Compound emissions: Software development and first validation, Environ. Modell. Softw., 25, 1845–1856, https://doi.org/10.1016/j.envsoft.2010.05.004, 2010.
Retama, A., Neria-Hernández, A., Jaimes-Palomera, M., Rivera-Hernández, O., Sánchez-Rodríguez, M., López-Medina, A., and Velasco, E.: Fireworks: A major source of inorganic and organic aerosols during Christmas and New Year in Mexico city, Atmospheric Environment: X, 2, 100013, https://doi.org/10.1016/j.aeaoa.2019.100013, 2019.
rkouznetsov: fmidev/silam-model: Release to get DOI, v5_7pub_1, Zenodo [code], https://doi.org/10.5281/zenodo.5713863, 2021 (data available at: https://github.com/fmidev/silam-model, last access: 22 November 2021).
Rozbicka, K. and Rozbicki, T.: The “Weekend Effect” on Ozone in the Warsaw Conurbation, Poland, Pol. J. Environ. Stud., 25, 1675–1683, https://doi.org/10.15244/pjoes/61815, 2016.
Sharma, S., Zhang, M., Anshika, Gao, J., Zhang, H., and Kota, S. H.: Effect of restricted emissions during COVID-19 on air quality in India, Sci. Total Environ., 728, 138878, https://doi.org/10.1016/j.scitotenv.2020.138878, 2020.
Shi, C., Wu, H., and Chiu, Y.-H.: The Dynamic Analysis of the Pollutant Emissions Impact on Human Health in China Industries Based on the Meta-Frontier DEA, Healthcare, 8, 5, https://doi.org/10.3390/healthcare8010005, 2019.
Singh, A., Pant, P., and Pope, F. D.: Air quality during and after festivals: Aerosol concentrations, composition and health effects, Atmos. Res., 227, 220–232, https://doi.org/10.1016/j.atmosres.2019.05.012, 2019.
Singh, K. P., Gupta, S., and Rai, P.: Identifying pollution sources and predicting urban air quality using ensemble learning methods, Atmos. Environ., 80, 426–437, https://doi.org/10.1016/j.atmosenv.2013.08.023, 2013.
Sofiev, M.: A model for the evaluation of long-term airborne pollution transport at regional and continental scales, Atmos. Environ., 34, 2481–2493, 2000.
Sofiev, M.: Extended resistance analogy for construction of the vertical diffusion scheme for dispersion models, J. Geophys. Res., 107, ACH 10-1–ACH 10-8, https://doi.org/10.1029/2001JD001233, 2002.
Sofiev, M.: On possibilities of assimilation of near-real-time pollen data by atmospheric composition models, Aerobiologia 35, 523–531, https://doi.org/10.1007/s10453-019-09583-1, 2019.
Sofiev, M., Siljamo, P., Valkama, I., Ilvonen, M., and Kukkonen, J.: A dispersion modelling system SILAM and its evaluation against ETEX data, Atmos. Environ., 40, 674–685, https://doi.org/10.1016/j.atmosenv.2005.09.069, 2006.
Sofiev, M., Genikhovich, E., Keronen, P., and Vesala, T.: Diagnosing the Surface Layer Parameters for Dispersion Models within the Meteorological-to-Dispersion Modeling Interface, J. Appl. Meteorol. Clim., 49, 221–233, https://doi.org/10.1175/2009JAMC2210.1, 2010.
Sofiev, M., Soares, J., Prank, M., de Leeuw, G., and Kukkonen, J.: A regional-to-global model of emission and transport of sea salt particles in the atmosphere, J. Geophys. Res., 116, D21302, https://doi.org/10.1029/2010JD014713, 2011.
Sofiev, M., Vira, J., Kouznetsov, R., Prank, M., Soares, J., and Genikhovich, E.: Construction of the SILAM Eulerian atmospheric dispersion model based on the advection algorithm of Michael Galperin, Geosci. Model Dev., 8, 3497–3522, https://doi.org/10.5194/gmd-8-3497-2015, 2015a.
Sofiev, M., Berger, U., Prank, M., Vira, J., Arteta, J., Belmonte, J., Bergmann, K.-C., Chéroux, F., Elbern, H., Friese, E., Galan, C., Gehrig, R., Khvorostyanov, D., Kranenburg, R., Kumar, U., Marécal, V., Meleux, F., Menut, L., Pessi, A.-M., Robertson, L., Ritenberga, O., Rodinkova, V., Saarto, A., Segers, A., Severova, E., Sauliene, I., Siljamo, P., Steensen, B. M., Teinemaa, E., Thibaudon, M., and Peuch, V.-H.: MACC regional multi-model ensemble simulations of birch pollen dispersion in Europe, Atmos. Chem. Phys., 15, 8115–8130, https://doi.org/10.5194/acp-15-8115-2015, 2015b.
Sofiev, M., Kouznetsov, R., Hänninen, R., and Sofieva, V. F.: Technical note: Intermittent reduction of the stratospheric ozone over northern Europe caused by a storm in the Atlantic Ocean, Atmos. Chem. Phys., 20, 1839–1847, https://doi.org/10.5194/acp-20-1839-2020, 2020.
Vira, J. and Sofiev, M.: On variational data assimilation for estimating the model initial conditions and emission fluxes for short-term forecasting of SOx concentrations, Atmos. Environ., 46, 318–328, https://doi.org/10.1016/j.atmosenv.2011.09.066, 2012.
Wang, Q. and Su, M.: A preliminary assessment of the impact of COVID-19 on environment – A case study of China, Sci. Total Environ., 728, 138915, https://doi.org/10.1016/j.scitotenv.2020.138915, 2020.
Wesely, M. L.: Parameterization of surface resistances to gaseous dry deposition in regional-scale numerical models, Atmos. Environ., 23, 1293–1304, 1989.
Xian, P., Reid, J. S., Hyer, E. J., Sampson, C. R., Rubin, J. I., Ades, M., Asencio, N., Basart, S., Benedetti, A., Bhattacharjee, P. S., Brooks, M. E., Colarco, P. R., da Silva, A. M., Eck, T. F., Guth, J., Jorba, O., Kouznetsov, R., Kipling, Z., Sofiev, M., Perez Garcia-Pando, C., Pradhan, Y., Tanaka, T., Wang, J., Westphal, D. L., Yumimoto, K., and Zhang, J.: Current state of the global operational aerosol multi-model ensemble: An update from the International Cooperative for Aerosol Prediction (ICAP), Q. J. Roy. Meteor. Soc., 145, 176–209, https://doi.org/10.1002/qj.3497, 2019.
Xu, Z., Huang, X., Nie, W., Chi, X., Xu, Z., Zheng, L., Sun, P., and Ding, A.: Influence of synoptic condition and holiday effects on VOCs and ozone production in the Yangtze River Delta region, China, Atmos. Environ., 168, 112–124, https://doi.org/10.1016/j.atmosenv.2017.08.035, 2017.
Yao, L., Wang, D., Fu, Q., Qiao, L., Wang, H., Li, L., Sun, W., Li, Q., Wang, L., Yang, X., Zhao, Z., Kan, H., Xian, A., Wang, G., Xiao, H., and Chen, J.: The effects of firework regulation on air quality and public health during the Chinese Spring Festival from 2013 to 2017 in a Chinese megacity, Environ. Int., 126, 96–106, https://doi.org/10.1016/j.envint.2019.01.037, 2019.
Yarwood, G., Rao, S., Yocke, M., and Whitten, G. Z.: Updates to the carbon bond chemical mechanism: CB05, Final report to the U.S. Environmental Protection Agency, RT-0400675, 2005.
Ye, C., Chen, R., and Chen, M.: The impacts of Chinese Nian culture on air pollution, J. Clean. Prod., 112, 1740–1745, https://doi.org/10.1016/j.jclepro.2015.04.113, 2016.
Zhao, Y., Qiu, L. P., Xu, R. Y., Xie, F. J., Zhang, Q., Yu, Y. Y., Nielsen, C. P., Qin, H. X., Wang, H. K., Wu, X. C., Li, W. Q., and Zhang, J.: Advantages of a city-scale emission inventory for urban air quality research and policy: the case of Nanjing, a typical industrial city in the Yangtze River Delta, China, Atmos. Chem. Phys., 15, 12623–12644, https://doi.org/10.5194/acp-15-12623-2015, 2015.
Zhou, M., Jiang, W., Gao, W., Zhou, B., and Liao, X.: A high spatiotemporal resolution anthropogenic VOC emission inventory for Qingdao City in 2016 and its ozone formation potential analysis, Process Saf. Environ., 139, 147–160, https://doi.org/10.1016/j.psep.2020.03.040, 2020.
Zou, Y., Charlesworth, E., Yin, C. Q., Yan, X. L., Deng, X. J., and Li, F.: The weekday/weekend ozone differences induced by the emissions change during summer and autumn in Guangzhou, China, Atmos. Environ., 199, 114–126, https://doi.org/10.1016/j.atmosenv.2018.11.019, 2019.