the Creative Commons Attribution 4.0 License.
the Creative Commons Attribution 4.0 License.
 | 30 Nov 2021
Cosmic-Ray neutron Sensor PYthon tool (crspy 1.2.1): an open-source tool for the processing of cosmic-ray neutron and soil moisture data
Miguel Angel Rico-Ramirez
Sharon Desilets
Darin Desilets
Rafael Rosolem
Understanding soil moisture dynamics at the sub-kilometre scale is increasingly important, especially with the continuous development of hyper-resolution land surface and hydrological models. Cosmic-ray neutron sensors (CRNSs) are able to provide estimates of soil moisture at this elusive scale, and networks of these sensors have been expanding across the world over the previous decade. However, each network currently implements its own protocol when processing raw data into soil moisture estimates. As a consequence, this lack of a harmonised global data set can ultimately lead to limitations in the global assessment of the CRNS technology from multiple networks. Here, we present crspy, an open-source Python tool that is designed to facilitate the processing of raw CRNS data into soil moisture estimates in an easy and harmonised way. We outline the basic structure of this tool, discussing the correction methods used as well as the metadata that crspy can create about each site. Metadata can add value to global-scale studies of field-scale soil moisture estimates by providing additional routes to understanding catchment similarities and differences. We demonstrate that current differences in processing methodologies can lead to misinterpretations when comparing sites from different networks and that having a tool to provide a harmonised data set can help to mitigate these issues. By being open source, crspy can also serve as a development and testing tool for new understanding of the CRNS technology as well as being used as a teaching tool for the community.
- Article
(3021 KB) - Full-text XML
-
Supplement
(153 KB) - BibTeX
- EndNote


Soil moisture exerts a large influence on hydrological (Van Loon et al., 2015), biogeochemical (Schlesinger et al., 2015), and climatic processes (Dobriyal et al., 2012; Koster et al., 2004); agricultural systems (Fontanet et al., 2018; Dutta et al., 2014); landslide modelling (Zhuo et al., 2019); and Earth system sciences (Fang and Lakshmi, 2014; Bonan, 2008). Its accurate measurement is important to advance our understanding of these areas of research. In situ point-scale soil moisture estimates, such as time domain reflectometry (TDR), can provide higher temporal resolution; however, spatial resolution is still limited, on the order of centimetres. Soil heterogeneity can lead to uncertainties when upscaling to the field scale (Western et al., 1999), which would be required for regional- or larger-scale hydrological modelling. Alternatively, satellite remote sensing products such as Soil Moisture Active Passive (SMAP) and Soil Moisture and Ocean Salinity (SMOS) can provide global estimates of soil moisture at a coarser spatial (∼40 km resolution) and temporal (∼3 d) scale, and at much shallower depths (∼5 cm) (Entekhabi et al., 2010; Kerr et al., 2001). It is accepted that we will require a finer spatial resolution than currently achievable through remote sensing estimates for tasks such as increasing our understanding of sub-kilometre land–atmosphere interactions or for the improvements of farming practices (such as through the process of irrigation scheduling); thus, there is a need for additional processing of ancillary data for the downscaling of these products (Portal et al., 2020; Alemohammad et al., 2018). In addition, the recent push for hyper-resolution global modelling means that we require measurements at a finer spatial resolution, on the order of sub-kilometre scales (Wood et al., 2011). Bierkens et al. (2015) discussed the implications of moving from a more standard resolution ∼50 km model to a hyper-resolution model at the sub-kilometre scale. The study further discussed the need to move from sub-grid paradigms, which represent a conceptualised form of Earth system dynamics from within the standard 50 km resolution model, to explicit dynamics of Earth system processes at scales <50 km. This requires a greater understanding of environmental functions at sub-kilometre spatial scales, which in turn requires accurate measurements of environment states at the same scales.
Cosmic-ray neutron sensors (CRNSs) are a relatively new technology that allows estimates of soil moisture at the field scale (∼600 m diameter) at an hourly temporal resolution. Zreda et al. (2008) demonstrated that fast neutrons are mainly moderated by hydrogen atoms, which allows us to infer changes in water content in the soil profile. A tube attached to the sensor, filled with a gas such as helium or boron trifluoride, is able to detect fast neutrons that pass through it by inducing a voltage difference. Desilets et al. (2010) introduced an equation used to convert neutron counting rates into gravimetric soil moisture which has been further improved upon by Dong et al. (2014) and Hawdon et al. (2014) (Eq. 1). The original equation along with the above-mentioned advancements provides us with estimates of volumetric soil moisture:
where θvol is volumetric soil moisture (cm3 cm−3); a0, a1, and a2 are coefficients obtained from neutron particle physics modelling (Zreda et al., 2008; Desilets et al., 2010) and are assumed to be constants; LW is the lattice (chemically bounded mineral) water (g g−1); WSOM is the water equivalent of soil organic carbon (gram of water per gram of soil); ρbd is the bulk density of the dry soil (g cm−3); ρw is the density of water defined as 1 g cm−3; Nraw is the measured raw, uncorrected, neutron count identified over the given integration time, usually set to 1 h; fp, fi, fh, and fv represent correction factors for air pressure, incoming neutron intensity, atmospheric water vapour, and above-ground biomass respectively that are applied to Nraw to account for additional influences on the neutron signal other than soil moisture; and N0 is the theoretical neutron count found in absolutely dry conditions (i.e. the maximum number of neutrons that can be found at the site without the direct presence of hydrogen). This last term is unique to each site and is found through the calibration process, explained in detail in Sect. 2.2.
The detection of background neutrons in the atmosphere, as a method to infer estimates of field-scale soil moisture, was first described in Zreda et al. (2008). In that study, the authors demonstrated that neutron intensity above the surface was inversely correlated with the amount of moisture in the soil below. This was developed further in Desilets et al. (2010), where the initial form of Eq. (1) was first described and applications of this technology continued to be explored within the Earth sciences community (Desilets, 2011; Franz et al., 2012; Rivera Villarreyes et al., 2011). A large-scale network of these sensors was subsequently deployed across the USA, leading to the Cosmic-Ray Soil Moisture Observing System (COSMOS) (Zreda et al., 2012).
After the establishment of the first national-scale network in the USA (Zreda et al., 2012), other countries such as Australia (Hawdon et al., 2014; McJannet et al., 2021), Germany (Zacharias et al., 2011; Bogena, 2016), and the UK (Evans et al., 2016; Cooper et al., 2021) established their individual national networks, as well as additional sensors located in smaller networks or individual sites. Sensors from these networks have, in some cases, been running for up to 10 years and can provide potentially valuable information for the understanding of soil hydrology. As these networks have grown so has the literature surrounding best practices for the calibration and correction of the sensor signals, allowing us to have a lower uncertainty in CRNS soil moisture estimates (Franz et al., 2012; Rosolem et al., 2013; Hawdon et al., 2014; Baatz et al., 2015; Schrön et al., 2017). As a consequence of improvements to the signal correction and sensor calibration, a divergence in methods is noticeable between different networks. Each network inevitably implements its own protocol when correcting the neutron signal to give soil moisture estimates, leading to a less harmonised data set among networks. This is in part due to the difficulties that would be encountered in quickly changing data processing pipelines within already established databases. The benefit of such structures is that live data are available to stakeholders through online portals. Unfortunately, the interdependencies of a database mean that it does not lend itself to quick changes; thus, a post-processing method could alleviate some of these issues.
This lack of a harmonised global data set can ultimately lead to limitations in the global assessment of this technology from multiple CRNS networks. Discrepancies in processing methodology can leave questions around the information obtained and the uncertainty propagated from the analysis and comparison of sensors in different networks, such as whether soil moisture signals can be attributed solely to environmental differences or processing differences. By not necessarily following all of the recommended correction steps, the estimated soil moisture products from these sensors or even networks can be seen as suboptimal, potentially undermining their true value. An example of the impact of evaluating with sub-processed cosmic ray soil moisture data is found in Dirmeyer et al. (2016). CRNS data from the COSMOS network were compared with both alternative in situ soil moisture instruments and land surface models. The CRNS data used in this study did not apply the atmospheric water vapour correction at the time and so can be considered less accurate than they otherwise should be. There is a consensus to follow certain steps and guidelines which are not uniformly applied across all networks. Known corrections to account for changes in atmospheric pressure, neutron intensity, atmospheric water vapour, and aboveground biomass are applied differently or, on occasion, not at all on some networks, which could lead to different estimates of soil moisture (Zreda et al., 2012; Hawdon et al., 2014; Evans et al., 2016). For example, Rosolem et al. (2013) demonstrated the influence on the neutron signal that occurs from changes in atmospheric water vapour over time. When comparing processed soil moisture estimates with and without this additional signal correction, they demonstrated a difference of up to 0.1 cm3 cm−3 at a site at Park Falls, USA. Additionally, Hawdon et al. (2014) demonstrated the different approaches available for correcting neutron counts for incoming cosmic-ray intensity and showed that there is a noticeable difference in neutron counts and ultimately soil moisture depending on the chosen method. Schrön et al. (2017) provided an improved approach to CRNS calibration, demonstrating that their revised approach improves the accuracy of soil moisture estimates. Using UK sites as an example, Schrön et al. (2017) found that the root-mean-square error (RMSE) of soil moisture estimates from the CRNS was reduced from 5.3 % vol, using the conventional calibration approach, to 1.4 % vol, using the revised calibration approach. Improvements in accuracy were identified at all of the sites that they analysed. Although this revised approach is being adopted in more recent studies (Cooper et al., 2021), this is not always the case (such as the original sites in the COSMOS network) and can mean that sites in different networks have been calibrated using different methods.
In order to mitigate this ongoing issue of lack of harmonisation in the soil moisture estimates from the CRNS technology, we present here an open-source Python tool to process raw CRNS data into soil moisture estimates, using the most current methods identified in the literature. It is designed to allow a user to apply consistent data processing methods across sensors that may be located in different networks. Section 2 will describe the structure of the tool along with the relevant correction and calibration methods. Section 2 will also describe the site metadata creation process, which is an additional aspect to crspy that is built to facilitate the data analysis of many sites. Section 3 will discuss the implications of differing processing methodologies on soil moisture estimates, as well as the benefits of creating detailed metadata for post-processing analysis.
The Cosmic-Ray neutron Sensor PYthon tool (crspy, pronounced “crispy”) is a tool written in Python3 that has been developed to facilitate the processing of the global networks of CRNS data in a uniform and harmonised way. It is available through an open-source repository and can be installed into a user's Python environment. The tool is designed to allow the easy implementation of the most up-to-date correction factors and calibration processes to any CRNS site globally, ultimately allowing for any user to access a harmonised data set. Although it is designed for multiple sites from varied networks, crspy is versatile enough to process a single site as well. It is being provided to help facilitate research in the CRNS community and is not intended to state whether one networks processing methods are superior to another. It is the authors' opinion, however, that it is important for the community to consider the creation of a best practice, as this will allow for the comparison of sensor data around the world in the future. In addition, crspy is structurally designed to accommodate new corrections and processing steps that may become available in the future in an easy manner. By being open source, crspy can also serve as a development and testing tool for any new understanding of the CRNS technology, as well as a teaching tool for the community.
Figure 1 is a visual representation of the processes within crspy that
convert raw sensor data into corrected soil moisture estimates. Due to the
varied nature of input data, such as when different networks label data
differently, it is first necessary for a user to correctly format input data
following crspy's naming convention (see Table A1 in Appendix A).
Additionally, to organise the various input and output data sets, a specific
working directory folder structure is necessary. This allows crspy to
automatically handle the numerous sources of data. After installing the
package, a user can build this folder structure easily with the
crspy.initial(wd) function, where wd is a string representing the working directory
location.
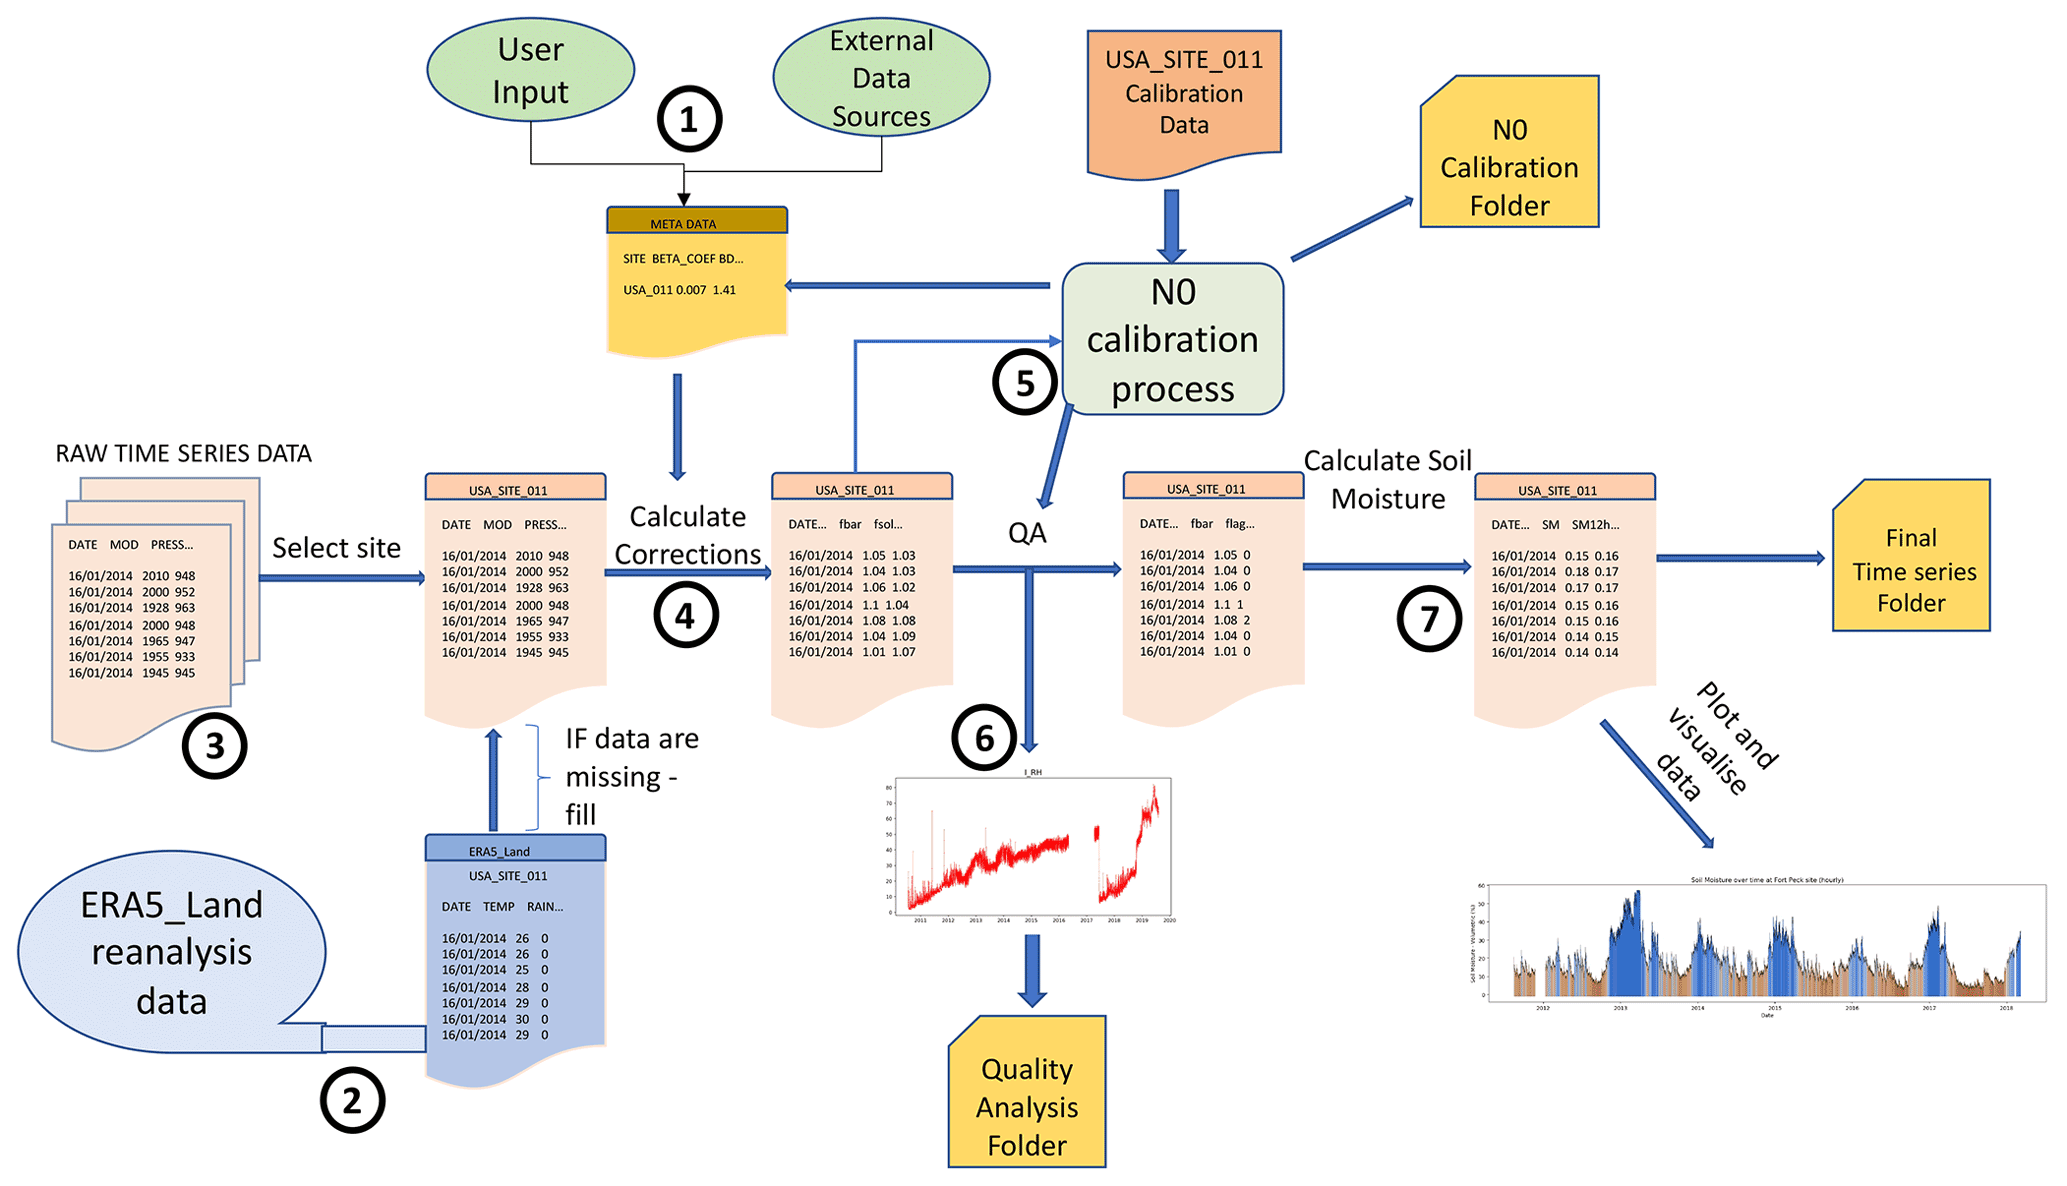
Figure 1The structure of crspy, demonstrating all of the modules that are used in creating soil moisture estimates. Number 1 represents the metadata table, which is a collection of site descriptors, e.g. soil texture and site elevation (see Sect. 2.4). Numbers 2, 3, and 4 correspond to gap filling with ERA5-Land data, data tidying, and the computation of correction factors, respectively (see Sect. 2.1). Number 5 represents the calibration process, if this option is selected (see Sect. 2.2). Number 6 highlights the quality assessment steps undertaken (see Sect. 2.3). Finally, number 7 represents the step where soil moisture estimates are calculated from the neutron counting rates (refer to Eq. 1).
2.1 Data processing and correction
To obtain soil moisture estimates, we need to apply Eq. (1) at each time
step in the data. The values will be obtained from time-varying sensor data,
external data products, static site-specific values, and static values that
are not site-specific. The coefficients are
constants with values of 0.0808, 0.372, and 0.115 respectively, as defined in
Desilets et al. (2010). These values are fitting constants that describe
the shape of the relationship between neutron counts and soil moisture,
obtained from neutron particle physics modelling, and are the same for all
sites. These values are stored in the config.ini file, which stores constant
values for crspy.
2.1.1 Site-specific soil properties
The site-specific soil parameters described in Eq. (1) are LW, WSOM (obtained from soil organic carbon), and ρbd. Due to the open data policies of many of the CRNS networks, these data are usually available online (see the “Data availability” section). These values should be defined prior to running the main crspy function and are stored and read from the metadata file.
The LW parameter corresponds to the lattice water (%), which represents the hydrogen contained in the mineral structures of the soil (Hawdon et al., 2014). As fast neutrons are mitigated by hydrogen atoms, regardless of their source, this will have an overall impact on the neutron count rate. This value is usually obtained through the analysis of soil samples taken from the footprint of the site sensor (Franz et al., 2012). The WSOM parameter represents the water equivalent of soil organic matter (g cm−3). Soil organic carbon (SOC) is obtained through the analysis of soil samples and represents the total organic carbon in the soil at the site. Hawdon et al. (2014) discuss the need to convert this value into a water equivalent and provided a method for this (Eq. 2). This is completed on the assumption that organic matter in the soil is cellulose and means that proportionally the water equivalent of this can be found as follows:
The ρbd parameter represents the dry-soil bulk density (g cm−3) and is a site-specific static value. It is obtained through the analysis of soil samples and is used in the conversion of gravimetric soil moisture to volumetric soil moisture values. If dry-soil bulk density data are unavailable for a site, crspy includes the option to obtain this value from the global data source SoilGridsv2 (see Sect. 2.4). In the case of missing data, crspy takes advantages of built-in routines to fill out the information. In that case, if ρbd or SOC (used to calculate WSOM) are missing, crspy will use the estimates collected from SoilGridsv2, which are assembled in the metadata process. If LW is unavailable, a value of zero can be input into the metadata table by the user. Past studies have also demonstrated techniques to estimate LW using soil clay content, which could be used to provide estimates that can be input to the metadata table (Avery et al., 2016; McJannet et al., 2017). Notice that the other site-specific static value is the N0 number. This number is found through the calibration process, which is described in greater detail in Sect. 2.2.
2.1.2 Time-varying values and correction methods
The remaining values required to obtain θvol are Nraw and fp, fi fh, and fv, which all vary with time. It is ultimately the relationship between Nraw and N0 that gives us the ability to estimate volumetric soil moisture once the additional corrections have been applied. The parameter Nraw is obtained from the sensor data and will usually be representative of the number of neutrons counted over a 1 h time period. This is the measured raw (uncorrected) neutron count; however, we know that there are additional impacts on this count rate that require correction which are represented by the f factors in Eq. (1). Changes in atmospheric pressure impact the neutron counting rate; the fp term corrects for this so that Nraw⋅fp gives the neutron count rate as if it were taken at the reference atmospheric pressure. Changes in incoming cosmic-ray intensity will directly influence neutron count rates, as this is the source of fast neutrons; thus, the fi term will correct this to match a reference date in time. Atmospheric water vapour and above-ground biomass are additional sources of hydrogen, outside of the soil moisture source that we are interested in, and so the fh and fv terms adjust the count rate in consideration of this. These correction methods have been improved upon since the first implementation of this technology, with additional sources of uncertainty identified and equations designed to mitigate their impact.
There are occasional data availability issues observed at some sites. For example, meteorological variables are a necessary part of converting neutron counts to soil moisture estimates because they are needed to account for the numerous impacts on the signal, such as pressure corrections and atmospheric water vapour corrections. On occasion, some of the sites do not measure all of the necessary variables considered to be essential to correct for additional sources on the neutron signal. External relative humidity sensors are essential in correcting for changes in atmospheric water vapour but are not always included in site data. When data are unavailable from in situ site sensors, ERA5-Land (Muñoz Sabater, 2019) data are used to replace missing sensor data. ERA5-Land is a data set, based upon the ERA5 reanalysis data and provided publicly by the European Centre for Medium-Range Weather Forecasts (ECMWF), that combines modelled data with real-world observations, resulting in a gridded, global hourly product at a 9 km resolution. Previous iterations of the ERA reanalysis data sets (such as ERA-Interim) have proven useful for other global networks for the task of gap filling missing data, such as in the FLUXNET community (Vuichard and Papale, 2015). We implement a similar approach to that used by the FLUXNET community in crspy and, consequently, to the global CRNS database, as we envision the potential of a merged database incorporating both flux tower and CRNS soil moisture data in the future. As the two measurement technologies show similar temporal and spatial footprints, their combined use can eventually lead to a better understanding of land–atmosphere interactions at the field scale (e.g. Iwema et al., 2017). It is important to note that although the resolution is spatially coarser when compared with CRNS sites, the ERA5-Land data set was chosen as a source for replacing missing sensors for three main reasons: (1) it covers the lifetime of all of the CRNS sites around the world, which ensures that all historical data can be used for gap filling if necessary; (2) the data set is produced at an hourly resolution, which matches the standard resolution of CRNS sites; (3) it is an open data source, which aligns with our desire to develop a full open-source tool for CRNS data processing.
The ERA5-Land data set includes key variables such as precipitation, temperature and dew point temperature which can be used to correct for influences on the neutron signal, such as the impact of atmospheric water vapour on neutron count rates. Hence, we can use dew point temperature when relative humidity sensors are not available at the site (Rosolem et al., 2013). Our choice also follows previous studies that demonstrated that ERA-Interim tended to perform best when compared with other global reanalysis products (Decker et al., 2012). ERA5, which ERA5-Land is derived from, has benefitted from a decade of research when compared with ERA-Interim and has been shown to be a great improvement (Hersbach et al., 2020).
(i) Atmospheric pressure correction (fp)
Changes in atmospheric pressure can have an impact on neutron counting rates measured by the CRNSs (Zreda et al., 2012; Hawdon et al., 2014). This is attributed to the fact that higher atmospheric pressure reduces neutron counting rates, as there are more particles in the air column that can slow fast neutrons down. In crspy this is corrected with the following equation:
where fp is the pressure correction factor (defined in Eq. 1), β is a coefficient to account for mass attenuation length at the site, p is the atmospheric pressure at the site (hPa), and p0 is a reference atmospheric pressure (hPa) for the site, commonly taken as the mean pressure for the site's elevation. The β coefficient and the reference atmospheric pressure value are calculated for each location as a function of the latitude, elevation, and cut-off rigidity, at the site as described in Desilets (2021).
(ii) Incoming high-energy neutron intensity (fi)
It is important to correct for incoming neutron intensity, as this will have a direct impact on neutron counting rates. Changes in the incoming cosmic-ray intensity will affect the number of fast neutrons in the atmosphere, as increased cosmic-ray intensity will lead to an increased counting rate created through the cascade of reactions (Desilets et al., 2006). We use data from the Neutron Monitor Database (NMDB; available online), which comprises a collection of neutron monitoring sites from around the world. The NMDB provides neutron counting rates at an hourly resolution from monitoring stations around the world, and its data are considered the official distribution from each site principal investigator. The correction method currently varies across networks. For example, COSMOS (USA) originally corrected the data by comparing neutron intensity to a predefined reference date, which, in that case, was to be 1 May 2011. The Jungfraujoch neutron monitoring station in Switzerland was used as a reference site. The calculation for the incoming neutron intensity correction factor is as follows:
where Im is the incoming cosmic-ray intensity at the sensor measurement time, I0 is incoming neutron intensity at the decided reference date, and is used here to define this particular incoming cosmic-ray intensity correction factor (in order to avoid confusion with fi from Eq. 1).
The default approach in crspy, however, is to use the approach outlined in Hawdon et al. (2014), where the Jungfraujoch monitoring station is used but an additional correction for differences in site cut-off rigidity is applied:
Here, Rccorr is the correction for differences in cut-off rigidity (GV), Rc is the cut-off rigidity at the sensor location, and Rcjung is the cut-off rigidity at the Jungfraujoch monitoring station (which has a value of 4.49 GV). This is applied at each time step to give a final corrected value as follows:
Ultimately, fi is similar to but contains an additional correction to account for the difference in cut-off rigidity between the CRNS site being processed and the Jungfraujoch neutron monitoring reference site.
The Australian CosmOz network employs a different approach that does not
always use the Jungfraujoch as the reference monitoring station. Instead,
this network changes the reference station based on the station that
has the closest cut-off rigidity (GV) to the sensor site from the Neutron
Monitor Database (Hawdon et al., 2014). This option is also available in
crspy when running the main processing function crspy.process_raw_data(fileloc, intentype="nearestGV") by invoking
“intentype” with the “nearestGV” option. This involves identifying the NMDB
site with the nearest cut-off rigidity and applying Eq. (4).
(iii) Atmospheric water vapour (fh)
Hydrogen atoms can slow down fast neutrons, leading to a reduction in the count rate with increasing atmospheric water vapour. This signal needs to be removed to ensure that neutron counting rates are attributed to soil moisture and not moisture in the air. This is corrected at each time step with the following equation (Rosolem et al., 2013):
where fh is the atmospheric water vapour correction factor, and ρv is absolute humidity (g m−3). Some sites do not have external relative humidity sensors that can be used to calculate vapour pressure, which can be used to calculate absolute humidity along with temperature. When this is the case, ERA-5 Land data can be utilised by converting dew point temperature (∘C) to vapour pressure (kPa) (for further information on the steps to obtain absolute humidity from standard meteorological variables, please refer to the appendix section in Rosolem et al., 2013).
Arguably, ERA5-Land data present a spatial mismatch with the cosmic-ray sensor whilst also being a non-direct measurement of environmental variables. The majority of CRNS sites in the USA have not been deployed with a set of standard meteorological measurements, and only a few are co-located with external monitoring stations. Hence, in this case, ERA5-Land data are critical to ensure that neutron counts are appropriately corrected for water vapour variations at these sites. Our preliminary analysis suggests that correcting neutron counts with ERA5-Land data provides superior results compared with not applying the correction at all due to a lack of meteorological data (Fig. 2). In this example, meteorological data at the Atmospheric Radiation Measurement (ARM) site in Oklahoma are available from a nearby flux tower (Biraud et al., 2021). Notice how the processed soil moisture time series corrected with ERA5-Land data closely follows the soil moisture estimates produced when using the in situ meteorological data (Fig. 2a). Neglecting this correction can lead to a significant underestimation of soil moisture, especially during the wet seasons. Figure 2c helps to visualise these impacts by showing the difference between obtained soil moisture with a correction using ERA5-Land data and that with no correction applied, both compared with soil moisture corrected with in situ data.
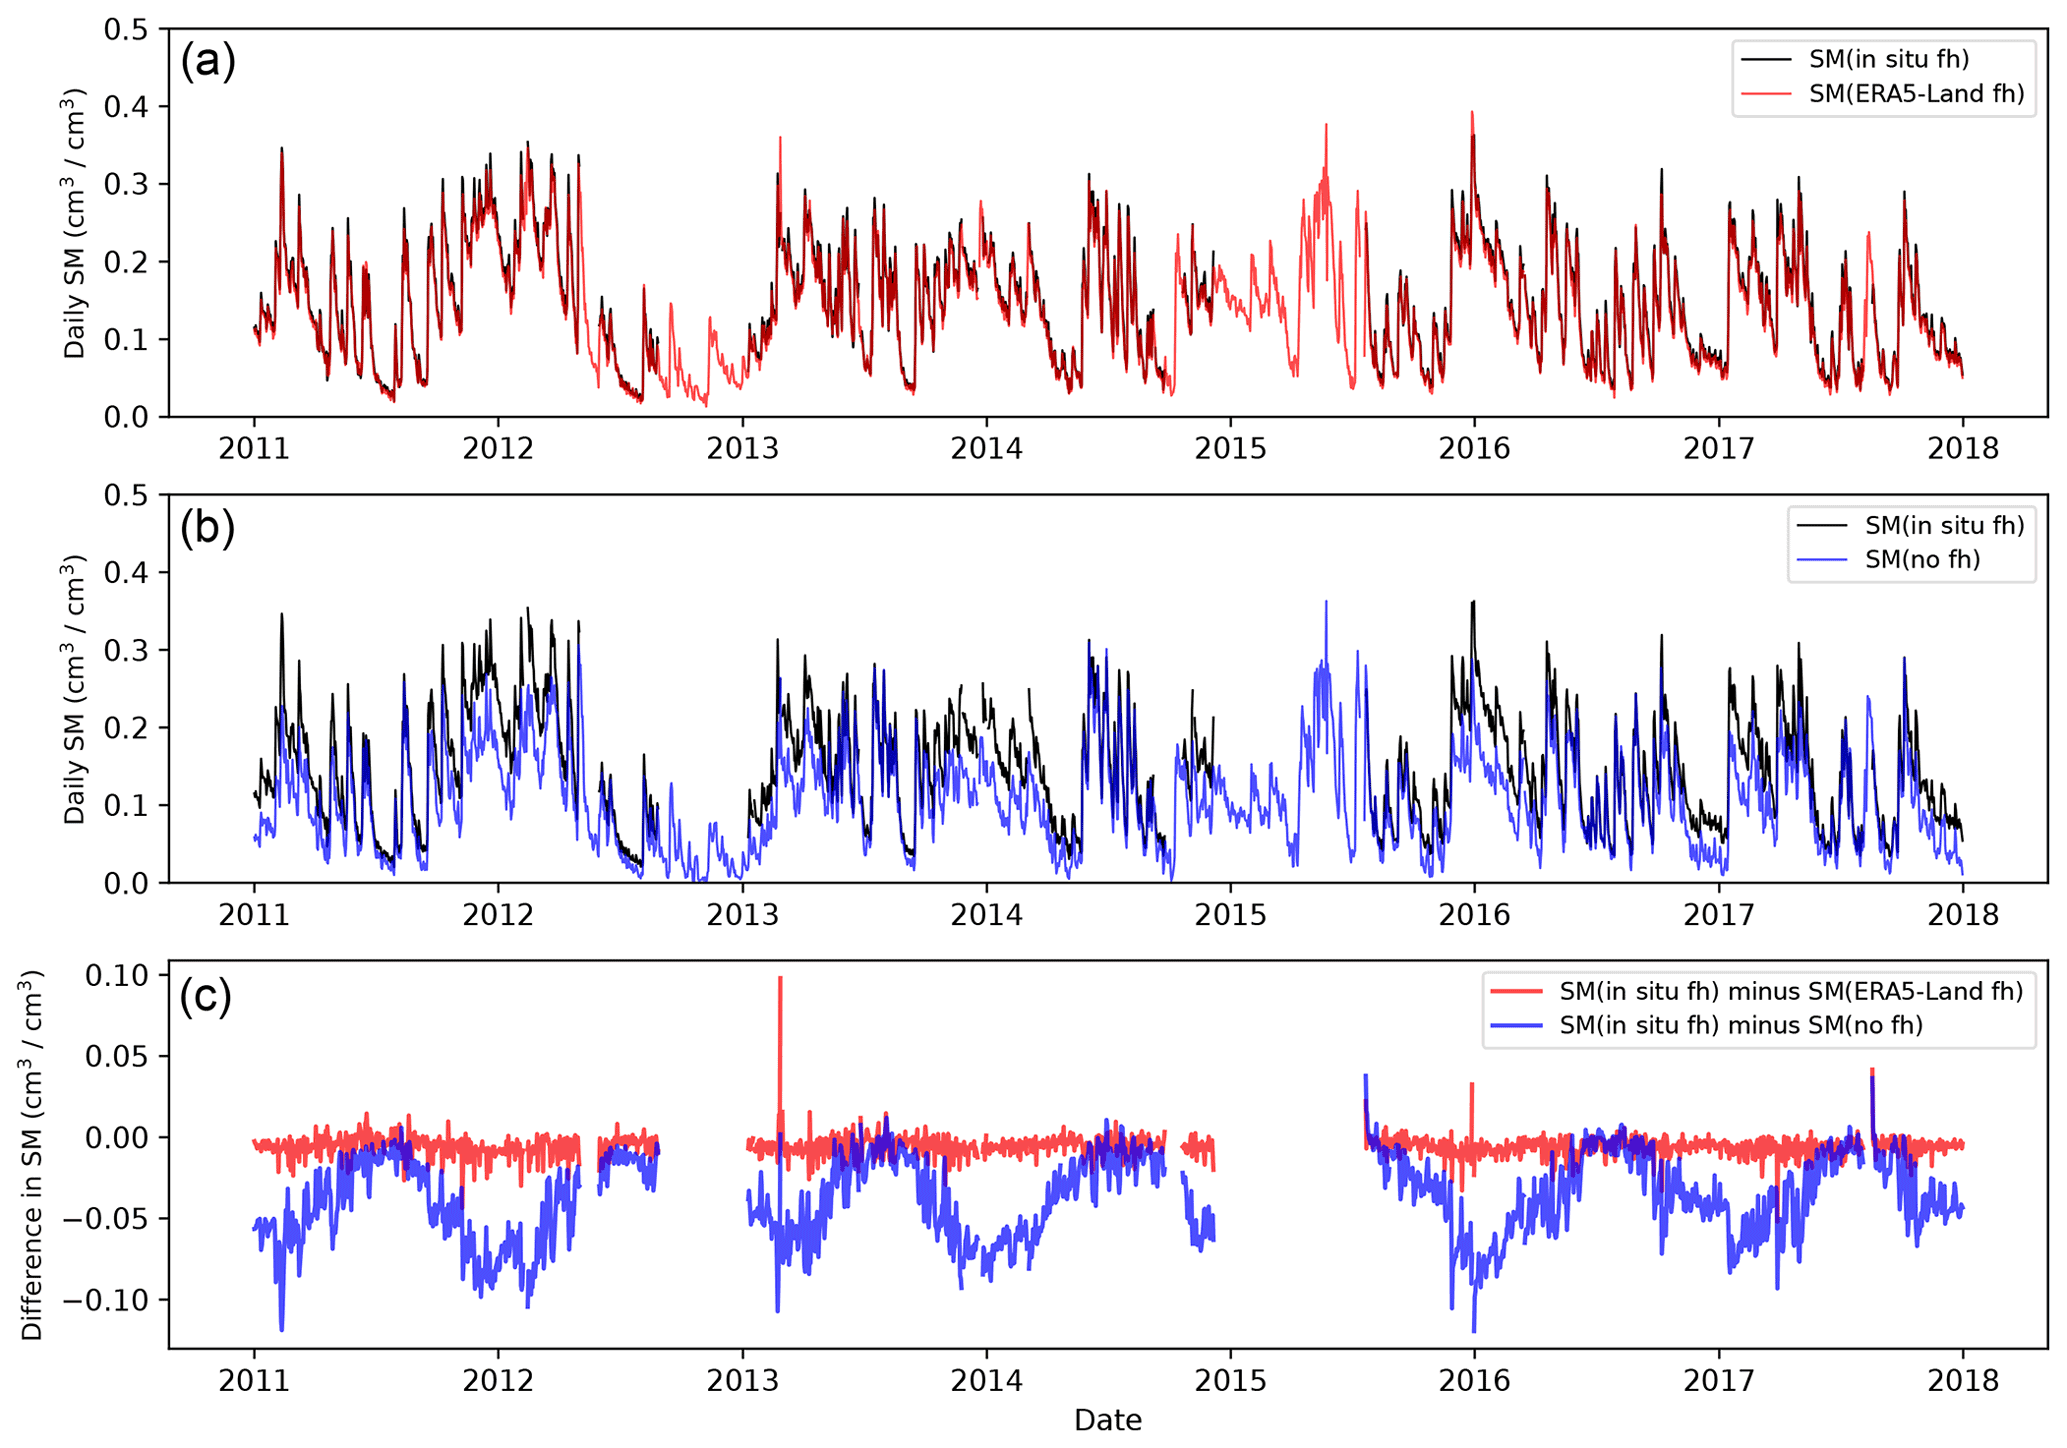
Figure 2The soil moisture (SM) record at the ARM-1 CRNS site in the USA. Panels (a) and (b) show the SM product when corrected using in situ data in black. The red line in panel (a) is the SM product corrected with ERA5-Land data in place of temperature and relative humidity sensors. The blue line in panel (b) shows the SM product when not correcting for atmospheric water vapour (fh). Panel (c) shows the difference between the SM corrected with in situ data and the alternative correction methods.
(iv) Above-ground biomass (AGB) (fv)
Similar to other sources of hydrogen, biomass can also affect the neutron counting signal. There have been numerous attempts to identify the relationship between AGB and neutron count rates (e.g. Rivera Villarreyes et al., 2011; Baatz et al., 2015; Heidbüchel et al., 2016, and Tian et al., 2016). Unlike other sources of hydrogen, AGB is sometimes not available from local samples at each site. In order to reduce the impact of AGB on the measured neutron signal, crspy currently uses a static estimated value for each site from the European Space Agency (ESA) Climate Change Initiative (CCI) global data set and applies a correction method based on the work of Baatz et al. (2015), who found a linear relationship between above-ground biomass and neutron counting rates.
The following equation is used:
where fv is the above-ground biomass correction factor, and agb is the dry above-ground biomass at the site (kg m−2). The ESA CCI database provides above-ground biomass estimates as a global gridded data product at a 100 m resolution (Santoro and Cartus, 2019). As the ESA CCI data currently used are a static value in time, they will not impact the soil moisture estimates, in principle, because the correction is applied on both the Nraw and N0 numbers, thereby mitigating any impact. Nevertheless, we have included this routine in crspy in this form because we anticipate improvements to dynamical above-ground biomass corrections in the future, at which point crspy can be updated to include the latest theory that can be applied across all sites (Franz et al., 2018; Vather et al., 2020; Fersch et al., 2020). Further improvements to be able to dynamically account for biomass changes at all CRNS sites will be important for reliable estimation of soil moisture dynamics, especially when analysing sites with land use changes or cropping cycles.
2.2 Sensor calibration
The above steps give us all of the values in Eq. (1) that are necessary to provide a soil moisture estimate, except for N0. A required step in processing, and eventually using the data, is to calibrate the CRNS to the specific conditions found at the site of interest. Without this step, the soil moisture can potentially have significant biases and may be deemed unusable. Alternatively, the uncalibrated measurement can only give you a rough idea about the dynamics of the soil wetness conditions in relative terms. The calibration step typically requires multiple soil samples (typically >100) taken from within the sensor footprint and oven-dried to get an accurate representation of soil moisture at the calibration time. These samples are then weighted and averaged to give a field-scale soil moisture estimate of the sensor footprint (note that we use dry-soil bulk density, ρbd, sampled within the footprint to estimate volumetric water content in cm3 cm−3). The crspy tool uses the soil moisture averaging method obtained from field samples proposed by Schrön et al. (2017), which is based upon the original work of Köhli et al. (2015). The method provides an updated approach for weighting soil moisture samples taken within the footprint that considers the spatial distance of each sample from the sensor as well as the influences of pressure and humidity during the sampling period. This allows for a more accurate estimate of independent soil moisture within the CRNS footprint for the calibration step. Schrön et al. (2017) suggested improved sampling strategies which included samples closer to the sensor (<5 m radius from the sensor) and sample locations guided by the knowledge of local hydrological features. The data required for the calibration step include the date of the sample, an integer to represent each soil moisture profile (a core of soil taken from within the sensor footprint), the depth of each sample within each profile, the distance from the sensor, and the volumetric soil moisture of the sample. Again, these should be named following the template requirements of crspy (see Table A2 in Appendix A). Calibration data sets are openly available from some of the networks at existing sites, such as CosmOz and COSMOS, and can be obtained from their respective websites. Alternatively, if a user was setting up their own sensor, a sampling campaign would be required such as that described in Schrön et al. (2017).
With regards to the number of calibration days, crspy is flexible enough to process both single-day or multiple-day calibration campaigns. Multiple calibration campaigns were shown to improve the CRNS signal (Iweema et al., 2015). For the case of multiple-day calibration, all calibration days should be presented in a single table, ensuring that the correct dates of each sample period are provided, and following the same formatting and naming requirements used for single-day calibration.
Finally, when running crspy for a single site, the user is able to turn the calibration process on or off. This is included because calibration only needs to be done once, as N0 does not vary with time. When the calibration step is turned on, crspy will call the calibration routine and write the output to the metadata table in the column “N0”. If the calibration routine is turned off, crspy will skip this step and simply read the N0 number for the site from the metadata. Alternatively, the user can provide the N0 coefficient independently in the metadata table and skip the calibration step completely by always having it off in crspy.
2.3 Quality assessment
All data should be checked for quality to ensure that erroneous data are not included, and crspy includes some automated steps to begin this process. All networks implement quality assessment on neutron counts in order to remove poor-quality data (e.g. Zreda et al., 2012; Hawdon et al., 2014; Evans et al., 2016). In crspy, we remove suspicious data points by applying flags to neutron counts that fall within four categories, and the following rules are consistent with the application in other networks:
-
counts that differ by 20 % from the previous time step are removed;
-
counts below 30 % of N0 are removed;
-
counts above (N0 ⋅1.075) are removed, according to Eq. (13) in Köhli et al. (2021);
-
battery voltages below 10 V are removed,
Flag 1 is applied on the raw, uncorrected neutron count, as we are interested in identifying sudden jumps in the counting rate in the sensor that are believed to be in error. Flags 2 and 3 are applied to the corrected neutron count. This is because the N0 number is itself a corrected number (i.e. it is the maximum number of neutrons at the site under theoretical dry conditions, once additional environmental influences on the neuron count rate, N, have been taken into account and removed from the signal). In the case of flags 2 and 3 the N and N0 number need to both be corrected in order to be comparable.
Additionally, crspy will output time series diagnostic plots of all variables used for identifying patterns in data that point towards potential issues which may require a small subset of the data to be removed manually (this, of course, depends on the quality of the data from individual sites and, therefore, cannot be fully automated).
2.4 Metadata
Metadata are important pieces of information that allow the user to better describe each site characteristics beyond its soil moisture dynamics. This information can be extremely useful, especially when multi-site regional to global CRNS stations are to be analysed simultaneously. The metadata of each site are stored in a tabular format within the folder structure of the working directory, and a full description of the columns is given in the Appendix A (Table A3). This serves two main purposes. Firstly, it stores static site-specific variables that are used in computing estimated soil moisture values (e.g. LW, SOC, and ρbd). To provide an example, ρbd is necessary to convert gravimetric soil moisture estimates into volumetric soil moisture estimates in Eq. (1). The ρbd value is collected during the calibration campaign at each site and will vary between sites. It represents an averaged value taken from the soil samples, and it is stored in the metadata. The user should also give each site a country code which represents the country it is located in and a unique site number for each CRNS site. The country code is used to help identify geographic locations in analysis and helps when the site numbering of networks may overlap. Raw time series data should be titled with the country code and number in the following format: country_SITE_sitenum.txt. Here, country is a capitalised letter code, and the sitenum is a three-digit number. For example, sensor data for a site in the UK could be titled: UK_SITE_101.txt. The country and sitenum variables form a sitecode (e.g. UK_SITE_101) which is used to label the outputs of crspy for easier identification, especially when processing many sites. The country and sitenum are also used as lookup values in the metadata to extract necessary variables.
A second purpose of the metadata is to act as a resource when analysing many sites together. The ability to classify catchments by physical characteristics can allow us to understand key similarities and differences between sites, which is an important direction in hydrological research (Wagener et al., 2007). To increase the value of the metadata, in addition to including data collected at the site, global data products have been integrated. These products are all public products that a user can download and store within the folder structure of the working directory. We realise that these global data sets are not a direct replacement for the invaluable information obtained at the site; however, in many cases, such pieces of information are not available, undermining any multi-site analysis. We believe that the use of the data sets described in detail below can provide us with key information at both the regional and global level. In crspy, a simple function is used to extract the information from the data products below when provided with the location of the CRNS (i.e. latitude and longitude):
- (i)
ESA CCI Land Cover and Above-Ground Biomass data. The European Space Agency (ESA) Climate Change Initiative (CCI) provides numerous global data products that are useful in the Earth sciences community. Land Cover data and Above-Ground Biomass data are obtained from ESA CCI and stored in metadata for each site for analysis via identifying site differences and similarities. Both products are spatially consistent with the CRNS range (100–300 m) and are available globally. The usefulness of ESA CCI data sets in land surface modelling continues to be established (Li et al., 2017).
- (ii)
International Soil Reference and Information Centre (ISRIC). The ISRIC provides a global data product that gives estimates of soil properties on a 250 m resolution grid. This is available as SoilGridsv2 (Poggio et al., 2021), which is an updated (as of May 2020) iteration of the original SoilGrid product (Hengl et al., 2017). The properties are estimated from collections of ground measurements that are compiled by the World Soil Information Service (WoSIS). WoSIS provides standardised soil profile data to facilitate the creation of products such as SoilGrid (Batjes et al., 2020).
- (iii)
ERA5-Land. As discussed previously, meteorological variables from ERA5-Land data can be downloaded for each site. Mean annual precipitation and temperature data are stored along with derived Köppen–Geiger classifications.
2.5 Running the tool
Once the working environment has been prepared, the data can be processed
with crspy.process_raw_data(fileloc, calibrate=True, intentype=None). Here, “fileloc” is the location of the
raw sensor data, the calibration process can be turned on or off as a
Boolean descriptor, and intentype can be left as “None” to enact the default
process for incoming neutron intensity correction or can be changed to
“nearestGV” to utilise the alternative method. Once applied, crspy will
process the raw data using the provided information to give soil moisture
estimates and will output figures and tables into the folder structure of
the working directory. A description of the final output file and what each
of the standard columns represent is given in Table A4.
3.1 Benefits of data harmonisation
As mentioned previously, one of the key purposes of crspy is the easy and harmonised processing of CRNS sites from around the globe, as there is currently no true consensus on what correction steps are implemented in different national networks. These technical differences can lead to changes in outputs which may result in non-optimal conditions for regional/global analysis from multiple countries. Whereas some users may wish to understand changes at one particular site, inter-site comparisons are limited when each site could be processed in a different way. In this section, we highlight such impacts using an example related to the individual sensor corrections steps and their impact on the final soil moisture estimates.
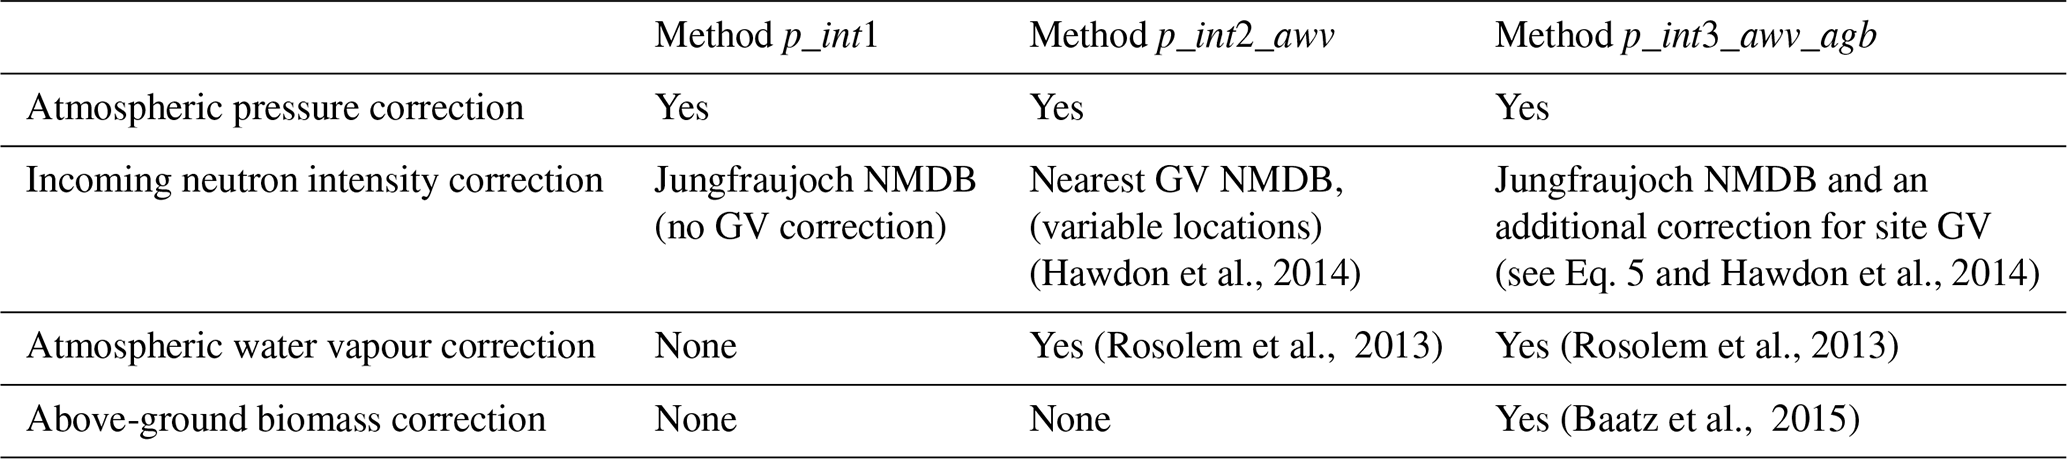
Table 1 outlines three identified methods that are currently employed across different networks. The p_int1 method is employed at the COSMOS (USA) network; it lacks the atmospheric water vapour correction and applies an intensity correction using only the Jungfraujoch neutron monitoring site directly. The p_int2_awv method closely resembles the CosmOz (Australia) network methodology, which applies the atmospheric water vapour corrections and an intensity correction that differs from the p_int method. In this case, the neutron monitoring station used as an incoming neutron intensity reference is changed to the nearest station with a similar cut-off rigidity to the CRNS site being corrected. The p_int3_awv_agb method is the default crspy method; it resembles the methods used by COSMOS-UK while also allowing for the above-ground biomass correction to the neutron signal. In this final case, the intensity correction uses Jungfraujoch as its reference site but with an additional correction to account for differences in cut-off rigidity between Jungfraujoch and the site (Eq. 5).
Table 1The three identified methods of correcting neutron signals in use.
With all of these different correction approaches applied independently by each national network, we investigate both the impact on the measured neutron counts and, consequently, the propagated effects on the estimation of soil moisture. Figure 3 shows two sites with distinct hydroclimatic regimes, both taken from the COSMOS-USA network, that have been processed using the three identified methods (see highlighted star markers in Figs. 4 and 5). The Santa Rita Creosote site (Arizona, USA) is a shrubland-dominated region with a soil categorised predominantly by sandy loam. The site has a mean annual temperature of 19 ∘C and a mean annual precipitation of 335 mm, the latter of which primarily falls in winter storms and monsoonal summers (Köppen–Geiger climate classification BSh, a hot semi-arid climate). Climate data are taken from ERA5-Land, and the Köppen–Geiger classification is derived from ERA5-Land data using the method outlined in Peel et al. (2007). The Wind River site (Washington, USA) is an old-growth mixed conifer forest area. The site is much wetter than the Santa Rita Creosote site, with an annual precipitation of 2200 mm, and much colder, with an average annual temperature of 8 ∘C. Precipitation at Wind River tends to fall all year round but with slightly lower rates in the summer period (Köppen–Geiger classification is Csb, a Mediterranean climate, mild with dry, warm summers). Climate data have been extracted from ERA5-Land, and the Köppen–Geiger classification is derived from 10 years of ERA5-Land data using the method outlined in Peel et al. (2007). The raw neutron data from both sites were obtained directly from the COSMOS network, representing the p_int case in Table 1. In addition, in order to compare the impact of the different correction approaches outlined in Table 1, the raw data from the CRNSs at both sites have been processed in crspy to give the corrected signals for the p_int2_awv and p_int3_awv_agb methods.
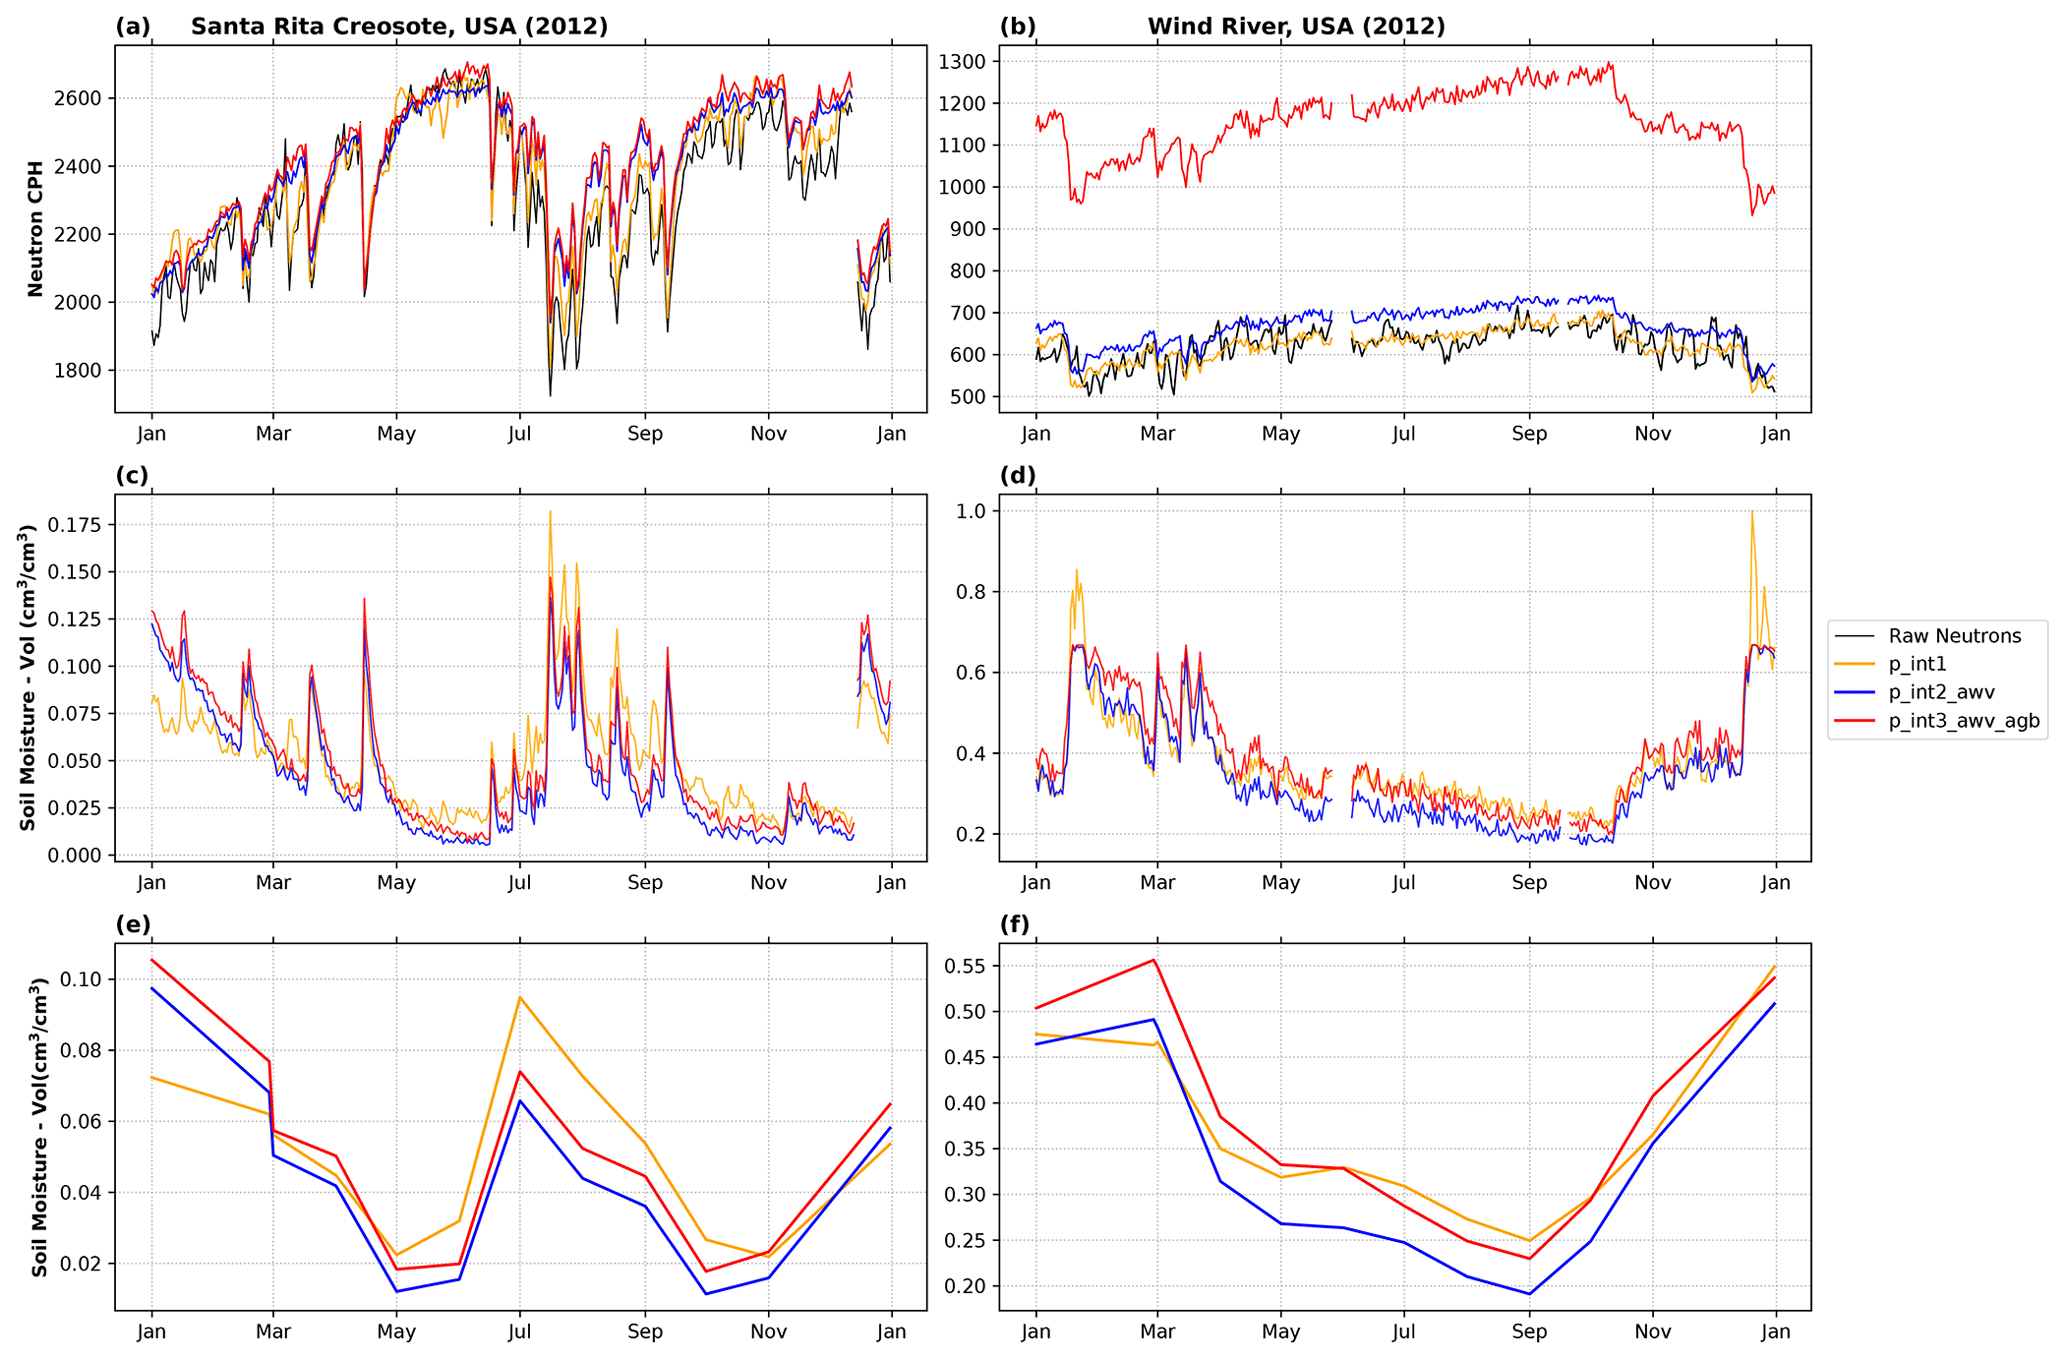
Figure 3Example of CRNS data obtained at two distinct sites: Santa Rita Creosote (a, c, e) and Wind River (b, d, f). Daily neutron counting rates (raw and corrected based on the different strategies outlined in Table 1) are shown in panels (a) and (b). Derived soil moisture estimates (cm3 cm−3) are shown at daily and monthly timescales in panels (c) and (d) and in panels (e) and (f) respectively.
It is clear to see the inverse relationship between neutron count rates and soil moisture, most noticeably at Santa Rita Creosote (Fig. 3a, c). The soil moisture here tends to be low, such as in June when it was below 0.05 cm3 cm−3, which is to be expected in a hot semi-arid environment. Sudden spikes in soil moisture can be attributed to precipitation events, with the summer monsoonal precipitation causing a sudden increase in the mean soil moisture values for the months of July, August, and September (and, inversely, periods corresponding to decreases neutron counting rates). It is also clear that the method chosen has an impact on soil moisture values. This is most notable when comparing the p_int1 method with both the p_int2_awv and p_int3_awv_agb methods. During the summer months, the p_int1 method appears to estimate higher soil moisture values compared with the other two methods (both appearing to be much more closely aligned with each other). This is likely due to the fact that the p_int1 method does not account for changes in atmospheric water vapour. As a consequence, during the monsoonal summers when there is more hydrogen in the atmosphere from increased humidity, the relatively high water vapour in the atmosphere is incorrectly attributed to additional soil moisture. This is because the CRNS records wrongly attribute the decrease (attenuation) of neutron counts due to water vapour to an increase in soil moisture, causing an overestimation. For example, even early in March, there is a sudden rise in soil moisture from the p_int1 estimates that does not appear in the other two methods (Fig. 3c). This suggests that rather than a sudden rise in soil moisture, this was actually a rise in atmospheric water vapour. This demonstrates the importance of removing external impacts on the neutron signal, as they could be incorrectly attributed to soil moisture dynamics. The negative effect of neglecting such correction, for example, can be even more pronounced in monthly estimates of soil moisture due to the aggregated nature of this error (Fig. 3e).
The Wind River site is a much wetter site when compared with Santa Rita, with its driest month matching Santa Rita Creosote's wettest month. In the case of Wind River, it is worth noting that there is a much larger difference between the neutron count rate of the p_int3_awv_agb method compared with the other methods (Fig. 3b). This is because the p_int3_awv_agb method includes an above-ground biomass correction, using the ESA CCI Above-Ground Biomass product to calculate a correction. Currently, as this correction is applied using a static aboveground biomass value (constant with time), the impact of the correction is not translated to differences in estimated soil moisture. This is due to the correction being applied to both the neutron counting rate and the N0 term. With dynamic data, which represent changes in above-ground biomass over time, we would be able to improve our estimates of soil moisture, as the impact of changing above-ground biomass could be removed from the neutron signal. One additional noticeable feature that crspy implements is the capping of soil moisture to more realistic values, in this case 0.68 cm3 cm−3. The p_int1 method does not do this, and so there are physically impossible values of volumetric soil moisture in February and December, as seen in Fig. 3d. In crspy, maximum values for soil moisture are estimated by inferring the porosity of the soil:
where sm_max is the maximum volumetric soil moisture value (cm3 cm−3), ρbd is soil bulk density (g cm−3), and density is the density of ground material (estimated with an assumed density of quartz at 2.65 g cm−3). If a user did not wish to enable this cut-off value, the value for sm_max can be set to one in the metadata.
At the Wind River site, the differences between p_int2_awv and p_int3_awv_agb are much more noticeable, especially when the soil moisture estimates are aggregated to monthly timescales (Fig. 3f). This observed difference is due to the fact that these methods do not apply the same correction for incoming cosmic-ray intensity (fi). Such differences are caused by the choice of correction rather than physical controls on soil water dynamics. This can lead to inaccurate comparisons across sites from different national/regional networks. For example, identifying useful soil moisture signals that can be used to categorise the hydrology of sites will be an important tool for understanding differences and similarities with regards to hydrology. Branger and McMillan (2020) demonstrated this in their paper which looked to identify useful soil moisture signals that can be robust, discriminatory, and representative, and research into developing useful diagnostic soil moisture signatures is ongoing (Araki and McMillan, 2020). When reducing large time series data into signatures, such differences can be aggregated, which could begin to affect conclusions. However, the authors stress here that it is not within the scope of this work nor the intention of this study to identify which method is better or worse than the other; rather, we intend to highlight the potential negative impacts of the lack of a harmonised data set for large-scale global assessment of CRNS technology.
3.2 Usefulness of crspy metadata
Metadata can be used to describe the network of CRNSs around the world geographically, climatologically, and hydrologically. To achieve this, crspy compiles relevant data obtained directly from the sensor, key data descriptors provided from each site or network, and from global data products. Wagener et al. (2021) discuss the need for high-quality metadata to improve our ability to understand the knowledge accumulation in the field of hydrology. Metadata can be valuable in separating relevant sites in different groups; for example, researchers may be interested in understanding how soil moisture behaves at sites above 2000 m elevation with certain land use types and given particular weather events (Chen et al., 2020), how it behaves at sites where mean annual precipitation is above/below a certain threshold, or they may even wish to group sites by different land cover or soil types. So called meta-analyses can help a researcher identify which sites should be included in their studies and which can be excluded (Evaristo and McDonnell, 2017). The metadata provided by crspy allow the user to quickly obtain any grouping of interest in an easy and accessible way.
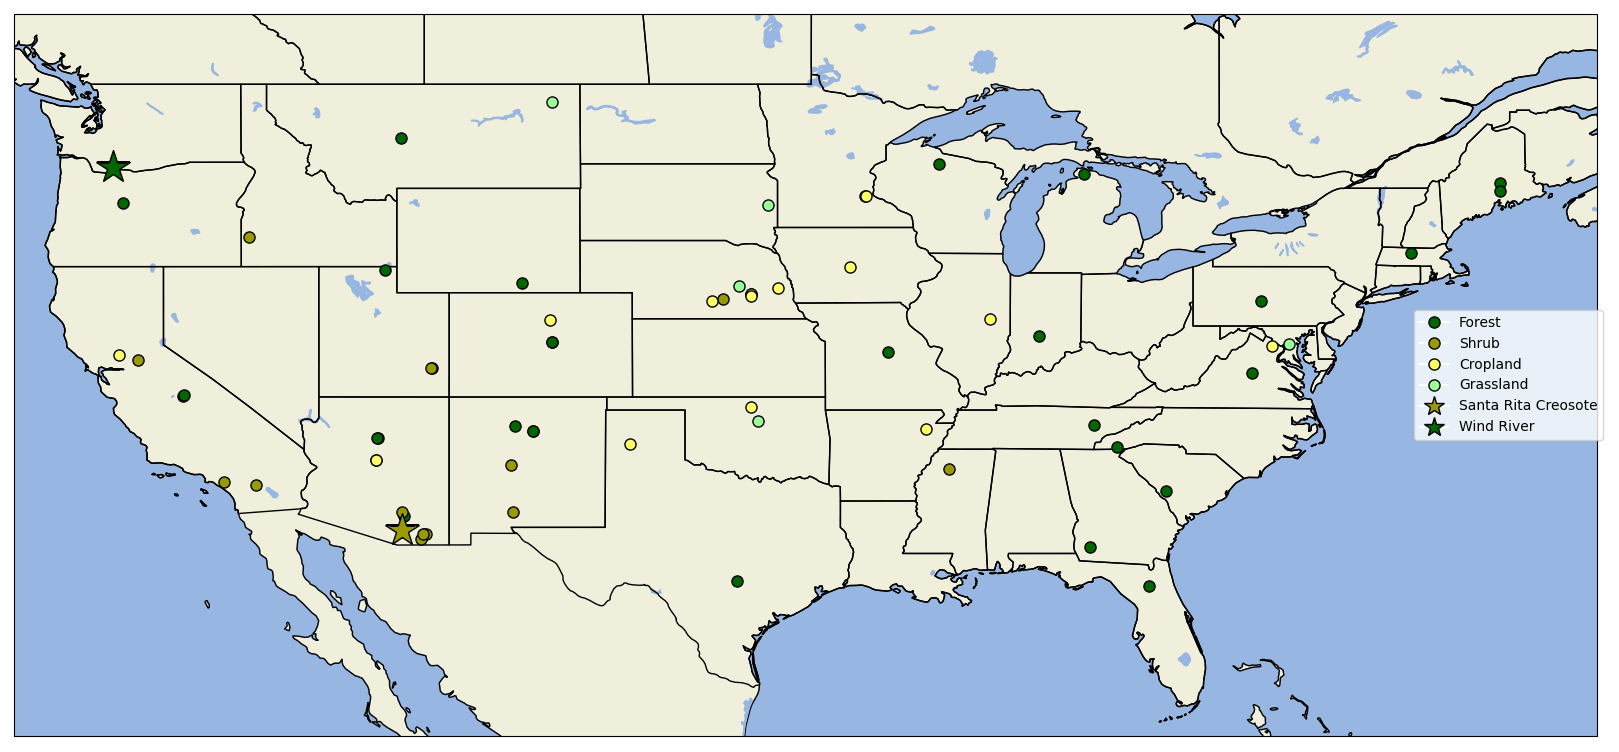
Figure 4Map showing the location of CRNS sites from the COSMOS network across continental USA (CONUS). The colours are representative of the land cover types obtained from the ESA CCI global database, and the stars highlight the location of the two sites processed above (i.e. Santa Rita Creosote and Wind River).
In order to demonstrate some of the features that can be easily accessed
with the help of metadata, we show an example using the compiled COSMOS
network data for the continental USA (CONUS). Some of these data are taken
directly from the network website and then processed using the
crspy.fill_metadata() function. This function collects
information from global data products at a specific site location (i.e.
latitude and longitude) as well as using meteorological data from ERA5-Land
to produce annual meteorological summaries (e.g. mean annual temperature,
mean annual precipitation, and Köppen–Geiger climate classification).
Figure 4 gives an example of how the metadata can be easily used to show the
location of each sensor in the CONUS domain based upon the
supplied additional information – in this case, the main land cover classes
obtained from the CCI ESA Land Use data. An important step here is that the
user is not required to download and process the land cover data separately
and individually. crspy incorporates that step for the user seamlessly.
In addition to locating the CRNS stations and identified the main land cover type, Fig. 5 shows a scatter histogram of the sites across CONUS, providing additional annual meteorological summaries, namely mean annual temperature and mean annual precipitation. The scatterplot still retains the information about the main land cover type obtained from the ESA CCI global database. In addition, both meteorological variables are shown as side histograms and were computed using ERA5-Land data. The initial analysis indicates that CRNSs classified as shrublands tend to be relatively warmer and drier. Grassland and forests tend to be wetter while showing a wider range of temperatures. Croplands are slightly warmer than grassland and forests but still show lower temperatures than those observed in shrublands. However, croplands also indicate a slightly wider range of wetness compared with the grassland and forest sites, as observed from the total annual precipitation. This could be useful when deciding which sites should be used in a particular study, such as a study on soil moisture dynamics in shrublands with low overall precipitation. Alternatively, it can be used in big-data analytics when trying to identify the dominant mechanisms in soil moisture dynamics globally.
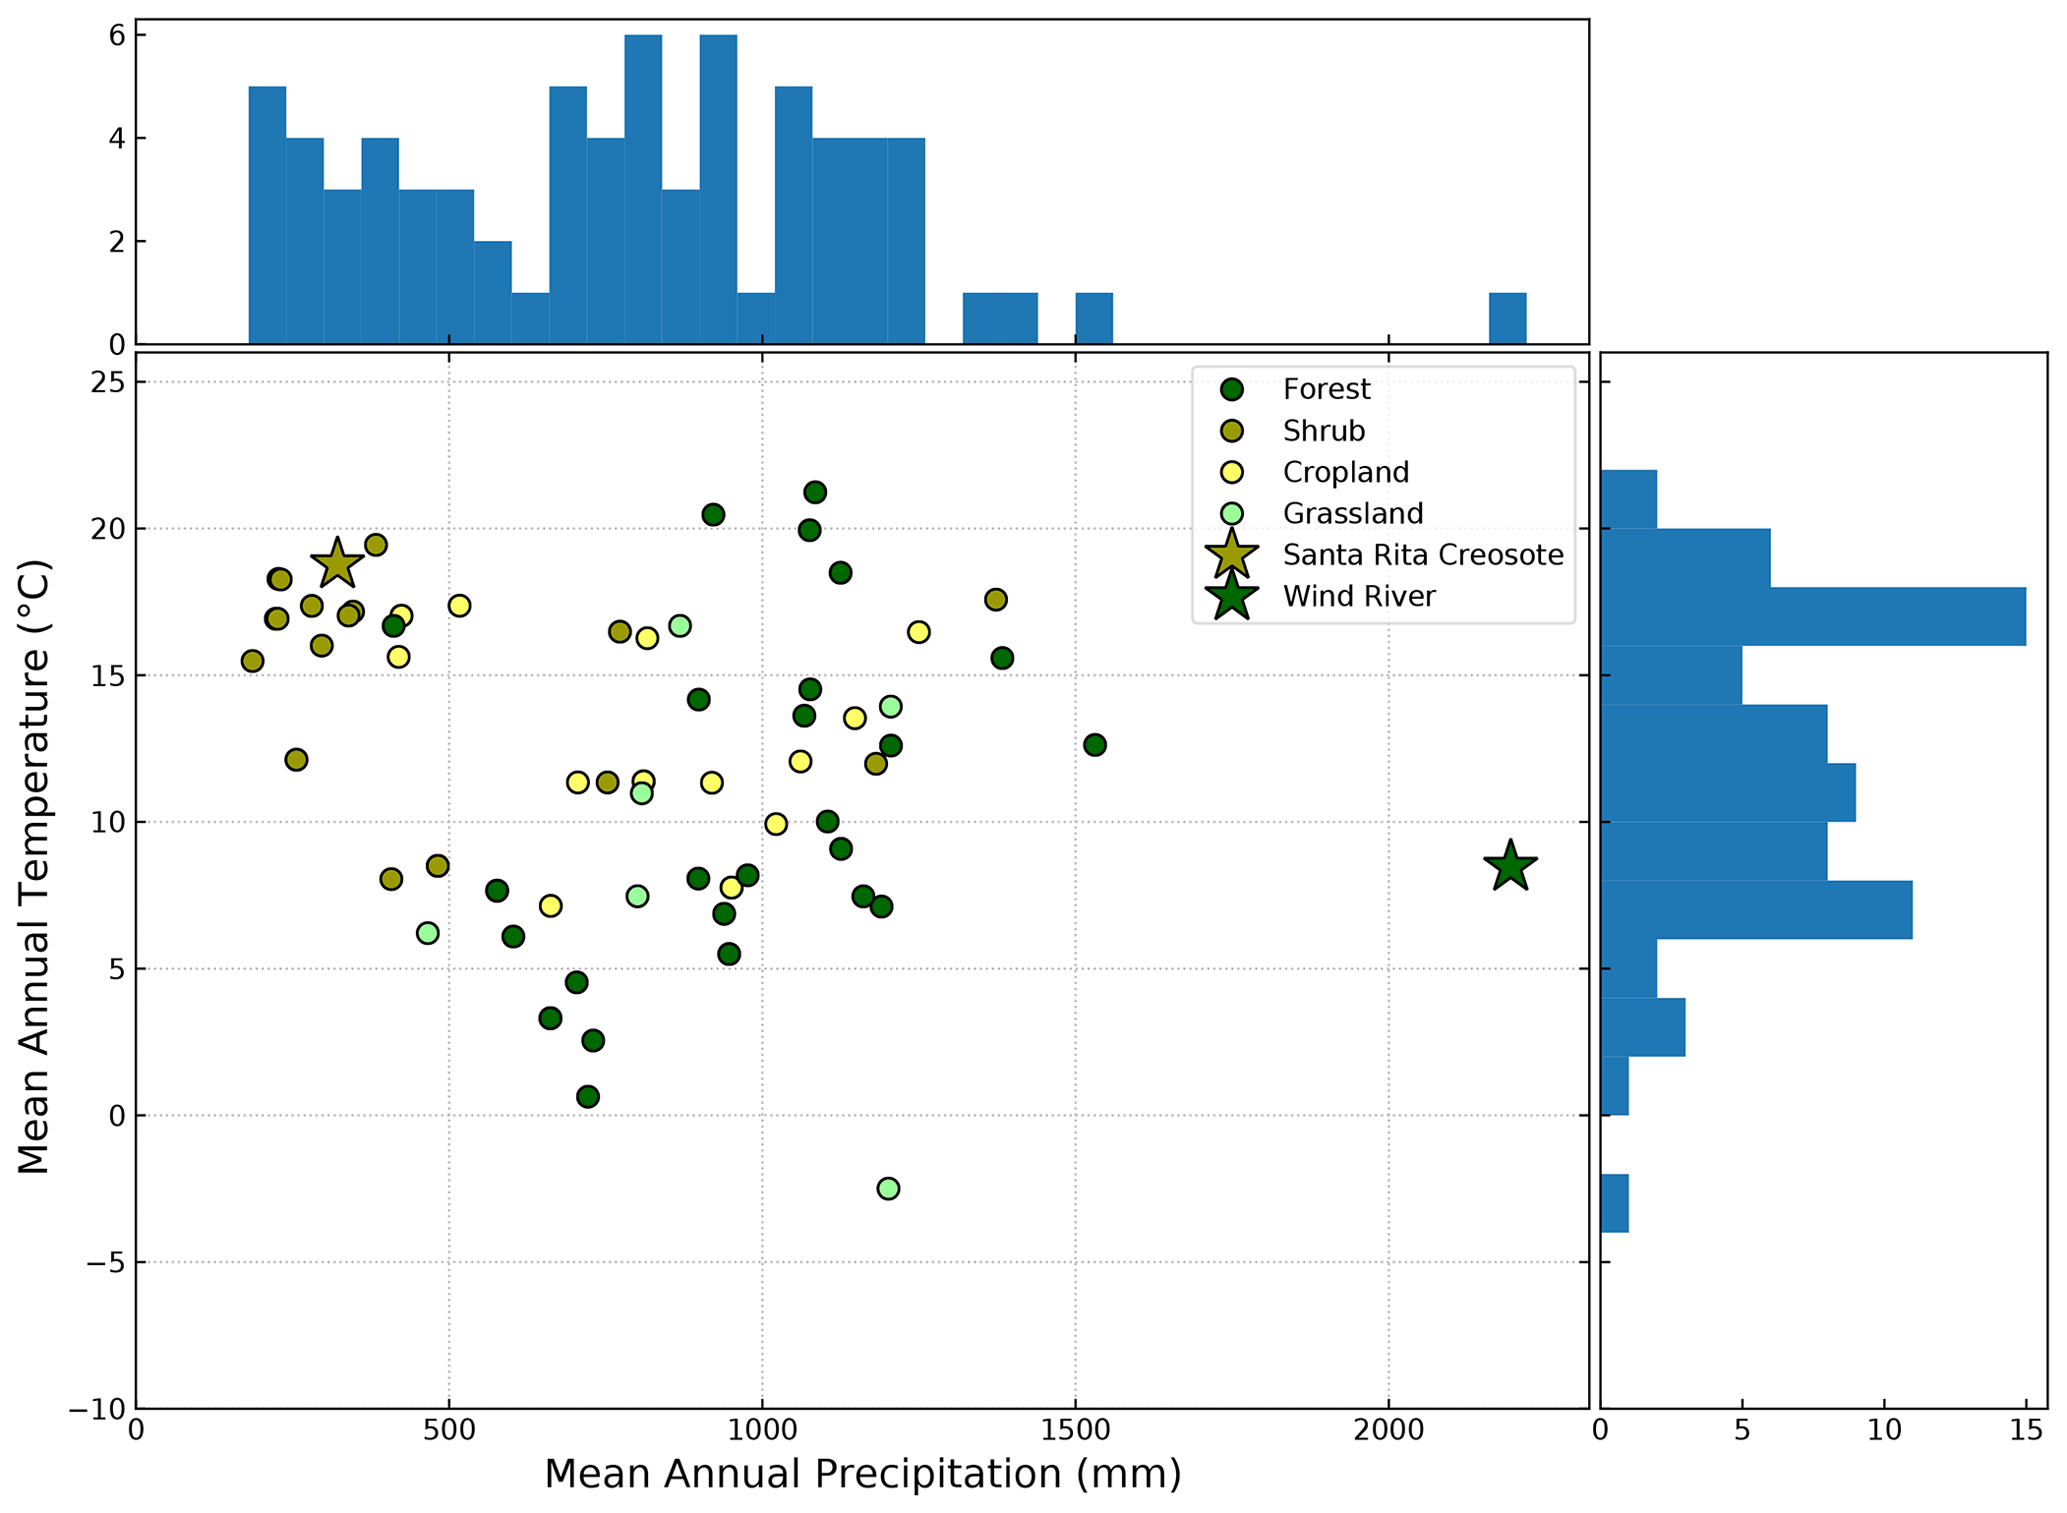
Figure 5Scatter histogram showing the CONUS CRNS sites and some of their climatological characteristics. The units for the histograms are the number of sites for each bin. The colours represent land use types identified from the ESA CCI Land Use global data set. The stars highlight the location of the two sites processed above (i.e. Santa Rita Creosote and Wind River).
The objective of metadata in crspy is to easily collect a wide range of information on site characteristics that can be used to improve our knowledge of soil moisture and, consequently, other hydrological and environmental processes beyond just a single site. This allows for knowledge accumulation across multiple sites (from local to regional and even global), highlighting key similarities and any emergent patterns (e.g. hydroclimatic and ecological). Metadata analysis has not yet been fully exploited in hydrological sciences (Evaristo and McDonnell, 2017), but it can also contribute to knowledge accumulation, which can be translated to aid in the design of improved or new perceptual or conceptual models (Wagener et al., 2021). An early example of that within the cosmic-ray neutron sensing community is clearly demonstrated by Shuttleworth et al. (2013) during the conceptual development of the COsmic-ray Soil Moisture Interaction Code (COSMIC). COSMIC was developed as a forward observational operator, allowing for the conversion of simulated soil moisture profile by land surface or hydrological models into equivalent neutron counting rates, facilitating data assimilation applications (Rosolem et al., 2014). By collecting and accumulating information from (at that time) 42 available COSMOS sites (see Table 1 in Shuttleworth et al., 2013), the authors were able to simplify the requirement for two of the prescribed parameters by establishing relationship with dry-soil bulk density (see Fig. 6 and Eqs. 6 and 7 in Shuttleworth et al., 2013). crspy will certainly facilitate such efforts in the future to help both experimental and modelling scientists, with the potential to reach other disciplines beyond traditional hydrological and environmental sciences. For example, a prototype version of crspy has recently been used for space weather application (Hands et al., 2021).
In this paper, we have presented crspy, an open-source Python tool for the processing of cosmic-ray neutron sensors. Our aim in developing crspy is to provide a tool to the community that can provide methods to process CRNS data easily and that can be updated in the future to keep pace with our increasing understanding of the sensor signal. Due to this evolving understanding of the sensor, we expect to be updating crspy regularly in the future to accommodate our new understanding of the technology along the years.
Köhli et al. (2021) recently presented research that demonstrates a revised formulation of the key equation that converts neutron counts into soil moisture estimates (see Eq. 1). This emphasises the need to be able to update CRNS estimates to keep pace with the research as well as to test newer formulations across a range of sites quickly. In version 1.2.1 of crspy, we maintain the Desilets et al. (2010) version of Eq. (1) as the default setting but provide a document that describes how a user could update crspy on their home machine to implement the revised approach (see the Supplement). This document serves two functions: it demonstrates how to update crspy so that researchers may be able to test newer methods on a broad range of sites, but it also speaks of a more general need to agree on a standard approach for processing CRNS data. We believe it will be an important step in the future for the numerous stakeholders in CRNS measurements to agree upon a standard approach. This must be decided as a community, and we should look towards the positive steps other communities have taken in this regard, such as the flux community (Novick et al., 2018).
Another aspect of development in crspy will be making it more accessible and user-friendly. We consider that one of the key functions of crspy is to act as a tool for researchers, providing a way to update processing methods and apply them quickly to a collection of data. On top of this, we would hope that it can be used as an education tool, helping newer users understand how the sensor functions and what is required to fully correct it based on our current understanding. This could include developing crspy into frameworks such as Python Dash, which are powerful tools for exploring data.
Soil moisture is an important component of the hydrological cycle, and understanding its dynamics at relevant spatio-temporal scales is critical especially with recent advances of global land surface and hydrological models. The CRNS technology is able to provide estimates of soil moisture at the sub-kilometre scale and at an hourly resolution. This is particularly relevant now as we continue to move towards hyper-resolution global modelling efforts. Over the years, with increased adoption of the technology, the CRNS community has acquired a better understanding of the benefits and limitations of this relatively novel technique. However, due to a lack of data harmonisation across networks, undertaking global-scale analyses is currently very limited and unexploited. Here, we introduced the crspy Python package with the aim of facilitating user data processing easily and with the most current methods and, most importantly, in a harmonised fashion. crspy is an open-source tool aimed at integrating the latest developed methodologies for CRNSs for use in both research and teaching activities. It integrates high-quality global data products (such as ERA5-Land) to ensure that all sites can be included in the analysis. This is done in a similar way to other well-established global environmental networks such as the AmeriFlux and FLUXNET.
Our application examples demonstrated that processing CRNS data with different methodologies can ultimately lead to divergences in soil moisture estimates. This could potentially have a negative impact on the analysis and overall findings, especially when sites across multiple networks are evaluated simultaneously. By harmonising data processes, we envisage that CRNS data will be used more widely by the global modelling and experimental communities, leading to further adoption of the technology. The objective of crspy is to provide an open and easy-to-use data processing platform that can enable easy processing of CRNS data. Additionally, crspy data collection relies on the production of an extensive metadata archive. This archive can be shared and used within the community to better understand key aspects of soil moisture from typical sampling locations, in order to provide information on signature behaviour by different groupings. crspy has been developed to show the potential to easily and efficiently process CRNS data in a harmonised way. The aim is to promote the usefulness of free and open-access data and engage the CRNS and research communities in the continued improvement of this product in the coming years.
Appendix A consists of four tables that outline the naming conventions required for crspy to run; it also presents the output table and a description of each variable. When labelling input data, column titles should match the style used in the “Column name” column below. This initial step will then allow crspy to run smoothly, as it uses column titles to identify relevant data sources.
Table A1The naming convention for CRNS input data. Networks can occasionally have different naming conventions (e.g. temperature is referred to as t1). Changing the column titles to the following format will allow crspy to function correctly.
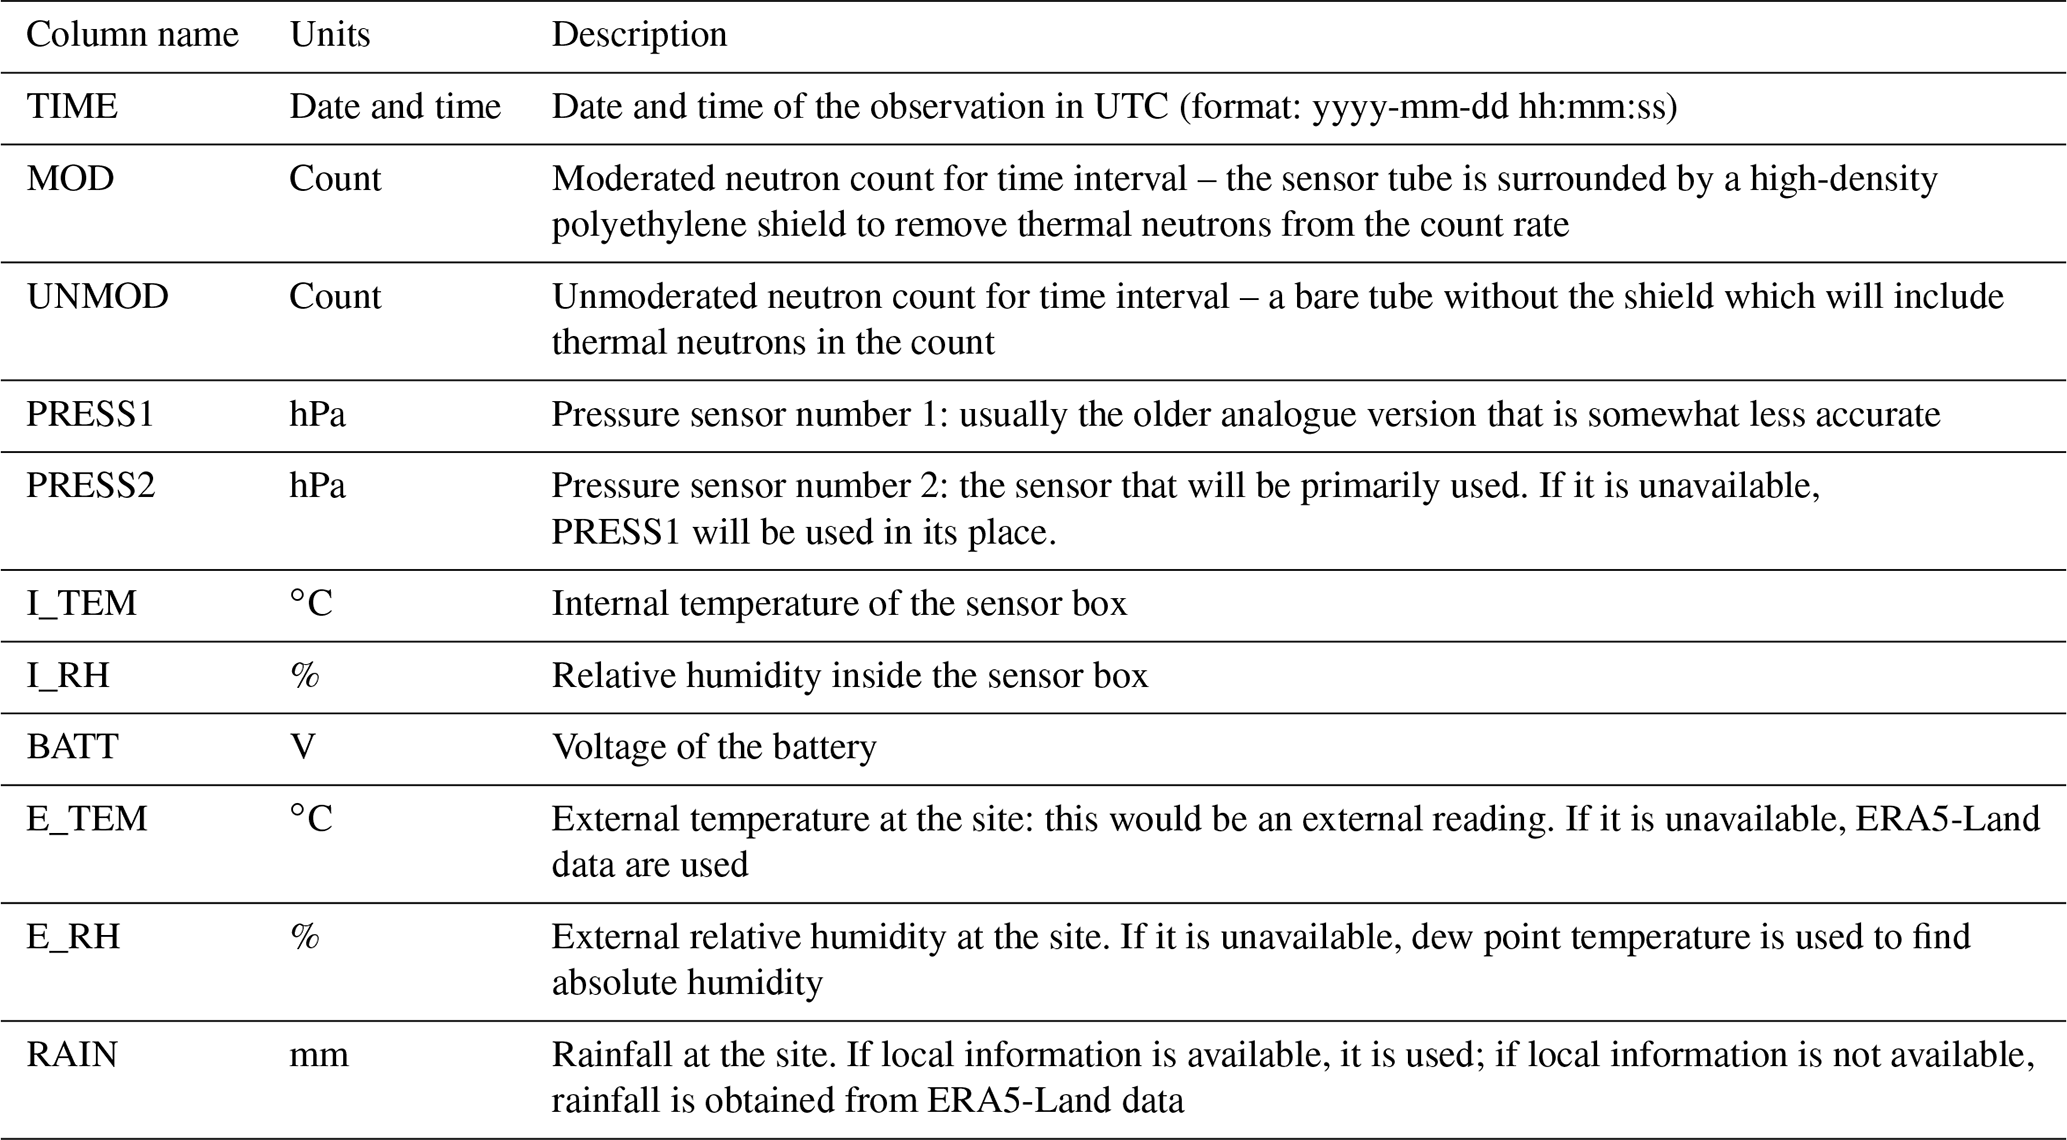
Table A2The naming convention for the calibration data. This format should be followed and will allow the calibration module to be utilised.
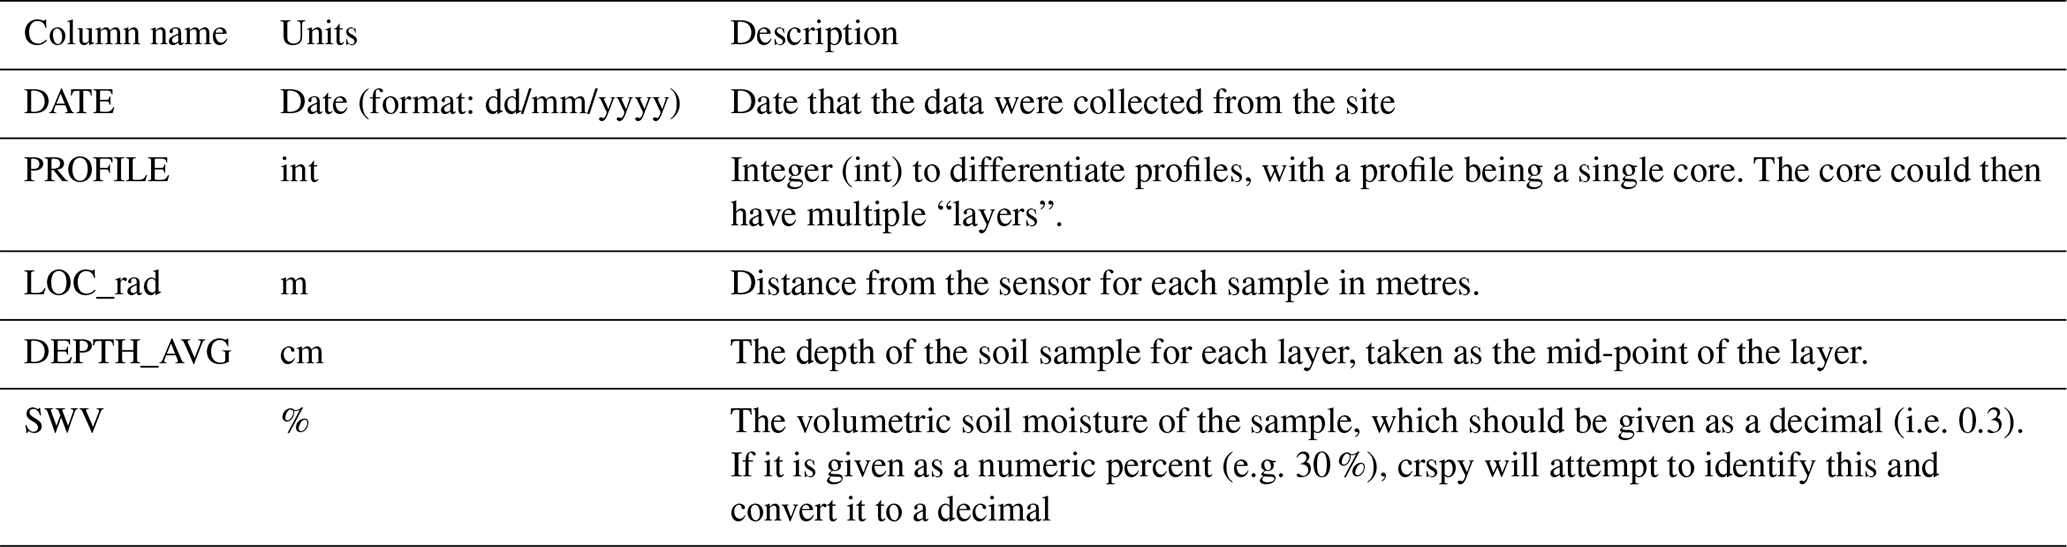
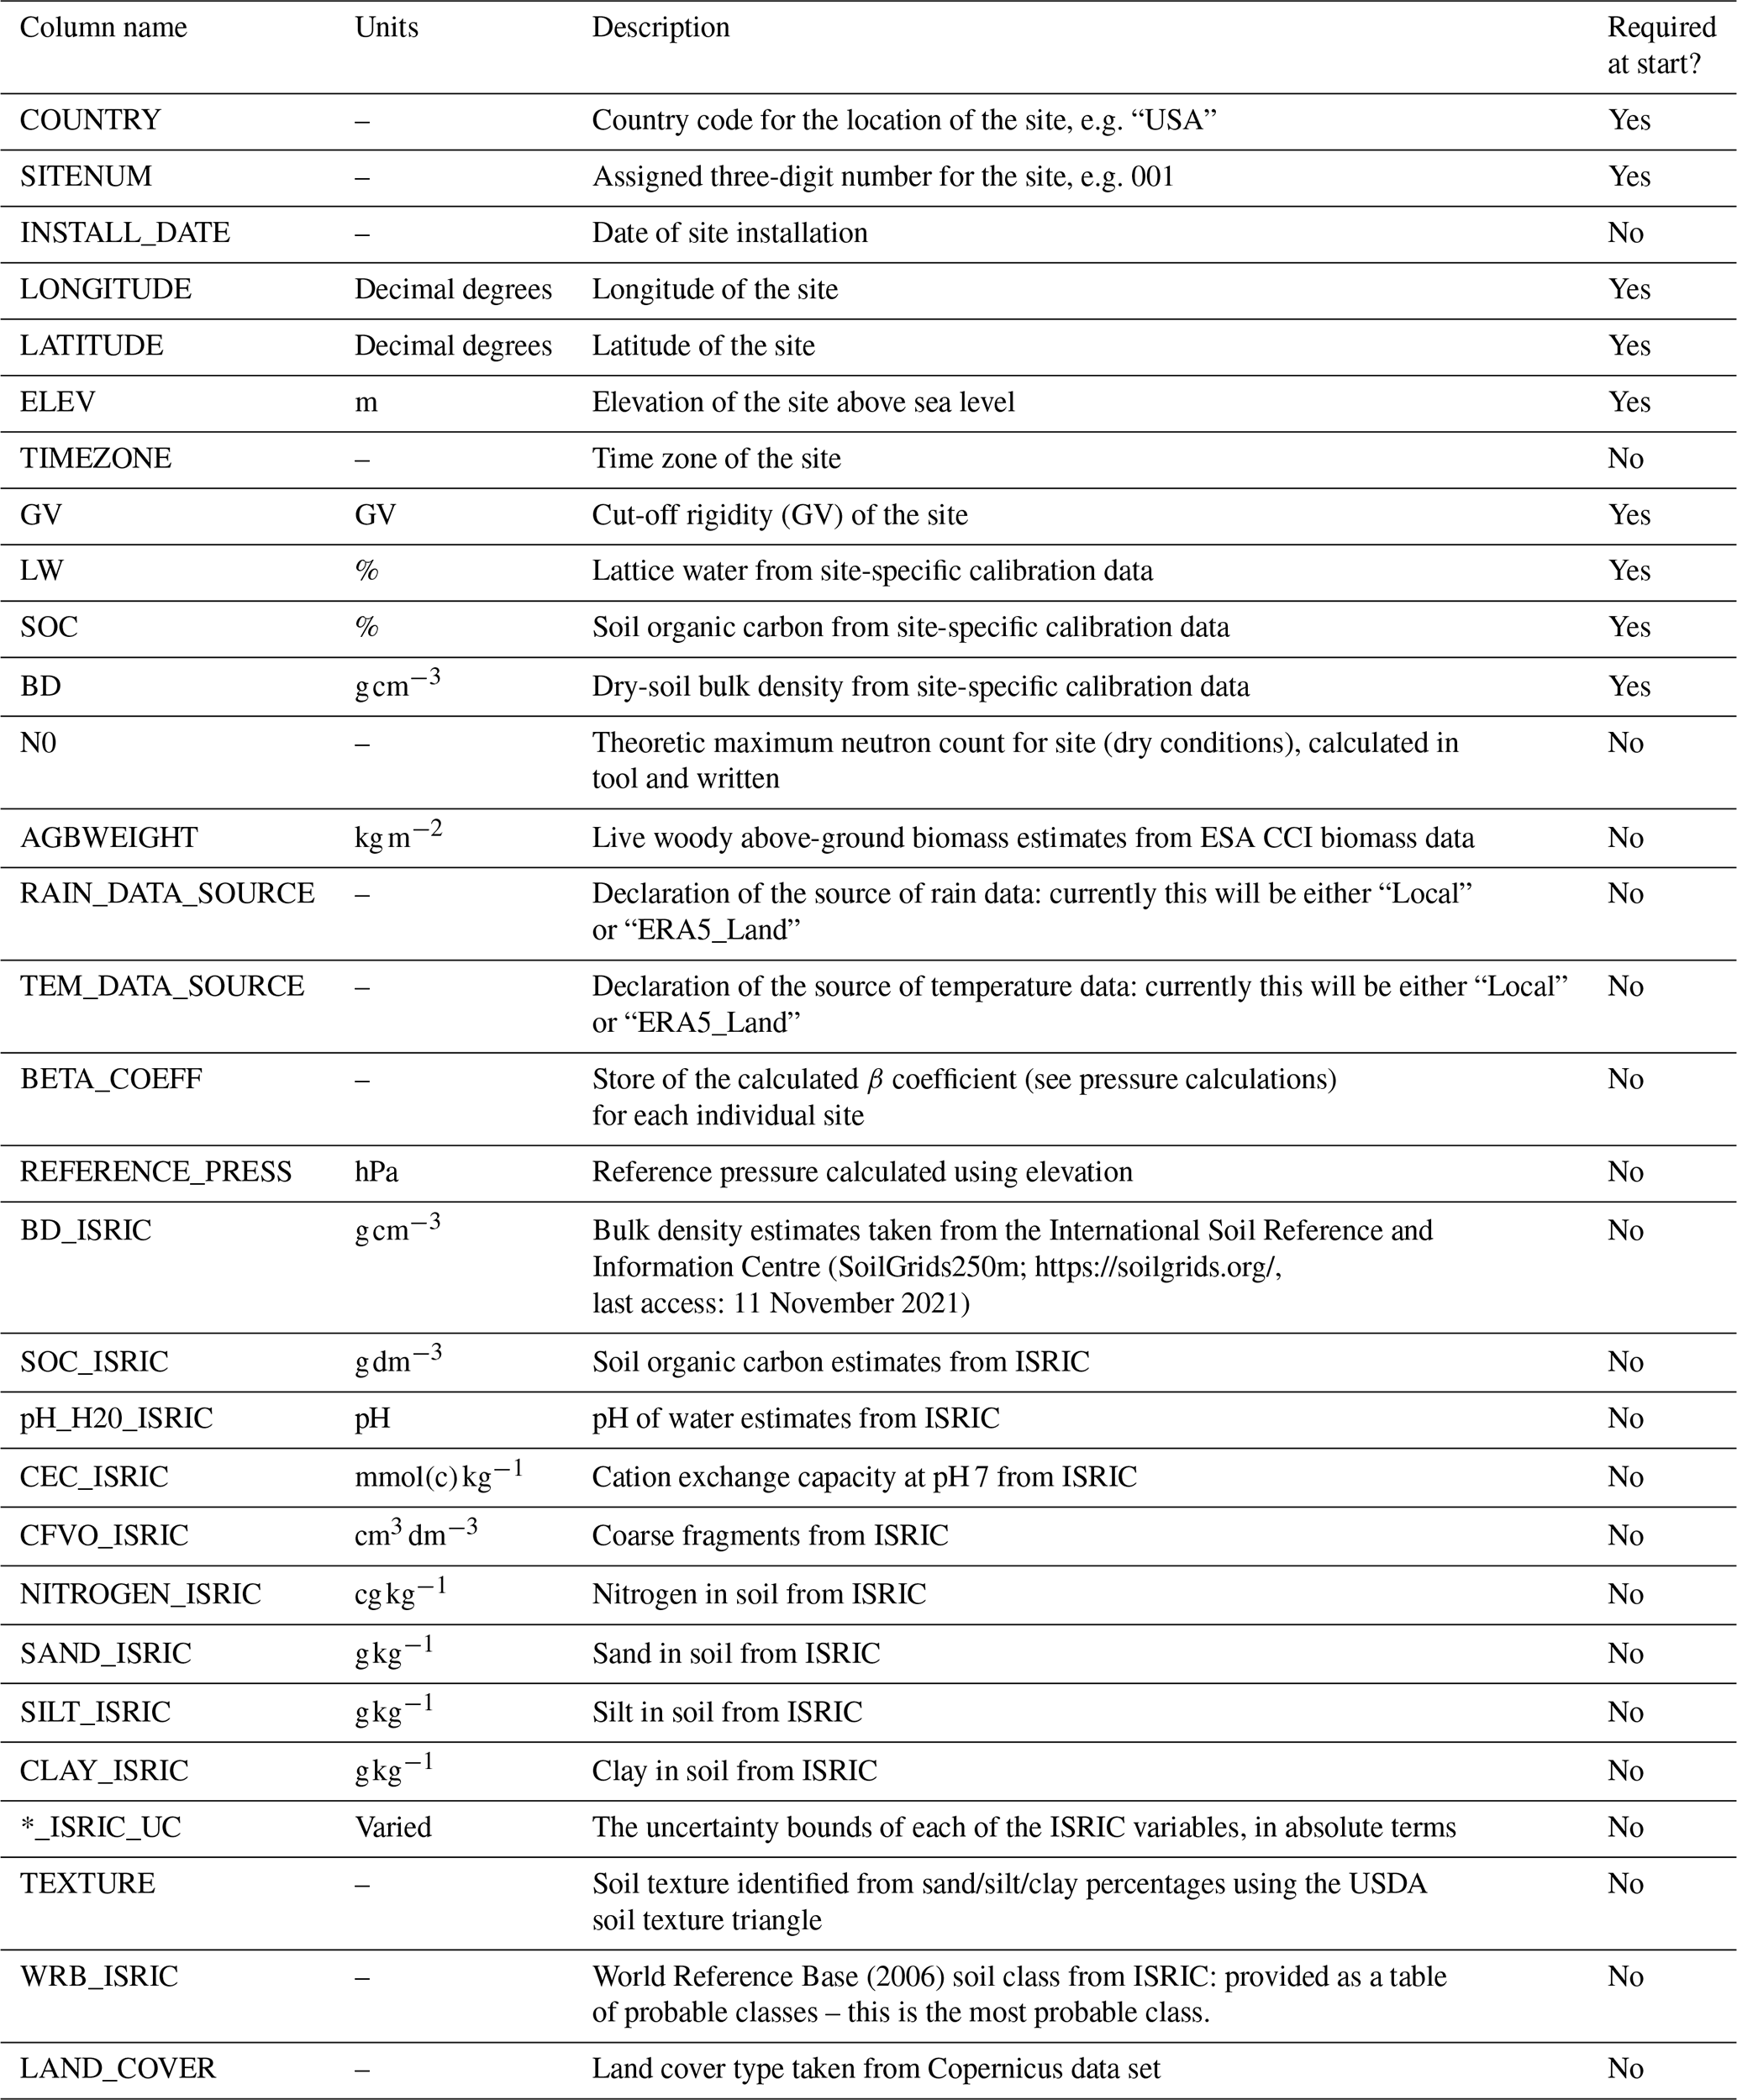
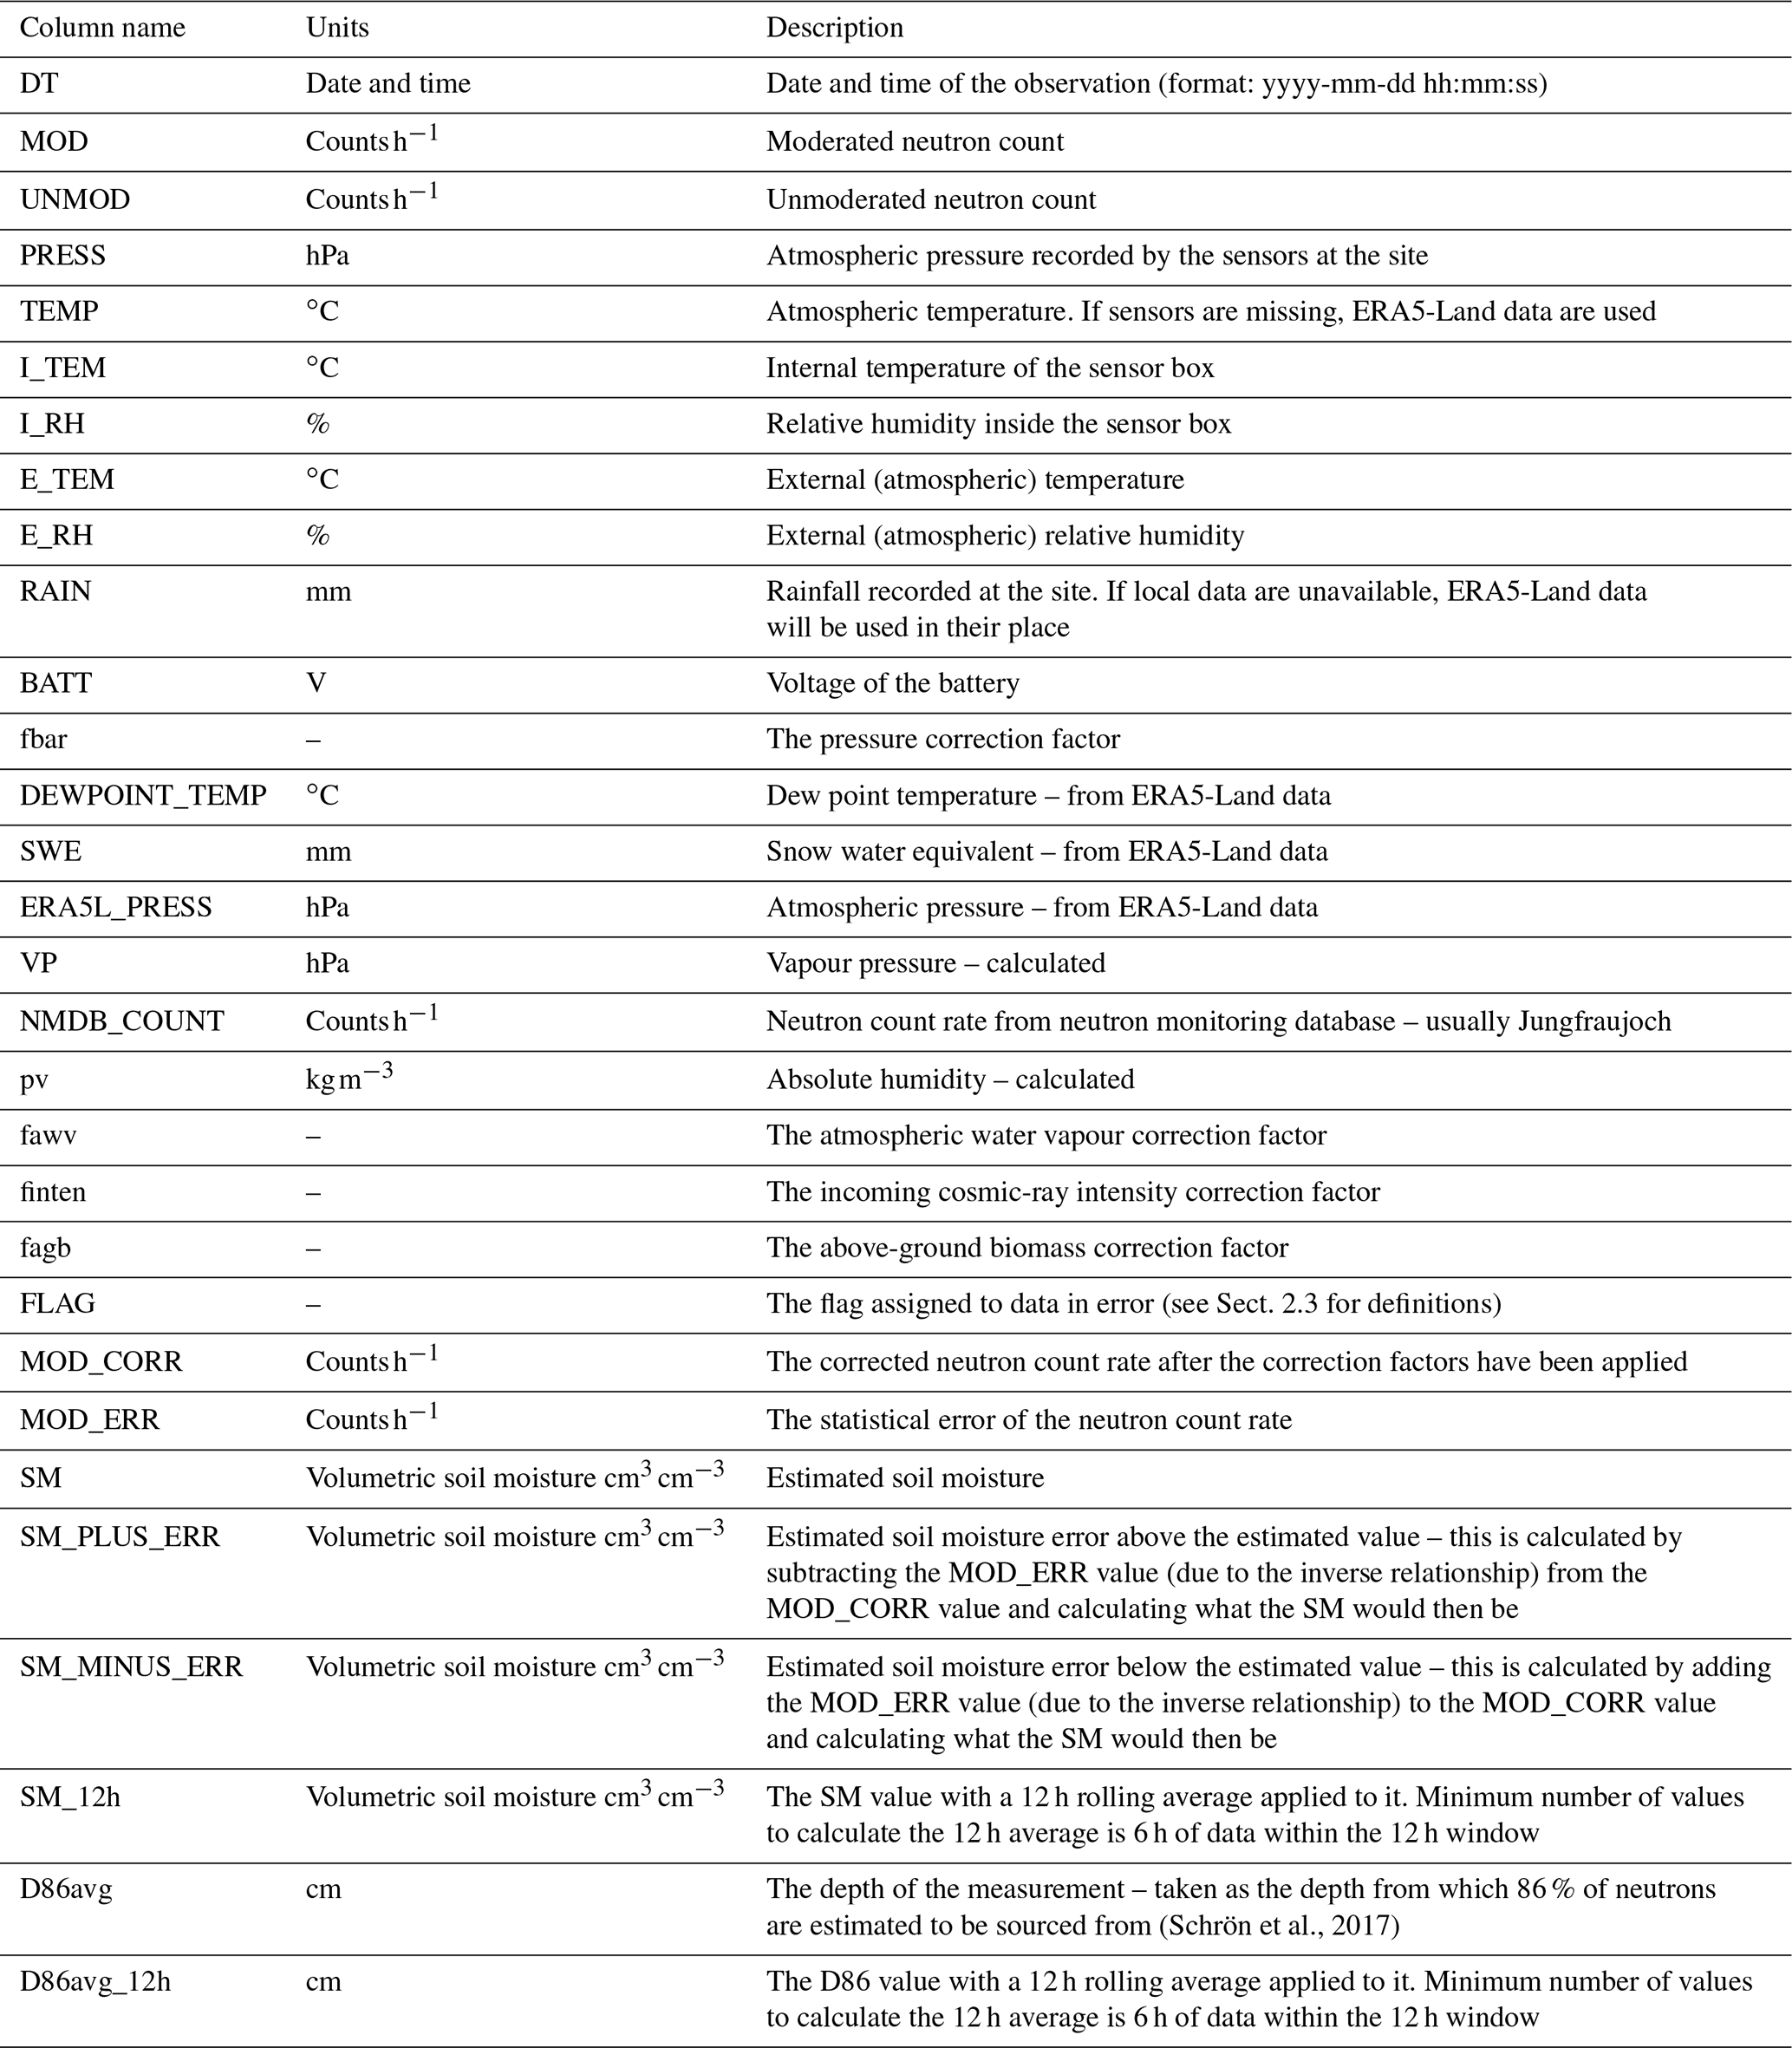
Table A4crspy final output table from a given CRNS site. Note that there may be additional columns when run as different networks may have additional variables.
Appendix B provides some examples of the automatically generated outputs of crspy along with a description of their purpose.
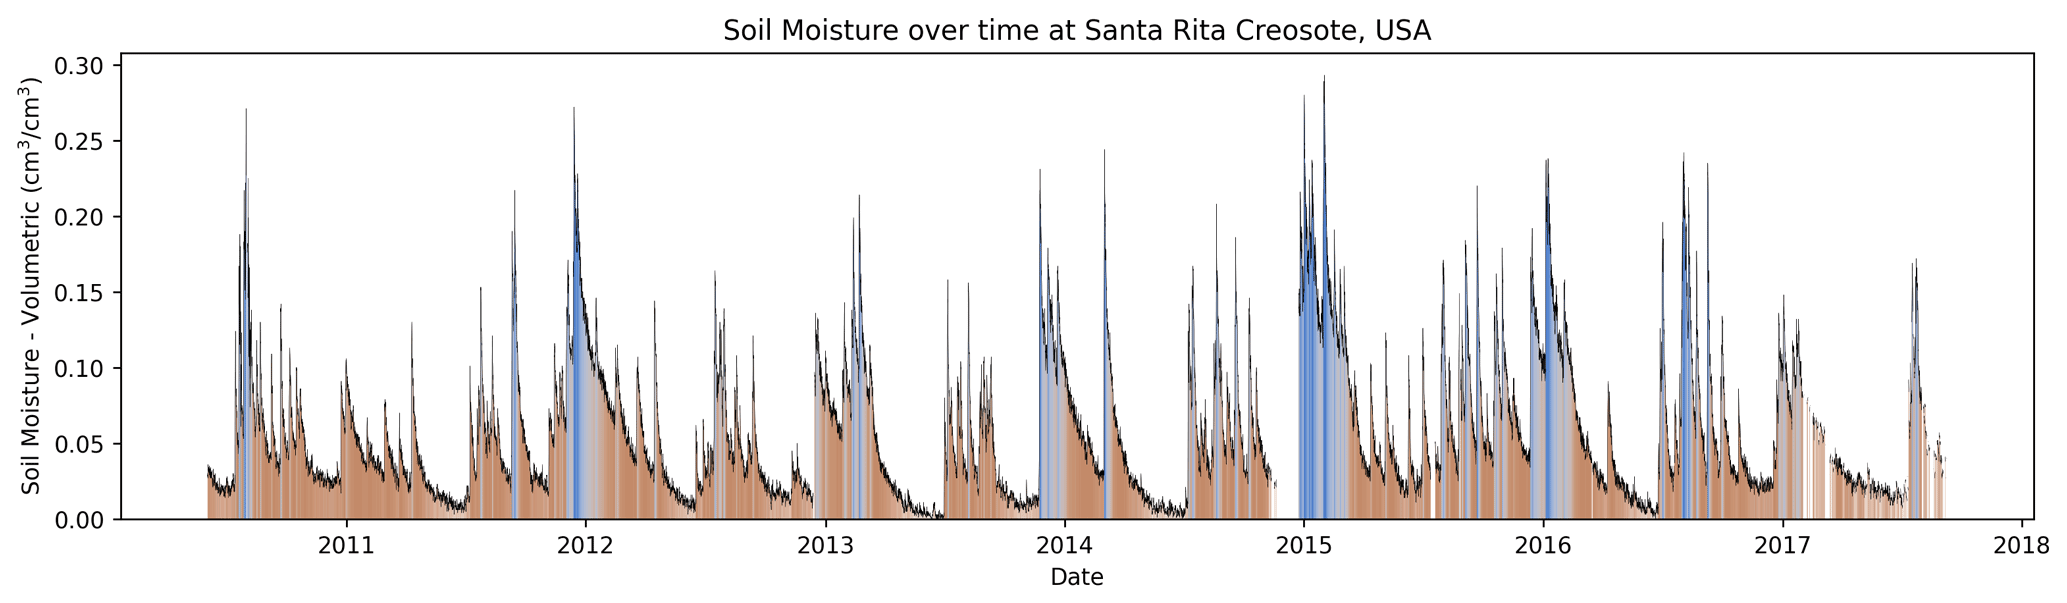
Figure B1Charts that take the fully corrected SM data and plot them over the entire time series are output automatically. Optional yearly plots are also possible. The colouring is used to visually see the difference between wet (dark blue) and dry (dark brown) periods (code is found in “graphical_functions.py” under the “colourts()” function).
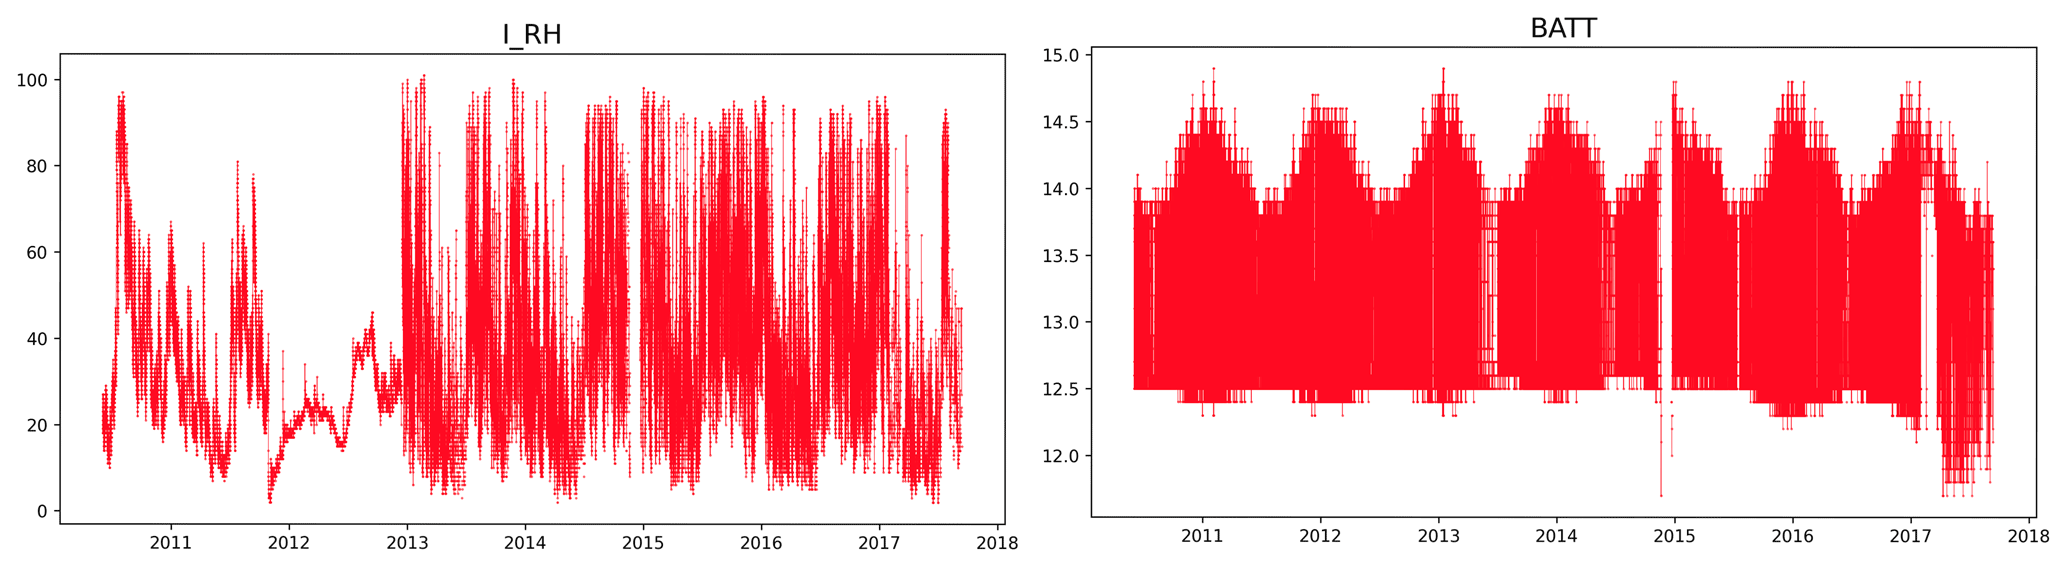
Figure B2Diagnostic plots that create time series of the data columns are generated. Here, two are presented (titles match variables from Table A4): I_RH is the internal relative humidity, and BATT is the battery voltage. These allow a user to quickly visually understand possible periods where more investigation is necessary. For example, the BATT variable begins to fall around 2017 which demonstrates an issue with the battery (right panel).
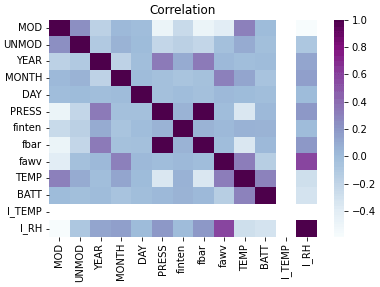
Figure B3A correlation heat map is generated during quality analysis. We would expect correlation between certain variables (such as fbar and PRESS), but other correlations may point towards issues with the sensor that require investigation.
The code discussed in this paper can be found at https://doi.org/10.5281/zenodo.5543669 (Power et al., 2021a). The GitHub repository where future updates will be uploaded can be found at https://github.com/danpower101/crspy (last access: 11 November 2021). Moreover, the GitHub repository includes a wiki page which goes into greater detail on how to run the package. We have also generated an example walk-through repository including example data that users can try, this can be found at https://doi.org/10.5281/zenodo.5719063 (Power et al., 2021b).
Raw CRNS data, including calibration data, are publicly available from several sources, including the US COSMOS network (http://cosmos.hwr.arizona.edu/, last access: 11 November 2021, Zreda et al., 2012, https://doi.org/10.5194/hess-16-4079-2012), the Australian CosmOz network (https://doi.org/10.25901/5e7ab81af0394, McJannet et al., 2021), and the UK-COSMOS network (https://doi.org/10.5285/b5c190e4-e35d-40ea-8fbe-598da03a1185, Stanley et al., 2021). We acknowledge the NMDB database (https://www.nmdb.eu, last access: 11 November 2021), founded under the European Union's FP7 programme (contract no. 213007), for providing neutron count data. ESA CCI data, including Above-Ground Biomass data (https://doi.org/10.5285/84403d09cef3485883158f4df2989b0c, Santoro and Cartus, 2021) and Land Cover data (ESA Land Cover CCI project team and Defourny, 2019, https://catalogue.ceda.ac.uk/uuid/b382ebe6679d44b8b0e68ea4ef4b701c, last access: 11 November 2021), are available from http://cci.esa.int/data (last access: 10 January 2021). The soil grids data are accessible online from https://soilgrids.org/ (last access: 11 November 2021, Poggio et al., 2021, https://doi.org/10.5194/soil-7-217-2021). The ERA5-Land data are provided by ECMWF and are available at https://doi.org/10.24381/cds.e2161bac (Muñoz Sabater, 2021). The flux tower data (ARM1) are available from https://doi.org/10.17190/AMF/1246027 (Biraud et al., 2021).
The supplement related to this article is available online at: https://doi.org/10.5194/gmd-14-7287-2021-supplement.
All authors were involved in the conceptualisation of this work. Data curation was undertaken by DD, SD, and DP. The investigation was carried out by DP, RR, and MAAR. Software was written by DP. The paper was primarily drafted by DP, and DP, RR, and MARR were responsible for writing the final article.
Two co-authors, Darin Desilets and Sharon Desilets, are also part of Hydroinnova LLC, which is the main manufacturer of cosmic-ray neutron sensors. However, their contribution to this study was fundamentally related to organising the database for multiple sites and providing the latest developments in high-energy incoming neutron corrections. Our paper does not evaluate nor compare the quality of the cosmic-ray sensor against other typical measurements of soil moisture, as the goal of this study was to address the need for a common data processing tool for the sensors, which is currently unavailable to the cosmic-ray neutron sensing community.
Publisher's note: Copernicus Publications remains neutral with regard to jurisdictional claims in published maps and institutional affiliations.
This work was funded by the Engineering and Physical Sciences Research Council (EPSRC) Water Informatics: Science and Engineering Centre for Doctoral Training (WISE-CDT; grant no. EP/L016214/1) with additional support from the Brazilian Experimental datasets for MUlti-Scale interactions in the critical zone under Extreme Drought (BEMUSED; grant no. NE/R004897/1) and the MOSAIC Digital Environment Feasibility Study (grant no. NE/T005645/1), both of which are funded by the Natural Environment Research Council (NERC). This work also received support from the International Atomic Energy Agency of the United Nations (IAEA/UN; project no. CRP D12014). Funding for the AmeriFlux data portal was provided by the U.S. Department of Energy's Office of Science.
We would also like to acknowledge GMD editor David Lawrence and three anonymous reviewers for their positive comments and very useful suggestions to improve this paper.
This research has been supported by the Engineering and Physical Sciences Research Council (grant no. EP/L016214/1), the Natural Environment Research Council (grant nos. NE/R004897/1 and NE/T005645/1), and the International Atomic Energy Agency (grant no. CRP D12014).
This paper was edited by David Lawrence and reviewed by three anonymous referees.
Alemohammad, S. H., Kolassa, J., Prigent, C., Aires, F., and Gentine, P.: Global downscaling of remotely sensed soil moisture using neural networks, Hydrol. Earth Syst. Sci., 22, 5341–5356, https://doi.org/10.5194/hess-22-5341-2018, 2018.
Araki, R. and McMillan, H. K.: Developing diagnostic signatures from in-situ soil moisture networks under different land-uses, in: American Geophysical Union, Fall Meeting 2020, American Geoscience Union, H195-0005, 2021.
Avery, W. A., Finkenbiner, C., Franz, T. E., Wang, T., Nguy-Robertson, A. L., Suyker, A., Arkebauer, T., and Muñoz-Arriola, F.: Incorporation of globally available datasets into the roving cosmic-ray neutron probe method for estimating field-scale soil water content, Hydrol. Earth Syst. Sci., 20, 3859–3872, https://doi.org/10.5194/hess-20-3859-2016, 2016.
Baatz, R., Bogena, H. R., Hendricks Franssen, H.-J., Huisman, J. A., Montzka, C., and Vereecken, H.: An empirical vegetation correction for soil water content quantification using cosmic ray probes, Water Resour. Res., 51, 2030–2046, https://doi.org/10.1002/2014WR016443, 2015.
Batjes, N. H., Ribeiro, E., and van Oostrum, A.: Standardised soil profile data to support global mapping and modelling (WoSIS snapshot 2019), Earth Syst. Sci. Data, 12, 299–320, https://doi.org/10.5194/essd-12-299-2020, 2020.
Bierkens, M. F. P., Bell, V. A., Burek, P., Chaney, N., Condon, L. E., David, C. H., de Roo, A., Döll, P., Drost, N., Famiglietti, J. S., Flörke, M., Gochis, D. J., Houser, P., Hut, R., Keune, J., Kollet, S., Maxwell, R. M., Reager, J. T., Samaniego, L., Sudicky, E., Sutanudjaja, E. H., van de Giesen, N., Winsemius, H., and Wood, E. F.: Hyper-resolution global hydrological modelling: What is next?: “Everywhere and locally relevant”, Invited Commentary, Hydrol. Process., 29, 310–320, https://doi.org/10.1002/hyp.10391, 2015.
Biraud, S., Fischer, M., Chan, S., and Torn, M.: AmeriFlux BASE US-ARM ARM Southern Great Plains site – Lamont, Ver. 11-5, AmeriFlux AMP [data set], https://doi.org/10.17190/AMF/1246027, 2021.
Bogena, H. R.: TERENO: German network of terrestrial environmental observatories, JLSRF, 2, A52, https://doi.org/10.17815/jlsrf-2-98, 2016.
Bonan, G. B.: Forests and climate change: Forcings, feedbacks, and the climate benefits of forests, Science, 320, 1444–1449, https://doi.org/10.1126/science.1155121, 2008.
Branger, F. and McMillan, H. K.: Deriving hydrological signatures from soil moisture data, Hydrol. Process., 34, 1410–1427, https://doi.org/10.1002/hyp.13645, 2020.
Chen, M., Zeng, C., Zhang, F., Kang, S., and Li, C.: Characteristics of Dissolved Organic Matter from a Transboundary Himalayan Watershed: Relationships with Land Use, Elevation, and Hydrology, ACS Earth Space Chem., 4, 449–456, https://doi.org/10.1021/acsearthspacechem.9b00329, 2020.
Cooper, H. M., Bennett, E., Blake, J., Blyth, E., Boorman, D., Cooper, E., Evans, J., Fry, M., Jenkins, A., Morrison, R., Rylett, D., Stanley, S., Szczykulska, M., Trill, E., Antoniou, V., Askquith-Ellis, A., Ball, L., Brooks, M., Clarke, M. A., Cowan, N., Cumming, A., Farrand, P., Hitt, O., Lord, W., Scarlett, P., Swain, O., Thornton, J., Warwick, A., and Winterbourn, B.: COSMOS-UK: national soil moisture and hydrometeorology data for environmental science research, Earth Syst. Sci. Data, 13, 1737–1757, https://doi.org/10.5194/essd-13-1737-2021, 2021.
Decker, M., Brunke, M. A., Wang, Z., Sakaguchi, K., Zeng, X., and Bosilovich, M. G.: Evaluation of the Reanalysis Products from GSFC, NCEP, and ECMWF Using Flux Tower Observations, J. Climate, 25, 1916–1944, https://doi.org/10.1175/jcli-d-11-00004.1, 2012.
Desilets, D.: Radius of influence for a cosmic-ray soil moisture probe: Theory and Monte Carlo simulations, Sandia National Laboratories, 2011.
Desilets, D.: Intensity correction factors for a cosmic ray neutron sensor, Zenodo [data set], https://doi.org/10.5281/ZENODO.4569062, 2021.
Desilets, D., Zreda, M., and Ferré, T. P. A.: Nature's neutron probe: Land surface hydrology at an elusive scale with cosmic rays, Water Resour. Res., 46, W11505, https://doi.org/10.1029/2009WR008726, 2010.
Dirmeyer, P. A., Wu, J., Norton, H. E., Dorigo, W. A., Quiring, S. M., Ford, T. W., Santanello, J. A., Bosilovich, M. G., Ek, M. B., Koster, R. D., Balsamo, G., and Lawrence, D. M.: Confronting weather and climate models with observational data from soil moisture networks over the United States, J. Hydrometeorol., 17, 1049–1067, https://doi.org/10.1175/JHM-D-15-0196.1, 2016.
Dobriyal, P., Qureshi, A., Badola, R., and Hussain, S. A.: A review of the methods available for estimating soil moisture and its implications for water resource management, J. Hydrol., 458–459, 110–117, https://doi.org/10.1016/j.jhydrol.2012.06.021, 2012.
Dong, J., Ochsner, T. E., Zreda, M., Cosh, H., and Zou, C. B.: Calibration and Validation of the COSMOS Rover for Surface Soil Moisture Measurement, Vadose Zone J., 1–8, vzj2013.08.0148, https://doi.org/10.2136/vzj2013.08.0148, 2014.
Dutta, R., Morshed, A., Aryal, J., Este, C. D., and Das, A.: Development of an intelligent environmental knowledge system for sustainable agricultural decision support, Environ. Modell. Softw., 52, 264–272, 2014.
Entekhabi, D., Njoku, E. G., O'Neill, P. E., Kellogg, K. H., Crow, W. T., Edelstein, W. N., Entin, J. K., Goodman, S. D., Jackson, T. J., Johnson, J., Kimball, J., Piepmeier, J. R., Koster, R. D., Martin, N., McDonald, K. C., Moghaddam, M., Moran, S., Reichle, R., Shi, J. C., Spencer, M. W., Thurman, S. W., Tsang, L., and Zyl, J. V.: The soil moisture active passive (SMAP) mission, P. IEEE, 98, 704–716, https://doi.org/10.1109/JPROC.2010.2043918, 2010.
ESA Land Cover CCI project team and Defourny, P.: ESA Land Cover Climate Change Initiative (Land_Cover_cci): Global Land Cover Maps, Version 2.0.7, Centre for Environmental Data Analysis [data set], available at: https://catalogue.ceda.ac.uk/uuid/b382ebe6679d44b8b0e68ea4ef4b701c (last access: 11 November 2021), 2019 (data available at: http://cci.esa.int/data, last access: 10 January 2021).
Evans, J. G., Ward, H. C., Blake, J. R., Hewitt, E. J., Morrison, R., Fry, M., Ball, L. A., Doughty, L. C., Libre, J. W., Hitt, O. E., Rylett, D., Ellis, R. J., Warwick, A. C., Brooks, M., Parkes, M. A., Wright, G. M. H., Singer, A. C., Boorman, D. B., Jenkins, A., Evans, J. G., Libre, J. W., Jenkins, A., Rylett, D., Singer, A. C., Warwick, A. C., Morrison, R., Ward, H. C., Ellis, R. J., Ball, L. A., Hewitt, E. J., Fry, M., Parkes, M. A., Boorman, D. B., Hitt, O. E., Brooks, M., Wright, G. M. H., and Doughty, L. C.: Soil water content in southern England derived from a cosmic-ray soil moisture observing system – COSMOS-UK, Hydrol. Process., 30, 4987–4999, https://doi.org/10.1002/hyp.10929, 2016.
Evaristo, J. and McDonnell, J. J.: A role for meta-analysis in hydrology, Hydrol. Process., 31, 3588–3591, https://doi.org/10.1002/hyp.11253, 2017.
Fang, B. and Lakshmi, V.: Soil moisture at watershed scale: Remote sensing techniques, J. Hydrol., 516, 258–272, https://doi.org/10.1016/j.jhydrol.2013.12.008, 2014.
Fersch, B., Francke, T., Heistermann, M., Schrön, M., Döpper, V., Jakobi, J., Baroni, G., Blume, T., Bogena, H., Budach, C., Gränzig, T., Förster, M., Güntner, A., Hendricks Franssen, H.-J., Kasner, M., Köhli, M., Kleinschmit, B., Kunstmann, H., Patil, A., Rasche, D., Scheiffele, L., Schmidt, U., Szulc-Seyfried, S., Weimar, J., Zacharias, S., Zreda, M., Heber, B., Kiese, R., Mares, V., Mollenhauer, H., Völksch, I., and Oswald, S.: A dense network of cosmic-ray neutron sensors for soil moisture observation in a highly instrumented pre-Alpine headwater catchment in Germany, Earth Syst. Sci. Data, 12, 2289–2309, https://doi.org/10.5194/essd-12-2289-2020, 2020.
Fontanet, M., Fernàndez-Garcia, D., and Ferrer, F.: The value of satellite remote sensing soil moisture data and the DISPATCH algorithm in irrigation fields, Hydrol. Earth Syst. Sci., 22, 5889–5900, https://doi.org/10.5194/hess-22-5889-2018, 2018.
Franz, T. E., Zreda, M., Rosolem, R., and Ferre, T. P. A.: Field Validation of a Cosmic-Ray Neutron Sensor Using a Distributed Sensor Network, Vadose Zone J., 11, vzj2012.0046, https://doi.org/10.2136/vzj2012.0046, 2012.
Franz, T. E., Wahbi, A., and Avery, W.: Estimation of Biomass Water Equivalent via the Cosmic Ray Neutron Sensor, in: Cosmic Ray Neutron Sensing: Estimation of Agricultural Crop Biomass Water Equivalent, Springer International Publishing, Cham, 25–32, https://doi.org/10.1007/978-3-319-69539-6_4, 2018.
Hands, A. D. P., Baird, F., Ryden, K. A., Dyer, C. S., Lei, F., Evans, J. G., Wallbank, J. R., Szczykulska, M., Rylett, D., Rosolem, R., Fowler, S., Power, D., and Henley, E. M.: Detecting Ground Level Enhancements Using Soil Moisture Sensor Networks, Adv. Space Res., 19, e2021SW002800, https://doi.org/10.1029/2021SW002800, 2021.
Hawdon, A., McJannet, D., and Wallace, J.: Calibration and correction procedures for cosmic-ray neutron soil moisture probes located across Australia, Water Resour. Res., 50, 5029–5043, https://doi.org/10.1002/2013WR015138, 2014.
Heidbüchel, I., Güntner, A., and Blume, T.: Use of cosmic-ray neutron sensors for soil moisture monitoring in forests, Hydrol. Earth Syst. Sci., 20, 1269–1288, https://doi.org/10.5194/hess-20-1269-2016, 2016.
Hengl, T., Jesus, J. M. D., Heuvelink, G. B. M., Gonzalez, M. R., Kilibarda, M., Blagotić, A., Shangguan, W., Wright, M. N., Geng, X., Bauer-Marschallinger, B., Guevara, M. A., Vargas, R., MacMillan, R. A., Batjes, N. H., Leenaars, J. G. B., Ribeiro, E., Wheeler, I., Mantel, S., and Kempen, B.: SoilGrids250m: Global gridded soil information based on machine learning, PLoS ONE, 12, e0169748, https://doi.org/10.1371/journal.pone.0169748, 2017.
Hersbach, H., Bell, B., Berrisford, P., Hirahara, S., Horányi, A., Muñoz-Sabater, J., Nicolas, J., Peubey, C., Radu, R., Schepers, D., Simmons, A., Soci, C., Abdalla, S., Abellan, X., Balsamo, G., Bechtold, P., Biavati, G., Bidlot, J., Bonavita, M., Chiara, G. D., Dahlgren, P., Dee, D., Diamantakis, M., Dragani, R., Flemming, J., Forbes, R., Fuentes, M., Geer, A., Haimberger, L., Healy, S., Hogan, R. J., Hólm, E., Janisková, M., Keeley, S., Laloyaux, P., Lopez, P., Lupu, C., Radnoti, G., de Rosnay, P., Rozum, I., Vamborg, F., Villaume, S., and Thépaut, J. N.: The ERA5 global reanalysis, Q. J. Roy. Meteor. Soc., 146, 1999–2049, https://doi.org/10.1002/qj.3803, 2020.
Iwema, J., Rosolem, R., Baatz, R., Wagener, T., and Bogena, H. R.: Investigating temporal field sampling strategies for site-specific calibration of three soil moisture–neutron intensity parameterisation methods, Hydrol. Earth Syst. Sci., 19, 3203–3216, https://doi.org/10.5194/hess-19-3203-2015, 2015.
Iwema, J., Rosolem, R., Rahman, M., Blyth, E., and Wagener, T.: Land surface model performance using cosmic-ray and point-scale soil moisture measurements for calibration, Hydrol. Earth Syst. Sci., 21, 2843–2861, https://doi.org/10.5194/hess-21-2843-2017, 2017.
Kerr, Y. H., Waldteufel, P., Wigneron, J. P., Martinuzzi, J. M., Font, J., and Berger, M.: Soil moisture retrieval from space: The Soil Moisture and Ocean Salinity (SMOS) mission, IEEE T. Geosci. Remote, 39, 1729–1735, https://doi.org/10.1109/36.942551, 2001.
Köhli, M., Schrön, M., Zreda, M., Schmidt, U., Dietrich, P., and Zacharias, S.: Footprint characteristics revised for field-scale soil moisture monitoring with cosmic-ray neutrons, Water Resour. Res., 51, 5772–5790, https://doi.org/10.1002/2015WR017169, 2015.
Köhli, M., Weimar, J., Schrön, M., Baatz, R., and Schmidt, U.: Soil Moisture and Air Humidity Dependence of the Above-Ground Cosmic-Ray Neutron Intensity, Front. Water, 2, 544847, https://doi.org/10.3389/frwa.2020.544847, 2021.
Koster, R. D., Dirmeyer, P. A., Guo, Z., Bonan, G., Chan, E., Cox, P., Gordon, C. T., Kanae, S., Kowalczyk, E., Lawrence, D., Liu, P., Lu, C.-H., Malyshev, S., McAvaney, B., Mitchell, K., Mocko, D., Oki, T., Oleson, K., Pitman, A., Sud, Y. C., Taylor, C. M., Verseghy, D., Vasic, R., Xue, Y., Yamada, T., and Team, G.: Regions of Strong Coupling Between Soil Moisture and Precipitation, Science, 305, 1138–1140, https://doi.org/10.1126/science.1100217, 2004.
Li, W., MacBean, N., Ciais, P., Defourny, P., Lamarche, C., Bontemps, S., Houghton, R. A., and Peng, S.: Gross and net land cover changes in the main plant functional types derived from the annual ESA CCI land cover maps (1992–2015), Earth Syst. Sci. Data, 10, 219–234, https://doi.org/10.5194/essd-10-219-2018, 2018.
McJannet, D., Hawdon, A., Baker, B., Renzullo, L., and Searle, R.: Multiscale soil moisture estimates using static and roving cosmic-ray soil moisture sensors, Hydrol. Earth Syst. Sci., 21, 6049–6067, https://doi.org/10.5194/hess-21-6049-2017, 2017.
McJannet, D., Stenson, M., Sommer, A., and Hawdon, A.: CosmOz – The Australian Cosmic-ray Soil Moisture Sensor Network, Version 1.0.0, Terrestrial Ecosystem Research Network (TERN) [data set], https://doi.org/10.25901/5e7ab81af0394, 2021.
Muñoz Sabater, J.: ERA5-Land hourly data from 1981 to present, Copernicus Climate Change Service (C3S) Climate Data Store (CDS) [data set], https://doi.org/10.24381/cds.e2161bac, 2019.
Muñoz Sabater, J.: ERA5-Land hourly data from 1950 to 1980, Copernicus Climate Change Service (C3S) Climate Data Store (CDS) [data set], https://doi.org/10.24381/cds.e2161bac, 2021.
Peel, M. C., Finlayson, B. L., and McMahon, T. A.: Updated world map of the Köppen-Geiger climate classification, Hydrol. Earth Syst. Sci., 11, 1633–1644, https://doi.org/10.5194/hess-11-1633-2007, 2007.
Poggio, L., Sousa, L. M. de, Batjes, N. H., Heuvelink, G. B. M., Kempen, B., Ribeiro, E., and Rossiter, D.: SoilGrids 2.0: producing soil information for the globe with quantified spatial uncertainty, Soil, 7, 217–240, https://doi.org/10.5194/soil-7-217-2021, 2021 (data available at: https://soilgrids.org/, last access: 11 November 2021).
Portal, G., Jagdhuber, T., Vall-llossera, M., Camps, A., Pablos, M., Entekhabi, D., and Piles, M.: Assessment of multi-scale SMOS and SMAP soil moisture products across the Iberian Peninsula, Remote Sens., 12, 570, https://doi.org/10.3390/rs12030570, 2020.
Power, D., Rico-Ramirez, M. A., Desilets, S., Desilets, D., and Rosolem, R.: crspy: v1.2.1, v1.2.1, Zenodo [code], https://doi.org/10.5281/zenodo.5543669, 2021a.
Power, D., Rico-Ramirez, M. A., Desilets, S., Desilets, D., and Rosolem, R.: crspy_example: v1.2.2, v1.2.2, Zenodo [code], https://doi.org/10.5281/zenodo.5719063, 2021b.
Rivera Villarreyes, C. A., Baroni, G., and Oswald, S. E.: Integral quantification of seasonal soil moisture changes in farmland by cosmic-ray neutrons, Hydrol. Earth Syst. Sci., 15, 3843–3859, https://doi.org/10.5194/hess-15-3843-2011, 2011.
Rosolem, R., Shuttleworth, W. J., Zreda, M., Franz, T. E., Zeng, X., and Kurc, S. A.: The effect of atmospheric water vapor on neutron count in the cosmic-ray soil moisture observing system, J. Hydrometeorol., 14, 1659–1671, 2013.
Rosolem, R., Hoar, T., Arellano, A., Anderson, J. L., Shuttleworth, W. J., Zeng, X., and Franz, T. E.: Translating aboveground cosmic-ray neutron intensity to high-frequency soil moisture profiles at sub-kilometer scale, Hydrol. Earth Syst. Sci., 18, 4363–4379, https://doi.org/10.5194/hess-18-4363-2014, 2014.
Santoro, M. and Cartus, O.: ESA Biomass Climate Change Initiative (Biomass_cci): Global datasets of forest above-ground biomass for the year 2017, v1, Centre for Environmental Data Analysis [data set], https://doi.org/10.5285/BEDC59F37C9545C981A839EB552E4084, 2019.
Santoro, M. and Cartus, O.: ESA Biomass Climate Change Initiative (Biomass_cci): Global datasets of forest above-ground biomass for the years 2010, 2017 and 2018, v2, Centre for Environmental Data Analysis [data set], https://doi.org/10.5285/84403d09cef3485883158f4df2989b0c, 2021 (data available at: http://cci.esa.int/data, last access: 10 January 2021).
Schlesinger, W. H., Dietze, M. C., Jackson, R. B., Phillips, R. P., Rhoades, C. C., Rustad, L. E., and Vose, J. M.: Forest biogeochemistry in response to drought, Glob. Change Biol., 22, 2318–2328, https://doi.org/10.1111/gcb.13105, 2016.
Schrön, M., Köhli, M., Scheiffele, L., Iwema, J., Bogena, H. R., Lv, L., Martini, E., Baroni, G., Rosolem, R., Weimar, J., Mai, J., Cuntz, M., Rebmann, C., Oswald, S. E., Dietrich, P., Schmidt, U., and Zacharias, S.: Improving calibration and validation of cosmic-ray neutron sensors in the light of spatial sensitivity, Hydrol. Earth Syst. Sci., 21, 5009–5030, https://doi.org/10.5194/hess-21-5009-2017, 2017.
Shuttleworth, J., Rosolem, R., Zreda, M., and Franz, T.: The COsmic-ray Soil Moisture Interaction Code (COSMIC) for use in data assimilation, Hydrol. Earth Syst. Sci., 17, 3205–3217, https://doi.org/10.5194/hess-17-3205-2013, 2013.
Stanley, S., Antoniou, V., Askquith-Ellis, A., Ball, L. A., Bennett, E. S., Blake, J. R., Boorman, D. B., Brooks, M., Clarke, M., Cooper, H. M., Cowan, N., Cumming, A., Evans, J. G., Farrand, P., Fry, M., Hitt, O. E., Lord, W. D., Morrison, R., Nash, G. V., Rylett, D., Scarlett, P. M., Swain, O. D., Szczykulska, M., Thornton, J. L., Trill, E. J., Warwick, A. C., and Winterbourn, B.: Daily and sub-daily hydrometeorological and soil data (2013–2019) [COSMOS-UK], NERC Environmental Information Data Centre [data set], https://doi.org/10.5285/b5c190e4-e35d-40ea-8fbe-598da03a1185, 2021.
Tian, Z., Li, Z., Liu, G., Li, B., and Ren, T.: Soil water content determination with cosmic-ray neutron sensor: Correcting aboveground hydrogen effects with thermal/fast neutron ratio, J. Hydrol., 540, 923–933, https://doi.org/10.1016/j.jhydrol.2016.07.004, 2016.
Van Loon, A. F..: Hydrological drought explained, WIREs Water, 2, 359–392, https://doi.org/10.1002/wat2.1085, 2015.
Vather, T., Everson, C. S., and Franz, T. E.: The applicability of the cosmic ray neutron sensor to simultaneously monitor soil water content and biomass in an acacia mearnsii forest, Hydrology, 7, 48, https://doi.org/10.3390/HYDROLOGY7030048, 2020.
Vuichard, N. and Papale, D.: Filling the gaps in meteorological continuous data measured at FLUXNET sites with ERA-Interim reanalysis, Earth Syst. Sci. Data, 7, 157–171, https://doi.org/10.5194/essd-7-157-2015, 2015.
Wagener, T., Sivapalan, M., Troch, P., and Woods, R.: Catchment Classification and Hydrologic Similarity, Geography Compass, 1, 901–931, https://doi.org/10.1111/j.1749-8198.2007.00039.x, 2007.
Wagener, T., Gleeson, T., Coxon, G., Hartmann, A., Howden, N., Pianosi, F., Rahman, M., Rosolem, R., Stein, L., and Woods, R.: On doing hydrology with dragons: Realizing the value of perceptual models and knowledge accumulation, WIRES Water, 8, e1550, https://doi.org/10.1002/wat2.1550, 2021.
Western, A. W., Grayson, R. B., Blöschl, G., Willgoose, G. R., and McMahon, T. A.: Observed spatial organization of soil moisture and its relation to terrain indices, Water Resour. Res., 35, 797–810, https://doi.org/10.1029/1998WR900065, 1999.
Wood, E. F., Roundy, J. K., Troy, T. J., van Beek, L. P. H., Bierkens, M. F. P., Blyth, E., de Roo, A., Döll, P., Ek, M., Famiglietti, J., Gochis, D., van de Giesen, N., Houser, P., Jaffé, P. R., Kollet, S., Lehner, B., Lettenmaier, D. P., Peters-Lidard, C., Sivapalan, M., Sheffield, J., Wade, A., and Whitehead, P.: Hyperresolution global land surface modeling: Meeting a grand challenge for monitoring Earth's terrestrial water, Water Resour. Res., 47, W05301, https://doi.org/10.1029/2010WR010090, 2011.
Zacharias, S., Bogena, H., Samaniego, L., Mauder, M., Fuß, R., Pütz, T., Frenzel, M., Schwank, M., Baessler, C., Butterbach-Bahl, K., Bens, O., Borg, E., Brauer, A., Dietrich, P., Hajnsek, I., Helle, G., Kiese, R., Kunstmann, H., Klotz, S., Munch, J. C., Papen, H., Priesack, E., Schmid, H. P., Steinbrecher, R., Rosenbaum, U., Teutsch, G., and Vereecken, H.: A Network of Terrestrial Environmental Observatories in Germany, Vadose Zone J., 10, 955–973, https://doi.org/10.2136/vzj2010.0139, 2011.
Zhuo, L., Dai, Q., Han, D., Chen, N., Zhao, B., and Berti, M.: Evaluation of Remotely Sensed Soil Moisture for Landslide Hazard Assessment, IEEE J. Sel. Top. Appl., 12, 162–173, https://doi.org/10.1109/JSTARS.2018.2883361, 2019.
Zreda, M., Desilets, D., Ferré, T. P. A., and Scott, R. L.: Measuring soil moisture content non-invasively at intermediate spatial scale using cosmic-ray neutrons, Geophys. Res. Lett., 35, L21402, https://doi.org/10.1029/2008GL035655, 2008.
Zreda, M., Shuttleworth, W. J., Zeng, X., Zweck, C., Desilets, D., Franz, T., and Rosolem, R.: COSMOS: the COsmic-ray Soil Moisture Observing System, Hydrol. Earth Syst. Sci., 16, 4079–4099, https://doi.org/10.5194/hess-16-4079-2012 (data available at: http://cosmos.hwr.arizona.edu/, last access: 11 November 2021).
- Abstract
- Context and background
- The crspy tool
- Discussion
- Future direction
- Summary
- Appendix A: Tables to describe variables' names and outputs
- Appendix B: Examples of standard outputs of crspy
- Code availability
- Data availability
- Author contributions
- Competing interests
- Disclaimer
- Acknowledgements
- Financial support
- Review statement
- References
- Supplement