the Creative Commons Attribution 4.0 License.
the Creative Commons Attribution 4.0 License.
 | 11 Nov 2021
Turbidity maximum zone index: a novel model for remote extraction of the turbidity maximum zone in different estuaries
Chongyang Wang
Li Wang
Danni Wang
Dan Li
Chenghu Zhou
Hao Jiang
Qiong Zheng
Shuisen Chen
Kai Jia
Yangxiaoyue Liu
Ji Yang
Xia Zhou
Yong Li
An efficient recognition and extraction of the estuarine turbidity maximum zone (TMZ) is important for studying terrestrial hydrological processes. Although many studies relevant to the TMZ have been conducted worldwide, the extraction methods and criteria used to describe the TMZ vary significantly both spatially and temporally. To improve the applicability of the methods adopted in previous studies and to develop a novel model to accurately extract the TMZ in multiple estuaries and different seasons from remote-sensing imageries, this study estimated the total suspended solid (TSS) and chlorophyll a (Chl a) concentrations in three estuaries. These were the Pearl River estuary (PRE), the Hanjiang River estuary (HRE), and the Moyangjiang River estuary (MRE) of Guangdong Province, China. The spatial distribution characteristics of the TSS and Chl a concentrations were analyzed. A nearly opposite association was found between the TSS and Chl a concentrations in the three estuaries, particularly in the PRE. The regions with high (low) TSS concentrations had relatively low (high) Chl a concentrations and, therefore, a turbidity maximum zone index (TMZI), defined as the ratio of the difference and sum of the logarithmic transformation of the TSS and Chl a concentrations, was firstly proposed. By calculating the TMZI values in the PRE on 20 November 2004 (low-flow season), it was found that the criterion TMZI>0.2 could be used to identify the TMZs of the PRE effectively. The TMZ extraction results were generally consistent with the visual-interpretation results. The area-based accuracy measures showed that the quality (Q) of the extraction reached 0.8429. The same criterion was applied in the PRE on 18 October 2015 (high-flow season), and high accuracy and consistency across seasons were observed (Q=0.8171). The western shoal of the PRE was the main distribution area of TMZs. Extracting TMZs by the newly proposed index performed well in different estuaries and on different dates (HRE on 13 August 2008 in the high-flow season and MRE on 6 December 2013 in the low-flow season). Compared to the previous fixed threshold of TSS or turbidity methods, extracting the TMZ using the TMZI had higher accuracy and better applicability (Q: 0.1046–0.4770 vs. 0.8171–0.8429). Evidently, this unified TMZI is potentially an optimized method for the global monitoring and extraction of TMZs of estuaries from different satellite remote-sensing imageries. It can be used to help the understanding of the spatial and temporal variation in TMZs and estuarine processes at regional and global scales as well as improve the management and sustainable development of regional society and the natural environment.
- Article
(26139 KB) - Full-text XML
- BibTeX
- EndNote


The turbidity maximum zone (TMZ) is the dynamic turbid water area within an estuary where the suspended solid concentrations, namely, sediment and matter, are consistently and significantly higher than landwards and seawards (Shen, 1995; Gebhardt et al., 2005; Yu et al., 2014; Li et al., 2019). It is a special phenomenon of suspended sediment movement and migration in estuaries worldwide (Schubel, 1968; Shi et al., 1993; Mitchell et al., 2012; Wang et al., 2021). The spatial distributions and dynamic changes in TMZs not only have a deep and wide impact on the formation and development of estuary morphology, channels, shoals, and sandbars (Asp et al., 2018; Azhikodan and Yokoyama, 2019; Li et al., 2019) but also significantly affect the physics and geochemical and biogeochemical processes of natural estuarine environments as well as social production activities (Gebhardt et al., 2005; Jalón-Rojas et al., 2016; Kitheka et al., 2016; Toublanc et al., 2016; Yan et al., 2020). The TMZ has long been a popular area for scientific study and engineering innovations among researchers, government agencies, engineering corporations, and communities (Shen et al., 2001; Shi et al., 2017; Jiang et al., 2019; Wang et al., 2021).
Previous studies have examined the TMZ from various aspects based on different data resources and methods, such as the characteristics and dynamics of total suspended solid (TSS) concentrations in the TMZ (Yang et al., 2014; Wan and Wang, 2017; Grasso et al., 2018), the mechanisms and formation of the TMZ (Brenon and Hir, 1999; Wai et al., 2004; Yu et al., 2014; Toublanc et al., 2016), the location, distribution, and change in the TMZ across time (Jiang et al., 2013; Jalón-Rojas et al., 2016; Li et al., 2019; Yan et al., 2020), the interaction with other factors, and its long-term trend (Gebhardt et al., 2005; Chen et al., 2016; Li et al., 2019). The location of the TMZ in an estuary is a fundamental question and an important aspect of studying the TMZ. It was found that there were two major ways to obtain the locations and distributions of TMZs (Wang et al., 2021). One was a relatively approximate description, such as TMZ locations corresponding to the front of the salinity wedge and moving range of stagnation points, or a distance from coastlines (Feng et al., 2002; Mitchell, 2013; Kitheka et al., 2016; Liu et al., 2016; Toublanc et al., 2016; Gong et al., 2017; Zhang et al., 2019; Yan et al., 2020). The other was a relatively quantitative result. The thresholds of TSS concentrations or turbidity criteria were used to extract the distribution of TMZs (Jiang et al., 2013; Yang and Liu, 2015; Chen et al., 2016; Jalón-Rojas et al., 2016; Shi et al., 2017; Li et al., 2019). However, the fixed threshold method has potential drawbacks. It is a challenging task to precisely generate TMZ extraction results at different times using a fixed threshold of TSS concentration because TSS concentrations showed significant variations in different seasons. Moreover, the threshold values are difficult to transfer from local regions to other regions because research and a scientific basis are lacking. The threshold method and criteria vary significantly in different estuaries, in different regions of the same estuary, in the same estuary at different times, and in different studies, demonstrating considerable subjectivity. The results were not comparable (Wang et al., 2021).
TSS concentrations in the TMZs and adjacent waters vary significantly (Uncles et al., 2000; Park et al., 2008; Mitchell, 2013; Wang et al., 2018). Many studies have shown that suspended solids can affect the growth of chlorophyll a (Chl a) through absorption and sunlight scattering in water (Pozdnyakov et al., 2005; Chen et al., 2015; Montanher et al., 2014; Wang et al., 2017a, 2020b). Therefore, it was concluded that there is a relationship between TSS concentrations and Chl a concentrations and different characteristics in the TMZ and normal water bodies in estuaries. This relationship might be used to overcome the drawbacks of previous methods of extracting the TMZ and to distinguish and recognize the TMZ effectively.
Based on this analysis, the objectives of this study are to propose a new model with better adaptability and robustness for distinguishing and extracting the TMZ in different estuaries and in different seasons. To achieve this goal, the TSS and Chl a concentrations in the Pearl River estuary (PRE), Hanjiang River estuary (HRE), and Moyangjiang River estuary (MRE) were first estimated. The different spatial characteristics were analyzed and compared. Subsequently, the corresponding relationship and special features of TSS and Chl a concentrations were used to develop a turbidity maximum zone index (TMZI). Finally, the TMZs in these estuaries were extracted at different times by the model (TMZI) and validated and assessed for accuracy.
The remainder of this paper is organized as follows. The study areas, in situ data, satellite imagery, TSS concentration data, Chl a retrieval model, and its calibration and validation are described in Sect. 2, as are the TMZ extraction accuracy assessment measures. The spatial analysis of TSS concentration, Chl a concentration, and the corresponding relationship between them are presented in Sect. 3.1. The establishment of the TMZI and its application and assessment in different estuaries and at different times are shown in Sect. 3.2–3.5. The summary and conclusions are presented in Sect. 4.
2.1 Study areas
The study areas include the Pearl, Hanjiang, and Moyangjiang River estuaries of Guangdong Province, South China (Figs. 1, 4, and 7–10). The PRE (horn-shaped) is located between longitudes 113.45–114.2∘ E and latitudes 22.25–22.85∘ N, mainly in the core zone of the Guangdong–Hong Kong–Macao Greater Bay Area. The HRE (fork-shaped) is located between longitudes 116.6–117∘ E and latitudes 23.2–23.6∘ N, mainly in Shantou city, Eastern Guangdong Province. The MRE (calabash-shaped) is located between longitudes 111.9–112.3∘ E and latitudes 21.66–21.8∘ N, mainly in Yangjiang city, Western Guangdong Province.
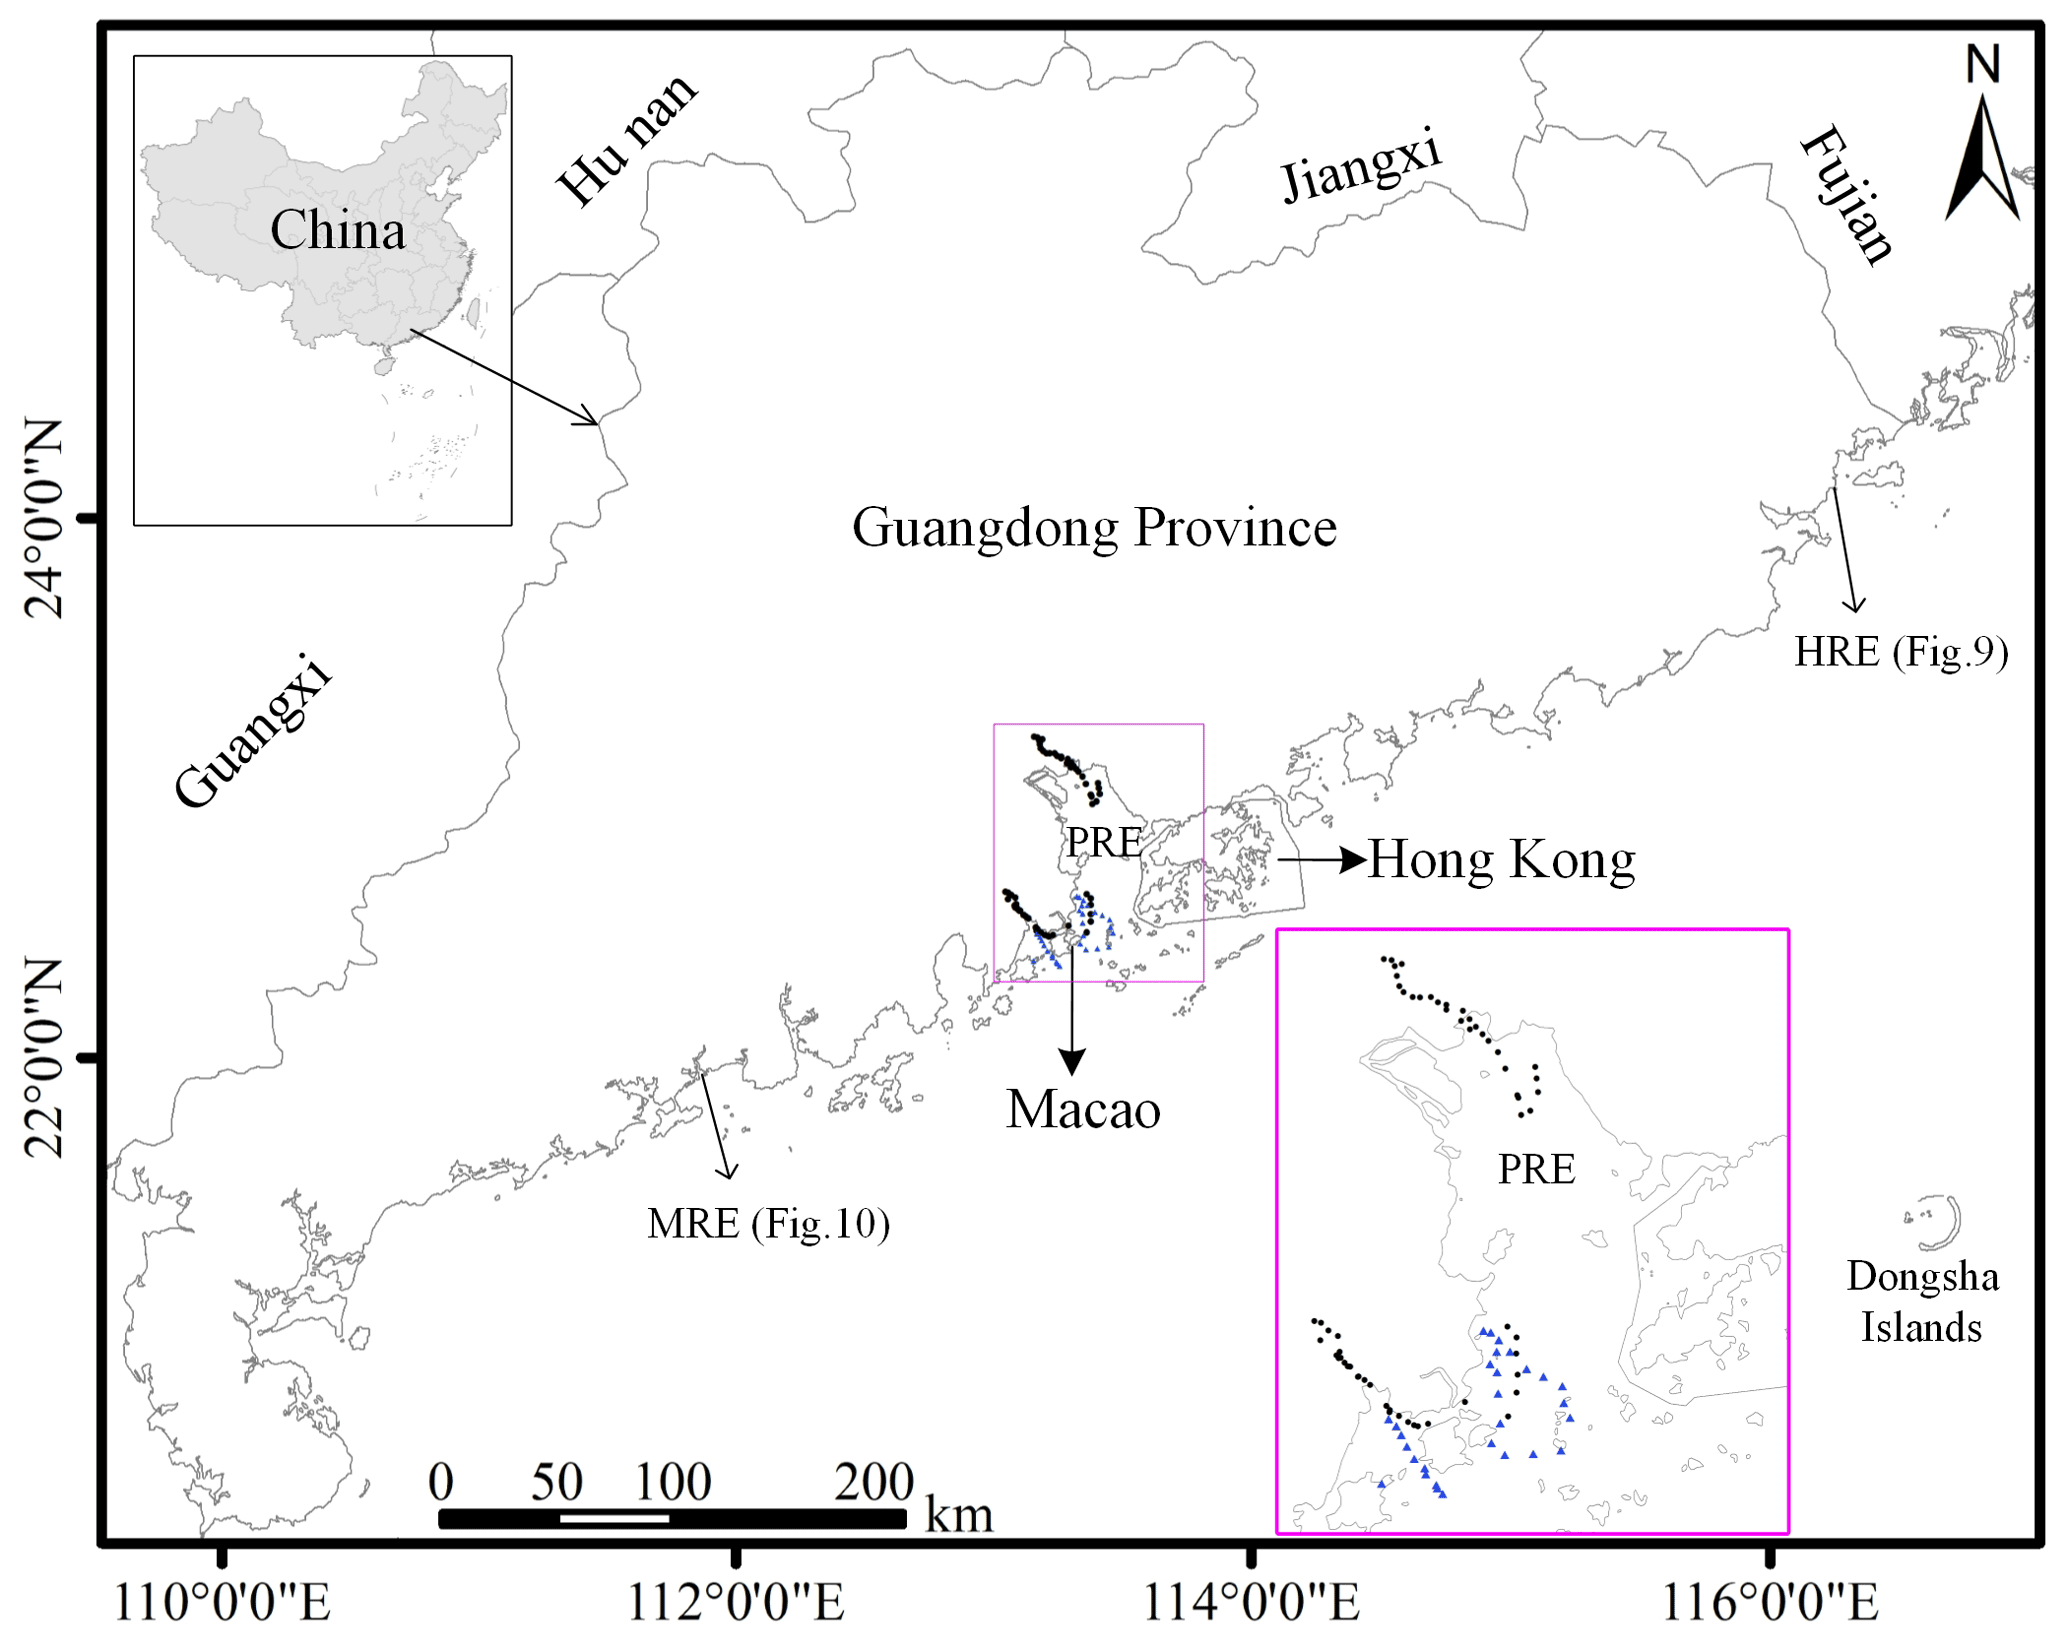
Figure 1Study areas (PRE, HRE, and MRE) and the locations of the in situ data indicated by black dots and blue triangles.
The Pearl River has the second largest annual runoff and is the third largest river in China. The Hanjiang and Moyangjiang rivers are the second and third largest rivers in Guangdong Province (Chen et al., 2011; Wang et al., 2018, 2020a). Previous studies have reported that the sediment loads of the Pearl, Hanjiang, and Moyangjiang rivers were 7.53×10⁷, 6.93×10⁶, and 3.27×10⁵ t yr−1, respectively (Wang et al., 2017a, b, 2020a). It was found that the three rivers and estuaries have different characteristics, and much associated research has been conducted in these regions for a long time.
2.2 In situ and satellite data
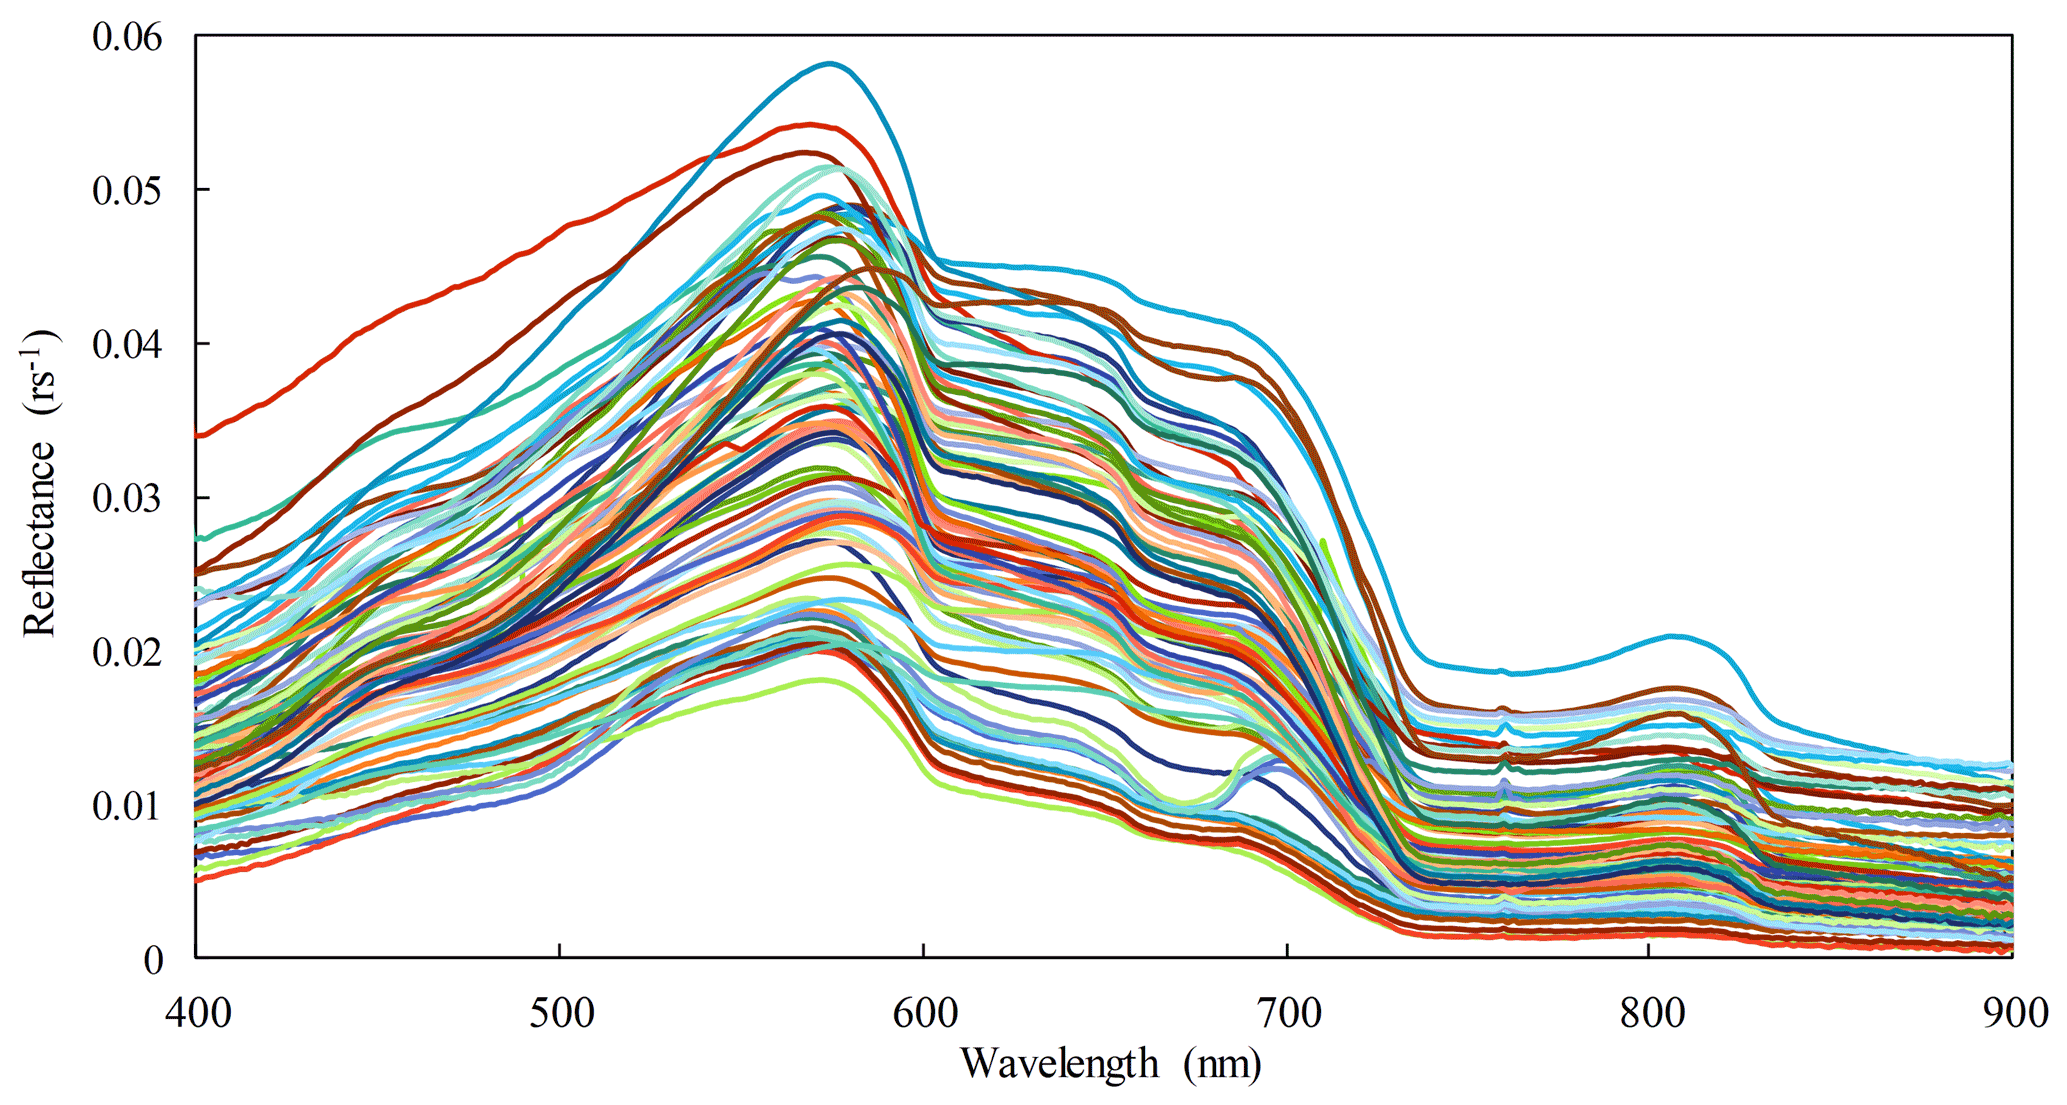
The 89 in situ samples, including water surface reflectance and Chl a concentrations, were collected from the PRE (Figs. 1 and 2, Table 1). Sixty of these samples were also used in a previous study by the current authors (black dots) (Chen et al., 2011). The present study included 29 new samples (blue triangles). Here, these samples were used to recalibrate and validate a Landsat-based Chl a concentration retrieval model.
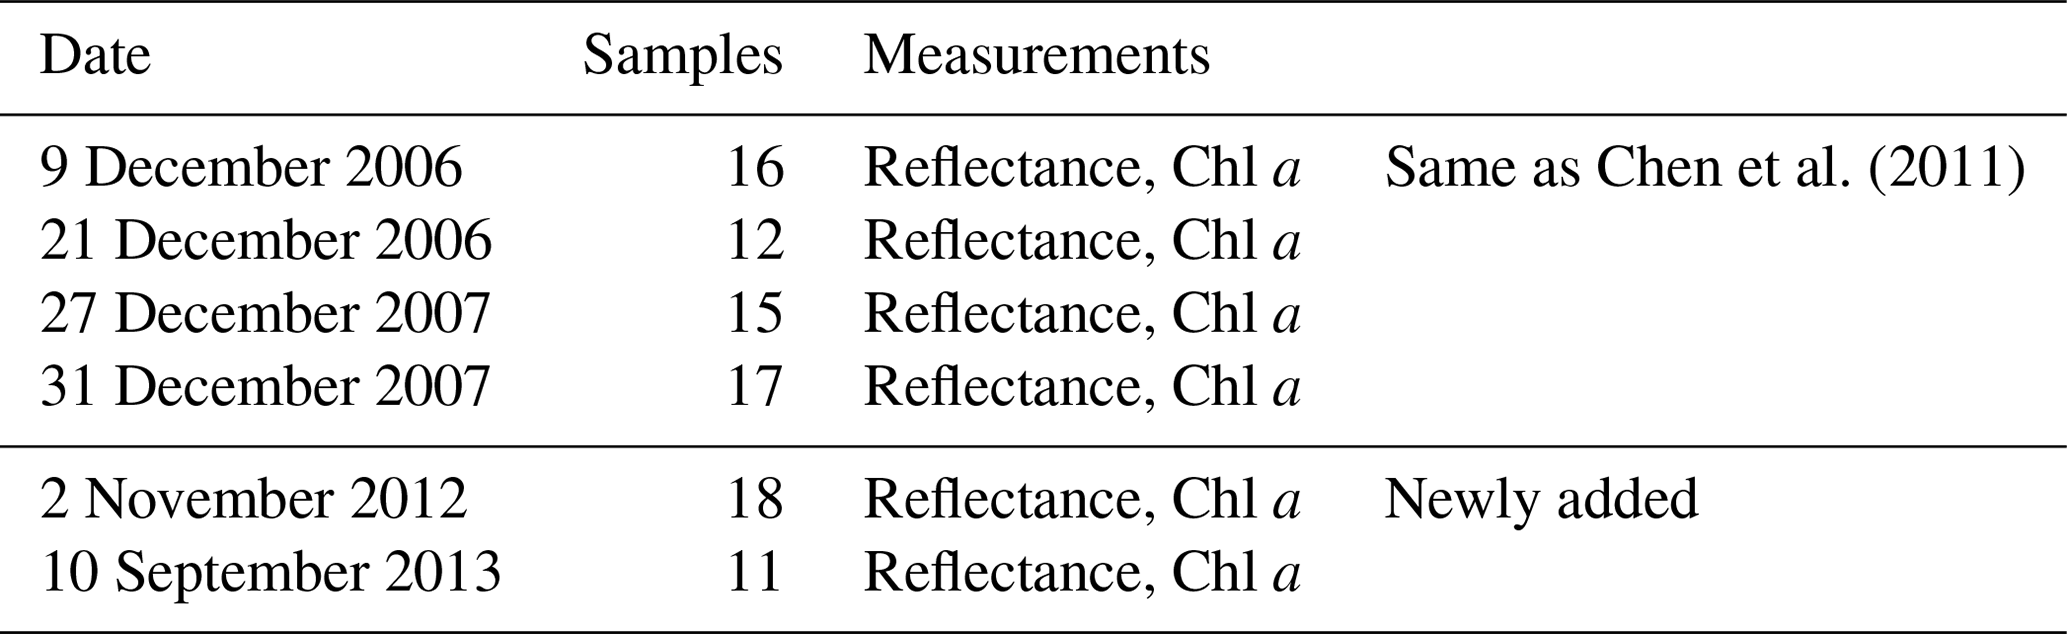
In addition, four scenes of good-quality Landsat imageries were used. Two images from TM and OLI () were captured on 20 November 2004 (product ID: LT05_L1TP_122044_20041120_20161129_01_T1) and 18 October 2015 (LC08_L1TP_122044_20151018_20170403_01_T1), respectively, covering the PRE (Figs. 7a and 8c). A further image from TM () was captured on 13 August 2008 (LT05_L1TP_120044_20080813_20161030_01_T1), covering the HRE (Fig. 9c). The final image from OLI () was captured on 6 December 2013 (LC08_L1TP_123045_20131206_20170428_01_T1), covering the MRE (Fig. 10c).
2.3 Total suspended solid data and chlorophyll a data
The aim of this study was to establish and develop a new model (TMZI) based on TSS concentrations and Chl a concentrations and further extract TMZs in three estuaries of Guangdong Province. Therefore, the TSS and Chl a concentrations in the study areas were first calculated. The TSS concentration data were obtained from previous work by the current authors (Wang et al., 2017a, b, 2018, 2020a). The corresponding Chl a data required retrieval using Landsat imagery. Consequently, a Landsat-based Chl a concentration retrieval model was expected to be suitable for different estuaries. Many models have been developed to estimate Chl a concentration from different remote-sensing data (Gregg and Casey, 2004; Chen et al., 2011; Kim et al., 2016a, b; Attila et al., 2018). Following the features and forms of some typical chlorophyll a retrieval models (Le et al., 2009, 2013; Chen et al., 2011; Song et al., 2013), a three-band Landsat-based chlorophyll a model using the 89 in situ samples was recalibrated and validated (Fig. 3; Eq. 1). The model, based on Landsat TM and OLI sensors, explained approximately 80 % of the Chl a concentration variation (Chl a: 1.92–92.6 mg m−3, N=60, P-value < 0.01) and had an acceptable validation accuracy (Chl a: 2.33–36.8 mg m−3, , N=29).
where R1, R2, and R3 represent the blue, green, and red band of the TM and OLI sensors, respectively. The parameters a and b corresponding to the TM and OLI sensors are 0.008907, 2.308593 and 0.00765, 2.353329, respectively. The unit of chlorophyll a concentration is in mg m−3.
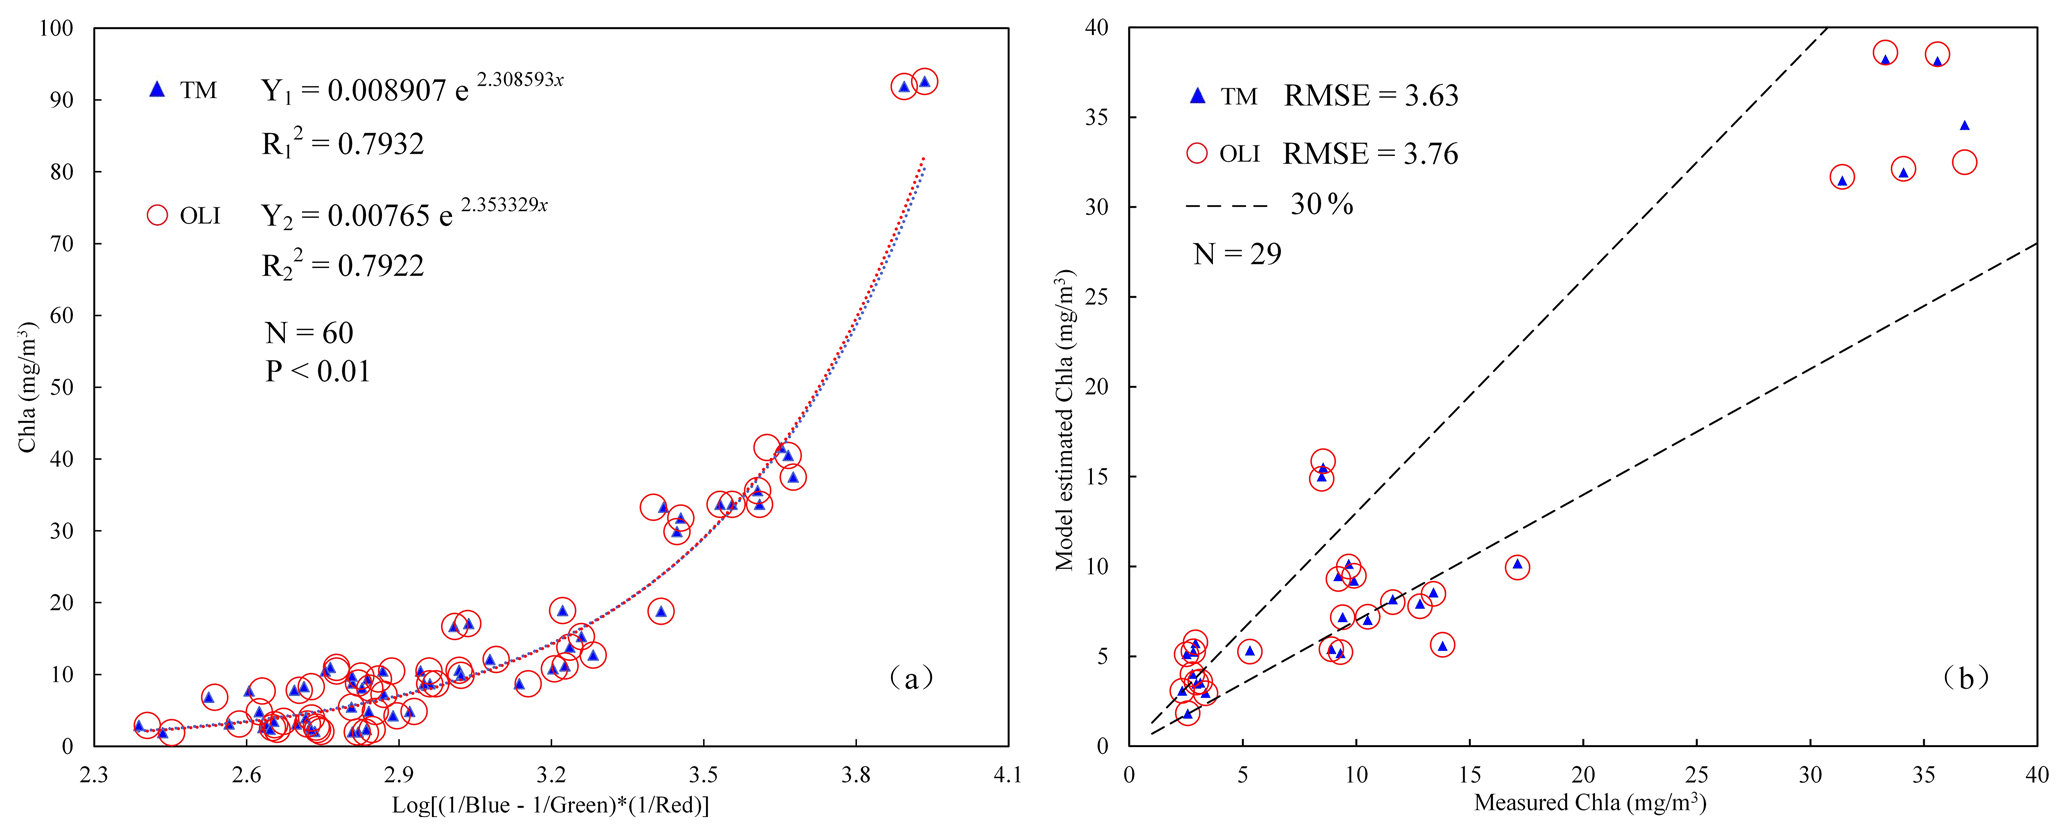
Figure 3The calibration (a) and validation (b) results of the Chl a retrieval models based on 89 in situ data for Landsat sensors.
2.4 Accuracy assessment measures
To evaluate TMZI extraction accuracy and compare the performances of the different methods, the common accuracy measures of object recognition in remote-sensing, area-based accuracy measures (Cai et al., 2018), were used.
Suppose that AE is the area of the extracted TMZ, AC is the correct part of AE, and AR is the reference TMZ. Then the quality (Q) of the TMZ extraction results in the study could be defined as follows (Eq. 2).
The range of Q is 0 to 1. The bigger the Q value, the higher the accuracy of the TMZ extraction results and the better the performance of the method.
3.1 The spatial characteristics of TSS and Chl a concentrations in estuaries
Chl a concentrations in each estuary were estimated using the Chl a concentration retrieval model that was developed (Fig. 3). The different spatial distribution characteristics of the TSS and Chl a concentrations were analyzed. Taking the PRE as an example, TSS concentrations in the low-flow season of the PRE (20 November 2004) have a large variation ranging from 1.37 to more than 200 mg L−1 (Fig. 4a). Due to the strong interaction between runoff and tide, the main region of high TSS concentrations is in the west shoal of the PRE (Wang et al., 2018), where concentrations of more than 100 mg L−1 were frequently found. In addition, TSS concentrations in parts of the east shoal and waters adjacent to Neilingding Island were also relatively higher. The other areas of the PRE have low TSS concentrations, where the maximum value is generally not more than 40 mg L−1, particularly in the Hong Kong coastal water bodies (Fig. 4a).
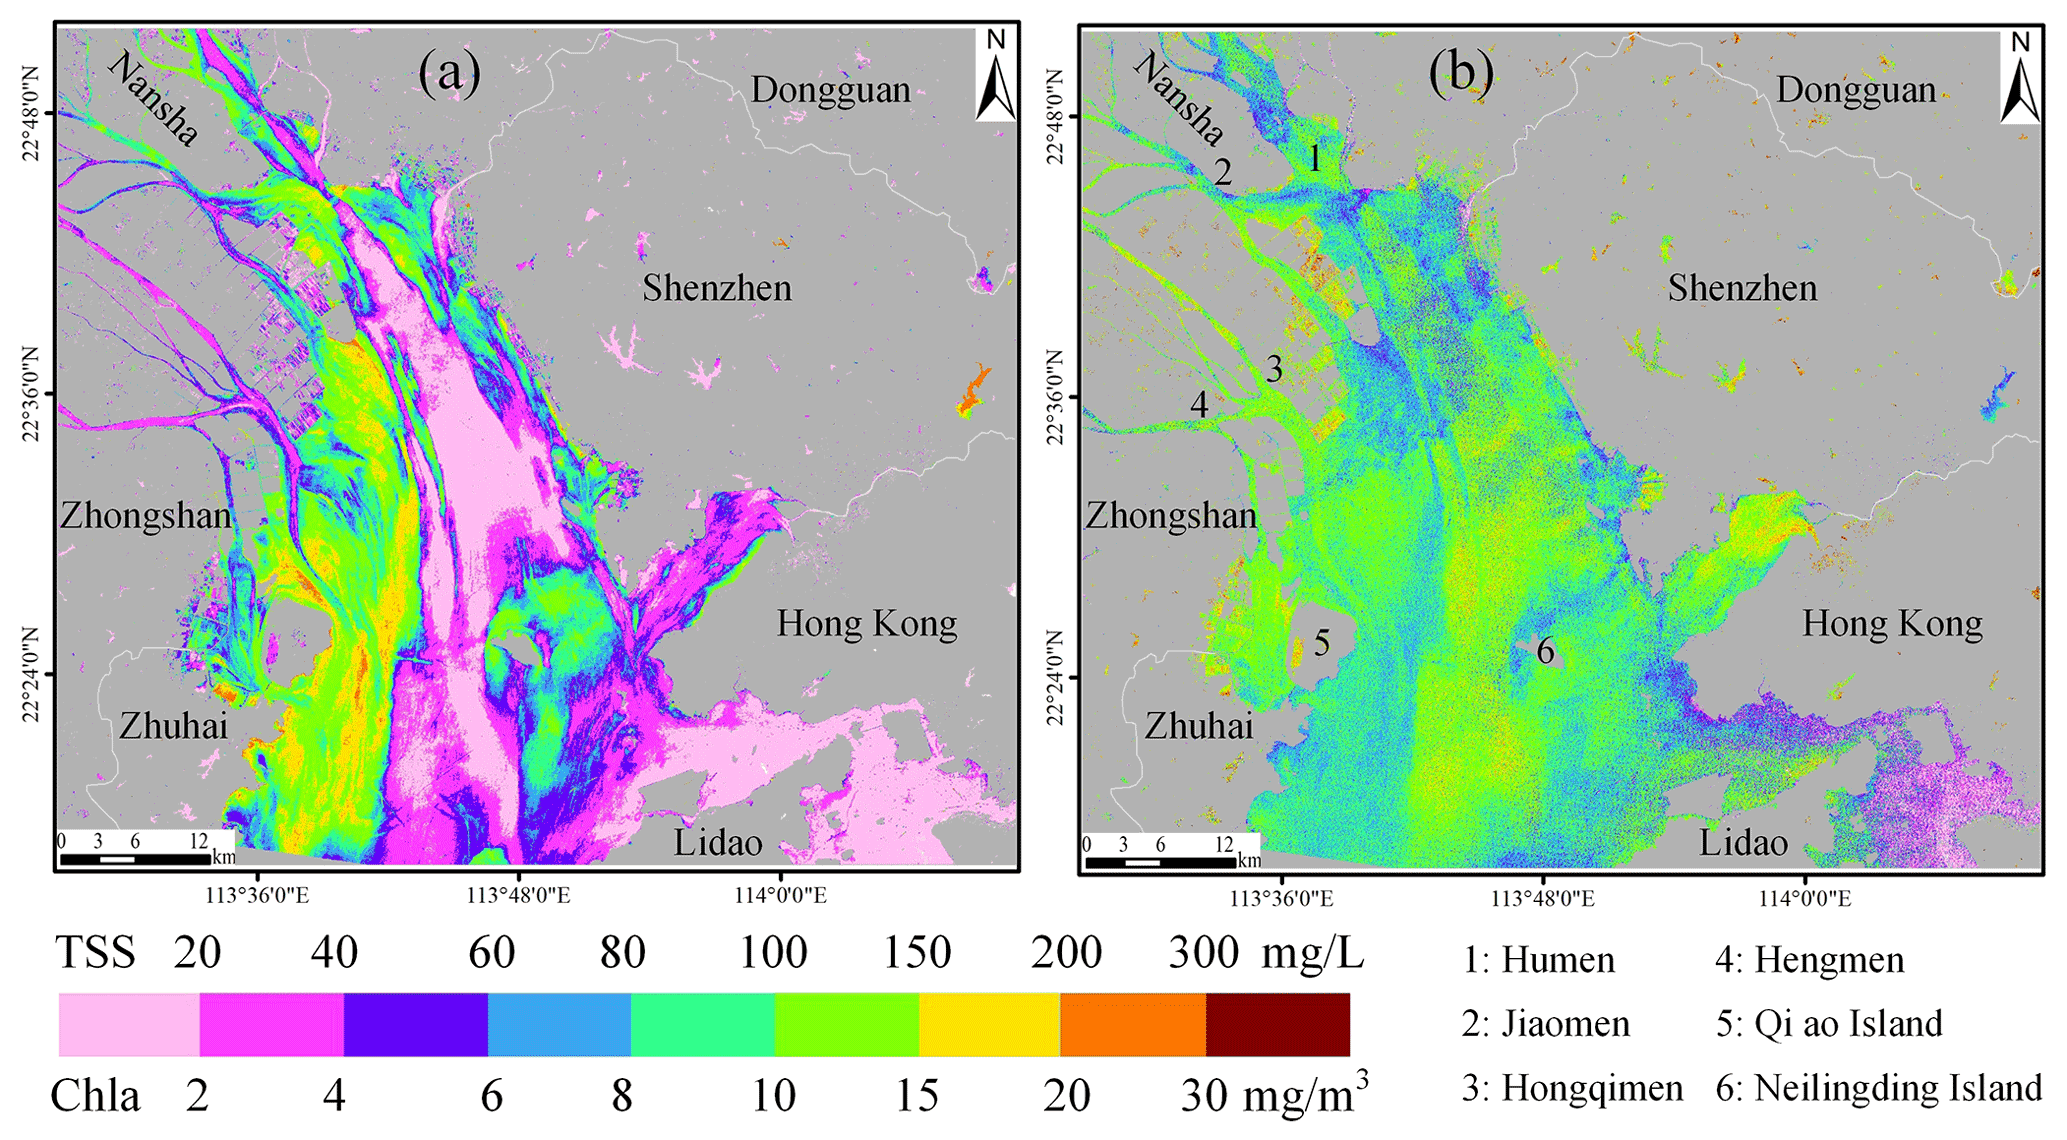
Figure 4The estimated TSS concentrations (a) and Chl a concentrations (b) in the PRE on 20 November 2004.
In contrast to the TSS concentration results, the Chl a concentrations in the PRE have significantly lower values of less than 20 mg m−3 in almost the entire PRE (Fig. 4b). The results accord with the findings of Liu et al. (2017) and Huang et al. (2005), who found that Chl a concentrations ranged from 0.24 to 21.5 mg m−3 in the PRE at different times. Furthermore, Chl a concentrations in the PRE show almost opposite spatial characteristics to TSS concentrations. Apart from the eastern Lidao District coastal water bodies, the regions of relatively high (low) Chl a concentrations are the regions of relatively low (high) TSS concentrations. These corresponding features are apparent in the four waterways, namely, Humen, Jiaomen, Hongqimen, and Hengmen waterways, and the shoals and channels of the PRE (Fig. 4).
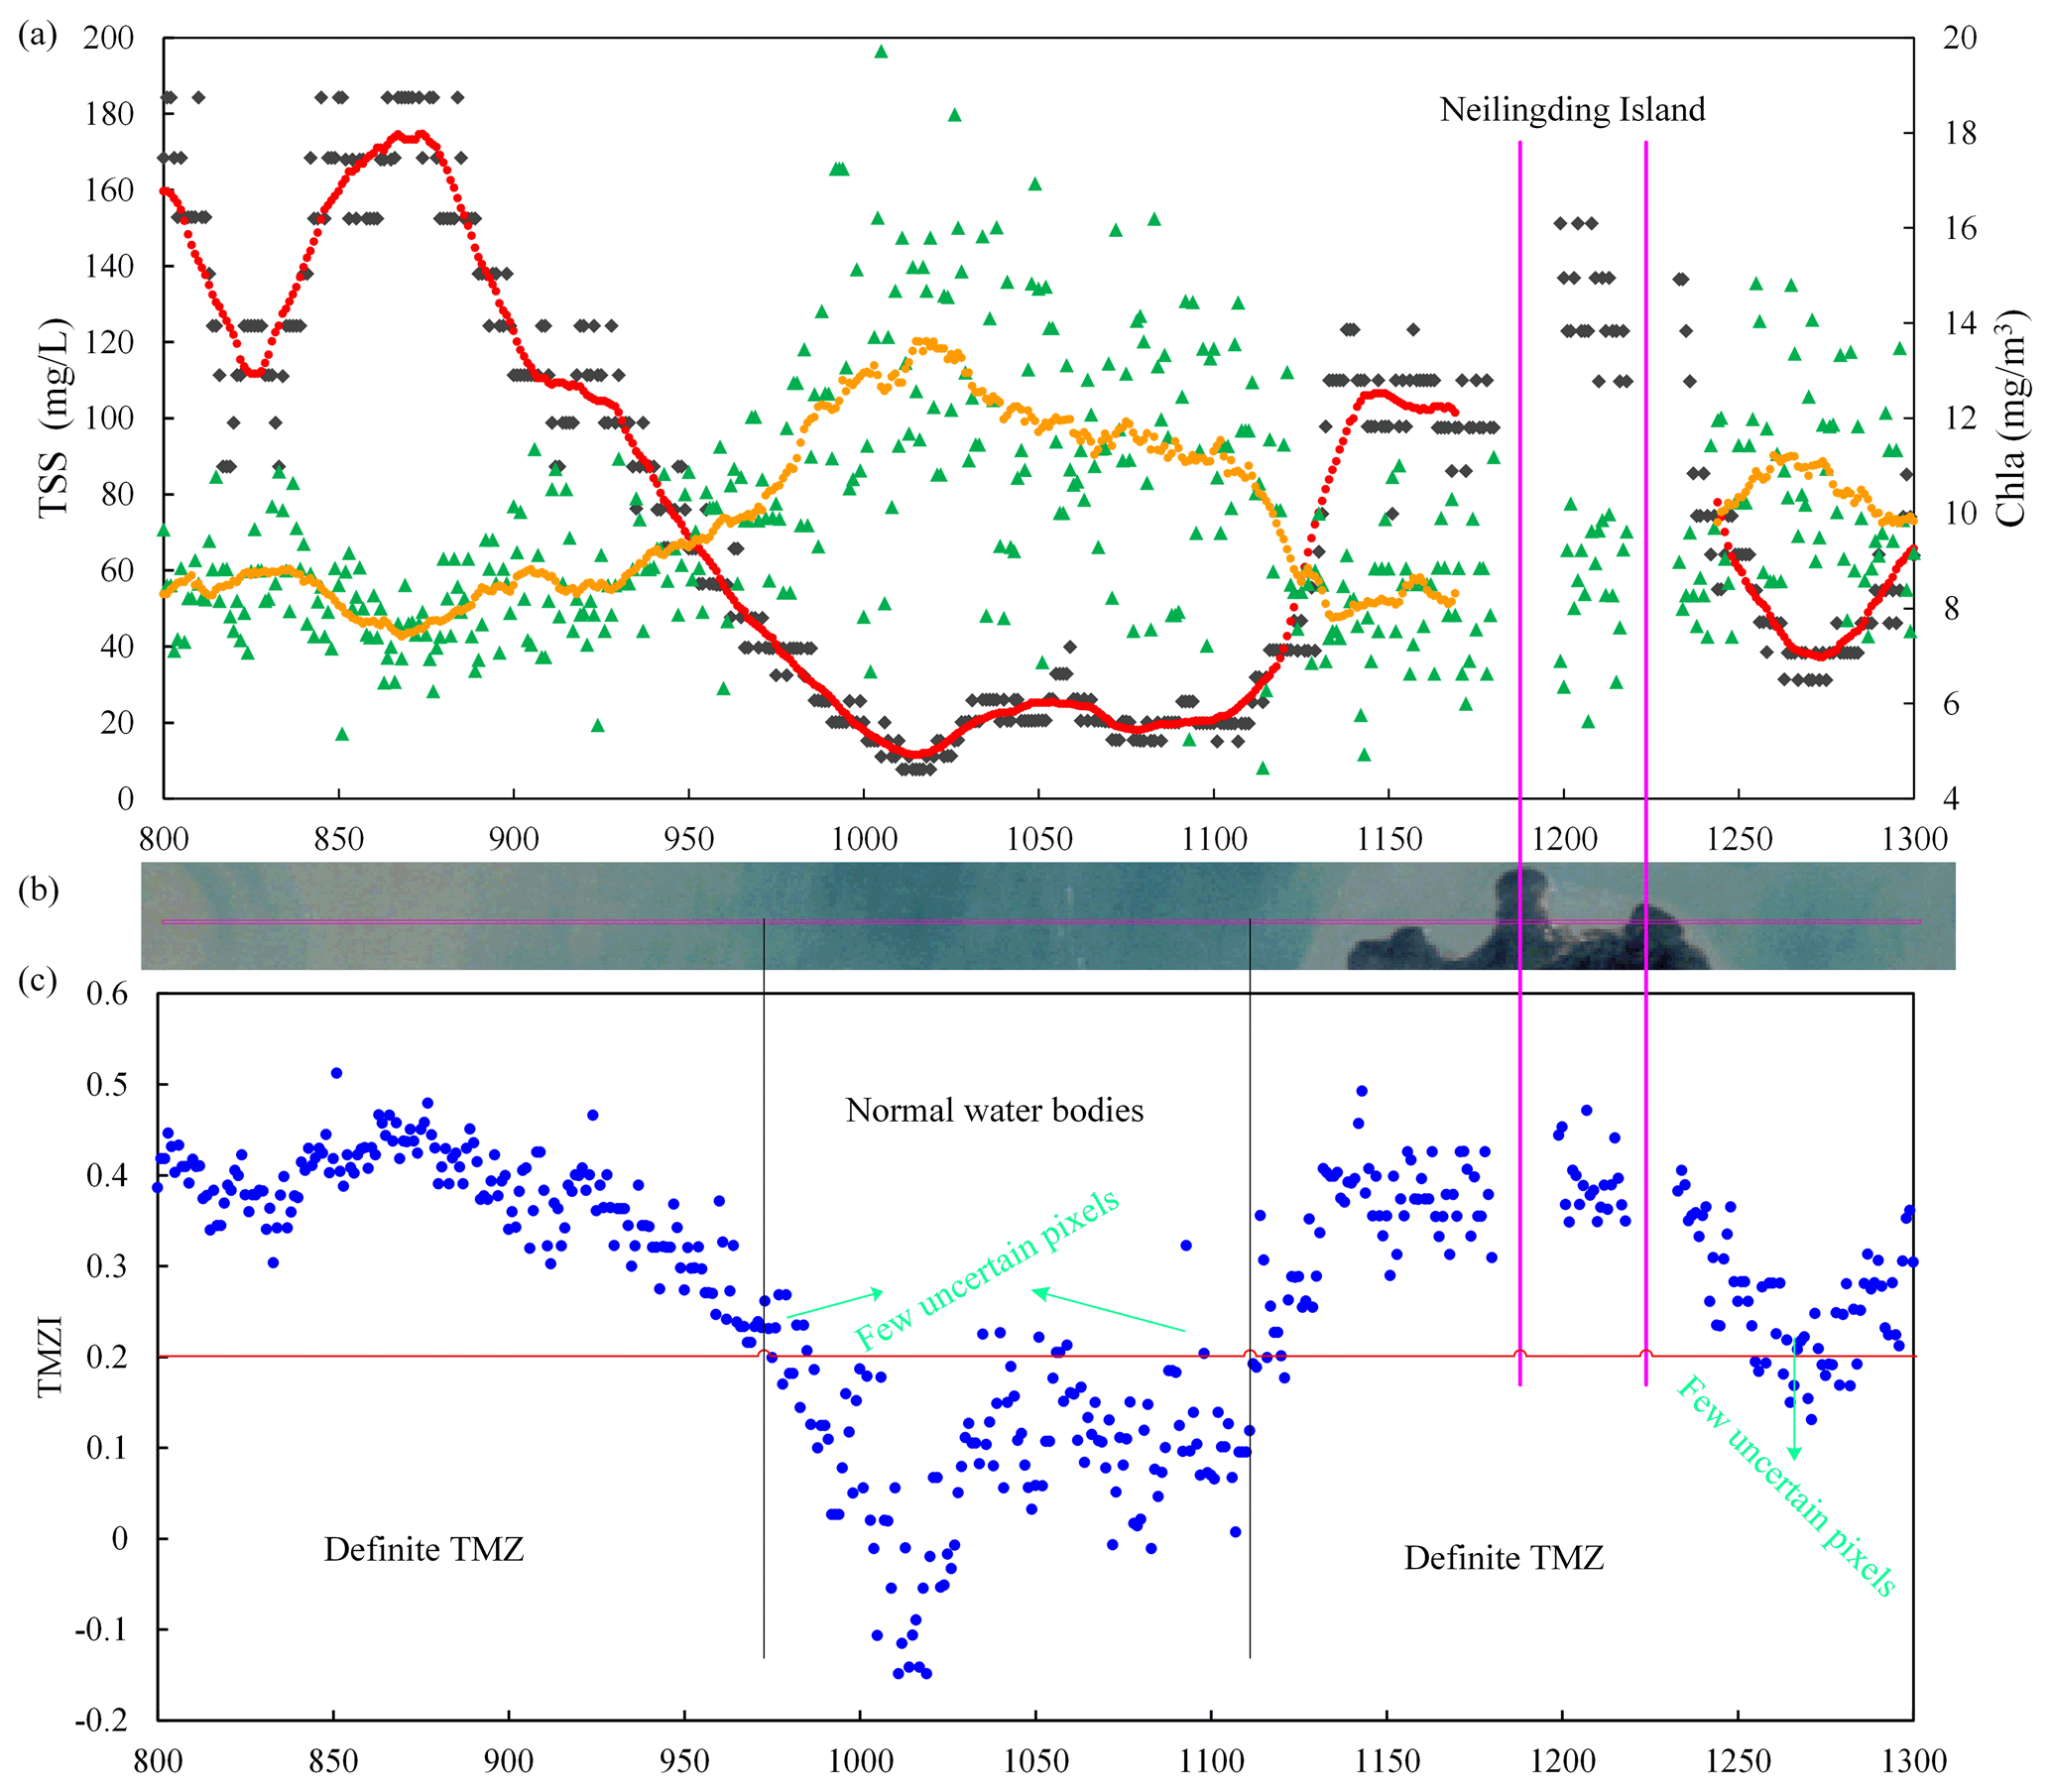
Figure 5The corresponding spatial relationship between the TSS concentrations, indicated by black dots and red trend line, and Chl a concentrations, indicated by green triangles and orange trend line of row 1600 (a), the true color imagery (b), and the corresponding values of the TMZI (c).
To further analyze and assess the corresponding relationship between TSS and Chl a concentrations in the estuaries, three rows of TSS and Chl a concentration values in the PRE were extracted (Fig. 7a; pink lines; rows 1200, 1600, and 1900, columns from 800 to 1300). The results for row 1600 are shown in Fig. 5a. A correlation analysis showed a significant negative correlation between TSS and Chl a concentrations. For the original TSS and Chl a concentrations, the correlation coefficient was −0.6531. The correlation coefficient reaches approximately −0.9 for its trend lines (Fig. 5a).
3.2 Establishment and application of the TMZI
Based on the analysis and corresponding features between TSS and Chl a concentrations, it is considered that the transform results derived from the two water color elements may help to better distinguish and extract the TMZ. In this study, the TMZI was defined as the ratio of the difference and sum of logarithmic transformation of TSS concentrations and Chl a concentrations (Eq. 3), which is similar to the normalized difference vegetation index (NDVI).

Figure 6The true color imagery and the corresponding values of the TMZI of rows 1200 (a, b) and 1900 (c, d).
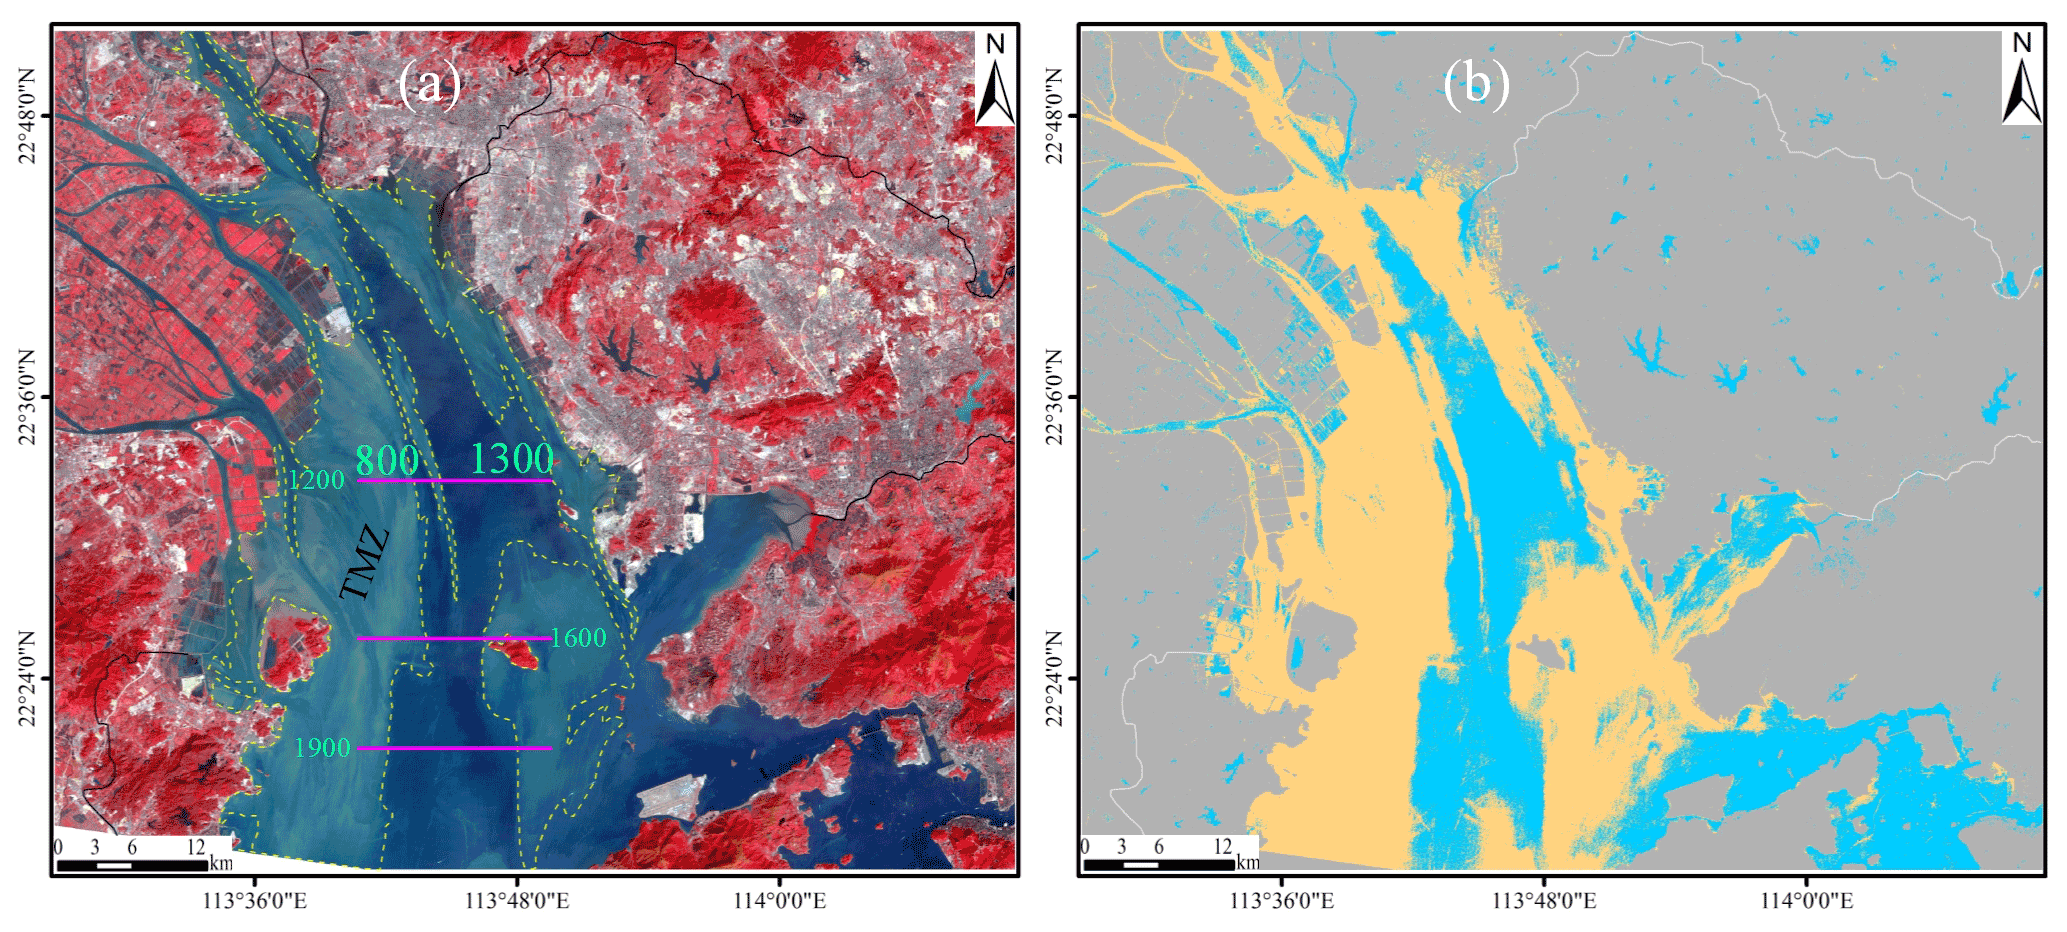
Figure 7False color imagery (USGS, 1982; NASA, 2001) and the visual-interpretation TMZ results (regions indicated by yellow dashed frames) (Wang et al., 2020b, 2021) (a) and the extracted TMZ results, indicated by mango coloring, (b) in the PRE on 20 November 2004 (low-flow season).
According to the definition and equation, this study calculated TMZI values (Figs. 5c, 6b and d). Taking the results of row 1600 as an example (Fig. 5b and c), the row pixels can be mainly divided into one TMZ (columns 800–975), normal water bodies (columns 975–1110), and another TMZ (columns 1110–1300) from left to right. The null values located in columns 1180–1200 and 1220–1235 are Neilingding Island (Figs. 5 and 7a). Through a comparison with the results of the TMZI, it is found that all the values of the TMZI corresponding to TMZ pixels are larger than 0.2, while the values corresponding to normal water body pixels are all smaller than 0.2, except for a few blurry pixels (Fig. 5b and c). For the results of rows 1200 and 1900, similar corresponding characteristics between the TMZ and TMZI and the same criterion were also found (Fig. 6). Therefore, the TMZI showed a significant feature and had the potential to develop into a better model for recognizing and extracting the estuarine TMZ.
The TMZI of the entire Landsat TM imagery was subsequently calculated, and TMZs in the PRE were extracted. Figure 7b shows the spatial distribution results of the TMZ in the PRE on 20 November 2004. The TMZ is widely distributed throughout the PRE, accounting for more than half of the water areas in the imagery. Among them, the main TMZ is located within an average distance of 11 km from the Panyu, Nansha, Zhongshang, and Zhuhai coasts, which approximately corresponds to the west shoal in the PRE. In the western Dongguan and Shenzhen coastal water bodies, an approximately rectangular TMZ develops approximately 5 km from the coastline, which indicates the location of the east shoal of the PRE (Wang et al., 2018). In addition, a third main TMZ in the PRE located from nearby Neilingding Island to western Hong Kong water bodies is found, although TSS concentrations in the TMZ are lower than those of the previous TMZs (Figs. 4a and 7b). Compared to the visual interpretation of TMZ results in previous works by the current authors (Fig. 7a) (Wang et al., 2020b, 2021), the area-based accuracy measures show that the quality of extraction achieves 0.8429. The good TMZ extraction results and the high validation accuracy by the TMZI in this study indicate a more effective way to recognize TMZs in estuaries (Figs. 6 and 7).
3.3 Validation of the accuracy of the TMZI in different seasons
Due to the complexity of hydrodynamic environments, the estuarine factors and water color elements show significant variations in different seasons, even in the same estuary at different times of the day. Therefore, this study further validated the accuracy of the TMZI for extracting the TMZ in the PRE during the high-flow season (18 October 2015).
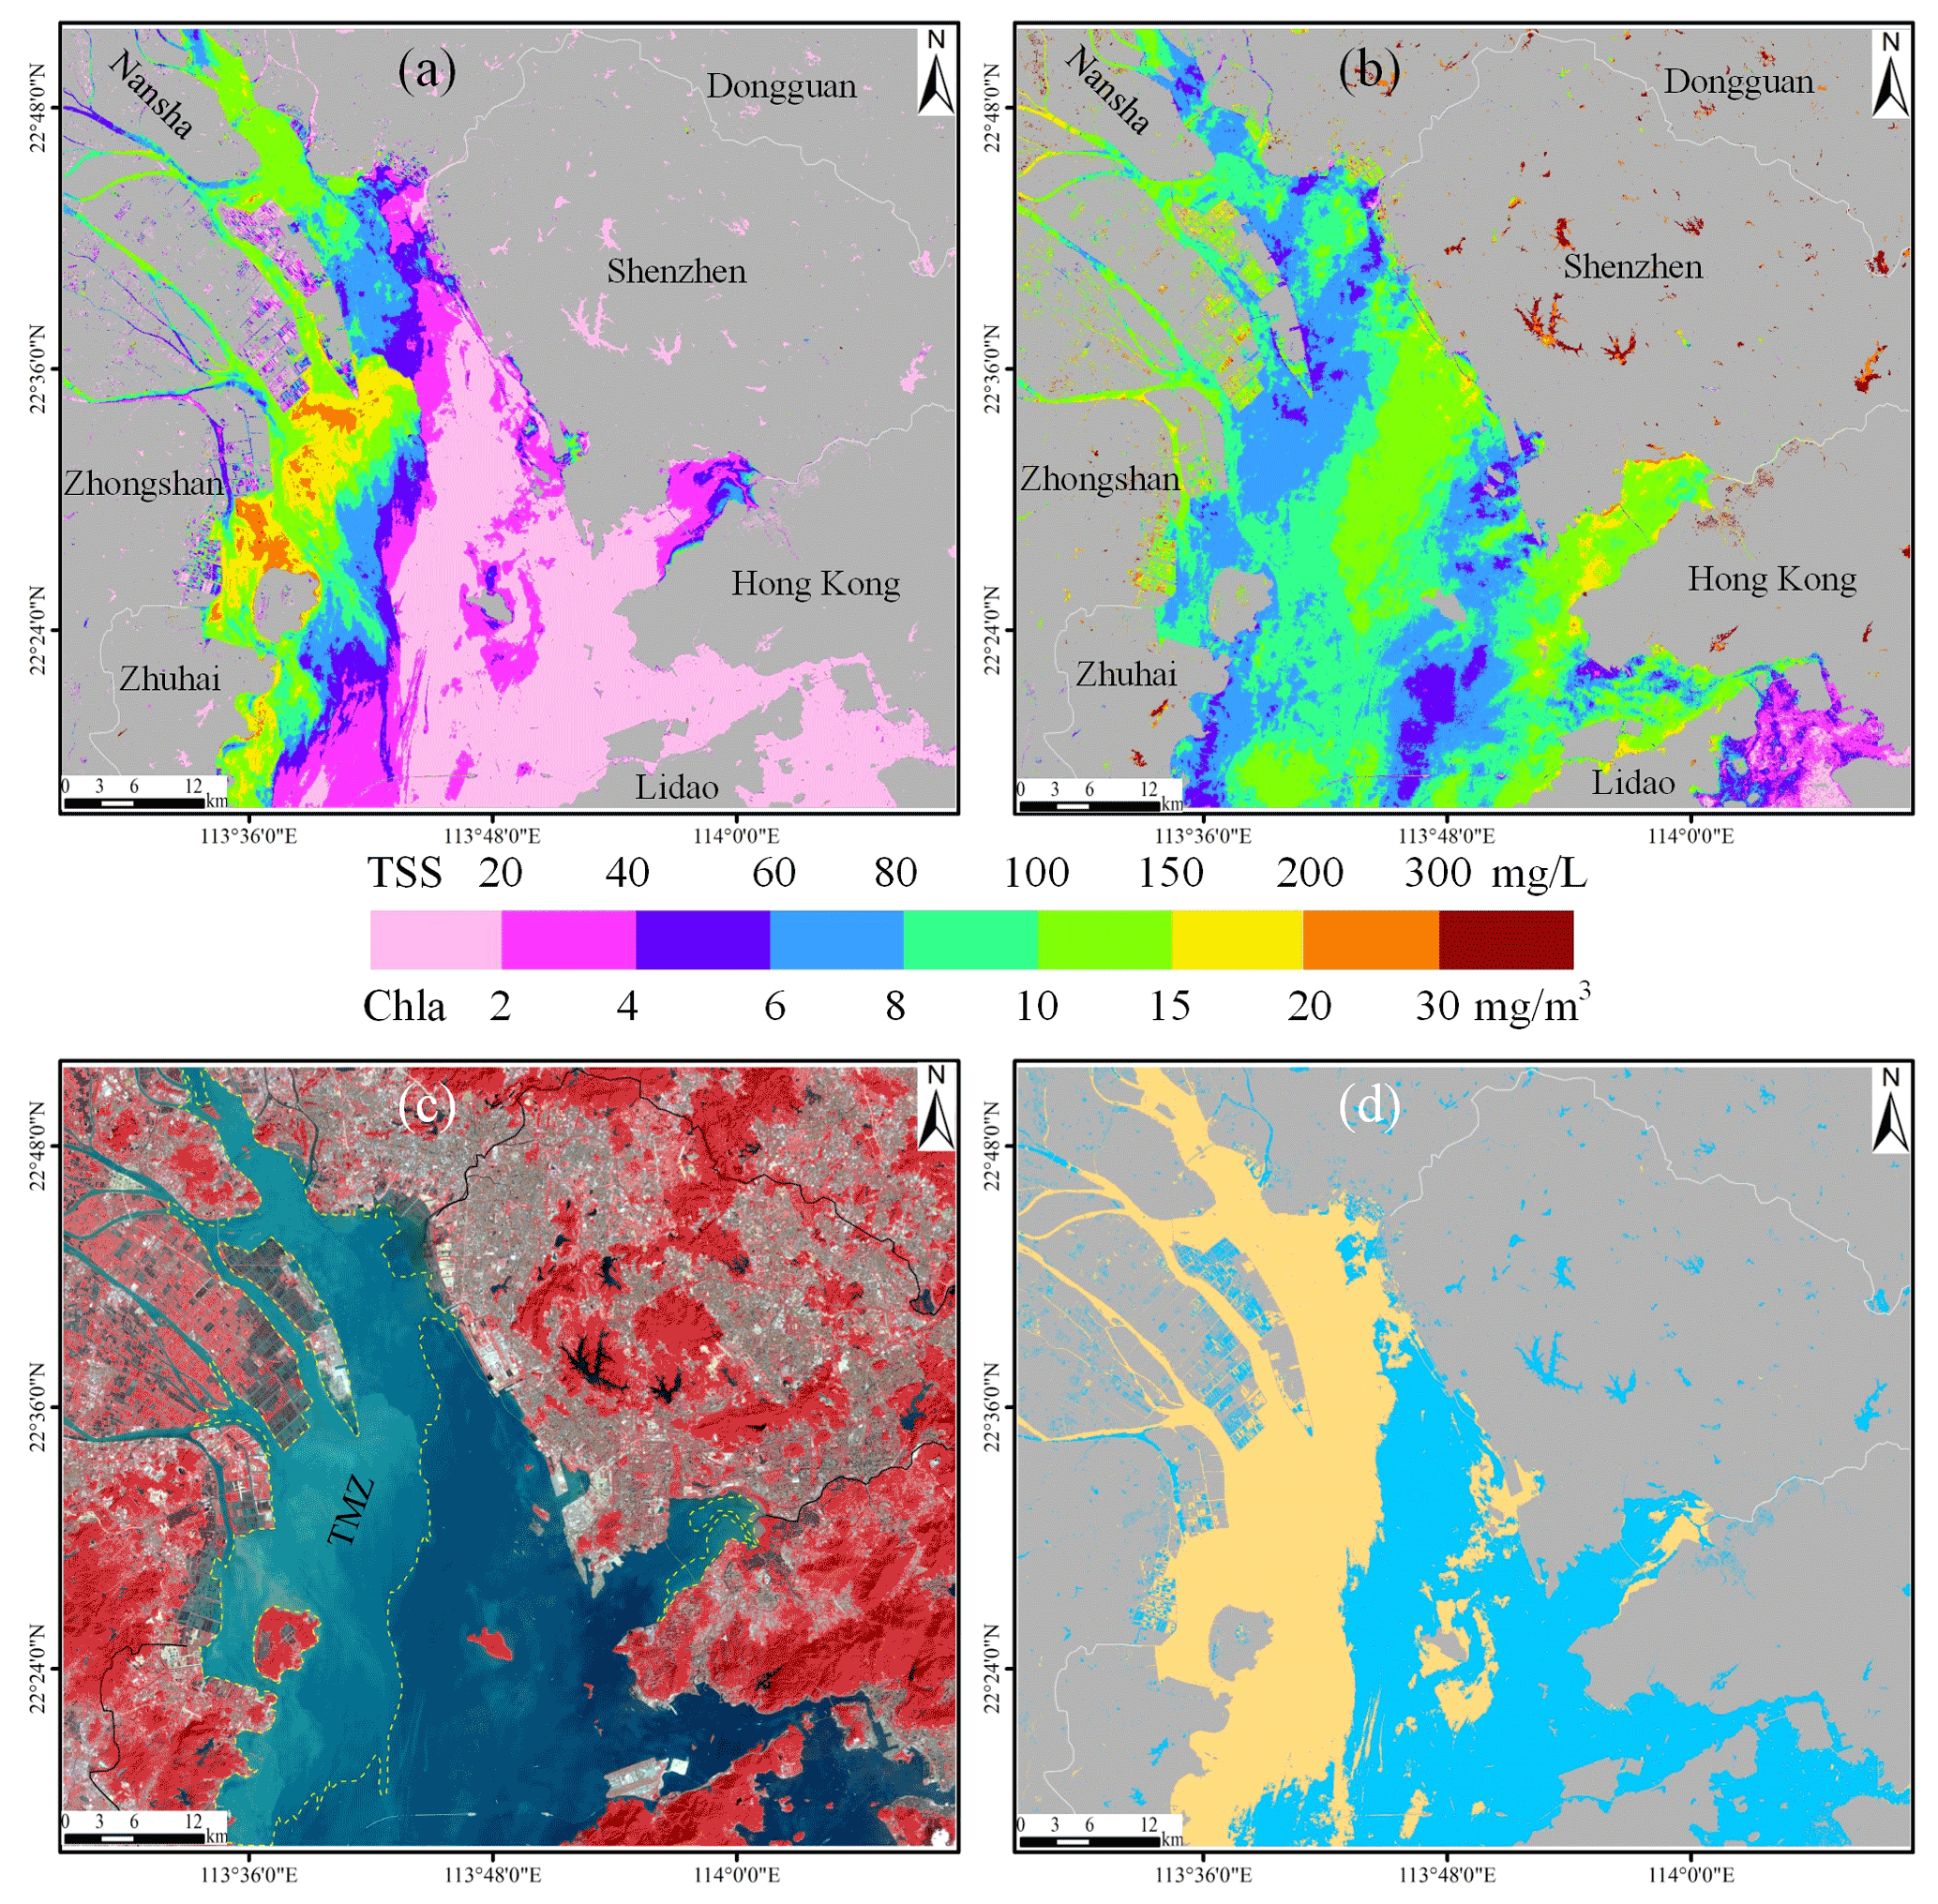
Figure 8The estimated TSS concentrations (a), Chl a concentrations (b), false color imagery (USGS, 1982; NASA, 2001) and the visual-interpretation TMZ results (regions indicated by yellow dashed frames) (Wang et al., 2020b) (c), and extracted TMZ results, indicated by mango coloring, (d) in the PRE on 18 October 2015 (high-flow season).
Figure 8a and b demonstrate the retrieved TSS and Chl a concentration results in the high-flow season of PRE. The results in different seasons are significantly different (Figs. 4 and 8). On 18 October 2015, TSS concentrations in the PRE had wider variables, ranging from 2.23 to 286.6 mg L−1. However, the water bodies with high TSS concentrations (more than 80 mg L−1) were mainly in the outlets of four waterways, namely, the Humen, Jiaomen, Hongqimen, and Hengmen waterways. The other regions of the PRE have significantly lower TSS concentrations of generally less than 20 mg L−1 (Fig. 8a). Similar to the corresponding features between TSS and Chl a concentrations in the low-flow season, the almost opposite spatial characteristics remain in the high-flow season. For regions with relatively high (low) Chl a concentrations there are relatively low (high) TSS concentrations (Fig. 8a and b). Notably, the eastern Lidao District coastal water bodies are an exception, with the same results in the low-flow season (Fig. 4). Both TSS and Chl a concentrations in the zone are relatively low (Figs. 4 and 8).
Using the results of TSS and Chl a concentrations of the PRE on 18 October 2015, the TMZI was calculated and TMZs of the PRE were extracted in the high-flow season (Fig. 8d). Compared with the visual-interpretation TMZ results (Fig. 8c) (Wang et al., 2020b), the area-based accuracy measures show that the quality of extraction is 0.8171. It is also indicated that an acceptable accuracy is obtained by the TMZI in the high-flow season of the PRE. In addition, only one main TMZ remains along the west coast of the PRE (Fig. 8d), which is similar to one of the main TMZs in the low-flow season of 2004 (Fig. 7b). However, clear differences remain in different seasons, such as TMZs in the Hongqimen and Hengmen waterways and the eastern Zhuhai coasts (Figs. 7b and 8d). The other TMZs in the high-flow season of 2015 are mainly located in the surrounding Dachanwan Wharf of Shenzhen and Neilingding Island. The distributions are less apparent than those in the low-flow season of 2004 (Fig. 7b). Besides, two relatively small isolated TMZs can be found on the two artificial islands of the Hong Kong–Zhuhai–Macao Bridge (Fig. 8d), which may imply the associated influence of human activities.
According to the analysis of the PRE results on 18 October 2015, it is demonstrated that the TMZI and the criterion TMZI>0.2 also perform well in extracting the estuarine TMZ in different seasons using Landsat OLI imagery.
3.4 Assessment of the applicability of the TMZI in different estuaries
To further assess the applicability of the TMZI in different estuaries, as for the PRE, the corresponding TMZ results in the HRE and the MRE were also calculated and validated.

Figure 9The estimated TSS concentrations (a), Chl a concentrations (b), true color imagery (USGS, 1982; NASA, 2001) (c), and extracted TMZ results, indicated by mango coloring, (d) in the HRE on 13 August 2008 (high-flow season).
Figure 9a and b indicate the results of TSS and Chl a concentrations in the HRE on 13 August 2008. The TSS concentrations downstream and in the estuary of the HRE are significantly higher than the outer shelf area, particularly in the downstream area of the Dongxi River and Xinjinhe River waterways of the Hanjiang River, with a mean value in excess of 300 mg L−1 (Fig. 9a). TSS concentrations in the offshore area (South China Sea) are frequently less than 20 mg L−1. Therefore, a significant decreasing trend of TSS concentration is found from the northwest to southeast in the HRE (Fig. 9a). Furthermore, the Chl a concentrations in the HRE show opposite spatial distributions characteristics, which resembles the findings in the PRE (Figs. 4 and 8). Relatively low Chl a concentrations are mainly generally found in the downstream area and estuary, and the outer shelf area has high values (Fig. 9b). The Chl a concentrations in the HRE range from 4.1 to 37.3 mg m−3 (Fig. 9b), which is slightly higher than that of the PRE (Figs. 4 and 8).
The TMZ extraction results for the HRE are shown in Fig. 9d. The TMZs are distributed in all the downstream areas and estuaries of the Hanjiang River. They can be divided into four main TMZs based on different waterways, namely, the Beixi, Dongxi, Waishahe, Xinjinhe, and Meixi waterways of the Hanjiang River. The maximum TMZ is located within an average distance of 3 km from the Beixi estuary, western Haishan coast, and the coastlines between the Beixi and Dongxi estuaries. The second largest TMZ of the HRE is distributed from the Meixi to the Xinjinhe estuaries. The region of the main TMZ of the Xinjinhe estuary appears knife-shaped, which is mainly caused by the runoff of the Xinjinhe waterway and the flow guiding line connected to Longhu District, Shantou City (Fig. 9d) (Wang et al., 2017a). The other two relatively smaller TMZs are distributed in the Dongxi and Waishahe estuaries, respectively. The results indicate that the TMZ distribution in the HRE is mainly related to tide, runoff, estuarine topography, and human activity.
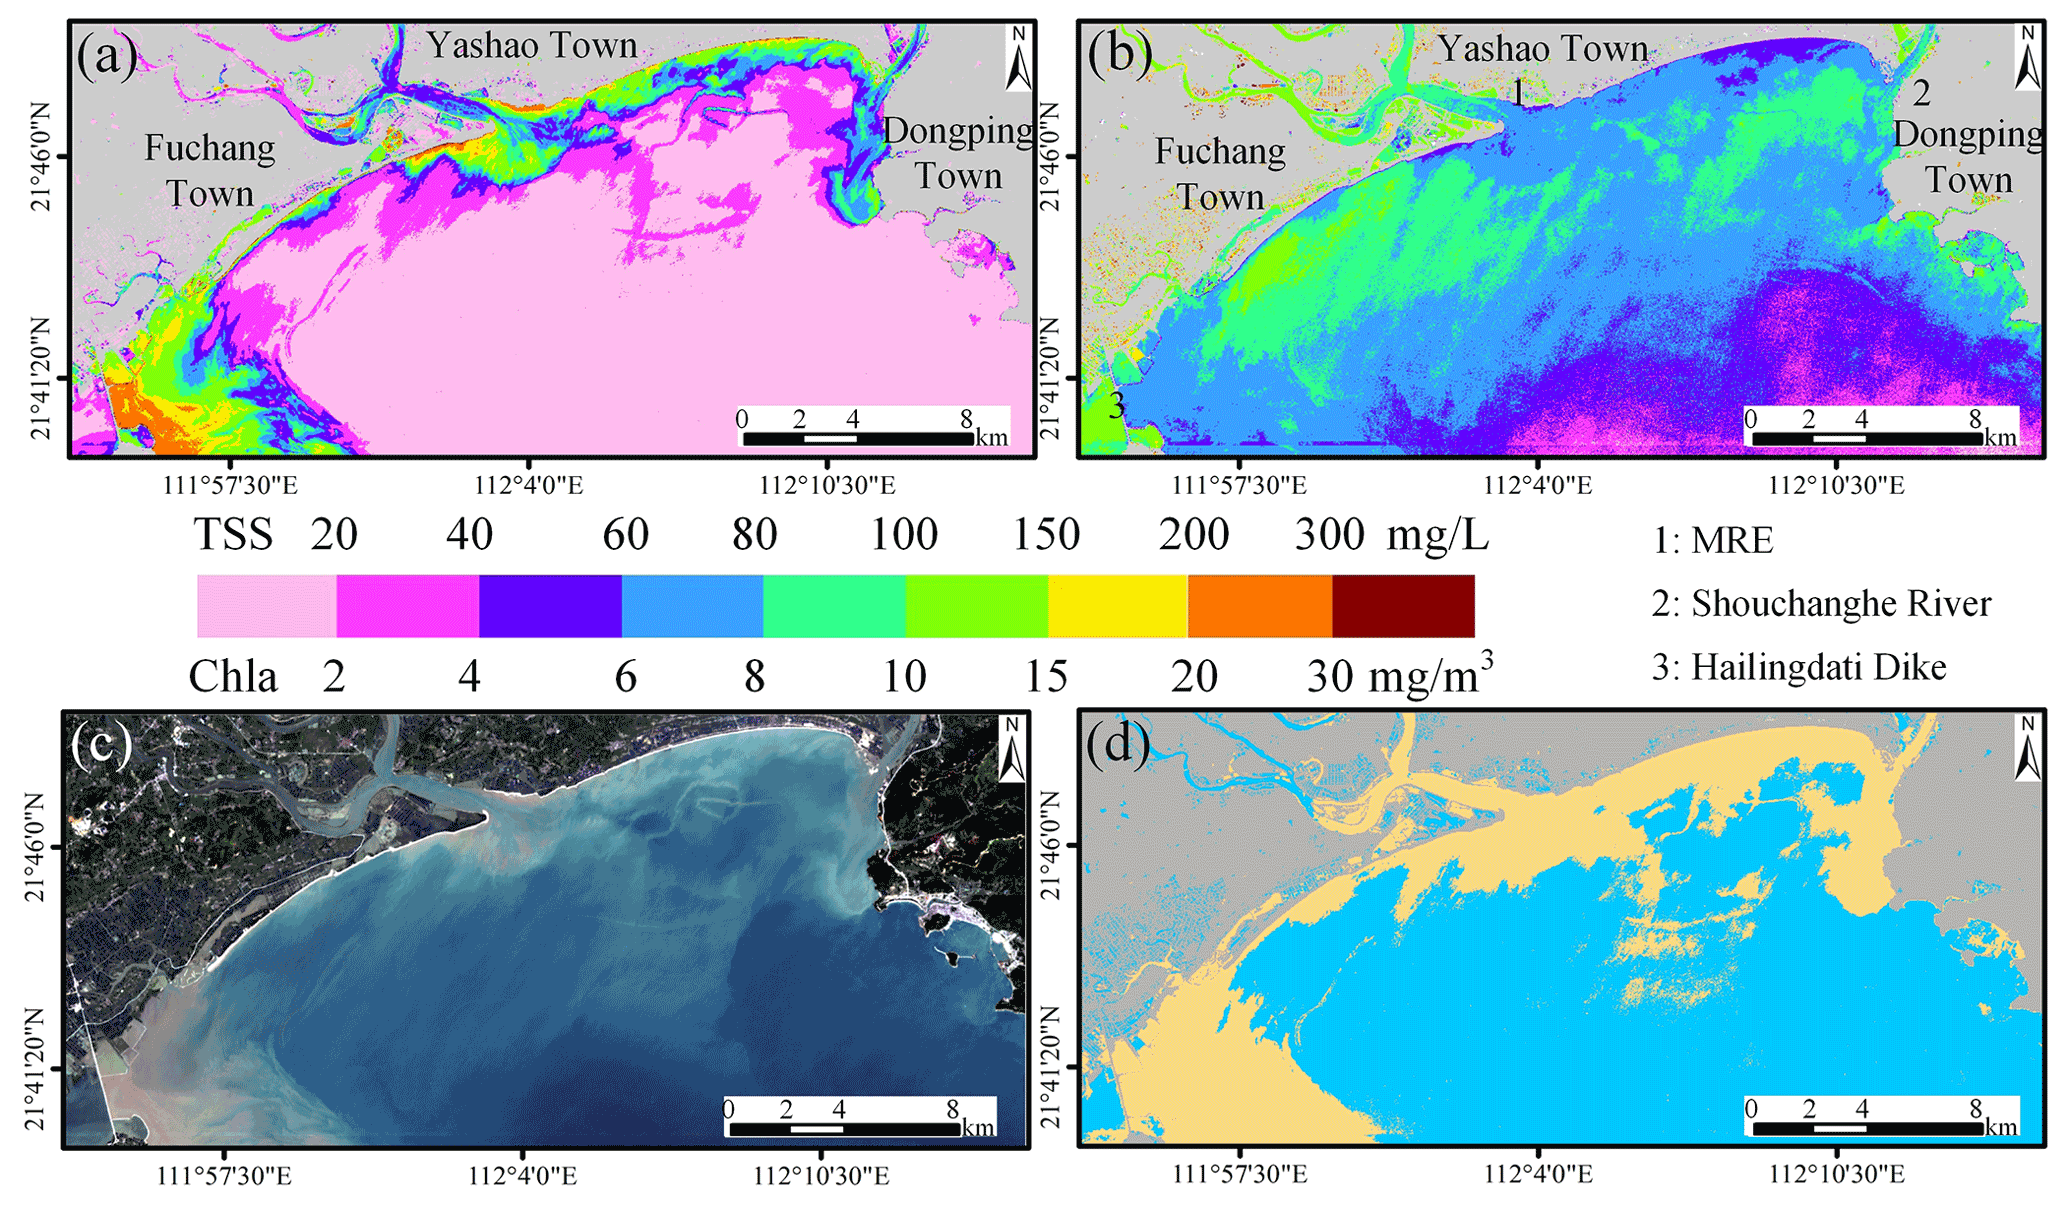
Figure 10The estimated TSS concentrations (a), Chl a concentrations (b), true color imagery (USGS, 1982; NASA, 2001) (c), and extracted TMZ results, indicated by mango coloring, (d) in the MRE on 6 December 2013 (Low-flow season).
In the MRE, the region of high TSS concentrations is mainly distributed at an average distance of 1.2 km from the Yangjiang coastlines, particularly in the eastern Hailingdati dike water bodies, with a mean value of more than 150 mg L−1 (Fig. 10a). The outer shelf area has significantly lower TSS concentrations of generally less than 35 mg L−1. The Chl a concentrations in most regions of the MRE are more than 4 mg m−3, except for the southwestern Dongping town coastal water bodies, where Chl a concentrations mainly range from 2 to 4 mg m−3. The Chl a concentrations in the downstream Moyangjiang River, the coast near Fuchang town, and outside of the Shouchanghe River estuary have relatively high values of frequently greater than 8 mg m−3 (Fig. 10b). Compared to the PRE and the HRE, the corresponding relationship between TSS and Chl a concentrations in the MRE is slightly weak. However, a trend of high (low) TSS concentrations in water bodies with relatively low (high) Chl a concentrations remains (Fig. 10a and b).
Figure 10c and d indicate the true color imagery of the MRE and the TMZ extraction results. There are two main TMZs in the MRE on 6 December 2013. The first TMZ is mainly distributed from the inside and outside of the Moyangjiang River estuary to the Shouchanghe River estuary, with a distance of approximately 1.8 km from the coastlines (Fig. 10d). The distribution of the TMZ in this region is mainly attributed to the interaction of tide and runoff. Another main TMZ is in the regions 4 km from the Hailingdati dike and is mainly caused by obstruction by ocean currents (Fig. 10d). In addition, several small, long, and narrow TMZs are accuracy extracted through the TMZI with the same criterion as that in the PRE and the HRE.
The results of the three estuaries and the comparison and accuracy assessment indicate that extracting the TMZ based on the TMZI and the criterion TMZI>0.2 has a high applicability in multiple estuaries and different seasons.
3.5 Comparison with the previous methods
Previous studies have extracted the TMZ based mainly on the threshold of TSS concentrations or turbidity. For example, Jalón-Rojas et al. (2016) used thresholds of 500 mg L−1 (300 NTU, nephelometric turbidity unit) and 1000 mg L−1 (600 NTU) to define a moderately concentrated TMZ and highly concentrated TMZ in the Loire Estuary in France; Jiang et al. (2013) and Li et al. (2019) defined the TMZ as the areas with TSS values larger than 700 mg L−1 in Yangtze Estuary and Hangzhou Bay. For the TMZ in the PRE, it was found that TSS values in studies by Shi et al. (2017) and Wai et al. (2004) were more than 89.4 and about 150 mg L−1, respectively. Based on the two criteria (TMZ: TSS>89.4 or ), this study calculated and extracted TMZs in the PRE (Fig. 11c–f).

Figure 11The true color imagery (USGS, 1982; NASA, 2001) and TMZ extraction results in the PRE at different times (a, c, e: 20 November 2004; b, d, f: 18 October 2015) based on the TMZI method of this study (a and b, regions indicated by mango coloring, as in Figs. 7b and 8d), the criterion by Shi et al. (2017) (c, d, regions indicated by cyan color), and the criterion by Wai et al. (2004) (e, f, regions indicated by yellow color).
Compared to the visual-interpretation TMZ results (Figs. 7a and 8c), the TMZ extraction results in the PRE based on the criterion of Shi et al. (2017) are superior to those of Wai et al. (2004), on 20 November 2004 (Fig. 11c vs. Fig. 11e, low-flow season) or 18 October 2015 (Fig. 11d vs. Fig. 11f, high-flow season). The extraction quality based on the criteria of Shi et al. (2017) and Wai et al. (2004) are 0.4238, 0.4770 and 0.1046, 0.1661, respectively. The primary reason may be that the time of the data source in Shi et al. (2017) was closer to the present study than that in the study by Wai et al. (2004). This means that the criterion of Shi et al. (2017) was more suitable for this study than that of Wai et al. (2004).
It was also found that a relatively good result was obtained in the west shoal of the PRE on 20 November 2004, according to the criterion of Shi et al. (2017) (Fig. 11c). The extracted TMZs are almost consistent with reality compared to the true color imagery and the visual-interpretation TMZ results (Wang et al., 2020b, 2021). However, the accuracy in the east shoal and surrounding Neilingding Island of the PRE is lower than in the west shoal, where obvious distributions of TMZs are not recognized effectively (Fig. 11c). Furthermore, the same criterion does not work well in the western shoal of the PRE at different times (Fig. 11c vs. Fig. 11d). Almost one-third of the distributions of TMZs in the western shoal of the PRE during the high-flow season are not distinguished and extracted (Fig. 11d). The results based on the criteria of previous studies indicate that fixed thresholds have a distinct disadvantage when extracting the TMZ at different times or in estuaries.
Based on the evaluation and analysis of all the above results (Figs. 7–11), the TMZI could be widely and effectively applied for the accurate extraction of estuarine TMZ, regardless of the significant variations in hydrodynamic environments, TSS and Chl a concentrations in different estuaries and seasons. Compared to previous studies and the results from fixed thresholds, it is concluded that the TMZI has significant potential to develop into a unified model for distinguishing and extracting the TMZ effectively and accurately in many other estuaries globally (Q: 0.8171–0.8429 vs. 0.1046–0.4770).
This study established and developed a novel model (turbidity maximum zone index) based on TSS and Chl a concentration to distinguish estuarine turbidity maximum zone from Landsat imageries. It was found that both TSS and Chl a concentrations showed significant variations and different characteristics in the PRE, the HRE, and the MRE at different times (Figs. 4 and 8–10). A corresponding relationship between TSS and Chl a concentrations in the three estuaries of Guangdong Province remains. In this study, the Chl a and TSS concentrations showed almost opposite spatial distribution characteristics, where relatively high (low) Chl a concentrations corresponded exactly to the relatively low (high) TSS concentrations (Figs. 4–5 and 8–10). Therefore, here, the turbidity maximum zone index (TMZI) was defined and designed as the ratio of the difference and sum of the logarithmic transformation of TSS and Chl a concentrations.
Compared with the true (false) color imagery and the visual-interpretation TMZ results, it was found that the TMZ extraction results by the TMZI were consistent with reality (Figs. 7–10; Q: 0.8171–0.8429). Notably, the criterion used for extracting TMZs in different estuaries and seasons was the same (TMZI>0.2). In addition, reasonable accuracy and a better performance were obtained by the TMZI compared with the previous fixed TSS concentration or turbidity threshold (Fig. 11; Q: 0.8171–0.8429 vs. 0.1046–0.4770), demonstrating that the TMZI has a higher adaptability and robustness.
The results of this study indicate that there is significant potential for optimizing the TMZI to distinguish and extract TMZs from multi-source satellite remote sensing, such as Sentinel, Aqua and Terra-MODIS, Envisat MERIS, and SeaWiFS. This will also assist in establishing and developing a global unified criterion for extracting TMZs effectively in different estuaries and at different times.
All the Landsat remote-sensing imageries are fully available at https://glovis.usgs.gov/app?fullscreen=1 (last access: 9 November 2021, USGS, 1982; NASA, 2001).
The individual contributions and responsibilities of the authors are listed as follows: CW designed the research and wrote the paper; CZ, DL, and LW guided the research process; DW, QZ, HJ, KJ, and YaL collected and analyzed the data; SC, JY, XZ, and YoL revised the paper, provided some comments, and helped edit the paper. All authors have read and agreed to the published version of the paper.
The authors declare that they have no conflict of interest.
Publisher's note: Copernicus Publications remains neutral with regard to jurisdictional claims in published maps and institutional affiliations.
The authors thank USGS for providing the Landsat remote-sensing imageries and appreciate the constructive suggestions and comments from reviewers and editors that helped improve this paper.
This research has been supported by the National Natural Science Foundation of China (grant nos. 41801364 and 41976189), the Key Special Project for Introduced Talents Team of Southern Marine Science and Engineering Guangdong Laboratory (Guangzhou) (grant no. GML2019ZD0301), the Natural Science Foundation of Guangdong Province (grant no. 2021A1515012579), the 2019 science and Technology Innovation Project of Provincial Special Fund for Economic Development of Guangdong Province (grant no. 2019B1), the Guangdong Innovative and Entrepreneurial Research Team Program (grant no. 2016ZT06D336), and the GDAS' Project of Science and Technology Development (grant nos. 2020GDASYL-20200104006, 2020GDASYL-20200302001, and 2019GDASYL-0301001).
This paper was edited by Richard Neale and reviewed by two anonymous referees.
Asp, N. E., Gomes, V., Schettini, C. A. F., Filho, P. W. S., Siegle, E., Ogston, A. S., Nittrouer, C. A., Silva, J. N. S., Nascimento Jr., W. R., Souza, S. R., Pereira, L. C. C., and Queiroz, M. C.: Sediment dynamics of a tropical tide-dominated estuary: Turbidity maximum, mangroves and the role of the Amazon River sediment load, Estuar. Coast. Shelf S., 214, 10–24, https://doi.org/10.1016/j.ecss.2018.09.004, 2018.
Attila, J., Kauppila, P., Kallio, K. Y., Alasalmi, H., Keto, V., Bruun, E., and Koponen, S.: Applicability of Earth Observation chlorophyll-a data in assessment of water status via MERIS-With implications for the use of OLCI sensor, Remote Sens. Environ., 212, 273–287, https://doi.org/10.1016/j.rse.2018.02.043, 2018.
Azhikodan, G. and Yokoyama, K.: Seasonal morphodynamic evolution in a meandering channel of a macrotidal estuary, Sci. Total Environ., 684, 281–295, https://doi.org/10.1016/j.scitotenv.2019.05.289, 2019.
Brenon, I. and Hir, P. L.: Modelling the Turbidity Maximum in the Seine Estuary (France): Identification of Formation Processes, Estuar. Coast. Shelf S., 49, 525–544, https://doi.org/10.1006/ecss.1999.0514, 1999.
Cai, L., Shi, W., Miao, Z., and Hao, M.: Accuracy Assessment Measures for Object Extraction from Remote Sensing Images, Remote Sens., 10, 303, https://doi.org/10.3390/rs10020303, 2018.
Chen, S., Fang, L., Li, H., Chen, W., and Huang, W.: Evaluation of a three-band model for estimating chlorophyll-a concentration in tidal reaches of the Pearl River Estuary, China, ISPRS J. Photogramm., 68, 356–364, https://doi.org/10.1016/j.isprsjprs.2011.01.004, 2011.
Chen, S., Han, L., Chen, X., Li, D., Sun, L., and Li, Y.: Estimating wide range Total Suspended Solids concentrations from MODIS 250 m imageries: An improved method, ISPRS J. Photogramm., 99, 58–69, https://doi.org/10.1016/j.isprsjprs.2014.10.006, 2015.
Chen, X., Shen, Z., and Yang, Y.: Response of the turbidity maximum zone in the Yangtze River Estuary due to human activities during the dry season, Environ. Sci. Pollut. R., 11, 1–16, https://doi.org/10.1007/s11356-016-6872-1, 2016.
Feng, H., Cochran, J. K., and Hirschberg, D. J.: Transport and sources of metal contaminants over the course of tidal cycle in the turbidity maximum zone of the Hudson River estuary, Water Res., 36, 733–743, https://doi.org/10.1016/S0043-1354(01)00268-8, 2002.
Gebhardt, A. C., Schoster, F., Gaye-Haake, B., Beeskow, B., Rachold, V., Unger, D., and Ittekkot, V.: The turbidity maximum zone of the Yenisei River (Siberia) and its impact on organic and inorganic proxies, Estuar. Coast. Shelf S., 65, 61–73, https://doi.org/10.1016/j.ecss.2005.05.007, 2005.
Gong, S., Gao, A., Lin, J., Zhu, X., Zhang, Y., and Hou, Y.: Temporal-spatial distribution and its influencing factors of suspended particulate matters in Minjiang lower reaches and estuary, Journal of Earth Sciences and Environment, 39, 826–836, https://doi.org/10.3969/j.issn.1672-6561.2017.06.012, 2017.
Grasso, F., Verney, R., Hir, P. L., Thouvenin, B., Schulz, E., Kervella, Y., Fard, I. K. P., Lemoine, J.-P., Dumas, F., and Garnie, V.: Suspended Sediment Dynamics in the Macrotidal Seine Estuary (France) – Part 1: Numerical Modeling of Turbidity Maximum Dynamics, J. Geophys. Res.-Oceans, 123, 558–577, https://doi.org/10.1002/2016JC012638, 2018.
Gregg, W. W. and Casey, N. W.: Global and regional evaluation of the SeaWiFS chlorophyll data set, Remote Sens. Environ., 93, 463–479, https://doi.org/10.1016/j.rse.2003.12.012, 2004.
Huang, B., Hong, H., Ke, L., and Cao, Z.: Size-fractionated phytoplankton biomass and productivity in the Zhujiang River Estuary in China, Acta Oceanol. Sin., 27, 180–186, https://doi.org/10.3321/j.issn:0253-4193.2005.06.024, 2005.
Jalón-Rojas, I., Schmidt, S., Sottolichio, A., and Bertier, C.: Tracking the turbidity maximum zone in the Loire Estuary (France) based on a long-term, high-resolution and high-frequency monitoring network, Cont. Shelf Res., 117, 1–11, https://doi.org/10.1016/j.csr.2016.01.017, 2016.
Jiang, J., He, Q., Zhu, L., and Lin, J.: Analysis of hydrodynamic features of the North Passage in the turbidity maximum, Changjinag Estuary, Haiyang Xuebo, 41, 11–20, https://doi.org/10.3969/j.issn.0253-4193.2019.01.002, 2019.
Jiang, X., Lu, B., and He, Y.: Response of the turbidity maximum zone to fluctuations in sediment discharge from river to estuary in the Changjiang Estuary (China), Estuar. Coast. Shelf S., 131, 24–30, https://doi.org/10.1016/j.ecss.2013.07.003, 2013.
Kim, H. H., Ko, B. C., and Nam, J. Y.: Predicting chlorophyll-a using Landsat 8 OLI sensor data and the non-linear RANSAC method-a case study of Nakdong River, South Korea, Int. J. Remote Sens., 37, 3255–3271, https://doi.org/10.1080/01431161.2016.1196839, 2016a.
Kim, W., Moon, J.-E., Park, Y.-J., and Ishizaka, J.: Evaluation of chlorophyll retrievals from Geostationary Ocean Color Imager (GOCI) for the North-East Asian region, Remote Sens. Environ., 184, 482–495, https://doi.org/10.1016/j.rse.2016.07.031, 2016b.
Kitheka, J. U., Mavuti, K. M., Nthenge, P., and Obiero, M.: The turbidity maximum zone in a shallow, well-flushed Sabaki estuary in Kenya, J. Sea Res., 110, 17–28, https://doi.org/10.1016/j.seares.2015.03.001, 2016.
Le, C., Li, Y., Zha, Y., Sun, D., Huang, C., and Lu, H.: A four-band semi-analytical model for estimating chlorophyll a in highly turbid lakes: The case of Taihu Lake, China, Remote Sens. Environ., 113, 1175–1182, https://doi.org/10.1016/j.rse.2009.02.005, 2009.
Le, C., Hu, C., Cannizzaro, J., English, D., Muller-Karger, F., and Lee, Z.: Evaluation of chlorophyll-a remote sensing algorithms for an optically complex estuary, Remote Sens. Environ., 129, 75–89, https://doi.org/10.1016/j.rse.2012.11.001, 2013.
Li, L., Ye, T., Wang, X., and Xia, Y.: Tracking the multidecadal variability of the surface turbidity maximum zone in Hangzhou Bay, China, Int. J. Remote Sens., 1–22, https://doi.org/10.1080/01431161.2019.1633701, 2019.
Liu, H., Huang, L., Tan, Y., Ke, Z., Liu, J., Zhao, C., and Wang, J.: Seasonal variations in chlorophyll a and primary production and their influencing factors in the Pearl River Estuary, Journal of Tropical Oceanography, 36, 81–91, available at: http://journal15.magtechjournal.com/Jwk3_rdhyxb/EN/10.11978/2016033 (last access: 11 November 2021), 2017.
Liu, R., Wang, Y., Gao, J., Wu, Z., and Guan, W.: Turbidity maximum formation and its seasonal variations in the Zhujiang (Pearl River) Estuary, southern China, Acta Oceanol. Sin., 35, 22–31, https://doi.org/10.1007/s13131-016-0897-7, 2016.
Mitchell, S., Akesson, L., and Uncles, R.: Observations of turbidity in the Thames Estuary, United Kingdom, Water Environ. J., 26, 511–520, https://doi.org/10.1111/j.1747-6593.2012.00311.x, 2012.
Mitchell, S. B.: Turbidity maxima in four macrotidal estuaries, Ocean Coast. Manage., 79, 62–69, https://doi.org/10.1016/j.ocecoaman.2012.05.030, 2013.
Montanher, O., Novo, E., Barbosa, C., Renno, C., and Silva, T.: Empirical models for estimating the suspended sediment concentration in Amazonian white water rivers using Landsat 5/TM, Int. J. Appl. Earth Obs., 29, 67–77, https://doi.org/10.1016/j.jag.2014.01.001, 2014.
NASA (National Aeronautics and Space Administration): The EO-1 Extended Mission, available at: http://eo1.usgs.gov (last access: 9 November 2021), 2001.
Park, K., Wang, H. V., Kim, S.-C., and Oh, J.-H.: A Model Study of the Estuarine Turbidity Maximum along the Main Channel of the Upper Chesapeake Bay, Estuar. Coast., 31, 115–133, https://doi.org/10.1007/s12237-007-9013-8, 2008.
Pozdnyakov, D., Shuchman, R., Korosov, A., and Hatt, C.: Operational algorithm for the retrieval of water quality in the Great Lakes, Remote Sens. Environ., 97, 352–370, https://doi.org/10.1016/j.rse.2005.04.018, 2005.
Schubel, J.: Turbidity maximum of the northern chesapeake bay, Science, 161, 1013–1015, https://doi.org/10.1126/science.161.3845.1013, 1968.
Shen, H.: New understanding on the study of the maximum turbidity zone in estuaries of China, Advence in Earth Sciences, 10, 210–212, available at: http://www.adearth.ac.cn/CN/10.11867/j.issn.1001-8166.1995.02.0210 (last access: 11 November 2021), 1995.
Shen, H., He, S., Mao, Z., and Li, J.: On the turbidity maximum in the Chinese estuaries, J. Sediment. Res., 1, 23–29, https://doi.org/10.3321/j.issn:0468-155X.2001.01.004, 2001.
Shi, W., Shen, H., and Li, J.: Review on the formation of estuarine turbidity maximum, Advence in Earth Sciences, 8, 8–13, available at: http://www.adearth.ac.cn/EN/volumn/volumn_136.shtml (last access: 11 November 2021), 1993.
Shi, Z., Xu, J., Huang, X., Zhang, X., Jiang, Z., Ye, F., and Liang, X.: Relationship between nutrients and plankton biomass in the turbidity maximum zone of the Pearl River Estuary, J. Environ. Sci., 57, 72–84, https://doi.org/10.1016/j.jes.2016.11.013, 2017.
Song, K., Li, L., Tedesco, L. P., Li, S., Duan, H., Liu, D., Hall, B. E., Du, J., Li, Z., Shi, K., and Zhao, Y.: Remote estimation of chlorophyll-a in turbid inland waters: Three-band model versus GA-PLS model, Remote Sens. Environ., 136, 342–357, https://doi.org/10.1016/j.rse.2013.05.017, 2013.
Toublanc, F., Brenon, I., and Coulombier, T.: Formation and structure of the turbidity maximum in the macrotidal Charente estuary (France)_Influence of fluvial and tidal forcing, Estuar. Coast. Shelf S., 169, 1–14, https://doi.org/10.1016/j.ecss.2015.11.019, 2016.
Uncles, R. J., Bloomer, N. J., Frickers, P. E., Griffiths, M. L., Harris, C., Howland, R. J. M., Morris, A. W., Plummer, D. H., and Tappin, A. D.: Seasonal variability of salinity, temperature, turbidity and suspended chlorophyll in the Tweed Estuary, Sci. Total Environ., 251/252, 115–124, https://doi.org/10.1016/S0048-9697(00)00405-8, 2000.
USGS (US Geological Survey): Land Remote Sensing (LRS) Program: The Landsat project, available at: https://landsat.usgs.gov (last access: 9 November 2021), 1982.
Wai, O. W. H., Wang, C., Li, Y., and Li, X.: The formation mechanisms of turbidity maximum in the Pearl River estuary, China, Mar. Pollut. Bull., 48, 441–448, https://doi.org/10.1016/j.marpolbul.2003.08.019, 2004.
Wan, Y. and Wang, L.: Numerical investigation of the factors influencing the vertical profiles of current, salinity, and SSC with in a turbidity maximum zone, Int. J. Sediment Res., 32, 20–33, https://doi.org/10.1016/j.ijsrc.2016.07.003, 2017.
Wang, C., Chen, S., Li, D., Wang, D., Liu, W., and Yang, J.: A Landsat-based model for retrieving total suspended solids concentration of estuaries and coasts in China, Geosci. Model Dev., 10, 4347–4365, https://doi.org/10.5194/gmd-10-4347-2017, 2017a.
Wang, C., Li, D., Wang, D., and Chen, S.: Detecting the Temporal and Spatial Changes of Suspended Sediment Concentration in Hanjiang River Estuary During the Past 30 Years Using Landsat Imageries, Research Journal of Environmental Science, 11, 143–155, https://doi.org/10.3923/rjes.2017.143.155, 2017b.
Wang, C., Li, W., Chen, S., Li, D., Wang, D., and Liu, J.: The spatial and temporal variation of total suspended solid concentration in Pearl River Estuary during 1987–2015 based on remote sensing, Sci. Total Environ., 618, 1125–1138, https://doi.org/10.1016/j.scitotenv.2017.09.196, 2018.
Wang, C., Chen, S., Yang, J., Li, Y., Zhou, X., Li, D., and Wang, D.: Monitoring total suspended solids concentrations in estuaries based on remote sensing, China Water & Power Press, Beijing, China, 2020a.
Wang, C., Wang, D., Yang, J., Fu, S., and Li, D.: Suspended Sediment within Estuaries and along Coasts: A Review of Spatial and Temporal Variations based on Remote Sensing, J. Coastal Res., 36, 1323–1331, https://doi.org/10.2112/JCOASTRES-D-19-00164.1, 2020b.
Wang, C., Zhou, C., Chen, S., Xie, Y., Li, D., Yang, J., Zhou, X., Li, Y., Wang, D., and Liu, Y.: Retrospect and perspective of the estuarine turbidity maximum zone researches, Chinese Sci. Bull., 66, 2328–2342, https://doi.org/10.1360/TB-2020-0938, 2021.
Yan, D., Song, D., and Bao, X.: Spring-neap tidal variation and mechanism analysis of the maximum turbidity in the Pearl River Estuary during flood season, Journal of Tropical Oceanography, 39, 20–35, available at: http://journal15.magtechjournal.com/Jwk3_rdhyxb/EN/10.11978/2019035 (last access: 11 November 2021), 2020.
Yang, J. and Liu, W.: Characteristics of the maximum turbidity zone in the lingdingyang-Pearl river estuary during the flood season in the recent 30 years, Pearl River Water Transport, 16, 58–62, https://doi.org/10.14125/j.cnki.zjsy.2015.16.034, 2015.
Yang, Y., Li, Y., Sun, Z., and Fan, Y.: Suspended sediment load in the turbidity maximum zone at the Yangtze River Estuary: The trends and causes, J. Geogr. Sci., 24, 129–142, https://doi.org/10.1007/s11442-014-1077-3, 2014.
Yu, Q., Wang, Y., Gao, J., Gao, S., and Flemming, B.: Turbidity maximum formation in a well-mixed macrotidal estuary: The role of tidal pumping, J. Geophys. Res.-Oceans, 119, 7705–7724, https://doi.org/10.1002/2014JC010228, 2014.
Zhang, X., Chen, X., Dou, X., Zhao, X., Xia, W., Jiao, J., and Xu, H.: Study on formation mechanism of turbidity maximum zone and numerical simulations in the macro tidal estuaries, Advances in Water Science, 30, 84–92, https://doi.org/10.14042/j.cnki.32.1309.2019.01.009, 2019.