the Creative Commons Attribution 4.0 License.
the Creative Commons Attribution 4.0 License.
 | 13 Oct 2021
Modeling sensitivities of BVOCs to different versions of MEGAN emission schemes in WRF-Chem (v3.6) and its impacts over eastern China
Mingshuai Zhang
Chun Zhao
Yuhan Yang
Qiuyan Du
Yonglin Shen
Shengfu Lin
Wenjing Su
Cheng Liu
Biogenic volatile organic compounds (BVOCs) simulated by current air quality and climate models still have large uncertainties, which can influence atmospheric chemistry and secondary pollutant formation. These modeling sensitivities are primarily due to two sources. One originates from different treatments in the physical and chemical processes associated with the emission rates of BVOCs. The other is errors in the specification of vegetation types and their distribution over a specific region. In this study, the version of the Weather Research and Forecasting model coupled with Chemistry (WRF-Chem) updated by the University of Science and Technology of China (USTC version of WRF-Chem) from the public WRF-Chem(v3.6) is used. The modeling results over eastern China with different versions (v1.0, v2.0, v3.0) of the Model of Emissions of Gases and Aerosols from Nature (MEGAN) in WRF-Chem are examined or documented. Sensitivity experiments with these three versions of MEGAN and two vegetation datasets are conducted to investigate the difference of three MEGAN versions in modeling BVOCs and its dependence on the vegetation distributions. The experiments are also conducted for spring (April) and summer (July) to examine the seasonality of the modeling results. The results indicate that MEGAN v3.0 simulates the largest amount of biogenic isoprene emissions over eastern China. The different performance among MEGAN versions is primarily due to their different treatments of applying emission factors and vegetation types. In particular, the results highlight the importance of considering the sub-grid vegetation fraction in estimating BVOC emissions over eastern China, which has a large area of urbanization. Among all activity factors, the temperature-dependent factor dominates the seasonal change of activity factor in all three versions of MEGAN, while the different response to the leaf area index (LAI) change determines the difference among the three versions in seasonal variation of BVOC emissions. The simulated surface ozone concentration due to BVOCs can be significantly different (ranging from 1 to more than 10 ppbv in some regions) among the experiments with three versions of MEGAN, which is mainly due to their impacts on surface VOCs and NOx concentrations. Theoretically MEGAN v3.0 that is coupled with the land surface scheme and considers the sub-grid vegetation effect should overcome previous versions of MEGAN in WRF-Chem. However, considering uncertainties of retrievals and anthropogenic emissions over eastern China, it is still difficult to apply satellite retrievals of formaldehyde and/or limited sparse in situ observations to constrain the uncertain parameters or functions in BVOC emission schemes and their impacts on photochemistry and ozone production. More accurate vegetation distribution and measurements of biogenic emission fluxes and species concentrations are still needed to better evaluate and optimize models.
- Article
(5608 KB) - Full-text XML
-
Supplement
(3161 KB) - BibTeX
- EndNote


-
Modeling performance of BVOC and its impact over eastern China using different versions (v1.0, v2.0, v3.0) of Model of Emissions of Gases and Aerosols from Nature (MEGAN) in WRF-Chem(v3.6) are examined and documented.
-
Three versions of MEGAN show different sensitivity to vegetation distributions and simulate different seasonal variations of BVOC emissions over eastern China.
-
The temperature-dependent factor dominates the seasonal change of activity factor in all three versions of MEGAN, while the different response to the change of leaf area index determines the difference among the three versions in seasonal variation of BVOC emissions.
-
The surface ozone concentration can be significantly affected by BVOC emissions over eastern China, but the impact is sensitive to the MEGAN versions.
Volatile organic compounds (VOCs) in the atmosphere are from biogenic and anthropogenic sources. Previous studies have indicated that biogenic emission is the dominant source of VOCs, accounting for about 90 % of total emissions at global scale (Guenther et al., 1995). Biogenic VOCs (BVOCs) play a critical role in atmospheric chemistry because some species such as isoprene and monoterpenes are reactive and can participate in atmospheric photochemical reactions. Therefore, BVOCs could have a significant impact on the formation of ozone and secondary organic aerosol (SOA) and ultimately air quality and climate change (Pierce et al., 1998; Carslaw et al., 2000; Poisson et al., 2000; Zhang et al., 2000; Carlton et al., 2009; Brown et al., 2013; Hantson et al., 2017). Among the BVOC species, isoprene is one of the key identified species that dominates the BVOC emissions. Global estimation also shows that biogenic isoprene emission is approximately half of total BVOC emissions (Guenther et al., 2012).
Due to the importance of BVOCs for the atmospheric environment, progress has been made extensively in modeling BVOC emission and its impacts regionally and globally over the past several decades (Geron et al., 1994; Guenther et al., 1995; Niinemets et al., 1999; Arneth et al., 2007). BVOC emissions are normally estimated with numerical schemes, such as the Seasonal Isoprene synthase Model-Biochemical Isoprenoid biosynthesis Model (SIM-BIM) (Lehning et al., 2001; Zimmer et al., 2003), the Biogenic Emission Inventory System (BEIS) (Pierce et al., 1998), the Global Biosphere Emissions and Interactions System (GloBEIS3) (Yarwwod et al., 2002), the semi-empirical BVOC emission model (seBVOC) (Stewart et al., 2003) and the Model of Emissions of Gases and Aerosols from Nature (MEGAN) (Guenther et al., 2006, 2012; Zhao et al., 2016; Jiang et al., 2018). MEGAN is one of the most widely used emission schemes for estimating BVOC emissions under different environmental conditions and has been coupled with multiple chemical transport models to include the impact of BVOCs on air pollutants (Levis et al., 2003; Yang et al., 2011; Ghude et al., 2013; Situ et al., 2013; Tie et al., 2013; Li and Xie, 2014; Forkel et al., 2015; Kota et al., 2015; Liu et al., 2018; Wu et al., 2020). However, there still remain larger uncertainties in the estimation of BVOC emission with MEGAN, due to the uncertain emission rates of some compounds, the limited knowledge of environmental activity factors controlling the BVOC emissions, the accuracy of vegetation distributions, etc. (Guenther, 2013).
WRF-Chem (Weather Research and Forecasting model coupled with Chemistry) is an online coupled meteorology and chemistry model that can simulate meteorology fields and chemical species simultaneously (Grell et al., 2005; Fast et al., 2006). The MEGAN scheme is widely used for estimating biogenic emissions online with WRF-Chem (Jiang et al., 2012a; Wang et al., 2015; Abdi-Oskouei et al., 2018; Wei et al., 2018; Arghavani et al., 2019; Safronov et al., 2019; Visser et al., 2019; Li et al., 2020; Yin et al., 2020). The public versions (v4.2 and older) of WRF-Chem include the first MEGAN version (referred to as MEGAN v1.0 hereafter) (Guenther et al., 1995) and the second version (referred to as MEGAN v2.0 hereafter) (Guenther et al., 2006). The first version is an earlier scheme with simple canopy treatment and chemical mechanism, considering only the environmental effects from light and temperature on emission flux, and therefore is mainly used in previous studies (e.g., Guenther et al., 1996; Derognat et al., 2003) but not often in recent studies. Comparatively, MEGAN v2.0 is more commonly used for calculating the BVOC emissions with WRF-Chem recently (Geng et al., 2011; Jiang et al., 2012b; Zhang et al., 2015; Zhou et al., 2017) due to its treatment of additional chemical compounds and plant types for emissions. It also considers more complex environmental controlling processes. MEGAN v2.1 (Guenther et al., 2012) was recently coupled with WRF-Chem embedded in the CLM4 land surface scheme (Zhao et al., 2016), so that MEGAN obtains the meteorological fields that are calculated online and the consistent vegetation types from the land surface scheme. Although all these three MEGAN versions were coupled in WRF-Chem and used for estimating BVOC emissions, so far the difference among these MEGAN versions in terms of modeling BVOC emission and its impacts in WRF-Chem is not examined and documented.
With the rapid increase in economic development during the past several decades, eastern China has become the most economically prosperous and developed region of China. More and more air pollutants and precursors are emitted into the atmosphere over the region. Previous studies have found that BVOCs play important roles in air pollutant production over eastern China (e.g., Han et al., 2005; Wei et al., 2007; Wang et al., 2008; Fu et al., 2010; Zheng et al., 2010; H. Li et al., 2015; L. Li et al., 2015). Tie et al. (2013) found that the ozone formation was strongly VOC-limited in Shanghai in eastern China, and its production could be partly attributed to the biogenic emission of isoprene. Jiang et al. (2012b) investigated the impacts of local biogenic and anthropogenic emissions to the daytime mean ozone mixing ratios over eastern China using WRF-Chem with MEGAN v2.0. Geng et al. (2011) applied WRF-Chem with MEGAN v2.0 for studying the effect of isoprene on ozone formation in Shanghai, and they found that the BVOCs from the large surrounding forest have significant impact on ozone production through two different mechanisms. G. Li et al. (2017) employed WRF-Chem with MEGAN v2.0 to estimate the relative contribution of biogenic and anthropogenic sources to ozone concentration over eastern China and concluded that the BVOCs contributed significantly to the background ozone concentration. Wang et al. (2019) found that the ozone concentration in the south of Shanghai can be enhanced significantly due to the mixing of the emissions of BVOCs from the forest and precursors from the ships.
Since the WRF-Chem model with different MEGAN versions has been widely used for studying the impacts of BVOCs on air quality over eastern China while the performance of different MEGAN versions in WRF-Chem has not been examined, this study aims to investigate the difference of MEGAN versions in terms of modeling BVOCs, focusing on biogenic isoprene and its impact on ozone concentration over eastern China. This study updates the MEGAN v2.1 coupled by Zhao et al. (2016) to the latest version MEGAN v3.0 (Jiang et al., 2018) (see details in Sect. 2.2) and analyzes the difference of WRF-Chem modeling results with MEGAN v1.0, MEGAN v2.0 and MEGAN v3.0. Numerical experiments are conducted for April and July of 2015 to reflect the seasonal variation of biogenic isoprene emissions and its potential impacts. In order to examine the different sensitivities of MEGAN versions in WRF-Chem to vegetation distributions, two land-use datasets are adopted in this study, which are USGS24 (United States Geological Survey 24 categories classification) and MODIS2015 (a new dataset derived from the satellite retrievals in this study representing the land-use condition of 2015). In summary, this study documents the different performance among different versions of MEGAN and its impacts on ozone and other chemical compounds, which can provide the WRF-Chem community with more comprehensive analysis to understand the mechanisms of modeling sensitivities in BVOCs among different versions of MEGAN in WRF-Chem and vegetation distributions. The different response to seasonal change and vegetation distributions are also quantified. On the other hand, modeling sensitivity analysis also provides more information about what and where to measure for better constraining the modeling of BVOCs over eastern China. The paper is organized as follows. Section 2 describes the numerical experiments and methods. The results and discussions are presented in Sect. 3. A summary is provided in Sect. 4.
2.1 WRF-Chem
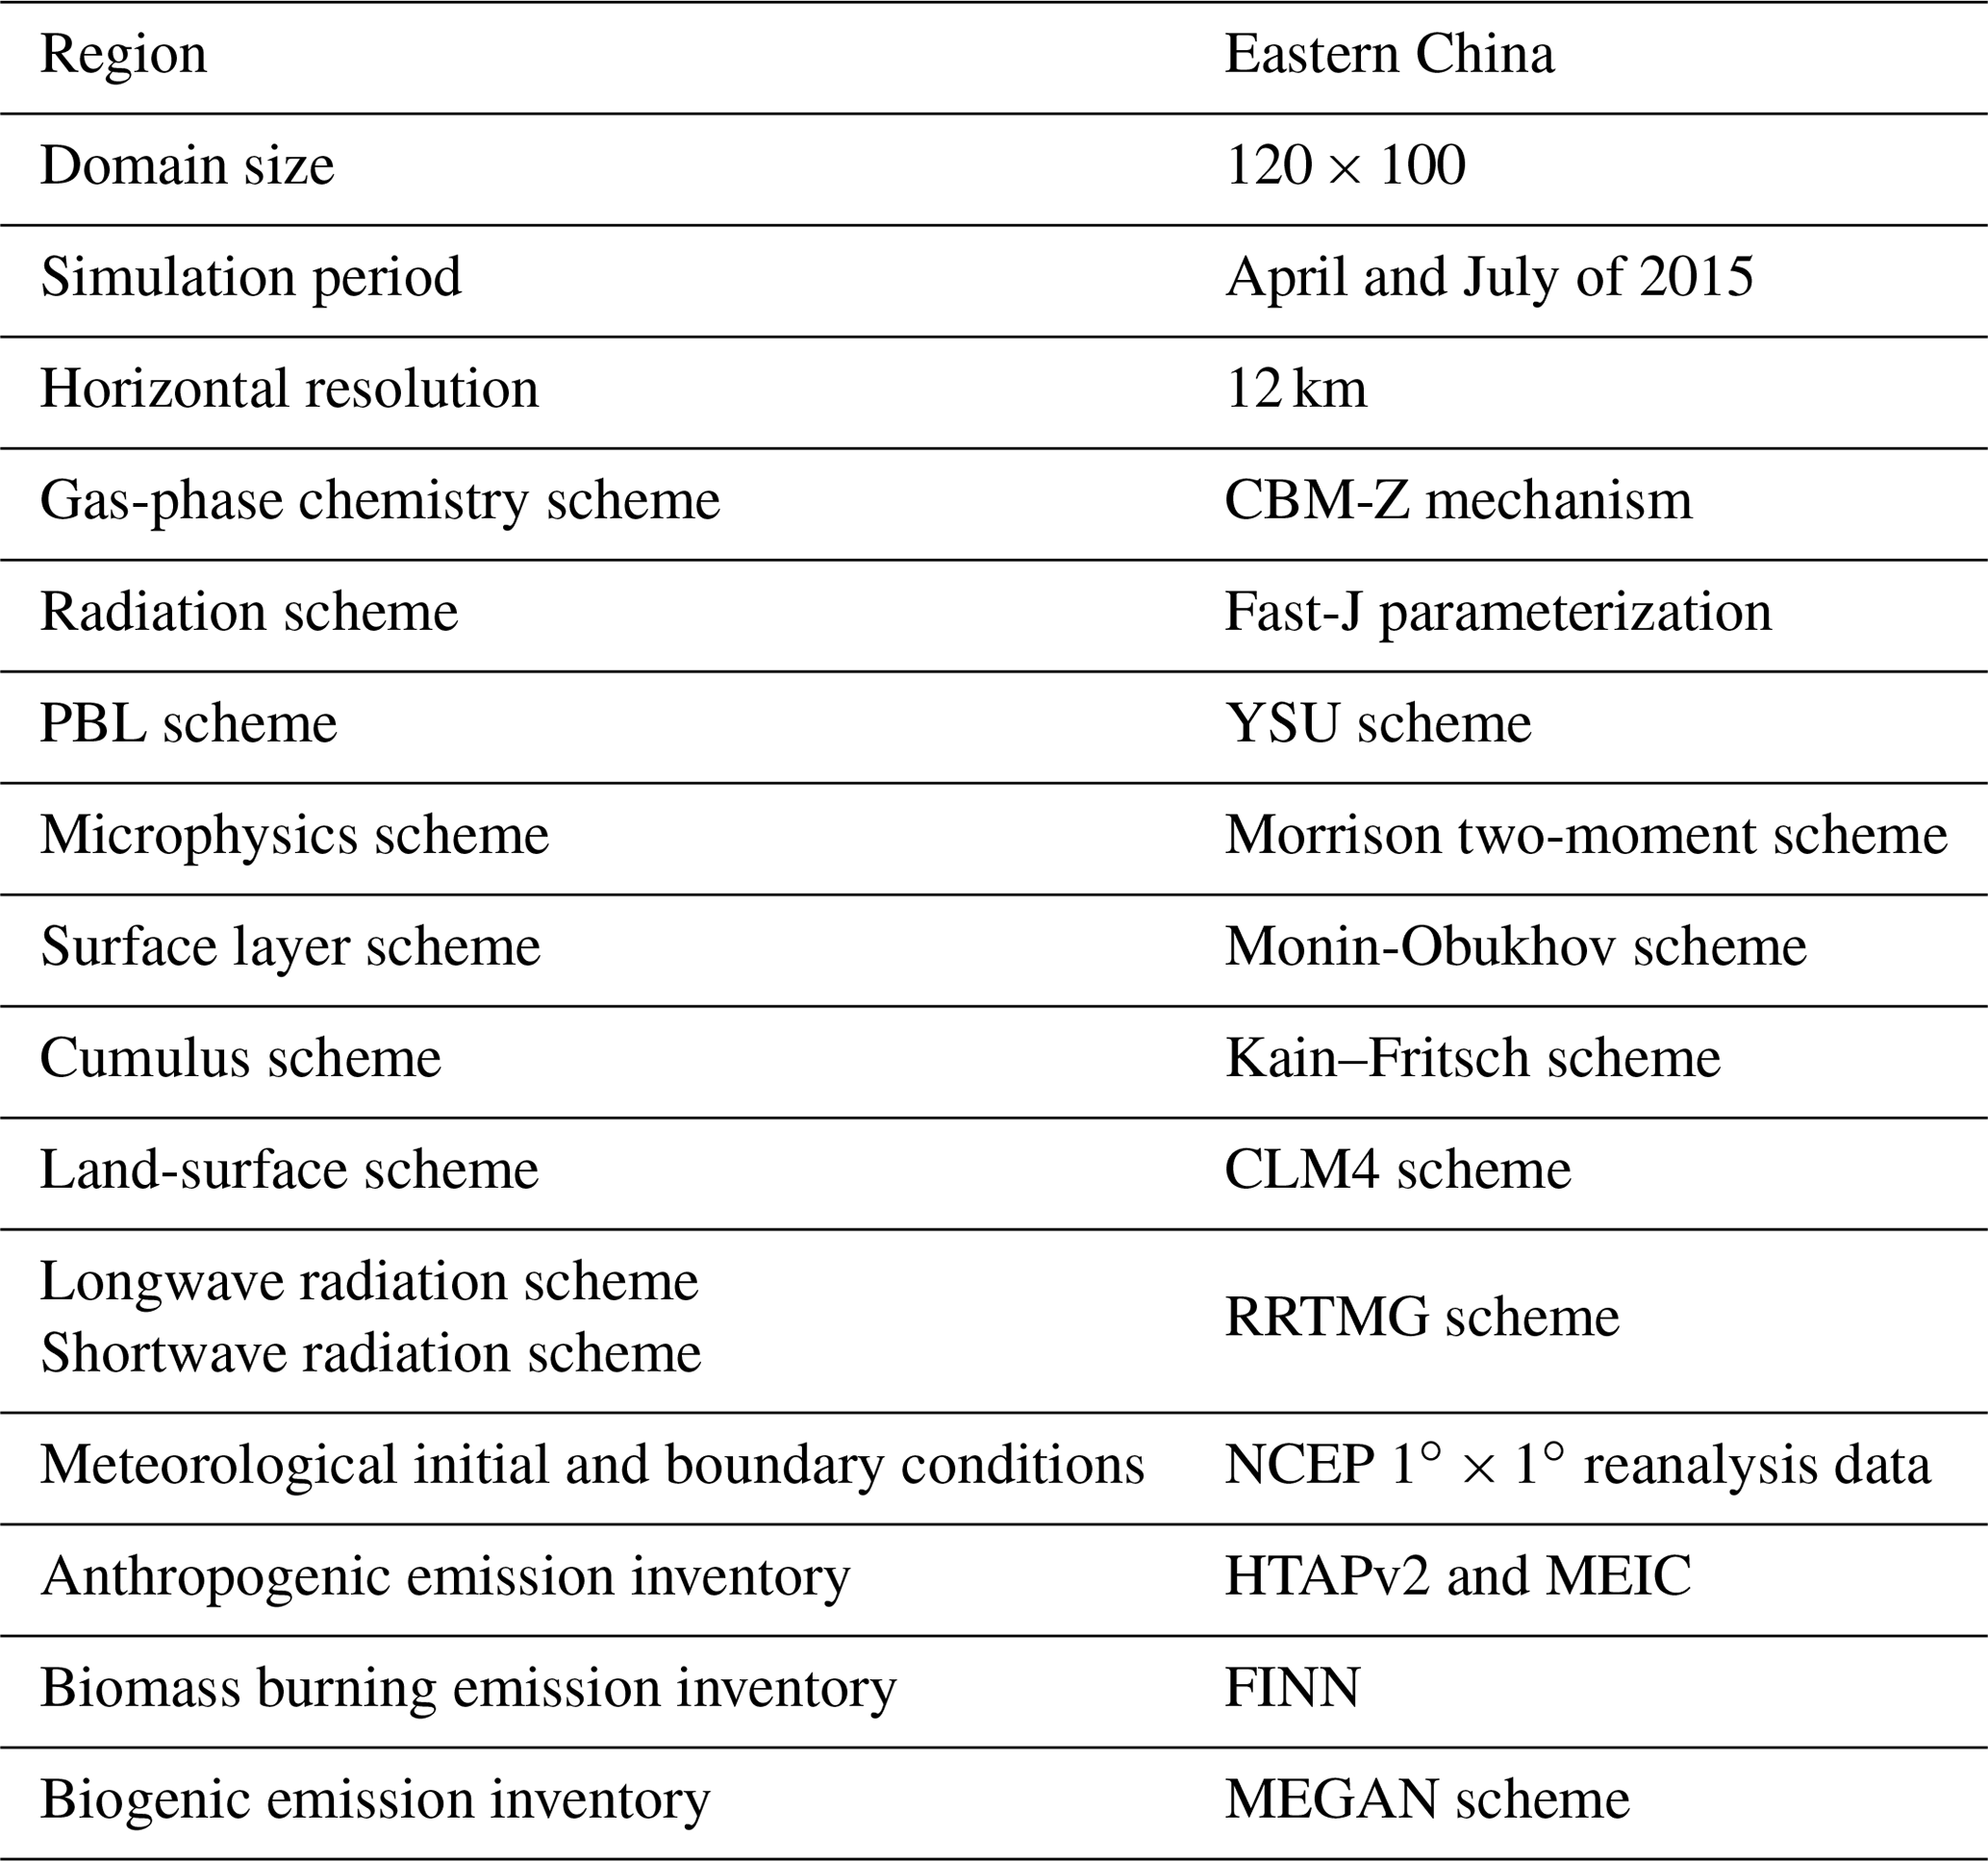
The version of WRF-Chem updated by University of Science and Technology of China (USTC version of WRF-Chem) is used in this study. Compared with the publicly released version, this USTC version of WRF-Chem includes some additional functions such as the MEGAN scheme implemented in the land surface model (Zhao et al., 2013a, b, 2014, 2016). The configuration of WRF-Chem in this study is similar to that used by Zhao et al. (2016). In brief, the CBM-Z photochemical mechanism (Zaveri and Peters, 1999) is selected to simulate the gas-phase chemistry that contains 55 prognostic species and 134 reactions. The photolysis rates is computed by the Fast-J radiation parameterization (Wild et al., 2000), and the Yonsei University (YSU) scheme (Hong et al., 2006) is for planetary boundary layer (PBL) parameterization. All of the WRF-Chem simulations use the Morrison two-moment scheme (Morrison et al., 2009) for cloud physics, the Monin–Obukhov similarity theory (Paulson, 1970) for the surface layer, the Kain–Fritsch scheme (Kain, 2004) to simulate sub-grid-scale clouds and precipitation, and the rapid radiative transfer parameterization (RRTMG) for both longwave and shortwave radiation (Iacono et al., 2008). In order to show the design of experiment clearly, all configurations are listed in Table 1.
2.2 MEGAN implemented in WRF-Chem
MEGAN is a widely used scheme for calculating biogenic emissions from the terrestrial system to the atmosphere with the impact from different environmental conditions, such as radiation, temperature, soil moisture and leaf area. However, different versions of MEGAN implement different treatments for calculating emission rates and environmental forcing, and therefore, the detailed difference of these versions of MEGAN in WRF-Chem and their impacts on modeling results need to be quantified. Three versions of MEGAN (MEGAN v1.0, MEGAN v2.0 and MEGAN v3.0) coupled online with WRF-Chem are investigated in this study. The details about these three different versions are described below.
MEGAN in WRF-Chem estimates the biogenic emission (Fi) of different chemical compounds (i) based on emission factors (εi) (µg m−2 h−1), activity factors (γi) that are controlled by environmental conditions, and the loss and production rate within the plant canopy (ρ).
where εi is a plant functional type (PFT) weighted value that is calculated by PFT-specific emission factor εi,j and grid box area coverage fraction fPFT(j) of PFT(j), i.e., , and γi is the product of each activity factor such as leaf-level photosynthetic photon flux density (PPFD) (γP), temperature (γt), leaf area index (LAI) (γLAI) and leaf age (γa), i.e., γi=γLAIγPγtγa
MEGAN v1.0 is the first model version coupled in WRF-Chem. It considers only the response of emission to radiation and temperature. The mechanism of environmental impact is very simple compared with the later versions. For emission factors, MEGAN v1.0 follows the land surface scheme with 24 land use types and prescribes emission factors for each land-use type (Fig. 2). It groups the 24 land-use types into the 6 plant categories (urban or bare soil, agriculture, grassland, deciduous forest, mixed forest, and other natural land) for calculating biogenic emission activity factor.
Guenther et al. (2006) introduced MEGAN v2.0, which is a major update from the previous version. The emission factor of BVOCs for each grid cell can be prescribed or calculated with a prescribed vegetation distribution and emission factor for each PFT. For activity factor, the impacts of PPFD, temperature, monthly LAI, leaf age, soil moisture and solar radiation on biogenic emissions are taken into account (Guenther et al., 2006).
Different from the offline MEGAN v2.0, after coupling with WRF-Chem, MEGAN v2.0 reads emission factors at each grid cell for isoprene and calculates emission factors for other BVOCs based on PFTs and PFT-specified emission factors at each grid cell. The vegetation distribution at each grid cell used in MEGAN v2.0 in WRF-Chem includes only four dominant PFT at each grid cell and is prescribed differently from the one used in the land surface scheme (e.g., 24 land-use types). In addition, the MEGAN v2.0 coupled with the publicly released versions of WRF-Chem uses the monthly mean surface air temperature, LAI and solar radiation from the climatological database that may not be consistent with the meteorological fields during simulation.
The MEGAN v3.0 employed in this study is updated from MEGAN v2.1 as implemented by Zhao et al. (2016). Zhao et al. (2016) implemented MEGAN v2.1 into CLM4.0 in WRF-Chem so that biogenic emission and land surface processes can use consistent distributions of meteorological fields such as land-use type, surface air temperature, LAI and solar radiation, which is significantly different from previous versions (v1.0 and v2.0) in terms of scheme structure because the coupling of previous versions of MEGAN is independent of land surface scheme. Compared to the widely used MEGAN v2.0 in WRF-Chem that defines emission factor as the total flux of chemical compounds, MEGAN v2.1 defines emission factor as the net primary emission that escaped into the atmosphere, and it does not contain the downward flux of chemicals from above canopy, as detailed in Zhao et al. (2016). In addition, MEGAN v2.1 can also consider sub-grid vegetation distributions, which is different from previous versions that generally apply dominant vegetation type in each grid for BVOC emission calculation. The primary update in MEGAN v3.0 from MEGAN v2.1 is to consider the drought activity factor as one of environmental forcing. It is implemented in this study to include the effect of drought on biogenic emissions following the drought feedback mechanism introduced by Jiang et al. (2018) and the technical description of CLM4.0 (Oleson et al., 2010). They presented a more sophisticated mechanistic representation of BVOC emission in MEGAN to simulate the impact of drought on biogenic isoprene emissions. The new drought activity factor γd,isoprene is calculated as the following formula:
where α is an empirical and regionally applicable value derived from field measurements at the Missouri Ozarks AmeriFlux observation site (MOFLUX) to limit and modify the isoprene emission due to the drought force. Therefore, the value of α may not be suitable for China. However, due to the lack of observations in China, the default α value is used in this study. Vcmax is the photosynthetic enzyme activity, and βt is the soil water stress function calculated as follows:
where wi is the wilting factor based on soil water potential at each soil layer, and ri is the fraction of roots in the soil layer. More details can be found in the CLM4.0 technical notes (Oleson et al., 2010). It is noteworthy that the major difference between MEGAN v3.0 and previous versions is primarily caused by the difference between MEGAN v2.1 and previous versions as discussed above instead of drought effect.
2.3 Vegetation distribution
Zhao et al. (2016) suggested that the distributions of vegetation types play an important role in determining regional emissions of BVOCs with MEGAN. Two vegetation datasets are used to examine the sensitivities of BVOC emissions with different MEGAN versions to vegetation distributions. One is the default land cover dataset (USGS24) used in WRF-Chem (referred to as VEG-USGS hereafter), which generally represents the land cover information for the 1990s over eastern China (Loveland et al., 2000). It is converted to a 16-PFT dataset in CLM4.0 following the table derived by Bonan (1996) and Zhao et al. (2016). Specific descriptions of the legend and class of the land cover data are listed in the Table 2. Another land cover dataset is derived from the Moderate Resolution Imaging Spectroradiometer (MODIS) retrievals in 2015 (referred to as VEG-2015 hereafter) and converted to 16-PFT data using the same method as VEG-USGS, which has the horizontal resolution of 1 km over all of China. VEG-2015 retrievals were reclassified on the existing products of 2015, including GFSAD1000 (Cropland Extent 1km Crop Dominance, Global Food-Support Analysis Data) (Thenkabail et al., 2012), and MODIS MCD12Q1 (MODIS Land Cover Type Yearly Global 500m) products (Friedl et al., 2002). For the MCD12Q1 product, there are six different classification schemes (Gregorio, 2005), in which the two schemes of FAO (Food and Agriculture Organization) LCCS (Land Cover Classification System) land cover and FAO LCCS surface hydrology were used. Theoretically, VEG-2015 should be more representative for the reality in 2015, particularly for eastern China, which has undergone intensive urban expansion since the 2000s.
Table 2The domain averaged fractions of PFTs in two vegetation datasets.

Figure 1 shows the spatial distributions of the dominant PFT within each model grid cell (see details in Sect. 2.4) over eastern China from these two vegetation datasets. It is apparent that VEG-2015 is very different from VEG-USGS. The Z-shaped urban belt of the Yangtze River Delta region is evident in VEG-2015 but not in VEG-USGS. Not only the dominant PFT but also the sub-grid distributions of PFTs are different between the two datasets (not shown); all these can show that VEG-2015 conforms more with the recent land cover in China than VEG-USGS. Table 2 illustrates the percentage of each PFT averaged over the simulated domain from the two vegetation datasets. For example, the fractions of a needleleaf evergreen tree that is a major species of biogenic emissions range from 7.9 % in VEG-USGS to 1.7 % in VEG-2015, and the fraction of bare soil is nearly twice that of VEG-USGS. The emissions of BVOCs from MEGAN could be significantly different due to this difference. The sensitivity of estimated BVOC emissions to these two vegetation distributions may also be different due to the different treatment of vegetation type in three versions of MEGAN used in this study.
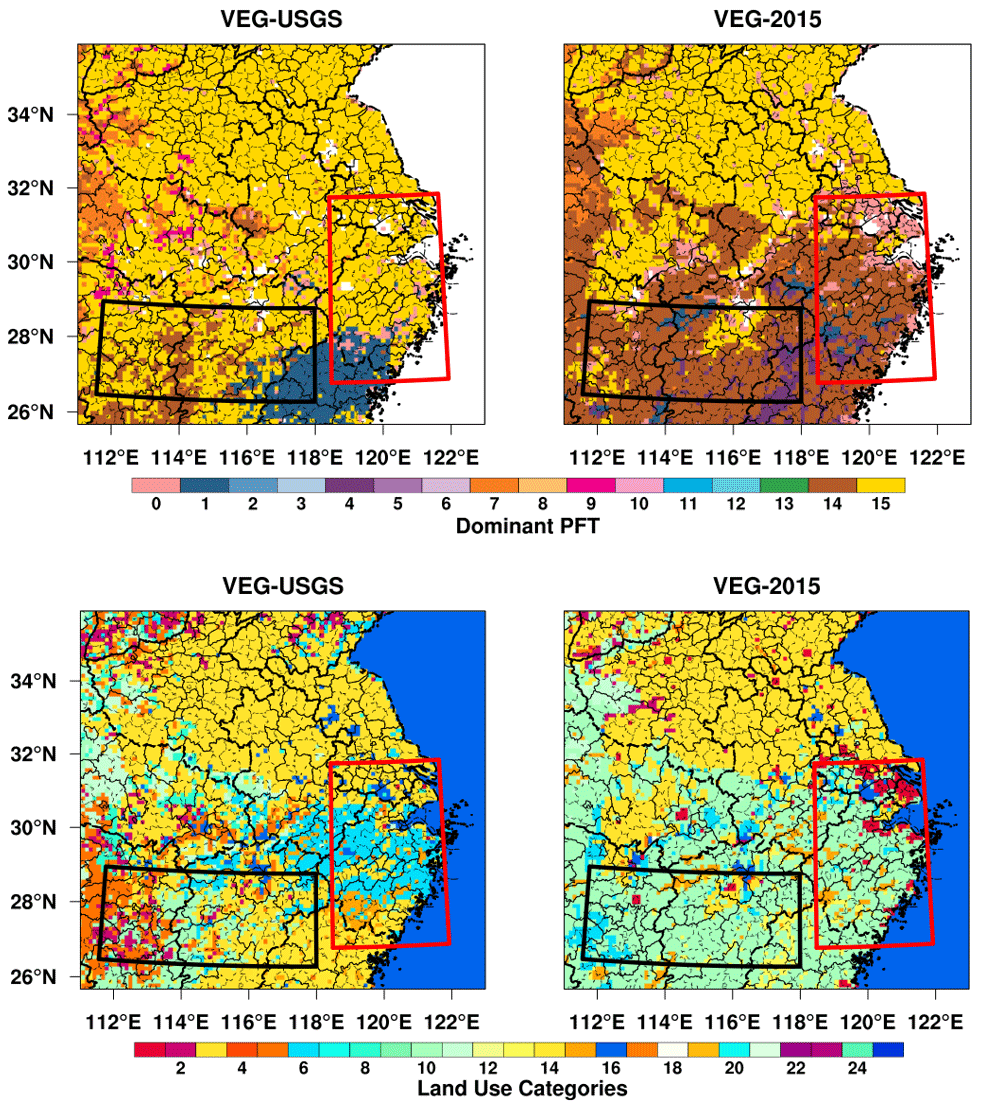
Figure 1Spatial distribution of two different vegetation datasets (VEG-USGS and VEG-2015) and dominant PFT derived from them in each grid over the simulation domain.
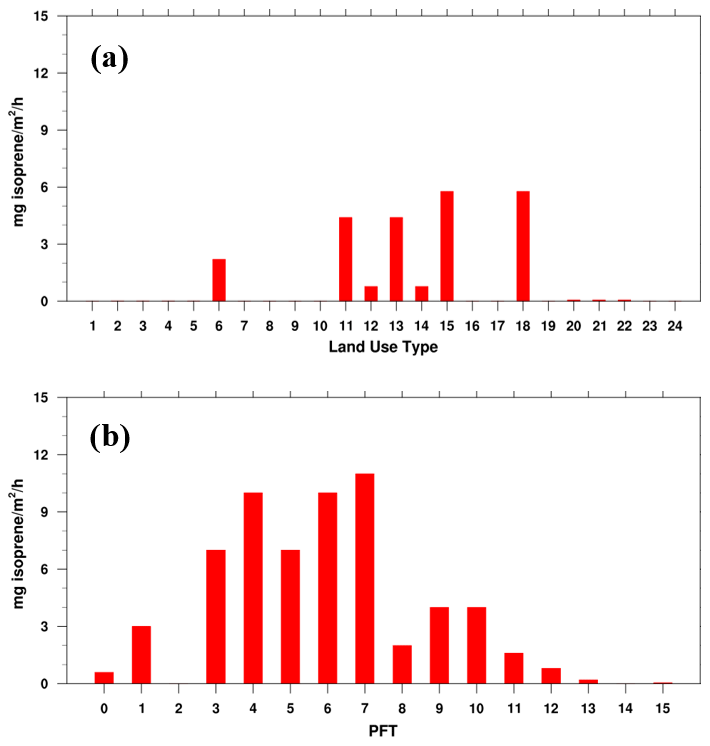
Figure 2Biogenic emission factor for each land use category in (a) MEGAN v1.0, and (b) for each PFT in MEGAN v3.0. The PFT numbers 0–15 are listed in Table 2.
2.4 Numerical experiments
In this study, the simulations are conducted with a horizontal resolution of 12 km and 120 × 100 grid cells (109.3–125.6∘ E, 25.4–36.4∘ N; Fig. S1 in the Supplement) over eastern China. The simulation periods are April and July of 2015, representing one month of spring and summer, respectively, to reflect the seasonal variation of biogenic emission. The quasi-global WRF-Chem simulation with 360 × 145 grid cells (67.5∘ S–77.5∘ N, 180∘ W–180∘ E) at the 1∘ × 1∘ horizontal resolution is used to provide the chemical boundary condition. The meteorological initial and lateral boundary conditions are obtained from the NCEP final reanalysis (FNL) data with 1∘ × 1∘ resolution and updated every 6 h. The modeled u and v component wind and temperature in the atmosphere above the planetary boundary layer are nudged towards the NCEP final reanalysis data with a 6 h timescale (Stauffer and Seaman, 1990). In this way, the simulated key meteorological fields (e.g., surface temperature, precipitation, surface net solar radiation and soil moisture) are close to the FNL reanalysis data (Figs. S2–S5 in the Supplement), which sets the basis for further investigating the impacts of different MEGAN versions. There are a few days in July when the simulated surface solar radiation fluxes have positive biases, which may be due to the biases of clouds and the lack of aerosol radiative impacts in the simulations. The nudged simulations also guarantee that the difference in simulated BVOCs is from the difference in MEGAN versions instead of the meteorological difference.
Anthropogenic emissions for these simulations are obtained from the Hemispheric Transport of Air Pollution version 2 (HTAPv2) at 0.1∘ × 0.1∘ horizontal resolution and monthly temporal resolution for 2010 (Janssens-Maenhout et al., 2015), while the Multi-resolution Emission Inventory for China (MEIC) at 0.1∘ × 0.1∘ horizontal resolution for 2015 (Li et al., 2017a, b) is used to replace the emissions over China within the simulation domain. Biomass burning emissions are obtained from the Fire Inventory from NCAR (FINN) at 1 km horizontal resolution and hourly temporal resolution (Wiedinmyer et al., 2011) and follow the injection heights proposed by Dentener et al. (2006) in the Aerosol Comparison between Observations and Models (AeroCom) and the diurnal variation provided by WRAP (2005). The GOCART dust emission scheme (Ginoux et al., 2001) is used to calculated the vertical dust flux, and the dust particles emitted into the atmosphere are distributed by the MOSAIC aerosol size bins based on the physics of scale-invariant fragmentation of brittle materials provided by Kok (2011). Sea-salt emissions are similar to Zhao et al. (2013a), who corrected particles with radius less than 0.2 µm and considered the dependence of the temperature of sea surface. More details about the sea-salt emissions and dust emission scheme coupled with MOSAIC aerosol scheme in WRF-Chem can be found in Zhao et al. (2010). Soil and lightning NOx sources are not included in this study.
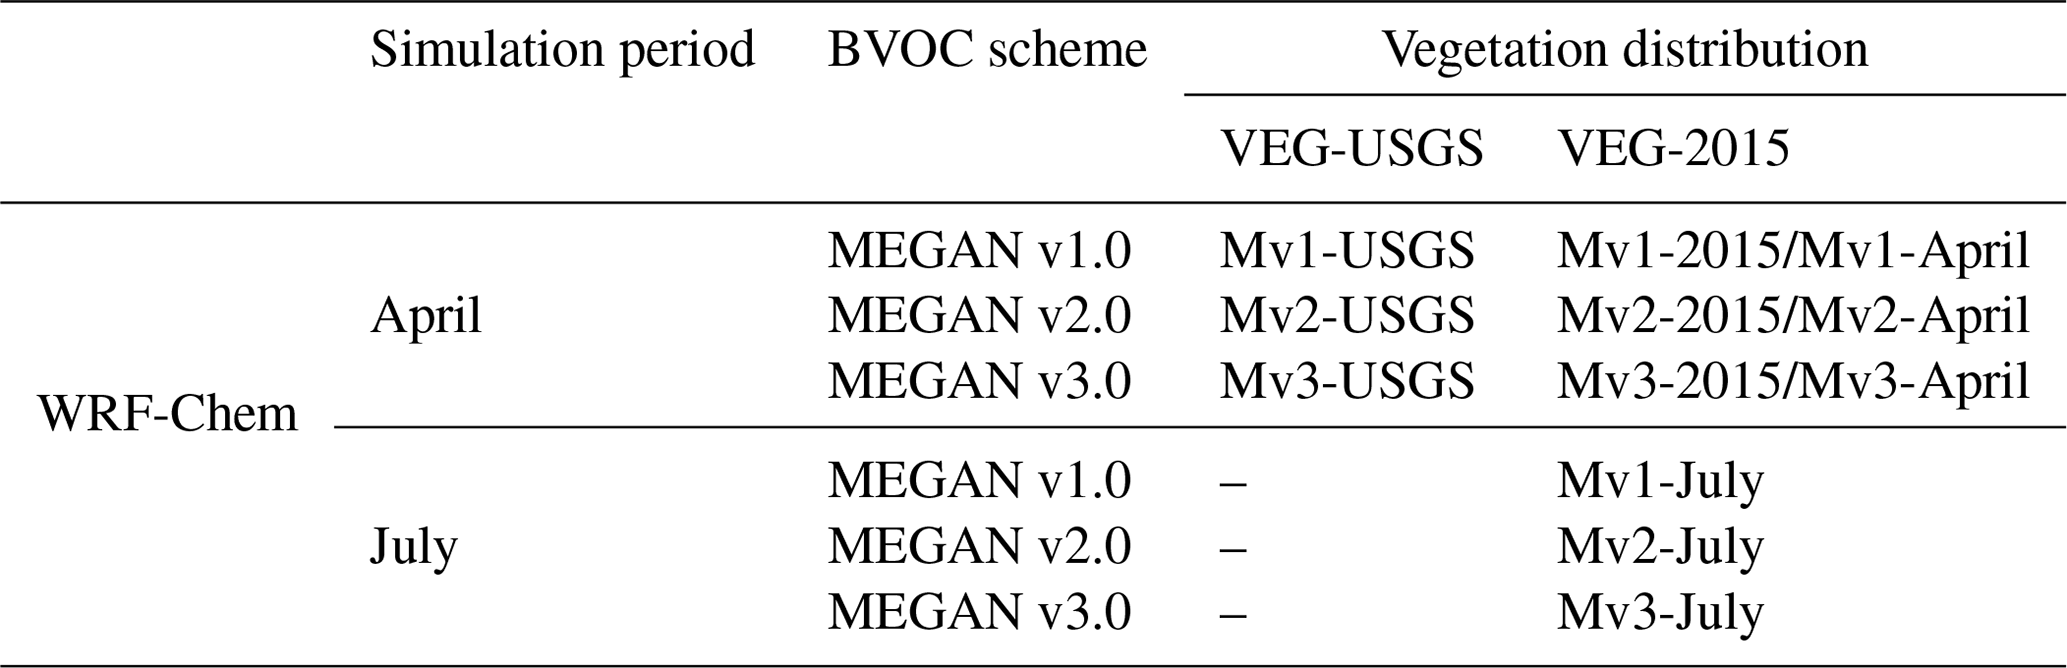
In order to investigate the sensitivities of biogenic isoprene emissions simulated by different versions of MEGAN to different vegetation distributions, as mentioned above, multiple experiments are conducted with different vegetation datasets and MEGAN versions, as summarized in Table 3. First of all, three experiments are conducted with the USGS vegetation distribution (VEG-USGS) using different versions of MEGAN embedded in WRF-Chem as discussed above, i.e., MEGAN v1.0 (Mv1-USGS), MEGAN v2.0 (Mv2-USGS) and MEGAN v3.0 (Mv3-USGS). The sensitivities of biogenic emissions to different versions of MEGAN can be explored by comparing these three experiments. Second, another three experiments are conducted similarly to the former ones but the VEG-USGS dataset is replaced by the VEG-2015 dataset, i.e., Mv1-2015, Mv2-2015 and Mv3-2015, respectively. By comparing these two sets of experiments, the impacts of the two vegetation distributions on the simulated BVOC emissions with each version of MEGAN can be investigated. These six experiments are conducted for both April and July. The seasonal variation of the sensitivities of BVOC emissions to different MEGAN versions and vegetation distributions can be explored through the simulations for these two months.
3.1 Biogenic isoprene emission
3.1.1 Sensitivity to emission schemes and vegetation distributions
Figure 3 shows the spatial distributions of biogenic isoprene emission averaged in April for six simulations with different vegetation datasets and biogenic emission schemes. First of all, within the same vegetation dataset of USGS, large differences exist among the results from these three versions of emission scheme. In terms of domain average, MEGAN v2.0 simulates the highest isoprene emission among the three versions, MEGAN v3.0 follows and MEGAN v1.0 simulates the lowest, especially over the northwest of the simulation domain. It can also be noticed that the spatial distributions of biogenic isoprene emission are different among the versions. To better illustrate the difference, two focus areas (denoted by the red and black boxes in Fig. 3) in the simulation domain are selected for further analysis. Over the southwest region of domain (denoted by the black box), the averaged biogenic isoprene emission in Mv1-USGS is below 0.2 mole km−2 h−1, and it is about 1.0 and 3.1 mole km−2 h−1 from the Mv3-USGS and Mv2-USGS simulations, respectively. Over the southeast region of domain (denoted by the red box), similarly, the MEGAN v2.0 simulates the highest biogenic isoprene emission among the three versions, and MEGAN v1.0 estimates more emissions than MEGAN v3.0.

Figure 3Spatial distributions of biogenic isoprene emissions averaged in April over the simulation domain estimated with different biogenic emission schemes and vegetation datasets as listed in Table 2. Two areas are marked by red and black boxes to discuss the characteristics in detail.
Over the southwest region of domain, for MEGAN v1.0, irrigated cropland (the third land use type in VEG-USGS), cropland with the grassland mosaic (the fifth) and savanna (the tenth) are the dominant land use types over the southwest region (Fig. 1), which have low emission factors (as shown in Fig. 2). For MEGAN v3.0, crop and grass are the dominant PFTs over the region, but some temperate needle-leaf evergreen trees that have a higher emission factor of about 3 mg isoprene m−2 h−1 (as shown in Fig. 2) are also included in this area (Fig. 1). The different vegetation distributions lead to the overall emission factors being different between MEGAN v1.0 and MEGAN v3.0 (Fig. 4). Therefore, MEGAN v3.0 simulated more biogenic isoprene emissions than MEGAN v1.0 (0.88 mole km−2 h−1 versus 0.42 mole km−2 h−1) over this region. Over the southeast region domain, the dominant land use type is cropland with woodland mosaic (the sixth), which has a high emission factor of about 2 mg isoprene m−2 h−1 and irrigated cropland in MEGAN v1.0. By contrast, the PFT in MEGAN v3.0 is cropland and has a lower emission factor. This leads to a larger overall emission factor in MEGAN v1.0 than in MEGAN v3.0 over this region. Therefore, MEGAN v1.0 calculates more biogenic isoprene emissions than MEGAN v3.0 (1.08 mole km−2 h−1 versus 0.65 mole km−2 h−1) over the area. In general, the difference between MEGAN v1.0 and MEGAN v3.0 with the same USGS land-use dataset is mainly due to the conversion of the USGS land use to PFT that leads to different vegetation types with different emission factors in each grid. For MEGAN v2.0, the emission factor of isoprene is obtained from the input database directly in WRF-Chem, and it is the highest among the three versions of MEGAN (Fig. 4). Therefore, MEGAN v2.0 simulates the most biogenic isoprene emissions over the two analyzed regions among the three different versions independent of the vegetation coverage (will be discussed below).
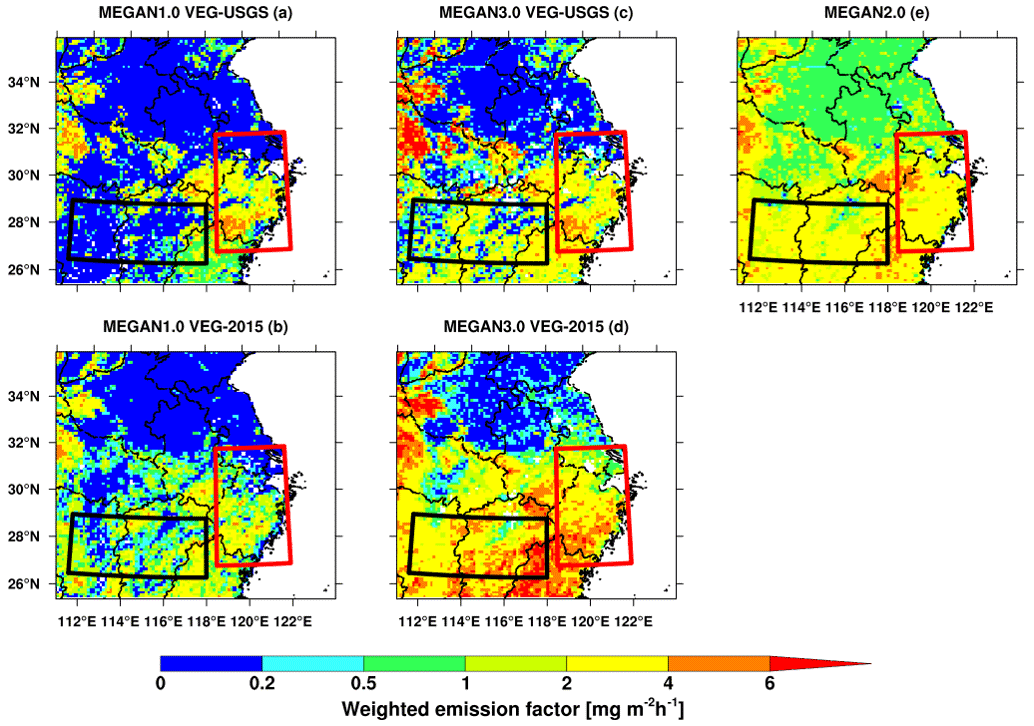
Figure 4Spatial distribution of the weighted mean emission factors derived from VEG-USGS and VEG-2015 in MEGAN v1.0 (a, b) and MEGAN v3.0 (c, d). Meanwhile, (e) shows the distribution of isoprene emission factors in the MEGAN v2.0 database. Please note the emission factors of isoprene are prescribed for MEGAN v2.0 in WRF-Chem and therefore are independent of vegetation distributions.
In terms of the modeling sensitivities to vegetation distributions (i.e., VEG-USGS versus VEG-2015), as discussed above, with prescribed emission factor of isoprene at each grid cell, the isoprene emission from MEGAN v2.0 in WRF-Chem does not change much with different vegetation distributions except for some small perturbation due to the impacts of vegetation distributions on meteorological fields. Over the southwest region of the domain, the averaged biogenic isoprene emission with VEG-2015 is higher (0.68 mole km−2 h−1 and 2.25 mole km−2 h−1) than that (0.42 and 0.88 mole km−2 h−1) with VEG-USGS for both MEGAN v1.0 and MEGAN v3.0 due to the increased fraction of needle-leaf evergreen trees and mixed forest over this area (Fig. 1) in VEG-2015, and these land use types have higher emission factors (Fig. 2) than croplands in VEG-USGS. Over the southeast, the vegetation coverage is significantly reduced from VEG-2015 to VEG-USGS due to the rapid development in economic and urban expansion over the region in last two decades. Therefore, for MEGAN v1.0, the averaged isoprene emission from Mv1-2015 is lower (0.39 mole km−2 h−1) than that (1.08 mole km−2 h−1) from Mv1-USGS, consistent with the lower overall emission factor with VEG-2015 compared to VEG-USGS in MEGAN v1.0 (Fig. 4). However, it is noteworthy that, for MEGAN v3.0, the isoprene emission from Mv3-2015 is higher (1.12 mole km−2 h−1) than that (0.65 mole km−2 h−1) from Mv3-USGS. The different sensitivities of the two versions to the vegetation changes are mainly due to their different treatments of sub-grid vegetation distribution as discussed in Sect. 2.2; i.e., MEGAN v3.0 considers sub-grid vegetation distribution besides the dominant vegetation type at each grid cell when estimating the BVOC emissions, while MEGAN v1.0 only considers the dominant vegetation type at each grid cell.
To further demonstrate the impact of sub-grid distribution of vegetation in MEGAN v3.0, Fig. 5 shows the difference of major sub-grid fractions of PFT other than the dominant one over the southeast region of the domain within the red box between VEG-2015 and VEG-USGS. Although the dominant vegetation types are crops, grass, and bare soil over the region (Fig. 1), the sub-grid fractions of needle-leaf evergreen trees, broad-leaf evergreen trees and broad-leaf deciduous trees that have relatively higher emission factors (Fig. 2) are higher in VEG-2015 than in VEG-USGS. As shown in Fig. 4, the overall emission factor εi,j weighted by sub-grid PFT fractions is higher with VEG-2015 than with VEG-USGS from MEGAN v3.0. It highlights that the sub-grid vegetation distribution is important in terms of estimating BVOC emissions over this region, which results in more biogenic isoprene emissions in MEGAN v3.0 than MEGAN v1.0 with the latest vegetation distribution dataset (i.e., VEG-2015).
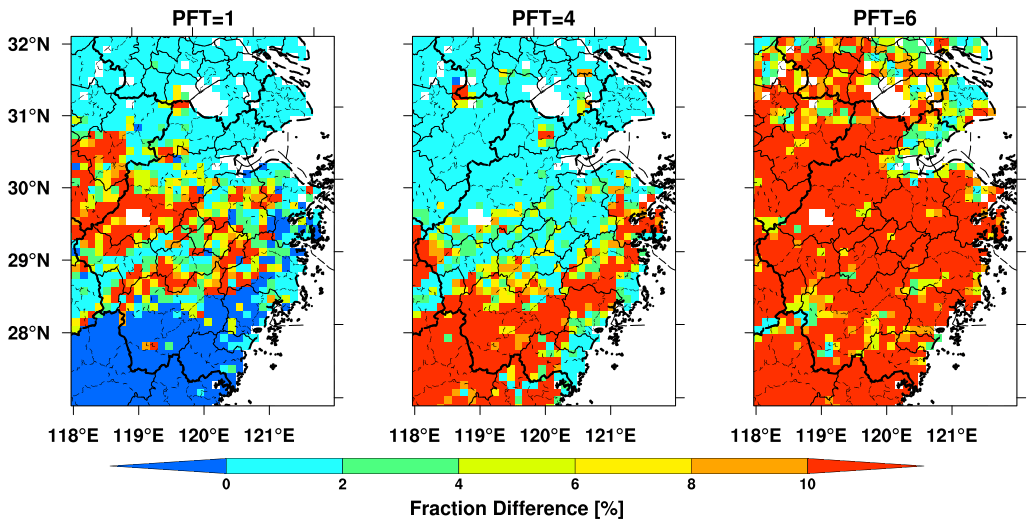
Figure 5Spatial distribution of the PFT percentage difference between the VEG-2015 and VEG-USGS (VEG-2015 minus VEG-USGS) for needle-leaf evergreen trees (PFT = 1), broadleaf evergreen trees (PFT = 4) and broadleaf deciduous trees (PFT = 6).
3.1.2 Environmental impacts
Besides the emission factor, biogenic emission is also influenced by an activity factor that is largely controlled by environmental conditions. The activity factor mainly accounts for the response of biogenic emission to temperature, leaf age, soil moisture, solar radiation, leaf area index and drought in the three versions of MEGAN in WRF-Chem. The seasonal variations (July versus April) of simulated biogenic emissions by different versions of MEGAN with VEG-2015 are investigated to demonstrate the environmental impacts and their difference among MEGAN versions. Please note that emission factors are not dependent on seasons. Figure 6 shows the ratios of monthly averaged biogenic isoprene emission and overall activity factor (γi) between July and April from three versions of MEGAN with the VEG-2015 vegetation dataset. Only the simulation results with VEG-2015 are analyzed here due to the similar results with VEG-USGS (not shown). It is evident that the ratios are all greater than 1, which means much more isoprene is emitted into the atmosphere by plants in July than in April. The seasonal variations of magnitudes and the distributions of activity factors are consistent with those of emissions. Among different versions, MEGAN v3.0 is most sensitive to environmental conditions, especially over the northern part of the domain between 32 and 36∘ N.

Figure 6Spatial distribution of the quotient of biogenic isoprene emission and activity factor between simulations in July and in April, using VEG-2015 vegetation dataset coupled with different emission schemes (MEGAN v1.0, MEGAN v2.0 and MEGAN v3.0).
The overall activity factor is the product of the factors determined by temperature, LAI, solar radiation, leaf age and drought condition in MEGAN v2.0 and MEGAN v3.0 while it is an overall function of temperature and solar radiation in MEGAN v1.0 that cannot be separated as isolated factors. Therefore, for MEGAN v2.0 and MEGAN v3.0, the ratios of isolated activity factors responding to temperature, LAI, solar radiation, leaf age and drought between July and April are further illustrated in Fig. 7. The temperature-dependent activity factor (γt) plays an important role in the seasonal change of total activity factor, especially in the north of the simulation domain, which is about 3.0–4.0 and >4.0 in MEGAN v2.0 and MEGAN v3.0, respectively, which means that MEGAN predicts higher biogenic isoprene emissions in warmer environments. Guenther et al. (2006) also point out that the temperature-dependent activity factor increases evidently with temperature.
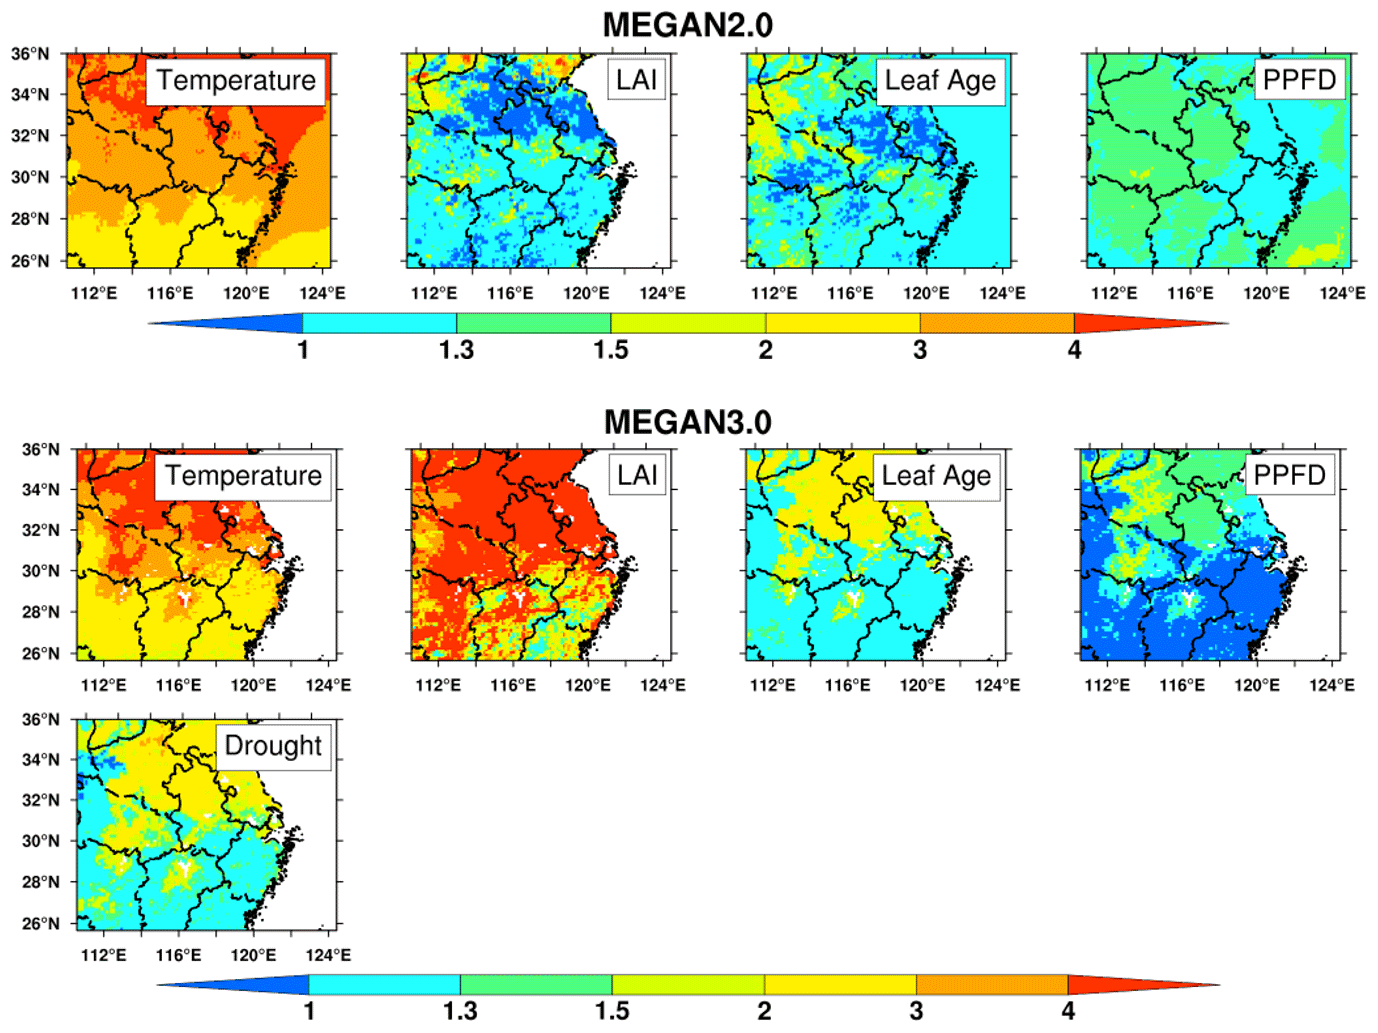
Figure 7Spatial distribution of the quotient of activity factor related to different environmental variables (such as temperature, LAI, light, leaf age and drought) between simulations in July and in April (July divided by April) using VEG-2015 vegetation dataset coupled with MEGAN v2.0 and MEGAN v3.0.
There are two activity factors associated with leaves. One is related to the emission dependence of absolute values of LAI (γLAI), which has the most different distributions among all activity factors in two versions. The ratio in MEGAN v3.0 is above 4 and less than 2 in MEGAN v2.0 over most part of the simulation domain. It is noteworthy that the ratio is below 1 in MEGAN v2.0 in the north of the domain while it is more than 4 in MEGAN v3.0, which dominates the difference between July and April. Figure 8 shows the change of activity factor for LAI as a function of the LAI value used in MEGAN v2.0 and MEGAN v3.0, respectively. It is evident that the estimated LAI activity factors in both versions increase with the LAI values, but with different increasing rates. In general, MEGAN v3.0 has the faster increasing rate. Please note, as discussed previously in Sect. 2.2, MEGAN v3.0 obtains the LAI online directly from the land surface scheme that can capture the seasonal change well, while MEGAN v2.0 obtains it from a climatological monthly mean input dataset that is different from the one used in the land surface scheme in WRF-Chem. Figure 9 shows the distributions of LAI in MEGAN v2.0 and MEGAN v3.0 in different months. For MEGAN v2.0, LAI has almost no change from April to July, particularly over the northern simulation domain, while for MEGAN v3.0, the LAI increases evidently over the whole domain, especially over the north. Therefore, the ratio of γLAI between July and April is around 1 in MEGAN v2.0, while it is much larger than 1 in MEGAN v3.0.
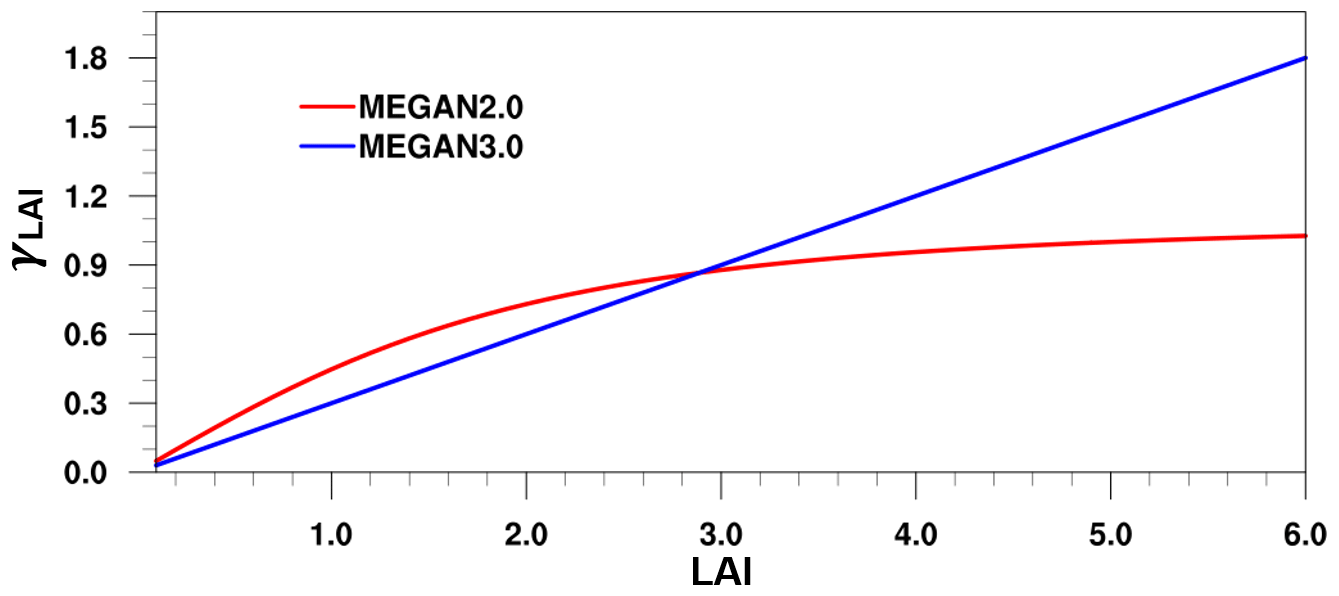
Figure 8Activity factor for LAI (γLAI) variation with LAI in different versions of MEGAN. The red line represents the MEGAN v2.0 and the blue line MEGAN v3.0.
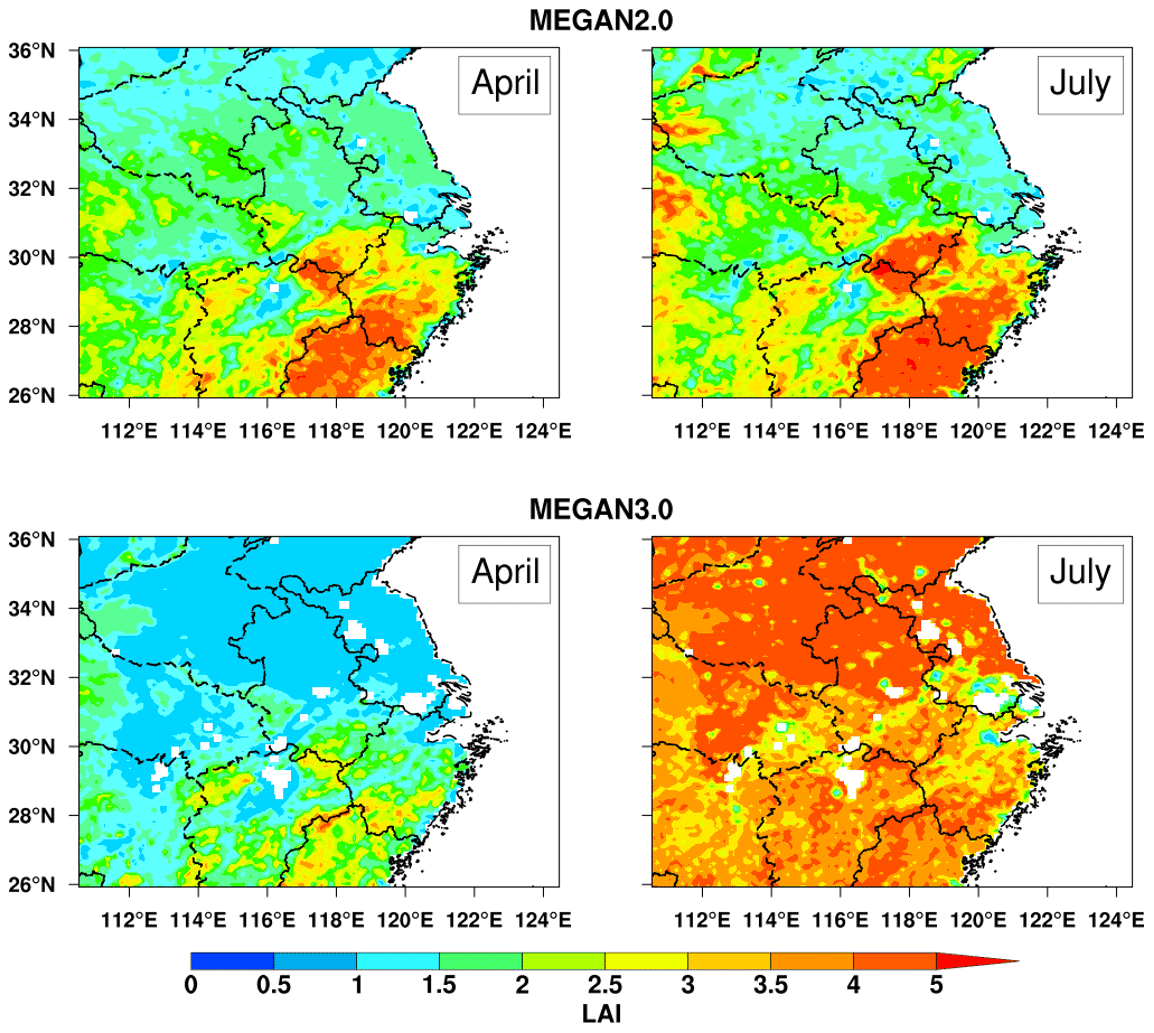
Figure 9The spatial distribution of monthly leaf area index (LAI) from VEG-2015 in MEGAN v2.0 and MEGAN v3.0.
The second activity factor is related to the leaf age (γa), which also has quite different distributions between MEGAN v2.0 and MEGAN v3.0. For MEGAN v2.0, the ratio is about 1–3 in the most of the area while it is below 1.0 between 30 and 34∘ N and more than 2 in the northwest of the simulation domain. For MEGAN v3.0, the ratio is above 1.0 over the whole domain, and the distribution has significant regional differences. It is 1–1.3 in the south region and more than 2 in the north region. Generally speaking, a leaf's ability to emit biogenic isoprene is significantly influenced by leaf phenology. Young leaves emit almost no isoprene, mature leaves emit the most, and old leaves eventually lose the ability to produce biogenic isoprene (Guenther et al., 2006). Therefore, plants emit more isoprene into the atmosphere in July than in April because of more mature leaves due to the plant growth. Activity factor for leaf age is a function of the relative change of emission activity and the fraction of leaves at different phenological stages that are determined by the difference of LAI in current and previous months, introduced by Jiang et al. (2018). In both versions of MEGAN, mature and old foliage have highest relative isoprene emission activity, followed by the growing foliage, and the new foliage is the lowest. Therefore, MEGAN v3.0 produces higher leaf age activity factor in July because of the larger difference of LAI in different months and more mature foliage to emit isoprene (Fig. 9).
The distribution of the ratio of the light-dependent activity factor (γP) is also different between the two versions. The light-dependent activity factor (γP) is a function of PPFD and activity of isoprene synthase and is dominated by the variation of PPFD. In general, plants often have a higher light-dependent activity factor in July than in April due to the stronger radiation. For MEGAN v2.0, it is about 1–1.5 over the whole domain and has no significant regional difference. For MEGAN v3.0, the ratio is below 1 in the south of the domain while it is about 1.3–1.5 or more than 2 in the north of the domain. MEGAN v3.0 considered the difference of sunlit and shaded leaves, and PPFD will be low on shaded leaves in dense canopy because of the blocking sunlight. Therefore, MEGAN v3.0 calculated a low light-dependent activity factor in the south of the domain due to the distribution of mixed forest which has a dense canopy in summer.
The seasonal variation of drought-dependent activity factor (γd,isoprene) is only included in MEGAN v3.0 with ratios of 1–3 over the domain. Previous studies have shown that plants emit more isoprene into the atmosphere under short-term mild drought stress (e.g., Jiang et al., 2018). The reduction of stomatal conductance is accompanied by an increase in leaf temperature resulting in more isoprene emissions from plants (Jiang et al., 2018). As mentioned in the methodology, the empirical coefficient α of 37 is applied for drought activity factor calculation following Jiang et al. (2018) in this study due to the lack of observations and experimental constraints over China. To examine its potential effect on calculating drought activity factor in China, sensitivity experiments are conducted with different values of α. The results indicate that the value of α has small effect on the seasonal variation and the spatial distribution of drought activity factor over eastern China (Fig. S6 in the Supplement), which is consistent with Jiang et al. (2018), who also stated the drought effect on seasonal change of isoprene emissions in China was not evident. In addition, as discussed in Sect. 2.2, the drought-dependent activity factor is proportional to photosynthetic enzyme activity, which can be affected by PPFD. Therefore, MEGAN v3.0 estimated more isoprene emissions in July, especially in the north of domain, and the pattern is similar to the distribution of the light-dependent activity factor.
3.1.3 Comparison with observations
The results discussed above show the difference in modeling biogenic emissions of isoprene. The difference of simulated near-surface isoprene concentrations is similar to their emissions (not shown here). It will be optimal to compare the simulated isoprene emissions and concentrations from different experiments with observations. However, as far as we know, the publicly available in situ measurements of isoprene emissions and concentrations over eastern China are extremely sparse. Only limited observations can be collected from published literature and unpublished data over both rural and urban areas of eastern China for comparison with the results of different experiments as listed in Table 4.
Table 4Measured and simulated isoprene concentrations (ppbv) at sampling sites.
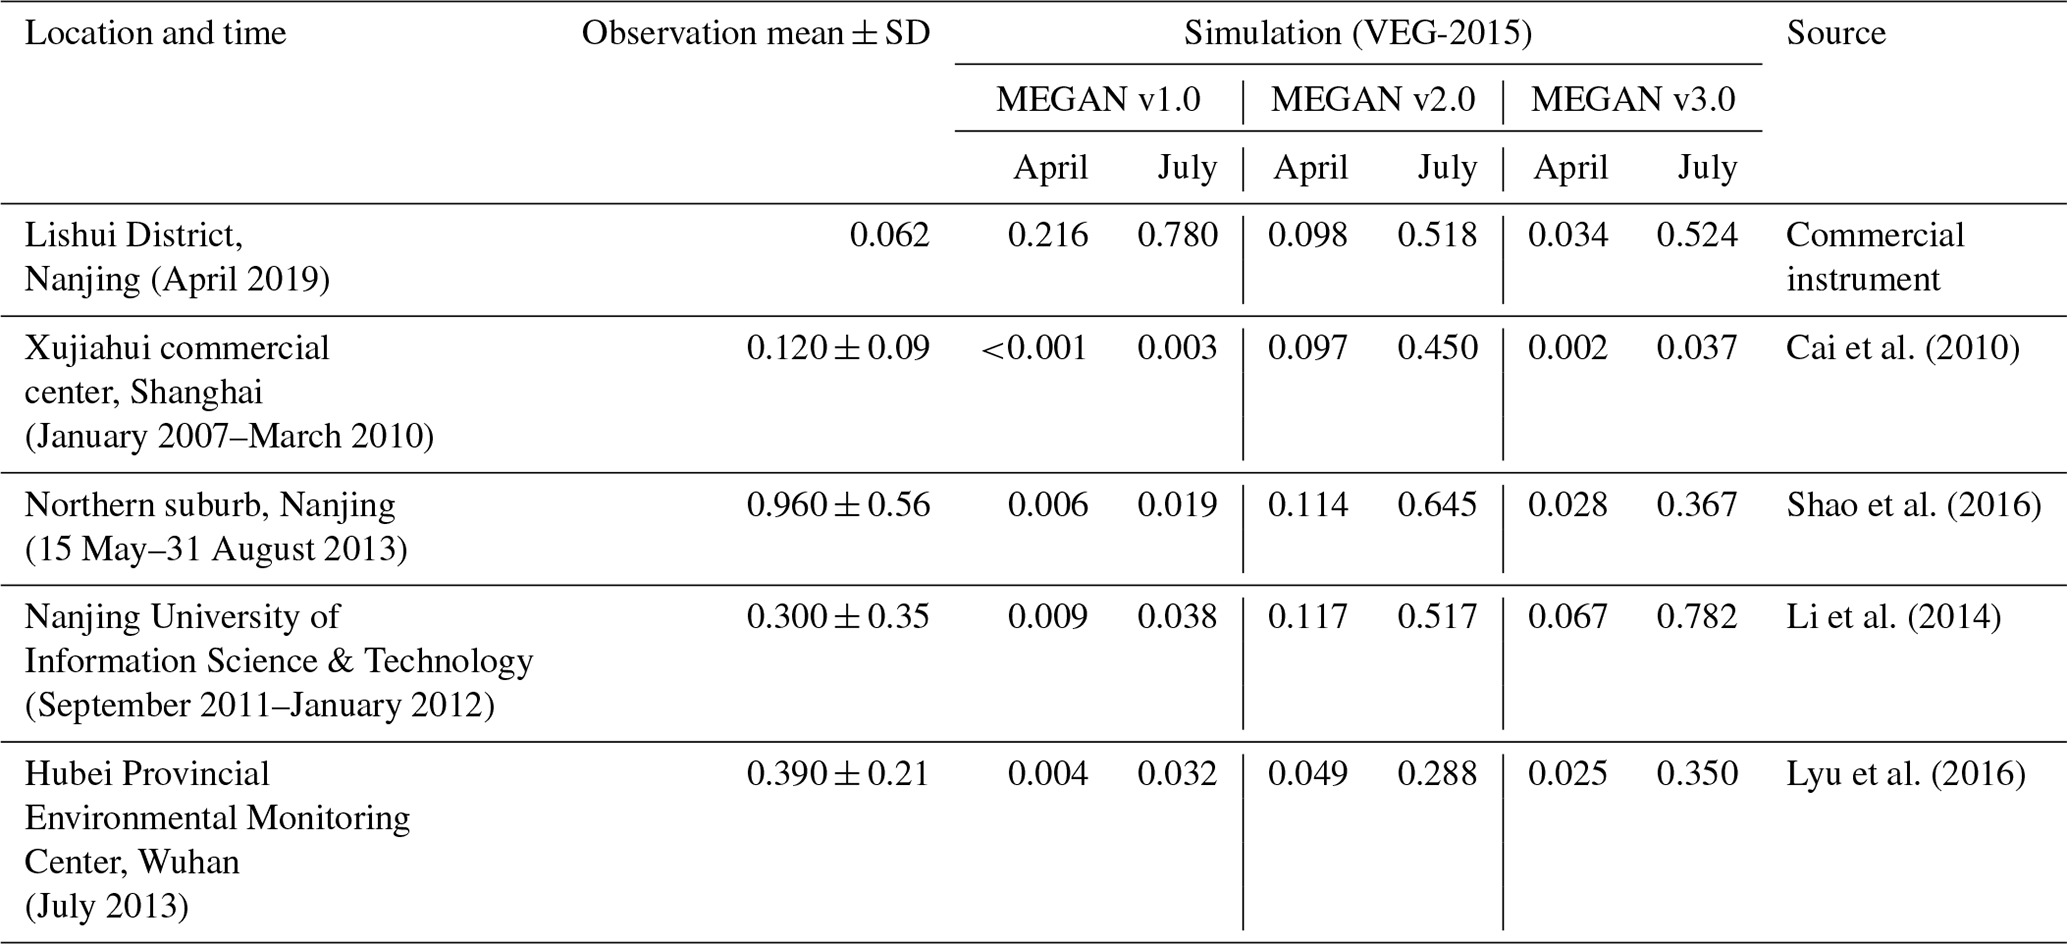
In general, the simulated isoprene concentrations from MEGAN v2.0 and MEGAN v3.0 are closer to measurements in these four sites listed in Table 4 while MEGAN v1.0 generally underestimates the observed values. Compared with the limited observations, MEGAN v2.0 produces higher isoprene concentrations in most sampling sites except the site of Lishui District, surrounded with the densely vegetation-covered suburbs. As discussed above, MEGAN v3.0 can simulate higher biogenic isoprene emissions in urban areas due to its consideration of sub-grid vegetation distributions. At the sampling sites in urban area, such as the sites of Xujiahui, Shanghai, and Nanjing, the simulation with MEGAN v3.0 produces a higher surface concentration of isoprene compared to that with MEGAN v1.0. In MEGAN v2.0, the prescribed vegetation distributions do not reflect the urbanization over eastern China. Therefore, the simulated isoprene concentrations between these two versions are comparable. Overall, the experiments with MEGAN v2.0 and MEGAN v3.0 may simulate a better surface concentration of isoprene over eastern China than that with MEGAN v1.0. Please note that these observations were collected at different sites for different periods. Ideally, the observations at multiple sites or from aircraft for a specific period are needed to evaluate overall model performance of BVOCs over a region (e.g., Zhao et al., 2016). It is difficult to effectively evaluate any simulations with those observations listed in Table 4.
Besides in situ and aircraft measurements, satellite-retrieved column-integrated formaldehyde is often used for evaluating modeling results of VOCs over a large area. Tropospheric formaldehyde vertical column concentrations have been retrieved from the Ozone Mapping and Profiler Suite (OMPS) (Abad et al., 2016), which is one of the instruments on board the Suomi National Polar-orbiting Partnership (Suomi-NPP). The satellite flies on a Sun-synchronous polar orbit with daily global coverage, and measurements are combined into 35 cross-track bins giving a spatial resolution of 50 km × 50 km. It crosses the Equator around 13:30 local solar time in the ascending mode (Su et al., 2019, 2020). Figure 10 shows the monthly mean total tropospheric column concentration of formaldehyde from the satellite retrievals and the simulations with different versions of MEGAN in April and July. In general, the simulated tropospheric column concentrations of formaldehyde are consistent with satellite retrievals in April, showing a high column of formaldehyde concentration over the Yangtze River Delta region and southern China. The formaldehyde concentrations are contributed comparably by both anthropogenic and biogenic sources over these two regions, and the biogenic source contributes about 20 % to the total in April (Fig. S7 in the Supplement). Although there are some small differences in formaldehyde column concentrations in April among the simulations with different MEGAN versions, consistent with the comparison of biogenic emissions (Fig. 3), it is difficult to apply the satellite retrievals to constrain their small difference if considering the uncertainties of retrievals. In July, the difference among the simulations with different MEGAN versions is much larger. Compared to the satellite retrievals, the simulation with MEGAN v1.0 (MEGAN v3.0) may underestimate (overestimate) tropospheric formaldehyde column concentrations. These biases may reflect their errors in biogenic emissions. The large difference between MEGAN v2.0 and MEGAN v3.0 in July may indicate that some activity factors controlling seasonal variation of BVOC emissions is less appropriate in MEGAN v3.0 than in MEGAN v2.0. However, please note that satellite retrievals of formaldehyde may also have relatively large uncertainties in July (e.g., Su et al., 2019, 2020) and the uncertainties of anthropogenic emissions of VOCs may also contribute to the modeling biases of formaldehyde.
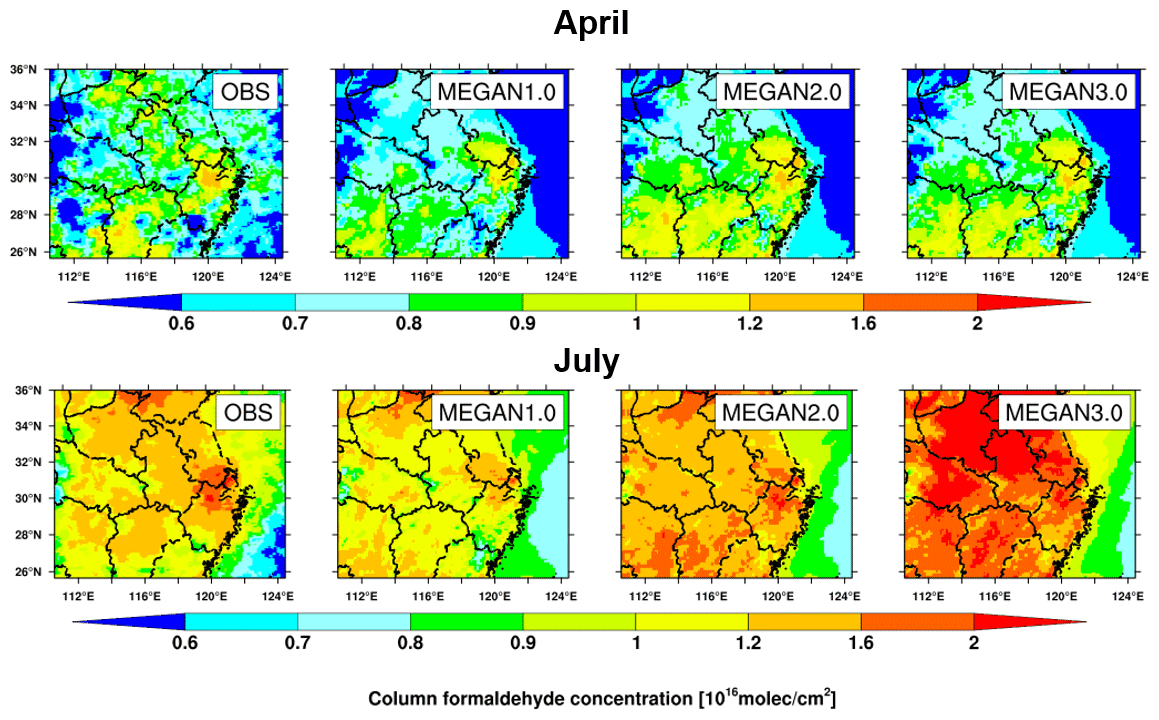
Figure 10Spatial distributions of total column tropospheric formaldehyde concentration (include biogenic and anthropogenic emissions) in April and July with different versions of MEGAN using the VEG-2015 vegetation dataset. The first column is from the satellite retrievals.
Through the sensitivity analysis and comparison with satellite retrievals, activity factors corresponding to temperature and LAI are most important for seasonal variation of BVOCs. The different functions of activity factor for LAI in MEGAN v2.0 and MEGAN v3.0 need to be constrained with observations. The empirical coefficient for calculating drought activity factor also need to be constrained for China with more laboratory and field experiments. Therefore, high-quality direct observations of BVOC emissions or concentrations for different seasons at multiple sites or from aircraft in both rural and urban areas of eastern China are definitely needed to evaluate the overall model performance of BVOCs over the region. Satellite retrieval of formaldehyde alone is still difficult when constraining uncertain parameters or functions in the BVOC emission scheme, particularly over regions like China. The modeling sensitivity analysis also suggests that some specific areas, such as the Anhui and Henan provinces in the north of the domain, need more reliable observations of BVOCs to constrain the large modeling sensitivities.
3.2 Impacts on mixing ratio of VOCs and ozone
Differences in emissions of BVOCs from multiple versions of MEGAN can influence the simulated mixing ratio of VOCs over eastern China that can further significantly affect ozone production through photochemistry (Wei et al., 2007; Bao et al., 2010; Calfapietra et al., 2013; Kim et al., 2013; Liu et al., 2018; Lu et al., 2019). The photochemistry is most active in summer; therefore, the simulation results in July with the latest vegetation coverage (VEG-2015) are analyzed here. Figure 11 shows the distributions of total VOCs and HCHO concentrations near the surface contributed by the BVOC emissions simulated by the model with different versions of MEGAN using VEG-2015 in July. The concentrations of species contributed by biogenic emissions are estimated through calculating the difference between the control simulation and the simulation without biogenic emissions. It is evident that BVOCs contribute significantly, 25 % and 35 % on average, to the total amount of VOCs and formaldehyde, respectively, over eastern China, and the difference among the simulations with the three versions of MEGAN is large (Fig. S8 in the Supplement). The simulation with MEGAN v3.0 produces the highest biogenic VOC concentration (>20 ppb), followed by MEGAN v2.0 (10–20 ppb), and the one with MEGAN v1.0 is the lowest (<5 ppb), particularly over the northern region. In terms of spatial distribution, the simulation with MEGAN v3.0 generates a higher biogenic VOC concentration over the north of the domain, while the ones with the other two versions of MEGAN generate a higher concentration over the south, which is consistent with the spatial distributions of the total biogenic emissions simulated by different MEGAN versions in WRF-Chem (Fig. S9 in the Supplement). The spatial distributions of simulated biogenic contribution to the surface formaldehyde concentrations are consistent with those of biogenic VOCs.
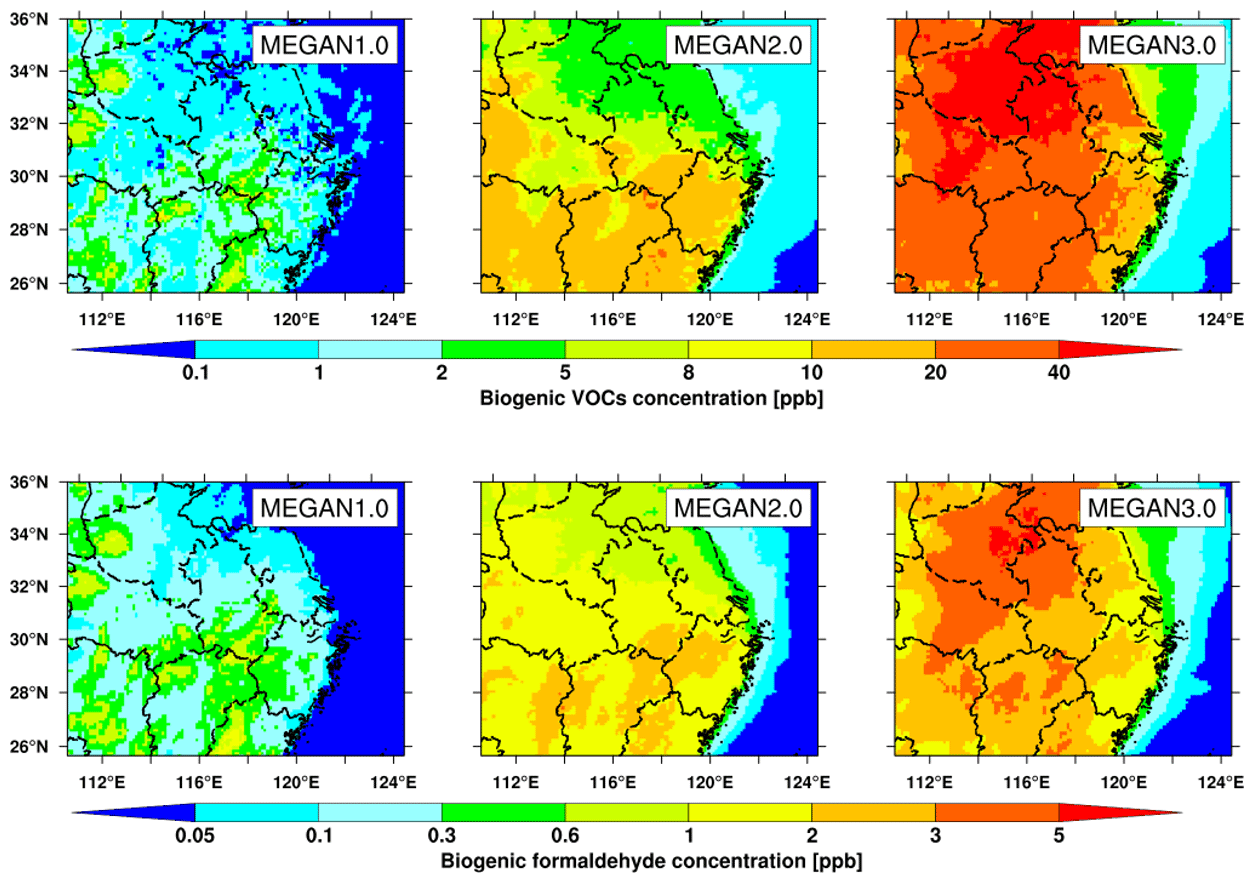
Figure 11Spatial distribution of VOCs and formaldehyde concentration due to the biogenic emissions (minus anthropogenic emissions) near the surface in July using the VEG-2015 vegetation dataset.
The significantly increased amounts of biogenic VOCs may induce the increase in surface ozone concentration over eastern China (Zhao et al., 2009). Figure 12 demonstrates the spatial distribution of the monthly mean ozone mixing ratio near the surface contributed by the emissions of BVOCs. The simulation with MEGAN v3.0 produces the largest amount of biogenic ozone over a large area of the simulation domain. The biogenic ozone from the simulation with MEGAN v3.0 is estimated to be over 8 ppb while it is 2–5 ppb from the one with MEGAN v2.0 and less than 1 ppb from the one with MEGAN v1.0. For MEGAN v1.0 and MEGAN v3.0, the distributions of surface biogenic ozone concentration is consistent with those of biogenic VOCs, for example, MEGAN v3.0 estimated more biogenic VOCs over the north of the domain while the ozone concentration is also simulated higher in the same region. For MEGAN v2.0, it is evident that the ozone formation is not solely influenced by biogenic VOCs. The ozone production can be determined by the changes of both VOCs and NOx concentrations, and the production efficiency can be different for NOx-sensitive region and VOC-sensitive regions (e.g., Zhao et al., 2009).
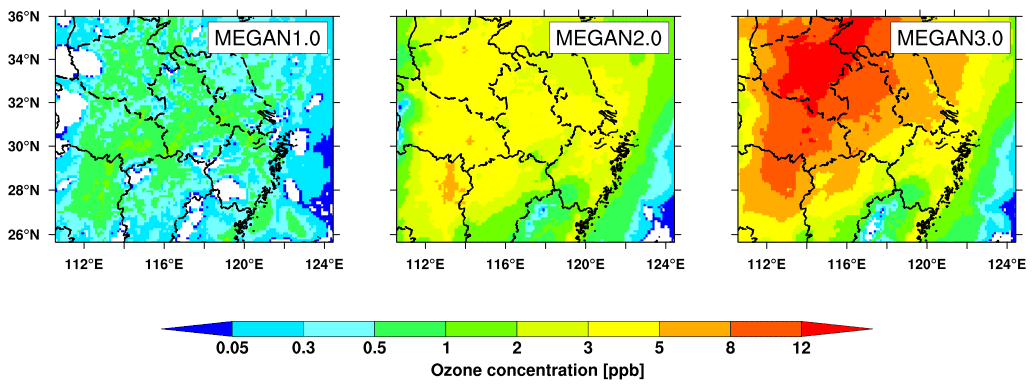
Figure 12Spatial distribution of ozone concentration due to the biogenic emissions near the surface in July using the VEG-2015 vegetation dataset.
Figure 13 shows the surface concentrations of NOx due to the biogenic emissions simulated with three versions of MEGAN with VEG-2015. The results are calculated as the difference between simulations with and without biogenic emissions. The simulations with MEGAN v3.0 estimate the highest BVOC-contributed concentration change, especially over the north of the domain (>2 ppb), followed by MEGAN v2.0 (0.2–0.4 ppb), and MEGAN v1.0 simulated the lowest concentration (about 0.1 ppb and below 0). The different changes of surface NOx concentrations are mainly caused by the different impacts on NOx lifetime due to biogenic VOCs. The increase in surface NOx concentration is due to the BVOC-induced increase in NOx lifetime reflected by the reduction of surface OH concentration (Fig. S10 in the Supplement). Therefore, the increase in ozone contributed by biogenic emissions in the north of the domain (30–36∘ N) simulated with MEGAN v2.0 is due to the combined effect of increased NOx and VOCs surface concentrations. It is also noteworthy that the surface ozone concentrations are simulated lower over the southeast of domain than in the southwest with the three versions of MEGAN, while the surface concentrations of BVOCs have no significant difference between the two regions. This is mainly due to the southwest being more sensitive to VOCs in terms of ozone production (Fig. S11 in the Supplement) (e.g., Zhao et al., 2009).
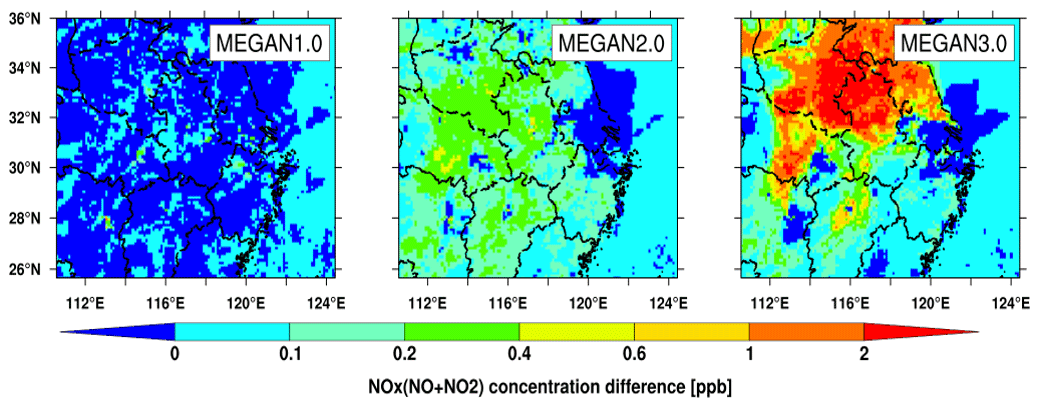
Figure 13Spatial distribution of NOx concentration due to the biogenic emissions near the surface (the difference between the simulation that considered biogenic emissions and the one without biogenic emissions) in July using the VEG-2015 vegetation date set.
In this study, three versions of MEGAN in WRF-Chem and their difference in simulating BVOC emissions and impacts on the ozone mixing ratio over eastern China is documented in the literature for the first time. The latest version of MEGAN v3.0 is coupled with the CLM4 land scheme as a part of WRF-Chem. Specifically, MEGAN v3.0 is updated from MEGAN v2.1 as an option in biogenic emission schemes and can share the consistent vegetation map and other variables with CLM4 such as surface temperature and leaf area index. What's more, MEGAN v3.0 includes the activity factor for drought, and the combinations of different versions of MEGAN and CLM4 are employed to investigate the sensitivity of the variation of MEGAN versions. Experiments are conducted for April and July over eastern China with VEG-USGS and VEG-2015 to study the sensitivities of simulated BVOCs by different MEGAN versions in WRF-Chem to seasonal change and the distributions of vegetation. The main conclusions are summarized below.
Physical and chemical processes in these three versions of MEGAN implemented in WRF-Chem are different, and the most intuitive distinction is their different treatments of the emission factor of BVOCs. MEGAN v1.0 prescribed constant values for different land use categories at each grid cell, and MEGAN v2.0 has a stand-alone PFT-specific emission factor map. For MEGAN v3.0, the overall emission factor at each grid cell is calculated by a PFT-specific emission factor and the fraction of each PFT. Therefore, the biogenic isoprene emissions estimated by three versions of MEGAN are different over the simulation domain. The VEG-USGS and VEG-2015 datasets present quite different distributions of vegetation coverage, which also contributes to the difference of emission factors among different versions. Different versions of MEGAN show different sensitivities to the changes of vegetation distributions due to their different treatments of vegetation fraction in estimating emission factors of BVOCs. The results highlight the importance of considering the sub-grid vegetation fraction in estimating BVOC emissions. MEGAN v3.0, with sub-grid vegetation distribution, simulates higher BVOC emissions over the urban area of the Yangtze River Delta (YRD) region compared to MEGAN v2.0, with only the dominant vegetation type at each grid cell.
Activity factor plays an important role in determining the seasonal change of BVOC emissions. Simulations with different versions of MEGAN show different seasonal variation of activity factors and thus BVOC emissions. The results indicated that the overall activity factor in July is higher than the one in April in all versions of MEGAN, and MEGAN v3.0 is most sensitive to the seasonal change, especially in the north of the simulation domain. In general, among all activity factors, the temperature-dependent factor dominates the seasonal change of activity factor in all three versions of MEGAN, while the different response to the LAI change determines the difference among the three versions in the seasonal variation of BVOC emissions. The additional drought-dependent activity factor in MEGAN v3.0 can result in a slightly higher BVOC emission over eastern China in July than April due to the increasing photosynthetic enzyme activity; i.e., plants emit more biogenic isoprene in July than in April under the short-term mild drought forcing. The overall drought impact on BVOC emissions over eastern China is as small as in previous studies (e.g., Jiang et al., 2018).
Different BVOCs simulated with the three versions of MEGAN in WRF-Chem lead to the large difference in ozone production. The simulation with MEGAN v3.0 produces the highest BVOC-contributed ozone concentration (>8 ppbv) over eastern China among the three versions, followed by the simulations with MEGAN v2.0 and MEGAN v1.0. The difference of BVOC-contributed ozone among the simulations with three versions of MEGAN is not only affected by the increased concentration of BVOCs but also influenced by the changes of NOx concentration. The simulations with different versions of MEGAN show different distributions of surface NOx concentration due to the BVOC-induced changes of NOx lifetime. The production efficiency of surface ozone concentration over eastern China due to BVOCs also depends on whether the regions are NOx-sensitive or VOCs-sensitive.
Although the analysis in this study is for one single year, the investigation of simulations for a different year demonstrates similar results (not shown), which indicates the modeling sensitivities with different versions of MEGAN do not change significantly with the years. This study highlights that the simulated emissions of BVOC over eastern China are sensitive to vegetation coverage, which has also been found by previous studies (e.g., Klinger et al., 2002; Wang et al., 2007). However, this study further demonstrates that the modeling sensitivity to vegetation coverage could be quite different depending on the BVOC emission schemes. Some studies also showed that BVOC emissions can be more than 50 % higher in summer than in other seasons (e.g., Li et al., 2020), which may also be sensitive to the formulas of emission activity factors in different emission algorithms as discussed in this study. The BVOC emissions over eastern China are sensitive to the versions of MEGAN used, consistent with previous studies (Tie et al., 2006; Situ et al., 2014) that found the offline calculation with different versions of MEGAN led to significantly different BVOC emissions over China. Although it is evident that surface ozone concentration can be significantly influenced by BVOC emissions over eastern China through affecting VOCs, OH and NOx and the BVOC impact is also region-sensitive as found in this and previous works (e.g., Geng et al., 2011; Tie et al., 2013; Liu et al., 2018), this study highlights that the overall impact can be quite sensitive to different algorithms in different MEGAN versions.
Theoretically MEGAN v3.0 that is coupled with the land surface scheme and considers the sub-grid vegetation effect should overcome previous versions of MEGAN in WRF-Chem; however, considering uncertainties of retrievals and anthropogenic emissions over eastern China, limited in situ observations or satellite retrieval of formaldehyde alone are still difficult when constraining uncertain parameters or functions in BVOC emission schemes applied over eastern China. High-quality direct observations of BVOC emissions or concentrations for different seasons at multiple sites or from aircraft in both rural and urban areas of eastern China are definitely needed to evaluate overall model performance of BVOCs over China, particularly over some specific areas with large modeling sensitivities of BVOC emission and activity factors, such as the Anhui and Henan provinces in the north of simulation domain, suggested by this study. In addition, direct measurements of biogenic emission fluxes and/or emission factors and activity factors in the laboratory may also be helpful when constraining different activity factor functions of MEGAN in atmospheric models. Last but not least, although, theoretically, VEG-2015 should be more representative for the reality in 2015, particularly for eastern China with its intensive urban expansion since the 2000s, it could still have some uncertainties, particularly for the specification of various vegetation types. The survey of more accurate and higher-resolution vegetation distributions based on in situ investigation should be conducted to support the estimation of BVOC emissions over eastern China.
The released version of WRF-Chem can be downloaded from http://www2.mmm.ucar.edu/wrf/users/download/get_source.html (last access: 28 September 2021, WRF Users Page, 2021). The code of the updated USTC version of WRF-Chem is available at https://doi.org/10.5281/zenodo.4663508 (Zhao and Zhang, 2021) or by contacting chunzhao@ustc.edu.cn. Also, the code modifications will be incorporated into the release version of WRF-Chem in future.
The supplement related to this article is available online at: https://doi.org/10.5194/gmd-14-6155-2021-supplement.
MZ and CZ designed the experiments, conducted and analyzed the simulations. MZ, CZ YY, QD, YS, SL, DG, WS, and CL contributed to the discussion and final version of the paper.
The authors declare that they have no conflict of interest.
Publisher’s note: Copernicus Publications remains neutral with regard to jurisdictional claims in published maps and institutional affiliations.
This research was supported by the Strategic Priority Research Program of Chinese Academy of Sciences (grant XDB41000000), the National Key Research and Development Program of China (2016YFA0602001), the National Natural Science Foundation of China (42061134009, 41775146), the Fundamental Research Funds for the Central Universities, and the USTC Research Funds of the Double First-Class Initiative. The study used the computing resources from the High-Performance Computing Center of University of Science and Technology of China (USTC), Hefei Advanced Computing Center and the TH-2 of National Supercomputer Center in Guangzhou (NSCC-GZ).
This research has been supported by the Strategic Priority Research Program of Chinese Academy of Sciences (grant no. XDB41000000), the National Key Research and Development Program of China (grant no. 2016YFA0602001), the National Natural Science Foundation of China (grant nos. 42061134009, 41775146), the Fundamental Research Funds for the Central Universities, and the USTC Research Funds of the Double First-Class Initiative.
This paper was edited by Samuel Remy and reviewed by Mauro Morichetti and two anonymous referees.
Abdi-Oskouei, M., Pfister, G., Flocke, F., Sobhani, N., Saide, P., Fried, A., Richter, D., Weibring, P., Walega, J., and Carmichael, G.: Impacts of physical parameterization on prediction of ethane concentrations for oil and gas emissions in WRF-Chem, Atmos. Chem. Phys., 18, 16863–16883, https://doi.org/10.5194/acp-18-16863-2018, 2018.
Arghavani, S., Malakooti, H., and Bidokhti, A. A.: Numerical evaluation of urban green space scenarios effects on gaseous air pollutants in Tehran Metropolis based on WRF-Chem model, Atmos. Environ., 214, 116832, https://doi.org/10.1016/j.atmosenv.2019.116832, 2019.
Arneth, A., Niinemets, Ü., Pressley, S., Bäck, J., Hari, P., Karl, T., Noe, S., Prentice, I. C., Serça, D., Hickler, T., Wolf, A., and Smith, B.: Process-based estimates of terrestrial ecosystem isoprene emissions: incorporating the effects of a direct CO2-isoprene interaction, Atmos. Chem. Phys., 7, 31–53, https://doi.org/10.5194/acp-7-31-2007, 2007.
Bao, H., Shrestha, K. L., Kondo, A., Kaga, A., and Inoue, Y.: Modeling the influence of biogenic volatile organic compound emissions on ozone concentration during summer season in the Kinki region of Japan, Atmos. Environ., 44, 421–431, 2010.
Bonan, G. B.: A land surface model (LSM version 1.0) for ecological, hydrological, and atmospheric studies: Technical description and user’s guide, NCAR Tech. Note 4171STR, 150 pp., available at: http://opensky.ucar.edu/islandora/object/technotes:185 (last access: 25 May 2016), 1996.
Brown, S. S., Dubé, W. P., Bahreini, R., Middlebrook, A. M., Brock, C. A., Warneke, C., de Gouw, J. A., Washenfelder, R. A., Atlas, E., Peischl, J., Ryerson, T. B., Holloway, J. S., Schwarz, J. P., Spackman, R., Trainer, M., Parrish, D. D., Fehshenfeld, F. C., and Ravishankara, A. R.: Biogenic VOC oxidation and organic aerosol formation in an urban nocturnal boundary layer: aircraft vertical profiles in Houston, TX, Atmos. Chem. Phys., 13, 11317–11337, https://doi.org/10.5194/acp-13-11317-2013, 2013.
Cai, C., Geng, F., Tie, X., Yu, Q., and An, J.: Characteristics and source apportionment of VOCs measured in Shanghai, China, Atmos. Environ., 44, 5005–5014, 2010.
Calfapietra, C., Fares, S., Manes, F., Morani, A., Sgrigna, G., and Loreto, F.: Role of Biogenic Volatile Organic Compounds (BVOC) emitted by urban trees on ozone concentration in cities: A review, Environ. Pollut., 183, 71–80, 2013.
Carlton, A. G., Wiedinmyer, C., and Kroll, J. H.: A review of Secondary Organic Aerosol (SOA) formation from isoprene, Atmos. Chem. Phys., 9, 4987–5005, https://doi.org/10.5194/acp-9-4987-2009, 2009.
Carslaw, N., Bell, N., Lewis, A. C., McQuaid, J. B., and Pilling, M. J.: A detailed case study of isoprene chemistry during the EASE96 Mace Head campaign, Atmos. Environ., 34, 2827–2836, 2000.
Dentener, F., Kinne, S., Bond, T., Boucher, O., Cofala, J., Generoso, S., Ginoux, P., Gong, S., Hoelzemann, J. J., Ito, A., Marelli, L., Penner, J. E., Putaud, J.-P., Textor, C., Schulz, M., van der Werf, G. R., and Wilson, J.: Emissions of primary aerosol and precursor gases in the years 2000 and 1750 prescribed data-sets for AeroCom, Atmos. Chem. Phys., 6, 4321–4344, https://doi.org/10.5194/acp-6-4321-2006, 2006.
Derognat, C., Beekmann, M., Baeumle, M., Martin, D., and Schmidt, H.: Effect of biogenic volatile organic compound emissions on tropospheric chemistry during the Atmospheric Pollution Over the Paris Area (ESQUIF) campaign in the Ile-de-France region, J. Geophys. Res.-Atmos., 108, 8560, https://doi.org/10.1029/2001JD001421, 2003.
Fast, J. D., Gustafson Jr., W. I., Easter, R. C., Zaveri, R. A., Barnard, J. C., Chapman, E. G., Grell, G. A., and Peckham, S. E.: Evolution of ozone, particulates, and aerosol direct radiative forcing in the vicinity of Houston using a fully coupled meteorology-chemistry-aerosol model, J. Geophys. Res.-Atmos., 111, D21305, https://doi.org/10.1029/2005JD006721, 2006.
Forkel, R., Balzarini, A., Baró, R., Bianconi, R., Curci, G., Jiménez-Guerrero, P., Hirtl, M., Honzak, L., Lorenz, C., Im, U., Pérez, J. L., Pirovano, G., San José, R., Tuccella, P., Werhahn, J., and Žabkar, R.: Analysis of the WRF-Chem contributions to AQMEII phase2 with respect to aerosol radiative feedbacks on meteorology and pollutant distributions, Atmos. Environ., 115, 630–645, 2015.
Friedl, M. A., McIver, D. K., Hodges, J. C. F., Zhang, X. Y., Muchoney, D., Strahler, A. H., Woodcock, C. E., Gopal, S., Schneider, A., Cooper, A., Baccini, A., Gao, F., and Schaaf, C.: Global land cover mapping from MODIS: algorithms and early results, Remote Sens. Environ., 83, 287–302, 2002.
Fu, P., Kawamura, K., Kanaya, Y., and Wang, Z.: Contributions of biogenic volatile organic compounds to the formation of secondary organic aerosols over Mt. Tai, Central East China, Atmos. Environ., 44, 4817–4826, 2010.
Geng, F., Tie, X., Guenther, A., Li, G., Cao, J., and Harley, P.: Effect of isoprene emissions from major forests on ozone formation in the city of Shanghai, China, Atmos. Chem. Phys., 11, 10449–10459, https://doi.org/10.5194/acp-11-10449-2011, 2011.
Geron, C. D., Guenther, A. B., and Pierce, T. E.: An improved model for estimating emissions of volatile organic compounds from forests in the eastern United States, J. Geophys. Res.-Atmos., 99, 12773–12791, 1994.
Ghude, S. D., Pfister, G. G., Jena, C., van der A, R. J., Emmons, L. K., and Kumar, R.: Satellite constraints of nitrogen oxide (NOx) emissions from India based on OMI observations and WRF-Chem simulations, Geophys. Res. Lett., 40, 423–428, 2013.
Ginoux, P., Chin, M., Tegen, I., Prospero, J. M., Holben, B., Dubovik, O., and Lin, S.-J.: Sources and distributions of dust aerosols simulated with the GOCART model, J. Geophys. Res.-Atmos., 106, 20255–20273, 2001.
González Abad, G., Vasilkov, A., Seftor, C., Liu, X., and Chance, K.: Smithsonian Astrophysical Observatory Ozone Mapping and Profiler Suite (SAO OMPS) formaldehyde retrieval, Atmos. Meas. Tech., 9, 2797–2812, https://doi.org/10.5194/amt-9-2797-2016, 2016.
Gregorio, A.: Land Cover Classification System: Classification concepts and user manual for Software version 2, FAO Environment and Natural Resources Service Series, No. 8, Rome, 208 pp., 2005.
Grell, G. A., Peckham, S. E., Schmitz, R., McKeen, S. A., Frost, G., Skamarock, W. C., and Eder, B.: Fully coupled “online” chemistry within the WRF model, Atmos. Environ., 39, 6957–6975, 2005.
Guenther, A.: Biological and Chemical Diversity of Biogenic Volatile Organic Emissions into the Atmosphere, ISRN Atmospheric Sciences, 2013, 786290, https://doi.org/10.1155/2013/786290, 2013.
Guenther, A., Hewitt, C. N., Erickson, D., Fall, R., Geron, C., Graedel, T., Harley, P., Klinger, L., Lerdau, M., Mckay, W. A., Pierce, T., Scholes, B., Steinbrecher, R., Tallamraju, R., Taylor, J., and Zimmerman, P.: A global model of natural volatile organic compound emissions, J. Geophys. Res.-Atmos., 100, 8873–8892, 1995.
Guenther, A., Zimmerman, P., Klinger, L., Greenberg, J., Ennis, C., Davis, K., Pollock, W., Westberg, H., Allwine, G., and Geron, C.: Estimates of regional natural volatile organic compound fluxes from enclosure and ambient measurements, J. Geophys. Res.-Atmos., 101, 1345–1359, 1996.
Guenther, A., Karl, T., Harley, P., Wiedinmyer, C., Palmer, P. I., and Geron, C.: Estimates of global terrestrial isoprene emissions using MEGAN (Model of Emissions of Gases and Aerosols from Nature), Atmos. Chem. Phys., 6, 3181–3210, https://doi.org/10.5194/acp-6-3181-2006, 2006.
Guenther, A. B., Jiang, X., Heald, C. L., Sakulyanontvittaya, T., Duhl, T., Emmons, L. K., and Wang, X.: The Model of Emissions of Gases and Aerosols from Nature version 2.1 (MEGAN2.1): an extended and updated framework for modeling biogenic emissions, Geosci. Model Dev., 5, 1471–1492, https://doi.org/10.5194/gmd-5-1471-2012, 2012.
Han, Z. W., Ueda, H., and Matsuda, K.: Model study of the impact of biogenic emission on regional ozone and the effectiveness of emission reduction scenarios over eastern China, Tellus B, 57, 12–27, 2005.
Hantson, S., Knorr, W., Schurgers, G., Pugh, T. A. M., and Arneth, A.: Global isoprene and monoterpene emissions under changing climate, vegetation, CO2 and land use, Atmos. Environ., 155, 35–45, 2017.
Hong, S.-Y., Noh, Y., and Dudhia, J.: A New Vertical Diffusion Package with an Explicit Treatment of Entrainment Processes, Mon. Weather Rev., 134, 2318–2341, 2006.
Iacono, M. J., Delamere, J. S., Mlawer, E. J., Shephard, M. W., Clough, S. A., and Collins, W. D.: Radiative forcing by long-lived greenhouse gases: Calculations with the AER radiative transfer models, J. Geophys. Res.-Atmos., 113, D13103, https://doi.org/10.1029/2008JD009944, 2008.
Janssens-Maenhout, G., Crippa, M., Guizzardi, D., Dentener, F., Muntean, M., Pouliot, G., Keating, T., Zhang, Q., Kurokawa, J., Wankmüller, R., Denier van der Gon, H., Kuenen, J. J. P., Klimont, Z., Frost, G., Darras, S., Koffi, B., and Li, M.: HTAP_v2.2: a mosaic of regional and global emission grid maps for 2008 and 2010 to study hemispheric transport of air pollution, Atmos. Chem. Phys., 15, 11411–11432, https://doi.org/10.5194/acp-15-11411-2015, 2015.
Jiang, F., Liu, Q., Huang, X., Wang, T., Zhuang, B., and Xie, M.: Regional modeling of secondary organic aerosol over China using WRF/Chem, J. Aerosol Sci., 43, 57–73, 2012a.
Jiang, F., Zhou, P., Liu, Q., Wang, T., Zhuang, B., and Wang, X.: Modeling tropospheric ozone formation over East China in springtime, J. Atmos. Chem., 69, 303–319, 2012b.
Jiang, X., Guenther, A., Potosnak, M., Geron, C., Seco, R., Karl, T., Kim, S., Gu, L., and Pallardy, S.: Isoprene Emission Response to Drought and the Impact on Global Atmospheric Chemistry, Atmos. Environ., 183, 69–83, 2018.
Kain, J. S.: The Kain–Fritsch Convective Parameterization: An Update, J. Appl. Meteorol., 43, 170–181, 2004.
Kim, S.-Y., Jiang, X., Lee, M., Turnipseed, A., Guenther, A., Kim, J.-C., Lee, S.-J., and Kim, S.: Impact of biogenic volatile organic compounds on ozone production at the Taehwa Research Forest near Seoul, South Korea, Atmos. Environ., 70, 447–453, 2013.
Klinger, L. F., Li, Q.-J., Guenther, A. B., Greenberg, J. P., Baker, B., and Bai, J.-H.: Assessment of volatile organic compound emissions from ecosystems of China, J. Geophys. Res., 107, 4603, https://doi.org/10.1029/2001JD001076, 2002.
Kok, J. F.: A scaling theory for the size distribution of emitted dust aerosols suggests climate models underestimate the size of the global dust cycle, P. Natl. Acad. Sci. USA, 108, 1016–1021, https://doi.org/10.1073/pnas.1014798108, 2011.
Kota, S. H., Schade, G., Estes, M., Boyer, D., and Ying, Q.: Evaluation of MEGAN predicted biogenic isoprene emissions at urban locations in Southeast Texas, Atmos. Environ., 110, 54–64, 2015.
Lehning, A., Zimmer, W., Zimmer, I., and Schnitzler, J. P.: Modeling of annual variations of oak (Quercus robur L.) isoprene synthase activity to predict isoprene emission rates, J. Geophys. Res.-Atmos., 106, 3157–3166, 2001.
Levis, S., Wiedinmyer, C., Bonan, G. B., and Guenther, A.: Simulating biogenic volatile organic compound emissions in the Community Climate System Model, J. Geophys. Res.-Atmos., 108, 4659, https://doi.org/10.1029/2002JD003203, 2003.
Li, G., Bei, N., Cao, J., Wu, J., Long, X., Feng, T., Dai, W., Liu, S., Zhang, Q., and Tie, X.: Widespread and persistent ozone pollution in eastern China during the non-winter season of 2015: observations and source attributions, Atmos. Chem. Phys., 17, 2759–2774, https://doi.org/10.5194/acp-17-2759-2017, 2017.
Li, H., Li, L., Huang, C., An, J., Yan, R., Huang, H., Wang, Y., Lu, Q., Wang, Q., Lou, S., Wang, H., Zhou, M., Tao, S., Qiao, L., and Chen, M.: Ozone Source Apportionment at Urban Area during a Typical Photochemical Pollution Episode in the Summer of 2013 in the Yangtze River Delta, Environm. Sci., 36, 1–10, 2015 (in Chinese).
Li, L., An, J. Y., Zhou, M., Yan, R. S., Huang, C., Lu, Q., Lin, L., Wang, Y. J., Tao, S. K., Qiao, L. P., Zhu, S. H., and Chen, C. H.: Source apportionment of fine particles and its chemical components over the Yangtze River Delta, China during a heavy haze pollution episode, Atmos. Environ., 123, 415–429, 2015.
Li, L., Yang, W., Xie, S., and Wu, Y.: Estimations and uncertainty of biogenic volatile organic compound emission inventory in China for 2008–2018, Sci. Total Environ., 733, 139301, https://doi.org/10.1016/j.scitotenv.2020.139301, 2020.
Li, L. Y. and Xie, S. D.: Historical variations of biogenic volatile organic compound emission inventories in China, 1981–2003, Atmos. Environ., 95, 185–196, 2014.
Li, M., Liu, H., Geng, G. N., Hong, C. P., Liu, F., Song, Y., Tong, D., Zheng, B., Cui, H. Y., Man, H. Y., Zhang, Q., and He, K. B.: Anthropogenic emission inventories in China: a review, Natl. Sci. Rev., 4, 834–866, 2017a.
Li, M., Zhang, Q., Kurokawa, J.-I., Woo, J.-H., He, K., Lu, Z., Ohara, T., Song, Y., Streets, D. G., Carmichael, G. R., Cheng, Y., Hong, C., Huo, H., Jiang, X., Kang, S., Liu, F., Su, H., and Zheng, B.: MIX: a mosaic Asian anthropogenic emission inventory under the international collaboration framework of the MICS-Asia and HTAP, Atmos. Chem. Phys., 17, 935–963, https://doi.org/10.5194/acp-17-935-2017, 2017b.
Li, X., Cai, C., Zhu, B., An, J., Li, Y., and Li, Y.: Source apportionment of VOCs in a suburb of Nanjing, China, in autumn and winter, J. Atmos. Chem., 71, 175–193, 2014.
Liu, Y., Li, L., An, J., Huang, L., Yan, R., Huang, C., Wang, H., Wang, Q., Wang, M., and Zhang, W.: Estimation of biogenic VOC emissions and its impact on ozone formation over the Yangtze River Delta region, China, Atmos. Environ., 186, 113–128, 2018.
Loveland, T. R., Reed, B. C., Brown, J. F., Ohlen, D. O., Zhu, Z., Yang, L., and Merchant, J. W.: Development of a global land cover characteristics database and IGBP DISCover from 1 km AVHRR data, Int. J. Remote Sens., 21, 1303–1330, 2000.
Lu, X., Zhang, L., Chen, Y., Zhou, M., Zheng, B., Li, K., Liu, Y., Lin, J., Fu, T.-M., and Zhang, Q.: Exploring 2016–2017 surface ozone pollution over China: source contributions and meteorological influences, Atmos. Chem. Phys., 19, 8339–8361, https://doi.org/10.5194/acp-19-8339-2019, 2019.
Lyu, X. P., Chen, N., Guo, H., Zhang, W. H., Wang, N., Wang, Y., and Liu, M.: Ambient volatile organic compounds and their effect on ozone production in Wuhan, central China, Sci. Total Environ., 541, 200–209, 2016.
Morrison, H., Thompson, G., and Tatarskii, V.: Impact of Cloud Microphysics on the Development of Trailing Stratiform Precipitation in a Simulated Squall Line: Comparison of One- and Two-Moment Schemes, Mon. Weather Rev., 137, 991–1007, 2009.
Niinemets, Ü., Tenhunen, J. D., Harley, P. C., and Steinbrecher, R.: A model of isoprene emission based on energetic requirements for isoprene synthesis and leaf photosynthetic properties for Liquidambar and Quercus, Plant Cell Environ., 22, 1319–1335, 1999.
Oleson, K. W., Lawrence, D. M., Bonan, G. B., Flanner, M. G., Kluzek, E., Lawrence, P. J., Levis, S., Swenson, S. C., Thornton, P. E., Dai, A., Decker, M., Dickinson, R., Feddema, J., Heald, C. L., Hoffman, F., Lamarque, J.-F., Mahowald, N., Niu, G.-Y., Qian, T., Randerson, J., Running, S., Sakaguchi, K., Slater, A., Stöckli, R., Wang, A., Yang, Z.-L., Zeng, X., and Zeng, X.: Technical Description of version 4.0 of the Community Land Model (CLM), Tech. Rep. NCAR/TN-478+CSTR, National Center for Atmospheric Research, available at: http://www.cesm.ucar.edu/models/cesm1.0/clm/CLM4_Tech_Note.pdf (last access: 30 September 2021), 2010.
Paulson, C. A.: The Mathematical Representation of Wind Speed and Temperature Profiles in the Unstable Atmospheric Surface Layer, J. Appl. Meteorol. Climatol., 9, 857–861, 1970.
Pierce, T., Geron, C., Bender, L., Dennis, R., Tonnesen, G., and Guenther, A.: Influence of increased isoprene emissions on regional ozone modeling, J. Geophys. Res.-Atmos., 103, 25611–25629, 1998.
Poisson, N., Kanakidou, M., and Crutzen, P. J.: Impact of Non-Methane Hydrocarbons on Tropospheric Chemistry and the Oxidizing Power of the Global Troposphere: 3-Dimensional Modelling Results, J. Atmos. Chem., 36, 157–230, 2000.
Safronov, A. N., Shtabkin, Y. A., Berezina, E. V., Skorokhod, A. I., Rakitin, V. S., Belikov, I. B., and Elansky, N. F.: Isoprene, Methyl Vinyl Ketone and Methacrolein from TROICA-12 Measurements and WRF-CHEM and GEOS-CHEM Simulations in the Far East Region, Atmosphere, 10, 152, https://doi.org/10.3390/atmos10030152, 2019.
Shao, P., An, J., Xin, J., Wu, F., Wang, J., Ji, D., and Wang, Y.: Source apportionment of VOCs and the contribution to photochemical ozone formation during summer in the typical industrial area in the Yangtze River Delta, China, Atmos. Res., 176–177, 64–74, 2016.
Situ, S., Guenther, A., Wang, X., Jiang, X., Turnipseed, A., Wu, Z., Bai, J., and Wang, X.: Impacts of seasonal and regional variability in biogenic VOC emissions on surface ozone in the Pearl River delta region, China, Atmos. Chem. Phys., 13, 11803–11817, https://doi.org/10.5194/acp-13-11803-2013, 2013.
Situ, S., Wang, X. M., Guenther, A., Zhang, Y. L., Wang, X. M., Huang, M. J., Fan, Q., and Xiong, Z.: Uncertainties of isoprene emissions in the MEGAN model estimated for a coniferous and broad-leaved mixed forest in Southern China, Atmos. Environ., 98, 105–110, 2014.
Stauffer, D. R. and Seaman, N. L.: Use of Four-Dimensional Data Assimilation in a Limited-Area Mesoscale Model. Part I: Experiments with Synoptic-Scale Data, Mon. Weather Rev., 118, 1250–1277, 1990.
Stewart, H. E., Hewitt, C. N., Bunce, R. G. H., Steinbrecher, R., Smiatek, G., and Schoenemeyer, T.: A highly spatially and temporally resolved inventory for biogenic isoprene and monoterpene emissions: Model description and application to Great Britain, J. Geophys. Res.-Atmos., 108, 4644, https://doi.org/10.1029/2002JD002694, , 2003.
Su, W., Liu, C., Hu, Q., Zhao, S., Sun, Y., Wang, W., Zhu, Y., Liu, J., and Kim, J.: Primary and secondary sources of ambient formaldehyde in the Yangtze River Delta based on Ozone Mapping and Profiler Suite (OMPS) observations, Atmos. Chem. Phys., 19, 6717–6736, https://doi.org/10.5194/acp-19-6717-2019, 2019.
Su, W., Liu, C., Chan, K. L., Hu, Q., Liu, H., Ji, X., Zhu, Y., Liu, T., Zhang, C., Chen, Y., and Liu, J.: An improved TROPOMI tropospheric HCHO retrieval over China, Atmos. Meas. Tech., 13, 6271–6292, https://doi.org/10.5194/amt-13-6271-2020, 2020.
Thenkabail, P. S., Knox, J. W., Ozdogan, M., Gumma, M. K., Congalton, R. G., Wu, Z. T., Milesi, C., Finkral, A., Marshall, M., Mariotto, I., You, S. C., Giri, C., and Nagler, P.: Assessing future risks to agricultural productivity, water resources and food security: How can remote sensing help?, Photogramm. Eng. Remote Sens., 78, 773–782, 2012.
Tie, X., Li, G., Ying, Z., Guenther, A., and Madronich, S.: Biogenic emissions of isoprenoids and NO in China and comparison to anthropogenic emissions, Sci. Total Environ., 371, 238–251, 2006.
Tie, X., Geng, F., Guenther, A., Cao, J., Greenberg, J., Zhang, R., Apel, E., Li, G., Weinheimer, A., Chen, J., and Cai, C.: Megacity impacts on regional ozone formation: observations and WRF-Chem modeling for the MIRAGE-Shanghai field campaign, Atmos. Chem. Phys., 13, 5655–5669, https://doi.org/10.5194/acp-13-5655-2013, 2013.
Visser, A. J., Boersma, K. F., Ganzeveld, L. N., and Krol, M. C.: European NOx emissions in WRF-Chem derived from OMI: impacts on summertime surface ozone, Atmos. Chem. Phys., 19, 11821–11841, https://doi.org/10.5194/acp-19-11821-2019, 2019.
Wang, L. H., Follette-Cook, M. B., Newchurch, M. J., Pickering, K. E., Pour-Biazar, A., Kuang, S., Koshak, W., and Peterson, H.: Evaluation of lightning-induced tropospheric ozone enhancements observed by ozone lidar and simulated by WRF/Chem, Atmos. Environ., 115, 185–191, 2015.
Wang, Q. G., Han, Z. W., Wang, T. J., and Higano, Y.: An Estimate of Biogenic Emissions of Volatile Organic Compounds during Summertime in China, Environ. Sci. Pollut. R., 14, 69–75, https://doi.org/10.1065/espr2007.02.376, 2007.
Wang, Q. G., Han, Z., Wang, T., and Zhang, R.: Impacts of biogenic emissions of VOC and NOx on tropospheric ozone during summertime in eastern China, Sci. Total Environ., 395, 41–49, 2008.
Wang, R., Tie, X., Li, G., Zhao, S., Long, X., Johansson, L., and An, Z.: Effect of ship emissions on O3 in the Yangtze River Delta region of China: Analysis of WRF-Chem modeling, Sci. Total Environ., 683, 360–370, 2019.
Wei, W., Lv, Z. F., Li, Y., Wang, L. T., Cheng, S. Y., and Liu, H.: A WRF-Chem model study of the impact of VOCs emission of a huge petrochemical industrial zone on the summertime ozone in Beijing, China, Atmos. Environ., 175, 44–53, 2018.
Wei, X. L., Li, Y. S., Lam, K. S., Wang, A. Y., and Wang, T. J.: Impact of biogenic VOC emissions on a tropical cyclone-related ozone episode in the Pearl River Delta region, China, Atmos. Environ., 41, 7851–7864, 2007.
Wiedinmyer, C., Akagi, S. K., Yokelson, R. J., Emmons, L. K., Al-Saadi, J. A., Orlando, J. J., and Soja, A. J.: The Fire INventory from NCAR (FINN): a high resolution global model to estimate the emissions from open burning, Geosci. Model Dev., 4, 625–641, https://doi.org/10.5194/gmd-4-625-2011, 2011.
Wild, O., Zhu, X., and Prather, M. J.: Fast-J: Accurate Simulation of In- and Below-Cloud Photolysis in Tropospheric Chemical Models, J. Atmos. Chem., 37, 245–282, 2000.
WRAP – Western Regional Air Partnership: 2002 Fire Emission Inventory for the WRAP Region – Phase II, Project No. 178-6, available at: http://www.wrapair.org/forums/fejf/tasks/FEJFtask7PhaseII.html (last access: 30 September 2021), 2005.
WRF Users Page: WRF Source Codes and Graphics Software Downloads, WRF [data set], available at: http://www2.mmm.ucar.edu/wrf/users/download/get_source.html, last access: 28 September 2021.
Wu, K., Yang, X., Chen, D., Gu, S., Lu, Y., Jiang, Q., Wang, K., Ou, Y., Qian, Y., Shao, P., and Lu, S.: Estimation of biogenic VOC emissions and their corresponding impact on ozone and secondary organic aerosol formation in China, Atmos. Res., 231, 104656, https://doi.org/10.1016/j.atmosres.2019.104656, 2020.
Yang, Q., W. I. Gustafson Jr., Fast, J. D., Wang, H., Easter, R. C., Morrison, H., Lee, Y.-N., Chapman, E. G., Spak, S. N., and Mena-Carrasco, M. A.: Assessing regional scale predictions of aerosols, marine stratocumulus, and their interactions during VOCALS-REx using WRF-Chem, Atmos. Chem. Phys., 11, 11951–11975, https://doi.org/10.5194/acp-11-11951-2011, 2011.
Yarwood, G., Wilson, G., Shepard, S., and Guenther, A.: User’s Guide to the Global Biosphere Emissions and Interactions System (Glo-BEIS) Version 3, ENVIRON International Corporation, Novato, CA, 2002.
Yin, L., Xu, Z., Liu, M., Xu, T., Wang, T., Liao, W., Li, M., Cai, X., Kang, L., Zhang, H., and Song, Y.: Estimation of biogenic volatile organic compound (BVOC) emissions in China using WRF–CLM–MEGAN coupled model, Biogeosciences Discuss. [preprint], https://doi.org/10.5194/bg-2019-458, 2020.
Zaveri, R. A. and Peters, L. K.: A new lumped structure photochemical mechanism for large-scale applications, J. Geophys. Res.-Atmos., 104, 30387–30415, 1999.
Zhang, L., Wang, T., Lv, M., and Zhang, Q.: On the severe haze in Beijing during January 2013: Unraveling the effects of meteorological anomalies with WRF-Chem, Atmos. Environ., 104, 11–21, 2015.
Zhang, R., Suh, I., Lei, W., Clinkenbeard, A. D., and North, S. W.: Kinetic studies of OH-initiated reactions of isoprene, J. Geophys. Res.-Atmos., 105, 24627–24635, 2000.
Zhao, C. and Zhang, M.: mszhang96/wrfchem_ustc: WRF-Chem_MEGANv3.0 (v1.0), Zenodo [data set], https://doi.org/10.5281/zenodo.4663508, 2021.
Zhao, C., Wang, Y., and Zeng, T.: East China Plains: A “Basin” of Ozone Pollution, Environ. Sci. Technol., 43, 1911–1915, 2009.
Zhao, C., Liu, X., Leung, L. R., Johnson, B., McFarlane, S. A., Gustafson Jr., W. I., Fast, J. D., and Easter, R.: The spatial distribution of mineral dust and its shortwave radiative forcing over North Africa: modeling sensitivities to dust emissions and aerosol size treatments, Atmos. Chem. Phys., 10, 8821–8838, https://doi.org/10.5194/acp-10-8821-2010, 2010.
Zhao, C., Chen, S., Leung, L. R., Qian, Y., Kok, J. F., Zaveri, R. A., and Huang, J.: Uncertainty in modeling dust mass balance and radiative forcing from size parameterization, Atmos. Chem. Phys., 13, 10733–10753, https://doi.org/10.5194/acp-13-10733-2013, 2013a.
Zhao, C., Ruby Leung, L., Easter, R., Hand, J., and Avise, J.: Characterization of speciated aerosol direct radiative forcing over California, J. Geophys. Res.-Atmos., 118, 2372–2388, 2013b.
Zhao, C., Hu, Z., Qian, Y., Ruby Leung, L., Huang, J., Huang, M., Jin, J., Flanner, M. G., Zhang, R., Wang, H., Yan, H., Lu, Z., and Streets, D. G.: Simulating black carbon and dust and their radiative forcing in seasonal snow: a case study over North China with field campaign measurements, Atmos. Chem. Phys., 14, 11475–11491, https://doi.org/10.5194/acp-14-11475-2014, 2014.
Zhao, C., Huang, M., Fast, J. D., Berg, L. K., Qian, Y., Guenther, A., Gu, D., Shrivastava, M., Liu, Y., Walters, S., Pfister, G., Jin, J., Shilling, J. E., and Warneke, C.: Sensitivity of biogenic volatile organic compounds to land surface parameterizations and vegetation distributions in California, Geosci. Model Dev., 9, 1959–1976, https://doi.org/10.5194/gmd-9-1959-2016, 2016.
Zheng, J., Zheng, Z., Yu, Y., and Zhong, L.: Temporal, spatial characteristics and uncertainty of biogenic VOC emissions in the Pearl River Delta region, China, Atmos. Environ., 44, 1960–1969, 2010.
Zhou, G., Xu, J., Xie, Y., Chang, L., Gao, W., Gu, Y., and Zhou, J.: Numerical air quality forecasting over eastern China: An operational application of WRF-Chem, Atmos. Environ., 153, 94–108, 2017.
Zimmer, W., Steinbrecher, R., Körner, C., and Schnitzler, J. P.: The process-based SIM–BIM model: towards more realistic prediction of isoprene emissions from adult Quercus petraea forest trees, Atmos. Environ., 37, 1665–1671, 2003.