the Creative Commons Attribution 4.0 License.
the Creative Commons Attribution 4.0 License.
 | 16 Aug 2021
Extension of a gaseous dry deposition algorithm to oxidized volatile organic compounds and hydrogen cyanide for application in chemistry transport models
Zhiyong Wu
John T. Walker
Paul A. Makar
Judith A. Perlinger
Xuemei Wang
The dry deposition process refers to flux loss of an atmospheric pollutant due to uptake of the pollutant by the Earth's surfaces, including vegetation, underlying soil, and any other surface types. In chemistry transport models (CTMs), the dry deposition flux of a chemical species is typically calculated as the product of its surface layer concentration and its dry deposition velocity (Vd); the latter is a variable that needs to be highly empirically parameterized due to too many meteorological, biological, and chemical factors affecting this process. The gaseous dry deposition scheme of Zhang et al. (2003) parameterizes Vd for 31 inorganic and organic gaseous species. The present study extends the scheme of Zhang et al. (2003) to include an additional 12 oxidized volatile organic compounds (oVOCs) and hydrogen cyanide (HCN), while keeping the original model structure and formulas, to meet the demand of CTMs with increasing complexity. Model parameters for these additional chemical species are empirically chosen based on their physicochemical properties, namely the effective Henry's law constants and oxidizing capacities. Modeled Vd values are compared against field flux measurements over a mixed forest in the southeastern US during June 2013. The model captures the basic features of the diel cycles of the observed Vd. Modeled Vd values are comparable to the measurements for most of the oVOCs at night. However, modeled Vd values are mostly around 1 cm s−1 during daytime, which is much smaller than the observed daytime maxima of 2–5 cm s−1. Analysis of the individual resistance terms and uptake pathways suggests that flux divergence due to fast atmospheric chemical reactions near the canopy was likely the main cause of the large model–measurement discrepancies during daytime. The extended dry deposition scheme likely provides conservative Vd values for many oVOCs. While higher Vd values and bidirectional fluxes can be simulated by coupling key atmospheric chemical processes into the dry deposition scheme, we suggest that more experimental evidence of high oVOC Vd values at additional sites is required to confirm the broader applicability of the high values studied here. The underlying processes leading to high measured oVOC Vd values require further investigation.
- Article
(2180 KB) - Full-text XML
-
Supplement
(1142 KB) - BibTeX
- EndNote


Atmospheric pollutants impact human health and can also cause detrimental effects on sensitive ecosystems (Wright et al., 2018). Quantifying atmospheric deposition for atmospheric pollutants is needed to estimate their lifetimes in air and deposition rates to ecosystems. In the mass continuity equation of a chemistry transport model (CTM), atmospheric deposition is calculated separately for dry and wet deposition fluxes. Dry deposition refers to the removal process through which pollutants are taken up by the Earth's surface, and this process, while being quite slow, is a continuous process happening all the time, even during precipitation. In contrast, wet deposition is fast but episodic, and pollutants need to first be incorporated into hydrometeors before being delivered to the surface via precipitation. The amount of dry deposition of a pollutant of interest is typically calculated as the product of its ambient concentration and its dry deposition velocity (Vd), with Vd being calculated using empirically developed dry deposition schemes (Wesely and Hicks, 2000). In most Vd formulations, turbulent and diffusion effects are parameterized as aerodynamic and quasi-laminar resistance, respectively, above and sometimes also inside the canopy. Uptake effects by canopies, underlying soils, and any other surface types are parameterized as canopy (or surface) resistance, which includes several flux pathways such as to stomatal, cuticle, and soil. All of these flux pathways can be simultaneously affected by meteorological, biological, and chemical factors, most of which cannot be explicitly considered and are thus highly empirically parameterized in existing dry deposition schemes, which are known to have large uncertainties even for the most commonly studied chemical species such as O3, SO2, and more commonly measured nitrogen species with relatively rich flux datasets (Flechard et al., 2011; Wu et al., 2012, 2018)
Existing dry deposition schemes have thus far considered a small number of oxidized volatile organic compounds (oVOCs). Due to the lack of field flux data for oVOCs, Vd of these species is typically parameterized based on physicochemical properties, taking SO2 and O3 as references (Wesely, 1989; Zhang et al., 2003). In these existing schemes, Vd values of most oVOCs are of a similar order of magnitude as or slightly smaller than that of Vd of O3. However, higher daytime Vd values for certain oVOCs than predicted by these schemes were recently reported by two studies (Karl et al., 2010; Nguyen et al., 2015). In one study Karl et al. (2010) found that Vd values of oVOCs calculated using existing schemes are about a factor of 2 lower than those based on canopy-level concentration gradient measurements over six forest and shrubland sites. Vd in their study was calculated from an inverse Lagrangian transport model with concentration gradient data as model input. The ratios of magnitudes between Vd(oVOCs) and Vd(O3) in the study of Karl et al. (2010) are similar to those of Zhang et al. (2003) in that Vd(oVOCs) are slightly smaller than Vd(O3) in both cases. However, the typical daytime Vd(O3) over vegetated canopies is around 1 cm s−1 in the literature from numerous studies (see summary in Silva and Heald, 2018), and the value in Karl et al. (2010) is much higher (e.g., up to 2.4 cm s−1 at canopy top). One hypothesis explaining both high Vd(O3) and high Vd(oVOCs) would be the reaction of O3 with oVOCs, which depends on the chemical structure of the oVOC, but data required for validating this hypothesis are still lacking. We thus suspect that the very high Vd(oVOCs) values presented in Karl et al. (2010) were likely caused by atmospheric chemical processes not typically considered in the dry deposition process. High Vd(oVOCs) values were also observed over a temperate mixed forest in the southeastern US in a more recent short-term study (Nguyen et al., 2015), which again were suspected to be caused by atmospheric chemical reactions near vegetation surface. The flux measurements themselves also contain uncertainty. For example, Wu et al. (2015) showed that different measurement methods (e.g., flux gradient versus eddy correlation) resulted in very different daytime Vd(O3) over the same forest canopy.
Hydrogen cyanide (HCN) is one of the most abundant cyanides present in the atmosphere (Singh et al., 2003) and is considered a biomass burning marker (Bunkan et al., 2013), but few existing studies have considered its dry deposition, which is critical to estimating the total sinks and atmospheric lifetimes of cyanides.
To meet the demands of modeling a large number of organic compounds in CTMs (Kelly et al., 2019; Moussa et al., 2016; Paulot et al., 2018; Pye et al., 2015; Xie et al., 2013), existing or newly developed air–surface exchange and dry deposition schemes need to be expanded to include additional oVOCs. At this stage with very limited knowledge of oVOC Vd, air–surface exchange models based on various theoretical and/or measurement approaches should be developed so that these models can be made available to the scientific community where such models are urgently needed as well as for future evaluation and improvement should more flux measurements become available. For example, Nguyen et al. (2015) modified the Wesely (1989) scheme to fit the flux data. A more sophisticated model, with a bottom-up approach, was adopted in Nizzetto and Perlinger (2012) to handle air–canopy exchange of semivolatile organic compounds.
The original dry deposition scheme of Zhang et al. (2003) includes 9 inorganic species and 22 organic species. Most of these 22 organic species are oVOCs formed from oxidation of nonmethane hydrocarbons. To take advantage of the recent flux dataset of a large number of oVOCs and HCN collected over a temperate forest (Nguyen et al., 2015), the present study extends the Zhang et al. (2003) scheme by including 12 additional oVOC species and HCN while keeping the same original model structure and theory. These additional oVOCs include hydroxymethyl hydroperoxide, peroxyacetic acid, organic hydroxy nitrates, and other multifunctional species that are mainly formed from the oxidation of biogenic VOCs (e.g., isoprene and monoterpenes). Model parameters for these newly included species are theoretically constrained based on the effective Henry's law constants and oxidizing capacities of the individual species as well as by considering the measured Vd values. Such an approach provides a top-down determination of Vd through comparison with measured (bottom-up) fluxes. Model–measurement comparison is conducted for Vd as well as resistance components and uptake pathways, results from which identify the major causes of model–measurement discrepancies. This study provides a computer code that is potentially useful for CTMs handling these oVOCs.
2.1 Brief description of the Vd formulation
In the scheme of Zhang et al. (2003), Vd is calculated as follows:
where Ra is the aerodynamic resistance, Rb the quasi-laminar sub-layer resistance, Rc the surface resistance, and z the reference height above the vegetation. Rc is parameterized as
where Rs is the canopy stomatal resistance, Rm the mesophyll resistance, Rns the non-stomatal resistance including resistance for uptake by leaf cuticles (Rcut) and by soil or ground litter (Rg), Rac in-canopy aerodynamic resistance, and Wst the fraction of stomatal blocking under wet conditions.
Rs is calculated as follows:
Here Gs(PAR) is the unstressed canopy stomatal conductance for water vapor, a function of photosynthetically active radiation (PAR). The dimensionless functions f(T), f(D), and f(ψ) range from 0 to 1, representing the fractional degree of stomatal closure caused by the stress from temperature, water vapor pressure deficit, and leaf water potential, respectively. and Di are the molecular diffusivities for water vapor and the gas of interest, respectively.
Rcut and Rg for any chemical species are scaled to those of SO2 and O3 with two species (i)-dependent scaling parameters α(i) and β(i):
Details of the Rs-related formulas were described in Zhang et al. (2002), Rns-related formulas in Zhang et al. (2003), and Ra and Rb formulas in Wu et al. (2018).
2.2 Extension of the scheme to additional chemical species
Dry deposition of a gaseous compound to most canopy types is mainly through non-stomatal uptake during nighttime and through both non-stomatal and stomatal uptake during daytime. The non-stomatal uptake depends on water solubility and reactivity of the species, which can be quantified by its effective Henry's law constant (H*) and oxidizing capacity, respectively (Wesely, 1989; Zhang et al., 2002).
In the Supplement, Table S1 lists H* values and Table S2 lists the oxidizing capacities for oVOCs and HCN considered in the present study. As shown in Eq. (5) above, two model parameters (α and β) are needed for every chemical species to calculate the non-stomatal uptake, with α being dependent on H* and β dependent on oxidizing capacity. Initial α values were first given based on the relative magnitudes of H* of all the chemical species and that of SO2. Considering that the majority of the chemical species are very reactive, a value of 1.0 was used for β for most species and smaller values for a few less reactive species. α and β values were then adjusted based on the agreement of nighttime Vd between modeled values and measured fluxes obtained from a forest site in the southeastern US during summer (Nguyen et al., 2015). When adjusting α and β values, two rules were first applied: (1) the trends in α (or β) values between different chemical species should be consistent with the trends of their log (H*) (or oxidizing capacity) (see Fig. S1 in the Supplement for the finalized α versus log (H*)), and (2) modeled mean and median nighttime Vd should be mostly within a factor of 2.0 of the measured values (see discussion in Sect. 3.2 below). Only after these two rules were satisfied were the possible maximum α and β values chosen to reduce the gap between the modeled and measured daytime Vd, knowing that model-predicted Vd values were mostly lower than the measured ones. The finalized α and β values for the additional 12 oVOCs and HCN are listed in Table 1.
Table 1List of model parameters needed in the scheme of Zhang et al. (2003) to simulate the dry deposition velocity of additional oVOC species and HCN: α and β are scaling parameters for non-stomatal resistance, and Rm is mesophyll resistance.

a Treated as one group of compounds in the field measurements due to instrument limitations and have the same parameter values in the model. b The β value for HCOOH in Zhang et al. (2003) is 0.0, and here it is given as 0.2 to be consistent with other oVOC species (which would make no difference since the α value of 2 would dominate the non-stomatal resistance).
Model parameters chosen for the additional oVOCs and HCN can produce the magnitude of nighttime Vd for nearly all the chemical species, but they inevitably underpredicted daytime Vd for several oVOC species with very high measured daytime Vd values. We designed the model parameters this way due to the following considerations: (1) some of the chemical processes causing flux loss at the surfaces may be treated separately in the mass continuity equation in chemical transport models, (2) some of the oVOCs may also experience bidirectional air–surface exchange, and (3) more flux measurements are needed to confirm if the very high daytime flux for certain oVOCs is a universal phenomenon, noting that the existing data used here were from a short period of several days and over only one surface type.
Besides α and β, another chemical-species-dependent parameter that needs to be arbitrarily chosen is Rm. Rm for HCN was set to 100 s m−1 based on its effective Henry's law constants and oxidizing capacities. Karl et al. (2010) found that enzymatic conversion can be an efficient pathway for the immobilization of oVOCs (e.g., methacrolein and methyl vinyl ketone, acetaldehyde, methacrolein) within the leaf interior, besides dissolution and oxidation, which suggests that the magnitude of Rm for oVOCs is minimal. Thus, the Rm for the oVOCs was set to 0 s m−1 (Table 1).
2.3 Field flux data
The fluxes of 16 atmospheric compounds (including 13 oVOC species, HCN, hydrogen peroxide – H2O2, and nitric acid – HNO3) were measured using the eddy covariance (EC) technique at the Centreville (“CTR”) Southeastern Aerosol Research and Characterization Study (SEARCH) site (hereinafter referred to as CTR). Note that formic acid (HCOOH) is the only overlapping oVOC species between the original Zhang et al. (2003) scheme and the flux measurement dataset. The CTR site (Brent, Alabama; 32.90∘ N, 87.25∘ W) is surrounded by a grassy field to the south and a temperate mixed forest that is part of the Talladega National Forest in all the other directions. The forest canopy is comprised of needleleaf coniferous (shortleaf, longleaf, and loblolly pine; ∼ 40 %) and broadleaf deciduous (primarily oak, sweetgum, and hickory; ∼ 60 %) tree species. The canopy height near the tower is on average ∼ 10 m with a leaf area index (LAI) of ∼ 4.7 m2 m−2. A 20 m metal walk-up tower is used as the main structure supporting instruments that measured the eddy covariance fluxes and related meteorological variables. The sonic anemometer and the gas inlet were mounted at a height of about 22 m, facing north toward the forest. Mixing ratios of gas-phase compounds were measured with negative-ion chemical ionization mass spectrometry (CIMS) at 8 Hz or faster. A database of half-hourly Vd for 16 atmospheric compounds covering 5 non-continuous days in June 2013 was obtained at the site. During these periods, the predominant winds were northerly, which is ideal to sample air from the forest (Fig. S2), and the requirement for energy balance closure was met (see Nguyen et al., 2015). At CTR, it was typically humid (RH 50 %–80 %) and warm (28–30 ∘C) in the daytime during the experiment (Fig. S3). A comprehensive description of the Vd dataset, data processing protocols, instrumental methods, uncertainty analysis, and site characterizations can be found in Nguyen et al. (2015).
3.1 Comparison of modeled resistance components
3.1.1 Atmospheric resistances (Ra and Rb)
For very reactive and soluble substances such as HNO3 and H2O2, Rc is often assumed to be close to 0 (Hall and Claiborn, 1997; Meyers et al., 1989; Valverde-Canossa et al., 2006; Wesely and Hicks, 2000). The analysis of the measurement data showed that the daytime averaged Vd for HNO3 and H2O2 fit the rate of deposition well without surface resistance () (Nguyen et al., 2015), which supports the assumption of near-zero Rc for HNO3 and H2O2 over the mixed deciduous–coniferous CTR site under a humid environment. Therefore, the measured Vd of HNO3 and H2O2 can be used to evaluate the modeled atmospheric resistances for those species (the sum of Ra and Rb). Ra represents the resistance for turbulent transport between the reference height and the surface and is not chemical-compound-specific. Rb quantifies the resistance for the mass transfer across the thin layer of air in contact with surface elements and is a function of the molecular diffusivity of a specific compound (Wesely and Hicks, 1977). In theory, the differences in Rb between any two gaseous species are only determined by differences in their molecular diffusivity at any given turbulent condition.
Figure 1 compares the modeled average diel variations of Vd for HNO3 and H2O2 against observations. The measured Vd values for HNO3 and H2O2 peaked around noon at about 4 and 6 cm s−1, respectively, and were less than 1 cm s−1 during the night. The model reproduced the diel pattern and captured the peak Vd values at noon well. During the early nighttime (hours 19–23), the modeled Vd values for HNO3 and H2O2 were on the order of 1 cm s−1, which is much higher than the measurements (< 0.2 cm s−1). During the night, Ra dominates atmospheric resistance as it is usually much larger than Rb in magnitude. This discrepancy between the measurement and the model during the early night could be due to the stability correction functions used in the Ra calculation (the equations can be found in the article by Wu et al., 2018), which is subject to large uncertainties under nocturnal stable conditions (Högström, 1988). The measurements indicated that H2O2 deposited slightly faster than HNO3, and the model reproduces this well, as shown in Fig. 1. Modeled Rb for H2O2 is always smaller than that for HNO3 due to the smaller molecular weight and the larger molecular diffusivity. Overall, the model was in good agreement with the measurements regarding Vd for HNO3 and H2O2, implying that the parameterization for atmospheric resistances (Ra and Rb) was reasonable for the site during the study period.

Figure 1Comparison of the observed and modeled average diel variations of dry deposition velocities (Vd) for HNO3 and H2O2. The shaded area indicates the standard deviation of the observations. The model assumes that surface resistances (Rc) for HNO3 and H2O2 are zero.
3.1.2 Stomatal resistance (Rs)
Over vegetated areas, gas molecules can exit and enter the leaf through the stomata by molecular diffusion, similar to the leaf–air exchange of water vapor and CO2. In dry deposition models, Rs for water vapor is estimated using evapotranspiration stomatal submodels, an approach that is also popular in the land surface and climate communities. Rs is extended to any gas species using the ratio of molecular diffusivity of the species of interest to that of water vapor (Pleim and Ran, 2011; Wesely and Hicks, 2000). Figure 2 compares the modeled canopy stomatal conductance () for water vapor against the observation-based estimates. The observation-based Gs was estimated by using the inversion of the Penman–Monteith (P-M) equation (Monteith and Unsworth, 1990), which calculates Rs for water vapor by using measured water vapor fluxes and related meteorological data (e.g., humidity, temperature). The evaporation from soil water and liquid water on the vegetation surfaces is usually a minor contribution to the total water vapor flux observed above a forest canopy during daytime in summer. It was assumed that 85 % of the water vapor flux originated from transpiration in this study, following that used in the study of Turnipseed et al. (2006) at Duke Forest, North Carolina. Note that a value of 90 % was used by Clifton et al. (2017) at Harvard Forest, Massachusetts. The uncertainty of the calculated Rs related to the uncertainty in water vapor flux portion (on an order of 10 %) is much smaller than the differences between the modeled and the observation-based stomatal conductance (by a factor of 2) as discussed below.
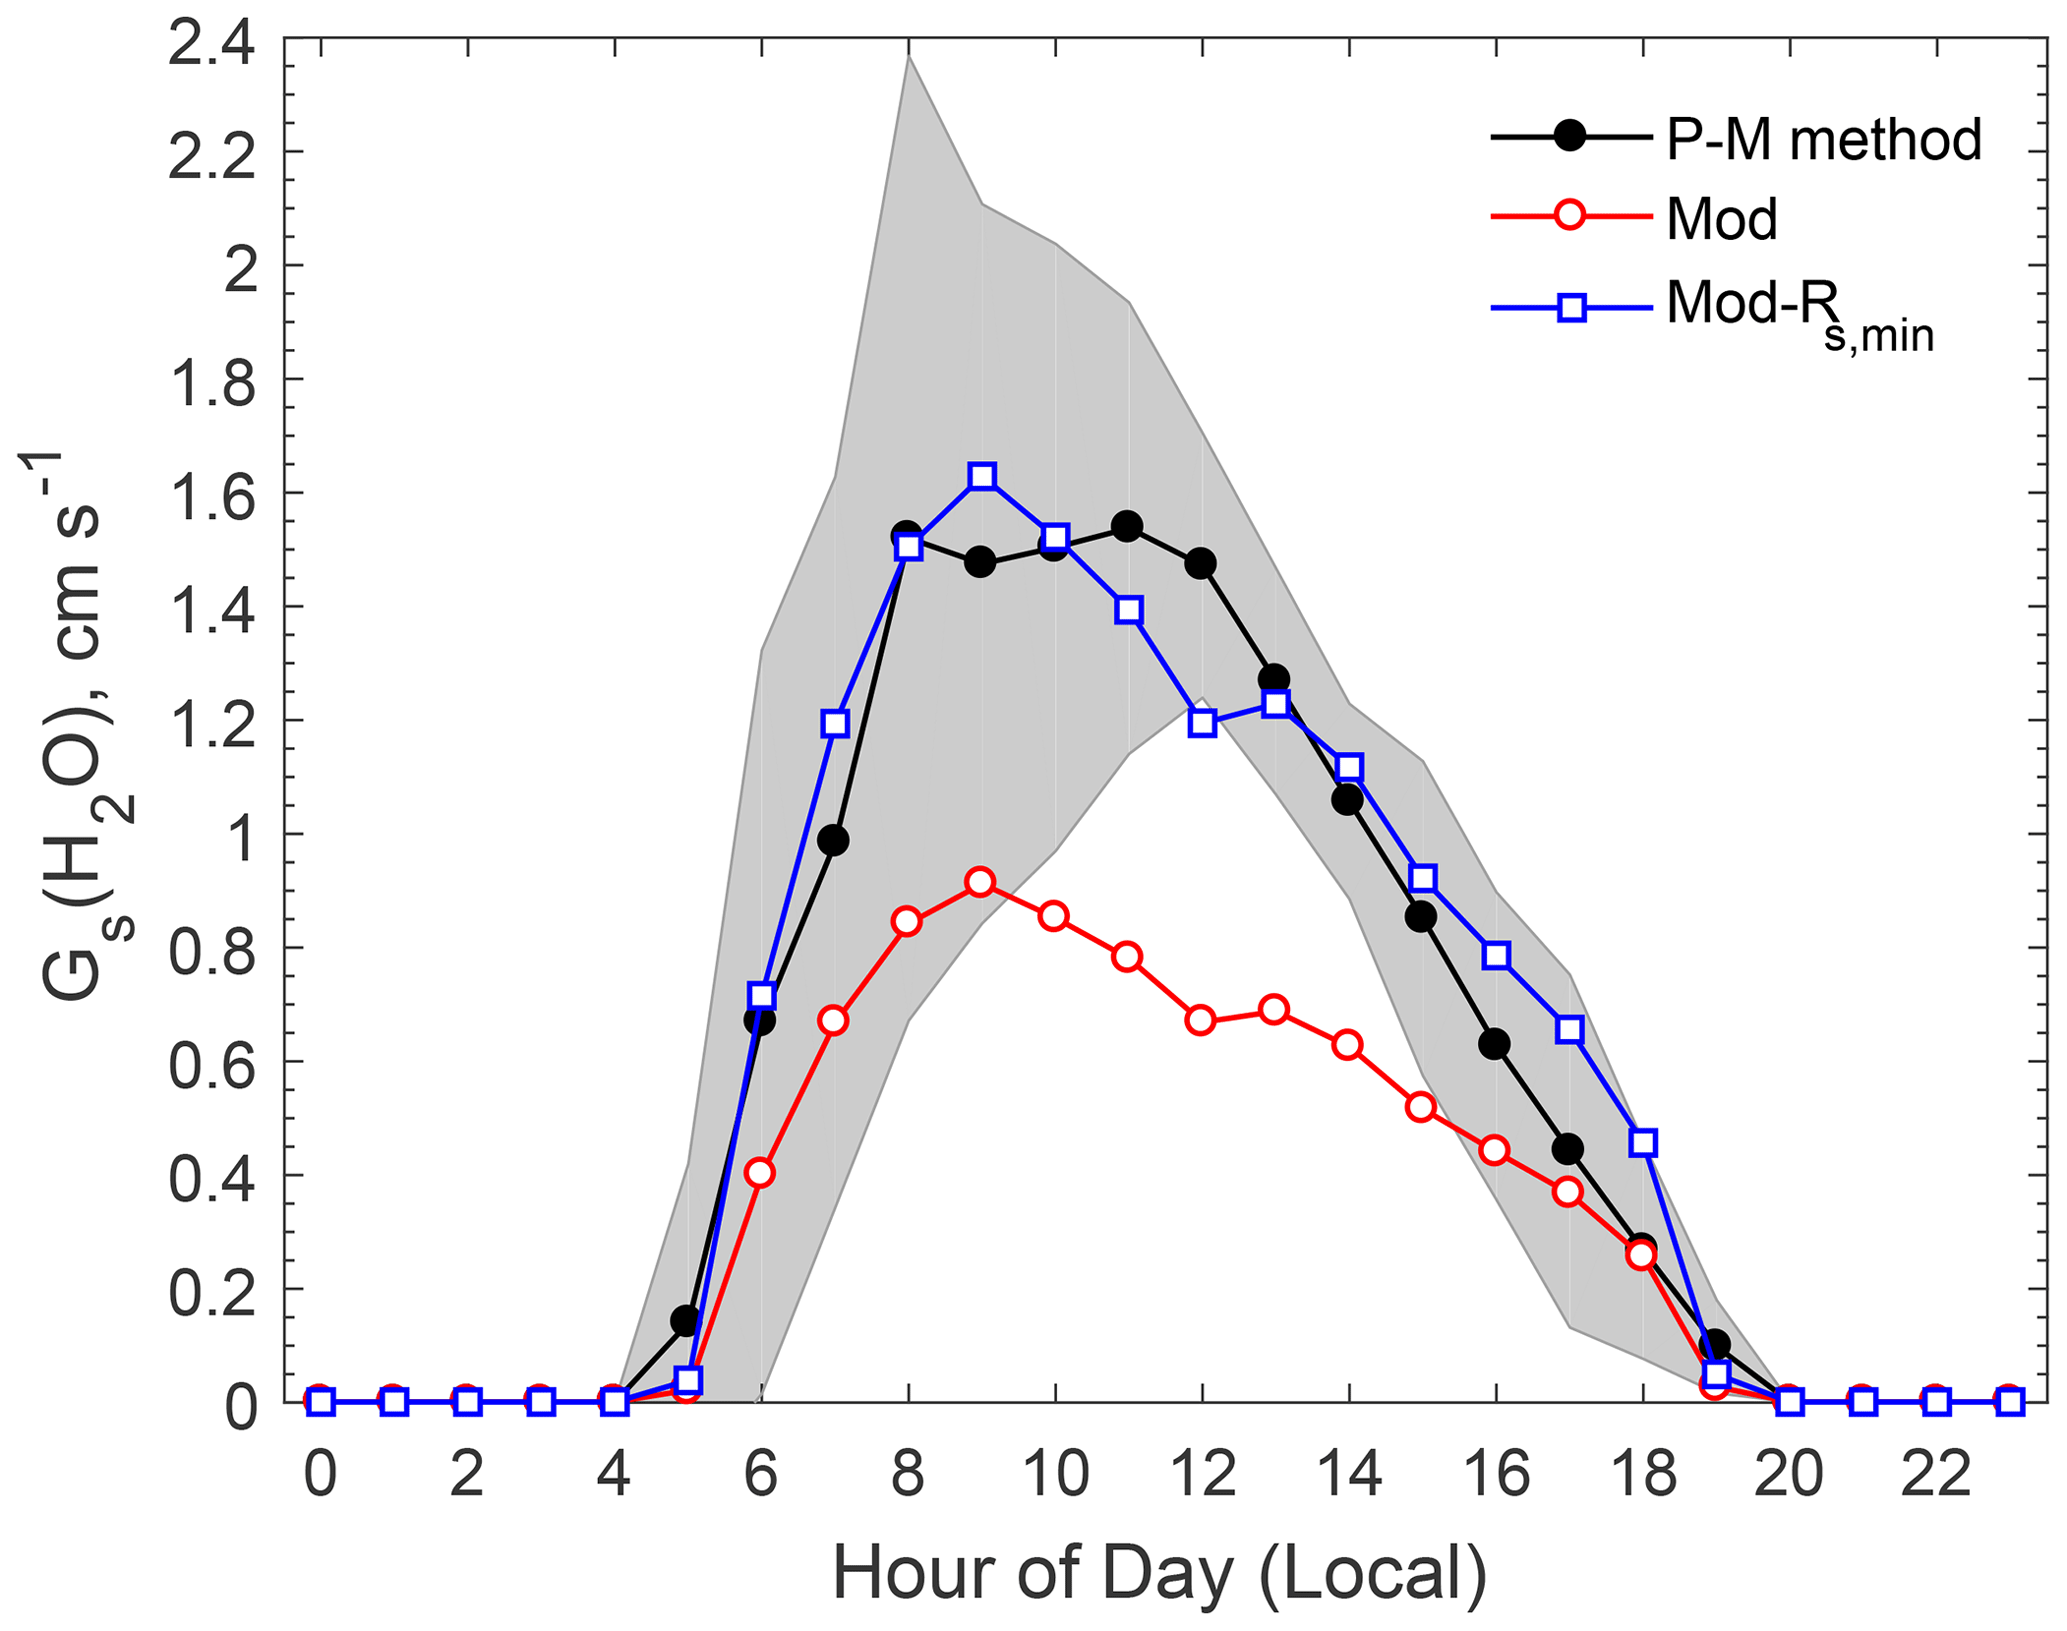
Figure 2Comparison of observation-based and modeled average diel variations of stomatal conductance (Gs) for water vapor. The shaded area indicates the standard deviation of the observation-based Gs(H2O) estimated by the P-M method. “Mod-Rs,min” refers to a model sensitivity test in which Rs,min was reduced by 40 %.
As shown in Fig. 2, the model reproduced the basic diel pattern in Gs (i.e., highest values between 08:00 and 11:00), but the peak value is only about half of the observation-based values. The Jarvis-type stomatal submodel (Jarvis, 1976) is known for its linear dependence on the prescribed minimum stomatal resistance (Rs,min), a term that is subject to large uncertainties (Kumar et al., 2011; Wu et al., 2018, 2011). A series of tests conducted by iteratively adjusting the Rs,min values showed the modeled Gs to be in better agreement with observations if Rs,min was decreased by 40 % (Fig. 2). Modeled Gs with the adjusted Rs,min was in good agreement with the observation-based values most of the time, though the modeled values were slightly smaller than the observation-based estimates around noon. Analysis of the Rs parameterization indicates that this discrepancy was related to the stress function for water vapor pressure deficit (VPD) used in the Jarvis-type stomatal submodel, which may overpredict the stress on stomatal opening due to high VPD around noon.
3.1.3 Non-stomatal resistance (Rns)
To assess if the non-stomatal resistance (Rns) parametrization (Eq. 3) is reasonable, modeled (defined as Gns) values are compared with the non-stomatal portion of the flux, the inverse of which is termed the residual conductance (Gresidual). Gresidual includes all processes influencing deposition aside from Ra, Rb, Rm, and Rs, calculated as . Here Vd is from the observations, Ra and Rb are calculated by the model driven by the observed meteorology, Rs is the observation-based estimate by the P-M method adjusted by the molecular diffusivity of each gas (similar to Eq. 4), and Rm is listed in Table 1. The uncertainties in individual resistance terms of Zhang et al. (2003) and several other dry deposition schemes have been thoroughly assessed by Wu et al. (2018), from which we believe Gresidual estimated using the above formula is meaningful although with large uncertainties. The estimated Gresidual can provide useful information on the resulting from processes such as deposition to the leaf cuticle and ground (i.e., non-stomatal) or chemical loss due to reactions within and near the canopy that lead to flux divergence.
Figure 3 compares the observation-based Gresidual for each oVOC species or HCN against the corresponding modeled non-stomatal conductance (Gns) under different conditions. The mean and median values are presented in Table S3. During the nighttime when the canopy surface was dry (no dew), the Gresidual for oVOC species ranged from 0.08 to 0.18 cm s−1, and the modeled Gns was comparable in magnitude. When the surface was wet from dew formation on leaves and needles, the oVOC species showed an increase in Gresidual by 55 %–440 % compared to the nighttime dry surface. The model captured the increases in non-stomatal uptake when the surface become wet with dew, although it may underestimate (e.g., HDC4, INP, HCN) or overestimate (e.g., PAA, DHC4, HCOOH) the wetness effects. During the daytime of the study period, no precipitation was recorded at the CTR site (Fig. S3) and the canopy surface was dry. The mean Gresidual for oVOCs ranged from 0.5 to 8.7 cm s−1 during the daytime, which is much higher than the modeled Gns for most species (0.2–1 cm s−1). Figure S4 presents the diel variations of Gresidual and Gns, and it shows that the modeled Gns had smaller diel variations than those of Gresidual; large differences in magnitude can be seen during the daytime. The modeled Gns showed a peak during the early morning (around 07:00), which may be due to the enhanced non-stomatal uptake by dew-wetted surfaces.
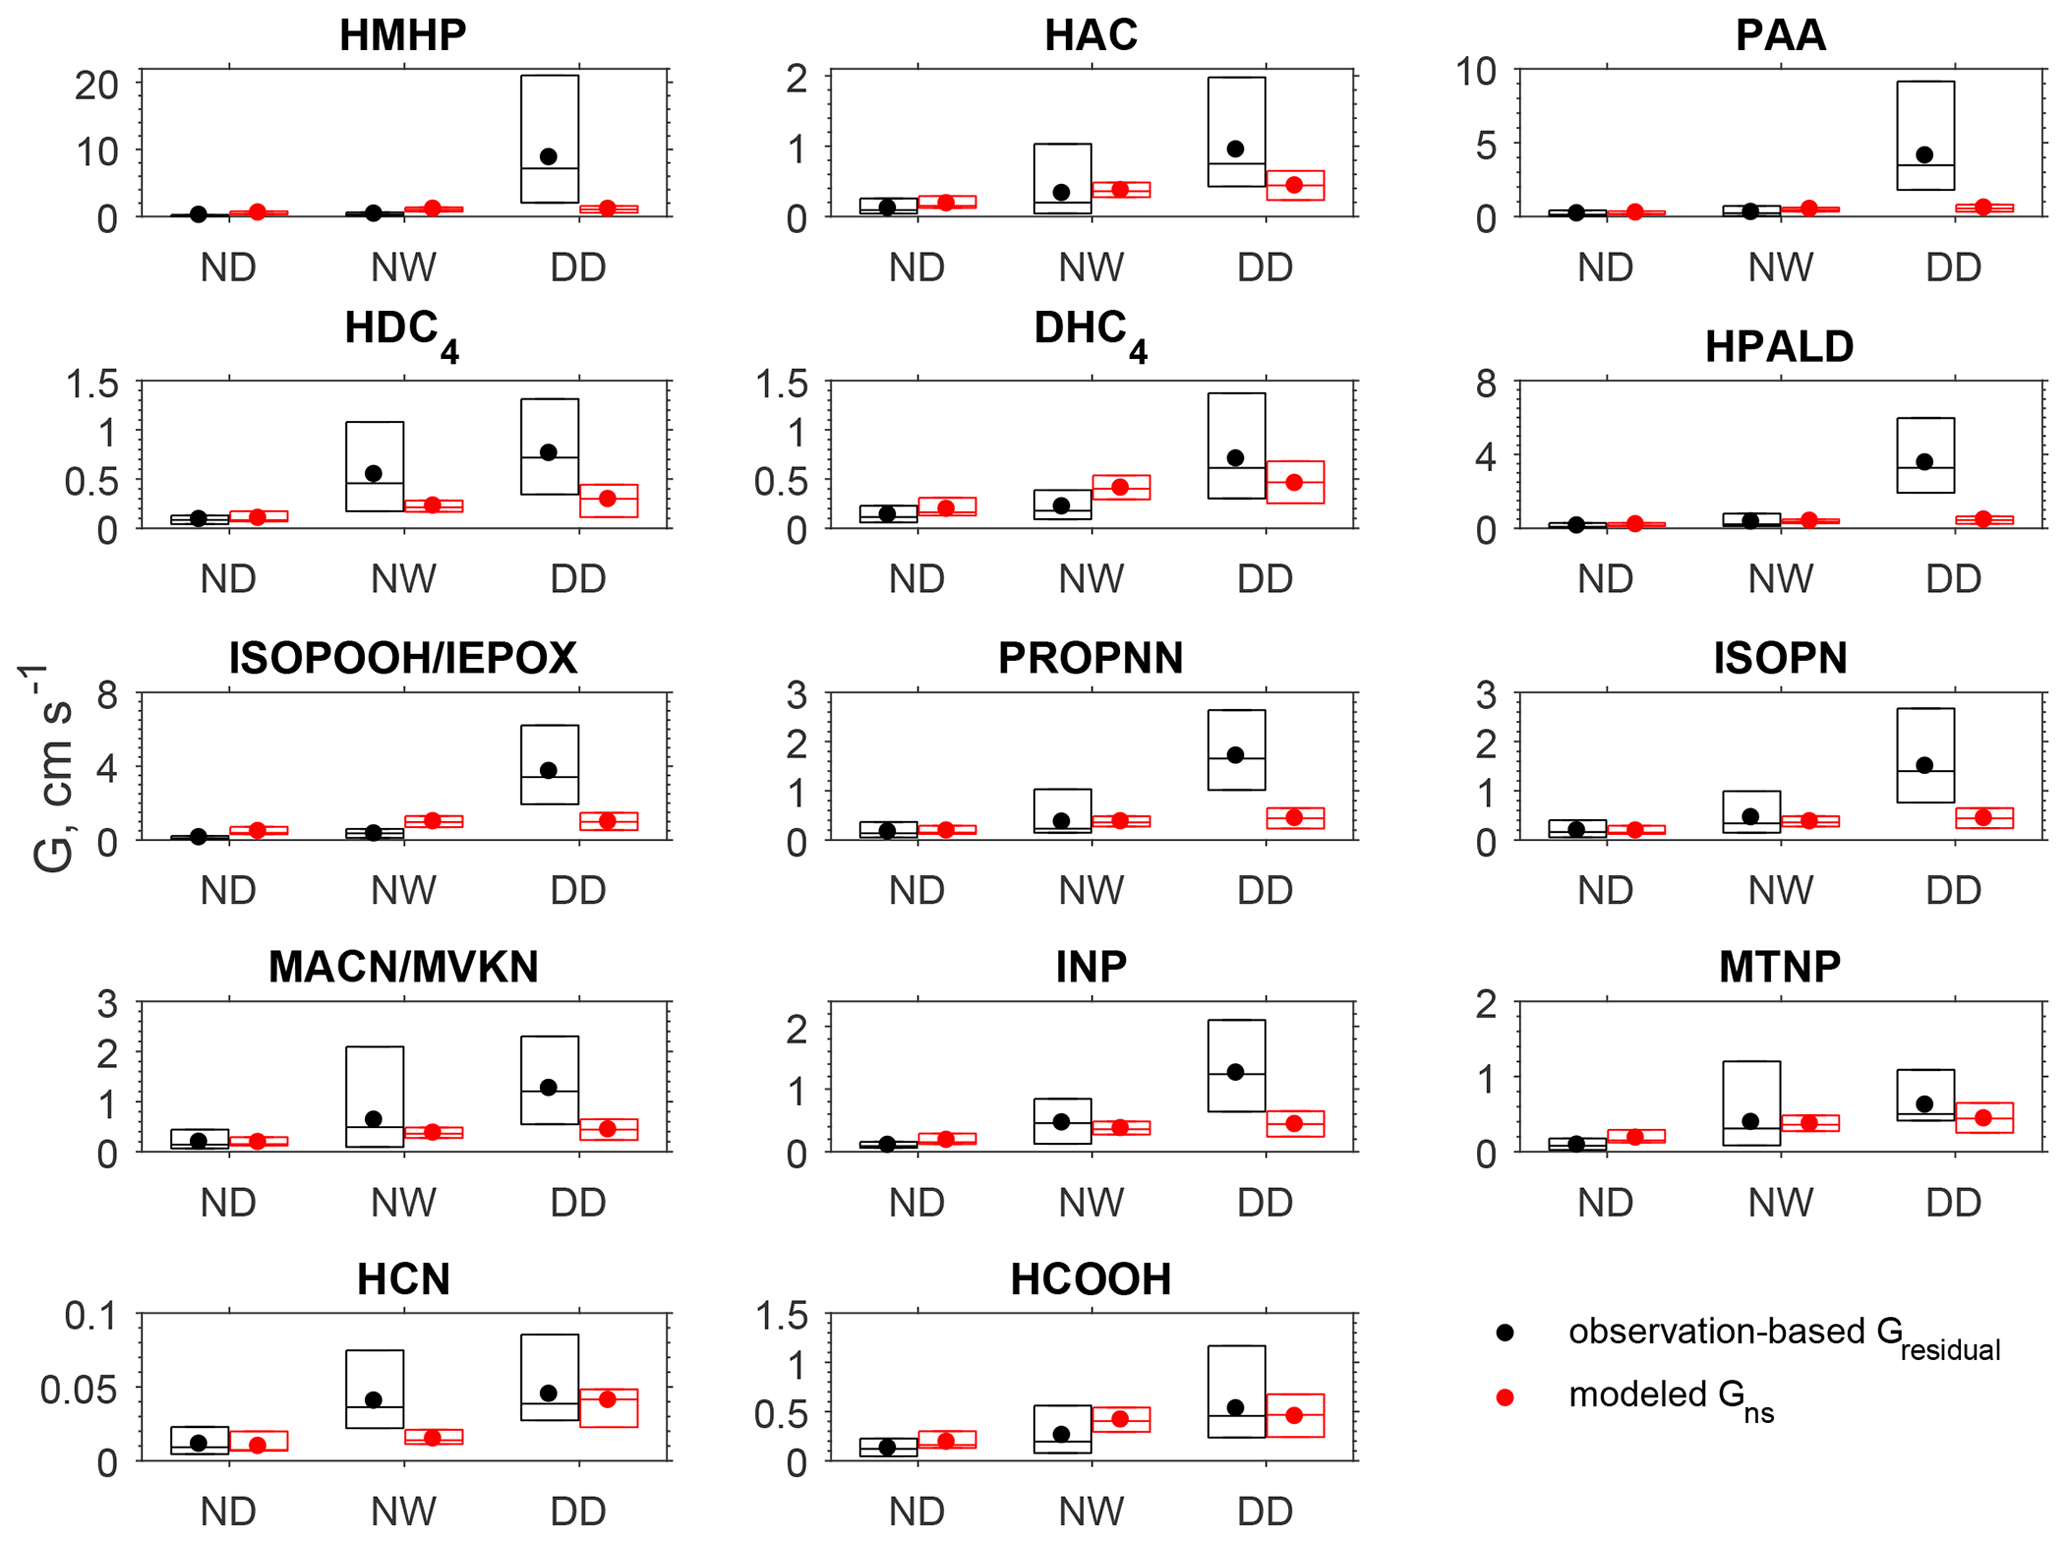
Figure 3Box plot of the observation-based residual conductance (Gresidual) and the modeled non-stomatal conductance (Gns) during the nighttime dry period (ND, n=88), nighttime wet period (NW, n=40), and daytime dry period (DD, n=85). In each box, the central mark is the median, and the edges of the box are the 25th and 75th percentiles. The filled dots represent the arithmetical mean of data between the 25th and 75th percentiles. Daytime is 09:00–17:00 (local time) and nighttime is 20:00–06:00 (local time). The wet surface conditions were determined in the model driven by the observations of relative humidity, precipitation rate, friction velocity, and temperature.
3.2 Evaluation of modeled deposition velocities
Figure 4 shows a model–measurement comparison of diel Vd of the oVOCs and HCN, and Table 2 presents the statistical results of the comparison. As described in Sect. 2, the assigned α and β values should first produce reasonable nighttime Vd. Modeled nighttime mean Vd values were very close to measurements for the majority of the chemical species, although the differences were somewhat larger for the median values (Table 2). Three species (HAC, HPALD, PROPNN) still had 50 % lower modeled than measured nighttime mean Vd but had slightly higher modeled than measured nighttime median Vd. In contrast, modeled daytime mean Vd values were more than 50 % lower than the measured values for four species (HMHP, PAA, HPALD, ISOPOOH/IEPOX) and were also significantly lower for several other species. Only three species (MTNP, HCN, HCOOH) had comparable modeled and measured Vd for both daytime and nighttime. One species (DHC4) had slightly lower modeled than measured daytime mean or median Vd, but with an opposite trend for nighttime Vd.
Table 2Statistical results of the observed and modeled dry deposition velocity (Vd) for oVOCs and HCN (cm s−1)*.

* Note: N is the number of samples; R is the correlation coefficient between observation (Obs) and model simulation (Mod); “Mod-Rs,min” refers to a sensitivity test in which Rs,min was reduced by 40 %; daytime is 09:00–17:00 (local time) and nighttime is 20:00–06:00 (local time). Median values are provided in parentheses, following arithmetic mean values.
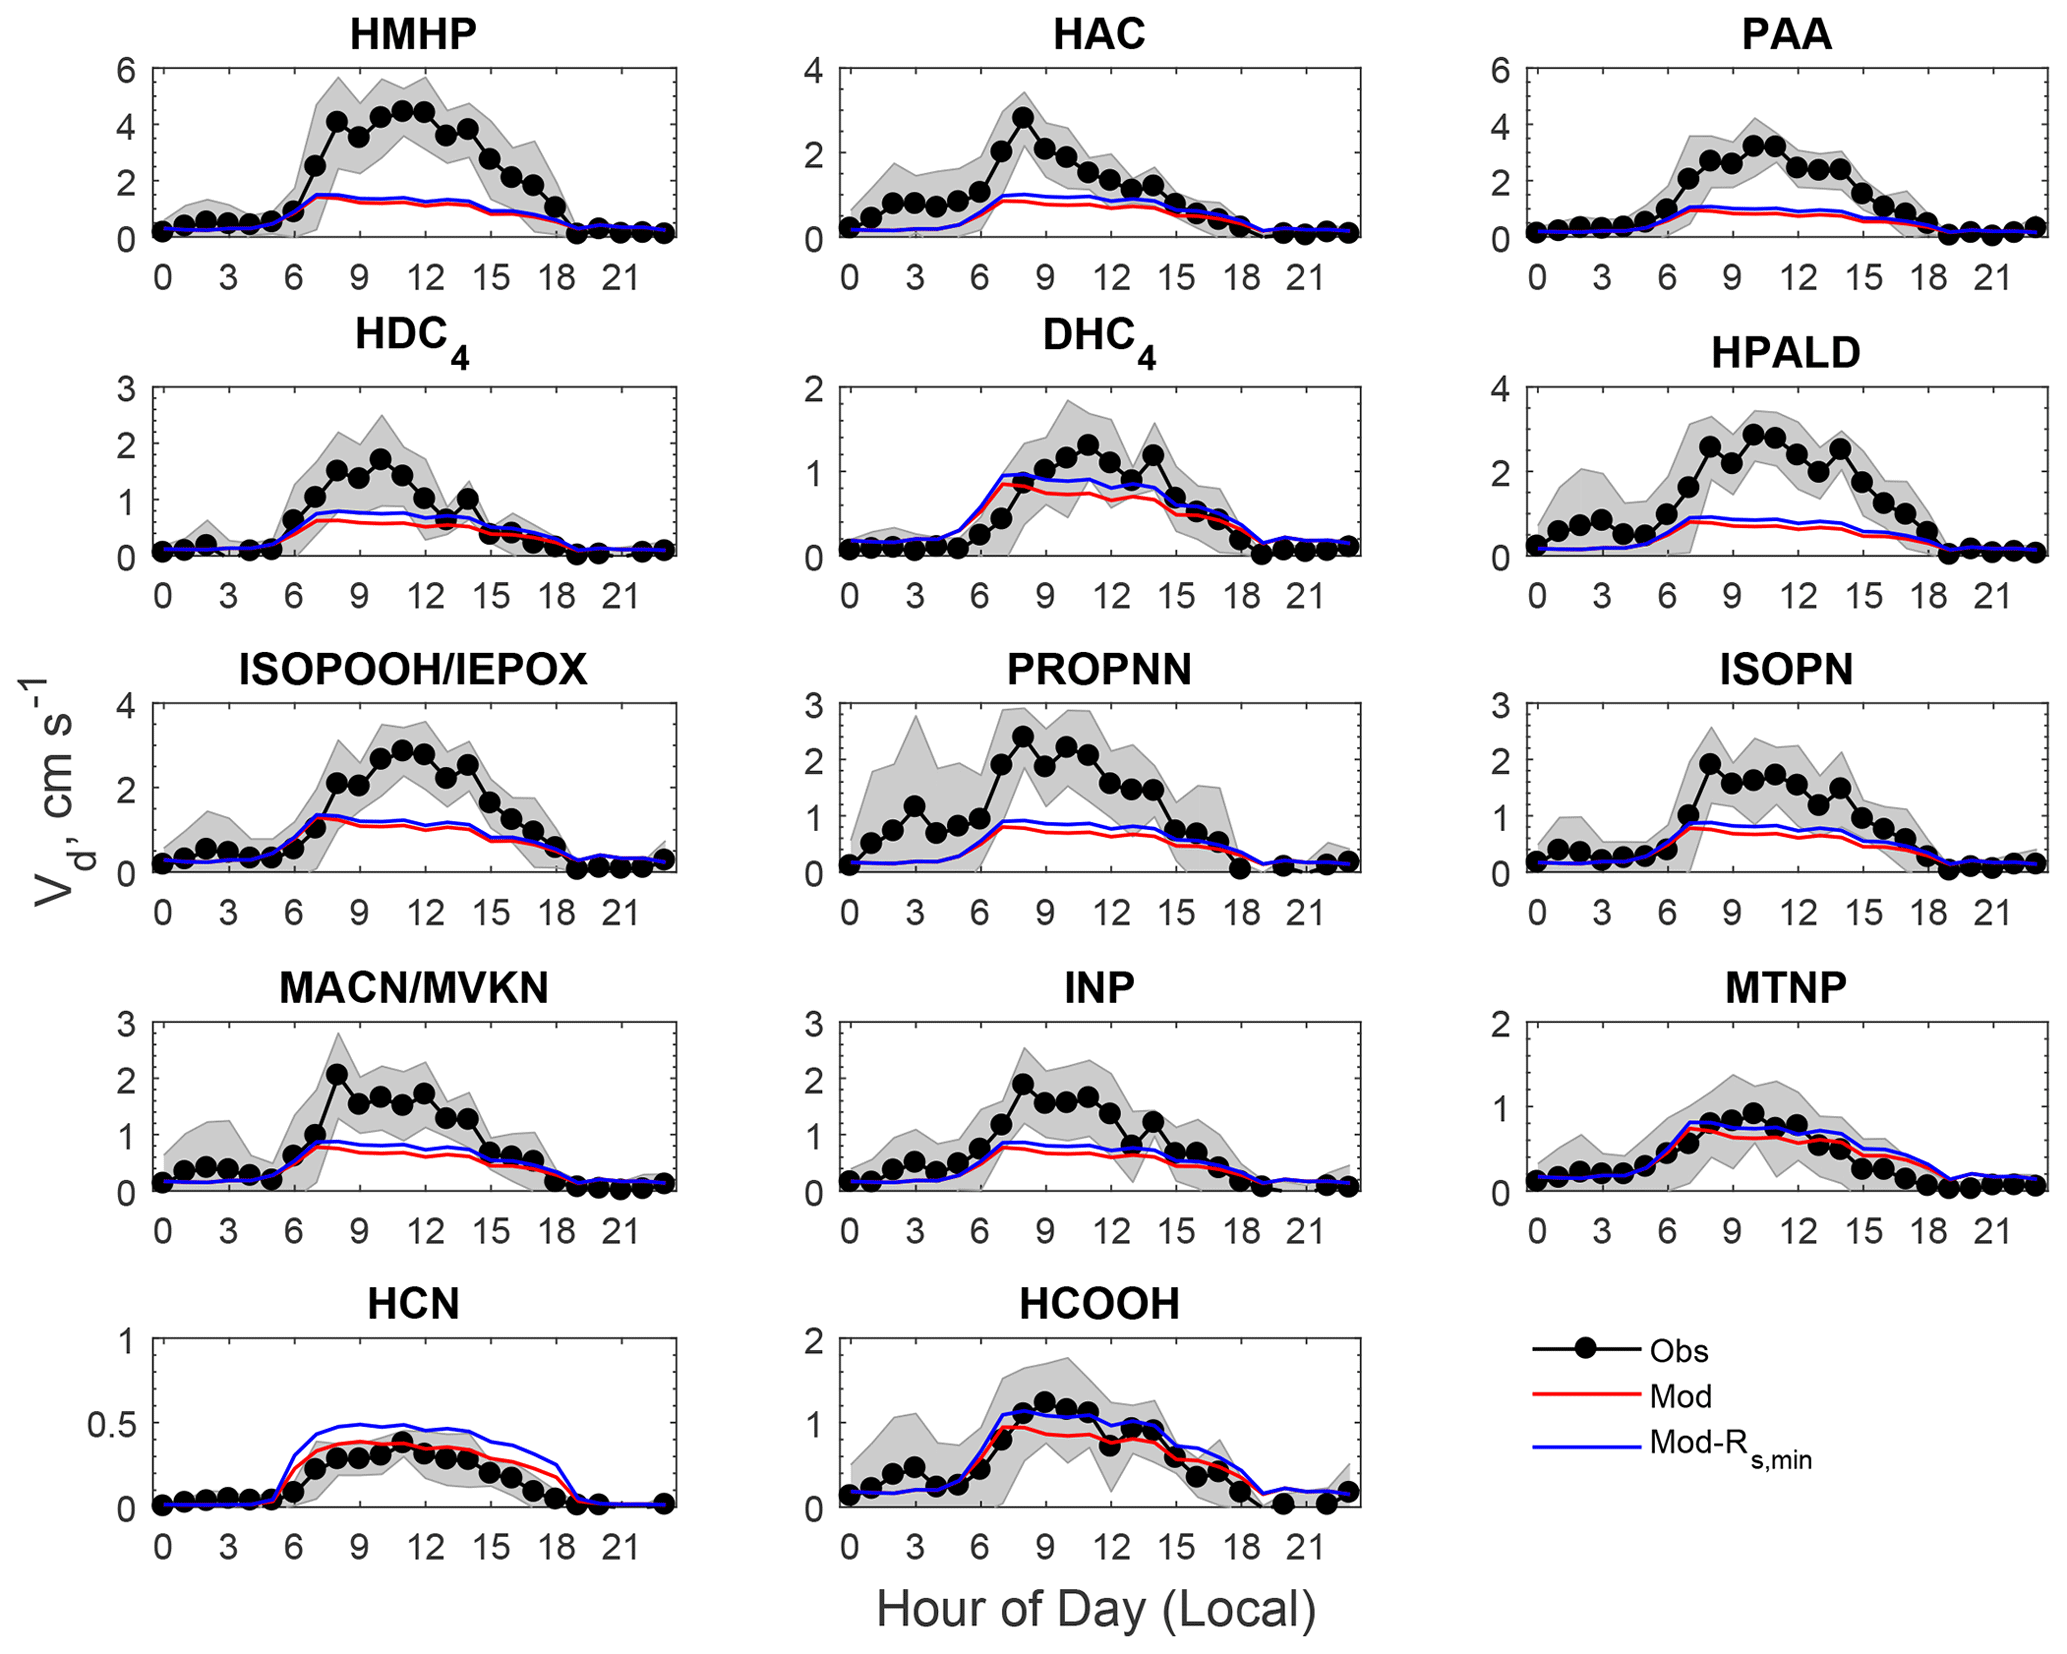
Figure 4Comparison of averaged diel cycles of observed and modeled dry deposition velocities (Vd) of oVOCs and HCN. The shaded area indicates the standard deviation of the observations. “Mod-Rs,min” refers to a sensitivity test in which Rs,min was reduced by 40 %.
The model reproduced the basic features of the diurnal pattern of the observations, showing the highest values during the day and the lowest values at night. Correlation coefficients between the measurement and the model ranged from 0.52 to 0.77. At night, the measured Vd for the oVOCs remained relatively low, typically ranging from 0.1–0.5 cm s−1, and the model produced the same magnitudes for most of the species. During the daytime, the model can only capture the magnitudes of the measured Vd for a few species (e.g., HCN, HCOOH, MTNP, DHC4), the peak Vd values of which were less than 1.5 cm s−1. For the other species, the measured peak Vd values were in the range of 2 to 5 cm s−1, while the modeled results were below 1 cm s−1. As shown in Sect. 3.1.2, the modeled Gs was likely underestimated when compared to the simultaneous measurements of water vapor flux. Adjusting Gs higher by 67 % (through reducing Rs,min by 40 %) can only increase the modeled Vd of the oVOCs by 10 %–40 % during the daytime (see the sensitivity test in Fig. 4), and the peak values were still mostly below 1 cm s−1. Figure 5 shows that the model captured the differences in measured Vd for the oVOCs to some extent. The model–measurement agreements were good for species with the measured mean Vd below 0.5 cm s−1, above which the discrepancy increased. For the measurements, the mean values were significantly larger than the median values, especially for the fast-deposited species, indicating that the distribution of the measured Vd values skewed to the right (high values). The model has better agreement with the measurements by comparing the median versus mean values.
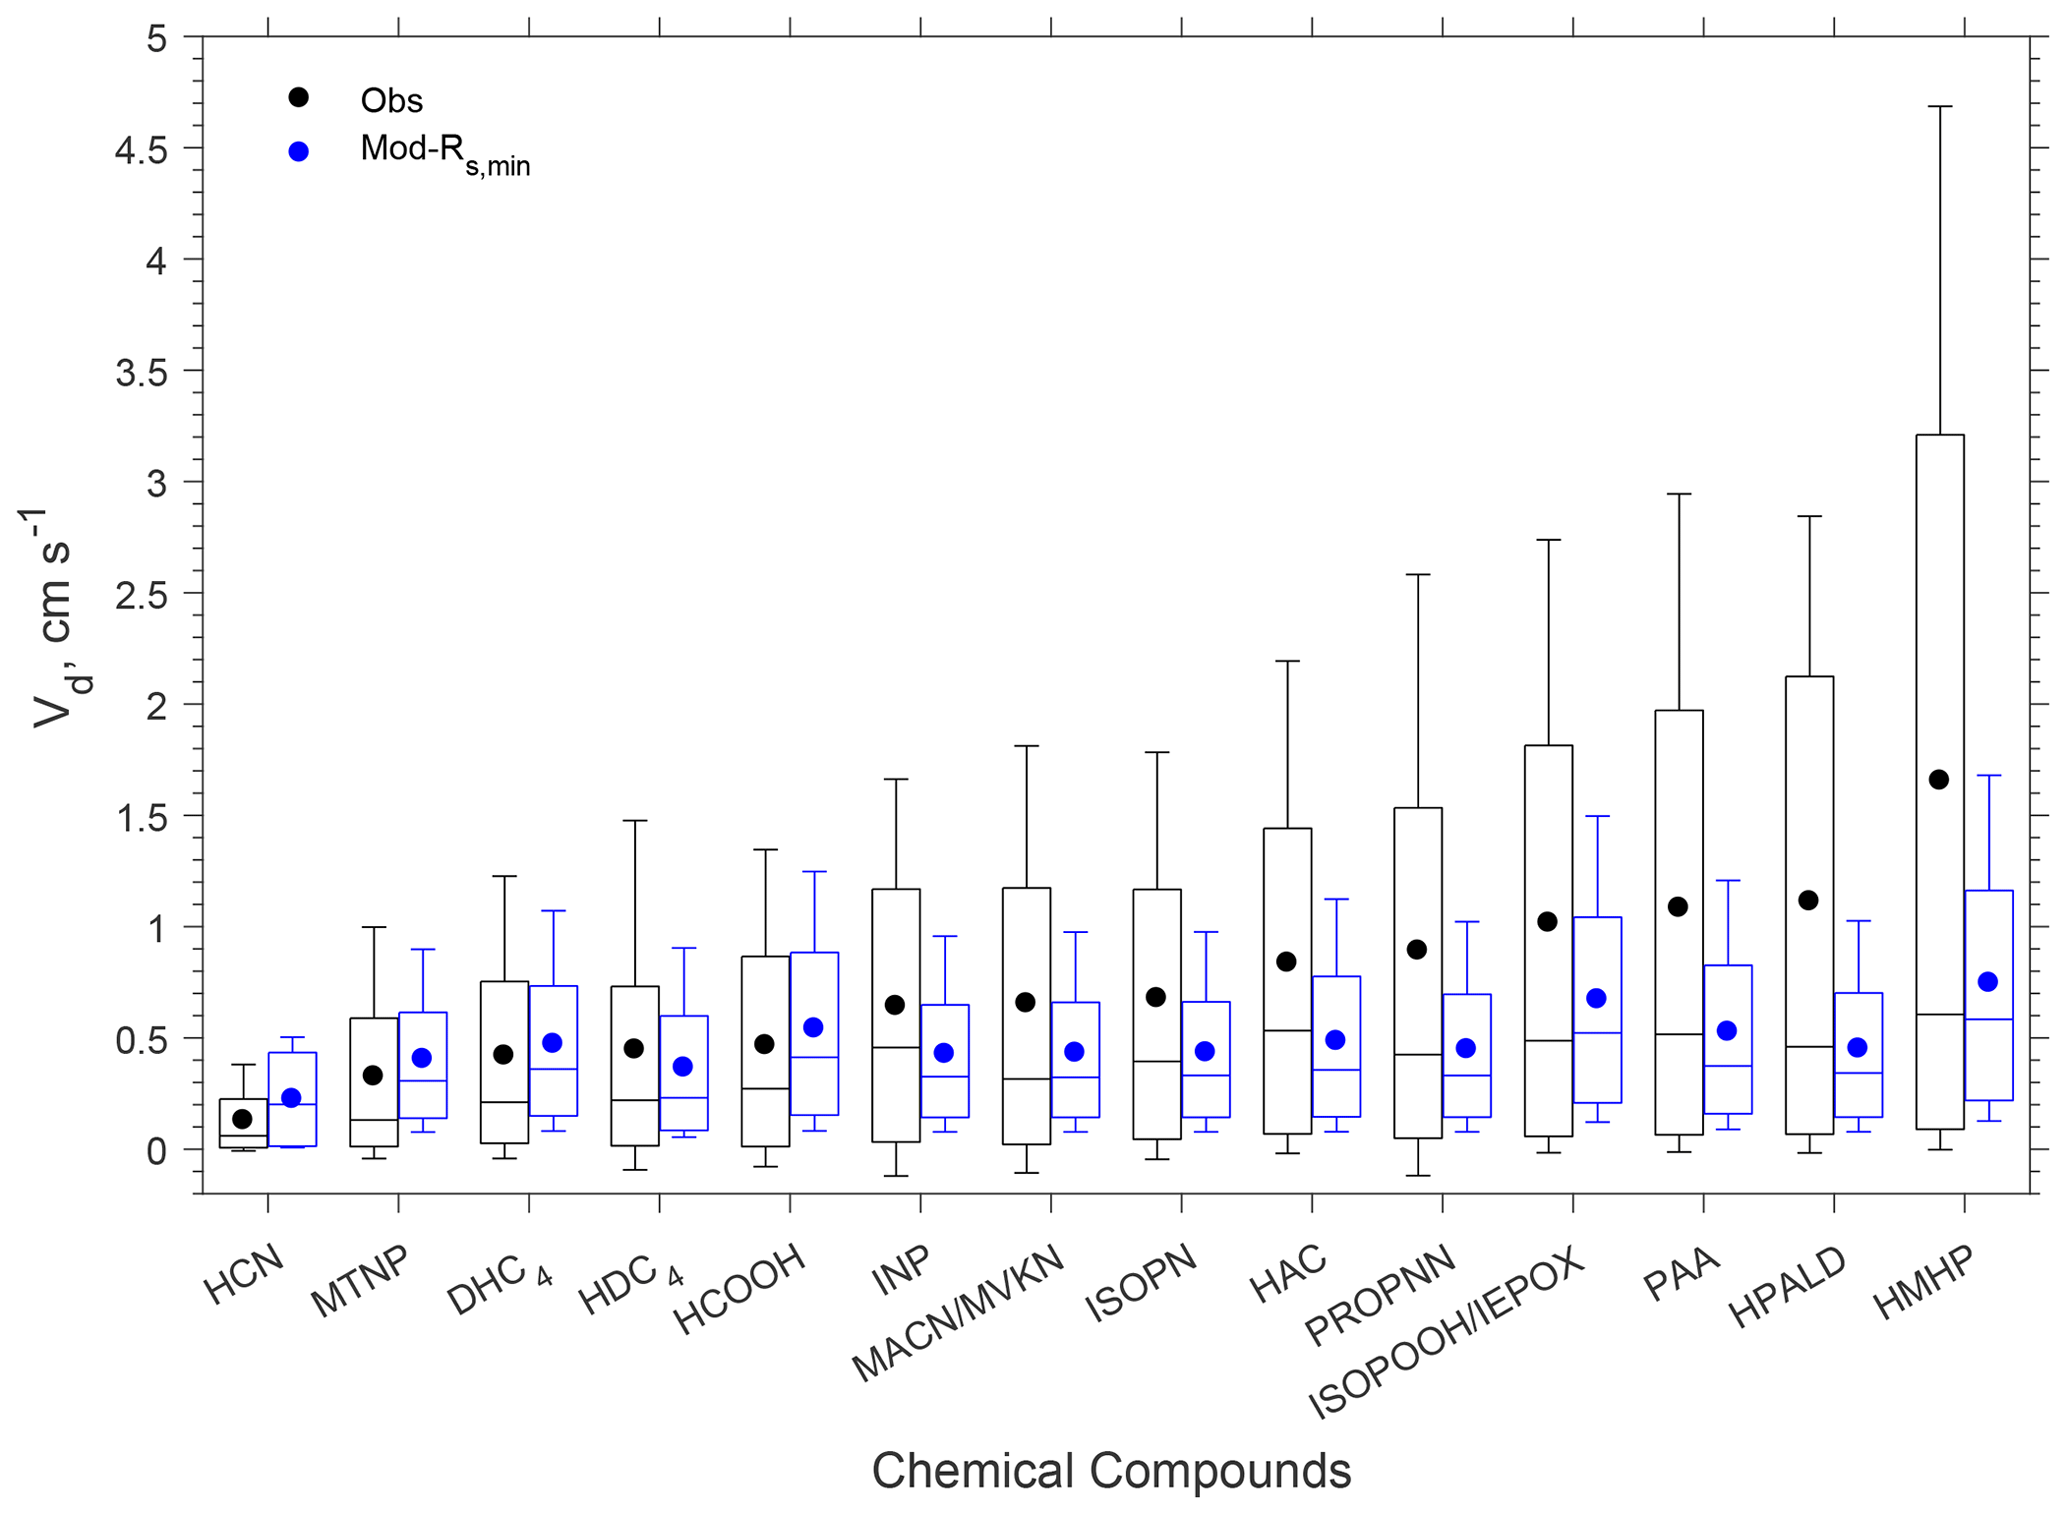
Figure 5Box plot of observed and modeled hourly dry deposition velocities (Vd) of oVOCs and HCN. In each box, the central mark is the median, the edges of the box are the 25th and 75th percentiles, and the whiskers extend to the 10th and 90th percentiles. The filled dots represent the arithmetical mean of all the data. “Mod-Rs,min” refers to a sensitivity test in which Rs,min was reduced by 40 %.
3.3 Fast chemical reactions as potential causes of the daytime model–measurement discrepancies
At night when stomata are mostly closed and atmospheric chemical reactions are largely inhibited, the measured fluxes above the canopy should better represent non-stomatal surface uptake. In the presence of sunlight, fast chemical reactions between the inlet and canopy could make a significant or even dominant contribution to the measured fluxes of reactive species (Cape et al., 2009; Farmer and Cohen, 2008; Wolfe et al., 2011). The impact of fast chemical reactions on surface fluxes should be different for different chemical species. To verify this hypothesis, two chemical species (HAC and PAA) having similar molecular weights (74 and 76 Da, respectively) but very different daytime fluxes were compared (Fig. 6). Their similar molecular diffusivities (controlled by molecular weight) suggest that they should be transferred through the quasi-laminar sub-layer and taken up through leaf stomata at similar rates, resulting in similar resistance components of Rb and Rs. Note that Ra is universal to any trace gases and Rm is assumed to be negligible. Thus, the differences between their Vd should be caused by their different non-stomatal sinks. At night, Vd values were similar between HAC and PAA (median values: 0.04 cm s−1) over dry surfaces. When the surfaces were wet due to dew formation, Vd for both HAC and PAA increased (median values: 0.30–0.48 cm s−1). In contrast, Vd(PAA) was much higher than Vd(HAC) during daytime, suggesting additional or larger sinks for PAA compared to HAC. The reactivity parameters listed in Table S2 in the Supplement also suggest that PAA is more reactive than HAC. Thus, fast chemical processing and subsequent flux divergence above the canopy likely caused the large discrepancies between the measured and modeled Vd for the reactive oVOC compounds during the daytime.
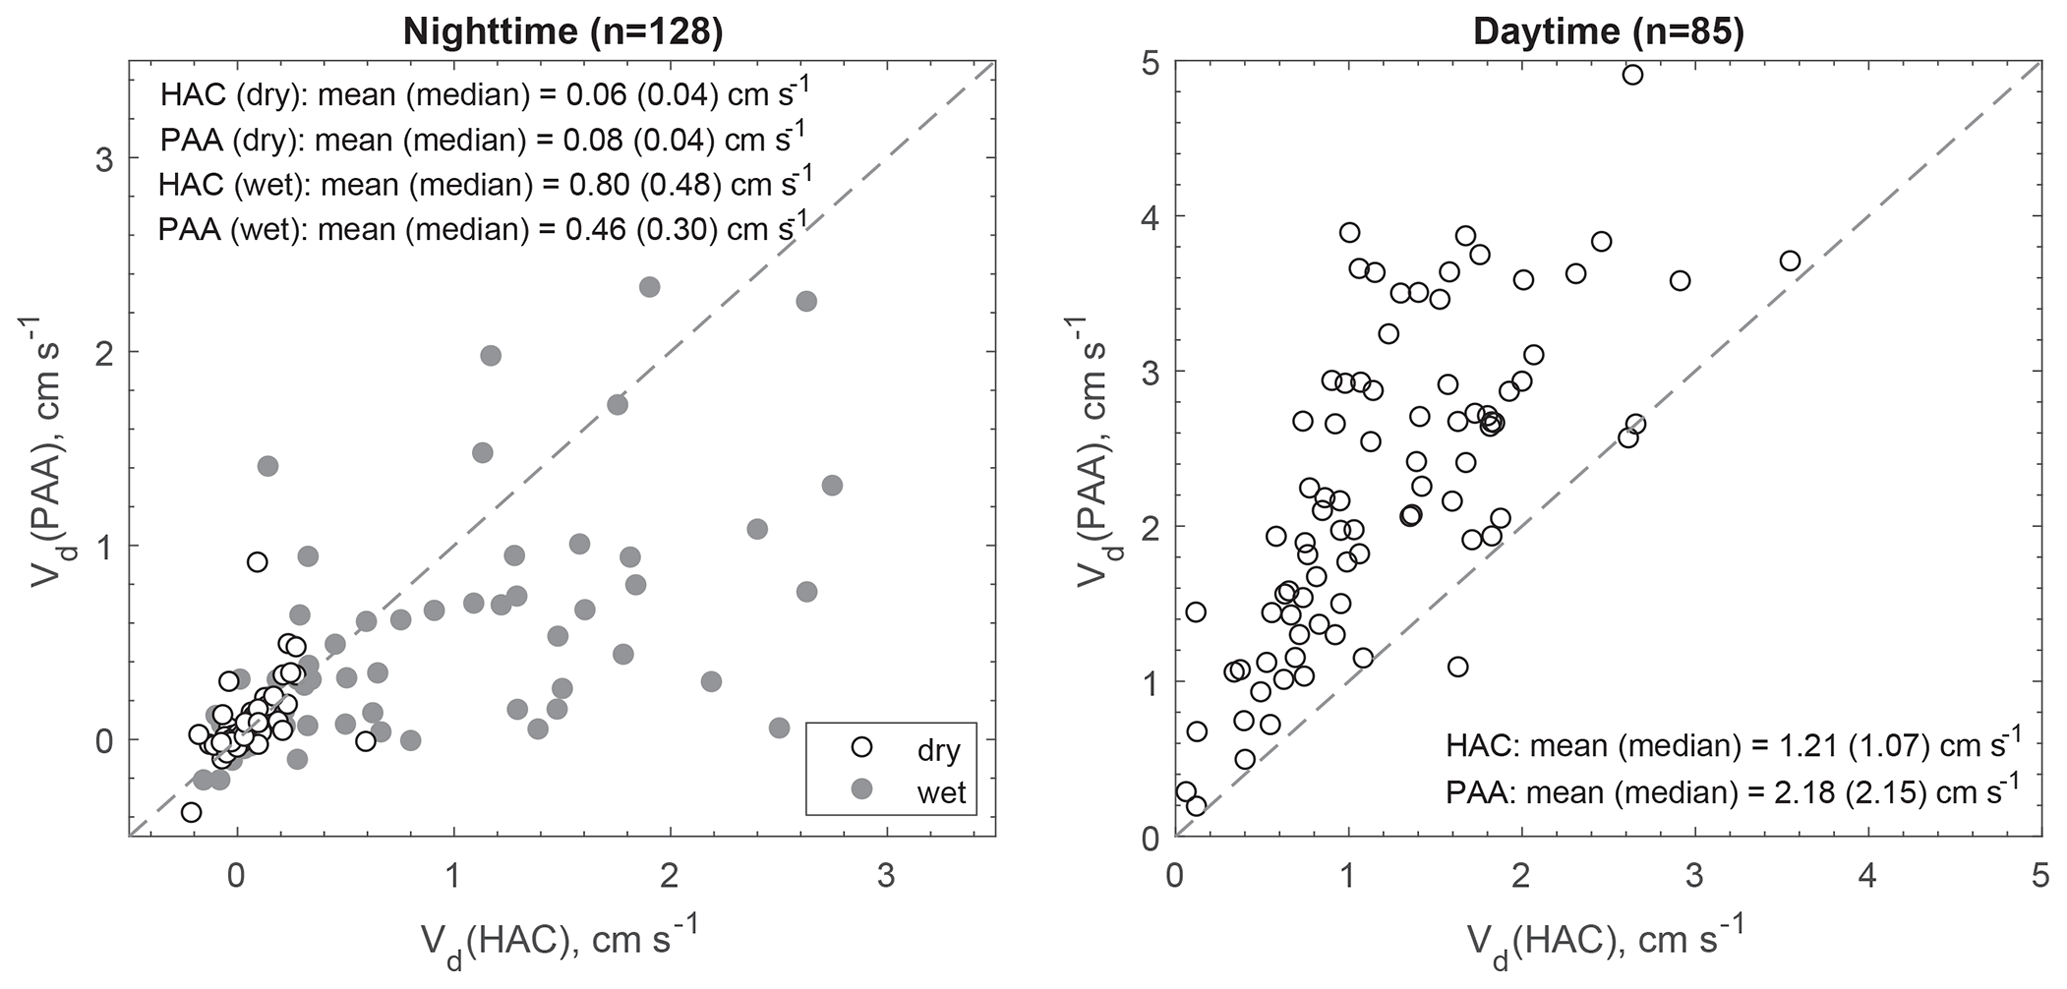
Figure 6Scatter plot of the measured dry deposition velocities (Vd) for hydroxyacetone (HAC) and peroxyacetic acid (PAA) during nighttime (20:00–06:00, local time) and daytime (09:00–17:00, local time). The shaded (white) cycles correspond to wet (dry) surface conditions.
Chemical processes can indeed cause flux divergence or convergence at the surface, which has been supported by growing evidence from field measurements (e.g., Farmer and Cohen, 2008; Min et al., 2014; Wolfe et al. 2009). For example, Wolfe et al. (2009) suggested that the differences in loss rate between the inlet and canopy may be an important contributor to the measured net flux of peroxyacetyl nitrate, irrespective of turbulent timescales. Photochemical OH production is reduced within canopies, which in turn slows down the oxidation of volatile organic compounds and the photolysis of organic nitrates. The oVOCs measured at the CTR site are mainly produced from the oxidation of isoprene and monoterpenes (Nguyen et al., 2015). Most of the oVOCs are quite chemically reactive and can undergo fast oxidation (e.g., multifunctional carbonyls), decomposition (e.g., HMHP), or photolysis (e.g., organic nitrates) (Müller et al., 2014; Nguyen et al., 2015). Vertical gradients in the chemical production and loss rates below the inlet can exhibit chemical flux divergence, which contributes to the net flux above the canopy. Quantifying the effects of chemical processing on the net flux would require a multi-layer model with resolved emission, deposition, turbulent diffusion, and chemical processes throughout the canopy, which is recommended for future studies (e.g., Ashworth et al., 2015; Bryan et al., 2012; Stroud et al., 2005; Wolfe and Thornton, 2011; Zhou et al., 2017).
Quantifying Vd as the ratio of flux to concentration at one measurement height only (), rather than as the ratio of flux to the concentration difference at the measurement height and the surface (), although commonly employed in analyzing eddy covariance flux measurements, is a simplification. It is valid for (1) matter that disappears nearly completely by reactions at the surface and (2) unstable or neutral conditions. Most chemical species considered here may satisfy the first condition. With regards to the second condition, our analysis is based on the assumption that, under stable conditions at nighttime, concentrations observed at the measurement height change in relation to the fluxes measured at this height. However, no relation between measured concentration and flux is typically observed due to the presence of a shallow stable boundary layer, connection between the stable free atmosphere and stable boundary layer by internal gravity waves, ground inversions, and low-level jets, leading to intermittent turbulence at the measurement height containing a gravity wave signal and non-steady-state conditions (Foken, 2017). Future efforts to model oVOC and HCN deposition velocities above forest canopies should be based on neutral or unstable boundary layer flux measurements only or, for example, on a modified Bowen ratio flux measurement in which concentrations are measured at two heights in the constant flux layer. Such an approach can provide a means to compute a measured deposition velocity of a surface-reactive substance as proportional to the ratio between the measured flux and the measured concentration difference.
The number of chemical species simulated in chemical transport models (CTMs) has been increasing with increasing computer power. Among these, oVOCs and HCN are important groups of atmospheric pollutants for which dry deposition processes need to be treated as accurately as possible so that their inputs to ecosystems (noting that some oVOCs are organic nitrogen) and their roles in other atmospheric chemistry processes (e.g., formation of ozone and secondary organic aerosols) can be assessed. Earlier dry deposition schemes considered very few oVOCs and need to be extended for more species. Dry deposition of HCN was assumed to be negligible in some CTMs (e.g., Moussa et al., 2016). The present study first generated the effective Henry's law constant and oxidizing capacity, the two key physical and chemical properties that are considered to control the dry deposition process (Wesely and Hicks, 2000), for 12 oVOC species and HCN. Two scaling factors for the non-stomatal resistance and one for the mesophyll resistance were applied to individual oVOCs and HCN for calculating their respective Vd.
The modeled nighttime Vd agrees well with the measured data for most of the oVOCs, suggesting that the current non-stomatal parameterization scheme is a reasonable approach. The stomatal conductance for water vapor, with adjusted (reduced) Rs,min, also agrees well with measured values. However, the modeled peak Vd values during daytime are only a fraction (0.2–0.5) of the measured values for some of the oVOCs, suggesting that fast atmospheric chemical processes likely contributed to the total measured fluxes. In practice, these additional fluxes during daytime can be modeled as non-stomatal uptake, and better model–measurement agreement can be obtained by adjusting the non-stomatal parameterization scheme (e.g., Müller et al., 2018; Paulot et al., 2018). However, using this approach will produce unreasonably high values for the solubility parameter and overpredict Vd during nighttime if the same non-stomatal formulas are used for both day and nighttime (as is the case in the existing schemes). More importantly, the high measured Vd values have only been observed at relatively few sites during very short periods (Karl et al., 2010; Nguyen et al., 2015). More evidence is needed to parameterize Vd for oVOCs to different land use categories over entire seasons. Until then, the conservative estimates of Vd such as modeled in this study are still recommended for use in CTMs. The model parameters chosen for Vd of these oVOCs provide the best-known representation of their respective physicochemical properties, and the modeled Vd values fall within the range of the low-end values of the available measurements.
Future field studies should focus on conducting flux measurements of oVOC compounds with the highest uncertainties, such as those that are most chemically reactive in the atmosphere or most rapidly taken up by wet surfaces. Additional measurements are also needed in different ecosystems to inform the representativeness of the high oVOC Vd reported by Nguyen et al. (2015) and Karl et al. (2010). Furthermore, concurrent chemical measurements of oxidants such as O3 and radicals are needed to quantify flux divergence due to fast within- and near-canopy chemical reactions. Future dry deposition schemes should include additional biochemical processes and species-dependent parameters for non-stomatal uptake, including enzymatic reactions (Karl et al., 2010), the octanol–air partitioning coefficients to account for cavity formation and polar intermolecular interactions with leaf surfaces and reservoirs (Nizzetto and Perlinger, 2012), and the enhancement and reduction effects due to soil and leaf moisture. Chemical processes within the canopy airspace could also be coupled with emission and deposition schemes to realistically simulate chemical fate and transport, including bidirectional fluxes of the reactive compounds discussed here and less reactive compounds such as methanol. Such an approach would require specification of chemical conditions within and near the canopy as well as in-canopy radiation and airflow. While more computationally intensive, the results presented here reinforce the need for such advanced models to explicitly resolve the non-stomatal processes contributing to the net atmosphere–biosphere exchange of reactive compounds. Above all, intercomparison studies should first be conducted for existing models that can handle oVOC dry deposition processes to quantify the magnitudes of uncertainties in the simulated Vd as well as the associated ambient concentrations and deposition fluxes.
The computer code and data used in this study can be obtained by contacting the corresponding author. The code is also available from https://doi.org/10.5281/zenodo.4697426 (Zhang and Wu, 2021).
The supplement related to this article is available online at: https://doi.org/10.5194/gmd-14-5093-2021-supplement.
ZW conducted model run and data analysis and drafted the paper. LZ designed the project, finalized computer code, drafted part of the paper, and finalized the paper. JTW contributed to paper writing and commented on the paper. PAM generated chemistry data that are used in the Supplement and commented on the paper. JAP contributed to model design and paper writing and commented on the paper. XW contributed to the project design and commented on the paper.
The authors declare that they have no conflict of interest.
The research presented was not performed or funded by the US Environmental Protection Agency and was not subject to the EPA's quality system requirements. The views expressed in this article are those of the authors and do not necessarily represent the views or policies of the US Environmental Protection Agency.
Publisher's note: Copernicus Publications remains neutral with regard to jurisdictional claims in published maps and institutional affiliations.
We thank Tran Nguyen for the field flux data and Glenn Wolfe and Christopher Groff for the tree survey data. We also greatly appreciate helpful comments from Tran Nguyen, Chris Geron, and Donna Schwede. The Southeastern Aerosol Research and Characterization (SEARCH) network was sponsored by the Southern Company and the Electric Power Research Institute. The field data during the SOAS 2013 campaign are available at https://esrl.noaa.gov/csd/groups/csd7/measurements/2013senex/Ground/DataDownload/ (last access: 11 August 2021).
Xuemei Wang was supported by the Chinese National Key Research and Development Plan (grant no. 2017YFC0210100) and the State Key Program of the National Natural Science Foundation of China (grant no. 91644215).
This paper was edited by Jason Williams and reviewed by two anonymous referees.
Ashworth, K., Chung, S. H., Griffin, R. J., Chen, J., Forkel, R., Bryan, A. M., and Steiner, A. L.: FORest Canopy Atmosphere Transfer (FORCAsT) 1.0: a 1-D model of biosphere–atmosphere chemical exchange, Geosci. Model Dev., 8, 3765–3784, https://doi.org/10.5194/gmd-8-3765-2015, 2015.
Bryan, A. M., Bertman, S. B., Carroll, M. A., Dusanter, S., Edwards, G. D., Forkel, R., Griffith, S., Guenther, A. B., Hansen, R. F., Helmig, D., Jobson, B. T., Keutsch, F. N., Lefer, B. L., Pressley, S. N., Shepson, P. B., Stevens, P. S., and Steiner, A. L.: In-canopy gas-phase chemistry during CABINEX 2009: sensitivity of a 1-D canopy model to vertical mixing and isoprene chemistry, Atmos. Chem. Phys., 12, 8829–8849, https://doi.org/10.5194/acp-12-8829-2012, 2012.
Bunkan, A. J. C., Liang, C.-H., Pilling, M. J., and Nielsen, C. J.: Theoretical and experimental study of the OH radical reaction with HCN, MolPh, 111, 1589–1598, 2013.
Cape, J. N., Hamilton, R., and Heal, M. R.: Reactive uptake of ozone at simulated leaf surfaces: implications for “non-stomatal” ozone flux, Atmos. Environ., 43, 1116–1123, 2009.
Clifton, O. E., Fiore, A. M., Munger, J., Malyshev, S., Horowitz, L., Shevliakova, E., Paulot, F., Murray, L., and Griffin, K.: Interannual variability in ozone removal by a temperate deciduous forest, Geophys. Res. Lett., 44, 542–552, 2017.
Farmer, D. K. and Cohen, R. C.: Observations of HNO3, ∑AN, ∑PN and NO2 fluxes: evidence for rapid HOx chemistry within a pine forest canopy, Atmos. Chem. Phys., 8, 3899–3917, https://doi.org/10.5194/acp-8-3899-2008, 2008.
Flechard, C. R., Nemitz, E., Smith, R. I., Fowler, D., Vermeulen, A. T., Bleeker, A., Erisman, J. W., Simpson, D., Zhang, L., Tang, Y. S., and Sutton, M. A.: Dry deposition of reactive nitrogen to European ecosystems: a comparison of inferential models across the NitroEurope network, Atmos. Chem. Phys., 11, 2703–2728, https://doi.org/10.5194/acp-11-2703-2011, 2011.
Foken, T.: Micrometeorology, 2nd, Springer, Berlin, Germany, 2017.
Hall, B. D. and Claiborn, C. S.: Measurements of the dry deposition of peroxides to a Canadian boreal forest, J. Geophys. Res.-Atmos., 102, 29343–29353, 1997.
Högström, U.: Non-dimensional wind and temperature profiles in the atmospheric surface layer: A re-evaluation, Bound.-Lay. Meteorol., 42, 55–78, 1988.
Jarvis, P.: The interpretation of the variations in leaf water potential and stomatal conductance found in canopies in the field, Philos. T. R. Soc. B, 273, 593–610, 1976.
Karl, T., Harley, P., Emmons, L., Thornton, B., Guenther, A., Basu, C., Turnipseed, A., and Jardine, K.: Efficient atmospheric cleansing of oxidized organic trace gases by vegetation, Science, 330, 816–819, 2010.
Kelly, J. M., Doherty, R. M., O'Connor, F. M., Mann, G. W., Coe, H., and Liu, D.: The roles of volatile organic compound deposition and oxidation mechanisms in determining secondary organic aerosol production: a global perspective using the UKCA chemistry–climate model (vn8.4), Geosci. Model Dev., 12, 2539–2569, https://doi.org/10.5194/gmd-12-2539-2019, 2019.
Kumar, A., Chen, F., Niyogi, D., Alfieri, J. G., Ek, M., and Mitchell, K.: Evaluation of a photosynthesis-based canopy resistance formulation in the Noah land-surface model, Bound.-Lay. Meteorol., 138, 263–284, 2011.
Meyers, T., Huebert, B., and Hicks, B.: HNO3 deposition to a deciduous forest, Bound.-Lay. Meteorol., 49, 395–410, 1989.
Min, K.-E., Pusede, S. E., Browne, E. C., LaFranchi, B. W., and Cohen, R. C.: Eddy covariance fluxes and vertical concentration gradient measurements of NO and NO2 over a ponderosa pine ecosystem: observational evidence for within-canopy chemical removal of NOx, Atmos. Chem. Phys., 14, 5495–5512, https://doi.org/10.5194/acp-14-5495-2014, 2014.
Monteith, J. L. and Unsworth, M.: Principles of Environmental Physics, 2nd Edn., Butterworth-Heinemann, London, 1990.
Moussa, S. G., Leithead, A., Li, S.-M., Chan, T. W., Wentzell, J. J., Stroud, C., Zhang, J., Lee, P., Lu, G., and Brook, J. R.: Emissions of hydrogen cyanide from on-road gasoline and diesel vehicles, Atmos. Environ., 131, 185–195, 2016.
Müller, J.-F., Peeters, J., and Stavrakou, T.: Fast photolysis of carbonyl nitrates from isoprene, Atmos. Chem. Phys., 14, 2497–2508, https://doi.org/10.5194/acp-14-2497-2014, 2014.
Müller, J.-F., Stavrakou, T., Bauwens, M., Compernolle, S., and Peeters, J.: Chemistry and deposition in the Model of Atmospheric composition at Global and Regional scales using Inversion Techniques for Trace gas Emissions (MAGRITTE v1.0). Part B. Dry deposition, Geosci. Model Dev. Discuss. [preprint], https://doi.org/10.5194/gmd-2018-317, 2018.
Nguyen, T. B., Crounse, J. D., Teng, A. P., Clair, J. M. S., Paulot, F., Wolfe, G. M., and Wennberg, P. O.: Rapid deposition of oxidized biogenic compounds to a temperate forest, P. Natl. Acad. Sci. USA, 112, E392–E401, 2015.
Nizzetto, L. and Perlinger, J. A.: Climatic, biological, and land cover controls on the exchange of gas-phase semivolatile chemical pollutants between forest canopies and the atmosphere, Environ. Sci. Technol., 46, 2699–2707, 2012.
Paulot, F., Malyshev, S., Nguyen, T., Crounse, J. D., Shevliakova, E., and Horowitz, L. W.: Representing sub-grid scale variations in nitrogen deposition associated with land use in a global Earth system model: implications for present and future nitrogen deposition fluxes over North America, Atmos. Chem. Phys., 18, 17963–17978, https://doi.org/10.5194/acp-18-17963-2018, 2018.
Pleim, J. and Ran, L.: Surface flux modeling for air quality applications, Atmos., 2, 271–302, 2011.
Pye, H. O., Luecken, D. J., Xu, L., Boyd, C. M., Ng, N. L., Baker, K. R., Ayres, B. R., Bash, J. O., Baumann, K., and Carter, W. P.: Modeling the current and future roles of particulate organic nitrates in the southeastern United States, Environ. Sci. Technol., 49, 14195–14203, 2015.
Silva, S. J. and Heald, C. L.: Investigating dry deposition of ozone to vegetation, J. Geophys. Res.-Atmos., 123, 559–573, 2018.
Singh, H., Salas, L., Herlth, D., Kolyer, R., Czech, E., Viezee, W., Li, Q., Jacob, D. J., Blake, D., and Sachse, G.: In situ measurements of HCN and CH3CN over the Pacific Ocean: Sources, sinks, and budgets, J. Geophys. Res.-Atmos., 108, 8795, https://doi.org/10.1029/2002JD003006, 2003.
Stroud, C., Makar, P., Karl, T., Guenther, A., Geron, C., Turnipseed, A., Nemitz, E., Baker, B., Potosnak, M., and Fuentes, J. D.: Role of canopy-scale photochemistry in modifying biogenic-atmosphere exchange of reactive terpene species: Results from the CELTIC field study, J. Geophys. Res.-Atmos., 110, D17303, https://doi.org/10.1029/2005JD005775, 2005.
Turnipseed, A., Huey, L., Nemitz, E., Stickel, R., Higgs, J., Tanner, D., Slusher, D., Sparks, J., Flocke, F., and Guenther, A.: Eddy covariance fluxes of peroxyacetyl nitrates (PANs) and NOy to a coniferous forest, J. Geophys. Res.-Atmos., 111, D09304, https://doi.org/10.1029/2005JD006631, 2006.
Valverde-Canossa, J., Ganzeveld, L., Rappenglück, B., Steinbrecher, R., Klemm, O., Schuster, G., and Moortgat, G.: First measurements of H2O2 and organic peroxides surface fluxes by the relaxed eddy-accumulation technique, Atmos. Environ., 40, 55–67, 2006.
Wesely, M.: Parameterization of surface resistances to gaseous dry deposition in regional-scale numerical models, Atmos. Environ., 23, 1293–1304, 1989.
Wesely, M. and Hicks, B.: Some factors that affect the deposition rates of sulfur dioxide and similar gases on vegetation, JAPCA J. Air Waste Ma., 27, 1110–1116, 1977.
Wesely, M. and Hicks, B.: A review of the current status of knowledge on dry deposition, Atmos. Environ., 34, 2261–2282, 2000.
Wolfe, G. M. and Thornton, J. A.: The Chemistry of Atmosphere-Forest Exchange (CAFE) Model – Part 1: Model description and characterization, Atmos. Chem. Phys., 11, 77–101, https://doi.org/10.5194/acp-11-77-2011, 2011.
Wolfe, G. M., Thornton, J. A., Yatavelli, R. L. N., McKay, M., Goldstein, A. H., LaFranchi, B., Min, K.-E., and Cohen, R. C.: Eddy covariance fluxes of acyl peroxy nitrates (PAN, PPN and MPAN) above a Ponderosa pine forest, Atmos. Chem. Phys., 9, 615–634, https://doi.org/10.5194/acp-9-615-2009, 2009.
Wolfe, G. M., Thornton, J. A., McKay, M., and Goldstein, A. H.: Forest-atmosphere exchange of ozone: sensitivity to very reactive biogenic VOC emissions and implications for in-canopy photochemistry, Atmos. Chem. Phys., 11, 7875–7891, https://doi.org/10.5194/acp-11-7875-2011, 2011.
Wright, L. P., Zhang, L., Cheng, I., Aherne, J., and Wentworth, G. R.: Impacts and Effects Indicators of Atmospheric Deposition of Major Pollutants to Various Ecosystems – A Review, Aerosol Air Qual. Res., 18, 1953–1992, 2018.
Wu, Z. Y., Wang, X. M., Chen, F., Turnipseed, A. A., Guenther, A. B., Niyogi, D., Charusombat, U., Xia, B. C., Munger, J. W., and Alapaty, K.: Evaluating the calculated dry deposition velocities of reactive nitrogen oxides and ozone from two community models over a temperate deciduous forest, Atmos. Environ., 45, 2663–2674, 2011.
Wu, Z. Y., Wang, X. M., Turnipseed, A. A., Chen, F., Zhang, L. M., Guenther, A. B., Karl, T., Huey, L. G., Niyogi, D., Xia, B. C., and Alapaty, K.: Evaluation and improvements of two community models in simulating dry deposition velocities for peroxyacetyl nitrate (PAN) over a coniferous forest, J. Geophys. Res.-Atmos., 117, D04310, https://doi.org/10.1029/2011JD016751, 2012.
Wu, Z. Y., Zhang, L., Wang, X. M., and Munger, J. W.: A modified micrometeorological gradient method for estimating O3 dry depositions over a forest canopy, Atmos. Chem. Phys., 15, 7487–7496, https://doi.org/10.5194/acp-15-7487-2015, 2015.
Wu, Z. Y., Schwede, D. B., Vet, R., Walker, J. T., Shaw, M., Staebler, R., and Zhang, L.: Evaluation and intercomparison of five North American dry deposition algorithms at a mixed forest site, J. Adv. Model. Earth Sy., 10, 1571–1586, 2018.
Xie, Y., Paulot, F., Carter, W. P. L., Nolte, C. G., Luecken, D. J., Hutzell, W. T., Wennberg, P. O., Cohen, R. C., and Pinder, R. W.: Understanding the impact of recent advances in isoprene photooxidation on simulations of regional air quality, Atmos. Chem. Phys., 13, 8439–8455, https://doi.org/10.5194/acp-13-8439-2013, 2013.
Zhang, L. and Wu, Z.: A computer code for calculating dry deposition velocities for 45 gaseous species, Zenodo [code], https://doi.org/10.5281/zenodo.4697426, 2021.
Zhang, L., Moran, M. D., Makar, P. A., Brook, J. R., and Gong, S.: Modelling gaseous dry deposition in AURAMS: a unified regional air-quality modelling system, Atmos. Environ., 36, 537–560, 2002.
Zhang, L., Brook, J. R., and Vet, R.: A revised parameterization for gaseous dry deposition in air-quality models, Atmos. Chem. Phys., 3, 2067–2082, https://doi.org/10.5194/acp-3-2067-2003, 2003.
Zhou, P., Ganzeveld, L., Taipale, D., Rannik, Ü., Rantala, P., Rissanen, M. P., Chen, D., and Boy, M.: Boreal forest BVOC exchange: emissions versus in-canopy sinks, Atmos. Chem. Phys., 17, 14309–14332, https://doi.org/10.5194/acp-17-14309-2017, 2017.