the Creative Commons Attribution 4.0 License.
the Creative Commons Attribution 4.0 License.
 | 01 Jul 2021
Vertical structure of cloud radiative heating in the tropics: confronting the EC-Earth v3.3.1/3P model with satellite observations
Abhay Devasthale
Michael Tjernström
Annica M. L. Ekman
Klaus Wyser
Tristan L'Ecuyer
Understanding the coupling of clouds to large-scale circulation is one of the grand challenges for the global climate research community. In this context, realistically modelling the vertical structure of cloud radiative heating (CRH) and/or cooling in Earth system models is a key premise to understand this coupling. Here, we evaluate CRH in two versions of the European Community Earth System Model (EC-Earth) using retrievals derived from the combined radar and lidar data from the CloudSat and Cloud-Aerosol Lidar and Infrared Pathfinder Satellite Observation (CALIPSO) satellites. One model version is also used with two different horizontal resolutions. Our study evaluates large-scale intraseasonal variability in the vertical structure of CRH and cloud properties and investigates the changes in CRH during different phases of the El Niño–Southern Oscillation (ENSO), a process that dominates the interannual climate variability in the tropics.
EC-Earth generally captures both the intraseasonal and meridional pattern of variability in CRH over the convectively active and stratocumulus regions and the CRH during the positive and negative phases of ENSO. However, two key differences between model simulations and satellite retrievals emerge. First, the magnitude of CRH, in the upper troposphere, over the convectively active zones is up to twice as large in the models compared to the satellite data. Further dissection of net CRH into its shortwave and longwave components reveals noticeable differences in their vertical structure. The shortwave component of the radiative heating is overestimated by all model versions in the lowermost troposphere and underestimated in the middle troposphere. These over- and underestimates of shortwave heating are partly compensated by an overestimate of longwave cooling in the lowermost troposphere and heating in the middle troposphere. The biases in CRH can be traced back to disagreement in cloud amount and cloud water content. There is no noticeable improvement of CRH by increasing the horizontal resolution in the model alone. Our findings highlight the importance of evaluating models with satellite observations that resolve the vertical structure of clouds and cloud properties.
- Article
(3490 KB) - Full-text XML
- BibTeX
- EndNote


About 70 % of Earth is on average covered by clouds (King et al., 2013; Stubenrauch et al., 2013; Karlsson and Devasthale, 2018). Clouds are, however, unevenly distributed in time and space, particularly in the tropics. Regions with marine stratocumulus clouds or with persistent convection, such as the Intertropical Convergence Zone, can reach up to 90 % cloud cover, while over deserts and parts of the open ocean, cloud cover can be as low as 20 % when averaged over time.
In addition to playing an essential role in the hydrological cycle, clouds are crucial in regulating Earth's radiative balance (Stephens, 2005). By reflecting incoming solar (shortwave) radiation, they increase the planetary albedo, contributing to the cooling of Earth. At the same time, clouds absorb thermal (longwave) radiation and re-emit energy to space from cloud tops at a lower temperature than the surface, contributing to the warming of Earth. The absorption and emission of longwave radiation of clouds, and also of different atmospheric gases, are usually referred to as the greenhouse effect. The net result of radiation interaction with clouds varies strongly with time, location and cloud type.
The distribution of heating from clouds in space and time is an essential driver of circulation in the ocean and the atmosphere (e.g. Slingo and Slingo, 1988; Randall et al., 1989; Sherwood et al., 1994). Meridional differences in cloud radiative forcing, where tropical clouds have a stronger positive forcing compared to midlatitude clouds, enhance meridional temperature gradient and therefore impact the Hadley circulation (Sherwood et al., 1994; Raymond, 2000). Similarly, zonal differences in the tropics between convective and non-convective zones impact the zonal overturning eddies, such as the Walker circulation (Sherwood et al., 1994). In the tropics, the cloud radiative heating (CRH) can influence troposphere-to-stratosphere transport (Corti et al., 2006; Johansson et al., 2019). On a smaller scale, radiative heating can alter temperature profiles inside clouds, hence creating buoyancy-driven turbulence within the cloud (Ackerman et al., 1988; Wood, 2012).
El Niño–Southern Oscillation, or ENSO, is the major source of interannual climate variability in the tropics. This variability is due to variations in the strength of the easterly trade winds, known as the Walker circulation, that modify the sea surface temperature (SST) pattern across the Pacific, leading to a zone of strong convection over the western Pacific. At the same time, marine stratocumulus clouds will prevail over the eastern Pacific. During an El Niño, trade winds weaken, or even reverse, with a significant effect on the cloud distribution over the Pacific. Furthermore, the effects of ENSO have been shown to spread far beyond the Pacific Ocean (Madenach et al., 2019, and references within). The opposite, when the trade winds are enhanced, is usually referred to as La Niña.
Clouds and radiation are described differently in different climate models. However, they all have in common that they need some sort of parameterisation to resolve the subgrid structure of clouds. Inadequacies in how this is done increase uncertainty of the modelled climate. Exarchou et al. (2017) found that unrealistically low cloud cover in the European Community Earth System Model (EC-Earth) creates a warm SST bias over the tropical Atlantic. The same study also found that an increase in horizontal resolution did not reduce this SST bias. On the other hand, Hourdin et al. (2013) found that an increase in horizontal resolution in the IPSL-CM5A coupled model led to an improved cloud cover. This ambiguousness can also be found in Prodhomme et al. (2016), who found that an increased horizontal resolution in an earlier version of EC-Earth improved the representation of the Indian monsoon, while there was no improvement for the African monsoon.
The importance of realistic observation data for model development, evaluation and tuning has been pointed out in several studies (McFarlane et al., 2007; Mauritsen et al., 2012; Bojinski et al., 2014). Traditionally, observation datasets have either had poor spatial coverage, for example, data from field campaigns, or no or insufficient vertical information, such as data from many passive satellite sensors. Therefore, the evaluation of radiation in models usually focuses on the top of the atmosphere (TOA) (Thomas et al., 2019). This lack of vertical observations is dramatically improved with the deployment of CloudSat and CALIPSO (Cloud-Aerosol Lidar and Infrared Pathfinder Satellite Observation) satellites. The cloud radar aboard CloudSat can provide detailed information on the vertical structure of clouds, while CALIPSO detects even subvisual cirrus clouds. The data from CloudSat and CALIPSO have proven useful for evaluating climate models (e.g. Jiang et al., 2012; Li et al., 2013; Su et al., 2013; Zelinka et al., 2018; Voigt et al., 2019). Cesana et al. (2019) used the data from CloudSat and CALIPSO to investigate the vertical heating rates from a multimodel experiment. They found that the misrepresentation of clouds in the models was the leading cause of differences in vertical heating rates between the observations and models. Studies like this underline the importance of carrying out process-oriented model evaluations.
In this study, we aim to compare the vertical structure of clouds and CRH in the tropics from the global climate model (EC-Earth) with a combined dataset from the CloudSat and CALIPSO satellites sensors. We carry out both the statistical and process-oriented evaluations of the EC-Earth versions. The study will focus on evaluating variability in the vertical structure of CRH across both seasons and ENSO events. Two different versions of EC-Earth are used, and for one of these, we also employ two different horizontal resolutions: the default resolution and one higher to explore how resolution affects the CRH.
2.1 Model
The atmospheric model of EC-Earth v3 is based on the Integrated Forecasting System cycle 36r4 (IFS CY36r4) from the European Centre for Medium-Range Weather Forecasts (ECMWF). EC-Earth v3 is a continuation of EC-Earth v2.3 used in CMIP5 (Hazeleger et al., 2012, 2013). Compared to v2.3, EC-Earth v3 has an updated microphysics scheme to, among other things, better represent mixed-phase clouds (Forbes et al., 2011). There is also a new convection scheme that increases the intraseasonal variability, leading to more intense convection over the continents (Bechtold et al., 2008) and a better representation of the daily convective cycle (Bechtold et al., 2013). Together with a new McRad radiation scheme, the convection scheme also allows for a more detailed representation of the interaction between radiation and subgrid clouds (Morcrette et al., 2008).
We use two different versions of EC-Earth v3; the first was used in the PRocess-based climate sIMulation: AdVances in high-resolution modeling and European climate Risk Assessment (PRIMAVERA) project, while the second, v3.3.1, was used for phase 6 of the Coupled Model Intercomparison Project (CMIP6). The later version (v3.3.1) uses a new surface/vegetation albedo scheme and an improved description of the indirect aerosol effect compared to the PRIMAVERA version.
For the PRIMAVERA version of EC-Earth, we use two different horizontal resolutions: T511L91 and T255L91. T511L91 is a high-resolution version, with a horizontal resolution of 0.35∘, i.e. ∼40 km at the Equator, while the T255L91 is the standard resolution with a horizontal resolution of 0.70∘, i.e. ∼80 km at the Equator. Both the standard- and high-resolution versions use the tuning from the standard resolution, following the protocol of the intercomparison project (HighResMIP). EC-Earth v3.3.1 is only used with the standard resolution (T255L91). All versions use 91 vertical levels. The vertical levels are not equally distributed throughout the atmosphere. Instead, the resolution is highest in the lower part of the atmosphere and decreases as the altitude increases. However, to fit with the vertical resolution of the satellite observations, the output is interpolated by the model to a constant 480 m vertical resolution. Since one focus of this study is on the horizontal resolution, the time step for all model versions is set to 900 s, i.e. the time step usually used for T511L91. The model output is every third hour. The model simulations are performed as atmosphere only, i.e. with prescribed SSTs. The simulations with the PRIMAVERA versions use daily SSTs interpolated to the different resolutions, while v3.3.1 uses monthly SSTs. For brevity the high-resolution PRIMAVERA version is henceforth called EC-Earth3P-HR, the standard-resolution PRIMAVERA is called EC-Earth3P, and v3.3.1 used for CMIP6 is referred to as EC-Earth3.
2.2 Satellite observations
The satellite observations used in the study combine observations mainly from CloudSat and CALIPSO. CloudSat carries a 94 GHz cloud profiling radar (CPR) (Stephens et al., 2008) and CALIPSO carries the Cloud-Aerosol Lidar with Orthogonal Polarization (CALIOP) measuring at 532 and 1064 nm (Winker et al., 2009). They were both deployed in 2006 as part of the A-Train constellation (Stephens et al., 2002; L'Ecuyer and Jiang, 2010), where all satellites travel along the same path within just seconds to minutes. This setup allows for a dataset where measurements from instruments aboard different satellites easily can be combined. The 2B-FLXHR-LIDAR product (L'Ecuyer et al., 2008; Henderson et al., 2013) provides calculated radiative properties, the 2B-CLDCLASS-LIDAR product (Sassen et al., 2008) provides the vertical cloud mask, and 2B-CWC-RVOD (Austin et al., 2009) provides the cloud ice and liquid water content (IWC and LWC). These datasets have been used extensively for cloud studies in the tropics (e.g. Johansson et al., 2015, 2019; Matus and L'Ecuyer, 2017; Hartmann and Berry, 2017; L'Ecuyer et al., 2019; Hang et al., 2019).
The 2B-FLXHR-LIDAR product uses a two-stream radiative transfer model with 12 longwave bands and six shortwave bands. The state variables needed, e.g. temperature and specific humidity profiles, are obtained for each CloudSat profile from ECMWF reanalysis data, available from the ECMWF-AUX dataset. Various CloudSat and CALIPSO products provide cloud and aerosol properties. CloudSat cannot provide direct information on the phase of the cloud hydrometeors. Instead, this retrieval relies on temperature profiles from the ECMWF-AUX dataset together with data from the MODIS instrument aboard Aqua, which introduces a large uncertainty in the IWC data (Devasthale and Thomas, 2012).
2.3 Method
To evaluate the vertical structure of clouds in the EC-Earth model, and the corresponding CRH, we use data from 4 years of CloudSat and CALIPSO data: January 2007 to December 2010. The model simulations start in 2005, and all model versions were run for 6 years until 2010; 2005 and 2006 are considered as spin-up time and are excluded from the analysis. Furthermore, December 2009 is also excluded due to a lack of satellite data for this month. The 4 years are not enough to investigate interannual variability but should be sufficient for carrying out a statistical evaluation considering the Atmospheric Model Intercomparison Project (AMIP)-type simulations. We focus on the tropical region (30∘ S and 30∘ N) and evaluate the four seasons, December–February, March–May, June–August and September–November, separately.
Note that the satellite simulator for evaluating heating rates in EC-Earth is currently not available. CloudSat and CALIPSO pass the Equator at roughly 13:30 local time (LT) during daytime, so we linearly interpolated the model results from the two nearest 3-hourly outputs to fit the satellite overpass time. The time-interpolated data are then used to calculate the seasonal means for all comparisons shown later. This time interpolation together with the ability of the active satellite instruments to detect thin clouds reduces the need for satellite simulators otherwise commonly used for passive instruments (see, e.g. Pincus et al., 2012). However, when using data from early afternoon (∼ 13:30 LT), when the incoming shortwave radiation is close to its peak, the contribution of shortwave radiation to the total heating is emphasised.
The satellite data are projected on a 1∘ by 1∘ longitude–latitude grid while retaining the native 240 m vertical resolution. Due to ground clutter contamination in the CloudSat data, the lowest 750 m are not shown in the comparison. When the differences between the different data and model outputs are calculated, the dataset with higher resolution is averaged to the lower resolution. For both the satellite retrievals and the model output, the CRH is calculated by subtracting the shortwave and longwave clear-sky values from the cloudy sky values (in models typically referred to as “all-sky”) (Johansson et al., 2015).
where SWHR is the shortwave heating rate and LWHR is the longwave heating rate. A two-sided Student t test is used on the monthly mean values and the 95 % confidence interval is highlighted with black dots in the figures. We also did a Mann–Whitney rank test with similar results to the Student t test, and these results are therefore not shown. Even so, the small sample size, especially for the ENSO study, will limit the interpretation of the statistical test.
The cloud water content in EC-Earth is given in kg kg−1, while the satellite dataset provides the water content in g m−3. We therefore need to recalculate the water content from the model by multiplying with density:
where WC is the cloud water content (either ice or liquid) and ρ is the density. ρ is calculated from the ideal gas law (Holton and Hakim, 2012, chap. 2.9):
and
where p is the pressure, Tv is the virtual temperature, T is the temperature, qv is the specific humidity, and Rd and Rv are the gas constant for dry air and water vapour. We use the constants 287.04 and 461 J kg−1 K−1 for Rd and Rv, respectively, while the model is providing the other variables for each vertical level.
The phase of the ENSO is obtained from the National Oceanic and Atmospheric Administration (NOAA; see https://origin.cpc.ncep.noaa.gov/products/analysis_monitoring/ensostuff/ONI_v5.php, last access: July 2020). The ENSO index is based on SST anomalies over the Niño3.4 region (5∘ N–5∘ S, 120–170∘ W). The phases are based on a threshold of +0.5 ∘C (−0.5 ∘C) for positive (negative) ENSO relative to a 30-year period. The two phases are henceforth referred to as ENSOP (positive) and ENSON (negative). The months with positive ENSO (10 months) are averaged for the ENSOP analysis and similarly for the month with ENSON (22 months). The mean value for all months during the 4 years is then subtracted from the ENSOP and ENSON to create anomalies. Since the impact of ENSO is largest close to the Equator, we only use model and satellite data between 15∘ S and 15∘ N for this analysis.
The results are organised as follows. In Sect. 3.1, we provide a statistical comparison of CRH between the observations and EC-Earth, and in Sect. 3.2, the process-oriented comparison is presented where we focus on cloud variability associated with ENSO.
3.1 Seasonal vertical cloud radiative heating
3.1.1 Meridional average
In this section, we investigate the seasonal vertical CRH in the tropics. Figures 1–4 all show average values, or average differences, over ±30∘ latitude divided into the four seasons. Figure 1 shows the vertical structure of CRH derived from the satellite observations. During all seasons, clouds have a net heating effect in the upper troposphere. Close to the Equator, the Intertropical Convergence Zone constitutes the rising branch of the Hadley cell. This zone has a prevalent cloud cover with small seasonal variations within the ±30∘ latitude band and will therefore contribute to CRH throughout the year. Over the warm tropical waters, large convective systems exist and these clouds will generate strong CRH. This CRH is especially pronounced at higher altitudes during seasons when the convection is most active. The highest ocean surface temperatures are found in the western Pacific and eastern Indian Ocean (sometimes referred to as the tropical warm pool; 70–160∘) and the convective cloud systems here contribute to the radiative heating (1.5 K d−1) with a small seasonal cycle. In DJF and MAM, during the rainy period over south-central Africa (340–45∘), there is strong CRH (1.5 and 1 K d−1, respectively) compared to 0.5 K d−1 during the dry season (JJA). The signature of the South Asian monsoon (∼90∘) is also visible in the CRH (1.5 K d−1) during JJA and SON (also see Johansson et al., 2015). During the SON months, the intense but local CRH (1.5 K d−1) over South and Central America (280–315∘) also stands out.
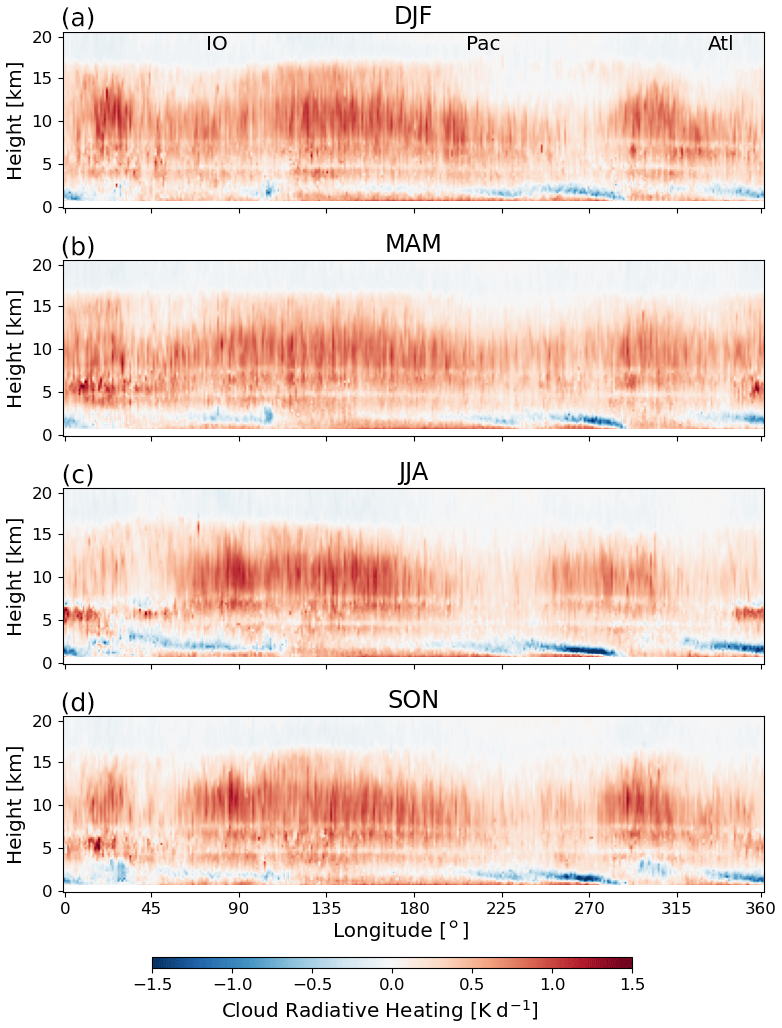
Figure 1The vertical structure of cloud radiative heating based on the 2B-FLXHR-LIDAR dataset (CloudSat/CALIPSO) averaged between latitude ±30∘. IO indicates the Indian Ocean, Pac indicates the Pacific Ocean, and Atl indicates the Atlantic Ocean. The longitude bins are spaced at 1∘. (a) December–February (DJF), (b) March–May (MAM), (c) June–August (JJA) and (d) September–November (SON).
West of the continents, cold upwelling water creates vast areas with marine stratocumulus clouds that are present on average 60 % of the time. These clouds generate the sloping wedges of low-level radiative cooling seen in the lower troposphere, mostly below 2 km, with maxima sloping down towards the west coast of the continents at low altitude. Marine stratocumuli located in the Southern Hemisphere have a seasonal cycle with peaks in cloud fraction in August–October (Wood, 2012), leading to intense cooling (−1.5 to −2 K d−1) in JJA and SON close to South America and Africa (see Fig. 1c–d).
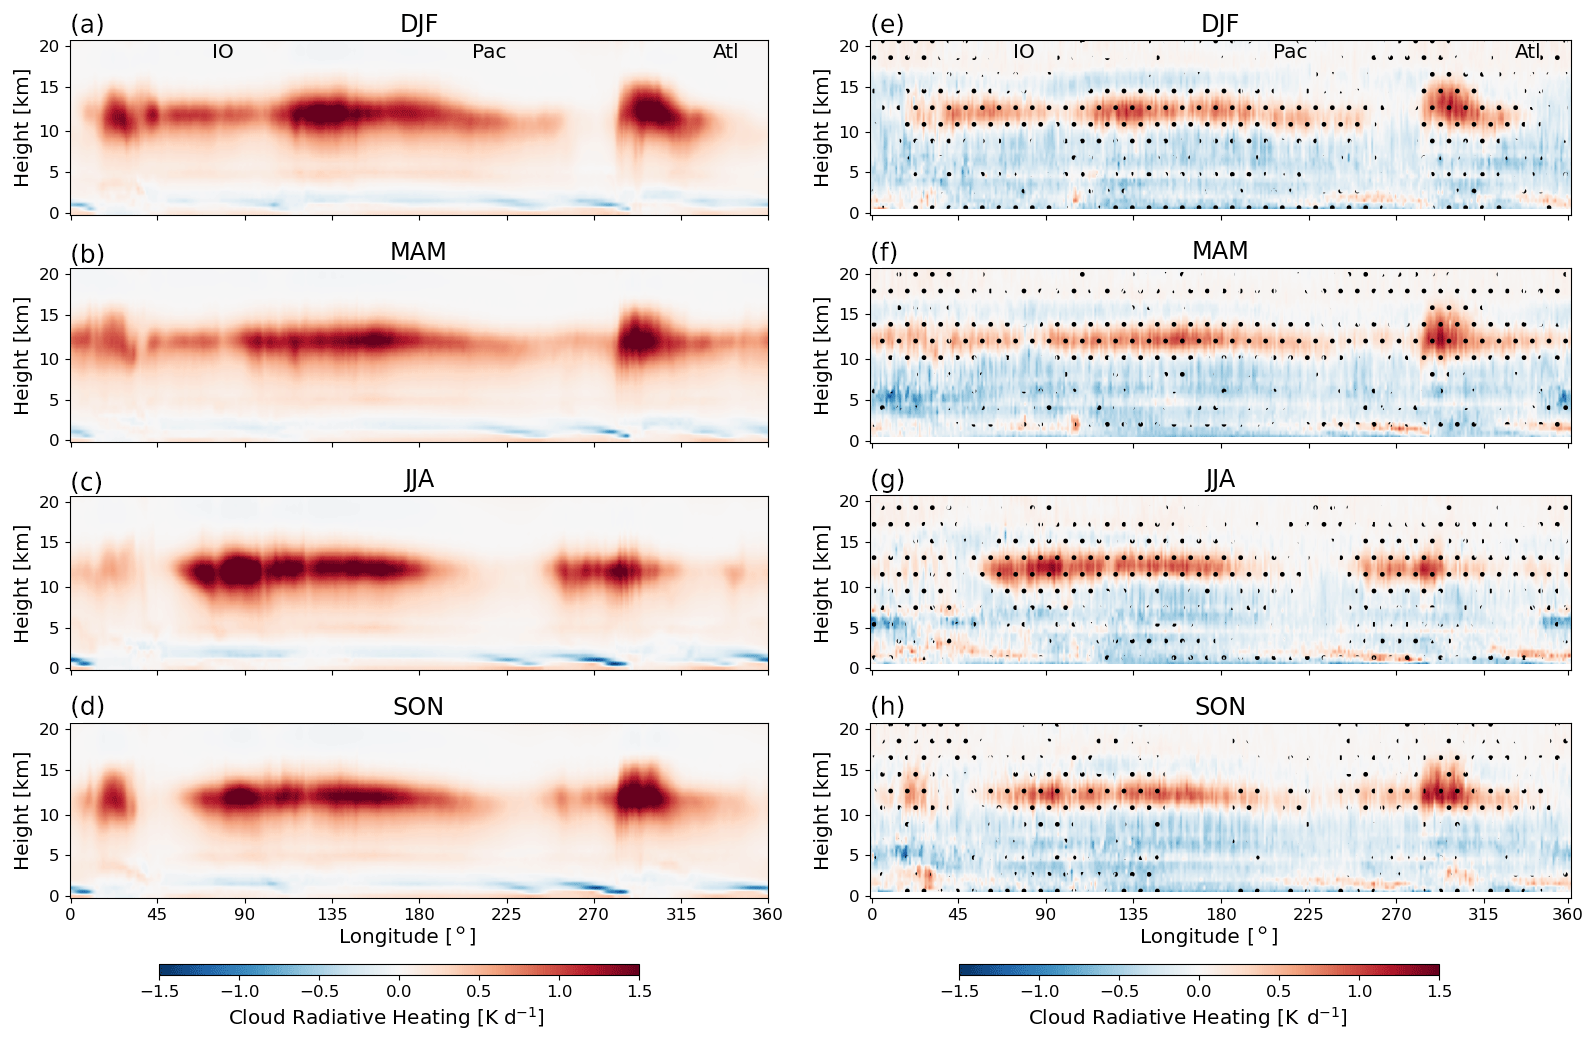
Figure 2As in Fig. 1 but showing (a–d) the vertical structure of cloud radiative heating from the high-resolution EC-Earth (EC-Earth3P-HR) and (e–h) the difference in cloud radiative heating, between CloudSat/CALIPSO observations (Fig. 1) and EC-Earth3P-HR (EC-Earth3P-HR minus CloudSat/CALIPSO). Statistically significant differences, at the 95 % confidence using a Student t test based on monthly mean values, are marked with black dots (e–h).
We now explore if the high-resolution version of EC-Earth can simulate the large-scale CRH features retrieved from satellite data. Similar to Fig. 1, Fig. 2a–d show the CRH as it is simulated in EC-Earth3P-HR, while Fig. 2e–h show the differences between the simulation and the satellite observations.
EC-Earth3P-HR captures the pattern of both meridional and seasonal variability in CRH, visible in the satellite-retrieved data. For example, the pronounced CRH rates over the warm pool region, over South and Central America during the SON months, and the Asian monsoon in JJA, are present in the EC-Earth3P-HR results. In the lower troposphere, the net cooling at the top of the marine stratocumuli, more pronounced in JJA and SON, is also captured by the model.
There are, however, noticeable differences between the satellite retrievals and the model simulations. First, within most parts between 10 and 15 km, the magnitude of the CRH is much stronger in EC-Earth3P-HR, almost twice as high as in the satellite observations. The seasonally averaged CRH from the model-simulated convection sometimes reaches above 2 K d−1, while in the satellite data, it typically stays around 1 K d−1. This overestimate by the model occurs over all convectively active regions, and the CRH is also overestimated in the stratocumulus regions, where the modelled cooling is too weak. The second striking disagreement between the model and observations relates to the vertical structure. The modelled CRH is vertically located in the upper troposphere, predominantly 12–14 km, where convective outflow and detrainment typically occur. In the middle troposphere, the CRH from the model simulations is weaker than in the observations. It should be noted that this disagreement is visible even though the satellite observations are matched to the interpolated CRH values from the nearest 3-hourly time steps in the model simulations.
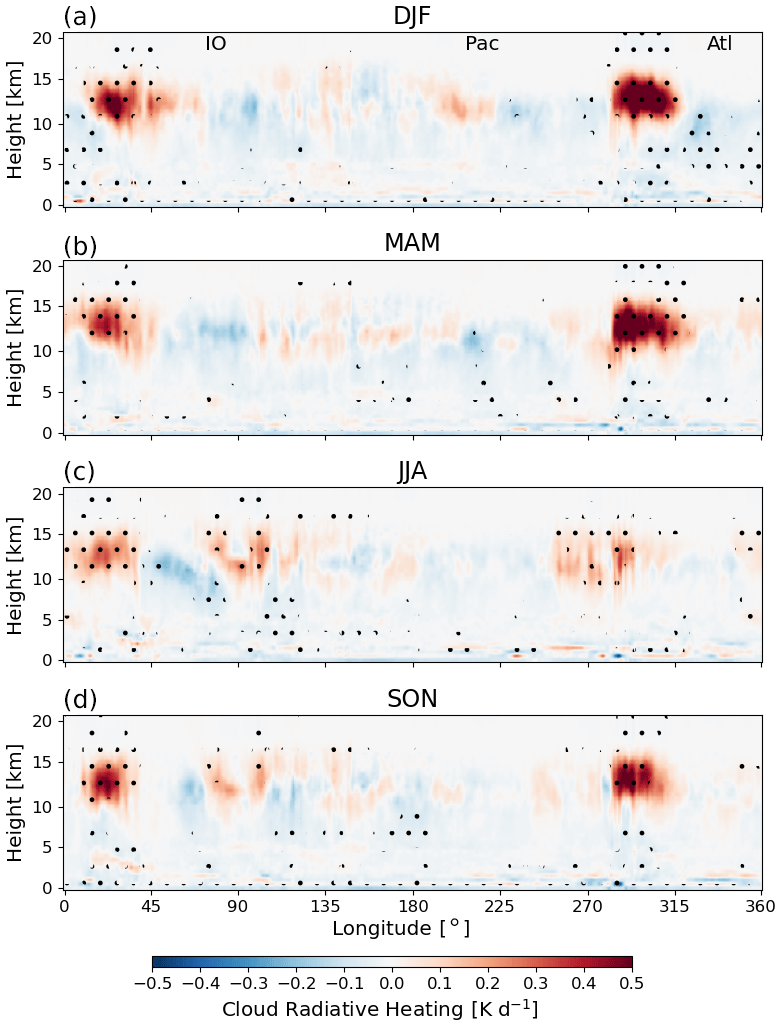
Figure 3Cloud radiative heating difference between the PRIMAVERA version of EC-Earth with high and standard resolutions (EC-Earth3P-HR minus EC-Earth3P). The differences where a Student t test has a 95 % confidence based on monthly mean values are marked with black dots.
Figure 3 address the question of whether the high-resolution version of EC-Earth offers any improvement when compared to its standard counterpart, showing the difference in CRH between EC-Earth3P-HR and EC-Earth3P. Over the American and the African continents, there are considerable differences for the simulations with a lower resolution. When the convection is strong, (Hart et al., 2019) the CRH in EC-Earth3P-HR is 0.5 K d−1 higher compared to EC-Earth3P. During the dry period (JJA), the differences are reduced but still reach up to 0.3 K d−1. Similarly, when the Indian monsoon is at its peak, during JJA, the CRH is larger in EC-Earth3P-HR than in EC-Earth3P. Even though the convection over the western Pacific and the eastern Indian Ocean is persistently active, there are only small differences between the two model versions over this area.
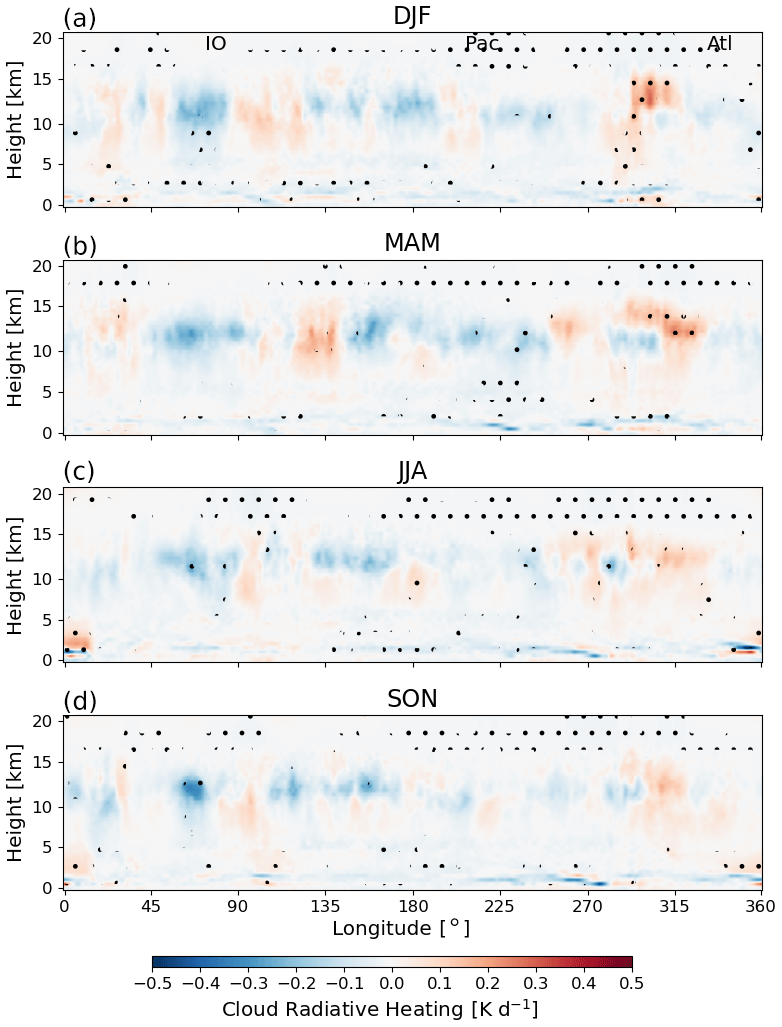
Figure 4Cloud radiative heating difference between EC-Earth model version 3.3.1 and the PRIMAVERA standard resolution (EC-Earth3 minus EC-Earth3P). The differences where a Student t test has a 95 % confidence based on monthly mean values are marked with black dots.
The difference in CRH between EC-Earth3 and EC-Earth3P is shown in Fig. 4. EC-Earth3 has a slightly higher CRH over the American continent for all seasons (0.3–0.4 K d−1) and for the western Pacific Ocean in MAM (0.2 K d−1). On the other hand, EC-Earth3P has slightly higher CRH over the Indian Ocean, especially during SON. The maritime stratocumulus regions have slightly higher CRH in EC-Earth3P than in EC-Earth3. The differences are in general small, with low significance, but both EC-Earth3 and EC-Earth3P are closer to the satellite observations than EC-Earth3P-HR, despite the higher horizontal resolution in the latter. It is important to remember that the high-resolution version of PRIMAVERA uses the same tuning as the standard resolution, which may affect its performance.
3.1.2 Evaluation of the individual shortwave and longwave components of the total CRH
We further explore the vertical structure of CRH, while focusing on the individual shortwave and longwave heating components (Figs. 5 and 6). Figure 5 shows the meridional and vertical structure of the shortwave and longwave components, while Fig. 6 shows the same when averaged over the entire tropics zonally and meridionally. Both figures show the annual averages.
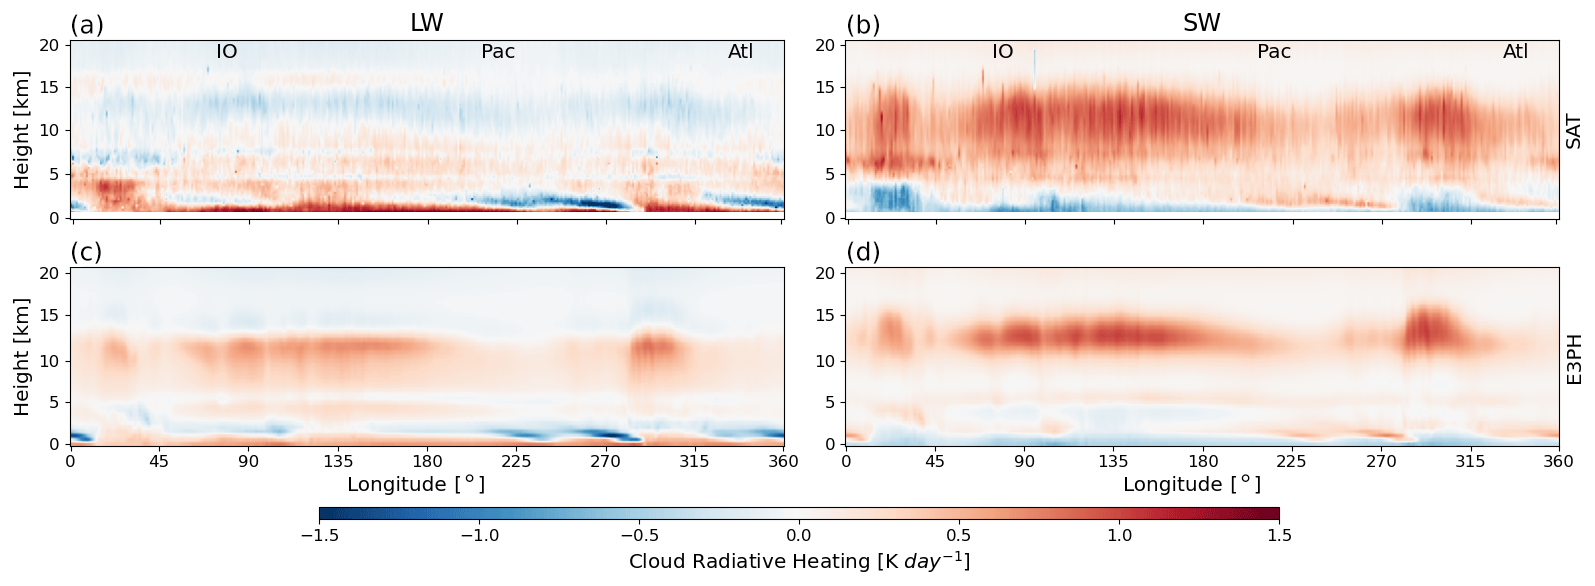
Figure 5Longwave (LW) and shortwave (SW) cloud radiation heating averaged over all seasons for CloudSat/CALIPSO observations (SAT; a, b) and high-resolution PRIMAVERA (E3PH; c, d).
Examining the vertical structure of the shortwave and longwave components of CRH reveals clear differences. In the lower troposphere (up to about 2 km), in the areas dominated by the stratocumulus and stratus clouds over the oceans, all model versions underestimate shortwave cooling at the cloud tops as well as in-cloud radiative heating (0.2 K d−1 difference). The shortwave heating is also strongly underestimated in the middle and upper troposphere (up to 12 km) by K d−1. Above 12 km, the differences are negligible. These shortwave over- and underestimates are to some extent compensated in the longwave spectrum by overestimated cooling in the lowermost troposphere and heating in the middle-to-upper troposphere. The resulting net CRH shows stronger heating for the satellite ∼0.4 K d−1) between 2 and 10 km compared to the models (∼0.2 K d−1), while the net CRH in the upper troposphere (between 10–14 km) is higher in the models (1 K d−1) compared to the observations (0.5 K d−1). This large difference in the upper troposphere is mainly due to the strong overestimate of longwave heating by the models.
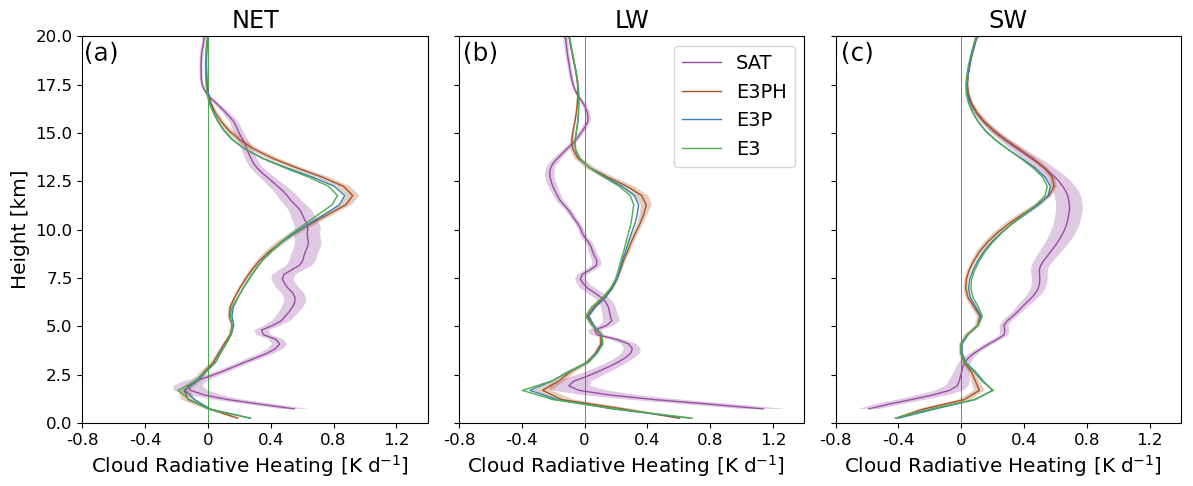
Figure 6Vertical cloud radiative heating for EC-Earth3P-HR (E3PH), EC-Earth3P (E3P), EC-Earth3 (E3) and CloudSat/CALIPSO observations (SAT) averaged over the entire tropics for each height bin. (a) Net (SW + LW; NET) heating, (b) longwave (LW) heating and (c) shortwave (SW) heating, for all seasons. Shaded areas show ±1σ spread for CloudSat/CALIPSO and EC-Earth3P-HR based on monthly mean values.
3.1.3 Potential reasons behind the observed biases
In order to understand possible reasons behind the observed biases, we investigated the vertical structure of clouds in both the models and observations. Note that the model means are based on 3-hourly data that are interpolated and matched in time with the local satellite overpass times (as mentioned in Sect. 2.3). Therefore, the differences arising from matching clouds at the different points of time in the diurnal cycles are expected to be low. We investigated the vertical structure of cloud fraction as well as cloud liquid water and ice content.
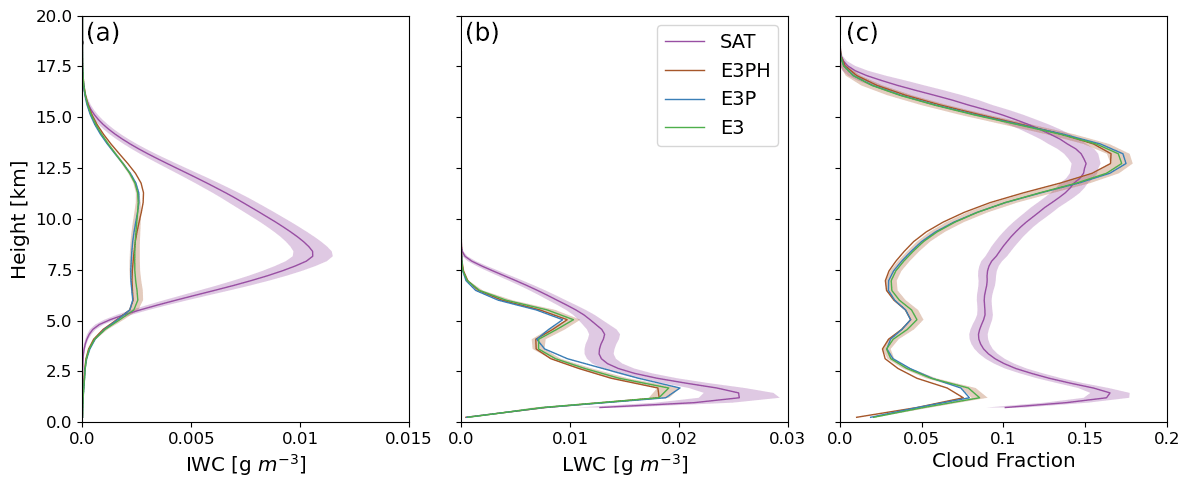
Figure 7Cloud water content and cloud fraction in EC-Earth3P-HR (E3PH), EC-Earth3P (E3P), EC-Earth3 (E3) and the CloudSat/CALIPSO observations (SAT) averaged over the entire tropics for each height bin. (a) Ice water content (IWC), (b) liquid water content and (c) cloud fraction (CF), for all seasons. Shaded areas show ±1σ spread for CloudSat/CALIPSO and EC-Earth3P-HR based on monthly mean values.
Figure 7 shows that the models underestimate the cloud fraction as well as cloud liquid and ice water content in the lower and middle parts of the troposphere. This underestimate results in suppressed shortwave heating and longwave cooling in the middle troposphere in the models, thus, at least partly, explaining the biases observed in Fig. 6. It is interesting to note that even though the difference in cloudiness is substantial in the middle part of the troposphere between the models (0.05) compared to satellite (0.1), the difference in liquid water content is smaller which implies that the models have fewer but denser clouds compared to observations. An explanation for the models underestimating liquid and ice water content is that the models do not include the contribution from rain and snow. The underestimation of cloudiness in the lower part of the atmosphere by the models could cause more longwave radiation reaching the middle/high atmosphere, leading to more longwave absorption and heating compared to the satellite observations around 10 km (Fig. 6b). In the upper troposphere, although the models do have similar cloudiness as in the observations, the ice water content is much lower in the models (peaks at 0.002 g m−3) compared to observations (0.011 g m−3). This leads to a significant underestimate of cloud-top longwave cooling in the models in the upper troposphere (Fig. 6). The underestimate of cloudiness seen in EC-Earth and the corresponding underestimate of shortwave heating are in line with the results reported from previous studies with different climate models or satellite data (e.g. Wang and Su, 2013; Cesana et al., 2019). In spite of better representation of subgrid scale SST variability and surface properties, the biases are enhanced in the high-resolution version of the EC-EARTH model. This may be due to the fact that, following the HighResMIP protocol, both the standard and high-resolution versions employ the same tuning parameters which likely results in an enhanced hydrological cycle in the high-resolution version of the model.
3.2 Cloud radiative heating in response to ENSO phase
3.2.1 Meridional average
Here, the CRH response to the positive and negative phases of ENSO (ENSOP and ENSON) is investigated. The CRH anomalies relative to the mean of the investigated period are averaged between latitude ±15∘ and are displayed in Figs. 8 and 9. For the ENSO analysis, we will only focus on EC-Earth3, i.e. the version used for CMIP6, as the differences between the model versions are relatively small.
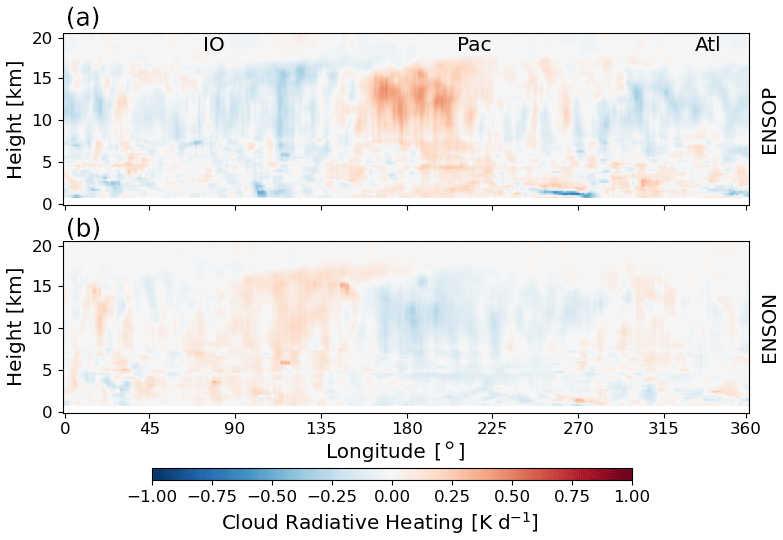
Figure 8Cloud radiative heating from CloudSat/CALIPSO during the positive (a) and negative (b) phases of ENSO compared to the average between latitude ±15∘. There is a simple moving average filter applied to the plots to reduce noise.
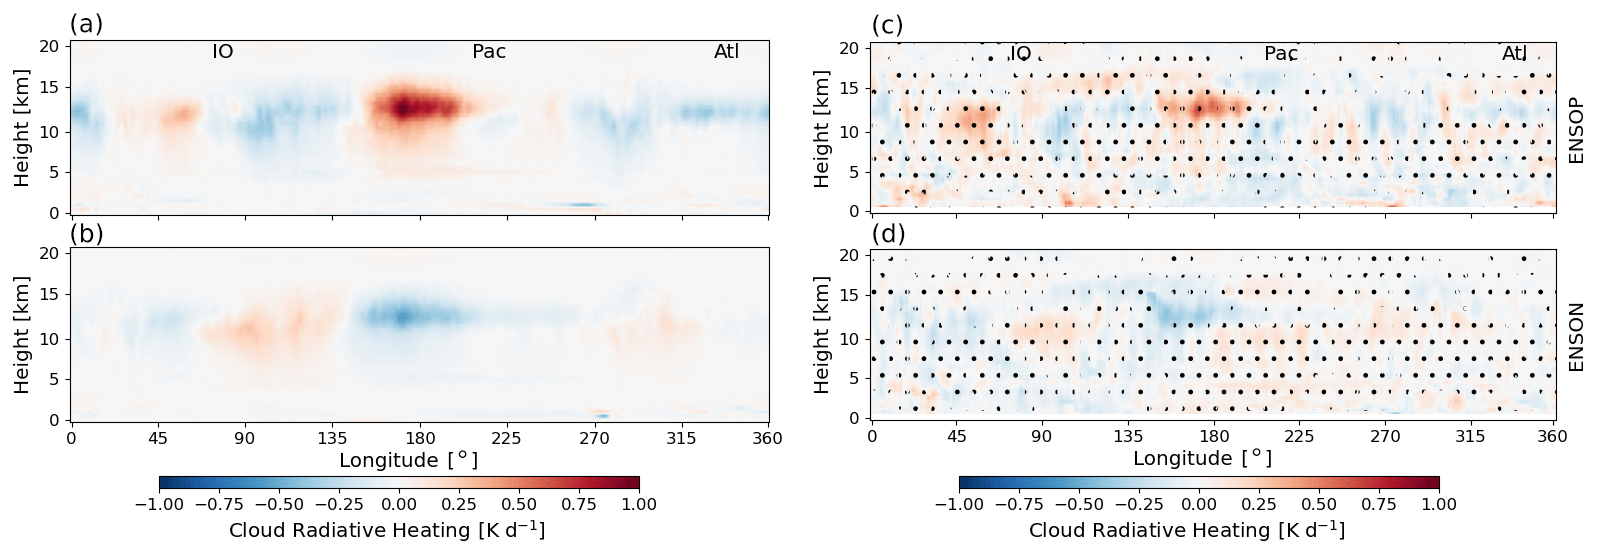
Figure 9As in Fig. 8 but showing the cloud radiative heating anomalies from EC-Earth3 during positive (a) and negative (b) ENSO compared to the average, and cloud radiative heating anomaly differences between CloudSat/CALIPSO observations and EC-Earth3 (EC-Earth3 minus CloudSat/CALIPSO) during positive (c) and negative (d) ENSO. The differences where a Student t test has a 95 % confidence based on monthly mean values are marked with a black dot (c–d).

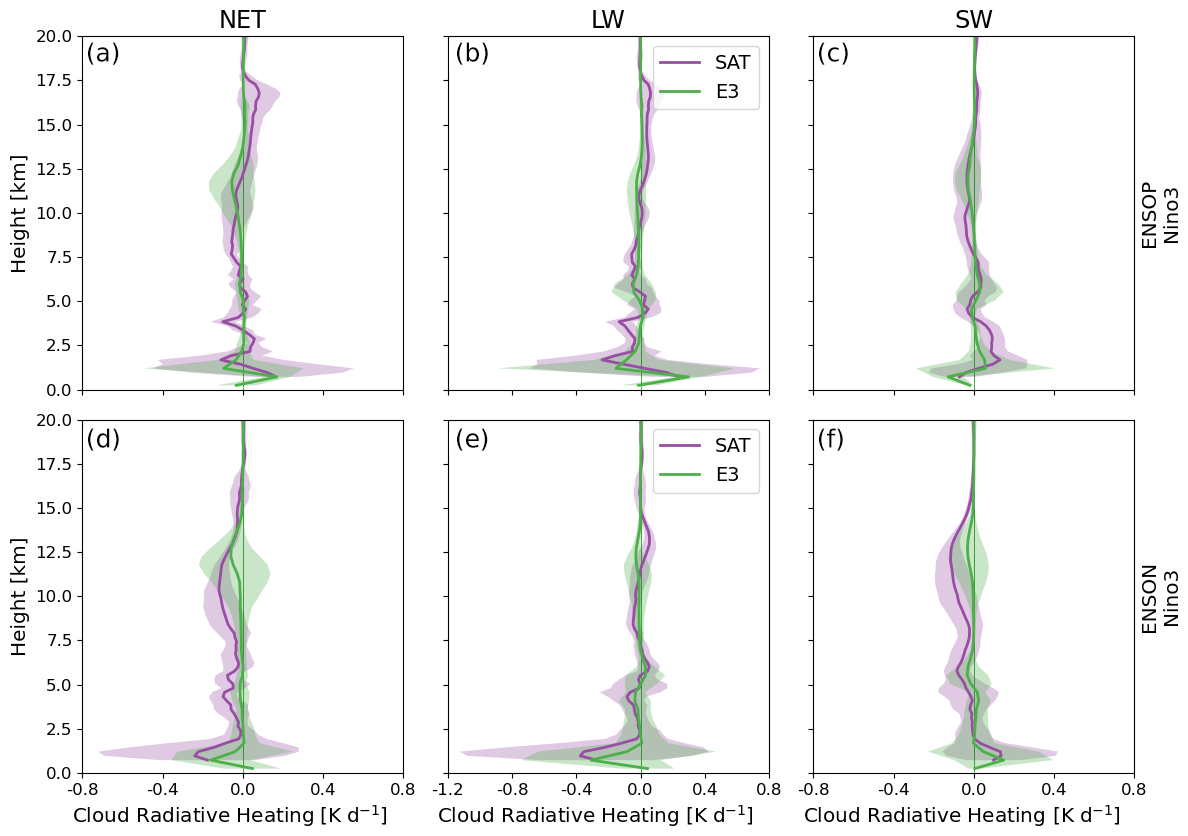
Figure 10Vertical cloud radiative heating anomalies for EC-Earth3 (E3) and CloudSat/CALIPSO observations (SAT) averaged over the Niño4 region for both ENSOP (a–c) and ENSON (d–f). Column 1: net (SW + LW; NET) heating, column 2: longwave (LW) heating and column 3: shortwave (SW) heating. Shaded areas show ±1σ spread based on monthly mean values.
The observed ENSO-driven CRH anomalies from the satellite observations are shown in Fig. 8. The meridional changes in deep convection in response to the shifts in the Walker circulation during ENSO phases are clearly visible in the CRH anomalies. During ENSOP, trade winds over the Pacific weaken, allowing a surge of warm water eastwards, leading to colder SST in the western Pacific Ocean, while the central and eastern Pacific will experience warmer-than-usual SST (see Timmermann et al., 2018). The increase in SST leads to additional and more vigorous convection. These will, in turn, generate stronger atmospheric radiative heating (0.75 K d−1) in the central Pacific atmosphere. Over the western Pacific, the decrease in SST will instead generate less convection, leading to a decrease in the CRH (−0.5 K d−1). In contrast, for ENSON, the surface water in the western Pacific and eastern Indian Ocean is warmer than usual, while the central and eastern parts of the Pacific Ocean are colder than usual. This leads to an increase of CRH with 0.25 K d−1 over the western Pacific and eastern Indian Ocean and a decrease with −0.25 K d−1 over the central Pacific Ocean. The response to ENSON is expected to be smaller than the response to ENSOP when compared to the average since ENSON is an enhancement of the normal mode.
ENSO also has implications for clouds over the Atlantic Ocean. Madenach et al. (2019) found that close to the Equator, high clouds in the Atlantic decreased during ENSOP and increased during ENSON, while the opposite was observed for low-level clouds. For ENSOP, the CRH decreases by −0.5 K d−1 in the Atlantic middle and high troposphere and the radiative cooling due to the maritime stratocumulus clouds outside Angola increases with −0.75 K d−1.
Figure 9a–b show the vertical structure of CRH for the EC-Earth3 simulation, and Fig. 9c–d show the anomaly differences between EC-Earth3 and satellite observations. While the shift in the Walker circulation and the sign of the CRH anomalies are captured in the EC-Earth3 simulation, there are again some striking differences compared to the satellite data. The magnitudes of cloud radiative heating and cooling rate anomalies are almost 2 times larger in the EC-Earth3 simulation in the active regions of ENSO. The CRH anomalies in the model are mostly restricted to the upper troposphere, whereas in the satellite observations, the entire troposphere experiences changes in the CRH. The maritime stratocumulus regions off the coasts of South and Central America show a similar behaviour to that in the satellite data, while the changes in CRH west of Africa are absent in the model. Over the Atlantic Ocean, there is a cooling (−0.5 K d−1) above 10 km during ENSOP, while the result for ENSON is close to neutral.
3.2.2 Niño3 and 4 regions
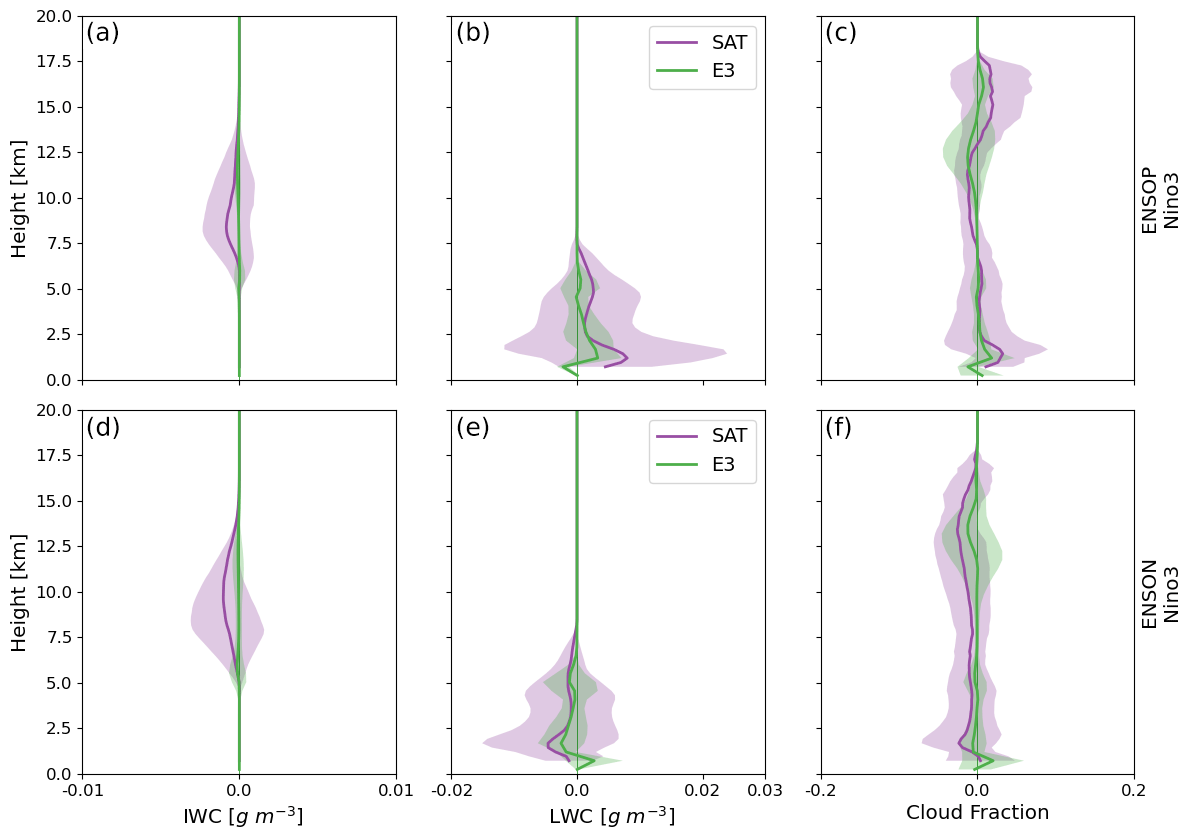
The Niño3.4 region, subregion to the two areas, Niño3 (5∘ N–5∘ S, 150–90∘ W) and Niño4 (5∘ N–5∘ S, 160∘ E–150∘ W), is used to determine if there is an El Niño or La Niña event. Both the Niño3 and Niño4 areas experience large SST variability during ENSOP and ENSON periods and are therefore useful to investigate in more detail. This will further help to interpret the differences observed in Fig. 9. The vertical structure of CRH anomalies during both ENSOP and ENSON, separated into its shortwave and longwave components, are plotted in Fig. 10 for Niño4 and Fig. 11 for Niño3, while the anomalies for the cloud properties are plotted in Figs. 12 and 13, similar to Figs. 6 and 7.
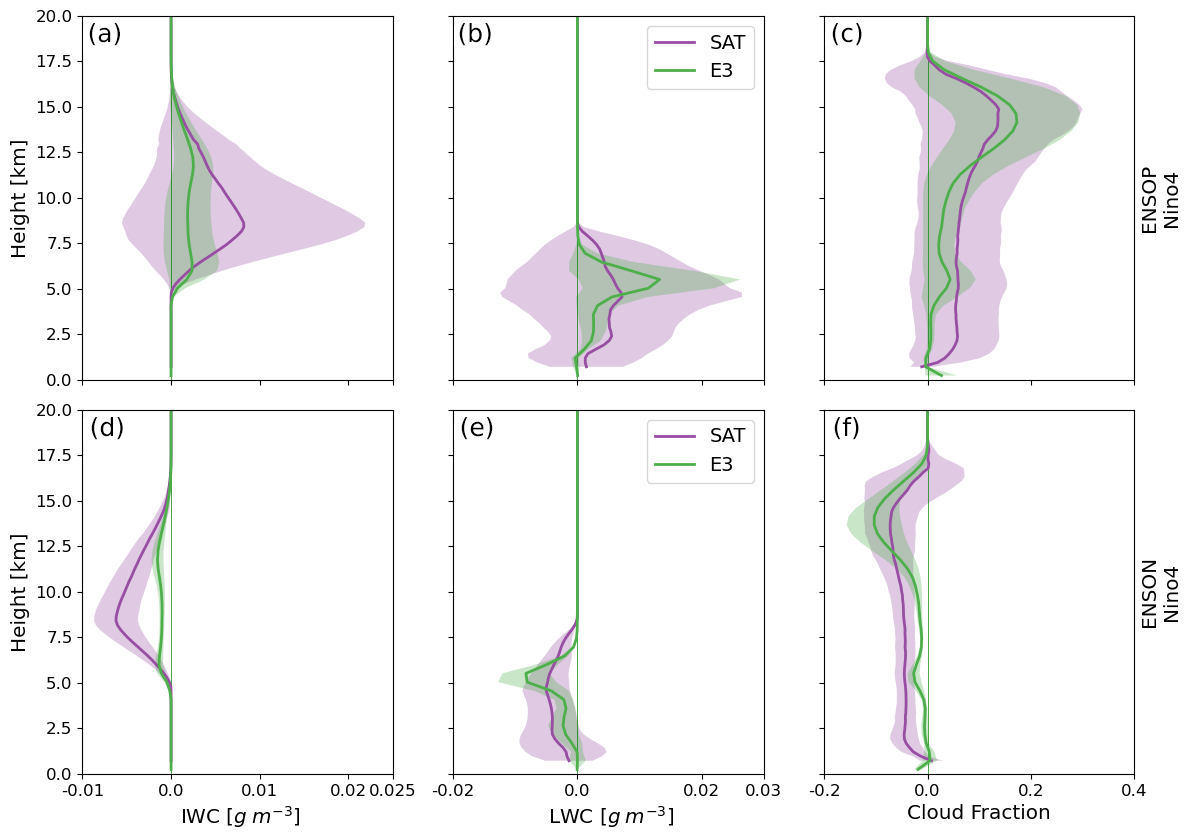
Figure 12Cloud water content and cloud fraction anomalies for EC-Earth3 (E3) and CloudSat/CALIPSO observations (SAT) averaged over the Niño4 region for both ENSOP (a–c) and ENSON (d–f). Column 1: ice water content (IWC), column 2: liquid water content (LWC) and column 3: cloud fraction (CF). Shaded areas show ±1σ spread based on monthly mean values.
During ENSOP, the model shows a strong increase in shortwave heating peaking at 12 km in the Niño4 area with anomalies reaching 0.7 K d−1 (Fig. 10c). This anomalous heating in the model is up to twice as large as for the satellite data, showing a peak in shortwave anomalous heating at 0.4 K d−1. Furthermore, in the model, the peak in the shortwave anomaly is restricted vertically to the uppermost troposphere, while in the satellite data, increased shortwave heating during ENSOP is visible both in the middle and upper troposphere. This result can be explained by the fact that the vertical cloud distribution in the model is predominantly restricted vertically to the uppermost troposphere, while in the observations, large cloud variability is also observed in the middle and lower troposphere (Fig. 12c).
The most considerable disagreement between the satellite observations and the model is seen in the longwave component of CRH in the upper troposphere (Fig. 10b). Here, the satellite data show a clear decrease in longwave heating with increasing altitude, mainly due to strong longwave cooling at the tops of the extensive convective and stratiform clouds and the optically thick cirrus. In the model simulations, the CRH anomaly continues to increase with height and then changes sign abruptly compared to the observations at around 14 km. As a result of these overestimations of both shortwave and longwave heating, the net CRH anomaly in the model (1 K d−1) is more than 2 times higher compared to observations (0.4 K d−1) in the upper troposphere in ENSOP for the Niño4 region.
As the Walker circulation is enhanced during the ENSON phase, the reduction in convection and associated clouds lead to a reduction in CRH in the upper troposphere over the Niño4 region (Fig. 10d–f). In this case, although the reduced shortwave heating (peak at −0.4 K d−1) is captured relatively well by the model, the magnitude of the reduction in longwave heating (−0.3 K d−1), in the model, is large enough to result in a net CRH anomaly that is significantly lower compared to the observations (−0.6 compared to −0.4 K d−1). Over the Niño3 region, the CRH and cloud property anomalies are low both in the observations and model simulations during both phases of the ENSO (Figs. 11 and 13).
Overall, the model tends to underestimate the anomaly in cloud ice water content and overestimate the anomaly in liquid water content for both phases of ENSO over both the Niño4 and Niño3 areas (Figs. 12 and 13). The variability in the satellite observations is however large for both liquid and ice water content compared to the model investigated here.
In the past, cloud radiative forcing in climate models has mainly been evaluated at the top of the atmosphere or the surface since the net fluxes are more readily observed there, either by satellite or by surface instruments (e.g. Thomas et al., 2019). A rigorous evaluation of the vertical structure of cloud radiative heating/cooling has only been possible in the last few years as the retrievals from the combined active radar and lidar sensors aboard CloudSat and CALIPSO satellites have matured enough to allow a quantitative analysis (Cesana et al., 2019). Understanding the vertical structure of CRH and evaluating climate models from this aspect is especially important in the tropics. In this region, the CRH does not only impact the zonal and meridional temperature gradients, and thereby influence the atmospheric circulation, but it also influences the troposphere-to-stratosphere transport.
In this study, we therefore investigated two versions of the EC-Earth climate model, where one version was used with two different horizontal resolutions (EC-Earth3P-HR and EC-Earth3P). In addition to a traditional statistical comparison, we also carried out a more process-oriented evaluation by examining how the latest version of the EC-Earth model simulate CRH during different phases of ENSO. The following conclusions can be drawn from the evaluations:
- a.
Compared to the satellite data, all versions of EC-Earth capture the general structure of the seasonal and spatial variability in net CRH over both the convectively active regions and the maritime stratocumulus regions.
- b.
The shortwave component of the radiative heating is overestimated by all model versions in the lowermost troposphere and underestimated in the middle troposphere. In the upper troposphere, the differences in shortwave heating are negligible. These over- and underestimates of shortwave heating are partly compensated in the models by an overestimate of longwave cooling in the lowermost troposphere and heating in the middle and upper troposphere.
- c.
There are two noticeable differences in the net CRH between EC-Earth (EC-Earth3P-HR) and the satellite retrievals. First, the magnitude of net CRH (above 2 K d−1) is much stronger in the model in the upper part of the troposphere over convectively active zones, almost twice as high as in the satellite observations. Second, the net CRH in the models is vertically limited to the upper troposphere, predominantly between 12–14 km, whereas the satellite observations also show pronounced heating in the middle troposphere. This disagreement is the largest in EC-Earth3P-HR.
- d.
There are substantial differences in the vertical structure of cloud fraction and cloud water content between the models and observations. In the upper part of the troposphere, the cloud fraction is similar but the models have less ice water content. Just as shown by earlier studies, such as Cesana et al. (2019), the models underestimate the cloud fraction in the lower and middle parts of the troposphere. The differences in cloud fraction and cloud water content are vital in understanding the disagreement in the magnitude and vertical distribution of the CRH between the models and the observations.
- e.
The spatial CRH variability associated with the ENSO phases and shifts in the Walker circulation is also reasonably captured by the models. However, the differences in the magnitude and vertical structure of the CRH between the model and satellite data mentioned above remain or even increase.
Our results highlight the importance of having satellite observations that resolve the vertical structure of clouds for evaluating climate models and the importance of realistically simulating the vertical structure of cloud properties. We could, however, only notice negligible differences in the simulation of vertical cloudiness and CRH over most parts of the tropics when changing the horizontal resolution in EC-Earth. An increase in the vertical resolution could potentially further improve the representation of clouds and CRH in the models, and such an investigation would be of interest in a prospective study. A longer time series from the observations, especially for the ENSO analysis, would be preferable for future studies.
At the time for the writing, the CloudSat data could be freely downloaded from http://www.cloudsat.cira.colostate.edu (CloudSat, 2019; for further information, please see also Sect. 2.2). Access to the source code of the EC-Earth3 model is restricted and can be granted after registration. For further information, contact the EC-Earth community at http://www.ec-earth.org (last access: April 2019). The Python script used for the analysis and the data from the models used in this study can be found on Zenodo at https://doi.org/10.5281/zenodo.4734468 (Johansson, 2021a), https://doi.org/10.5281/zenodo.3981154 (Johansson, 2021b), https://doi.org/10.5281/zenodo.3947700 (Johansson, 2021c), https://doi.org/10.5281/zenodo.3958826 (Johansson, 2021d) and https://doi.org/10.5281/zenodo.3960087 (Johansson, 2021e). Any answers to questions regarding the model configuration or the Python scripts are available from the authors upon request.
EJ ran the model simulations and did the subsequent analysis and drafted the manuscript. AD, MT and AMLE were all part of designing the study. KW provided valuable input for running the model and added a climate modeller's perspective, while TL'E provided insight on the CloudSat data. All the co-authors contributed to the interpretation of the results and review of the manuscript.
The authors declare that they have no conflict of interest.
Publisher's note: Copernicus Publications remains neutral with regard to jurisdictional claims in published maps and institutional affiliations.
The EC-Earth simulations for this publication were enabled by resources provided by the Swedish National Infrastructure for Computing (SNIC) at NSC. We are grateful to the CloudSat Data Processing Center (DPC) and Science Teams for providing CloudSat datasets.
Erik Johansson and Abhay Devasthale were supported by the Swedish National Space Board (SNSB; contract Dnr: 84/11:1 and 84/11:2).
The article processing charges for this open-access publication were covered by Stockholm University.
This paper was edited by Jason Williams and reviewed by two anonymous referees.
Ackerman, T. P., Liou, K.-N., Valero, F. P. J., and Pfister, L.: Heating Rates in Tropical Anvils, J. Atmos. Sci., 45, 1606–1623, https://doi.org/10.1175/1520-0469(1988)045<1606:HRITA>2.0.CO;2, 1988. a
Austin, R. T., Heymsfield, A. J., and Stephens, G. L.: Retrieval of Ice Cloud Microphysical Parameters Using the CloudSat Millimeter-Wave Radar and Temperature, J. Geophys. Res.-Atmos., 114, D00A23, https://doi.org/10.1029/2008JD010049, 2009. a
Bechtold, P., Köhler, M., Jung, T., Doblas-Reyes, F., Leutbecher, M., Rodwell, M. J., Vitart, F., and Balsamo, G.: Advances in Simulating Atmospheric Variability with the ECMWF Model: From Synoptic to Decadal Time-Scales, Q. J. Roy. Meteor. Soc., 134, 1337–1351, https://doi.org/10.1002/qj.289, 2008. a
Bechtold, P., Semane, N., Lopez, P., Chaboureau, J.-P., Beljaars, A., and Bormann, N.: Representing Equilibrium and Nonequilibrium Convection in Large-Scale Models, J. Atmos. Sci., 71, 734–753, https://doi.org/10.1175/JAS-D-13-0163.1, 2013. a
Bojinski, S., Verstraete, M., Peterson, T. C., Richter, C., Simmons, A., and Zemp, M.: The Concept of Essential Climate Variables in Support of Climate Research, Applications, and Policy, B. Am. Meteorol. Soc., 95, 1431–1443, https://doi.org/10.1175/BAMS-D-13-00047.1, 2014. a
Cesana, G., Waliser, D. E., Henderson, D., L'Ecuyer, T. S., Jiang, X., and Li, J.-L. F.: The Vertical Structure of Radiative Heating Rates: A Multimodel Evaluation Using A-Train Satellite Observations, J. Climate, 32, 1573–1590, https://doi.org/10.1175/JCLI-D-17-0136.1, 2019. a, b, c, d
CloudSat: Data processing center, available at: http://www.cloudsat.cira.colostate.edu, last access: April 2019. a
Corti, T., Luo, B. P., Fu, Q., Vömel, H., and Peter, T.: The impact of cirrus clouds on tropical troposphere-to-stratosphere transport, Atmos. Chem. Phys., 6, 2539–2547, https://doi.org/10.5194/acp-6-2539-2006, 2006. a
Devasthale, A. and Thomas, M. A.: Sensitivity of Cloud Liquid Water Content Estimates to the Temperature-Dependent Thermodynamic Phase: A Global Study Using CloudSat Data, J. Climate, 25, 7297–7307, https://doi.org/10.1175/JCLI-D-11-00521.1, 2012. a
Exarchou, E., Prodhomme, C., Brodeau, L., Guemas, V., and Doblas-Reyes, F.: Origin of the Warm Eastern Tropical Atlantic SST Bias in a Climate Model, Clim. Dynam., 51, 1819–1840, https://doi.org/10.1007/s00382-017-3984-3, 2017. a
Forbes, R., Tompkins, A. M., and Untch, A.: A New Prognostic Bulk Microphysics Scheme for the IFS, Technical Memorandum 649, European Centre for Medium-Range Weather Forecasts, https://doi.org/10.21957/bf6vjvxk, 2011. a
Hang, Y., L'Ecuyer, T. S., Henderson, D. S., Matus, A. V., and Wang, Z.: Reassessing the Effect of Cloud Type on Earth's Energy Balance in the Age of Active Spaceborne Observations. Part II: Atmospheric Heating, J. Climate, 32, 6219–6236, https://doi.org/10.1175/JCLI-D-18-0754.1, 2019. a
Hart, N. C. G., Washington, R., and Maidment, R. I.: Deep Convection over Africa: Annual Cycle, ENSO, and Trends in the Hotspots, J. Climate, 32, 8791–8811, https://doi.org/10.1175/JCLI-D-19-0274.1, 2019. a
Hartmann, D. L. and Berry, S. E.: The Balanced Radiative Effect of Tropical Anvil Clouds, J. Geophys. Res.-Atmos., 122, 5003–5020, https://doi.org/10.1002/2017JD026460, 2017. a
Hazeleger, W., Wang, X., Severijns, C., Ştefănescu, S., Bintanja, R., Sterl, A., Wyser, K., Semmler, T., Yang, S., van den Hurk, B., van Noije, T., van der Linden, E., and van der Wiel, K.: EC-Earth V2.2: Description and Validation of a New Seamless Earth System Prediction Model, Clim. Dynam., 39, 2611–2629, https://doi.org/10.1007/s00382-011-1228-5, 2012. a
Hazeleger, W., Guemas, V., Wouters, B., Corti, S., Andreu-Burillo, I., Doblas-Reyes, F. J., Wyser, K., and Caian, M.: Multiyear Climate Predictions Using Two Initialization Strategies, Geophys. Res. Lett., 40, 1794–1798, https://doi.org/10.1002/grl.50355, 2013. a
Henderson, D. S., L'Ecuyer, T., Stephens, G., Partain, P., and Sekiguchi, M.: A Multisensor Perspective on the Radiative Impacts of Clouds and Aerosols, J. Appl. Meteorol. Clim., 52, 853–871, https://doi.org/10.1175/JAMC-D-12-025.1, 2013. a
Holton, J. R. and Hakim, G. J.: An Introduction to Dynamic Meteorology, Vol. 88, 5th Edn., Academic Press, ISBN 978-0-12-384866-6, 2012. a
Hourdin, F., Foujols, M.-A., Codron, F., Guemas, V., Dufresne, J.-L., Bony, S., Denvil, S., Guez, L., Lott, F., Ghattas, J., Braconnot, P., Marti, O., Meurdesoif, Y., and Bopp, L.: Impact of the LMDZ Atmospheric Grid Configuration on the Climate and Sensitivity of the IPSL-CM5A Coupled Model, Clim. Dynam., 40, 2167–2192, https://doi.org/10.1007/s00382-012-1411-3, 2013. a
Jiang, J. H., Su, H., Zhai, C., Perun, V. S., Del Genio, A., Nazarenko, L. S., Donner, L. J., Horowitz, L., Seman, C., Cole, J., Gettelman, A., Ringer, M. A., Rotstayn, L., Jeffrey, S., Wu, T., Brient, F., Dufresne, J.-L., Kawai, H., Koshiro, T., Watanabe, M., LÉcuyer, T. S., Volodin, E. M., Iversen, T., Drange, H., Mesquita, M. D. S., Read, W. G., Waters, J. W., Tian, B., Teixeira, J., and Stephens, G. L.: Evaluation of Cloud and Water Vapor Simulations in CMIP5 Climate Models Using NASA “A-Train” Satellite Observations, J. Geophys. Res.-Atmos., 117, D14105, https://doi.org/10.1029/2011JD017237, 2012. a
Johansson, E.: Vertical cloud radiative heating: Python code, Zenodo [code], https://doi.org/10.5281/zenodo.4734468, 2021a. a
Johansson, E.: Vertical cloud radiative heating from the EC-Earth3 v3.3.1 model, Zenodo [data set], https://doi.org/10.5281/zenodo.3981154, 2021b. a
Johansson, E.: Vertical cloud radiative heating from the EC-Earth3 PRIMAVERA standard-resolution model, Zenodo [data set], https://doi.org/10.5281/zenodo.3947700, 2021c. a
Johansson, E.: Vertical cloud radiative heating from the EC-Earth3 PRIMAVERA high-resolution model part 1 (of 2), Zenodo [data set], https://doi.org/10.5281/zenodo.3958826, 2021d. a
Johansson, E.: Vertical cloud radiative heating from the EC-Earth3 PRIMAVERA high-resolution model part 2 (of 2), Zenodo [data set], https://doi.org/10.5281/zenodo.3960087, 2021e. a
Johansson, E., Devasthale, A., L'Ecuyer, T., Ekman, A. M. L., and Tjernström, M.: The vertical structure of cloud radiative heating over the Indian subcontinent during summer monsoon, Atmos. Chem. Phys., 15, 11557–11570, https://doi.org/10.5194/acp-15-11557-2015, 2015. a, b, c
Johansson, E., Devasthale, A., Ekman, A. M. L., Tjernström, M., and L'Ecuyer, T.: How Does Cloud Overlap Affect the Radiative Heating in the Tropical Upper Troposphere/Lower Stratosphere?, Geophys. Res. Lett., 46, 5623–5631, https://doi.org/10.1029/2019GL082602, 2019. a, b
Karlsson, K.-G. and Devasthale, A.: Inter-Comparison and Evaluation of the Four Longest Satellite-Derived Cloud Climate Data Records: CLARA-A2, ESA Cloud CCI V3, ISCCP-HGM, and PATMOS-x, Remote Sens., 10, 1567, https://doi.org/10.3390/rs10101567, 2018. a
King, M. D., Platnick, S., Menzel, W. P., Ackerman, S. A., and Hubanks, P. A.: Spatial and Temporal Distribution of Clouds Observed by MODIS Onboard the Terra and Aqua Satellites, IEEE T. Geosci. Remote Sens., 51, 3826–3852, https://doi.org/10.1109/TGRS.2012.2227333, 2013. a
L'Ecuyer, T. S. and Jiang, J. H.: Touring the Atmosphere Aboard the A-Train, Phys. Today, 63, 36–41, https://doi.org/10.1063/1.3463626, 2010. a
L'Ecuyer, T. S., Wood, N. B., Haladay, T., Stephens, G. L., and Stackhouse, P. W.: Impact of Clouds on Atmospheric Heating Based on the R04 CloudSat Fluxes and Heating Rates Data Set, J. Geophys. Res.-Atmos., 113, D00A15, https://doi.org/10.1029/2008JD009951, 2008. a
L'Ecuyer, T. S., Hang, Y., Matus, A. V., and Wang, Z.: Reassessing the Effect of Cloud Type on Earth's Energy Balance in the Age of Active Spaceborne Observations. Part I: Top of Atmosphere and Surface, J. Climate, 32, 6197–6217, https://doi.org/10.1175/JCLI-D-18-0753.1, 2019. a
Li, J.-L. F., Waliser, D. E., Stephens, G., Lee, S., L'Ecuyer, T., Kato, S., Loeb, N., and Ma, H.-Y.: Characterizing and Understanding Radiation Budget Biases in CMIP3/CMIP5 GCMs, Contemporary GCM, and Reanalysis, J. Geophys. Res.-Atmos., 118, 8166–8184, https://doi.org/10.1002/jgrd.50378, 2013. a
Madenach, N., Carbajal Henken, C., Preusker, R., Sourdeval, O., and Fischer, J.: Analysis and quantification of ENSO-linked changes in the tropical Atlantic cloud vertical distribution using 14 years of MODIS observations, Atmos. Chem. Phys., 19, 13535–13546, https://doi.org/10.5194/acp-19-13535-2019, 2019. a, b
Matus, A. V. and L'Ecuyer, T. S.: The Role of Cloud Phase in Earth's Radiation Budget, J. Geophys. Res.-Atmos., 122, 2016JD025951, https://doi.org/10.1002/2016JD025951, 2017. a
Mauritsen, T., Stevens, B., Roeckner, E., Crueger, T., Esch, M., Giorgetta, M., Haak, H., Jungclaus, J., Klocke, D., Matei, D., Mikolajewicz, U., Notz, D., Pincus, R., Schmidt, H., and Tomassini, L.: Tuning the Climate of a Global Model, J. Adv. Model. Earth Sy., 4, M00A01, https://doi.org/10.1029/2012MS000154, 2012. a
McFarlane, S. A., Mather, J. H., and Ackerman, T. P.: Analysis of Tropical Radiative Heating Profiles: A Comparison of Models and Observations, J. Geophys. Res.-Atmo., 112, D14218, https://doi.org/10.1029/2006JD008290, 2007. a
Morcrette, J.-J., Barker, H. W., Cole, J. N. S., Iacono, M. J., and Pincus, R.: Impact of a New Radiation Package, McRad, in the ECMWF Integrated Forecasting System, Mon. Weather Rev., 136, 4773–4798, https://doi.org/10.1175/2008MWR2363.1, 2008. a
Pincus, R., Platnick, S., Ackerman, S. A., Hemler, R. S., and Patrick Hofmann, R. J.: Reconciling Simulated and Observed Views of Clouds: MODIS, ISCCP, and the Limits of Instrument Simulators, J. Climate, 25, 4699–4720, https://doi.org/10.1175/JCLI-D-11-00267.1, 2012. a
Prodhomme, C., Batté, L., Massonnet, F., Davini, P., Bellprat, O., Guemas, V., and Doblas-Reyes, F. J.: Benefits of Increasing the Model Resolution for the Seasonal Forecast Quality in EC-Earth, J. Climate, 29, 9141–9162, https://doi.org/10.1175/JCLI-D-16-0117.1, 2016. a
Randall, D. A., Harshvardhan, Dazlich, D. A., and Corsetti, T. G.: Interactions among Radiation, Convection, and Large-Scale Dynamics in a General Circulation Model, J. Atmos. Sci., 46, 1943–1970, https://doi.org/10.1175/1520-0469(1989)046<1943:IARCAL>2.0.CO;2, 1989. a
Raymond, D. J.: The Hadley Circulation as a Radiative–Convective Instability, J. Atmos. Sci., 57, 1286–1297, https://doi.org/10.1175/1520-0469(2000)057<1286:THCAAR>2.0.CO;2, 2000. a
Sassen, K., Wang, Z., and Liu, D.: Global Distribution of Cirrus Clouds from CloudSat/Cloud-Aerosol Lidar and Infrared Pathfinder Satellite Observations (CALIPSO) Measurements, J. Geophys. Res.-Atmos., 113, D00A12, https://doi.org/10.1029/2008JD009972, 2008. a
Sherwood, S. C., Ramanathan, V., Barnett, T. P., Tyree, M. K., and Roeckner, E.: Response of an Atmospheric General Circulation Model to Radiative Forcing of Tropical Clouds, J. Geophys. Res.-Atmos., 99, 20829–20845, https://doi.org/10.1029/94JD01632, 1994. a, b, c
Slingo, A. and Slingo, J. M.: The Response of a General Circulation Model to Cloud Longwave Radiative Forcing. I: Introduction and Initial Experiments, Q. J. Roy. Meteor. Soc., 114, 1027–1062, https://doi.org/10.1002/qj.49711448209, 1988. a
Stephens, G. L.: Cloud Feedbacks in the Climate System: A Critical Review, J. Climate, 18, 237–273, https://doi.org/10.1175/JCLI-3243.1, 2005. a
Stephens, G. L., Vane, D. G., Boain, R. J., Mace, G. G., Sassen, K., Wang, Z., Illingworth, A. J., O'connor, E. J., Rossow, W. B., Durden, S. L., Miller, S. D., Austin, R. T., Benedetti, A., Mitrescu, C., and the CloudSat Science Team: THE CLOUDSAT MISSION AND THE A-TRAIN: A New Dimension of Space-Based Observations of Clouds and Precipitation, B. Am. Meteorol. Soc., 83, 1771–1790, https://doi.org/10.1175/BAMS-83-12-1771, 2002. a
Stephens, G. L., Vane, D. G., Tanelli, S., Im, E., Durden, S., Rokey, M., Reinke, D., Partain, P., Mace, G. G., Austin, R., L'Ecuyer, T., Haynes, J., Lebsock, M., Suzuki, K., Waliser, D., Wu, D., Kay, J., Gettelman, A., Wang, Z., and Marchand, R.: CloudSat Mission: Performance and Early Science after the First Year of Operation, J. Geophys. Res.-Atmos., 113, D00A18, https://doi.org/10.1029/2008JD009982, 2008. a
Stubenrauch, C. J., Rossow, W. B., Kinne, S., Ackerman, S., Cesana, G., Chepfer, H., Di Girolamo, L., Getzewich, B., Guignard, A., Heidinger, A., Maddux, B. C., Menzel, W. P., Minnis, P., Pearl, C., Platnick, S., Poulsen, C., Riedi, J., Sun-Mack, S., Walther, A., Winker, D., Zeng, S., and Zhao, G.: Assessment of Global Cloud Datasets from Satellites: Project and Database Initiated by the GEWEX Radiation Panel, B. Am. Meteorol. Soc., 94, 1031–1049, https://doi.org/10.1175/BAMS-D-12-00117.1, 2013. a
Su, H., Jiang, J. H., Zhai, C., Perun, V. S., Shen, J. T., Genio, A. D., Nazarenko, L. S., Donner, L. J., Horowitz, L., Seman, C., Morcrette, C., Petch, J., Ringer, M., Cole, J., von Salzen, K., Mesquita, M. d. S., Iversen, T., Kristjansson, J. E., Gettelman, A., Rotstayn, L., Jeffrey, S., Dufresne, J.-L., Watanabe, M., Kawai, H., Koshiro, T., Wu, T., Volodin, E. M., L'Ecuyer, T., Teixeira, J., and Stephens, G. L.: Diagnosis of Regime-Dependent Cloud Simulation Errors in CMIP5 Models Using “A-Train” Satellite Observations and Reanalysis Data, J. Geophys. Res.-Atmos., 118, 2762–2780, https://doi.org/10.1029/2012JD018575, 2013. a
Thomas, M. A., Devasthale, A., Koenigk, T., Wyser, K., Roberts, M., Roberts, C., and Lohmann, K.: A statistical and process-oriented evaluation of cloud radiative effects in high-resolution global models, Geosci. Model Dev., 12, 1679–1702, https://doi.org/10.5194/gmd-12-1679-2019, 2019. a, b
Timmermann, A., An, S.-I., Kug, J.-S., Jin, F.-F., Cai, W., Capotondi, A., Cobb, K. M., Lengaigne, M., McPhaden, M. J., Stuecker, M. F., Stein, K., Wittenberg, A. T., Yun, K.-S., Bayr, T., Chen, H.-C., Chikamoto, Y., Dewitte, B., Dommenget, D., Grothe, P., Guilyardi, E., Ham, Y.-G., Hayashi, M., Ineson, S., Kang, D., Kim, S., Kim, W., Lee, J.-Y., Li, T., Luo, J.-J., McGregor, S., Planton, Y., Power, S., Rashid, H., Ren, H.-L., Santoso, A., Takahashi, K., Todd, A., Wang, G., Wang, G., Xie, R., Yang, W.-H., Yeh, S.-W., Yoon, J., Zeller, E., and Zhang, X.: El Niño–Southern Oscillation Complexity, Nature, 559, 535–545, https://doi.org/10.1038/s41586-018-0252-6, 2018. a
Voigt, A., Albern, N., and Papavasileiou, G.: The Atmospheric Pathway of the Cloud-Radiative Impact on the Circulation Response to Global Warming: Important and Uncertain, J. Climate, 32, 3051–3067, https://doi.org/10.1175/JCLI-D-18-0810.1, 2019. a
Wang, H. and Su, W.: Evaluating and Understanding Top of the Atmosphere Cloud Radiative Effects in Intergovernmental Panel on Climate Change (IPCC) Fifth Assessment Report (AR5) Coupled Model Intercomparison Project Phase 5 (CMIP5) Models Using Satellite Observations, J. Geophys. Res.-Atmos., 118, 683–699, https://doi.org/10.1029/2012JD018619, 2013. a
Winker, D. M., Vaughan, M. A., Omar, A., Hu, Y., Powell, K. A., Liu, Z., Hunt, W. H., and Young, S. A.: Overview of the CALIPSO Mission and CALIOP Data Processing Algorithms, J. Atmos. Ocean. Tech., 26, 2310–2323, https://doi.org/10.1175/2009JTECHA1281.1, 2009. a
Wood, R.: Stratocumulus Clouds, Mon. Weather Rev., 140, 2373–2423, https://doi.org/10.1175/MWR-D-11-00121.1, 2012. a, b
Zelinka, M. D., Grise, K. M., Klein, S. A., Zhou, C., DeAngelis, A. M., and Christensen, M. W.: Drivers of the Low-Cloud Response to Poleward Jet Shifts in the North Pacific in Observations and Models, J. Climate, 31, 7925–7947, https://doi.org/10.1175/JCLI-D-18-0114.1, 2018. a