the Creative Commons Attribution 4.0 License.
the Creative Commons Attribution 4.0 License.
 | 24 Jun 2021
Partitioning soil organic carbon into its centennially stable and active fractions with machine-learning models based on Rock-Eval® thermal analysis (PARTYSOCv2.0 and PARTYSOCv2.0EU)
François Baudin
Claire Chenu
Bent T. Christensen
Uwe Franko
Sabine Houot
Eva Kanari
Thomas Kätterer
Ines Merbach
Folkert van Oort
Christopher Poeplau
Juan Carlos Quezada
Florence Savignac
Laure N. Soucémarianadin
Pierre Barré
Partitioning soil organic carbon (SOC) into two kinetically different fractions that are stable or active on a century scale is key for an improved monitoring of soil health and for more accurate models of the carbon cycle. However, all existing SOC fractionation methods isolate SOC fractions that are mixtures of centennially stable and active SOC. If the stable SOC fraction cannot be isolated, it has specific chemical and thermal characteristics that are quickly (ca. 1 h per sample) measurable using Rock-Eval® thermal analysis. An alternative would thus be to (1) train a machine-learning model on the Rock-Eval® thermal analysis data for soil samples from long-term experiments for which the size of the centennially stable and active SOC fractions can be estimated and (2) apply this model to the Rock-Eval® data for unknown soils to partition SOC into its centennially stable and active fractions. Here, we significantly extend the validity range of a previously published machine-learning model (Cécillon et al., 2018) that is built upon this strategy. The second version of this model, which we propose to name PARTYSOC, uses six European long-term agricultural sites including a bare fallow treatment and one South American vegetation change (C4 to C3 plants) site as reference sites. The European version of the model (PARTYSOCv2.0EU) predicts the proportion of the centennially stable SOC fraction with a root mean square error of 0.15 (relative root mean square error of 0.27) at six independent validation sites. More specifically, our results show that PARTYSOCv2.0EU reliably partitions SOC kinetic fractions at its northwestern European validation sites on Cambisols and Luvisols, which are the two dominant soil groups in this region. We plan future developments of the PARTYSOC global model using additional reference soils developed under diverse pedoclimates and ecosystems to further expand its domain of application while reducing its prediction error.
- Article
(1253 KB) - Full-text XML
-
Supplement
(349 KB) - BibTeX
- EndNote


Soil organic carbon (SOC) is identified as a key element contributing to soil functions such as primary productivity, water purification and regulation, carbon sequestration and climate regulation, habitat for biodiversity, and recycling of nutrients (Keesstra et al., 2016; Koch et al., 2013; Schulte et al., 2014; Wiesmeier et al., 2019). While the magnitude and the historical dimension of the decrease in SOC at the global level are progressively being unveiled (IPBES, 2018; Sanderman et al., 2017; Stoorvogel et al., 2017), SOC stock preservation and even increase is a major challenge for human societies in the 21st century (Amundson et al., 2015). With widespread beneficial effects on soil functioning at the local level (Pellerin et al., 2020), increasing the size of the global SOC reservoir contributes directly to the Sustainable Development Goal related to life on land (https://www.globalgoals.org/15-life-on-land, last access: 17 June 2020). It is also one of the few land-management-based intervention options that has a broad and positive impact on food security and climate change mitigation and adaptation, two other Sustainable Development Goals set by the United Nations (IPCC, 2019; Lal, 2004).
There is experimental evidence showing that in all soils, SOC is made of carbon atoms with highly contrasting residence times ranging from hours to millennia (Balesdent et al., 1987; Trumbore et al., 1989). This continuum in SOC persistence is often simplified by considering SOC as a mixture formed of several fractions, also called kinetic pools by modellers (Hénin and Dupuis, 1945; Jenkinson, 1990; Nikiforoff, 1936). The most drastic conceptual simplification of SOC persistence considers only two pools: (1) one made of young SOC with a short turnover rate (typically 3 decades on average; the active SOC pool) and (2) one made of older SOC that persists much longer in the soil (more than a century; the stable, passive, or persistent SOC pool). This dualistic representation of SOC persistence was considered “a necessary simplification, but certainly not a utopian one” 4 decades ago (Balesdent and Guillet, 1982) and is still considered meaningful (e.g. Lavallee et al., 2020). The active and stable soil organic matter pools contribute differently to the various soil functions (Hsieh, 1992). The active organic matter pool efficiently fuels soil biological activity (with carbon, nutrients, and energy) and plant growth (with nutrients) through its rapid decay, and it sustains soil structure development (Abiven et al., 2009; Janzen, 2006). Conversely, the potential contribution of a soil to climate regulation would be most dependent on its stable organic matter pool size (He et al., 2016; Shi et al., 2020).
A myriad of methods has been developed and tested to partition SOC into active and stable fractions that would match kinetic pools for the assessment of SOC dynamics and related soil functions since the second half of the 20th century (Balesdent, 1996; Hénin and Turc, 1949; Monnier et al., 1962; Poeplau et al., 2018). Some of these methods based on chemical or physical (size, density, or thermal) fractionation schemes can separate SOC fractions with, on average, different turnover rates (Balesdent, 1996; Plante et al., 2013; Poeplau et al., 2018; Trumbore et al., 1989). Of these methods, only a few are reasonably reproducible and easy to implement such as the ones based on rapid thermal analysis and chemical extractions (Gregorich et al., 2015; Poeplau et al., 2013, 2018; Soucémarianadin et al., 2018a). Other methods, such as size and density SOC fractionation, need to be inferred from machine-learning models or infrared spectroscopy to be implemented for large soil sample sets (Baldock et al., 2013; Cotrufo et al., 2019; Jaconi et al., 2019; Viscarra Rossel et al., 2019; Viscarra Rossel and Hicks, 2015; Vos et al., 2018; Zimmermann et al., 2007b). However, all SOC fractionation methods fail to achieve a proper separation of stable from active SOC, and the isolated SOC fractions are thus mixtures of centennially stable and active SOC (Fig. 1; Balesdent, 1996; Hsieh, 1992; von Lützow et al., 2007; Sanderman and Grandy, 2020). This limitation is common to all existing SOC fractionation methods and compromises the results of any work using them directly to quantify soil functions specifically related to SOC fractions or to parameterize SOC partitioning in multi-compartmental models of SOC dynamics (Luo et al., 2016). Simulations of SOC stocks changes by multi-compartmental models are very sensitive to the initial proportion of the centennially stable SOC fraction, underlining the importance of its accurate estimation (Clivot et al., 2019; Falloon and Smith, 2000; Jenkinson et al., 1991; Taghizadeh-Toosi et al., 2020).

Figure 1Conceptual representation of soil organic carbon fractionation methods vs. the PARTYSOC approach to quantify the size of the centennially stable and active soil organic carbon fractions. All existing soil organic carbon fractionation methods isolate fractions that are mixtures of centennially stable and active soil organic carbon. PARTYSOC is a machine-learning model trained on the Rock-Eval® thermal analysis data for soil samples from long-term experiments in which the size of the centennially stable SOC fraction can be estimated. When applied to the Rock-Eval® data for unknown topsoils, PARTYSOC partitions soil organic carbon into its active and stable fractions (i.e. without isolating soil organic carbon fractions from each other). SOC: soil organic carbon. Credits for photos: SOC physical fractionation methods, Mathilde Bryant; SOC thermal fractionation using Rock-Eval®, Lauric Cécillon.
If the stable SOC fraction cannot be isolated, it has specific chemical and thermal characteristics: stable SOC is depleted in hydrogen and thermally stable (Barré et al., 2016; Gregorich et al., 2015). These characteristics are measurable quickly (ca. 1 h per sample) and at a reasonable cost (less than USD 60 per sample in private laboratories) using Rock-Eval® thermal analysis, and they could be of use to identify the quantitative contribution of stable SOC to total SOC. An alternative to the elusive proper separation of stable and active SOC pools could thus be to directly predict their sizes by training a machine-learning model based on Rock-Eval® data to estimate the size of the stable and active SOC fractions without isolating them from each other (Fig. 1). This model would need a training set of soil samples for which SOC partitioning into its active and stable pools can be fairly estimated. Such soil samples are available in long-term (i.e. at least longer than 3 decades) bare fallow experiments (LTBF; soils kept free of vegetation and thus with negligible SOC inputs) and long-term vegetation change (C3 plants to C4 plants or vice versa) experiments, as described by Balesdent et al. (1987, 2018), Barré et al. (2010), Cerri et al. (1985), and Rühlmann (1999). Cécillon et al. (2018) used this strategy to develop a machine-learning random forest regression model for topsoil samples obtained from the archives of four European long-term agricultural sites including an LTBF treatment. This model, which we propose to name PARTYSOC, related thermal analysis parameters of topsoils measured with Rock-Eval® to their estimated proportion of the centennially stable SOC fraction (Fig. 1). This previous work positioned PARTYSOC as the first operational method quantifying the centennially stable and active SOC fractions in agricultural topsoils from northwestern Europe. However, the ability of this machine-learning model to fairly partition the centennially stable and the active SOC fractions of soil samples from new sites in and outside northwestern Europe is largely unknown because its training set is (1) rather limited with a low number of reference sites and (2) based on centennially stable SOC contents that are exclusively inferred from plant-free LTBF treatments.
In this study, we aimed to improve the accuracy and the genericity of the PARTYSOC machine-learning model that partitions SOC into its centennially stable and active fractions developed by Cécillon et al. (2018). (1) We increased the range of soil groups, soil texture classes, climates, and types of long-term experiments through the addition to the training set of topsoils from three new reference sites (two additional European long-term agricultural sites with an LTBF treatment and one South American long-term vegetation change site). (2) We integrated new predictor variables derived from Rock-Eval® thermal analysis. (3) In this second version of the model, we also changed the following series of technical details. We added a new criterion based on observed SOC content to estimate of the size of the centennially stable SOC fraction at reference sites to reduce the risk of overestimating this site-specific parameter. We calculated the proportion of the centennially stable SOC fraction differently in reference topsoil samples using SOC content estimated by Rock-Eval® rather than by dry combustion. We changed some criteria regarding the selection of reference topsoils in the training set of the model: we removed samples from agronomical treatments with compost or manure amendments, and preference was given to samples with good organic carbon yield in their Rock-Eval® thermal analysis. We better balanced the contribution of each reference site to PARTYSOCv2.0. (4) We also aimed to build a regional version of the model restricted to the reference sites available in Europe (named PARTYSOCv2.0EU). (5) Finally, we carefully evaluated the performance of the models on unknown soils, and we further investigated the sensitivity of model performance to the training and test sets. For clarity, the main changes between the first version of PARTYSOC (Cécillon et al., 2018) and this second version of the model are summarized in Supplement Table S1.
2.1 Reference sites and estimation of the centennially stable SOC fraction content at each site
This second version of PARTYSOC uses seven long-term study sites as reference sites (i.e. sites where the size of the centennially stable SOC fraction can be estimated). The main characteristics of these seven reference sites, their respective soil group, and basic topsoil properties are presented in Supplement Table S2 and more thoroughly in the references cited below. Six reference sites for PARTYSOCv2.0 are long-term agricultural experiments located in northwestern Europe that include at least one LTBF treatment. (1) The long-term experiment on animal manure and mineral fertilizers (B3 and B4 fields) and its adjacent LTBF experiment started in 1956 and terminated in 1985 at the Lermarken site of Askov in Denmark (Christensen et al., 2019; Christensen and Johnston, 1997). (2) The static fertilization experiment (V120) started in 1902, and the fallow experiment (V505a) started in 1988 at Bad Lauchstädt in Germany (Franko and Merbach, 2017; Körschens et al., 1998; Ludwig et al., 2007). (3) The “36 parcelles” experiment started in 1959 at Grignon in France (Cardinael et al., 2015; Houot et al., 1989). (4) The “42 parcelles” experiment started in 1928 at Versailles in France (van Oort et al., 2018). (5) The Highfield bare fallow experiment started in 1959 at Rothamsted in England (Johnston et al., 2009). (6) The Ultuna continuous soil organic matter field experiment started in 1956 in Sweden (Kätterer et al., 2011). These six reference sites are used in the European version of the machine-learning model, PARTYSOCv2.0EU. One additional long-term vegetation change site completes the reference site list for the PARTYSOCv2.0 global model. This site is a 56-year chronosequence of oil palm plantations (with C3 plants) established on former pastures (with C4 plants) located in South America (La Cabaña in Colombia) and sampled as a space-for-time substitution (Quezada et al., 2019).
For each reference site, data on total SOC content in topsoil (0–10 to 0–30 cm depending on the site; Supplement Table S2) were obtained from previously published studies (Barré et al., 2010; Cécillon et al., 2018; Franko and Merbach, 2017; Körschens et al., 1998; Quezada et al., 2019). Total SOC content was measured by dry combustion with an elemental analyser (SOCEA, g C kg−1) according to ISO 10694 (1995) after the removal of soil carbonates using an HCl treatment for the topsoils of Grignon. For the site of La Cabaña, data on 13C content (measured using an isotope ratio mass spectrometer coupled to the elemental analyser, the results being expressed in δ13C abundance ratio, which is ‰ relative to the international standard) were obtained from Quezada et al. (2019), and the relative contributions of new (C3-plant-derived) and old (C4-plant-derived) carbon to total SOC in topsoils (0–10 cm) were calculated using Eq. (3) of the paper published by Balesdent and Mariotti (1996), as done in Quezada et al. (2019).
Based on these published data, the content of the centennially stable SOC fraction (g C kg−1) at each reference site was estimated by modelling the decline of total SOC present at the onset of the experiment with time (sites with an LTBF treatment; SOC inputs are negligible in bare fallow systems) or by modelling the decline of C4-plant-derived SOC present at the time of vegetation change with time (La Cabaña site; SOC inputs from C4 plants are negligible after pasture conversion to oil palm plantation). For the seven reference sites, the decline in total SOC or C4-plant-derived SOC over time had a similar shape, as shown in Barré et al. (2010), Cécillon et al. (2018), Franko and Merbach (2017), and Quezada et al. (2019), and it could be modelled using a first-order exponential decay with a constant term following Eq. (1):
where γ(t) (g C kg−1) is the total (sites with an LTBF treatment) or C4-plant-derived (La Cabaña site) SOC content at time t, t (year) is the time under bare fallow (sites with an LTBF treatment) or since pasture conversion to oil palm plantation (La Cabaña site), and a, b, and c are fitting parameters. Parameter a (g C kg−1) corresponds to the content of the active SOC fraction and b (yr−1) is the characteristic decay rate. The parameter c (g C kg−1) represents the content of theoretically inert SOC. Following Barré et al. (2010), Cécillon et al. (2018), and Franko and Merbach (2017), we considered this parameter c to be a site-specific metric of the centennially stable SOC fraction content. As already stated in Cécillon et al. (2018), in our view, the centennially stable SOC fraction is not biogeochemically inert; its mean age and mean residence time in soil are both assumed to be high (centuries) though not precisely defined here. As a result, its decline with time is negligible at the timescale of the long-term agricultural experiments and the long-term vegetation change site. We thus considered the centennially stable SOC fraction content at each experimental site to be constant. In this study, we used the centennially stable SOC fraction content already estimated by Franko and Merbach (2017) for the site of Bad Lauchstädt (on the LTBF experiment started in 1988) and by Cécillon et al. (2018) for the sites of Versailles, Grignon, Rothamsted, and Ultuna. We estimated the content of the centennially stable SOC fraction for the Askov and La Cabaña sites using the same Bayesian curve-fitting method described by Cécillon et al. (2018). The Bayesian inference method was performed using Python 2.7 and the PyMC library (Patil et al., 2010).
For the second version of PARTYSOC, we aimed at reducing the potential bias towards an overestimation of the centennially stable SOC fraction content at reference sites using Eq. (1) (Supplement Table S1). This overestimation is possible at reference sites with an LTBF treatment, as SOC inputs to bare fallow topsoils are low but not null (e.g. Jenkinson and Coleman, 1994; Petersen et al., 2005). Similarly, C4-plant-derived SOC inputs are possible after conversion to C3 plants at the site of La Cabaña. We thus used the lowest observed total (sites with an LTBF treatment) or C4-plant-derived (La Cabaña site) topsoil SOC content value as the best estimate of the centennially stable SOC fraction content at reference sites where this measured value was lower than the fitted value of the site-specific parameter c in Eq. (1).
2.2 Rock-Eval® thermal analysis of topsoil samples available from reference sites
Surface soil samples (0–10 to 0–30 cm depending on the site; see Supplement Table S2) were obtained from the seven reference sites described in Sect. 2.1. As described in Cécillon et al. (2018), the first version of the PARTYSOC model was based on a set of 118 topsoil samples corresponding to time series obtained from the soil archives of the sites of Rothamsted (12 samples from the LTBF treatment and 8 samples from the adjacent long-term grassland treatment), Ultuna (23 samples from the LTBF treatment and 11 samples from the associated long-term cropland treatments), Grignon (12 samples from the LTBF treatment, 6 samples from the LTBF plus straw amendment treatment, and 6 samples from the LTBF plus composted straw amendment treatment), and Versailles (20 samples from the LTBF treatment and 20 samples from the LTBF plus manure amendment treatment). All 118 topsoil samples were previously analysed using Rock-Eval® thermal analysis (Cécillon et al., 2018).
For the second version of the machine-learning model, 78 additional topsoil samples were provided by managers of the three new reference sites. A total of 35 topsoil samples were obtained from the soil archives of the Askov site (19 samples corresponding to different dates of the LTBF treatment and 16 samples corresponding to different dates of the associated long-term cropland treatments). A total of 27 topsoil samples were obtained from the soil archives of the Bad Lauchstädt site (8 samples from two dates of the mechanical LTBF treatment, 8 samples from two dates of the chemical LTBF treatment, and 11 samples from two dates of several long-term cropland treatments of the static fertilization experiment, with 8 of the latter coming from treatments with manure applications). A total of 16 topsoil samples were obtained from the site of La Cabaña (13 samples from different C3-plant oil palm fields planted at different dates and three samples from different long-term C4-plant pastures).
The 78 additional topsoil samples from Askov, Bad Lauchstädt, and La Cabaña were analysed using the same Rock-Eval® 6 Turbo device (Vinci Technologies, France; see Behar et al., 2001, for a description of the apparatus) and the same setup as the one used for the sample set in the first version of PARTYSOC, described by Cécillon et al. (2018). Briefly, ca. 60 mg of ground (< 250 µm) topsoil samples were subjected to sequential pyrolysis and oxidation phases. The Rock-Eval® pyrolysis phase was carried out in an N2 atmosphere (3 min isotherm at 200 ∘C followed by a temperature ramp from 200 to 650 ∘C at a heating rate of 30 ∘C min−1). The Rock-Eval® oxidation phase was carried out in a laboratory air atmosphere (1 min isotherm at 300 ∘C followed by a temperature ramp from 300 to 850 ∘C at a heating rate of 20 ∘C min−1 and a final 5 min isotherm at 850 ∘C). Each Rock-Eval® analysis generated five thermograms corresponding to volatile hydrocarbon effluent (HC_PYR thermogram), CO (CO_PYR thermogram), and CO2 (CO2_PYR thermogram) measured each second during the pyrolysis phase and to CO (CO_OX thermogram) and CO2 (CO2_OX thermogram) measured each second during the oxidation phase (Behar et al., 2001).
A series of Rock-Eval® parameters was calculated from these five thermograms. For each thermogram, five temperature parameters (all in ∘C) were retained: T10, T30, T50, T70, and T90, which respectively represent the temperatures corresponding to the evolution of 10 %, 30 %, 50 %, 70 %, and 90 % of the total amount of evolved gas. The calculation of Rock-Eval® temperature parameters was performed using different intervals of integration depending on the thermogram. The integration omitted the first 200 s of the analysis for the three thermograms of the pyrolysis phase. The integration ended at the time of analysis corresponding to the maximum oven temperatures of 650 ∘C (HC_PYR thermogram), 560 ∘C (CO_PYR and CO2_PYR thermograms), 850 ∘C (CO_OX thermogram), and 611 ∘C (CO2_OX thermogram). These intervals of integration prevented any interference by inorganic carbon from most soil carbonates, and they ensured comparability with previous studies (Barré et al., 2016; Cécillon et al., 2018; Poeplau et al., 2019; Soucémarianadin et al., 2018b). Automatic baseline correction (as calculated by the software of the Rock-Eval® apparatus; Vinci Technologies, France) was performed for all thermograms but the CO_PYR and the CO2_PYR thermograms. This correction can yield some negative values for the CO_PYR and CO2_PYR thermograms of soil samples with very low SOC content (data not shown). For the HC_PYR thermogram we also determined three parameters reflecting a proportion of thermally resistant or labile hydrocarbons: a parameter representing the proportion of hydrocarbons evolved between 200 and 450 ∘C (thermolabile hydrocarbons, TLHC index, unitless; modified from Saenger et al., 2013, 2015), as described by Cécillon et al. (2018); a parameter representing the preservation of thermally labile hydrocarbons (I index, unitless; after Sebag et al., 2016); and a parameter representing the proportion of hydrocarbons thermally stable at 400 ∘C (R index, unitless; after Sebag et al., 2016). We also considered the hydrogen index (HI, mg HC g−1 C) and oxygen index (OIRE6, mg O2 g−1 C) that respectively describe the relative elemental hydrogen and oxygen enrichment of soil organic matter (see e.g. Barré et al., 2016). These 30 Rock-Eval® parameters are not directly related to total SOC content and were all included in the first version of the PARTYSOC model developed by Cécillon et al. (2018).
In this second version of PARTYSOC, we considered 10 additional Rock-Eval® parameters as possible predictors, some of these being directly linked to SOC content (Supplement Table S1). These 10 parameters were calculated for all 196 topsoil samples available from the seven reference sites. They included the content of SOC as determined by Rock-Eval® (TOCRE6, g C kg−1); the content of soil inorganic carbon as determined by Rock-Eval® (MinC, g C kg−1); the content of SOC evolved as HC, CO, or CO2 during the pyrolysis phase of Rock-Eval® (PC, g C kg−1); the content of SOC evolved as HC during the temperature ramp (200–650 ∘C) of the pyrolysis phase of Rock-Eval® (S2, g C kg−1); the content of SOC that evolved as HC, CO, or CO2 during the first 200 s of the pyrolysis phase (at ca. 200 ∘C) of Rock-Eval® (PseudoS1, g C kg−1; after Khedim et al., 2021); the ratio of PseudoS1 to PC (PseudoS1 PC, unitless); the ratio of PseudoS1 to TOCRE6 (PseudoS1 TOCRE6, unitless); the ratio of S2 to PC (S2 PC, unitless; after Poeplau et al., 2019); the ratio of PC to TOCRE6 (PC TOCRE6, unitless); and the ratio of HI to OIRE6 (HI OIRE6, mg HC mg−1 O2). TOCRE6, MinC, PC, HI, and OIRE6 were obtained as default parameters from the software of the Rock-Eval® apparatus (Vinci Technologies, France). All other Rock-Eval® parameters were calculated from the integration of the five thermograms using R version 4.0.0 (R Core Team, 2020; RStudio Team, 2020) and functions from the R packages hyperSpec (Beleites and Sergo, 2020), pracma (Borchers, 2019), and stringr (Wickham, 2019).
2.3 Determination of the centennially stable SOC fraction proportion in topsoil samples from the reference sites
Following the first version of PARTYSOC (Cécillon et al., 2018), the proportion of the centennially stable SOC fraction in a topsoil sample of a reference site was calculated as the ratio of the site-specific centennially stable SOC fraction content (see Sect. 2.1) to the SOC content of this particular sample. We thus assume that the centennially stable SOC fraction content in topsoils is the same in the various agronomical treatments of a reference site and that it remains constant within the time period studied at each site.
While for the first version of PARTYSOC, the proportion of the centennially stable SOC fraction in reference topsoils was inferred using SOC contents determined by elemental analysis (SOCEA), in this second version, we preferred the SOC content determined by Rock-Eval® (Table S1). The reason behind this choice was to link the Rock-Eval® parameters measured in a reference topsoil sample to an inferred proportion of the centennially stable SOC fraction that better reflected the organic carbon that actually evolved during its Rock-Eval® analysis. This choice was possible for reference topsoil samples for which Rock-Eval® analyses showed a good organic carbon yield (TOCRE6 divided by SOCEA and multiplied by 100). This is generally the case for most soils, with typical organic carbon yields from Rock-Eval® ranging from 90 to 100 % SOCEA (Disnar et al., 2003). For the topsoils of the sites of Grignon, Rothamsted, Ultuna, and Versailles used in the first version of PARTYSOC, the organic carbon yield from Rock-Eval® was greater than 96 % (linear regression model, R2 = 0.97, n=118; Cécillon et al., 2018). Similarly, Rock-Eval® analyses of topsoil samples from the site of La Cabaña showed very good organic carbon yields (95 % on average, linear regression model R2 = 0.95, n=16). For these five reference sites (corresponding to 134 reference topsoil samples), we thus used the Rock-Eval® parameter TOCRE6 as a measure of the SOC content of topsoil samples to calculate their respective proportion of the centennially stable SOC fraction. Conversely, Rock-Eval® analyses of topsoil samples from the sites of Askov and Bad Lauchstädt showed moderate organic carbon yields (90 % on average for topsoils of Askov, with a noisy linear regression model, R2 = 0.68, n = 30; 92 % on average for topsoils of Bad Lauchstädt, yet with a very good linear regression model, R2 = 0.96, n = 11). Using the total carbon measured by Rock-Eval® (i.e. the sum of TOCRE6 plus MinC Rock-Eval® parameters) as an estimate of the SOC content of topsoil samples for these two sites – that are not carbonated – increased the organic carbon yield of Rock-Eval® analyses (96 % on average at Askov, still with a noisy linear regression model, R2 = 0.66, n = 30; 101 % on average at Bad Lauchstädt, with a very good linear regression model, R2 = 0.95, n = 11). For the two reference sites of Askov and Bad Lauchstädt (corresponding to 62 topsoil samples), we thus used the sum of Rock-Eval® parameters TOCRE6 plus MinC as a measure of the SOC content of topsoil samples to calculate their proportion of the centennially stable SOC fraction.
The uncertainty in the proportion of the centennially stable SOC fraction was calculated using Eq. (6) in the paper published by Cécillon et al. (2018), propagating the uncertainties in SOC content data (using a standard error of 0.5 g C kg−1 following Barré et al., 2010) and in the site-specific contents of the centennially stable SOC fraction (see above and Table 1).
Table 1Main statistics for soil organic carbon contents, site-specific contents of the centennially stable SOC fraction, and resulting proportions of centennially stable SOC fraction in topsoils of the seven reference sites used as the training sets for PARTYSOCv2.0 and PARTYSOCv2.0EU. More details on agronomical treatments and sampling year of reference topsoil samples are provided in Supplement Table S3. Abbreviations are as follows. SOC: soil organic carbon; LTBF: long-term bare fallow; min: minimum; max: maximum; SD: standard deviation.

2.4 Selection of the training set and of meaningful Rock-Eval® predictor variables for PARTYSOCv2.0
In machine learning, the selection of the model training and test sets influences the performance of the model, just like the selection of the predictor variables: here, the Rock-Eval® parameters (e.g. Cécillon et al., 2008; Wehrens, 2020).
For this second version of PARTYSOC, we changed some criteria regarding the inclusion of the available reference topsoil samples in the training set of the model (Supplement Table S1). We excluded from the training set all the topsoil samples experiencing agronomical treatments that may have changed the site-specific content of the centennially stable SOC fraction, in contradiction to our hypothesis of a constant content of this fraction at each reference site (see Sect. 2.3). These agronomical treatments concern the repeated application of some types of exogenous organic matter such as compost or manure, which we suspect may increase the content of the centennially stable SOC fraction after several decades. Therefore, we excluded all reference topsoil samples from plots that experienced repeated applications of composted straw (six samples from Grignon) or manure (20 samples from Versailles and 8 samples from Bad Lauchstädt) from the training set of the model. Yet, we kept some reference topsoil samples from Grignon and Ultuna experiencing repeated applications of straw.
We also excluded from the training set of the model the reference topsoil samples for which the organic carbon yield from Rock-Eval® is below 86 % or above 116 %. For the site of Askov, with a noisy relationship between SOCEA and the sum TOCRE6 plus MinC (see Sect. 2.3), we excluded the five samples without an SOCEA measurement preventing the calculation of the organic carbon yield from their Rock-Eval® analysis. Conversely, for the site of Bad Lauchstädt we kept topsoil samples without available SOCEA measurements, as the linear relationship between SOCEA and the sum TOCRE6 plus MinC was very good for this site (see Sect. 2.3). These criteria regarding the organic carbon yield from Rock-Eval® lead to the exclusion of nine samples from the site of Askov, four additional samples from the site of Versailles, and two from the site of Ultuna.
Contrary to the first version of PARTYSOC, this second version is based on a balanced contribution of each reference site (Supplement Table S1). Each reference site contributes to the model with 15 samples so that the reference sample set of PARTYSOCv2.0 is composed of 105 topsoil samples (90 for the European version of the model PARTYSOCv2.0EU). Besides the above-mentioned exclusion criteria (that excluded 49 of the 196 topsoil samples available from the seven reference sites), the 15 topsoil samples retained for each reference site were selected (1) to have a range of the proportion of the centennially stable SOC fraction as wide as possible and (2) to have the best organic carbon yield from Rock-Eval® analysis. On average, the organic carbon yield of the Rock-Eval® analyses for the retained training set of reference topsoil samples (calculated as described above) was greater than 98 % SOCEA (SOCDETERMINED_BY_ROCK-EVAL®=0.9924 SOCEA−0.1051, R2 = 0.99, n = 91 topsoil samples with available SOCEA measurements). The list of the 105 reference topsoil samples retained as the training set for PARTYSOCv2.0 is provided in Table S3. This list includes, for each reference topsoil sample, information on its reference site, land cover, agronomical treatment, sampling year, and values for the 40 Rock-Eval® parameters.
The 40 Rock-Eval® parameters calculated (see Sect. 2.2) captured most of the information related to SOC thermal stability, elemental stoichiometry, and content that is contained in the five Rock-Eval® thermograms. However, not all Rock-Eval® parameters necessarily carry meaningful information for partitioning SOC into its centennially stable and active fractions (Cécillon et al., 2018). PARTYSOCv2.0 and its European version PARTYSOCv2.0EU incorporate as predictor variables only the Rock-Eval® parameters showing a strong relationship with the proportion of the centennially stable SOC fraction (Supplement Table S1). The absolute value of 0.50 for the Spearman's ρ (nonparametric and nonlinear correlation test) was used as a threshold to select meaningful Rock-Eval® predictor variables (calculated from the reference topsoil sample set for the PARTYSOCv2.0 model, n = 105). Basic statistics of all Rock-Eval® parameters (training set for PARTYSOCv2.0) are reported in Supplement Table S4.
2.5 Random forest regression models to predict the proportion of the centennially stable SOC fraction from Rock-Eval® parameters, performance assessment, and error propagation in the models
The PARTYSOCv2.0 machine-learning model consists of a nonparametric and nonlinear multivariate regression model relating the proportion of the centennially stable SOC fraction (response vector or dependent variable y) of the reference soil sample set (n = 105 topsoil samples from the seven reference sites; see Sect. 2.4) to their Rock-Eval® parameters summarized by a matrix of predictor variables (X) made up of the selected centred and scaled Rock-Eval® parameters. As stated above, we also built a regional (European) version of the model based on the six European reference sites only (PARTYSOCv2.0EU, using the 90 reference topsoil samples from Askov, Bad Lauchstädt, Grignon, Rothamsted, Ultuna, and Versailles).
Like the first version of PARTYSOC, this second version uses the machine-learning algorithm of random forests–random inputs (hereafter termed random forests) proposed by Breiman (2001). This algorithm aggregates a collection of random regression trees (Breiman, 2001; Genuer and Poggi, 2020). PARTYSOCv2.0 and its European version PARTYSOCv2.0EU are based on a forest of 1000 different regression trees made of splits and nodes. The algorithm of random forests combines bootstrap resampling and random variable selection. Each of the 1000 regression trees was grown on a bootstrapped subset of the reference topsoil sample set (i.e. containing ca. two-thirds of “in-bag” samples). The algorithm randomly sampled one-third of the selected Rock-Eval® parameters (see Sect. 2.4) as candidates at each split of the regression tree, and it used a minimum size of terminal tree nodes of five topsoil samples. The relative importance (i.e. ranking) of each selected Rock-Eval® parameter in the regression models was computed as the unscaled permutation accuracy (Strobl et al., 2009).
The performance of PARTYSOCv2.0 and PARTYSOCv2.0EU was assessed by statistical metrics comparing the predicted vs. the estimated values of their reference topsoil sample set using three complementary validation procedures. First, the predictive ability of both models was assessed by an “internal” procedure that used their respective whole reference topsoil sample sets (n = 105 samples for PARTYSOCv2.0, n = 90 samples for PARTYSOCv2.0EU). For this procedure, performance statistics were calculated only for the “out-of-bag” topsoil samples of the whole reference sets using a random seed of 1 to initialize the pseudorandom number generator of the R software. Out-of-bag samples are observations from the training set not used for a specific regression tree that can be used as a “built-in” test set for calculating its prediction accuracy (Strobl et al., 2009). Second, the predictive ability of the models was assessed by a “random splitting” procedure that randomly split their respective reference topsoil sample sets into a test set (made of n = 30 samples) and a training set (n = 75 samples for PARTYSOCv2.0, n = 60 samples for PARTYSOCv2.0EU). This procedure was repeated 15 times using random seeds from 1 to 15 in the R software. Third, a fully independent “leave-one-site-out” procedure was used to assess the predictive ability of the models. This procedure successively excludes topsoil samples of one reference site from the training set and uses them as a test set (n = 15) for the models. It used the random seed of 1 in the R software. For the second and third procedures, performance statistics were calculated (1) for the out-of-bag topsoil samples of the training sets and (2) for the topsoil samples of the test sets. The leave-one-site-out validation should be seen as the procedure giving the most accurate estimation of the uncertainty of both regression models for unknown topsoil samples.
Finally, we assessed the sensitivity of model performance to the training and the test sets. For both sensitivity analyses, only the leave-one-site-out validation procedure was used (based exclusively on independent training and test sets). First, model sensitivity to the training set was assessed as its sensitivity to the independent reference sites included in the training set. It was performed successively using, as examples, two different test sets consisting of independent soils from the reference sites of Grignon and Versailles. Several random forest regression models were built using, as training sets, combinations of topsoil samples from a decreasing number of the remaining reference sites on the basis of their potential proximity to the topsoil samples of the test sets regarding their pedological or climatic conditions. The size of the various training sets ranged from n = 90 samples (six reference sites) to n = 30 samples (only two reference sites). Second, model sensitivity to the test set was assessed as its sensitivity to independent test samples (1) from a reference soil group (FAO, 2014) not existing in the training set (i.e. excluding Chernozem soil samples from the test set) (2) that are unlikely to be encountered in agricultural soils (i.e. excluding from the test set soils sampled at late dates of bare fallow treatments more than 25 years after the experiment onset, which cannot represent soils with regular carbon input). Model sensitivity to the test set was performed only for PARTYSOCv2.0EU to further investigate its predictive ability for soil samples from independent Cambisols and Luvisols of northwestern Europe.
Several statistics were used to assess the predictive ability of the regression models. The coefficient of determination, , was calculated for the out-of-bag samples of the training set, and R2 was calculated for the samples of the test set. The root mean square error of prediction, RMSEPOOB, was calculated for the out-of-bag samples of the training set, and RMSEP was calculated for the samples of the test set. The relative RMSEP, RRMSEP, was calculated as the ratio of the RMSEP to the mean value of the test set. The ratio of performance to interquartile range (RPIQ) was calculated as the ratio of the interquartile range of the test set (Q3–Q1, which gives the range accounting for 50 % of the test set around its median value) to the RMSEP (Bellon-Maurel et al., 2010). The bias of the random forest regression models was calculated as the mean of the model predictions for the test set minus the actual mean of the test set. Additionally, site-specific RMSEP and RRMSEP were calculated for the leave-one-site-out procedure (with the 15 independent test samples from each site). The uncertainty in the model predictions for new topsoils was determined using a methodology that was fully described by Cécillon et al. (2018). This methodology was adapted after the work of Coulston et al. (2016) to explicitly take into account the uncertainty in the reference values of the proportion of the centennially stable SOC fraction (see Sect. 2.3) that were used to build the models (Cécillon et al., 2018).
PARTYSOCv2.0 and PARTYSOCv2.0EU were programmed as R scripts in the RStudio environment software (RStudio Team, 2020) and were run using the R version 4.0.0 (R Core Team, 2020). The R scripts use the random forest algorithm of the randomForest R package (Liaw and Wiener, 2002) and the boot R package for bootstrapping (Canty and Ripley, 2020; Davison and Hinkley, 1997).
3.1 Content of the centennially stable SOC fraction at the reference sites
The two newly fitted values of the centennially stable SOC fraction content (i.e. parameter c in Eq. 1; see Sect. 2.1) were 5.10 g C kg−1 at the site of Askov (SD = 0.88 g C kg−1) and 5.12 g C kg−1 at the site of La Cabaña (SD = 0.35 g C kg−1). The fitted values of parameter c in Eq. (1) for all reference sites and their standard errors are provided in Supplement Table S2. A total (reference sites with an LTBF treatment) or a C4-plant-derived (La Cabaña site) SOC content value lower than the fitted value of the site-specific parameter c in Eq. (1) was measured at four of the seven reference sites for the PARTYSOCv2.0 model. At Bad Lauchstädt, an SOCEA value of 15.0 g C kg−1 was reported by Körschens et al. (1998) for topsoils of the well ring experiment (Ansorge, 1966). At Rothamsted, an SOCEA measurement of 9.72 g C kg−1 was reported for topsoils of the Highfield LTBF experiment by Cécillon et al. (2018). At Versailles, an SOCEA measurement of 5.50 g C kg−1 was reported after 80 years of bare fallow by Barré et al. (2010). At La Cabaña, a C4-plant-derived SOC content of 4.75 g C kg−1 was calculated using data from Quezada et al. (2019). These values did not differ strongly from the values of the centennially stable SOC contents calculated from the Bayesian curve-fitting method (Tables 1, S2). In particular, the hierarchy in the centennially stable SOC content of the seven reference sites was unchanged whatever the calculation method. These values were retained as the best estimates of the site-specific content of the centennially stable SOC fraction in topsoils of the four sites to reduce the risk of overestimating the actual value of the centennially stable SOC content compared to the first published version of the model (see Sect. 2.1; Tables 1 and S1). As these site-specific values of the centennially stable SOC fraction content were derived from SOCEA measurements, we attributed a standard deviation of 0.50 g C kg−1 to each of them following Barré et al. (2010). The final estimates of the content of the centennially stable SOC fraction at the seven reference sites that were used in PARTYSOCv2.0 are provided in Table 1. They varied by a factor of 3 across the reference sites, ranging from 4.75 g C kg−1 at La Cabaña to 15.00 g C kg−1 at Bad Lauchstädt. The lowest value of the topsoil content of the centennially stable SOC fraction used in PARTYSOCv2.0EU differed only slightly from the one of PARTYSOCv2.0 (5.10 g C kg−1 at the site of Askov).
3.2 Content and biogeochemical stability of SOC in the training sets and selection of meaningful Rock-Eval® parameters as predictor variables for the PARTYSOCv2.0 and PARTYSOCv2.0EU models
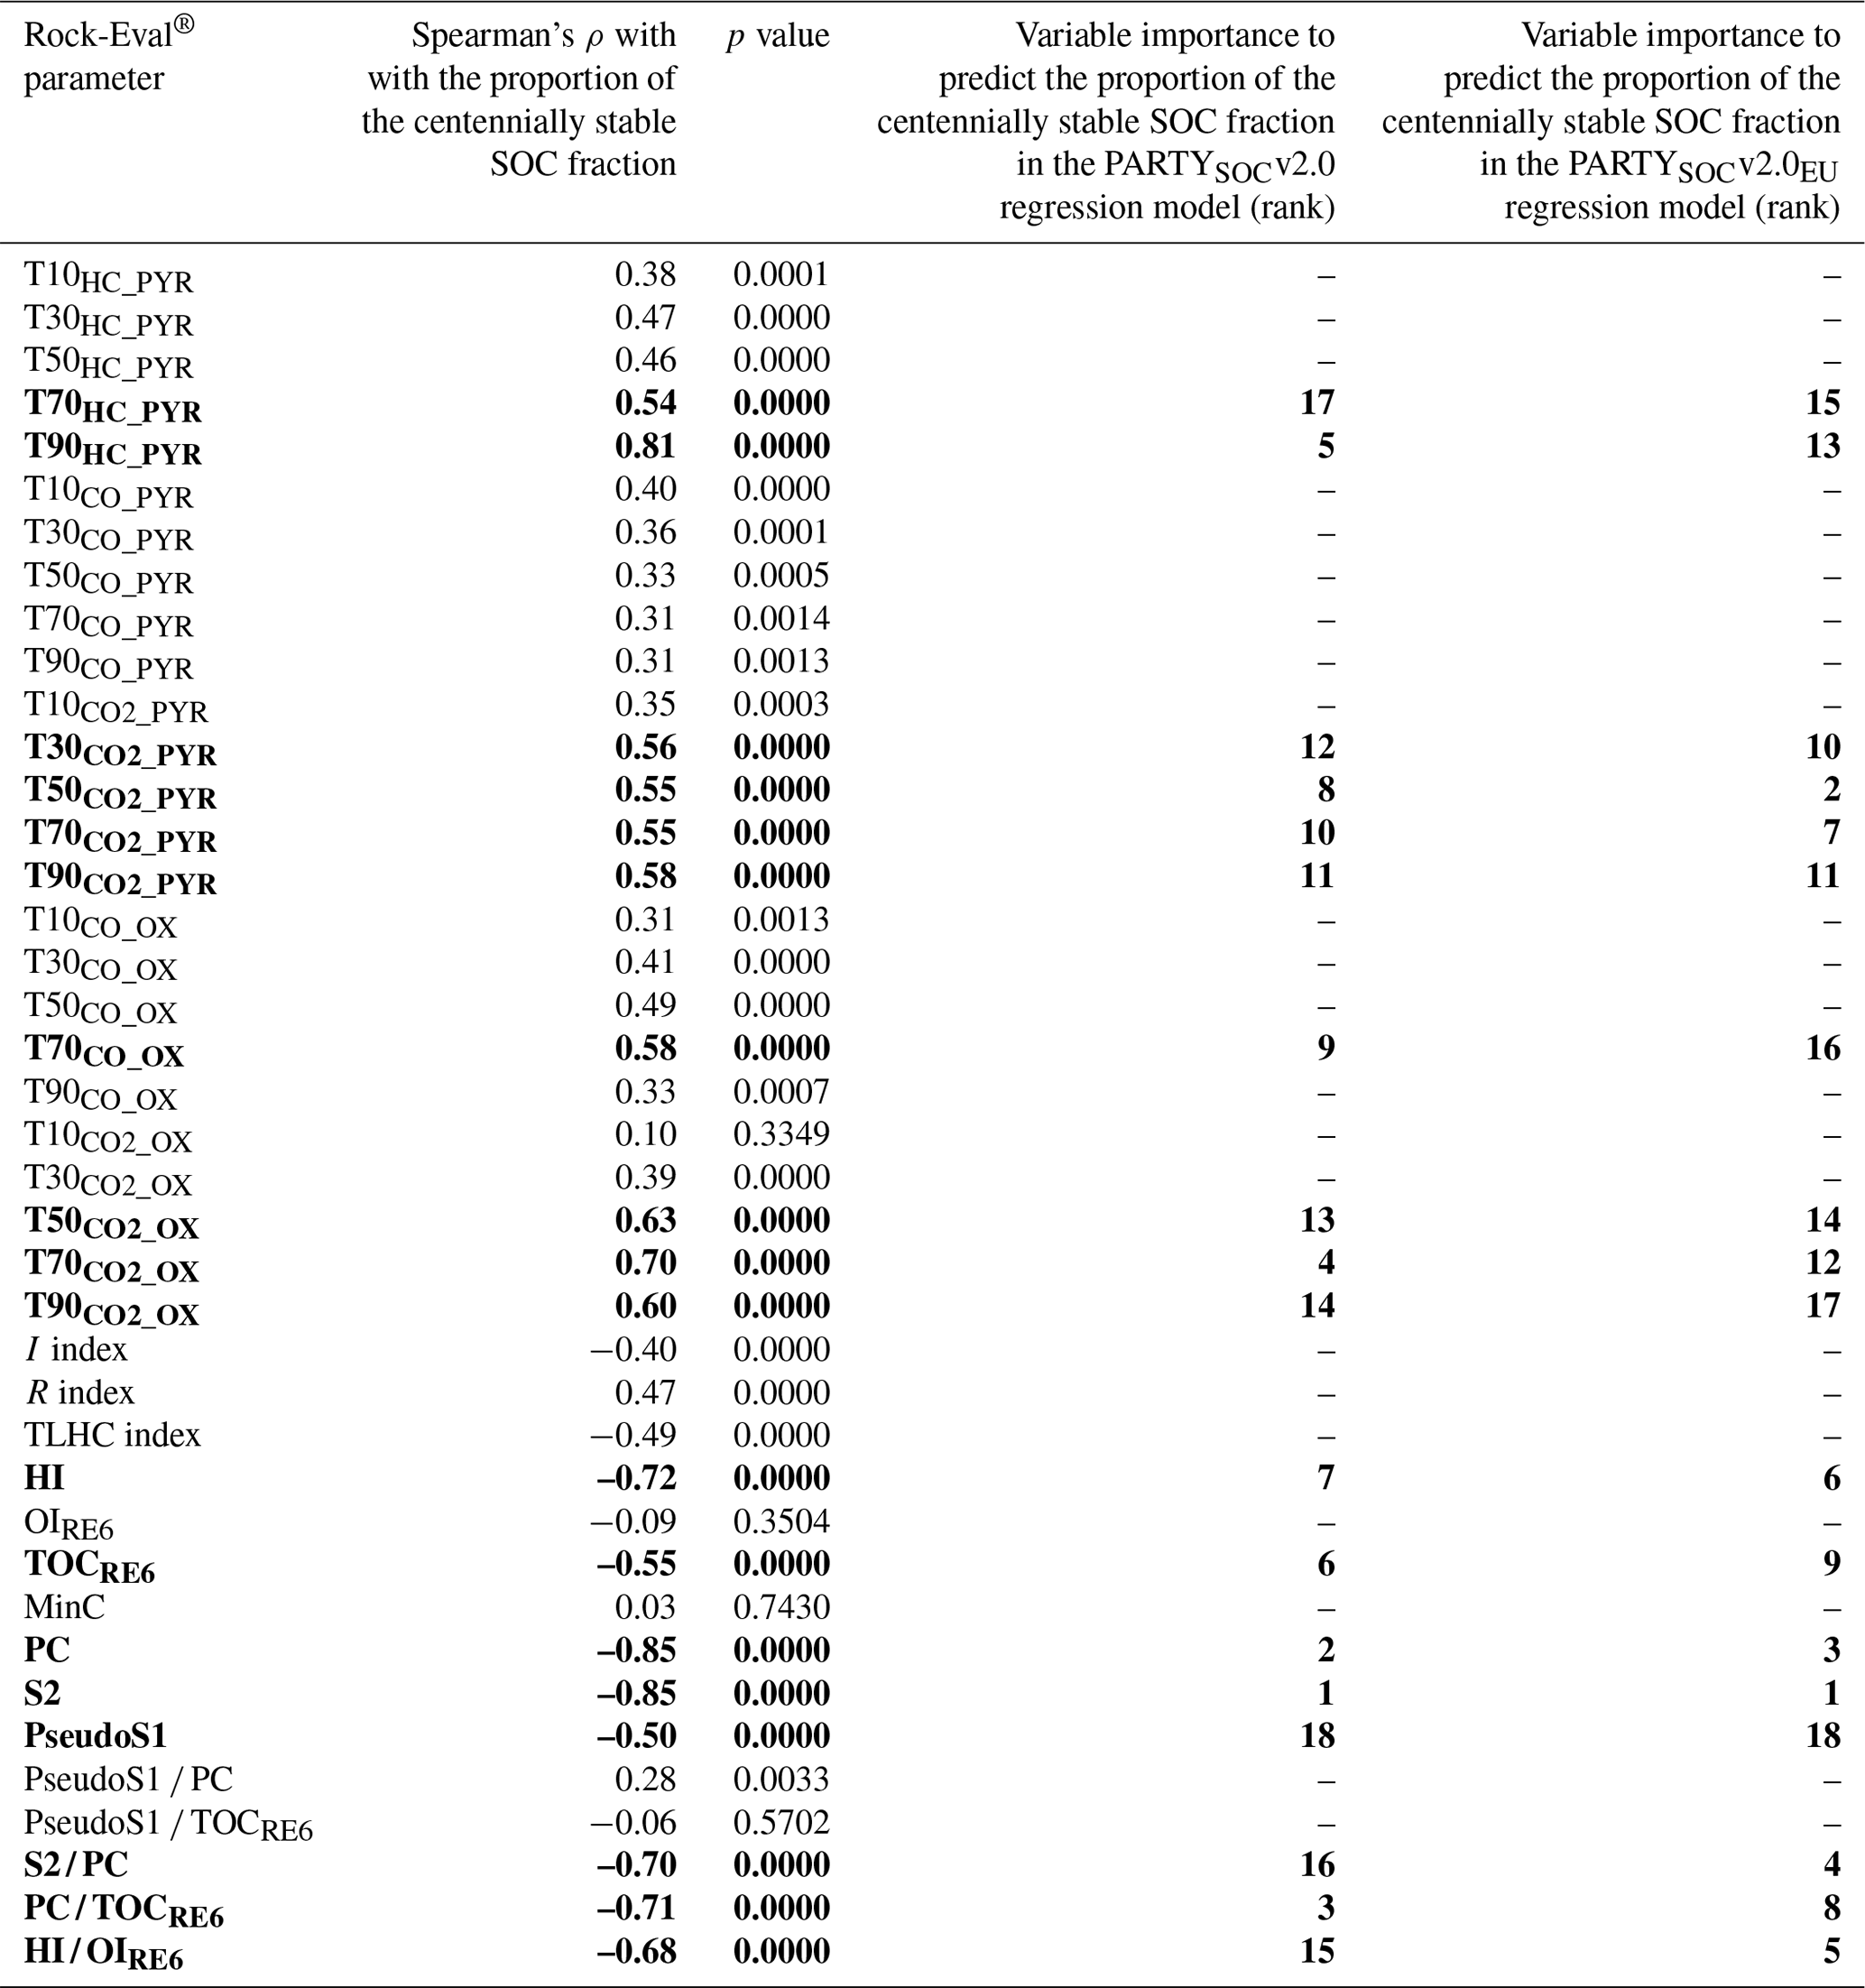
The SOC content in the topsoil samples of the seven reference sites ranged from 5.6 to 41.5 g C kg−1 in the training sets for the PARTYSOCv2.0 (n = 105) and PARTYSOCv2.0EU (n = 90) models (Table 1). As shown in Table 1, this resulted in proportions of the centennially stable SOC fraction ranging from 0.15 to 0.98 (PARTYSOCv2.0 training set) and from 0.23 to 0.98 (PARTYSOCv2.0EU training set). All 25 calculated Rock-Eval® temperature parameters showed positive values of Spearman's ρ coefficient with the response variable of the PARTYSOCv2.0 model (n = 105; with Spearman's ρ values up to 0.81 for T90HC_PYR; Table 2). While the inorganic carbon content was not correlated with the proportion of the centennially stable SOC fraction, TOCRE6 was significantly and negatively correlated with the response variable of the PARTYSOCv2.0 model (Spearman's ρ = −0.55; Table 2). Other Rock-Eval® parameters linked to soil carbon content showed a stronger relationship than TOCRE6 with the proportion of the centennially stable SOC fraction. This was the case for S2 and PC that showed the highest absolute Spearman's ρ coefficients, with a highly significant negative relationship (Spearman's ρ = −0.85; Table 2). A total of 18 of the 40 calculated Rock-Eval® parameters showed an absolute value of Spearman's ρ above 0.5 with the proportion of the centennially stable SOC fraction in the training set of the PARTYSOCv2.0 model (n = 105; Table 2) and were thus retained as predictor variables for the models. The 18 Rock-Eval® parameters retained were the Rock-Eval® temperature parameters T70HC_PYR, T90HC_PYR, T30CO2_PYR, T50CO2_PYR, T70CO2_PYR, T90CO2_PYR, T70CO_OX, T50CO2_OX, T70CO2_OX, and T90CO2_OX and the Rock-Eval® parameters PseudoS1, S2, S2 PC, HI, HI OIRE6, PC, PC TOCRE6, and TOCRE6.
Table 2Spearman's rank correlation coefficient test between the 40 calculated Rock-Eval® parameters and the proportion of the centennially stable organic carbon fraction in the reference topsoil sample set of the PARTYSOCv2.0 model (n = 105), with the variable importance (ranking) of the 18 selected Rock-Eval® parameters for predicting the proportion of the centennially stable SOC fraction in the PARTYSOCv2.0 and PARTYSOCv2.0EU random forest regression models. See Sect. 2.2 for a description of the units of the 40 Rock-Eval® parameters. The 18 Rock-Eval® parameters retained as predictor variables for the second version of PARTYSOC are shown in bold. SOC: soil organic carbon.
3.3 Performance assessment of the PARTYSOCv2.0 and PARTYSOCv2.0EU machine-learning models
Using both the internal and the random splitting performance assessment procedures (see Sect. 2.5), the PARTYSOCv2.0 and PARTYSOCv2.0EU models showed good to very good predictive ability for the proportion of the centennially stable SOC fraction (Fig. 2a; Table 3a). For most of the calculated statistics, the European version of the model PARTYSOCv2.0EU showed better performance than the PARTYSOCv2.0 model (Table 3). Using the random splitting procedure, the mean R2 of PARTYSOCv2.0EU was 0.87 (0.81 for PARTYSOCv2.0); its RMSEP and RRMSEP were respectively 0.07 and 0.13 (0.09 and 0.17 for PARTYSOCv2.0), and its mean RPIQ was 4.6 (3.6 for PARTYSOCv2.0). The bias was low for both models (Table 3a).
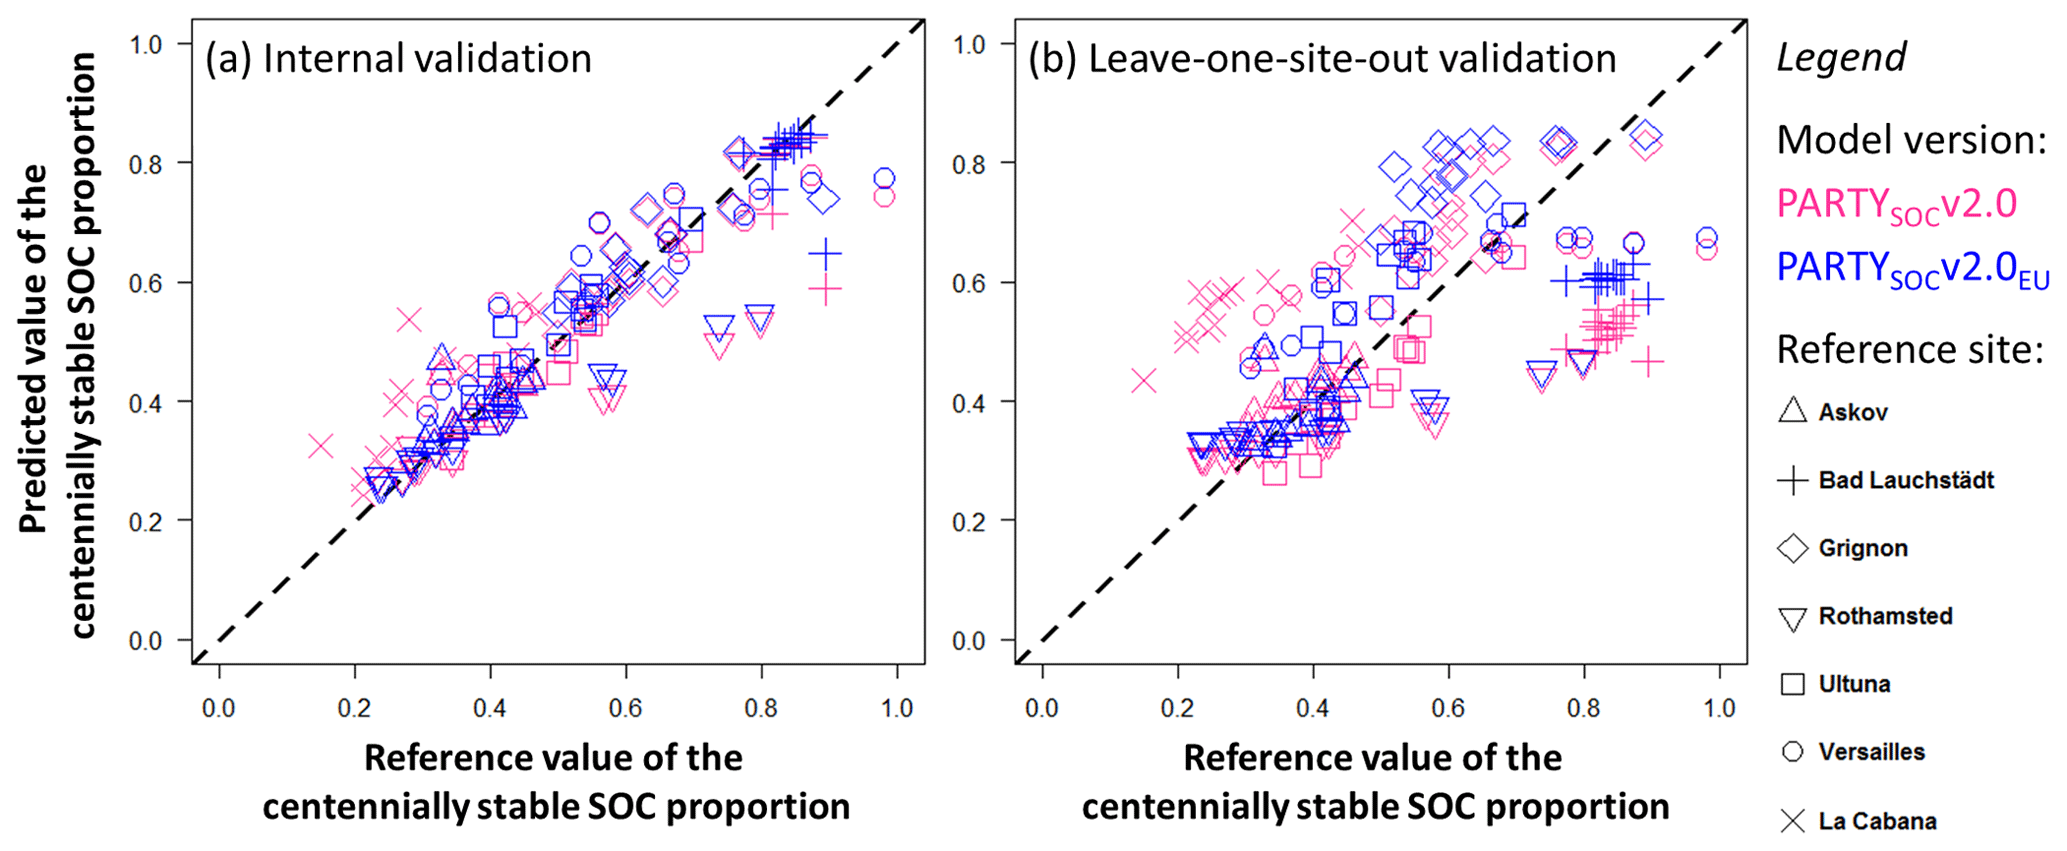
Figure 2Performance of PARTYSOCv2.0 and PARTYSOCv2.0EU machine-learning models based on Rock-Eval® thermal analysis for predicting the centennially stable organic carbon proportion in topsoils. (a) Results of the internal validation procedure. (b) Results of the leave-one-site-out validation procedure (see Sect. 2.5 for more details on model performance assessment). SOC: soil organic carbon.
The predictive ability of both models decreased when assessed using the leave-one-site-out procedure (see Sect. 2.5; Fig. 2b). Again, PARTYSOCv2.0EU showed better performance statistics than the PARTYSOCv2.0 model (Table 3; Fig. 2b), with an R2 of 0.45, an RMSEP of 0.15, an RRMSEP of 0.27, and an RPIQ of 2.4. The PARTYSOCv2.0 model poorly predicted the proportion of the centennially stable SOC fraction in topsoil samples of two sites (Table 3b; Fig. 2b): La Cabaña (overestimation; with a site-specific RMSEP of 0.28) and Bad Lauchstädt (underestimation; with a site-specific RMSEP of 0.32). The proportion of the centennially stable SOC fraction in topsoil samples of Bad Lauchstädt remained underestimated by the PARTYSOCv2.0EU model, though with a reduced site-specific RMSEP (0.23; Table 3b; Fig. 2b). All other site-specific RMSEPs were below 0.18 (0.17 at Versailles for PARTYSOCv2.0, 0.18 at Grignon for PARTYSOCv2.0EU; Table 3b), with remarkably low site-specific RMSEPs for the sites of Askov (below 0.05 for both models) and Ultuna (0.06 for PARTYSOCv2.0; 0.09 for PARTYSOCv2.0EU).
The most important Rock-Eval® parameter for predicting the proportion of the centennially stable SOC fraction is S2 for both PARTYSOCv2.0 and PARTYSOCv2.0EU (Table 2). Conversely, the two models show only two Rock-Eval® parameters in common of their five most important ones: S2, PC, PC TOCRE6, T70CO2_OX, and T90HC_PYR for PARTYSOCv2.0 and S2, T50CO2_PYR, PC, S2 PC, and HI OIRE6 for PARTYSOCv2.0EU (Table 2).
Table 3Performance of the PARTYSOCv2.0 and PARTYSOCv2.0EU random forest regression models based on Rock-Eval® thermal analysis for predicting the proportion of the centennially stable organic carbon fraction in topsoils. (a) Performance statistics calculated for the internal, random splitting (mean statistics of 15 different models), and leave-one-site-out validation procedures. (b) Site-specific performance statistics calculated for the leave-one-site-out validation procedure. The performance statistics and their abbreviations are defined at Sect. 2.5.

3.4 Sensitivity of model performance to the training and test sets
The sensitivity analysis to the training set showed that restricting the model training set to samples from fewer reference sites with pedoclimatic conditions closer to the ones of a fully independent test site changed its performance (Fig. 3). Removing from the training set a reference site with a climate (i.e. La Cabaña) or a soil group (i.e. Bad Lauchstädt) differing strongly from the independent test sites (here, Grignon and Versailles used as examples) reduced the site-specific RMSEP and RRMSEP of the model (Supplement Table S5). When Grignon or Versailles were used as independent test sites, the model with the best predictive ability (i.e. the lowest site-specific RMSEP and RRMSEP) used a training set composed of 45 topsoil samples from three European reference sites (including the French site with the closest climate, despite its different soil group; Supplement Tables S2 and S5; Fig. 3).
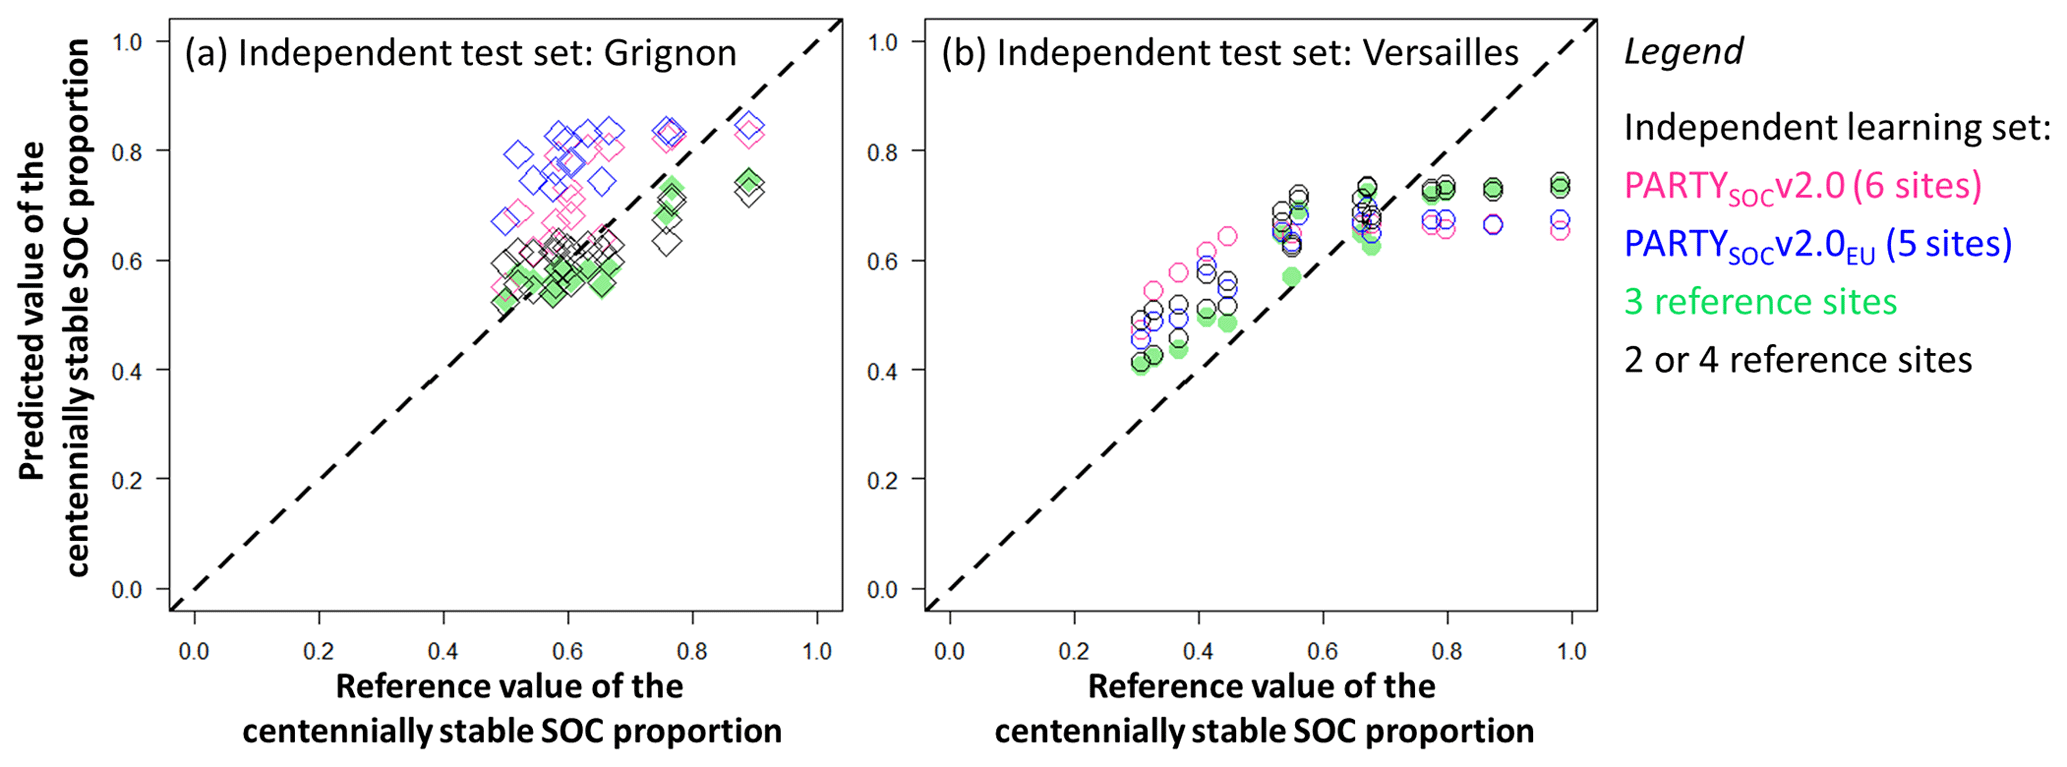
Figure 3Sensitivity of model performance to the reference sites included in the training set using 15 topsoil samples from the sites of (a) Grignon or (b) Versailles as independent test sets. Predictions by models showing the lowest RMSEP and RRMSEP are plotted in green (using a training set composed of three independent reference sites to predict Grignon or Versailles as a test set). See Table S5 for more details on the training sets of the different models and their site-specific performance statistics. SOC: soil organic carbon.
The sensitivity analysis to the test set showed that when excluding Chernozem samples from the test set (i.e. validating the model exclusively with independent samples from Cambisols or Luvisols), the performance statistics of PARTYSOCv2.0EU were improved (leave-one-site-out validation procedure: R2 of 0.56; RMSEP of 0.13; n = 75). The further removal of independent test soils that are unlikely to be encountered in agricultural Cambisols and Luvisols (soils sampled at late dates of bare fallow treatments more than 25 years after the experiment onset) also improved the performance statistics of PARTYSOCv2.0EU (Supplement Fig. S1; leave-one-site-out validation procedure: R2 of 0.71; RMSEP of 0.11; n = 58).
The second version of the PARTYSOC machine-learning model incorporates a large number of modifications and improvements (Table S1), and its predictive ability was more thoroughly assessed compared to the first version of the model (Cécillon et al., 2018). The critical examination of the performance of PARTYSOCv2.0 and PARTYSOCv2.0EU provides new insights (1) on the relationships between Rock-Eval® parameters and the century-scale persistence of SOC and (2) on both the current and potential capabilities of the model to partition the centennially stable and active organic carbon fraction in topsoils. Based on those insights, (3) we plan future developments of the PARTYSOC model to further expand its domain of application while reducing its prediction error.
4.1 Rock-Eval® chemical and thermal information is related to the century-scale persistence of SOC
The methodology used to estimate the centennially stable SOC proportion in reference topsoils has been revised for the second version of the PARTYSOC model (see Sect. 2.1 and 2.3 and Supplement Table S1), and the training set now integrates a wider range of centennially stable SOC contents (4.75–15.00 g C kg−1) with a median value of 6.95 g C kg−1 (n = 7; Table 1). This range covers most of the published size estimates of this fraction in topsoils, estimated using different methods (Balesdent et al., 1988; Barré et al., 2010; Buyanovsky and Wagner, 1998b; Cécillon et al., 2018; Franko and Merbach, 2017; Hsieh, 1992; Huggins et al., 1998; Jenkinson and Coleman, 1994; Körschens et al., 1998; Rühlmann, 1999). The contribution of each reference site to the training set and the inclusion criteria for topsoil samples were also modified, and 10 Rock-Eval® parameters not considered in the first version of the model were proposed as potential predictor variables for this second version of the model (see Sect. 2.2 and 2.4 and Supplement Table S1).
Using this improved design, all Rock-Eval® temperature parameters showed positive values of Spearman's ρ coefficient with the proportion of the centennially stable SOC fraction in topsoils (Table 2), while a few of them showed counterintuitive significant negative correlations using the training set for the first version of PARTYSOC (Cécillon et al., 2018). This confirms the generic link between SOC thermal stability and its in situ biogeochemical stability: centennially stable SOC is thermally stable, even though thermostable SOC fractions are a mixture of centennially stable and active SOC (Fig. 1; Barré et al., 2016; Gregorich et al., 2015; Plante et al., 2013; Sanderman and Grandy, 2020; Schiedung et al., 2017). Some Rock-Eval® temperature parameters were within the five most important predictor variables for both PARTYSOCv2.0 (T70CO2_OX, T90HC_PYR) and PARTYSOCv2.0EU (T50CO2_PYR; Table 2).
Contrary to the first version of PARTYSOC, the second version tested several Rock-Eval® parameters directly linked to soil carbon content as potential predictor variables. TOCRE6 was selected as a meaningful predictor variable for PARTYSOCv2.0 and PARTYSOCv2.0EU. Its negative correlation with the centennially stable SOC proportion (Table 2) was expected, according to the calculation of the latter (see Sect. 2.3). This is in line with results from SOC-dating techniques and with most multi-compartmental models of SOC dynamics, suggesting that the proportion of the most persistent SOC fraction is a decreasing function of total SOC (Huggins et al., 1998; Rühlmann, 1999). Indeed, the ex post optimized initial value of the proportion of the inert SOC fraction for the simple model of SOC dynamics (AMG) is higher (0.60 on average) for SOC-depleted temperate topsoils with a long-term arable history than for SOC-rich temperate topsoils with a long-term grassland history (0.47 on average; Clivot et al., 2019). Contrarily, the empirical function commonly used to initialize the size of the inert SOC fraction of the multi-compartmental RothC model predicts an increased proportion of inert SOC with increased total SOC (Falloon et al., 1998). This empirical function needs to be examined in light of these results.
Interestingly, S2 (pyrolyzable volatile hydrocarbon effluent) and PC (total pyrolyzable organic carbon), two other Rock-Eval® parameters linked to SOC content, showed a stronger negative relationship than TOCRE6 with the proportion of the centennially stable SOC fraction. Both variables are among the three most important predictor variables for PARTYSOCv2.0 and PARTYSOCv2.0EU, while TOCRE6 was ranked sixth or ninth out of the 18 predictor variables (Table 2). Other Rock-Eval® parameters related to the pyrolyzable SOC fraction (PC TOCRE6 and HI, both negatively related to the centennially stable SOC proportion) were also important predictor variables for both models. The results suggest that a simple decreasing function of total SOC content cannot accurately predict the centennially stable SOC proportion in topsoils according to the recent report by Clivot et al. (2019). They also confirm the generic elemental stoichiometry of the centennially stable SOC fraction in that it is consistently depleted in hydrogen (Barré et al., 2016; Gregorich et al., 2015; Poeplau et al., 2019), and they illustrate the usefulness of the pyrolysis step of Rock-Eval® thermal analysis and its volatile hydrocarbon effluent quantification to infer the proportion of the centennially stable SOC fraction in unknown topsoils.
4.2 Capability of the second version of PARTYSOC to partition the centennially stable and active SOC fractions
The training set for the second version of PARTYSOC was significantly diversified compared with the first version. It now represents wider pedoclimatic conditions (Table S2), and it includes one long-term vegetation change site as a reference site (La Cabaña). Reference topsoils from the Colombian site of La Cabaña fit well into the training set of the global model: they did not alter its overall performance, as the root mean square errors of PARTYSOCv2.0 (internal or random splitting validation procedures) are comparable to the ones of the model's first version, in which the content of the centennially stable SOC fraction was inferred exclusively from plant-free soils (Fig. 2a, Table 3; Cécillon et al., 2018). Similarly, the expansion of the training set to new pedoclimates (Supplement Table S2) did not alter the performance of the model when assessed using the internal or random splitting validation procedures (Fig. 2a, Table 3).
The predictive ability of the second version of PARTYSOC was more thoroughly assessed compared to the first version of the model. Specifically, the sensitivity of model performance to the reference sites included in the training set demonstrates that local models – with training sets composed of soils from pedoclimates similar to the ones of the soils from the prediction set – showed better predictive ability for the centennially stable SOC proportion compared to a global model (Fig. 3). While the current training set is composed of too few reference sites to implement local modelling, this suggests that the European version PARTYSOCv2.0EU should be preferred to the global version PARTYSOCv2.0 when predicting the centennially stable SOC proportion in unknown soils from Europe.
On the other hand, the leave-one-site-out validation procedure, the most robust validation procedure (see Sect. 2.5), demonstrates that the second version of PARTYSOC is currently not capable of accurately partitioning SOC into its centennially stable and active fractions in soil samples from pedoclimates that differ strongly from the ones included in the training set (Fig. 2b, Table 3b). This indicates that, like all machine-learning approaches, the PARTYSOC model gains progressively more genericity (i.e. capability to fairly predict the centennially stable SOC proportion in unknown soils) as its training set integrates soils from new pedoclimates. In this respect, we consider applying the second version of PARTYSOC to unknown soils from pedoclimates outside its training set not recommended. The sensitivity analysis to the test set, however, shows that PARTYSOCv2.0EU reliably partitions SOC kinetic fractions at its validation sites for Cambisols and Luvisols (with a mean prediction error in the centennially stable SOC proportion of 0.11; see Sect. 3.4 and Fig. S1). Cambisols and Luvisols are the two dominant reference soil groups in Europe, covering more than 41 % of European land areas (European Commission, 2008). Though the model test set does not include all the within-group pedological variability of Cambisols and Luvisols (FAO, 2014), this suggests that PARTYSOCv2.0EU can accurately partition SOC into its centennially stable and active fractions for a significant portion of northwestern European agricultural soils. The relatively high prediction error, however, of both PARTYSOCv2.0 and PARTYSOCv2.0EU models at Rothamsted (high RRMSEP; Table 3), a site developed on a Chromic Luvisol, may be due to an inaccurate estimate (overestimation) of the centennially stable SOC content at this site. Indeed, a report from an ancient LTBF trial at Rothamsted (drain gauge experiment; Jenkinson and Coleman, 1994), on the same soil unit as the Highfield bare fallow experiment, showed a measured total SOC content of 7.9 g C kg−1, which is lower than our current estimate of the centennially stable SOC content (9.72 g C kg−1; Table 1). Yet, the conditions of the drain gauge experiment, with a basic soil pH value of 7.9 due to heavy dressing of chalk on Rothamsted's arable lands before the 19th century (Avery and Catt, 1995; Jenkinson and Coleman, 1994), may not be directly comparable to the conditions of the Highfield bare fallow experiment, showing acidic pH values ranging from 5.2 to 6.3 (Supplement Table S2).
4.3 Future developments of the PARTYSOC model
The very first future improvements to the PARTYSOC machine-learning model are to increase the size and further expand the pedoclimatic diversity of its training set. A few additional LTBF sites and several C3-to-C4-plant (or C4 to C3) long-term vegetation change sites (including space-for-time substitution, like the site of La Cabaña) could be used to achieve this goal. A potential complement lies in a few long-term experimental sites with soil archives and treatments experiencing contrasting SOC stock changes. Radiocarbon measurements on recent and archived soil samples from such sites can be used to infer the content of the centennially stable SOC fraction in topsoils (Hsieh, 1992), but also in subsoils, to allow extending the model to deeper soil horizons. Following the method developed by Buyanovsky and Wagner (1998b, a) and Huggins et al. (1998), the content of the centennially stable SOC fraction can also be estimated in a few additional long-term experiments with contrasting SOC inputs. A promising complement to these strategies comes from numerous long-term sites where time series of SOC inputs, outputs, and stocks are well constrained (i.e. long-term experiments or long-term monitoring sites in various types of ecosystems including arable land, grassland, and forest). It is possible to reliably infer the content of the centennially stable SOC fraction at these sites using simple models of SOC dynamics like AMG (Clivot et al., 2019). Combining all these strategies could help significantly expand the training set of PARTYSOC to soil samples from diverse climates, ecosystems, soil types, and soil depths. When the training set for PARTYSOC integrates a sufficient diversity of soil samples, a second future improvement of the model lies in the comparison of different machine-learning algorithms and a test of local modelling approaches, as commonly used in soil spectroscopy studies (Dangal et al., 2019; Gogé et al., 2012; Ramirez-Lopez et al., 2013b, a).
The independent validation of PARTYSOCv2.0EU at five sites with the two dominant reference soil groups in northwestern Europe presented here (Figs. 2 and S1) constitutes significant progress in the metrology of SOC kinetic pools. It represents an improvement compared to other approaches that consistently fail to achieve a proper separation of active from stable SOC (Fig. 1; Hsieh, 1992; von Lützow et al., 2007). Methods such as physical and physico-chemical SOC fractionation schemes have been developed to initialize the size of SOC kinetic pools of models (Skjemstad et al., 2004; Zimmermann et al., 2007a), and some of them are now implemented for large topsoil sample sets at the national or continental scale in Europe (Cotrufo et al., 2019; Vos et al., 2018) and Australia (Gray et al., 2019; Viscarra Rossel et al., 2019). A similar implementation in soil monitoring networks of Rock-Eval® measurements combined with the second version of PARTYSOC can provide a more accurate quantification of the functionally different SOC fractions that are centennially stable or active (Fig. 1), at least for a portion of northwestern European agricultural land areas with Cambisols and Luvisols. Large-scale Rock-Eval® measurements and the combined application of PARTYSOCv2.0EU are already ongoing in the French soil monitoring network for soil quality assessment (RMQS; Jolivet et al., 2018). We recommend undertaking similar works in other national and international soil monitoring networks. The second version of PARTYSOC could also be directly employed as an SOC pool partitioning method for simple models of SOC dynamics that are built on the same dualistic conceptual approach of SOC persistence (i.e. active vs. stable SOC pools). The accuracy of these simple models, such as AMG, is highly sensitive to the proper partitioning of SOC kinetic pools (Clivot et al., 2019) and could thus strongly benefit from the second version of PARTYSOC.
We envision a significant contribution of the PARTYSOC machine-learning model based on Rock-Eval® thermal analysis to the forthcoming large-scale availability of accurate information on the size of the centennially stable and active SOC fractions. Such accurate information will foster (1) initiatives for soil health assessment and monitoring as well as (2) modelling works of SOC dynamics and of the climate regulation function of soils.
The Rock-Eval® data for the 105 reference topsoil samples in PARTYSOCv2.0 are provided in Table S3 as a CSV file. The R script used to extract Rock-Eval® raw data and calculate Rock-Eval® parameters, the Rock-Eval® data and the R script used to build the PARTYSOCv2.0 and PARTYSOCv2.0EU models and test their performance, and the PARTYSOCv2.0EU model (available as an R script and an R data file; please note that predictions of the centennially stable and active SOC contents – in g C kg−1 – are obtained by multiplying their respective proportions by the TOCRE6 Rock-Eval® parameter) can be accessed on GitHub at https://github.com/lauric-cecillon/PARTYsoc (last access: 17 June 2021) and on Zenodo at the permanent link https://doi.org/10.5281/zenodo.4446138 (Cécillon, 2021).
The supplement related to this article is available online at: https://doi.org/10.5194/gmd-14-3879-2021-supplement.
LC and PB designed the study with contributions from CC and FB. FB and FS performed the Rock-Eval® measurements. LC wrote the R scripts used to calculate Rock-Eval® parameters and built the second version of the PARTYSOC model with contributions from PB, LNS, and EK. BTC, UF, SH, TK, IM, FvO, CP, and JCQ provided the topsoil samples and the metadata for the reference sites. LC and PB wrote the paper with contributions from all authors.
The authors declare that they have no conflict of interest.
Publisher's note: Copernicus Publications remains neutral with regard to jurisdictional claims in published maps and institutional affiliations.
We are indebted to the generations of technicians and scientists that started and managed the long-term experiments and archives of soil samples used in this work. We thank Rothamsted Research for access to samples and data from the Rothamsted Sample Archive and the electronic Rothamsted Archive (e-RA). We thank David Montagne and Joël Michelin (AgroParisTech, France), who provided information on the soil characteristics at Grignon. We thank our colleagues in the ROMENS research group at Ecole normale supérieure (Paris, France), especially Samuel Abiven, Núria Catalán, Bertrand Guenet, and Marcus Schiedung, who provided advice that improved this paper. Finally, we thank Emanuele Lugato (JRC, Ispra, Italy) and an anonymous reviewer for their constructive comments that further improved our paper.
This research has been supported by the French Agence nationale de la recherche (StoreSoilC project, grant ANR-17-CE32-0005), the French Agence de la transition écologique (ADEME), and Ville de Paris (SOCUTE project, emergence(s) programme). The Rothamsted Long-term Experiments are supported by the UK Biotechnology and Biological Sciences Research Council under the National Capabilities programme grant (BBS/E/C/000J0300) and by the Lawes Agricultural Trust.
This paper was edited by Tomomichi Kato and reviewed by Emanuele Lugato and one anonymous referee.
Abiven, S., Menasseri, S., and Chenu, C.: The effects of organic inputs over time on soil aggregate stability – A literature analysis, Soil Biol. Biochem., 41, 1–12, https://doi.org/10.1016/j.soilbio.2008.09.015, 2009.
Amundson, R., Berhe, A. A., Hopmans, J. W., Olson, C., Sztein, A. E., and Sparks, D. L.: Soil and human security in the 21st century, Science, 348, 1261071–1261071, https://doi.org/10.1126/science.1261071, 2015.
Ansorge, H.: Die Wirkung des Stallmistes im “Statischen Düngungsversuch” Lauchstädt, 2. Mitteilung: Veränderung des Humusgehaltes im Boden, 10, 401–412, 1966.
Avery, B. W. and Catt, J. A.: The soil at Rothamsted, Lawes Agricultural Trust, Harpenden, 1995.
Baldock, J. A., Hawke, B., Sanderman, J., and Macdonald, L. M.: Predicting contents of carbon and its component fractions in Australian soils from diffuse reflectance mid-infrared spectra, Soil Res., 51, 577, https://doi.org/10.1071/SR13077, 2013.
Balesdent, J.: The significance of organic separates to carbon dynamics and its modelling in some cultivated soils, Eur. J. Soil Sci., 47, 485–493, https://doi.org/10.1111/j.1365-2389.1996.tb01848.x, 1996.
Balesdent, J. and Guillet, B.: Les datations par le 14C des matières organiques des sols. Contribution à l'étude de l'humification et du renouvellement des substances humiques, Science du sol, 2, 93–112, 1982.
Balesdent, J. and Mariotti, A.: Measurement of soil organic matter turnover using 13C natural abundance, in: Mass spectrometry of soils, edited by: Boutton, T. W. and Yamasaki, S. I., 83–111, 1996.
Balesdent, J., Mariotti, A., and Guillet, B.: Natural 13C abundance as a tracer for studies of soil organic matter dynamics, Soil Biol. Biochem., 19, 25–30, https://doi.org/10.1016/0038-0717(87)90120-9, 1987.
Balesdent, J., Wagner, G. H., and Mariotti, A.: Soil organic matter turnover in long-term field experiments as revealed by carbon-13 natural abundance, Soil Science Society of America Journal, 52, 118–124, https://doi.org/10.2136/sssaj1988.03615995005200010021x, 1988.
Balesdent, J., Basile-Doelsch, I., Chadoeuf, J., Cornu, S., Derrien, D., Fekiacova, Z., and Hatté, C.: Atmosphere–soil carbon transfer as a function of soil depth, Nature, 559, 599–602, https://doi.org/10.1038/s41586-018-0328-3, 2018.
Barré, P., Eglin, T., Christensen, B. T., Ciais, P., Houot, S., Kätterer, T., van Oort, F., Peylin, P., Poulton, P. R., Romanenkov, V., and Chenu, C.: Quantifying and isolating stable soil organic carbon using long-term bare fallow experiments, Biogeosciences, 7, 3839–3850, https://doi.org/10.5194/bg-7-3839-2010, 2010.
Barré, P., Plante, A. F., Cécillon, L., Lutfalla, S., Baudin, F., Bernard, S., Christensen, B. T., Eglin, T., Fernandez, J. M., Houot, S., Kätterer, T., Le Guillou, C., Macdonald, A., van Oort, F., and Chenu, C.: The energetic and chemical signatures of persistent soil organic matter, Biogeochemistry, 130, 1–12, https://doi.org/10.1007/s10533-016-0246-0, 2016.
Behar, F., Beaumont, V., and De B. Penteado, H. L.: Rock-Eval 6 technology: performances and developments, Oil Gas Sci. Technol., 56, 111–134, https://doi.org/10.2516/ogst:2001013, 2001.
Beleites, C. and Sergo, V.: hyperSpec: a package to handle hyperspectral data sets in R, R package version 0.99-20201127, available at: https://github.com/cbeleites/hyperSpecm (last access: 15 June 2021), 2020.
Bellon-Maurel, V., Fernandez-Ahumada, E., Palagos, B., Roger, J.-M., and McBratney, A.: Critical review of chemometric indicators commonly used for assessing the quality of the prediction of soil attributes by NIR spectroscopy, TrAC-Trend Anal. Chem., 29, 1073–1081, https://doi.org/10.1016/j.trac.2010.05.006, 2010.
Borchers, H. W.: racma: Practical Numerical Math Functions. R package version 2.2.9, available at: https://CRAN.R-project.org/package=pracma (last access: 22 June 2021), 2019.
Breiman, L.: Random Forests, Mach. Learn., 45, 5–32, https://doi.org/10.1023/A:1010933404324, 2001.
Buyanovsky, G. A. and Wagner, G. H.: Carbon cycling in cultivated land and its global significance, Glob. Change Biol., 4, 131–141, https://doi.org/10.1046/j.1365-2486.1998.00130.x, 1998a.
Buyanovsky, G. A. and Wagner, G. H.: Changing role of cultivated land in the global carbon cycle, Biol. Fert Soils, 27, 242–245, https://doi.org/10.1007/s003740050427, 1998b.
Canty, A. and Ripley, B.: boot: Bootstrap R (S-Plus) Functions, R package version 1.3-28, 2020.
Cardinael, R., Eglin, T., Guenet, B., Neill, C., Houot, S., and Chenu, C.: Is priming effect a significant process for long-term SOC dynamics? Analysis of a 52-years old experiment, Biogeochemistry, 123, 203–219, https://doi.org/10.1007/s10533-014-0063-2, 2015.
Cécillon, L.: lauric-cecillon/PARTYsoc: Second version of the PARTYsoc statistical model (Version v2.0), Zenodo, https://doi.org/10.5281/zenodo.4446138, 2021.
Cécillon, L., Cassagne, N., Czarnes, S., Gros, R., and Brun, J.-J.: Variable selection in near infrared spectra for the biological characterization of soil and earthworm casts, Soil Biol. Biochem., 40, 1975–1979, https://doi.org/10.1016/j.soilbio.2008.03.016, 2008.
Cécillon, L., Baudin, F., Chenu, C., Houot, S., Jolivet, R., Kätterer, T., Lutfalla, S., Macdonald, A., van Oort, F., Plante, A. F., Savignac, F., Soucémarianadin, L. N., and Barré, P.: A model based on Rock-Eval thermal analysis to quantify the size of the centennially persistent organic carbon pool in temperate soils, Biogeosciences, 15, 2835–2849, https://doi.org/10.5194/bg-15-2835-2018, 2018.
Cerri, C., Feller, C., Balesdent, J., Victoria, R., and Plenccassagne, A.: Application du traçage isotopique naturel en 13C, à l'étude de la dynamique de la matière organique dans les sols, Cr. Acad. Sci., 300, 423–428, 1985.
Christensen, B. T. and Johnston, A. E.: Soil organic matter and soil quality – Lessons learned from long-term experiments at Askov and Rothamsted, Dev. Soil Sci., 25, 399–430, https://doi.org/10.1016/S0166-2481(97)80045-1, 1997.
Christensen, B. T., Thomsen, I. K., and Eriksen, J.: The Askov long-term experiments: 1894–2019: a unique research platform turns 125 years, DCA – Nationalt Center for Fødevarer og Jordbrug, Tjele, 2019.
Clivot, H., Mouny, J.-C., Duparque, A., Dinh, J.-L., Denoroy, P., Houot, S., Vertès, F., Trochard, R., Bouthier, A., Sagot, S., and Mary, B.: Modeling soil organic carbon evolution in long-term arable experiments with AMG model, Environ. Modell. Softw., 118, 99–113, https://doi.org/10.1016/j.envsoft.2019.04.004, 2019.
Cotrufo, M. F., Ranalli, M. G., Haddix, M. L., Six, J., and Lugato, E.: Soil carbon storage informed by particulate and mineral-associated organic matter, Nat. Geosci., 12, 989–994, https://doi.org/10.1038/s41561-019-0484-6, 2019.
Coulston, J. W., Blinn, C. E., Thomas, V. A., and Wynne, R. H.: Approximating prediction uncertainty for random forest regression models, Photogramm. Eng. Rem. S., 82, 189–197, https://doi.org/10.14358/PERS.82.3.189, 2016.
Dangal, S., Sanderman, J., Wills, S., and Ramirez-Lopez, L.: Accurate and precise prediction of soil properties from a large mid-infrared spectral library, Soil Syst., 3, 11, https://doi.org/10.3390/soilsystems3010011, 2019.
Davison, A. C. and Hinkley, D. V.: Bootstrap methods and their application, Cambridge University Press, Cambridge, New York, NY, USA, 582 pp., 1997.
Disnar, J. R., Guillet, B., Keravis, D., Di-Giovanni, C., and Sebag, D.: Soil organic matter (SOM) characterization by Rock-Eval pyrolysis: scope and limitations, Org. Geochem., 34, 327–343, https://doi.org/10.1016/S0146-6380(02)00239-5, 2003.
European Commission: Soils of the European Union, Joint Research Centre, Institute for Environment and Sustainability, Publications Office, LU, 2008.
Falloon, P., Smith, P., Coleman, K., and Marshall, S.: Estimating the size of the inert organic matter pool from total soil organic carbon content for use in the Rothamsted carbon model, Soil Biol. Biochem., 30, 1207–1211, https://doi.org/10.1016/S0038-0717(97)00256-3, 1998.
Falloon, P. D. and Smith, P.: Modelling refractory soil organic matter, Biol. Fert. Soils, 30, 388–398, https://doi.org/10.1007/s003740050019, 2000.
FAO: World reference base for soil resources 2014: international soil classification system for naming soils and creating legends for soil maps, FAO, Rome, 2014.
Franko, U. and Merbach, I.: Modelling soil organic matter dynamics on a bare fallow Chernozem soil in Central Germany, Geoderma, 303, 93–98, https://doi.org/10.1016/j.geoderma.2017.05.013, 2017.
Genuer, R. and Poggi, J.-M.: Random Forests with R, Springer International Publishing, Cham, https://doi.org/10.1007/978-3-030-56485-8, 2020.
Gogé, F., Joffre, R., Jolivet, C., Ross, I., and Ranjard, L.: Optimization criteria in sample selection step of local regression for quantitative analysis of large soil NIRS database, Chemometr. Intell. Lab., 110, 168–176, https://doi.org/10.1016/j.chemolab.2011.11.003, 2012.
Gray, J., Karunaratne, S., Bishop, T., Wilson, B., and Veeragathipillai, M.: Driving factors of soil organic carbon fractions over New South Wales, Australia, Geoderma, 353, 213–226, https://doi.org/10.1016/j.geoderma.2019.06.032, 2019.
Gregorich, E. G., Gillespie, A. W., Beare, M. H., Curtin, D., Sanei, H., and Yanni, S. F.: Evaluating biodegradability of soil organic matter by its thermal stability and chemical composition, Soil Biol. Biochem., 91, 182–191, https://doi.org/10.1016/j.soilbio.2015.08.032, 2015.
He, Y., Trumbore, S. E., Torn, M. S., Harden, J. W., Vaughn, L. J. S., Allison, S. D., and Randerson, J. T.: Radiocarbon constraints imply reduced carbon uptake by soils during the 21st century, Science, 353, 1419–1424, https://doi.org/10.1126/science.aad4273, 2016.
Hénin, S. and Dupuis, M.: Bilan de la matière organique des sols, Annales Agronomiques, 1, 17–29, 1945.
Hénin, S. and Turc, L.: Essai de fractionnement des matières organiques du sol, Comptes rendus de l'Académie d'agriculture de Francem 35, 41–43, 1949.
Houot, S., Molina, J. A. E., Chaussod, R., and Clapp, C. E.: Simulation by NCSOIL of net mineralization in soils from the Deherain and 36 parcelles fields at Grignon, Soil Sci. Soc. Am. J., 53, 451–455, https://doi.org/10.2136/sssaj1989.03615995005300020023x, 1989.
Hsieh, Y.-P.: Pool size and mean age of stable soil organic carbon in croplands, Soil Sci. Soc. Am. J., 56, 460–464, https://doi.org/10.2136/sssaj1992.03615995005600020049x, 1992.
Huggins, D. R., Buyanovsky, G. A., Wagner, G. H., Brown, J. R., Darmody, R. G., Peck, T. R., Lesoing, G. W., Vanotti, M. B., and Bundy, L. G.: Soil organic C in the tallgrass prairie-derived region of the corn belt: effects of long-term crop management, Soil Till. Res., 47, 219–234, https://doi.org/10.1016/S0167-1987(98)00108-1, 1998.
IPBES: Summary for policymakers of the assessment report on land degradation and restoration of the Intergovernmental Science-Policy Platform on Biodiversity and Ecosystem Services, edited by: Scholes, R. J., Montanarella, L., Brainich, E., Brainich, E., Barger, N., ten Brink, B., Cantele, M., Erasmus, B., Fisher, J., Gardner, T., Holland, T. G., Kohler, F., Kotiaho, S., von Maltitz, G., Nangendo, G., Pandit, R., Parrotta, J., Potts, M. D., Prince, S., Sankaran, M., and Willemen, L., Intergovernmental Science-Policy Platform on Biodiversity and Ecosystem Services, 2018.
IPCC: Climate Change and Land: an IPCC special report on climate change, desertification, land degradation, sustainable land management, food security, and greenhouse gas fluxes in terrestrial ecosystems, edited by: Shukla, P. R., Skea, J., Calvo Buendia, E., Masson-Delmotte, V., Pörtner, H.-O., Roberts, D. C., Zhai, P., Slade, R., Connors, S., van Diemen, R., Ferrat, M., Haughey, E., Luz, S., Neogi, S., Pathak, M., Petzold, J., Portugal Pereira, J., Vyas, P., Huntley, E., Kissick, K., Belkacemi, M., and Malley, J., available at: https://www.ipcc.ch/srccl/ (last access: 22 June 2021), 2019.
ISO 10694: Soil quality – Determination of organic and total carbon after dry combustion (elementary analysis), available at: https://www.iso.org/standard/18782.html (last access: 22 June 2021), 1995.
Jaconi, A., Poeplau, C., Ramirez-Lopez, L., Van Wesemael, B., and Don, A.: Log-ratio transformation is the key to determining soil organic carbon fractions with near-infrared spectroscopy, Eur. J. Soil. Sci., 70, 127–139, https://doi.org/10.1111/ejss.12761, 2019.
Janzen, H. H.: The soil carbon dilemma: shall we hoard it or use it?, Soil Biol. Biochem., 38, 419–424, https://doi.org/10.1016/j.soilbio.2005.10.008, 2006.
Jenkinson, D. S.: The turnover of organic carbon and nitrogen in soil, Philos. T. R. Soc. Lond. B, 329, 361–368, https://doi.org/10.1098/rstb.1990.0177, 1990.
Jenkinson, D. S. and Coleman, K.: Calculating the annual input of organic matter to soil from measurements of total organic carbon and radiocarbon, Eur. J. Soil Sci., 45, 167–174, https://doi.org/10.1111/j.1365-2389.1994.tb00498.x, 1994.
Jenkinson, D. S., Adams, D. E., and Wild, A.: Model estimates of CO2 emissions from soil in response to global warming, Nature, 351, 304–306, https://doi.org/10.1038/351304a0, 1991.
Johnston, A. E., Poulton, P. R., and Coleman, K.: Soil organic matter: its importance in sustainable agriculture and carbon dioxide fluxes, in: Adv. Agronom., 101, 1–57, https://doi.org/10.1016/S0065-2113(08)00801-8, 2009.
Jolivet, C., Almeida-Falcon, J. L., Berché, P., Boulonne, L., Fontaine, M., Gouny, L., Lehmann, S., Maître, B., Ratié, C., Schellenberger, E., and Soler-Dominguez, N.: Manuel du Réseau de mesures de la qualité des sols, RMQS2: deuxième campagne métropolitaine, 2016 – 2027, Version 3, INRA, US 1106 InfoSol, Orléans, France, 2018.
Kätterer, T., Bolinder, M. A., Andrén, O., Kirchmann, H., and Menichetti, L.: Roots contribute more to refractory soil organic matter than above-ground crop residues, as revealed by a long-term field experiment, Agriculture, Ecosyst. Environ., 141, 184–192, https://doi.org/10.1016/j.agee.2011.02.029, 2011.
Keesstra, S. D., Bouma, J., Wallinga, J., Tittonell, P., Smith, P., Cerdà, A., Montanarella, L., Quinton, J. N., Pachepsky, Y., van der Putten, W. H., Bardgett, R. D., Moolenaar, S., Mol, G., Jansen, B., and Fresco, L. O.: The significance of soils and soil science towards realization of the United Nations Sustainable Development Goals, SOIL, 2, 111–128, https://doi.org/10.5194/soil-2-111-2016, 2016.
Khedim, N., Cécillon, L., Poulenard, J., Barré, P., Baudin, F., Marta, S., Rabatel, A., Dentant, C., Cauvy-Fraunié, S., Anthelme, F., Gielly, L., Ambrosini, R., Franzetti, A., Azzoni, R. S., Caccianiga, M. S., Compostella, C., Clague, J., Tielidze, L., Messager, E., Choler, P., and Ficetola, G. F.: Topsoil organic matter build-up in glacier forelands around the world, Glob. Change Biol., 27, 1662–1677, https://doi.org/10.1111/gcb.15496, 2021.
Koch, A., McBratney, A., Adams, M., Field, D., Hill, R., Crawford, J., Minasny, B., Lal, R., Abbott, L., O'Donnell, A., Angers, D., Baldock, J., Barbier, E., Binkley, D., Parton, W., Wall, D. H., Bird, M., Bouma, J., Chenu, C., Flora, C. B., Goulding, K., Grunwald, S., Hempel, J., Jastrow, J., Lehmann, J., Lorenz, K., Morgan, C. L., Rice, C. W., Whitehead, D., Young, I., and Zimmermann, M.: Soil security: solving the global soil crisis, Glob. Policy, 4, 434–441, https://doi.org/10.1111/1758-5899.12096, 2013.
Körschens, M., Weigel, A., and Schulz, E.: Turnover of soil organic matter (SOM) and long-term balances – tools for evaluating sustainable productivity of soils, Z. Pflanzenernaehr. Bodenk., 161, 409–424, https://doi.org/10.1002/jpln.1998.3581610409, 1998.
Lal, R.: Soil carbon sequestration impacts on global climate change and food security, Science, 304, 1623–1627, https://doi.org/10.1126/science.1097396, 2004.
Lavallee, J. M., Soong, J. L., and Cotrufo, M. F.: Conceptualizing soil organic matter into particulate and mineral-associated forms to address global change in the 21st century, Glob. Change Biol., 26, 261–273, https://doi.org/10.1111/gcb.14859, 2020.
Liaw, A. and Wiener, M.: Classification and regression by randomForest, R News, 2, 18–22, 2002.
Ludwig, B., Schulz, E., Rethemeyer, J., Merbach, I., and Flessa, H.: Predictive modelling of C dynamics in the long-term fertilization experiment at Bad Lauchstädt with the Rothamsted Carbon Model, Eur. J. Soil Sci., 58, 1155–1163, https://doi.org/10.1111/j.1365-2389.2007.00907.x, 2007.
Luo, Y., Ahlström, A., Allison, S. D., Batjes, N. H., Brovkin, V., Carvalhais, N., Chappell, A., Ciais, P., Davidson, E. A., Finzi, A., Georgiou, K., Guenet, B., Hararuk, O., Harden, J. W., He, Y., Hopkins, F., Jiang, L., Koven, C., Jackson, R. B., Jones, C. D., Lara, M. J., Liang, J., McGuire, A. D., Parton, W., Peng, C., Randerson, J. T., Salazar, A., Sierra, C. A., Smith, M. J., Tian, H., Todd-Brown, K. E. O., Torn, M., van Groenigen, K. J., Wang, Y. P., West, T. O., Wei, Y., Wieder, W. R., Xia, J., Xu, X., Xu, X., and Zhou, T.: Toward more realistic projections of soil carbon dynamics by Earth system models, Global Biogeochem. Cy., 30, 40–56, https://doi.org/10.1002/2015GB005239, 2016.
Monnier, G., Turc, C., and Jeanson Luusinang, C.: Une methode de fractionnement densimétrique par centrifugation des matières organiques du sol, Annales Agronomiques, 13, 55–63, 1962.
Nikiforoff, C. C.: Some General Aspects of the Chernozem Formation, Soil Sci. Soc. Am. J., 1, 333–342, https://doi.org/10.2136/sssaj1937.03615995000100000060x, 1936.
Patil, A., Huard, D., and Fonnesbeck, C.: PyMC: Bayesian stochastic modelling in Python, J. Stat. Softw., 35, https://doi.org/10.18637/jss.v035.i04, 2010.
Pellerin, S., Bamière, L., Launay, C., Martin, R., Schiavo, M., Angers, D., Augusto, L., Balesdent, J., Basile-Doelsch, I., Bellassen, V., Cardinael, R., Cécillon, L., Ceschia, E., Chenu, C., Constantin, J., Darroussin, J., Delacote, P., Delame, N., Gastal, F., Gilbert, D., Graux, A.-I., Guenet, B., Houot, S., Klumpp, K., Letort, E., Litrico, I., Martin, M., Menasseri-Aubry, S., Meziere, D., Morvan, T., Mosnier, C., Roger-Estrade, J., Saint-André, L., Sierra, J., Therond, O., Viaud, V., Grateau, R., Le Perchec, S., Savini, I., and Rechauchère, O.: Stocker du carbone dans les sols français, Quel potentiel au regard de l’objectif 4 pour 1000 et à quel coût? Rapport scientifique de l'étude, INRA (France), 540 pp., available at: https://www.inrae.fr/sites/default/files/pdf/Rapport Etude 4p1000.pdf (last access: 22 June 2021), 2020.
Petersen, B. M., Berntsen, J., Hansen, S., and Jensen, L. S.: CN-SIM – a model for the turnover of soil organic matter. I. Long-term carbon and radiocarbon development, Soil Biol. Biochem., 37, 359–374, https://doi.org/10.1016/j.soilbio.2004.08.006, 2005.
Plante, A. F., Beaupré, S. R., Roberts, M. L., and Baisden, T.: Distribution of radiocarbon ages in soil organic matter by thermal fractionation, Radiocarbon, 55, 1077–1083, https://doi.org/10.1017/S0033822200058215, 2013.
Poeplau, C., Don, A., Dondini, M., Leifeld, J., Nemo, R., Schumacher, J., Senapati, N., and Wiesmeier, M.: Reproducibility of a soil organic carbon fractionation method to derive RothC carbon pools: Soil carbon fractionation ring trial, Eur. J. Soil Sci., 64, 735–746, https://doi.org/10.1111/ejss.12088, 2013.
Poeplau, C., Don, A., Six, J., Kaiser, M., Benbi, D., Chenu, C., Cotrufo, M. F., Derrien, D., Gioacchini, P., Grand, S., Gregorich, E., Griepentrog, M., Gunina, A., Haddix, M., Kuzyakov, Y., Kühnel, A., Macdonald, L. M., Soong, J., Trigalet, S., Vermeire, M.-L., Rovira, P., van Wesemael, B., Wiesmeier, M., Yeasmin, S., Yevdokimov, I., and Nieder, R.: Isolating organic carbon fractions with varying turnover rates in temperate agricultural soils – A comprehensive method comparison, Soil Biol. Biochem., 125, 10–26, https://doi.org/10.1016/j.soilbio.2018.06.025, 2018.
Poeplau, C., Barré, P., Cécillon, L., Baudin, F., and Sigurdsson, B. D.: Changes in the Rock-Eval signature of soil organic carbon upon extreme soil warming and chemical oxidation - A comparison, Geoderma, 337, 181–190, https://doi.org/10.1016/j.geoderma.2018.09.025, 2019.
Quezada, J. C., Etter, A., Ghazoul, J., Buttler, A., and Guillaume, T.: Carbon neutral expansion of oil palm plantations in the Neotropics, Sci. Adv., 5, eaaw4418, https://doi.org/10.1126/sciadv.aaw4418, 2019.
Ramirez-Lopez, L., Behrens, T., Schmidt, K., Rossel, R. A. V., Demattê, J. A. M., and Scholten, T.: Distance and similarity-search metrics for use with soil vis–NIR spectra, Geoderma, 199, 43–53, https://doi.org/10.1016/j.geoderma.2012.08.035, 2013a.
Ramirez-Lopez, L., Behrens, T., Schmidt, K., Stevens, A., Demattê, J. A. M., and Scholten, T.: The spectrum-based learner: A new local approach for modeling soil vis–NIR spectra of complex datasets, Geoderma, 195–196, 268–279, https://doi.org/10.1016/j.geoderma.2012.12.014, 2013b.
R Core Team: R: a language and environment for statistical computing, R Foundation for Statistical Computing, Vienna, Austria, 2020.
RStudio Team: RStudio: integrated development for R, RStudio, Inc., Boston, MA, 2020.
Rühlmann, J.: A new approach to estimating the pool of stable organic matter in soil using data from long-term field experiments, Plant Soil, 213, 149–160, https://doi.org/10.1023/A:1004552016182, 1999.
Saenger, A., Cécillon, L., Sebag, D., and Brun, J.-J.: Soil organic carbon quantity, chemistry and thermal stability in a mountainous landscape: A Rock–Eval pyrolysis survey, Org. Geochem., 54, 101–114, https://doi.org/10.1016/j.orggeochem.2012.10.008, 2013.
Saenger, A., Cécillon, L., Poulenard, J., Bureau, F., De Daniéli, S., Gonzalez, J.-M., and Brun, J.-J.: Surveying the carbon pools of mountain soils: A comparison of physical fractionation and Rock-Eval pyrolysis, Geoderma, 241–242, 279–288, https://doi.org/10.1016/j.geoderma.2014.12.001, 2015.
Sanderman, J. and Grandy, A. S.: Ramped thermal analysis for isolating biologically meaningful soil organic matter fractions with distinct residence times, SOIL, 6, 131–144, https://doi.org/10.5194/soil-6-131-2020, 2020.
Sanderman, J., Hengl, T., and Fiske, G. J.: Soil carbon debt of 12,000 years of human land use, P. Natl. Acad. Sci. USA, 114, 9575–9580, https://doi.org/10.1073/pnas.1706103114, 2017.
Schiedung, M., Don, A., Wordell-Dietrich, P., Alcántara, V., Kuner, P., and Guggenberger, G.: Thermal oxidation does not fractionate soil organic carbon with differing biological stabilities, J. Plant Nutr. Soil Sci., 180, 18–26, https://doi.org/10.1002/jpln.201600172, 2017.
Schulte, R. P. O., Creamer, R. E., Donnellan, T., Farrelly, N., Fealy, R., O'Donoghue, C., and O'hUallachain, D.: Functional land management: A framework for managing soil-based ecosystem services for the sustainable intensification of agriculture, Environ. Sci. Policy, 38, 45–58, https://doi.org/10.1016/j.envsci.2013.10.002, 2014.
Sebag, D., Verrecchia, E. P., Cécillon, L., Adatte, T., Albrecht, R., Aubert, M., Bureau, F., Cailleau, G., Copard, Y., Decaens, T., Disnar, J.-R., Hetényi, M., Nyilas, T., and Trombino, L.: Dynamics of soil organic matter based on new Rock-Eval indices, Geoderma, 284, 185–203, https://doi.org/10.1016/j.geoderma.2016.08.025, 2016.
Shi, Z., Allison, S. D., He, Y., Levine, P. A., Hoyt, A. M., Beem-Miller, J., Zhu, Q., Wieder, W. R., Trumbore, S., and Randerson, J. T.: The age distribution of global soil carbon inferred from radiocarbon measurements, Nat. Geosci., 13, 555–559, https://doi.org/10.1038/s41561-020-0596-z, 2020.
Skjemstad, J. O., Spouncer, L. R., Cowie, B., and Swift, R. S.: Calibration of the Rothamsted organic carbon turnover model (RothC ver. 26.3), using measurable soil organic carbon pools, Soil Res., 42, 79–88, https://doi.org/10.1071/SR03013, 2004.
Soucémarianadin, L., Cécillon, L., Chenu, C., Baudin, F., Nicolas, M., Girardin, C., and Barré, P.: Is Rock-Eval 6 thermal analysis a good indicator of soil organic carbon lability? – A method-comparison study in forest soils, Soil Biol. Biochem., 117, 108–116, https://doi.org/10.1016/j.soilbio.2017.10.025, 2018a.
Soucémarianadin, L. N., Cécillon, L., Guenet, B., Chenu, C., Baudin, F., Nicolas, M., Girardin, C., and Barré, P.: Environmental factors controlling soil organic carbon stability in French forest soils, Plant Soil, 426, 267–286, https://doi.org/10.1007/s11104-018-3613-x, 2018b.
Stoorvogel, J. J., Bakkenes, M., Brink, B. J. E., and Temme, A. J. A. M.: To what extent did we change our soils? A global comparison of natural and current conditions, Land Degrad. Develop., 28, 1982–1991, https://doi.org/10.1002/ldr.2721, 2017.
Strobl, C., Malley, J., and Tutz, G.: An introduction to recursive partitioning: Rationale, application, and characteristics of classification and regression trees, bagging, and random forests, Psychol. Meth., 14, 323–348, https://doi.org/10.1037/a0016973, 2009.
Taghizadeh-Toosi, A., Cong, W.-F., Eriksen, J., Mayer, J., Olesen, J. E., Keel, S. G., Glendining, M., Kätterer, T., and Christensen, B. T.: Visiting dark sides of model simulation of carbon stocks in European temperate agricultural soils: allometric function and model initialization, Plant Soil, 450, 255–272, https://doi.org/10.1007/s11104-020-04500-9, 2020.
Trumbore, S. E., Vogel, J. S., and Southon, J. R.: AMS 14C measurements of fractionated soil organic matter: an approach to deciphering the soil carbon cycle, Radiocarbon, 31, 644–654, https://doi.org/10.1017/S0033822200012248, 1989.
van Oort, F., Paradelo, R., Proix, N., Delarue, G., Baize, D., and Monna, F.: Centennial fertilization-induced soil processes control trace metal dynamics. Lessons from a long-term bare fallow experiment, Soil Syst., 2, 23, https://doi.org/10.3390/soilsystems2020023, 2018.
Viscarra Rossel, R. A. and Hicks, W. S.: Soil organic carbon and its fractions estimated by visible-near infrared transfer functions: Vis-NIR estimates of organic carbon and its fractions, Eur. J. Soil Sci., 66, 438–450, https://doi.org/10.1111/ejss.12237, 2015.
Viscarra Rossel, R. A., Lee, J., Behrens, T., Luo, Z., Baldock, J., and Richards, A.: Continental-scale soil carbon composition and vulnerability modulated by regional environmental controls, Nat. Geosci., 12, 547–552, https://doi.org/10.1038/s41561-019-0373-z, 2019.
von Lützow, M., Kögel-Knabner, I., Ekschmitt, K., Flessa, H., Guggenberger, G., Matzner, E., and Marschner, B.: SOM fractionation methods: Relevance to functional pools and to stabilization mechanisms, Soil Biol. Biochem., 39, 2183–2207, https://doi.org/10.1016/j.soilbio.2007.03.007, 2007.
Vos, C., Jaconi, A., Jacobs, A., and Don, A.: Hot regions of labile and stable soil organic carbon in Germany – Spatial variability and driving factors, SOIL, 4, 153–167, https://doi.org/10.5194/soil-4-153-2018, 2018.
Wehrens, R.: Chemometrics with R: Multivariate Data Analysis in the Natural and Life Sciences, Springer Berlin Heidelberg, Berlin, Heidelberg, https://doi.org/10.1007/978-3-662-62027-4, 2020.
Wickham, H.: tringr: Simple, consistent wrappers for common string operations, R package version 1.4.0, available at: https://CRAN.R-project.org/package=stringr (last access: 22 June 2021), 2019.
Wiesmeier, M., Urbanski, L., Hobley, E., Lang, B., von Lützow, M., Marin-Spiotta, E., van Wesemael, B., Rabot, E., Ließ, M., Garcia-Franco, N., Wollschläger, U., Vogel, H.-J., and Kögel-Knabner, I.: Soil organic carbon storage as a key function of soils – A review of drivers and indicators at various scales, Geoderma, 333, 149–162, https://doi.org/10.1016/j.geoderma.2018.07.026, 2019.
Zimmermann, M., Leifeld, J., Schmidt, M. W. I., Smith, P., and Fuhrer, J.: Measured soil organic matter fractions can be related to pools in the RothC model, Eur. J. Soil Sci., 58, 658–667, https://doi.org/10.1111/j.1365-2389.2006.00855.x, 2007a.
Zimmermann, M., Leifeld, J., and Fuhrer, J.: Quantifying soil organic carbon fractions by infrared-spectroscopy, Soil Biol. Biochem., 39, 224–231, https://doi.org/10.1016/j.soilbio.2006.07.010, 2007b.