the Creative Commons Attribution 4.0 License.
the Creative Commons Attribution 4.0 License.
 | 22 Jan 2021
CLIMADA v1.4.1: towards a globally consistent adaptation options appraisal tool
Gabriela Aznar-Siguan
Climate change is a fact; therefore, adaptation to a changing environment is a necessity. Adaptation is ultimately local, yet similar challenges pose themselves to decision-makers all across the globe and on all levels. The Economics of Climate Adaptation (ECA) methodology has established an economic framework to fully integrate risk and reward perspectives of different stakeholders, underpinned by the CLIMADA (CLIMateADAptation) impact modeling platform. We present an extension of the latter to appraise adaption options in a consistent fashion in order to provide decision-makers from the local to the global level with the necessary facts to identify the most effective instruments to meet the adaptation challenge. We apply the open-source Python implementation to a tropical cyclone impact case study in the Caribbean, using openly available data. This allows us to prioritize a small basket of adaptation options, namely green and gray infrastructure options as well as behavioral measures and risk transfer, and permits inter-island comparisons. In Anguilla, for example, mangroves avert simulated damages more than 4 times the cost estimated for mangrove restoration, whereas the enforcement of building codes is shown to be effective in the Turks and Caicos Islands in a moderate-climate-change scenario. For all islands, cost-effective measures reduce the cost of risk transfer, which covers the damage of high-impact events that cannot be cost-effectively prevented by other measures. This extended version of the CLIMADA platform has been designed to enable risk assessment and options appraisal in a modular form and occasionally bespoke fashion yet with the high reusability of common functionalities to foster the usage of the platform in interdisciplinary studies and international collaboration.
- Article
(1280 KB) - Full-text XML
- BibTeX
- EndNote


Climate change is one of the defining challenges for humankind in the present century. Even if we were to stop global greenhouse gas emissions today, we are bound to a significant level of warming and concomitant change (IPCC, 2014). Therefore, adaptation to a changing environment is currently a key priority and will remain so in the future. This challenge will be shaped not only by changes in climate but also societal stressors. Adaptation is ultimately local, yet similar challenges pose themselves to decision-makers all across the globe and on all levels – from multinational organizations (Berkhout, 2012), sovereign and sub-sovereign states, cities, and companies, down to the local community (Webler et al., 2016). Decision-makers on all levels benefit from consistent methodologies providing the facts needed to identify the most effective instruments to meet the adaptation challenge. However, one needs to be aware of constraints such as insufficient local resources and capacities as well as the role of authority. Such a globally consistent approach to adaptation needs to combine impact (Burton et al., 2002; Füssel and Klein, 2006) with vulnerability (Fünfgeld and Mcevoy, 2011; Preston et al., 2011) assessments to strengthen societal resilience. This occurs most effectively via the cogeneration of adaptation knowledge (Muccione et al., 2019) and the proper dissemination of information (Moser, 2014, 2017). The combined assessment of impacts and options appraisal further enables more sustainable access to funding (Adger, 2006; Eakin and Lemos, 2006; Smit and Wandel, 2006; Yohe and Tol, 2002).
In this spirit, the Economics of Climate Adaptation (ECA) methodology has established an economic framework to fully integrate the risk and reward perspectives of different stakeholders (Bresch and ECA working group, 2009; Souvignet et al., 2016) to foster climate-resilient development (Watkiss and Hunt, 2016). ECA can be applied on different levels and granularity, combining elements of top-down and bottom-up approaches (e.g., Dessai et al., 2005), which are both used in the policy process (Kates and Wilbanks, 2003; Mc Kenzie Hedger et al., 2006). Hence, ECA provides a fact base to build an adaptation strategy that is robust against a wide range of plausible climate and societal change futures (Lempert and Schlesinger, 2000; Wilby and Dessai, 2010).
ECA starts with a comprehensive cost–benefit analysis (CBA), where benefit does not need to be expressed in monetary units and can be equally well expressed using factors such as lives saved, as illustrated by many case studies (Bresch and ECA working group, 2009; Wieneke and Bresch, 2016). Such CBA forms the basis for a wider multi-criteria analysis (MCA, e.g., Haque, 2016) to integrate aspects such as specific risk appetite and further locally determined context (Brown et al., 2011; Dessai and Hulme, 2004; Preston and Stafford-Smith, 2009; Truong et al., 2016) and criteria (e.g., in NAPAs, UNFCCC, 2011). This further allows for the integration of additional perspectives (Radhakrishnan et al., 2017), including – also indigenous (Kelman et al., 2012) – knowledge with respect to feasibility. Such an approach provides the information needed to (re-)prioritize measures to constitute an adaptation road map as a basis for adaptation funding discussions on all levels, from local to global, including funding bodies such as the Green Climate Fund (GCF). The ECA method is underpinned by the CLIMADA platform (CLIMateADAptation; Aznar-Siguan and Bresch, 2019b), which does allow for globally consistent (see Ward et al., 2020) yet high-resolution modeling of the socioeconomic impacts of weather extremes following a fully probabilistic event-based approach. Impacts are assessed today (as well as in the future) subject to the increase driven by economic development and the further incremental increase of risk due to climate change.
Building on the risk assessment already implemented (Aznar-Siguan and Bresch, 2019b), the present paper describes the concept of options appraisal based on an estimation of the expected change in socioeconomic impact over time. This allows the risk reduction benefit to be compared to the implementation cost of options, covered in Sect. 2, where the object-oriented design of the Python implementation is also documented. Section 3 provides an exemplary case study application, and Sect. 4 concludes with a discussion and provides an outlook for the future.
This extended version of the CLIMADA platform has been designed to enable risk assessment and options appraisal in a modular form and occasionally bespoke fashion (Hinkel and Bisaro, 2016) yet with the high reusability of common functionalities to foster usage in interdisciplinary studies (Souvignet et al., 2016) and international collaboration.
2.1 Concept
Framing the climate adaptation challenge in terms of risk allows us to treat adaptation measures as ways to reduce natural hazard risk both today and in the future. The open-source CLIMADA platform (Aznar-Siguan and Bresch 2019b) integrates hazard, exposure, and vulnerability to (i) assess risk in various metrics and (ii) quantify socioeconomic impacts. Is should be noted that CLIMADA does provide global coverage of major hazards beyond tropical cyclones (TCs), yet we focus on TCs in the present paper for illustrative purposes. Starting from a calibrated impact model to assess current risk, the drivers of risk are first modified to implement the effect of changes in hazard (e.g., climate driven) and exposure (development driven) over time, likely in a scenario fashion (see Serrao-Neumann and Low Choy, 2018). Vulnerability is implemented in CLIMADA by means of hazard- and exposure-specific impact functions. Thus, past and ongoing changes in vulnerability could easily also be taken into account in this framework, but pertinent information usually does not exist.
Adaptation measures are implemented primarily through modification of the impact function (e.g., better building codes leading to lower building damages). Adaptation measures that modify exposure (e.g., spatial planning) or hazard (e.g., dikes), or even combinations thereof, could also be realized in CLIMADA, but they are not part of the present illustrative application. Thus, risk metrics for both today and for future years are calculated with and without each adaptation measure. The (net present value of the) difference of the risk metrics computed with and without the implementation of the measure constitutes the measure's benefit. Together with estimates of implementation (capital expenditures, CAPEX) and maintenance (operations expenditures, OPEX) costs (or payment streams thereof; see Samuelson 1937), a cost–benefit ratio is then calculated for each single adaptation measure. It should be noted that risk metrics need not be monetary; hence, discounting or more general questions of time preference (Frederick et al., 2002) of the benefits might not be directly applicable (e.g., for the number of people displaced or lives lost as a risk metric), and costs could also be specified in nonmonetary units. It should also be noted that climate scenarios and development pathways are usually employed to assess future risk; hence, such cost–benefit considerations are contingent on the scenarios and pathways chosen for analysis. However, as will be shown, very much in the spirit of Wilby and Dessai (2010), (baskets of) adaptation measures can be tested for robustness (Dittrich et al., 2016) under different combinations of scenarios and pathways (as well as other key parameters, such as time-dependent discount rates).
2.2 Implementation
The software architecture defined in Aznar-Siguan and Bresch (2019b) has been extended to include the classes that handle adaptation measures (Measure and MeasureSet), discount rates (DiscRates), and the cost–benefit analysis (CostBenefit), as shown in Fig. 1. Note that other evaluation approaches, such as real options (Hino and Hall, 2017) or multi-criteria analysis (Haque, 2016), could be implemented in a similar fashion, in close correspondence with the cost and benefit as shown here.
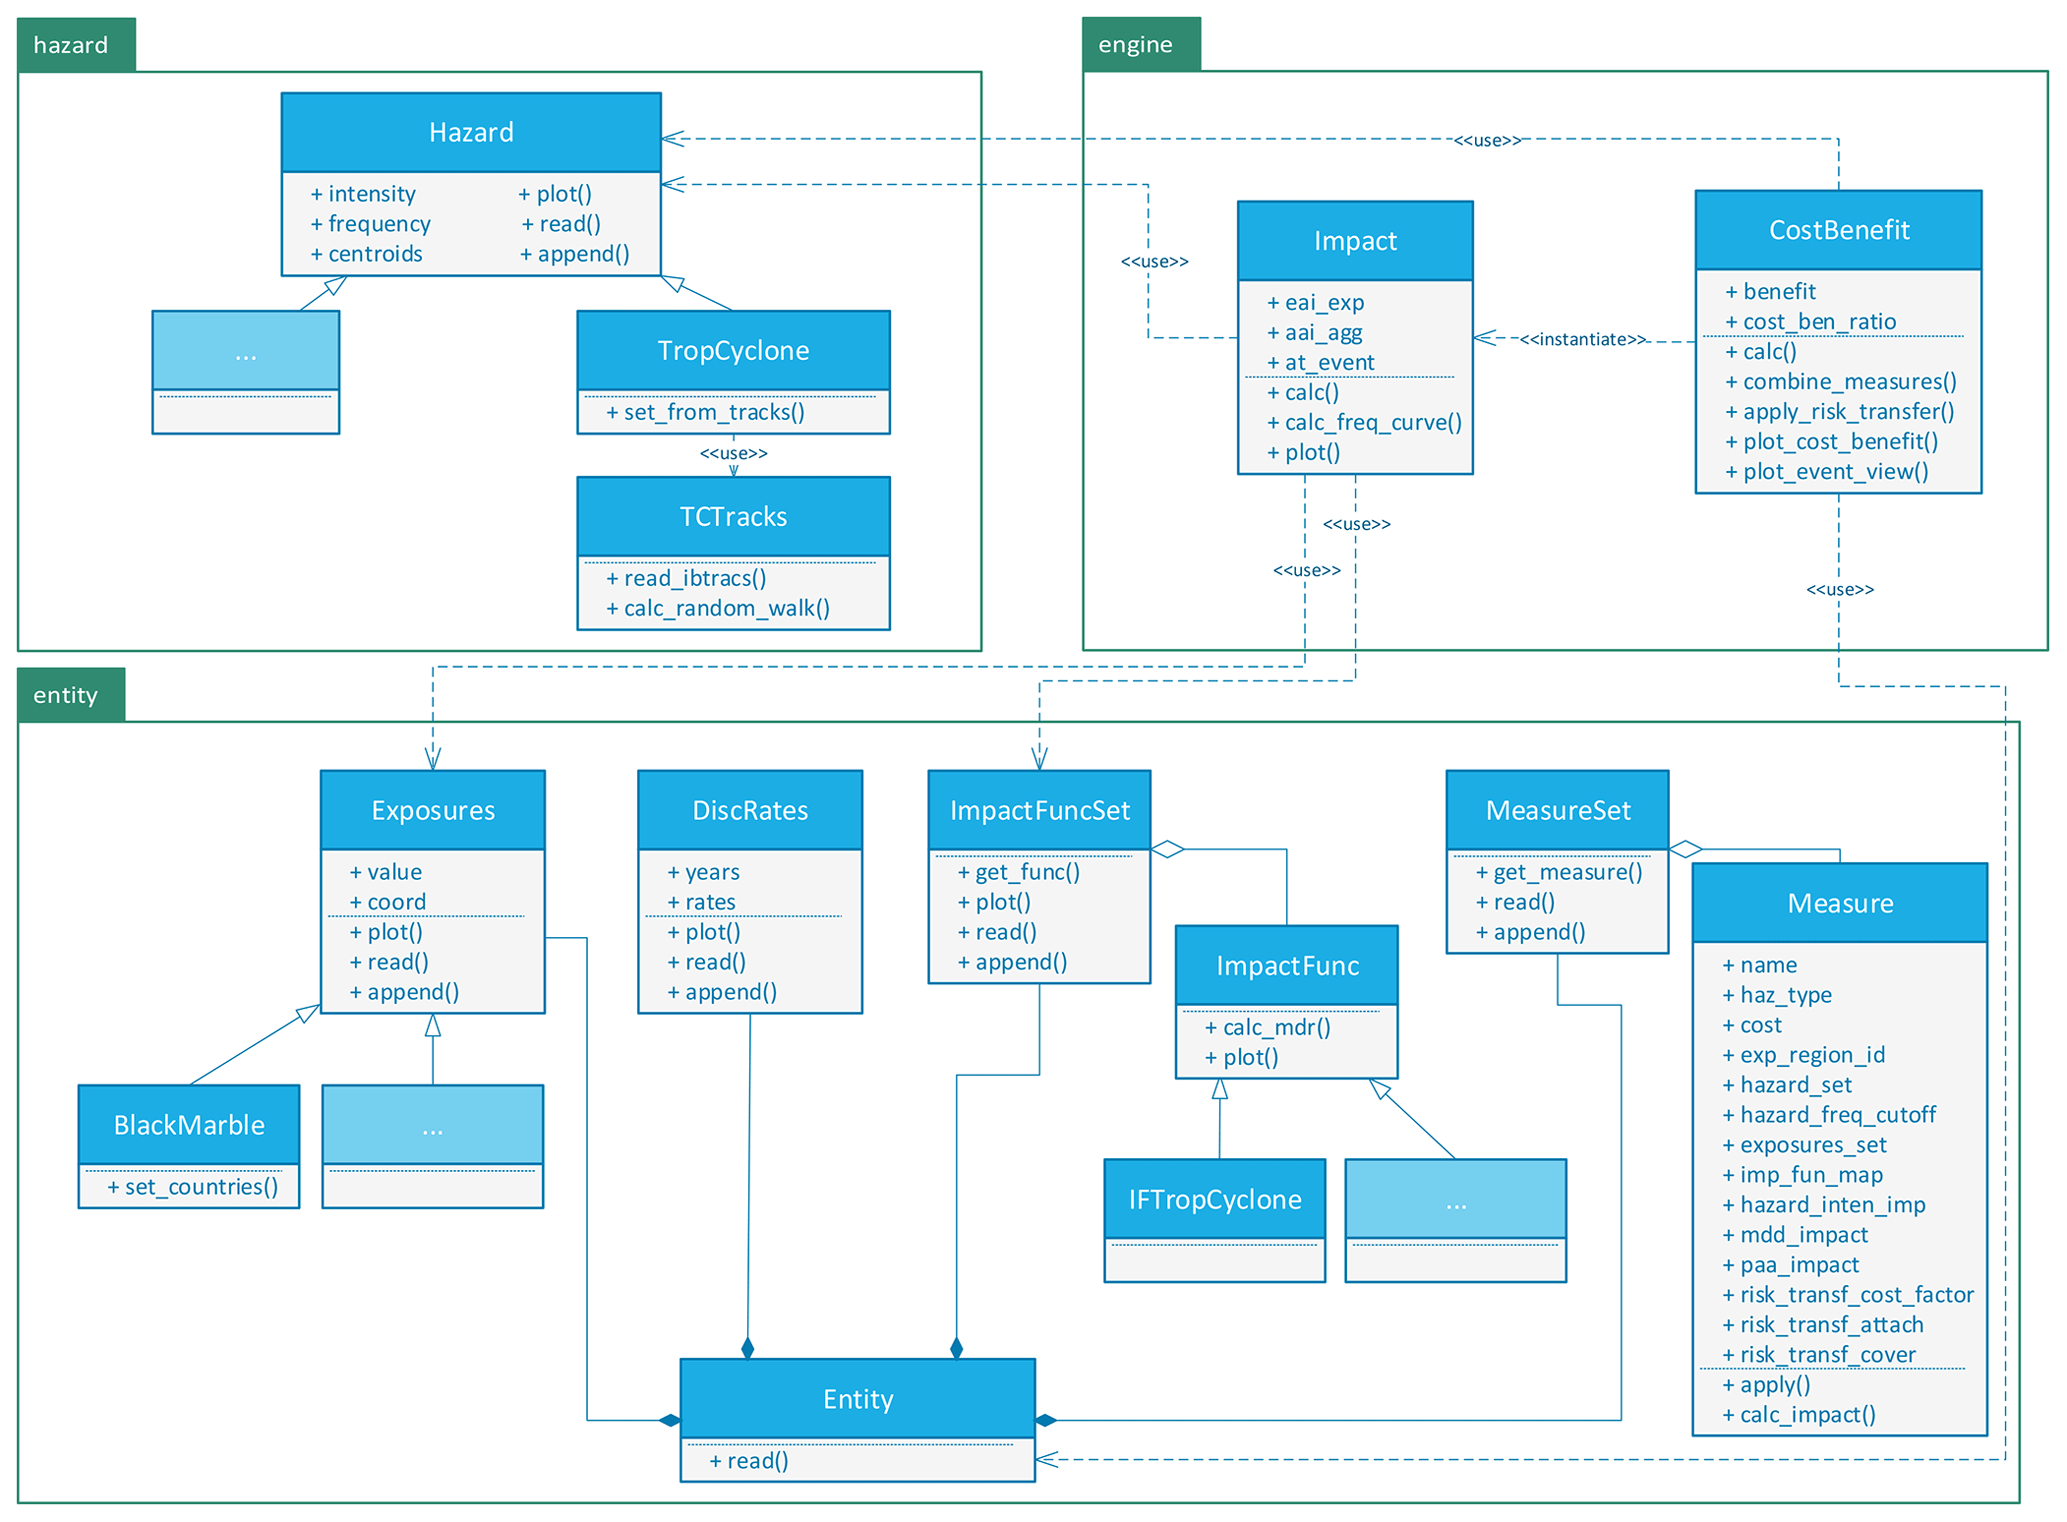
Figure 1Simplified architecture of CLIMADA including classes for adaptation measures, discount rates, and cost–benefit considerations. An extension of Aznar-Siguan and Bresch (2019b).
2.2.1 Adaptation measures
An adaptation measure in CLIMADA is a parametrization of a risk reduction measure that modifies the impact function, the exposure, the hazard, or a combination of any of them, or even directly the resulting impact. A measure is defined in the Measure class and is uniquely identified by its name and the hazard type it is acting on. Its parametrization is implemented via attributes. exp_region_id sets the physical boundaries of the measure, where exposures and hazards outside the defined regions are not modified by the measure; hazard_set and hazard_freq_cutoff change a given Hazard instance. The first replaces the hazard by a new Hazard instance that allows for the flexibility to introduce any desired protection distribution, spatially and in frequency of occurrence (e.g., a flood hazard event set built with higher flood protection in place). hazard_freq_cutoff defines a frequency cutoff that sets impacts at a higher frequency to zero and can thus be used to model a seawall, for example, which avoids all impacts with a frequency higher than hazard_freq_cutoff within its protected region defined by exp_region_id.
The exposures are modified through the exposures_set and imp_fun_map parameters. exposures_set replaces the Exposure instance, and imp_fun_map changes the selected impact functions assigned to each exposure. exposures_set provides more freedom to define changes to the exposure, such as changes in the assets' distribution through modified spatial planning. Implementing a building code for a specific construction type could be modeled with a new impact function, and it can be related to the former impact function through the imp_fun_map attribute.
Even if new impact functions can be easily introduced, the following attributes allow one to perform linear transformations to given impact functions: hazard_inten_imp transforms the abscissae (e.g., implementing elevation of homes in the case of flood), and mdd_impact and paa_impact transform the mean damage degree (MDD) and the percentage of affected assets (PAA, e.g., to reflect an improved building code), respectively. It should be noted that the mean damage ratio (MDR) is defined as the product of MDD and PAA for any given intensity; see Aznar-Siguan and Bresch (2019b) for a detailed description. Finally, a classical risk transfer option can be defined by setting a deductible (or attachment point) and a cover. A deductible and a cover are considered for the resulting damage of each event. Damages greater than the deductible up to cover are carried by the insurer, thereby lowering the damage burden for the insured. As the insurer incurs transaction and capital costs, the total cost of insurance is approximated by application of the multiplicative risk_transf_cost_factor (>1, usually of the order of 1.5 to 2) to the raw expected damage which is calculated for the insured layer (for details, see the case study below as well as, e.g., Surminski et al., 2020). Therefore, for risk transfer, the cost is calculated by CLIMADA.
For measures other than risk transfer, the cost is provided by the user through the cost attribute. This should provide the net present value (NPV) of the initial investment (capital expenditure, CAPEX) as well as the NPV of maintenance costs during the whole time range of implementation considered (operating expenditures, OPEX). The set of measures that are going to be compared in the cost–benefit analysis are gathered in the MeasureSet container, as represented in Fig. 1.
2.2.2 Cost and benefit
The CostBenefit class in Fig. 1 computes the costs and benefits of implementing a set of adaptation measures through its calc method. There, the socioeconomic variables are provided by the Entity class, in which the exposure to the hazard (Exposures instance), a set of impact functions representing the exposures vulnerability (ImpactFuncSet instance), a set of measures (MeasureSet instance), and the (if applicable time- and even measure-dependent) discount rates (DiscRates instance) to be applied over the time period of interest are gathered. The natural hazard is provided by a Hazard instance or a derivate class. Within the calc method the extent and probability of impact resulting from the implementation of each measure are computed through the Impact class, as explained in Aznar-Siguan and Bresch (2019b), and compared to the risk when no measure is applied. The benefit of the measure is its averted impact in terms of a configurable “risk function”. As a default, the average annual averted impact is used, but any risk function, such as any quantile or the averted impact for events with a specific return period (e.g., one in a hundred years), can be considered.
Scenarios of both future hazard and exposure at the end of the time period considered can also be provided as follows: a second Hazard captures the changes in the intensities and probability of occurrence, and a second Entity contains the changed exposures, measures, and, eventually, new impact functions (to account for a change in building quality, for example). The extent and probability of impact for each measure are computed at the beginning and at the end of the time range, and they are stored in the imp_meas_present and imp_meas_future attributes, respectively. The benefit is then computed as the NPV of the average annual averted impact (or the configured risk function) using the discount rates of DiscRates. The values discounted in the years between the beginning and the end of the period are estimated by interpolation through the imp_time_depen parameter. This allows one to set a linear (as by default) or either a concave (large increase at the beginning) or convex (increase mainly towards the end) change in risk over time.
The resulting benefits per measure are stored in the attribute benefit, while the cost–benefit ratio per measure is stored in the cost_ben_ratio attribute. These values are used by the method plot_cost_benefit, where the benefit of each measure is represented against the corresponding benefit–cost ratio in an adaptation cost curve. plot_event_view provides a further understanding of the effectiveness of the measures by showing the quantity of averted impact for events of selected return periods at the end of the time range considered (see case study below for illustrations). If some of the measures are to be implemented simultaneously, the combine_measures method can be used to obtain an approximation of the combined averted impact. There, the benefits of the measures are aggregated at the event level, avoiding double counting, and the risk function is applied afterwards. Furthermore, the apply_risk_transfer method allows one to implement risk transfer on top of selected measures (after combination, if applied, to properly account for risk reduction and diversification effects).
Building on the risk assessment case study documented in Aznar-Siguan and Bresch (2019b), we consider the small Caribbean islands hit by Hurricane Irma. The consequences of the 2017 Atlantic hurricane season underscore the importance of investing in disaster risk reduction for resilience, enhancing disaster preparedness for effective response, and the imperative of “building back better” during recovery, rehabilitation, and reconstruction (ECLAC, 2018).
CLIMADA has been used to quantify adaptation options before (see Bresch, 2016; Bresch and ECA working group, 2009; Bresch and Schraft, 2011; and Souvignet et al., 2016). These assessments were performed following the Economics of Climate Adaptation (ECA) methodology within consortia where data provided by dedicated surveys and local experts fed the models. It should be noted that these studies were well embedded in local stakeholder consultation and co-design processes, especially regarding both the scope and the set of adaptation measures considered. The analysis documented here aims at showing the versatility that CLIMADA offers to compare adaptation measures of different natures under different scenarios, but it does not provide a fully comprehensive adaptation assessment in the sense of a full ECA (Souvignet et al., 2016). In order to keep the case study lean and illustrative, only openly available national indicators are used, and uncertainties are not explored in detail, even though CLIMADA is designed to do so. We first describe the approach for Anguilla in Sect. 3.1 and then apply it later on all of the target islands in Sect. 3.2.
3.1 Adaptation in Anguilla
The analysis of Aznar-Siguan and Bresch (2019b) concludes that the current average annual impact (AAI) of hurricanes in Anguilla is 18±4 million current US dollars. The impacts were assessed in terms of physical damage to infrastructure whose value is proportional to its contribution to the national produced goods and services. Using these modeled assets, the generated tropical cyclone events (historical and synthetic), and the impact function of the previous work, we define several adaptation measures as explained in Sect. 2.2.1 and quantify their cost and benefit in terms of physical protection following Sect. 2.2.2. The time frame considered for this study ranges from 2016 (hereafter referred to as “current” time, establishing a risk baseline) until 2050.
3.1.1 Adaptation measures definition
We consider measures of different natures, such as green and gray infrastructure options (Denjean et al., 2017) as well as behavioral measures. The parameterizations chosen here allow us to reproduce the main findings on Anguilla from the Caribbean Catastrophe Risk Insurance Facility (2010). Ecosystem-based measures such as mangroves can provide substantial protection for properties (even properties that are relatively far away from them) against both storm surges and cyclonic winds (Das and Crépin, 2013; Reguero et al., 2018). The need for reforestation of mangroves in the Caribbean began in the 1980s, when the large-scale conversion of mangroves for aquaculture and tourism infrastructure took place. Even if Anguilla maintained a relatively constant mangrove area of 90 ha (Food and Agriculture Organization of the United Nations, 2007), these mangroves can be further damaged by storms. We define an investment of USD 100 000 ha−1 for the restoration of Anguilla's mangroves (Lewis, 2001) and an annual maintenance cost of USD 200 ha−1 that leads to a reduction in the impact function intensity of 0.74 % on the coast; this value is twice as high inland. The resulting impact functions (mangrove_coast and mangrove_inland, respectively) are represented in Fig. 2.
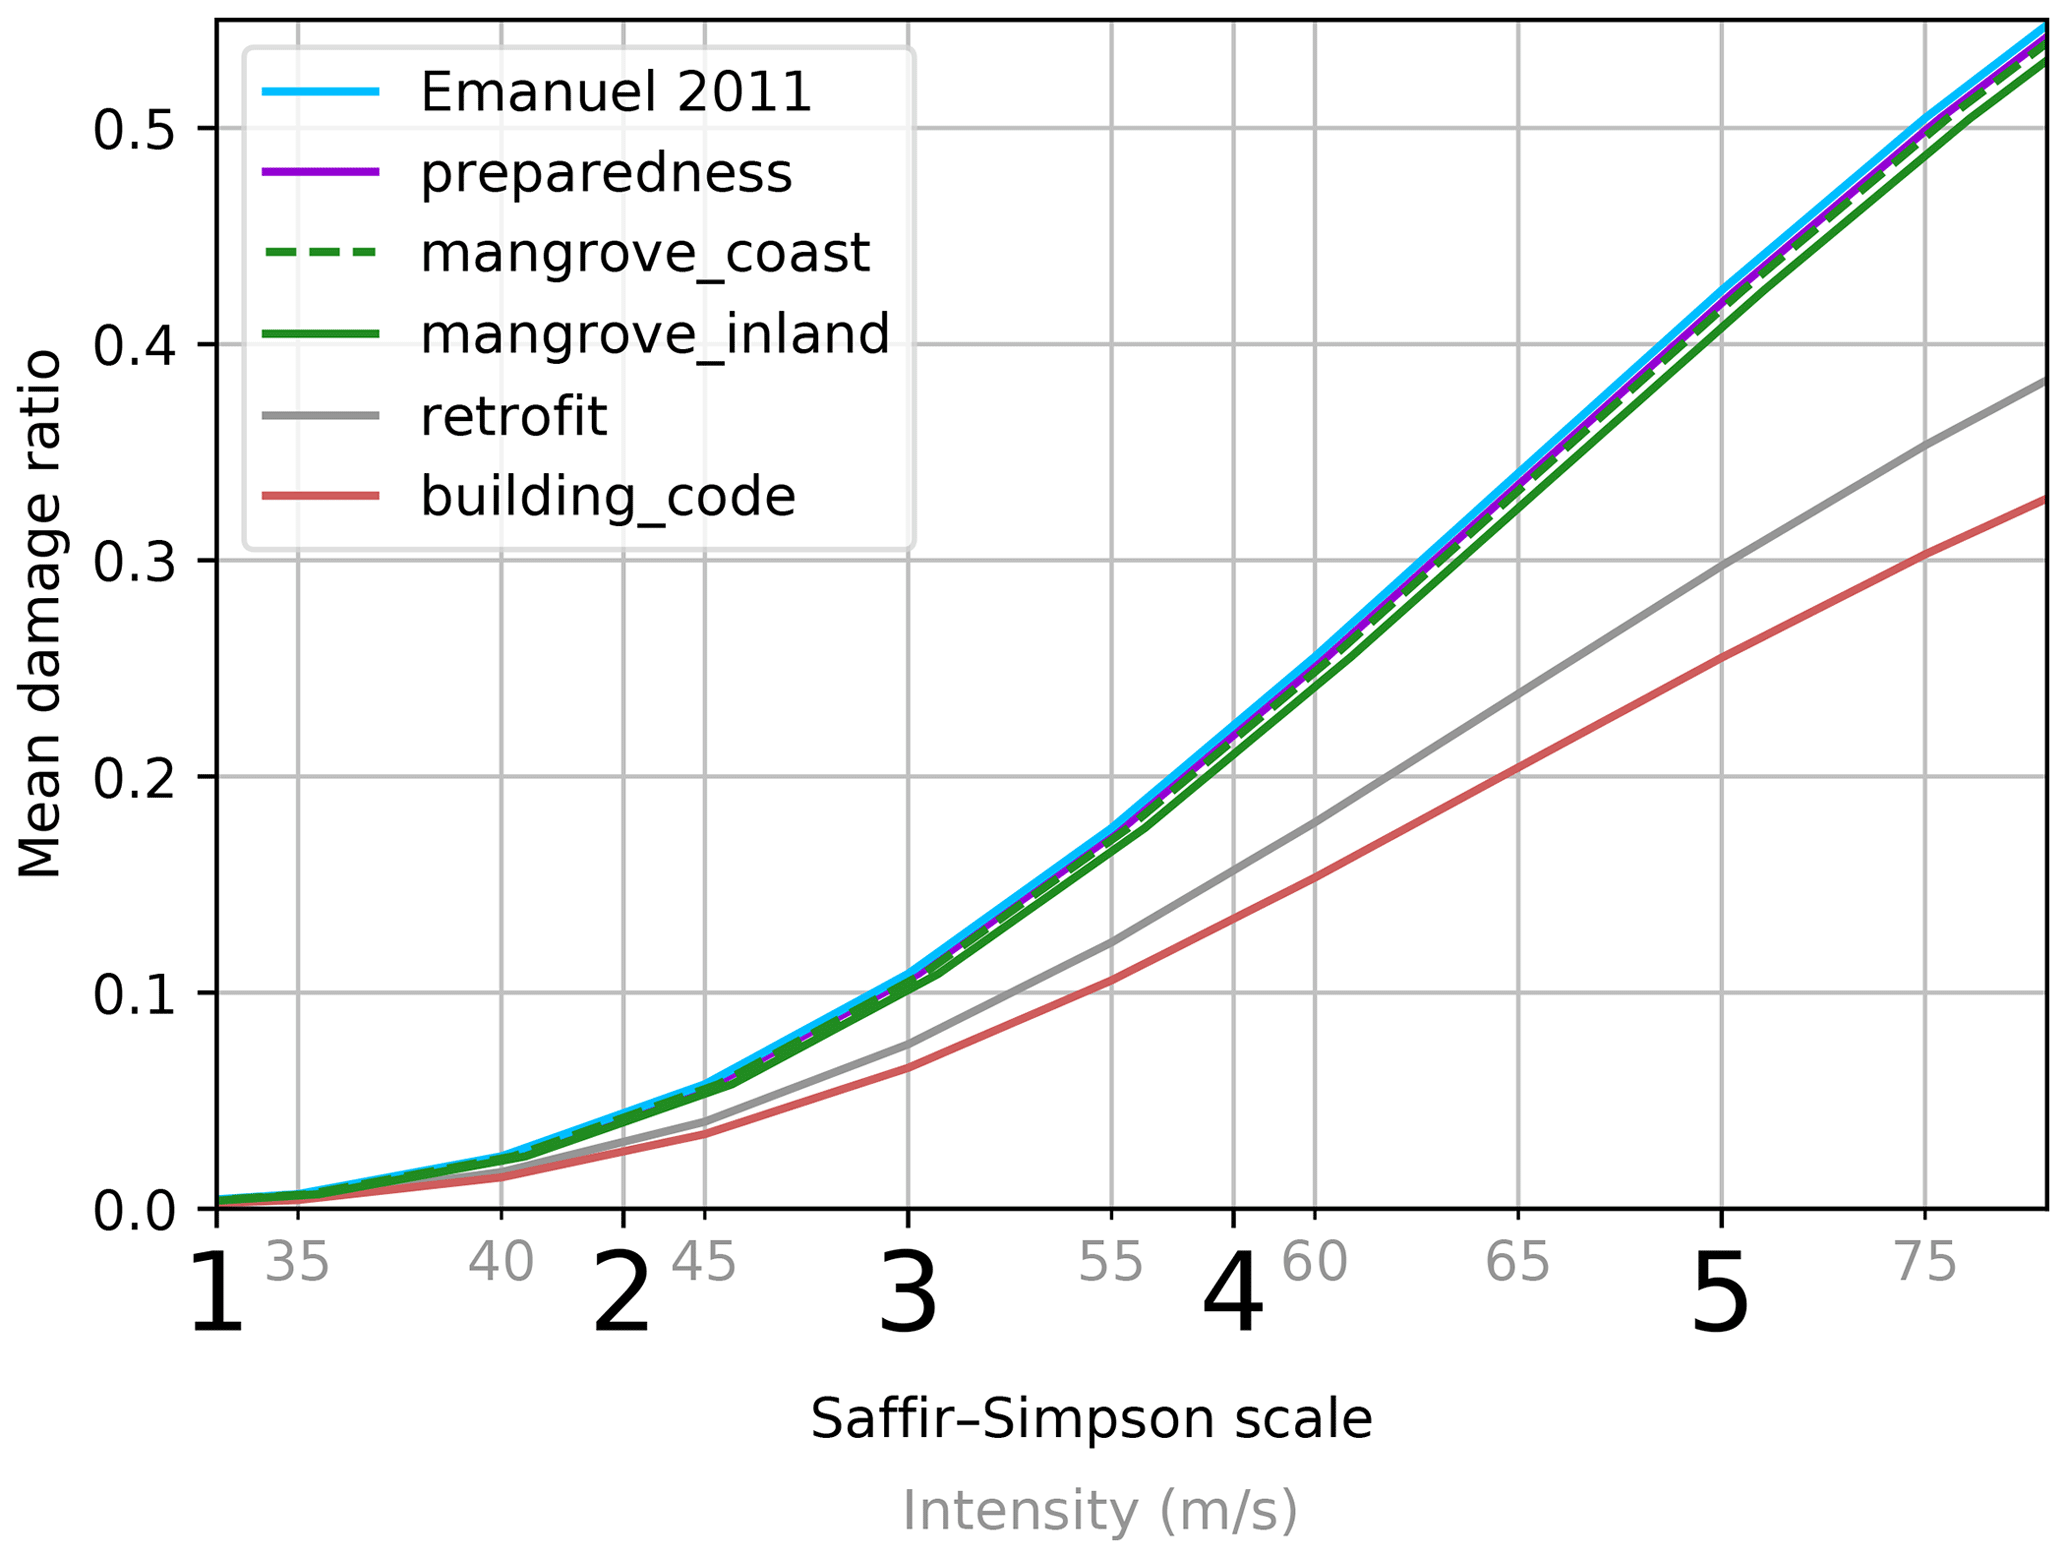
Figure 2Impact functions used in the definition of adaptation options. Emanuel 2011 refers to the impact function used in the risk assessment, following Emanuel (2011), and the Saffir–Simpson hurricane wind scale is shown as a reference (Schott et al., 2019). preparedness is the impact function obtained once the behavioral measure named preparedness is implemented. Mangrove reforestation generates the mangrove_coast impact function at a distance of up to 500 m from the coast and the mangrove_inland impact function on the rest of the island. retrofit and building_code show an impact reduction of 30 % and 40 %, respectively, at every wind intensity with respect to Emanuel 2011. See Aznar-Siguan and Bresch (2019b) for details about the mean damage ratio (MDR).
As gray options, we consider retrofitting and the implementation of building codes. Retrofitting existing housing not only reduces damages due to natural disasters, but it can also lead to a reduction in insurance costs (Surminski et al., 2020), potentially increases the market value of a building, and may have co-benefits such as energy saving. Here, we only consider the benefit caused by physical protection, which we set to an idealized 30 % of damage reduction at every wind intensity (see Fig. 2). Retrofitting can cost anywhere between 1 % and 20 % of the value of the property (Ou-Yang et al., 2013; Triveno and Hausler, 2017) and can be efficiently subsidized by governments. For illustration purposes, we set a total cost of 10 % of the retrofitted assets. The retrofit is performed progressively, with 10 % of the asset's value retrofitted in 2016, reaching 90 % in 2050.
Implementing building codes has similar benefits to retrofitting but only in newly constructed buildings. Its success lies in its enforcement and subsequent inspection, especially in residential housing (Prevatt et al., 2010). To assess its benefits and costs, we consider an annual rate of urbanization in Anguilla of 0.9 % (Central Intelligence Agency, 2019) and a 40 % reduction in the impact function (see Fig. 2). To approximate the costs for the government to train construction workers and hire inspectors as well as the owners expenses, the cost is set to 5 % of that of the annual newly built houses.
Preparing houses by protecting windows, roofs, and clearing the exteriors helps to reduce damage. Such action can be explained and promoted through labels (Attems et al., 2020), leaflets, or, for example, at the bottom of bills such as the electricity invoice. We name this measure preparedness, and we approximate its cost per inhabitant as (i) the cost of communication of USD 1 plus (ii) an annual USD 0.2 maintenance, and (iii) USD 100 as bulk expense for protection material. This measure ideally reduces the effective wind intensity and avoids most of the damages for events with low return periods. We set a wind intensity reduction of 0.5 % (see impact function in Fig. 2) and a threshold of 7-year events under which no damages are generated. This threshold corresponds to events with exceedance damages lower than USD 1.5 million.
Finally, risk transfer is considered, being particularly suitable to manage risks of low-frequency, high-severity events. We define an insurance layer with an attachment point (or deductible, i.e., the damage amount corresponding to a frequency at which the risk transfer is triggered on average) and cover (the amount of damage covered by risk transfer) proportional to the island's expected exceedance damages. The attachment is set to the 12-year per event damage (approximately USD 32 million), and the cover is designed to cater for events with up to a 145-year return period (which results in the risk transfer covering approximately USD 314 million per event). This comes at a cost of USD 1 million plus 2 % of the cover amount (a simple proxy for transaction and capital costs) plus 1.5 times (the risk_transf_cost_factor) the expected damage in the insurance layer (more to illustrate the implementation in principle than to model a specific case).
3.1.2 Cost and benefit of adaptation measures under changing risk
The risk of tropical cyclones during the 35 years of the implementation of the measures will change because of economic development (increased exposure and modified impact functions) and climate change (changing hazard). In order to assess the uncertainty of the future, CLIMADA compares different plausible future scenarios. Here, we consider a moderate scenario, where the economic growth follows the trend of the previous years (a 2 % annual increase) and the change in tropical cyclones follows a climate change stabilization scenario (the Representative Concentration Pathway, RCP, 4.5). We implement the consequent changes in intensity and frequency of tropical cyclones at 2050, following Knutson et al. (2015). Under this scenario the AAI is increased by USD 23 million, leading to a mean AAI of USD 41 million in 2050. Considering a linear change in risk during the 35 years and a discount rate of 2 %, the net present value (NPV) of the total expected damages is USD 723 million, which is 57 % higher than without an increase in risk due to economic development and (moderate) climate change, as illustrated in Fig. 3. Almost one-fourth of the damage increase in the moderate scenario is attributable to climate change, while the main increase is due to economic development. These changes in risk over time have a substantial impact on the cost–benefit analysis of the adaptation measures.
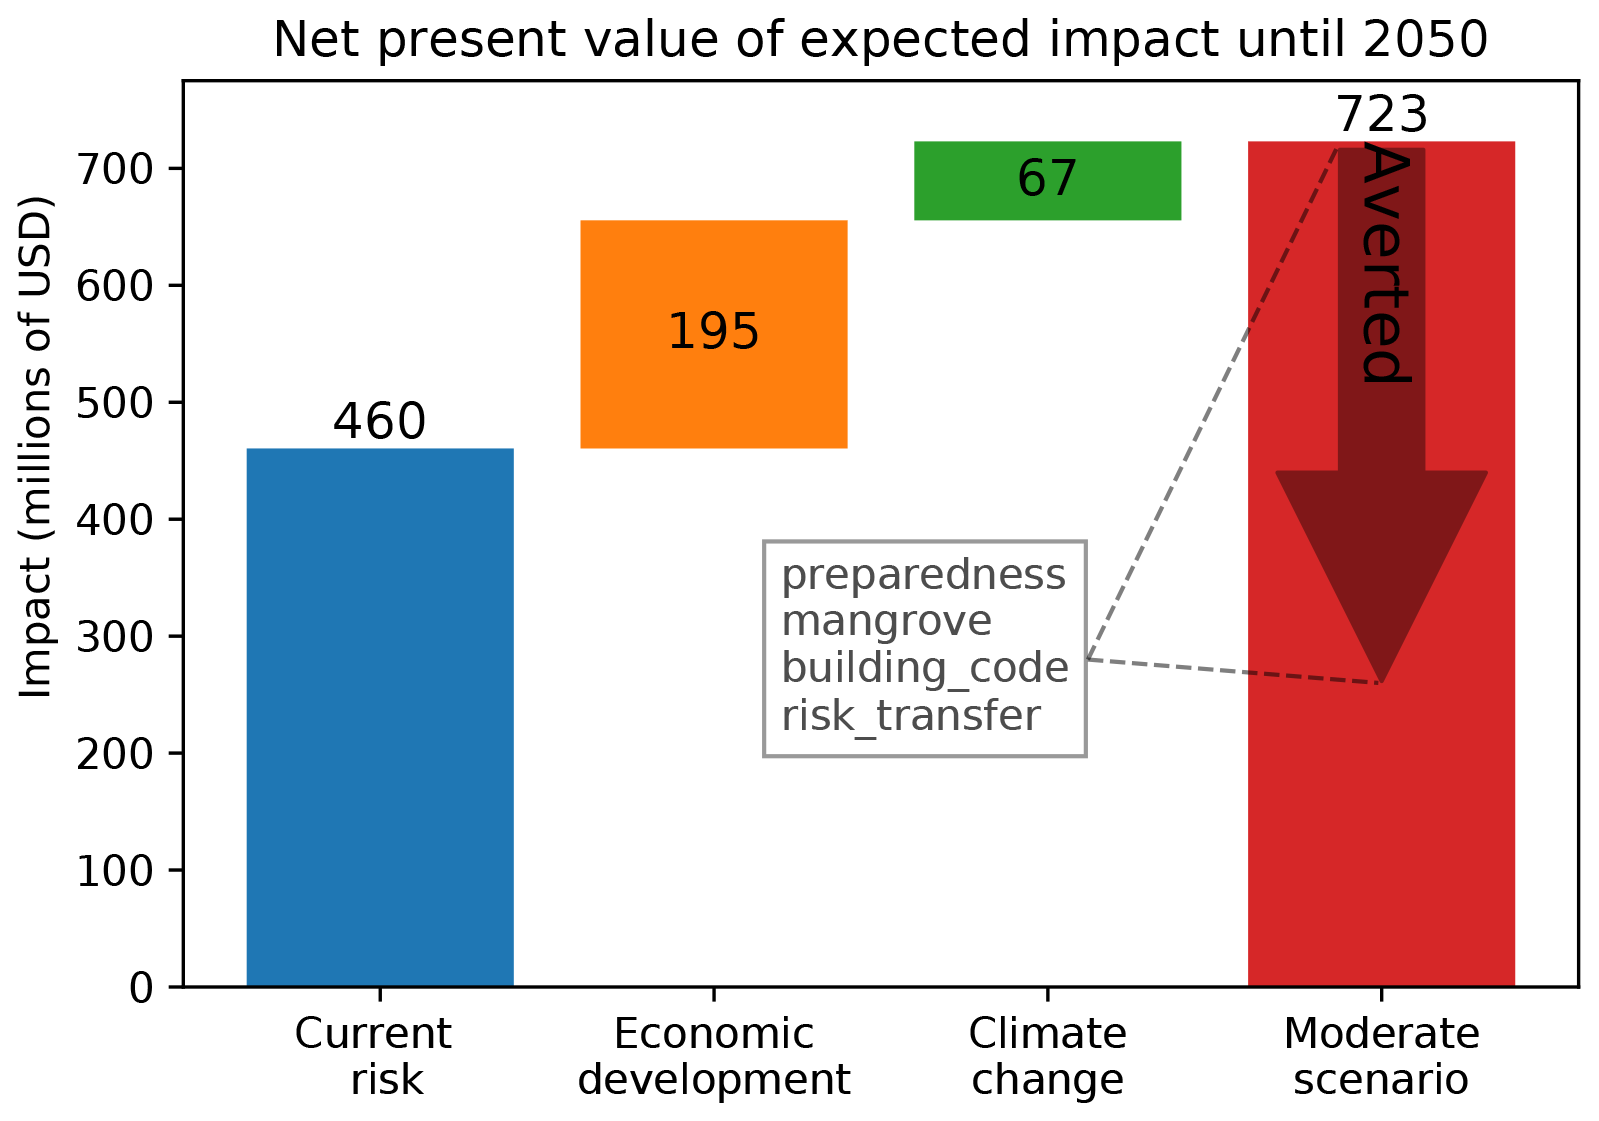
Figure 3Net present values (NPVs) of the expected tropical cyclone damage (average annual impact, AAI) in Anguilla by 2050. “Current risk” represents the NPV of the expected impacts from 2016 until 2050 if neither assets nor climate changes are taken into account. “Moderate scenario” shows the NPV of expected impacts with moderate economic development and climate change following RCP 4.5. The separate contribution to the total expected impact are shown in the “Economic development” and “Climate change” columns, respectively. The “Averted” arrow shows the quantity of impact that can be averted combining the preparedness, mangrove, building_code, and risk_transfer measures, as explained below (Fig. 4).
Figure 4 represents the NPV of the expected impact (“Total risk” tag) without changing risk (a) and with the moderate-risk-increase scenario (b). These amounts are compared to the total averted impact of each measure on the x axis. Whilst the implementation of all measures with current risk could eventually lead to averting almost all of the expected impact, this is no longer possible by 2050, given the increase in risk driven by both economic growth and climate change (Fig. 3), despite the concomitant increase in the averted impact of each measure. Nevertheless, the cost-effectiveness of all measures increases in the moderate scenario (and would increase even more in a high-change scenario). Preparedness and mangrove increase their benefit–cost ratio to values well above 1, 11.7, and 4.5, respectively, whereas the gray solutions' effectiveness increases more moderately. Retrofit remains the measure averting most of the damage after risk_transfer, but it is still not cost-effective, reaching a benefit–cost ratio of 0.88. Building_code averts of the order of USD 1 million of damages more than mangrove, but its benefit–cost ratio stays below 2. The risk_transfer option is not cost-efficient in the narrow sense, due to transaction and capital costs, but likely still remains attractive to a risk-averse agent (e.g., Jullien et al., 1999).
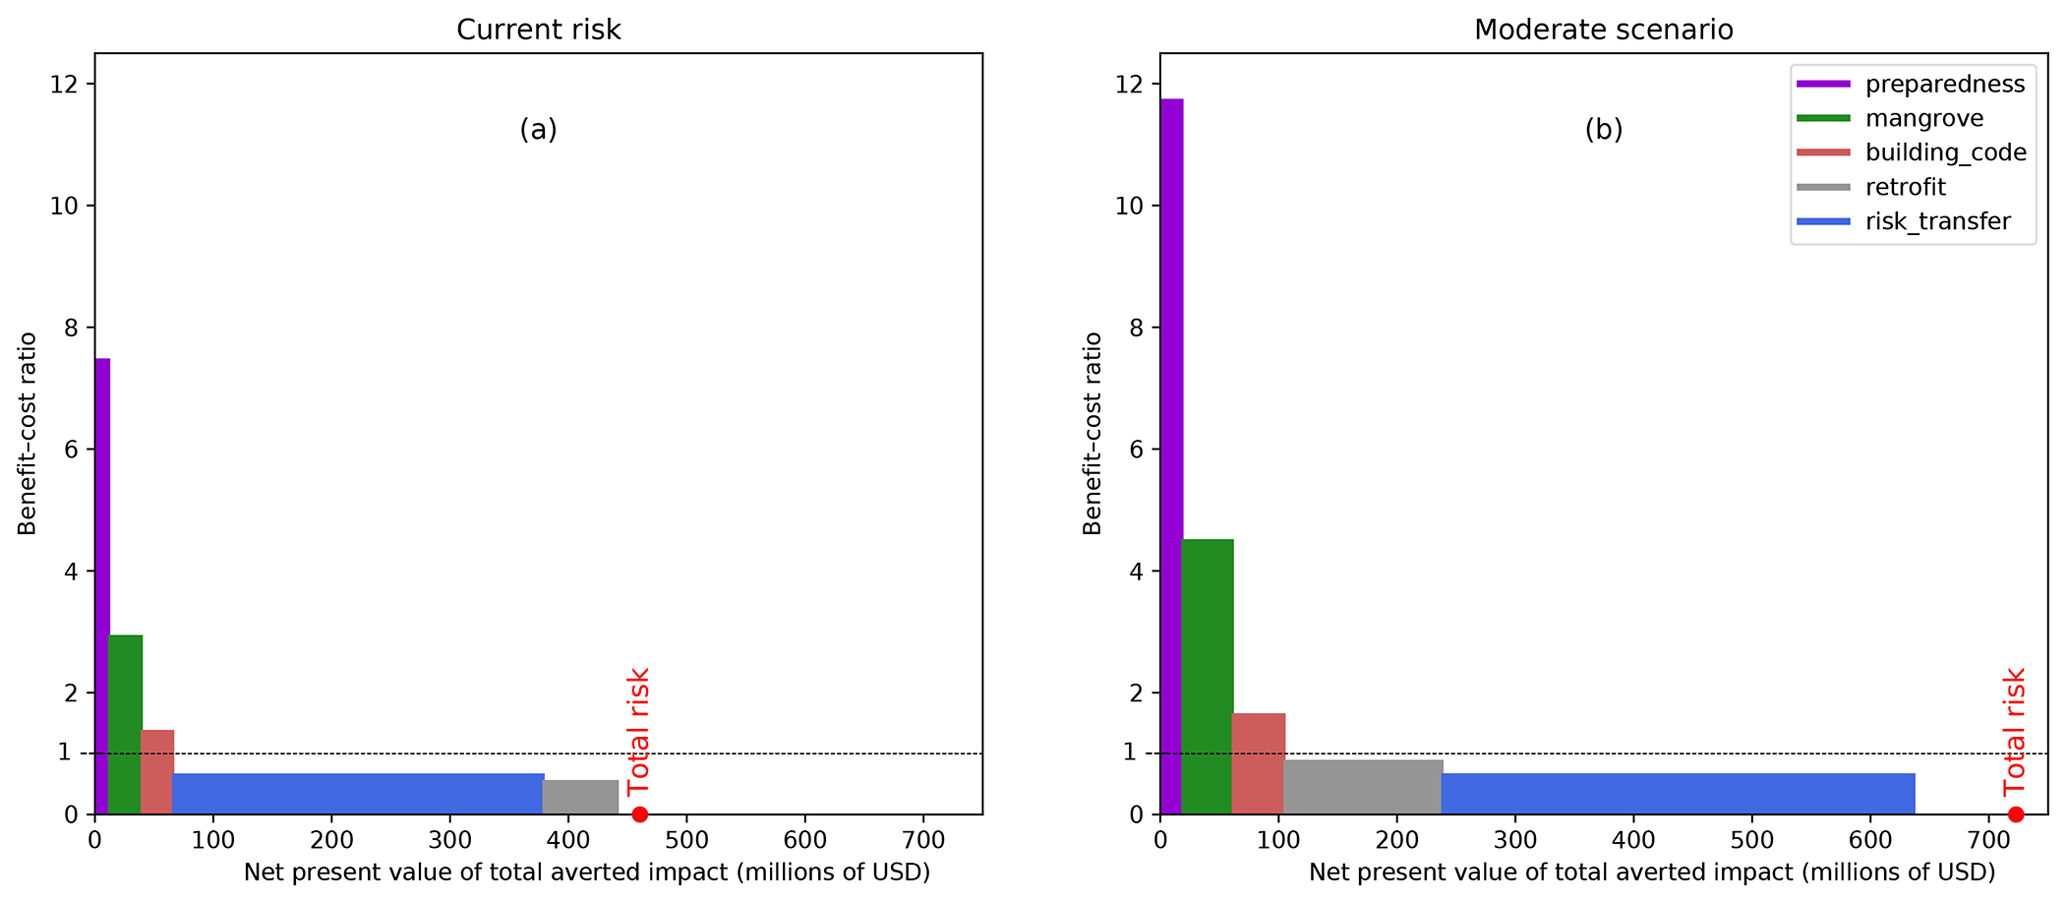
Figure 4Net present value (NPV) of each measures' total benefit and benefit–cost ratio without a changing future (a) and with a scenario of moderate change (b). “Total risk” indicates the NPV of the total damage expected if no measure is implemented (as in Fig. 3, above).
Performance of the measures is further represented in Fig. 5. The expected exceedance damages for events with return periods of 7, 10, and 40 years are shown together with the amount of damage that every measure averts, both considering the current risk (a) and the moderate-change scenario (b). By construction, preparedness averts all of the damages for events with return periods lower than or equal to 7 years, but its protection is minimal for less frequent events. This is not the case for building_code, where performance improves with the increasing return period of events in the same way as retrofit does. The latter just averts more damage than building_code because it is implemented more extensively. For events with 10-year return periods, the current risk scenario does not reach the attachment point of the risk_transfer (set at 12 years), whereas the increase in risk under the moderate scenario already triggers risk transfer more often than every 10 years in the future. However, even by using risk_transfer solutions along with all of the other measures, 40-year events can no longer be fully covered under the moderate-change scenario by 2050.
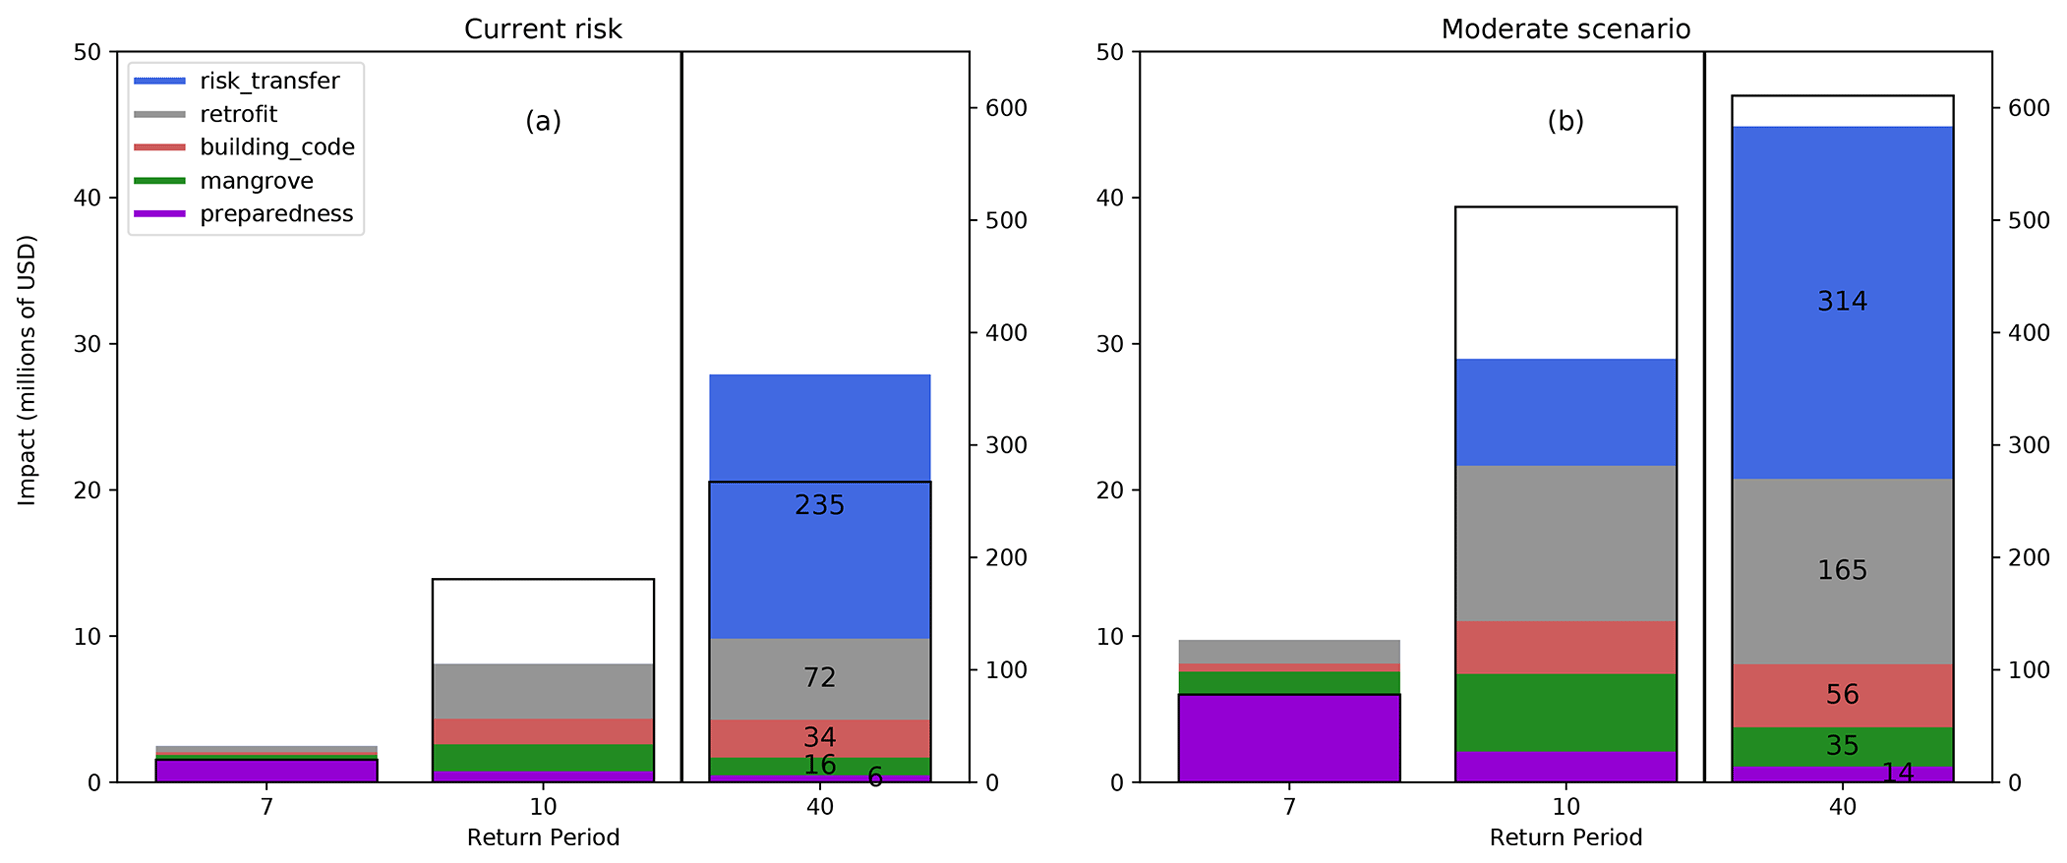
Figure 5Averted impact of each measure in 2050 for different return periods, without taking climate change or economic growth into account (a) and with the moderate risk increase (b). The thin black bars show the expected exceedance damages at each return period, and each colored block indicates the amount averted by the corresponding measure. The capacity of measures to absorb damage exceeds the expected damage for high-frequency (7 year) events, and risk transfer is more than sufficient in panel (a). Note the different vertical scale (on the right) for a 40-year return period. Shown are non-discounted values.
3.1.3 Combining measures
Figure 4 represents the averted damages of each measure independently. Combining the three most cost-effective measures for Anguilla (preparedness, mangrove, and building_code) in the moderate-risk scenario only averts a total damage of USD 104 million, which is only slightly lower than their added benefits (as combining them in CLIMADA avoids double-counting them). Applying risk_transfer on top of these measures will further increase the averted damage to USD 469 million, which is 65 % of all of the expected damage (see averted damage in Fig. 3). Even if risk_transfer alone was already averting USD 399 million, the difference of combining insurance with other adaptation solutions leads to a substantial reduction in cost for insurance. Implemented alone, risk_transfer costs USD 605 million, compared with USD 554 million when combined with preparedness, mangrove, and building_code, leading to an improved insurance benefit–cost ratio of 0.79 instead of 0.66. The reader is referred to Aznar-Siguan and Bresch (2020) for the detailed results.
3.2 Antilles heterogeneity
To illustrate the capability to consistently assess a basket of adaption options for different territories with common challenges, the same adaptation measure definitions as those in Sect. 3.1.1 can be applied for the neighboring islands using the indicators of Table 1. The mangrove protection is set by linearly interpolating Anguilla's factor proportionally to the island's ratio of mangrove area to total area. A maximum 1.5 % and 3 % reduction in intensity is fixed on the coast and inland, respectively. The first parameter in the parentheses in the last column of Table 1 represents the percentage reduction in mangroves in coastal areas, and the second parameter represents inland areas.
Table 1Economic and environmental indicators used in the cost and benefit analysis of adaptation measures per island group. Mangrove protection refers to the percentage of intensity reduced on the cost and in the inland, respectively. The mangrove area (in hectares, ha) is extracted from Food and Agriculture Organization of the United Nations (2007) and the indicators from Central Intelligence Agency (2019).
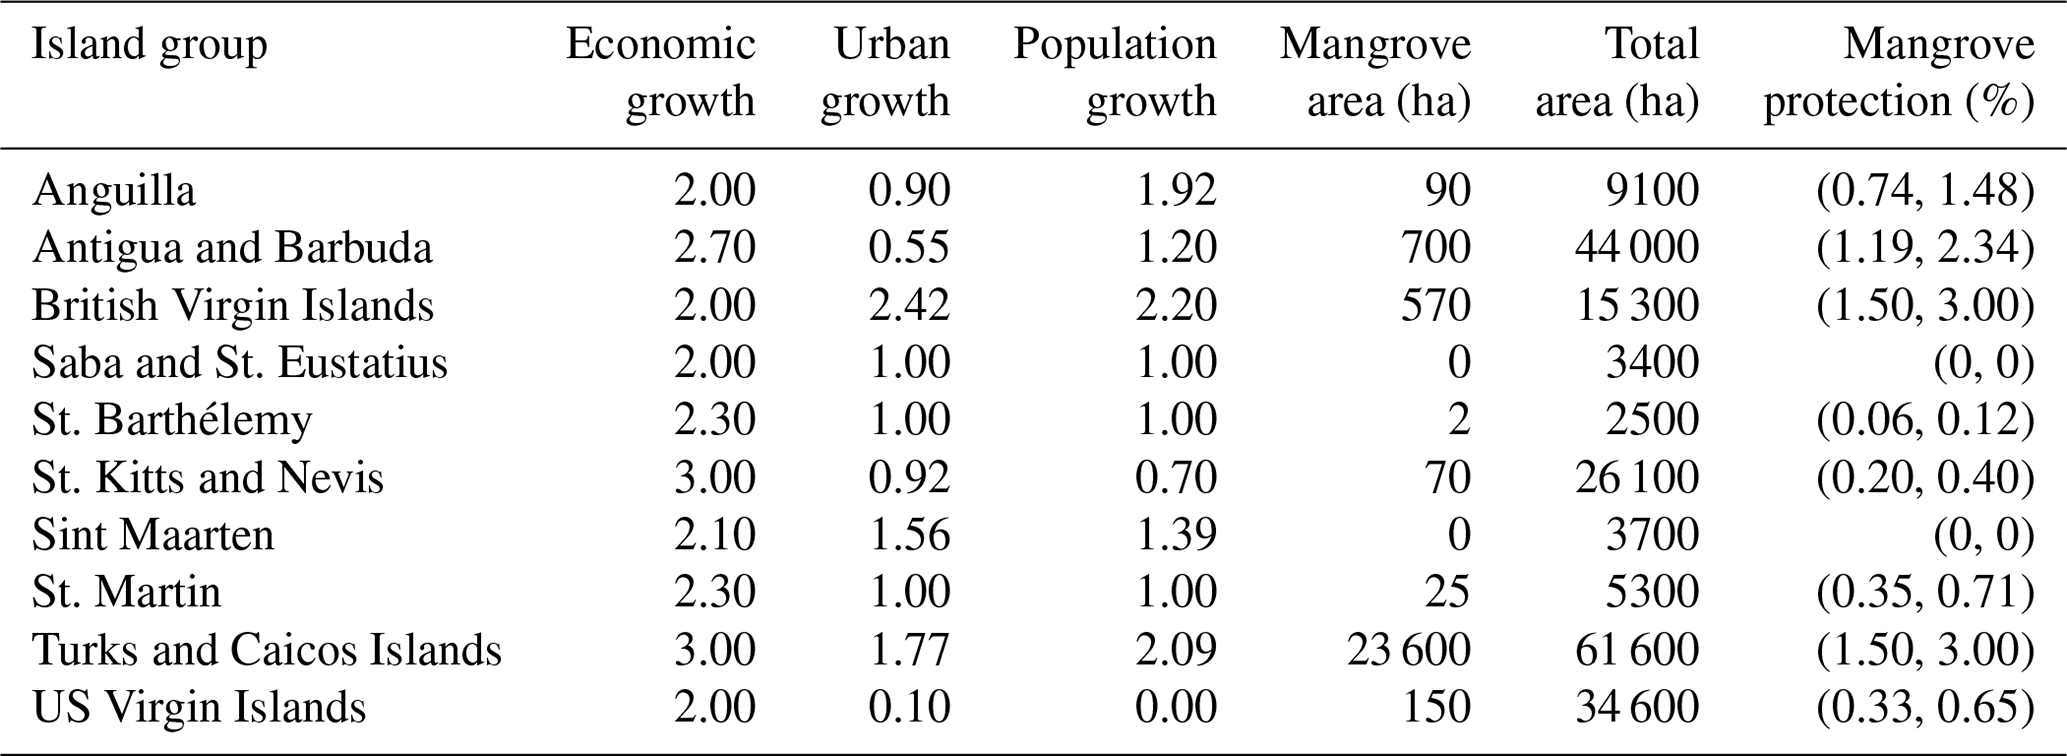
With this simple setting, the different situations with respect to the islands become apparent. Taking the three most cost-effective measures for each island group and combining them together with the risk_transfer option, between 53 % and 76 % of the total accumulated damages can be averted with a benefit–cost ratio ranging from 0.74 to 0.92. The islands that can avert more than 68 % of the damages (represented in gold in Fig. 6) manage to do so in different ways. The British Virgin Islands appear to see the most cost-effective measures. By preserving their 570 ha of mangroves and implementing preparedness, building_code, and risk_transfer, they avert 75 % of the total expected damages with a benefit–cost ratio of 0.92. Restoring all of the mangroves on the Turks and Caicos Islands appears to be far too expensive, with a benefit–cost ratio of 0.09. In this region, the gray options building_code and retrofit are the measures that, along with preparedness and risk_transfer, manage to reduce 70 % of the damages with a benefit–cost ratio of 0.80. Saba and St. Eustatius and Sint Maarten also need gray solutions, as they have no mangroves to restore, and these measures avert 73 % and 76 % of the expected damages with a benefit–cost ratio of 0.74 and 0.79, respectively. The mangrove area in Anguilla is sufficient to avert 65 % of the damages when combined with preparedness, building_code, and risk_transfer (purple category in Fig. 6). This is not the case for the United States Virgin Islands, St. Martin, St. Kitts and Nevis, and St. Barthélemy, where the same measures lead to a lower reduction in the damage of between 53 % and 61 % (cyan category in Fig. 6). Finally, Antigua and Barbuda manages to avert a similar quantity of expected damage as the previously mentioned United States Virgin Islands with the same measures but has an increased benefit–cost ratio of 0.84. Detailed results for each island as well as the possibility to further experiment with different parameters or settings can be found in Aznar-Siguan and Bresch (2020).
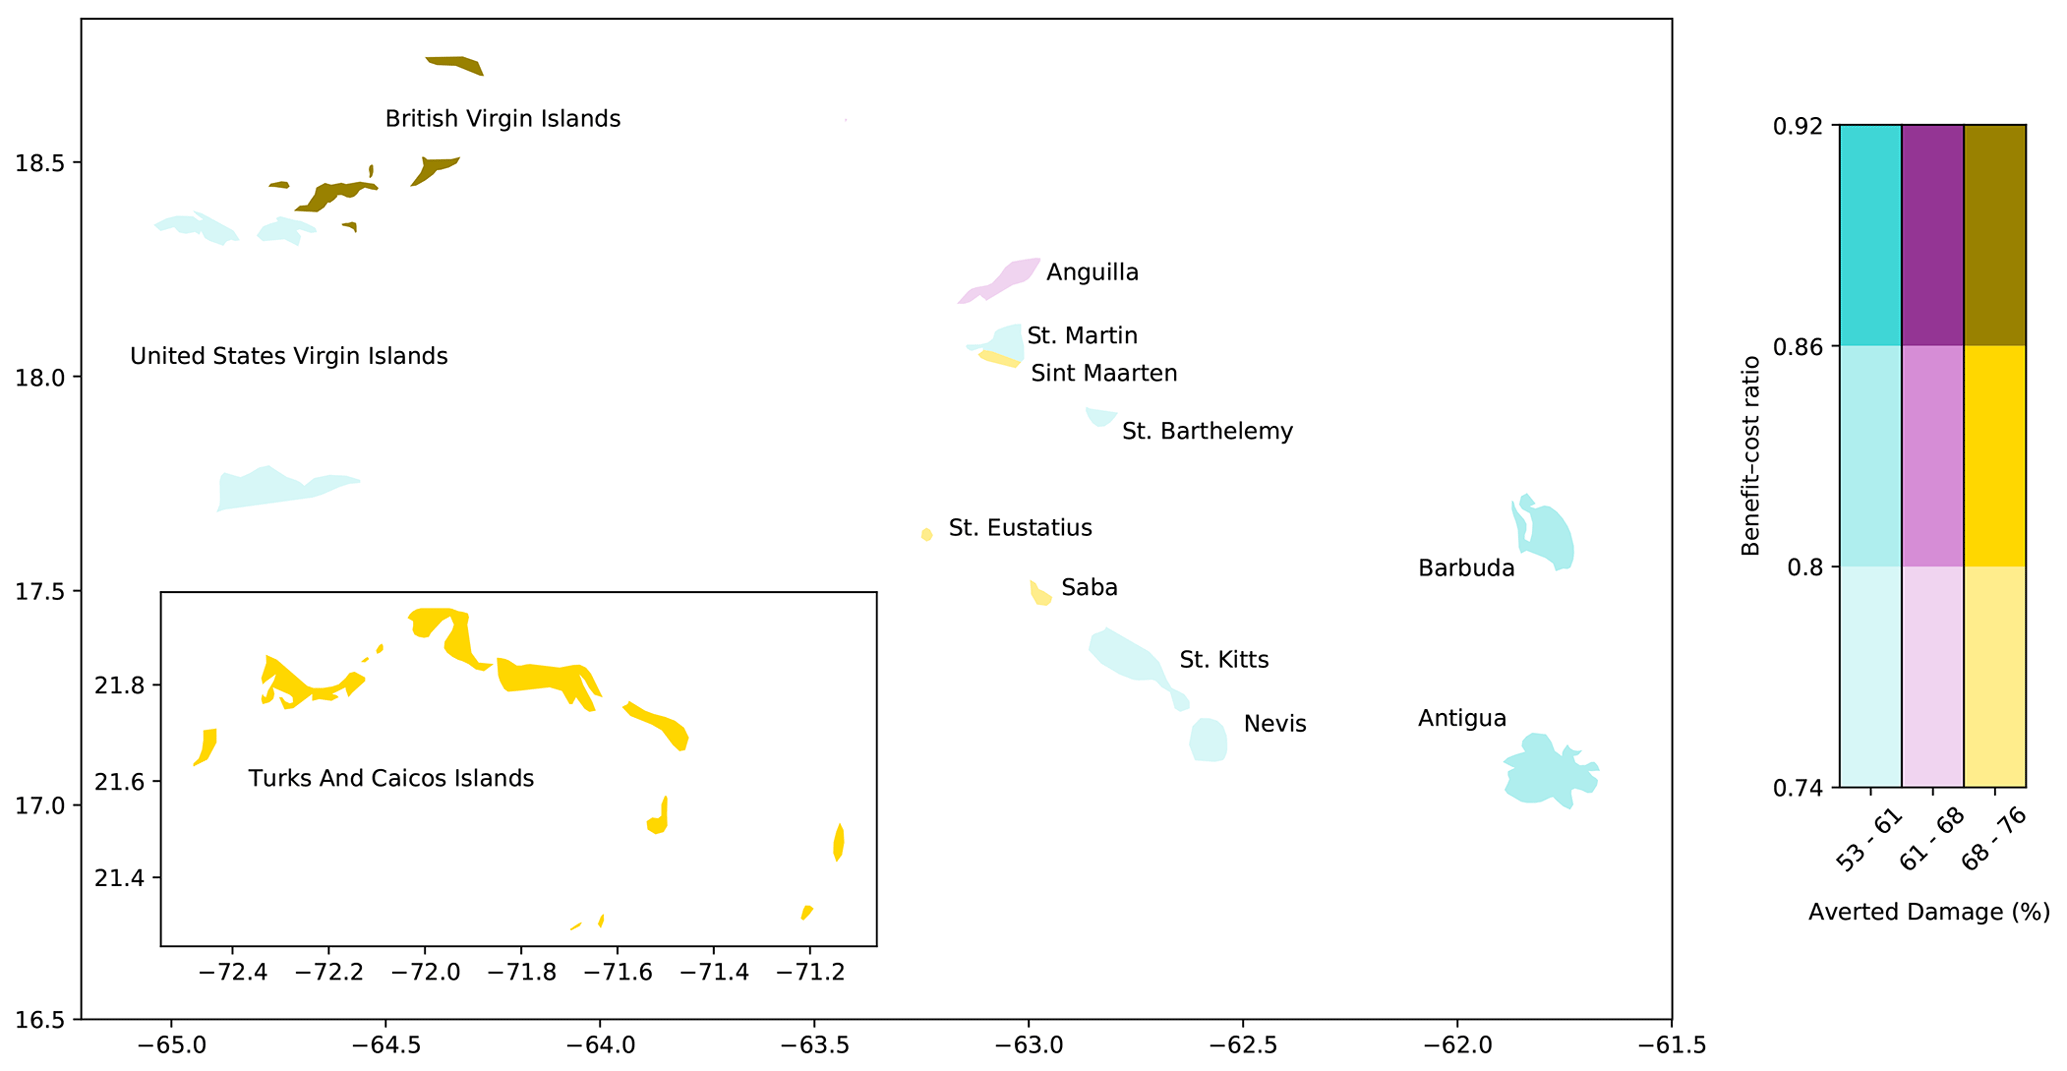
Figure 6Cost–benefit relations in selected islands in the Antilles. The three most cost-effective measures are combined with the risk transfer solution, and the resulting net present value of the total expected averted damages from 2016 to 2050 (benefit) is categorized into three equally spaced ranges – cyan (53 % to 61 % of damages averted), purple (61 % to 68 %), and gold (68 %–76 %) – and the benefit–cost ratio is also shown in three indicative ranges. The color intensity represents the benefit–cost ratio: the darkest colors result in more cost-effective measures.
In this paper we presented the concept of probabilistic options appraisal by extension of the CLIMADA impact modeling platform (Aznar-Siguan and Bresch, 2019b). In addition to the application to a specific and bespoke local situation, the platform allows for an intercomparison of adaptation measures across different contexts. CLIMADA underpins the wider Economics of Climate Adaptation (ECA) approach (Souvignet et al., 2016) and offers ready-to-use global hazard and exposure models that are able to provide first approximations at the local level as well as consistent regional comparisons. Additionally, high-resolution hazard models and specific exposure and impact functions can be implemented in CLIMADA to perform detailed analysis on target locations and adaptation measures, which might have been selected based on the findings of a first, less granular analysis. As CLIMADA integrates an end-to-end view of risk, from the risk drivers (such as socioeconomic development and climate change scenarios) to the resulting metrics for decision support, it lends itself to comprehensive sensitivity analyses and allows one to identify areas for effective model improvement. Building on previous work (Aznar-Siguan and Bresch, 2019b), we demonstrate CLIMADA's capability to analyze a basket of adaptation options for a set of Caribbean islands hit by hurricane Irma in 2017, using openly available indicators. Whilst an accurate analysis is outside the scope of this paper, the results illustrate the dependence of cost-effective solutions on social and environmental conditions in a limited area and scope of study.
While CLIMADA would lend itself to a detailed assessment of uncertainties in all elements of the analysis, we abstained from doing so in order to keep the case study illustrative and the figures more easily readable. Main drivers of uncertainty, beyond those in hazard, exposure, and vulnerability (Aznar-Siguan and Bresch, 2019b) for the four adaptation measures, while not quantified, can at least be qualitatively described as follows. As for preparedness, the level and scope for this study have been chosen based on general findings of previous ECA studies (Caribbean Catastrophe Risk Insurance Facility, 2010), where large differences had been found across regions, mainly stemming from barriers to implementation such as lack of agency of non-owner property residents. Notwithstanding, in all cases, preparedness does lower damages and almost always at a benefit–cost ratio >1 on a societal level, which does not necessarily mean that it is always “worth the money” for the single property owner. As for mangroves, the differences in applicability to single islands have been mentioned above. Again, as shown in studies (e.g, Reguero et al., 2018), such nature-based solutions (while difficult to assess at great precision in terms of exact benefit–cost) yield ratios far above 1 if applied at scale. With building codes, it all depends on design – and enforcement. The latter is utterly cultural, and any assessment must remain spurious, as even past experience might not provide solid a guidance for present and future uptake. On the other hand, implementation is rather straightforward in CLIMADA in terms of the impact function as far as the design component is concerned; hence, relative uncertainty can be limited there. Retrofit is implemented the exact same way as building codes and is exposed to the same threat with respect to enforcement. Risk transfer in contrast to measures discussed so far, which is a purely monetary transaction, shows, in its assessment at least, less uncertainty. However, it inherits all of the underlying uncertainty of the probabilistic model as well as of the measures in terms of their risk reduction capacity. After carrying out tests with many (sets of) parameters (Aznar-Siguan and Bresch, 2020), it was found that the results regarding the effectiveness of risk transfer proved robust and, most importantly, the relative order of measures in terms of cost-effectiveness in general is also very robust.
We show that combining measures of different natures, such as mangrove restoration, preparedness, building code enforcement, and retrofitting, can increase the amount of averted damage in a cost-effective way. In Anguilla, restoring mangroves averts simulated expected damages of more than USD 40 million over the next 35 years in a moderate-climate-change scenario. This represents 6 % of the scenario's expected damage and more than 4 times the cost estimated for restoration, confirming the findings of a study by the Caribbean Catastrophe Risk Insurance Facility (2010) as well as studies such as Reguero et al. (2018). Furthermore, combining mangrove restoration with building code enforcement and preparedness increases the averted damage to 14 % of the expected damage by 2050 with a cost of approximately one-third of the overall benefit. On the other hand, in the Turks and Caicos Islands, the enforcement of building codes results in a more cost-effective measure than mangrove restoration, with a cost three-quarters of the benefit. The reason for this is that even if both measures avert an expected damage of approximately USD 220 million (11 % of the islands expected damage), the restoration of mangroves needs to only be implemented in target areas to avert more damage than the invested capital. On these islands, the combination of gray measures, namely building code enforcement and retrofitting, with preparedness education averts 35 % of the simulated expected damage in a moderate-climate-change scenario by 2050 with a high – but effective – cost of 97 % of the benefit. In order to avert a significant fraction (more than 50 %) of the expected damage over the next 35 years, risk transfer is found to be the most effective complement in all cases studied. Combining insurance – be it indemnity-based or parametric (Caribbean Catastrophe Risk Insurance Facility, 2015) – with other cost-efficient measures reduces its cost (by USD 50 million in the case of Anguilla and USD 250 million in the Turks and Caicos Islands) and covers damage of high-impact events which cannot be cost-effectively averted by other measures.
While the idealized case study already provides elements relevant for the development of adaptation strategies and the interplay of prevention, preparedness, and risk transfer (see Joyette et al., 2015), further local bespoke data would improve the accuracy and representativeness of results, beginning with spatially explicit mapping of specific exposures such as infrastructure and sectoral split. The concept could handle both indirect impacts (e.g., business interruption) and series of consecutive events, but we did not venture into these forays due to lack of data to validate the model with. This was similar for other related hazards, where one could expand to torrential rain and separate wind from surge action for tropical cyclones, which would pose a major challenge as there is no separately reported damage and indirect methods would introduce further uncertainties (Strobl, 2012).
Methodologically, as mentioned in Sect. 1, cost–benefit analysis (CBA) and multi-criteria analysis (MCA) are not mutually exclusive, and a comprehensive analysis builds on both methods used in conjunction with each other. While ECA studies in cities in other regions such as in El Salvador or Bangladesh (Wieneke and Bresch, 2016) did consider asset damage and impacts on the people affected as well as lives lost in their pertinent metrics, some earlier studies also compared health impacts of reduced reservoir outflow (measured in disability-adjusted life years, as in Finkel, 2019) with hydropower production (measured in megawatt hours and electricity costs) in Tanzania (Bresch and ECA working group, 2009). In order to keep the case study exemplary and simple, we did not introduce metrics other than direct damage. This has the advantage of being able to easily compare very different adaptation options and their damage aversion potential by reducing all to a common monetary form. However, we do see eminent potential to develop both the platform and its applications in the direction of MCA, with the determination of the relative weights of the multiple criteria remaining a challenge. So far, ECA analyses in general and the underlying CLIMADA platform in particular do not account for a range of critical factors such as the role of institutions, access to and ownership of resources, agency, and leadership (Preston and Stafford-Smith, 2009), to name a few. While this will remain a major challenge in the future, we do see potential for further development of both the ECA methodology and the CLIMADA platform to better serve adaptive management approaches. The approach can be used to support the measurement of successful implementation and, hence, the evaluation of proposed adaptation options over time. Therefore, we provide a framework for lessons learned to inform future actions in an iterative fashion to make better, and often incremental, decisions in the face of uncertainty (Wilby and Dessai, 2010). Such a dynamic simulation platform mitigates the shortcomings of static adaptation databases (Mitchell et al., 2016) and lends itself as a basis for web-based adaptation support tools (Glaas et al., 2017). Hence, it might foster a more well-informed exchange between the disaster risk management and climate adaptation (expert) communities (Klima and Jerolleman, 2017) by, for example, informing climate adaptation narratives (Krauß and Bremer, 2020).
CLIMADA is openly available from GitHub (https://github.com/CLIMADA-project/climada_python, Bresch and Aznar-Siguan, 2019a) under the GNU GPL license (GNU Operating System, 2007). The documentation is hosted on Read the Docs (https://climada-python.readthedocs.io/en/stable/, Aznar-Siguan and Bresch, 2019a) and includes a link to the interactive tutorial for CLIMADA. CLIMADA v1.4.1, which is permanently available at the ETH Data Archive https://doi.org/10.5905/ethz-1007-252 (Bresch et al., 2020), was used for this publication. The script reproducing the main results of the paper and all of the figures is available at https://github.com/CLIMADA-project/climada_papers (Bresch and Aznar-Siguan, 2019b), and the detailed results for the specific single islands are available at https://github.com/CLIMADA-project/climada_papers/blob/main/202008_climada_adaptation/reproduce_results.ipynb (Aznar-Siguan and Bresch, 2020).
DNB conceptualized CLIMADA and oversaw its implementation in Python, based on his previous MATLAB implementation. GAS designed and executed the Python implementation of the software and carried out most of the exemplary case study work.
David N. Bresch developed the first version of CLIMADA as a basis for teaching a masters course on uncertainty and risk at ETH back in 2010. He is thankful for many students' feedback and improvement suggestions, without which the model would not be as comprehensive and stable as it is now.
This paper was edited by Min-Hui Lo and reviewed by two anonymous referees.
Adger, W. N.: Vulnerability, Global Environ. Chang., 16, 268–281, https://doi.org/10.1016/j.gloenvcha.2006.02.006, 2006.
Attems, M. S., Thaler, T., Snel, K. A. W., Davids, P., Hartmann, T., and Fuchs, S.: The influence of tailored risk communication on individual adaptive behaviour, Int. J. Disast. Risk Re., 49, 101618, https://doi.org/10.1016/j.ijdrr.2020.101618, 2020.
Aznar-Siguan, G. and Bresch, D. N.: CLIMADA_python documentation, available at: https://climada-python.readthedocs.io/en/stable/ (last access: 28 November 2020), 2019a.
Aznar-Siguan, G. and Bresch, D. N.: CLIMADA v1: a global weather and climate risk assessment platform, Geosci. Model Dev., 12, 3085–3097, https://doi.org/10.5194/gmd-12-3085-2019, 2019b.
Aznar-Siguan, G. and Bresch, D. N.: CLIMADA – Caribbean case study, available at: https://github.com/CLIMADA-project/climada_papers/blob/main/202008_climada_adaptation/reproduce_results.ipynb, last access: 28 November 2020.
Berkhout, F.: Adaptation to climate change by organizations, Wires Clim. Change, 3, 91–106, https://doi.org/10.1002/wcc.154, 2012.
Bresch, D. N.: Shaping Climate Resilient Development – Economics of Climate Adaptation, in: Climate Change Adaptation Strategies – An Upstream-downstream Perspective, edited by: Salzmann, G., Huggel, N., Nussbaumer, C., and Ziervogel, S. U., Springer International Publishing, Switzerland, https://doi.org/10.1007/978-3-319-40773-9, 2016.
Bresch, D. N. and Aznar-Siguan, G.: CLIMADA_python, available at: https://github.com/CLIMADA-project/climada_python (last access: 28 November 2020), 2019a.
Bresch, D. N. and Aznar-Siguan, G.: CLIMADA_python publications, available at: https://github.com/CLIMADA-project/climada_papers (last access: 28 November 2020), 2019b.
Bresch, D. N. and ECA working group: Shaping climate-resilient development: A framework for decision-making, available at: https://www.ethz.ch/content/dam/ethz/special-interest/usys/ied/wcr-dam/documents/Economics_of_Climate_Adaptation_ECA.pdf (last access: 28 November 2020), 2009.
Bresch, D. N. and Schraft, A.: Neue, integrierte sichtweise zum Umgang mit Klimarisiken und deren Versicherung, Schweiz. Z. Forstwesen, 162, 464–468, https://doi.org/10.3188/szf.2011.0464, 2011.
Bresch, D. N., Aznar Siguan, G., Bozzini, V., Bungener, R., Eberenz, S., Hartman, J., Mühlhofer, E., Peìrus, M., Röösli, T., Sauer, I., Schmid, E., Stalhandske, Z., Steinmann, C., and Stocker, D.: CLIMADA_python v1.4.1, ETH Zurich, https://doi.org/10.5905/ethz-1007-252, 2020.
Brown, A., Gawith, M., Lonsdale, K., and Pringle, P.: Managing adaptation: linking theory and practice, available at: https://www.ukcip.org.uk/wp-content/PDFs/UKCIP_Managing_adaptation.pdf (last access: 28 November 2020), 2011.
Burton, I., Huq, S., Lim, B., Pilifosova, O., and Schipper, E. L.: From impacts assessment to adaptation priorities: The shaping of adaptation policy, Clim. Policy, 2, 145–159, https://doi.org/10.3763/cpol.2002.0217, 2002.
Caribbean Catastrophe Risk Insurance Facility: Enhancing the climate risk and adaptation fact base for the Caribbean, available at: https://www.ccrif.org/sites/default/files/publications/ECABrochureFinalAugust182010.pdf (last access: 28 November 2020), 2010.
Caribbean Catastrophe Risk Insurance Facility: Understanding the CCRIF; A Collection of Questions and Answers, CCRIF SPC, Grand Cayman, Cayman Islands, 2015.
Central Intelligence Agency: The World Factbook, Washington, DC, available at: https://www.cia.gov/library/publications/resources/the-world-factbook/geos/av.html, last access: 1 October 2019.
Das, S. and Crépin, A. S.: Mangroves can provide protection against wind damage during storms, Estuar. Coast. Shelf S., 134, 98–107, https://doi.org/10.1016/j.ecss.2013.09.021, 2013.
Denjean, B., Denjean, B., Altamirano, M. A., Graveline, N., Giordano, R., Van der Keur, P., Moncoulon, D., Weinberg, J., Máñez Costa, M., Kozinc, Z., Mulligan, M., Pengal, P., Matthews, J., van Cauwenbergh, N., López Gunn, E., Bresch, D. N., and Denjean, B.: Natural Assurance Scheme: A level playing field framework for Green-Grey infrastructure development, Environ. Res., 159, 24–38, https://doi.org/10.1016/j.envres.2017.07.006, 2017.
Dessai, S. and Hulme, M.: Does climate adaptation policy need probabilities?, Clim. Policy, 4, 107–128, https://doi.org/10.1080/14693062.2004.9685515, 2004.
Dessai, S., Lu, X., and Risbey, J. S.: On the role of climate scenarios for adaptation planning, Global Environ. Chang., 15, 87–97, https://doi.org/10.1016/j.gloenvcha.2004.12.004, 2005.
Dittrich, R., Wreford, A., and Moran, D.: A survey of decision-making approaches for climate change adaptation: Are robust methods the way forward?, Ecol. Econ., 122, 79–89, https://doi.org/10.1016/j.ecolecon.2015.12.006, 2016.
Eakin, H. and Lemos, M. C.: Adaptation and the state: Latin America and the challenge of capacity-building under globalization, Global Environ. Chang., 16, 7–18, https://doi.org/10.1016/j.gloenvcha.2005.10.004, 2006.
ECLAC: Irma and Maria By Numbers, Focus. Mag. Caribb. Dev. Coop. Comm., 1, 1–17, available at: https://repositorio.cepal.org/bitstream/handle/11362/43446/1/FOCUSIssue1Jan-Mar2018.pdf (last access: 28 November 2020), 2018.
Emanuel, K.: Global Warming Effects on U. S. Hurricane Damage, Weather. Clim. Soc., 3, 261–268, https://doi.org/10.1175/WCAS-D-11-00007.1, 2011.
Finkel, M. L.: A call for action: integrating climate change into the medical school curriculum, Perspect. Med. Educ., 8, 265–266, https://doi.org/10.1007/s40037-019-00541-8, 2019.
Food and Agriculture Organization of the United Nations: Mangroves of North and Central America 1980–2005: Country reports, 2007.
Frederick, S., Loewenstein, G., and O'Donoghue, T.: Time discounting and time preference: A critical review, J. Econ. Lit., XL, 351–401, https://doi.org/10.1257/002205102320161311, 2002.
Fünfgeld, H. and Mcevoy, D.: Framing Climate Change Adaptation in Policy and Practice, VCCCAR Work. Pap. 1, VCCCAR Proj. Fram. Adapt. Vic. Context, Victoran Centre for Climate Change Adaptation Research, 65, 2011.
Füssel, H. M. and Klein, R. J. T.: Climate change vulnerability assessments: An evolution of conceptual thinking, Climatic Change, 75, 301–329, https://doi.org/10.1007/s10584-006-0329-3, 2006.
Glaas, E., Ballantyne, A. G., Neset, T. S., and Linnér, B. O.: Visualization for supporting individual climate change adaptation planning: Assessment of a web-based tool, Landscape Urban Plan., 158, 1–11, https://doi.org/10.1016/j.landurbplan.2016.09.018, 2017.
GNU Operating System: GNU General Public License, version 3, available at: https://www.gnu.org/licenses/gpl.html (last access: 28 November 2020), 2007.
Haque, A. N.: Application of Multi-Criteria Analysis on Climate Adaptation Assessment in the Context of Least Developed Countries, J. Multi-Criteria Decis. Anal., 23, 210–224, https://doi.org/10.1002/mcda.1571, 2016.
Hinkel, J. and Bisaro, A.: Methodological choices in solution-oriented adaptation research: a diagnostic framework, Reg. Environ. Chang., 16, 7–20, https://doi.org/10.1007/s10113-014-0682-0, 2016.
Hino, M. and Hall, J. W.: Real Options Analysis of Adaptation to Changing Flood Risk: Structural and Nonstructural Measures, ASCE-ASME J. Risk Uncertain. Eng. Syst. Part A Civ. Eng., 3, 04017005, https://doi.org/10.1061/AJRUA6.0000905, 2017.
IPCC: Climate Change 2014: Impacts, Adaptation and Vulnerability. Part A: Global and Sectoral Aspects, Contribution of Working Group II to the Fifth Assessment Report of the Intergovernmental Panel on Climate Change, edited by: Field, C. B., Barros, V. R., Dokken, D. J., Mach, K. J., Mastrandrea, M. D., Bilir, T. E., Chatterjee, M., Ebi, K. L., Estrada, Y. O., Genova, R. C., Girma, B., Kissel, E. S., Levy, A. N., MacCracken, S., Mastrandrea, P. R., and White, L. L., Cambridge University Press, UK and New York, NY, USA, 2014.
Joyette, A. R. T., Nurse, L. A., and Pulwarty, R. S.: Disaster risk insurance and catastrophe models in risk-prone small Caribbean islands, Disasters, 39, 467–492, https://doi.org/10.1111/disa.12118, 2015.
Jullien, B., Salanié, B., and Salanié, F.: Should More Risk-Averse Agents Exert More Effort?, Geneva Pap. Risk Ins., 24, 19–28, 1999.
Kates, R. W. and Wilbanks, T. J.: Making the global local: Responding to climate change concerns from the ground up, Environment, 45, 12–23, https://doi.org/10.1080/00139150309604534, 2003.
Kelman, I., Mercer, J., and Gaillard, J.: Indigenous knowledge and disaster risk reduction, Geography, 97, 12–21, 2012.
Klima, K. and Jerolleman, A.: A rose by any other name – communicating between hazard mitigation, climate adaptation, disaster risk reduction, and sustainability professionals, J. Environ. Stud. Sci., 7, 25–29, https://doi.org/10.1007/s13412-014-0210-z, 2017.
Knutson, T. R., Sirutis, J. J., Zhao, M., Tuleya, R. E., Bender, M., Vecchi, G. A., Villarini, G., and Chavas, D.: Global projections of intense tropical cyclone activity for the late twenty-first century from dynamical downscaling of CMIP5/RCP4.5 scenarios, J. Climate, 28, 7203–7224, https://doi.org/10.1175/JCLI-D-15-0129.1, 2015.
Krauß, W. and Bremer, S.: The role of place-based narratives of change in climate risk governance, Clim. Risk Manag., 28, 100221, https://doi.org/10.1016/j.crm.2020.100221, 2020.
Lempert, R. J. and Schlesinger, M. E.: Robust Strategies for Abating Climate Change, Climatc Change, 45, 387–401, https://doi.org/10.1023/A:1005698407365, 2000.
Lewis, R. R.: Mangrove Restoration – Costs and Benefits of Successful Ecological Restoration, Penang, Malaysia, available at: http://www.fao.org/forestry/10560-0fe87b898806287615fceb95a76f613cf.pdf (last access: 28 November 2020), 2001.
Mc Kenzie Hedger, M., Connell, R., and Bramwell, P.: Bridging the gap: Empowering decision-making for adaptation through the UK Climate Impacts Programme, Clim. Policy, 6, 201–215, https://doi.org/10.1080/14693062.2006.9685595, 2006.
Mitchell, C. L., Burch, S. L., and Driscoll, P. A.: (Mis)communicating climate change? Why online adaptation databases may fail to catalyze adaptation action, Wires Clim. Change, 7, 600–613, https://doi.org/10.1002/wcc.401, 2016.
Moser, S. C.: Communicating adaptation to climate change: The art and science of public engagement when climate change comes home, Wires Clim. Change, 5, 337–358, https://doi.org/10.1002/wcc.276, 2014.
Moser, S. C.: Communicating Climate Change Adaptation and Resilience, Oxford Res. Encycl. Clim. Sci., available at: http://oxfordre.com/climatescience/view/10.1093/acrefore/9780190228620.001.0001/acrefore-9780190228620-e-436 (last access: 28 November 2020), 2017.
Muccione, V., Huggel, C., Bresch, D. N., Jurt, C., Wallimann-Helmer, I., Mehra, M. K., and Pabón Caicedo, J. D.: Joint knowledge production in climate change adaptation networks, Curr. Opin. Env. Sust., 39, 147–152, https://doi.org/10.1016/j.cosust.2019.09.011, 2019.
Ou-Yang, C., Kunreuther, H., and Michel-kerjan, E.: An Economic Analysis of Climate Adaptations to Hurricane Risk in St. Lucia, Geneva Pap. R. I.-Iss. P., 38, 521–546, https://doi.org/10.1057/gpp.2013.18, 2013.
Preston, B. and Stafford-Smith, M.: Framing vulnerability and adaptive capacity assessment: Discussion paper, in: CSIRO Climate Adaptation National Research Flagship Working Paper No. 2, CSIRO Marine and Atmospheric Research, Aspendale, Victoria, Australia, 52 pp., 2009.
Preston, B. L., Yuen, E. J., and Westaway, R. M.: Putting vulnerability to climate change on the map: A review of approaches, benefits, and risks, Sustain. Sci., 6, 177–202, https://doi.org/10.1007/s11625-011-0129-1, 2011.
Prevatt, D. O., Dupigny-Giroux, L. A., and Masters, F. J.: Engineering perspectives on reducing hurricane damage to housing in CARICOM Caribbean islands, Nat. Hazards Rev., 11, 140–150, https://doi.org/10.1061/(ASCE)NH.1527-6996.0000017, 2010.
Radhakrishnan, M., Pathirana, A., Ashley, R., and Zevenbergen, C.: Structuring climate adaptation through multiple perspectives: Framework and case study on flood risk management, Water, 9, 20, https://doi.org/10.3390/w9020129, 2017.
Reguero, B. G., Beck, M. W., Bresch, D. N., Calil, J., and Meliane, I.: Comparing the cost effectiveness of nature-based and coastal adaptation: A case study from the Gulf Coast of the United States, PLoS One, 13, 1–24, https://doi.org/10.1371/journal.pone.0192132, 2018.
Samuelson, P. A.: A Note on Measurement of Utility, Rev. Econ. Stud., 4, 155–161, https://doi.org/10.2307/2967612, 1937.
Schott, T., Landsea, C., Hafele, G., Lorens, J., Thurm, H., Ward, B., Willis, M., and Zaleski, W.: The Saffir-Simpson Hurricane Wind Scale, available at: https://www.nhc.noaa.gov/pdf/sshws.pdf (last access: 28 November 2020), 2019.
Serrao-Neumann, S. and Low Choy, D.: Uncertainty and Future Planning: The Use of Scenario Planning for Climate Change Adaptation Planning and Decision, in: Communicating Climate Change Information for Decision-Making, edited by: Serrao-Neumann, S., Coudrain, A., and Coulter, L., Springer International Publishing, Cham, 79–90, 2018.
Smit, B. and Wandel, J.: Adaptation, adaptive capacity and vulnerability, Global Environ. Chang., 16, 282–292, https://doi.org/10.1016/j.gloenvcha.2006.03.008, 2006.
Souvignet, M., Wieneke, F., Müller, L., and Bresch, D. N.: Economics of Climate Adaptation (ECA) – Guidebook for Practitioners, Materials on Development Financing, UNU, KfW, 2016.
Strobl, E.: The economic growth impact of natural disasters in developing countries: Evidence from hurricane strikes in the Central American and Caribbean regions, J. Dev. Econ., 97, 130–141, https://doi.org/10.1016/j.jdeveco.2010.12.002, 2012.
Surminski, S., Westcott, M., Ward, J., Sayers, P., Bresch, D. N., and Clare, B.: Be prepared – exploring future climate-related risk for residential and commercial real-estate, J. Altern. Investments, 23, 24–34, https://doi.org/10.3905/jai.2020.1.100, 2020.
Triveno, L. and Hausler, E.: A housing policy that could almost pay for itself? Think retrofitting, World Bank blogs, available at: https://blogs.worldbank.org/sustainablecities/housing-policy-could-almost-pay-itself-think-retrofitting (last access: 18 January 2021), 2017.
Truong, C., Trück, S., Davies, P., and Mathew, S.: Exploring valuation methods for climate adaptation options, with particular reference to Australian coastal councils, Gold Coast, available at: https://www.nccarf.edu.au/sites/default/files/tool_downloads/Exploringvaluation methods.pdf (last access: 28 November 2020), 2016.
UNFCCC: Assessing the costs and benefits of adaptation options. An overview of approaches, United Nations Framework Convention on Climate Change, Bonn, Germany, available at: https://unfccc.int/resource/docs/publications/pub_nwp_costs_benefits_adaptation.pdf (last access: 18 January 2021), 2011.
Ward, P. J., Blauhut, V., Bloemendaal, N., Daniell, J. E., de Ruiter, M. C., Duncan, M. J., Emberson, R., Jenkins, S. F., Kirschbaum, D., Kunz, M., Mohr, S., Muis, S., Riddell, G. A., Schäfer, A., Stanley, T., Veldkamp, T. I. E., and Winsemius, H. C.: Review article: Natural hazard risk assessments at the global scale, Nat. Hazards Earth Syst. Sci., 20, 1069–1096, https://doi.org/10.5194/nhess-20-1069-2020, 2020.
Watkiss, P. and Hunt, A.: Assessing climate-resilient development options, in The economics of climate-resilient developmen, Edward Elgar Publishing, Cheltenham, United Kingdom, 24, 2016.
Webler, T., Tuler, S., Dow, K., Whitehead, J., and Kettle, N.: Design and evaluation of a local analytic-deliberative process for climate adaptation planning, Local Environ., 21, 166–188, https://doi.org/10.1080/13549839.2014.930425, 2016.
Wieneke, F. and Bresch, D. N.: Economics of Climate Adaptation (ECA) in Development Cooperation: A Climate Risk Assessment Approach, Development Bank – Materials on Development Financing, available at: https://www.kfw-entwicklungsbank.de/PDF/Download-Center/Materialien/2016_No5_Economics-of-Adaptation_EN.pdf (last access: 18 January 2021), No. 5, 2016.
Wilby, R. L. and Dessai, S.: Robust adaptation to climate change, Weather, 65, 180–185, https://doi.org/10.1002/wea.504, 2010.
Yohe, G. and Tol, R. S. J.: Indicators for social and economic coping capacity – Moving toward a working definition of adaptive capacity, Global Environ. Chang., 12, 25–40, https://doi.org/10.1016/S0959-3780(01)00026-7, 2002.