the Creative Commons Attribution 4.0 License.
the Creative Commons Attribution 4.0 License.
 | 14 Apr 2021
Global evaluation of the nutrient-enabled version of the land surface model ORCHIDEE-CNP v1.2 (r5986)
Jinfeng Chang
Philippe Ciais
Betrand Guenet
Julian Helfenstein
Yuanyuan Huang
Ronny Lauerwald
Fabienne Maignan
Victoria Naipal
Yilong Wang
Hui Yang
Haicheng Zhang
The availability of phosphorus (P) and nitrogen (N) constrains the ability of ecosystems to use resources such as light, water and carbon. In turn, nutrients impact the distribution of productivity, ecosystem carbon turnovers and their net exchange of CO2 with the atmosphere in response to variation of environmental conditions in both space and time. In this study, we evaluated the performance of the global version of the land surface model ORCHIDEE-CNP (v1.2), which explicitly simulates N and P biogeochemistry in terrestrial ecosystems coupled with carbon, water and energy transfers. We used data from remote sensing, ground-based measurement networks and ecological databases. Components of the N and P cycle at different levels of aggregation (from local to global) are in good agreement with data-driven estimates. When integrated for the period 1850 to 2017 forced with variable climate, rising CO2 and land use change, we show that ORCHIDEE-CNP underestimates the land carbon sink in the Northern Hemisphere (NH) during recent decades despite an a priori realistic gross primary productivity (GPP) response to rising CO2. This result suggests either that processes other than CO2 fertilization, which are omitted in ORCHIDEE-CNP such as changes in biomass turnover, are predominant drivers of the northern land sink and/or that the model parameterizations produce emerging nutrient limitations on biomass growth that are too strict in northern areas. In line with the latter, we identified biases in the simulated large-scale patterns of leaf and soil stoichiometry as well as plant P use efficiency, pointing towards P limitations that are too severe towards the poles. Based on our analysis of ecosystem resource use efficiencies and nutrient cycling, we propose ways to address the model biases by giving priority to better representing processes of soil organic P mineralization and soil inorganic P transformation, followed by refining the biomass production efficiency under increasing atmospheric CO2, phenology dynamics and canopy light absorption.
Please read the corrigendum first before continuing.
-
Notice on corrigendum
The requested paper has a corresponding corrigendum published. Please read the corrigendum first before downloading the article.
-
Article
(7266 KB)
- Corrigendum
-
Supplement
(14955 KB)
-
The requested paper has a corresponding corrigendum published. Please read the corrigendum first before downloading the article.
- Article
(7266 KB) - Full-text XML
- Corrigendum
-
Supplement
(14955 KB) - BibTeX
- EndNote


Nitrogen (N) and phosphorus (P) are key macronutrients that control metabolic processes and plant growth and constrain ecosystem-level productivity (Elser et al., 2007; Norby et al., 2010; Cleveland et al., 2013). The amount and stability of soil carbon (C) stock are also affected by N and P through their regulating role in the mineralization of litter and soil organic matter (Gärdenäs et al., 2011; Melillo et al., 2011). The availability of N and P is likely to limit future carbon storage under climate change and rising atmospheric CO2. Empirical stoichiometry observations were applied in the posteriori estimates of future carbon storage from land surface models (LSMs) lacking an explicit simulation of N and P biogeochemistry, which consistently led to an overestimation of future carbon storage in LSMs (Hungate et al., 2003; Wang and Houlton, 2009; Zaehle et al., 2015; Wieder et al., 2015). Nevertheless, this approach has large uncertainties (Penuelas et al., 2013; Sun et al., 2017) and relies on unproven assumptions (Brovkin and Goll, 2015).
An alternative is to directly represent the complex interactions between N, P and carbon in an LSM. Several LSMs incorporated different parameterizations of N interactions (e.g., Thornton et al., 2007; Zaehle et al., 2014), but very few global models have included P interactions. The few models accounting for P limitation in plant growth showed that P availability limits primary productivity and carbon stocks on highly weathered soils in the tropics (Wang et al., 2010; Yang et al., 2014), and one study also suggested that P limitations could also occur in the Northern Hemisphere in the near future (Goll et al., 2012). Model representations of P interactions are highly uncertain since the critical processes are poorly constrained by current observational data. In particular, the desorption of P from soil mineral surfaces and the enhancement of P availability for plants by phosphatase enzymes secreted by plant roots and microbes were identified to be critical but poorly constrained (Fleischer et al., 2019).
Previous studies (Wang et al., 2010; Goll et al., 2012; Yang et al., 2014; Thum et al., 2019) have suggested that the inclusion of the phosphorus cycle improves model performances with regard to reproducing observed C fluxes. But adding new and uncertain P-related processes does not grant an automatic improvement in an LSM in general. First, more (nutrient-related) equations with more uncertain parameters can result in less robust predictions. Second, models ignoring nutrients were often calibrated on available carbon data so that a new model with nutrients inevitably needs a parameter recalibration to reach similar performances as the same model without nutrients. Third, for evaluating a large-scale model resolving both nutrient and carbon biogeochemistry, one needs specific nutrient-related datasets, which are more scarce than classical biomass, productivity and soil carbon data used for benchmarking carbon-only models.
The evaluation for N and P, together with carbon cycling in global LSMs, remains very limited (Wang et al., 2010; Goll et al., 2012), but recent advances in ground-based measurements, ecological datasets and process understanding have made a better evaluation of C, N and P models feasible. The available nutrient datasets have allowed for meta-analyses of site-level nutrient fertilization experiments (e.g., Yuan and Chen, 2015; Wright, 2019), data-driven assimilation schemes to constrain nutrient budgets (Wang et al., 2018), new knowledge about the critical P processes of sorption (Helfenstein et al., 2018, 2020) and phosphatase-mediated mineralization (Sun et al., 2020), global datasets of leaf nutrient content (Butler et al., 2017), and empirical constraints on the CO2 fertilization effect on land carbon storage (Terrer et al., 2019; Liu et al., 2019). In addition to direct comparison with nutrient datasets, it is also possible to diagnose emerging model responses in terms of ecosystem resource use efficiencies (RUE) and confront them with observations for identifying how ecosystems adjust and optimize nutrient, water, light and carbon resource availabilities (Fernández-Martínez et al., 2014; Hodapp et al., 2019). In particular, modeled N and P use efficiencies can be compared to observation-based estimates at ecosystem scale (Gill and Finzi, 2016) and at biome scale (Wang et al., 2018).
Here we evaluate the global cycles of C, N and P in the nutrient-enabled version of the LSM ORCHIDEE, ORCHIDEE-CNP (v1.2). The model has been previously evaluated for tropical sites (Goll et al., 2017a, 2018) and for coarse-scale global carbon fluxes and stocks using the International Land Model Benchmarking system iLAMB by, e.g., Friedlingstein et al. (2019). The results from this evaluation showed a slightly worse performance for ORCHIDEE-CNP (v.1.2) than the carbon-only version of ORCHIDEE, which has been extensively calibrated (Friedlingstein et al., 2019). In this study, we perform a detailed evaluation of ORCHIDEE-CNP focusing on four ecosystem characteristics that were found to be critical for the response of land C cycling to increasing CO2 and climate change: (1) vegetation resource use efficiencies, (2) the response of plant productivity to increasing CO2, (3) ecosystem N and P turnover and openness, and (4) large-scale patterns of ecosystem stoichiometries. Points (1) and (2) control the response of vegetation carbon storage operating on timescales of years to decades, while points (3) and (4) control the carbon storage potential on an ecosystem level, which determines the response on much longer timescales. Further, the implications of including nutrient cycles on the simulated land C cycling are discussed.
2.1 Model description
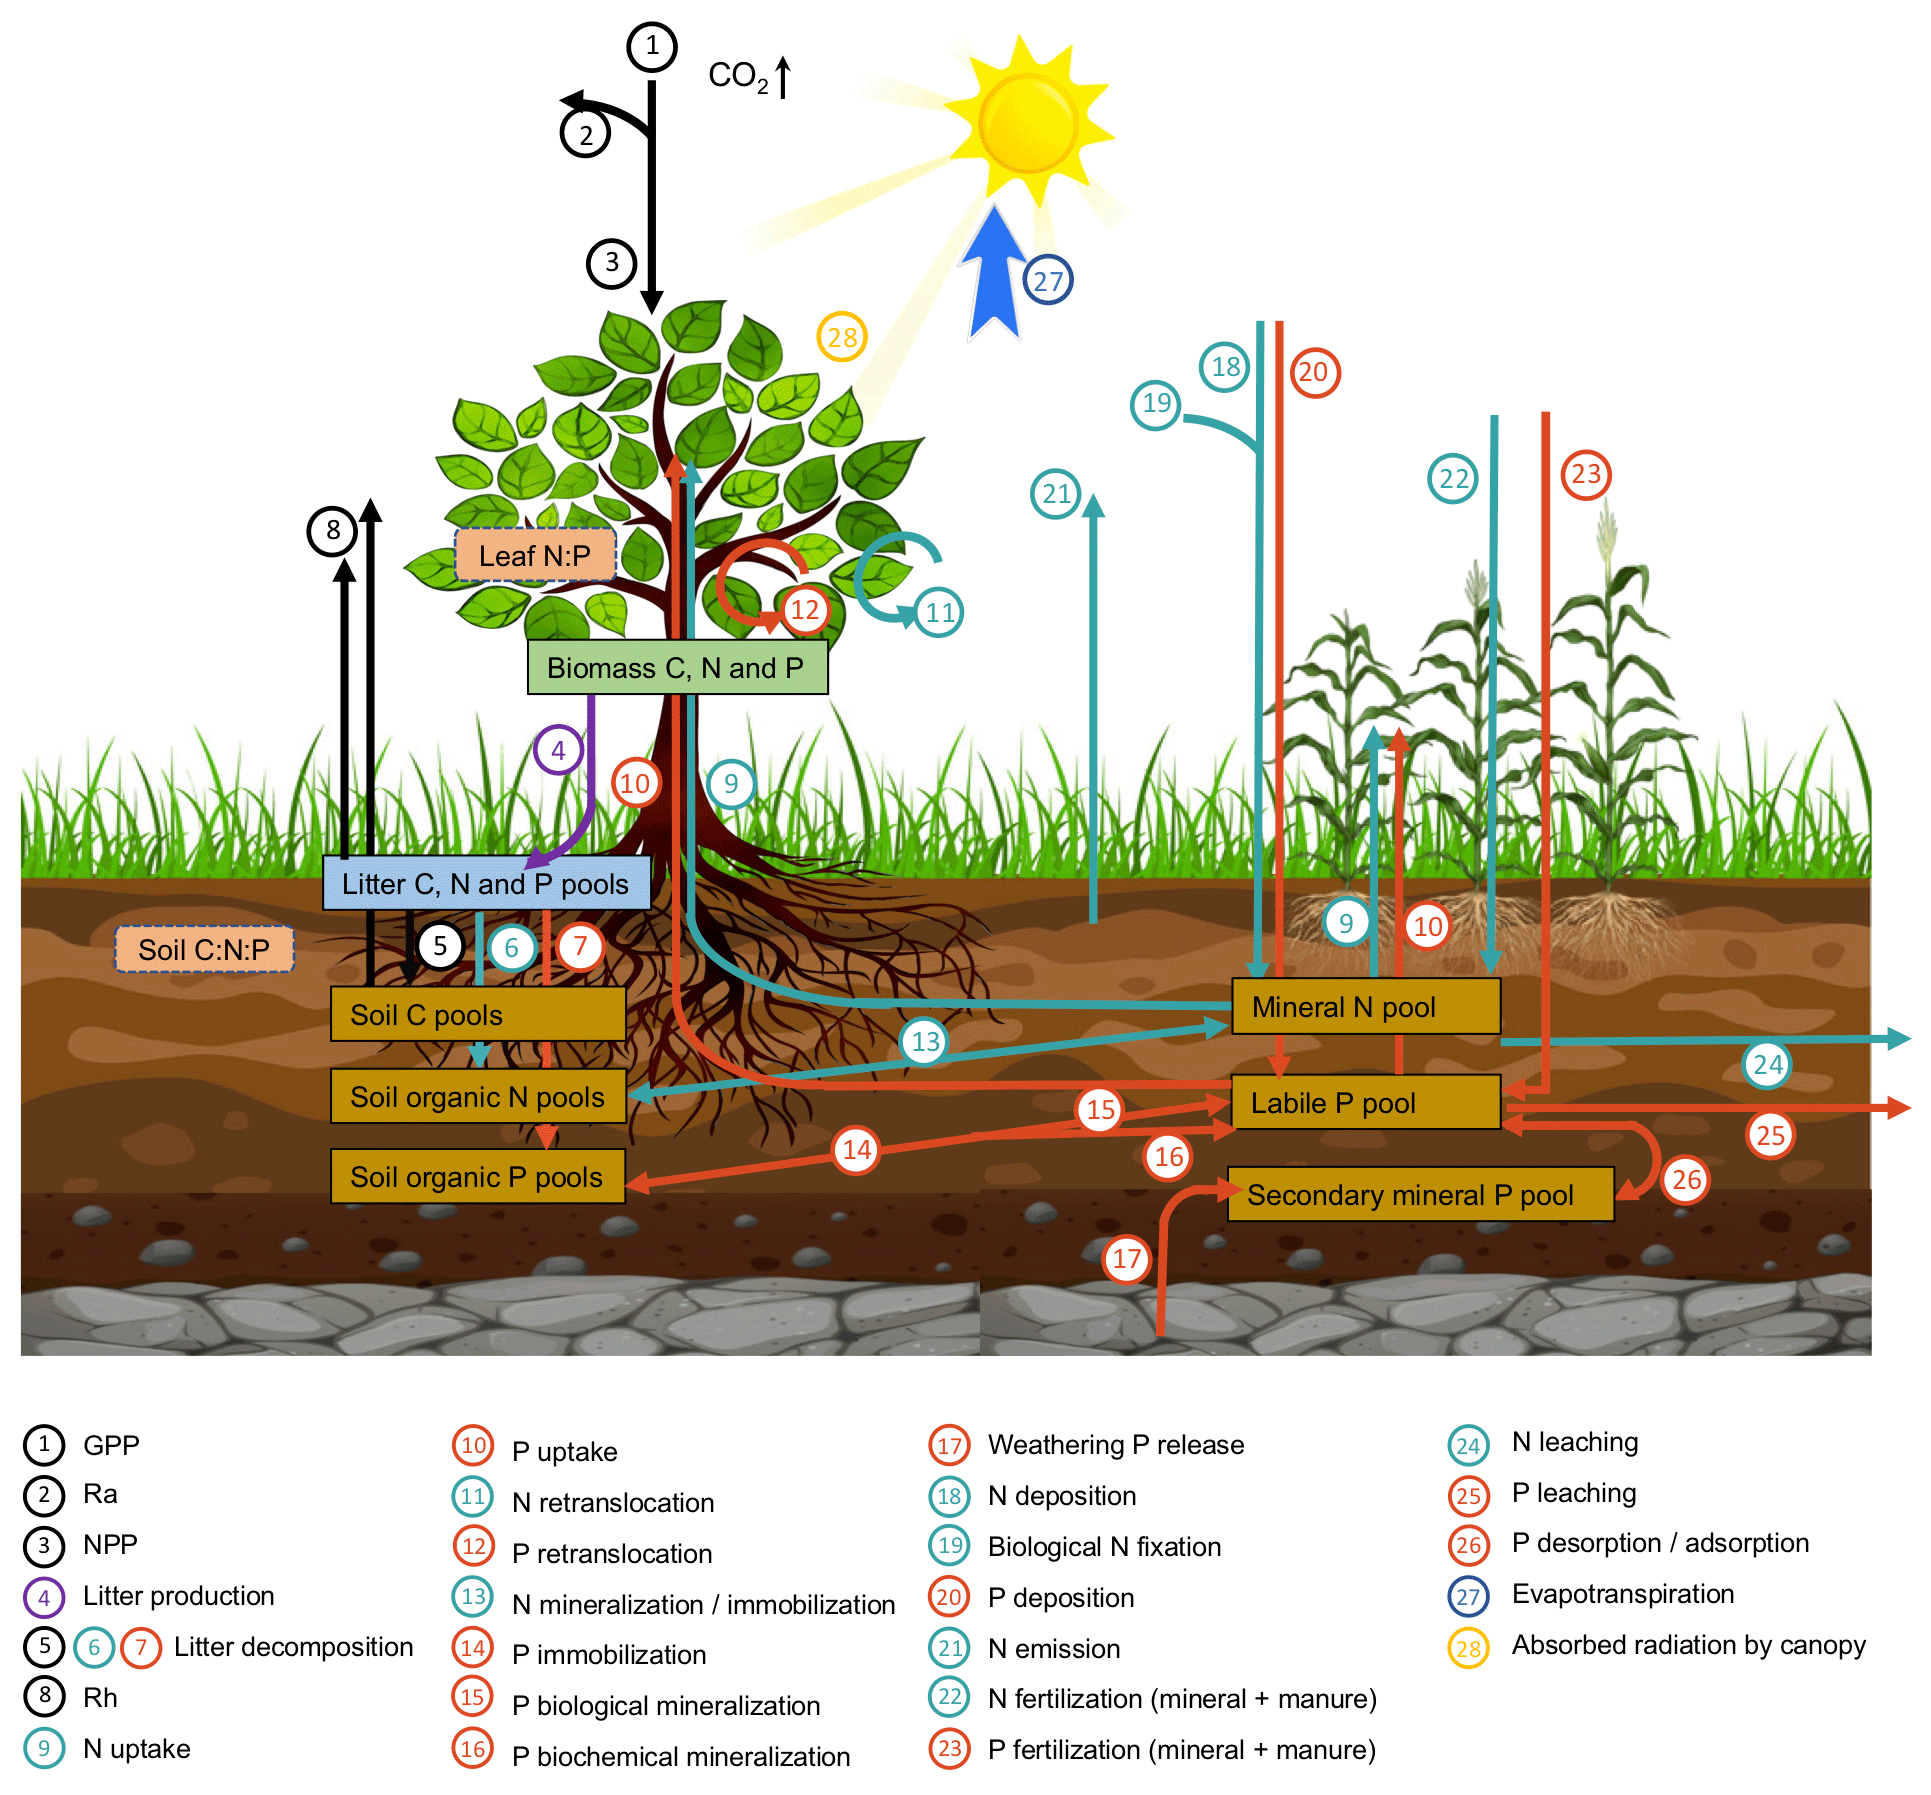
ORCHIDEE-CNP simulates the exchange of greenhouse gases (i.e., carbon dioxide, nitrous oxide), water and energy at the land surface and features a detailed representation of the root uptake of dissolved N and P, the allocation of N and P among tissues, and the N and P turnover in litter and soil organic matter (Goll et al., 2017a, 2018) (Fig. 1). In this study, we present the first global application of the model and an evaluation against global carbon and nutrient datasets. ORCHIDEE-CNP simulates the cycles of C, N and P, which are described in detail elsewhere (Krinner et al., 2005; Zaehle and Friend, 2010; Goll et al., 2014, 2017a, 2018). We give a brief overview here. P enters the ecosystem through release from minerals into the soil solution, whereas N is biologically fixed from an ample reservoir of dinitrogen. Dissolved nutrients are either taken up by vegetation, converted into soil organic matter or absorbed onto soil particles. Losses occur as leaching of dissolved nutrients, gaseous soil N emissions or occlusion of P in secondary minerals. When nutrients are taken up by vegetation they are either stored internally or used to build new plant tissue driven by the availability of C, N and P in vegetation. The nutrient concentration of plant tissue varies within a prescribed range depending on the relative availability of C, N and P. Before plant tissue is shed, depending on the tissue a fixed fraction of the nutrients is recycled. The nutrients contained in dead plant tissue and organic matter are mineralized and released back into the soil solution. The model version applied in this study is based on Goll et al. (2017a, 2018) and referred to as ORCHIDEE-CNP v1.2. Major modifications compared to v1.1 are described as follows (details can be found in Sect. S1 in the Supplement).
The original formulation of photosynthetic capacity in ORCHIDEE-CNP v1.1 assumed leaf N to be the sole regulator of leaf photosynthetic characteristics (Kattge et al., 2009). Here, we applied a new empirical function that relates photosynthetic capacity to both the leaf N and P concentration based on data from 451 species from 83 different plant families (D. S. Ellsworth et al., unpublished data). Leaf C : N : P ratios that were prescribed in ORCHIDEE-CNP v1.1 a priori in a narrow range specific to the plant functional type (PFT) are now given a larger range common to all PFTs (Table S1), allowing for the prediction of variation in leaf stoichiometry across climate and soil gradients independently of the prescribed vegetation (PFT) map.
In ORCHIDEE-CNP v1.1, an empirical function, f(Tsoil), was used to reduce biochemical mineralization and plant nutrient uptake at low soil temperature (Eq. 5 in Goll et al., 2017a), which was adopted from the N-enabled version of ORCHIDEE (Zaehle and Friend, 2010) to avoid an unrealistic accumulation of N within plants when temperatures are low. We found that this function was not needed when P uptake is accounted for and was thus removed. It should be noted that this temperature dependence is different from the one that describes the temperature dependence of soil organic matter (SOM) and litter decomposition. For grasslands and croplands, we implemented root dormancy, which is triggered by drought or low temperatures. During dormancy, root maintenance respiration is reduced by 90 % following Shane et al. (2009), but root acquisition of soil nutrients continues as long as root biomass exists (Malyshev and Henry, 2012). It should be noted that total root loss can occur for extremely long droughts or cold periods when maintenance respiration depletes root carbon.
Several parameters were recalibrated, i.e., the coefficient relating maintenance respiration to biomass and the leaf to sapwood ratio, or corrected in the case of the turnover of sapwood for tropical evergreen broadleaf forest (TREBF) and tropical rain-green broadleaf forest (TRDBF) to achieve more realistic wood growth rates for those forests (not shown). We also adjusted the recycling efficiency of nutrients from the root (, ) and leaf (, ) according to data compilations from Freschet et al. (2010) and Vergutz et al. (2012). The new values of these parameters and their sources are given in Supplement (Sect. S1).
2.2 Simulation setup
We performed a global simulation at 2∘ × 2∘ spatial resolution for the historical period (1700–2017) by adapting the TRENDY version 6 protocol (Sitch et al., 2015; Le Quéré et al., 2018). The simulation was performed using historical climate forcing, land cover changes and management (i.e., mineral fertilizer application, crop harvest; see Sect. 3.1.6), and atmospheric CO2 concentrations (S3-type simulation). Prior to the historical simulation, we performed a model spin-up to equilibrate the C, N and P pools and fluxes (Sect. S1A in the Supplement) by forcing the model with cycled climate forcing of 1901–1920 and the land cover map and land management corresponding to the year 1700. To disentangle the effect of introducing nutrient cycles into ORCHIDEE, we performed the same simulation with ORCHIDEE (revision 5375), which has no nutrient cycles and a comparable parameterization for other processes. ORCHIDEE was run at a higher spatial resolution (0.5∘ × 0.5∘) than ORCHIDEE-CNP. Prior to the analysis, the data from ORCHIDEE were remapped to the resolution of ORCHIDEE-CNP.
2.2.1 Meteorological data
The model was forced by CRU-JRA-55 meteorological data provided at a spatial resolution of 0.5∘ × 0.5∘ and upscaled to a resolution of 2∘ × 2∘. These data comprise global 6-hourly climate forcing data providing observation-based temperature, precipitation and incoming surface radiation. They are derived from Climatic Research Unit (CRU) TS3.1 monthly data (Harris et al., 2014) and the Japanese 55-year Reanalysis (JRA-55) data (Kobayashi et al., 2015), covering the period 1901 to 2017. This climate dataset was provided by the TRENDY v6 model intercomparison project (Le Quéré et al., 2018).
2.2.2 Land cover
The historic land cover change maps were based on the European Space Agency Climate Change Initiative (ESA-CCI) land cover data (Bontemps et al., 2013). To be used by global vegetation models like ORCHIDEE-CNP, ESA-CCI land cover data were aggregated to 2∘ × 2∘ and grouped into PFTs using the reclassification method from Poulter et al. (2011, 2015). The fraction of cropland and pasture in the PFT map was further constrained by the cropland area and the sum of pasture and rangeland area for the year 2010, respectively, in the History Database of the Global Environment land use dataset (HYDE 3.2; Klein Goldewijk et al., 2017a, b), which were also aggregated to 2∘ × 2∘. The above processes produced a reference ESA-CCI-based PFT map for the year 2010. The land use changes derived from Land-Use Harmonization (LUH) v2 (http://luh.umd.edu/data.shtml, last access: 3 September 2018; an update release of Hurtt et al., 2011) were aggregated to 2∘ × 2∘ and then applied to this reference PFT map to constrain the land cover changes of forest, grassland, pasture and rangeland, and cropland during the period 1700–2017 using the backward natural land cover reconstruction method of Peng et al. (2017). As a result, a set of historic PFT maps suitable for global vegetation models was established, distinguishing global land cover changes for the period of 1700–2017 at 2∘ × 2∘ resolution.
2.2.3 Soil and lithology datasets
ORCHIDEE-CNP v1.2 is forced by information on soil texture, pH, bulk density and soil types (Goll et al., 2017a). We used a global gridded map of three soil texture classes from Zobler (1986) to derive soil-texture-specific parameters for soil water capacity, hydraulic conductivity and thermal conductivity. We used global gridded data on bulk density from the Harmonized World Soil Database (HWSD; FAO/IIASA/ISRIC/ISSCAS/JRC, 2012) and soil pH from the International Geosphere–Biosphere Programme Data Information System Soil Data (Global Soil Data Task Group, 2000). Soil pH forcing maps are needed to simulate the dynamics of NH3 and NH in soil in ORCHIDEE (Zaehle and Friend, 2010). We used a global gridded map with the dominant soil orders (following the USDA Soil Taxonomy) at 1∘ × 1∘ resolution to derive soil-order-specific soil phosphorus sorption parameters (Goll et al., 2017a).
The release of P from chemical weathering of rocks is computed dynamically following Goll et al. (2017a) and depends on the lithology types and soil shielding (discontinuation of the active soil zone from the bedrock) (Hartmann et al., 2014). We used the global lithological map (GLiM) of Hartmann and Moosdorf (2012) upscaled to 1∘ × 1∘ resolution, which accounts for the lithology fractional coverage of 16 classes on a sub-grid scale. We also used a spatially explicit map of soil shielding at 1∘ × 1∘ resolution (Hartmann et al., 2014).
2.2.4 Atmospheric nitrogen and phosphorus deposition
Global gridded monthly atmospheric N and P deposition during 1860–2017 was derived from a reconstruction based on the global aerosol chemistry–climate model LMDZ-INCA (Wang et al., 2017). LMDZ-INCA was driven by emission data, which included sea salt and dust for P, primary biogenic aerosol particles for P, oceanic emissions for N (NH3), vegetation emissions for N (NO), agricultural activities (including fertilizer use and livestock) for N, and fuel combustion for both N (NOy and NHx) and P. Reconstructions for the years 1850, 1960, 1970, 1980 and 1990, as well as each year from 1997 to 2013, were linearly interpolated to derive a time series for 1850–2013. For the period before 1850, we assumed N and P deposition rates of the year 1850. For the period after 2013, we assumed rates of the year 2013. In ORCHIDEE-CNP, atmospheric N and P deposition is added to the respective soil mineral N and P pools without considering interception by the canopy.
2.2.5 Nutrient management
For croplands, we used yearly gridded mineral N and P fertilizer application data from Lu and Tian (2017) available for the period 1960 to 2017. This dataset is based on national-level data on crop-specific fertilizer application amounts from the International Fertilizer Industry Association (IFA) and the FAO. N and P mineral fertilization between 1900 and 1959 was linearly extrapolated assuming that fertilizer applications for 1900 are zero and that there were no N and P fertilizers applied before 1900. For pasture, we used global gridded datasets of mineral N fertilizer application rates from Lu and Tian (2017), developed by combining country-level statistics (FAO) and land use datasets (HYDE 3.2) (Xu et al., 2019). For both cropland and pasture, N and P in mineral fertilizer were assumed to go directly into soil mineral pools, where all mineral N fertilizer was assumed to be in the form of ammonium nitrate, with half of N as ammonium (NH) and half as nitrate (NO).
Manure applications are also included as a model forcing, given their significant input contribution to agricultural soils. For cropland, we used gridded annual manure N application data for the period 1860–2014 from Zhang et al. (2017) compiled and downscaled based on country-specific annual livestock population data from FAOSTAT. For the period before 1860, we assumed N and P deposition rates of the year 1860. For pasture, we used global gridded datasets of N manure application rates from Lu and Tian (2017). The application of manure P in cropland and pasture was derived from manure N assuming a manure P : N ratio of 0.2. This ratio is a weighted value by the amount of manure N applied to soil and derived from ruminants (14.4 Tg N yr−1) and monogastric animals (10.1 Tg N yr−1) from FAOSTAT for the year 2000 with P : N ratios of 0.165 in ruminant manure (mean of 0.15–0.18 from Lun et al., 2018) and 0.26 in monogastric manure (mean of 0.24–0.28 from Lun et al., 2018). For manure applied to cropland and pasture, we assumed a typical slurry application with 90 % of the N in the liquid part of the slurry (like urine) going into the soil NH4+ pool. For the solid part of the slurry, we assumed it goes into a litter pool with a C : N ratio of 10 : 1 following Soussana and Lemaire (2014).
Mineral and manure N and P fertilizers in cropland were applied at day of year (DOY) 120 for the Northern Hemisphere (30–90∘ N), DOY 180 for tropical regions (30∘ N–30∘ S) and DOY 240 for the Southern Hemisphere (30–90∘ S).
Table 1Main information on datasets used for global evaluation of ORCHIDEE-CNP.
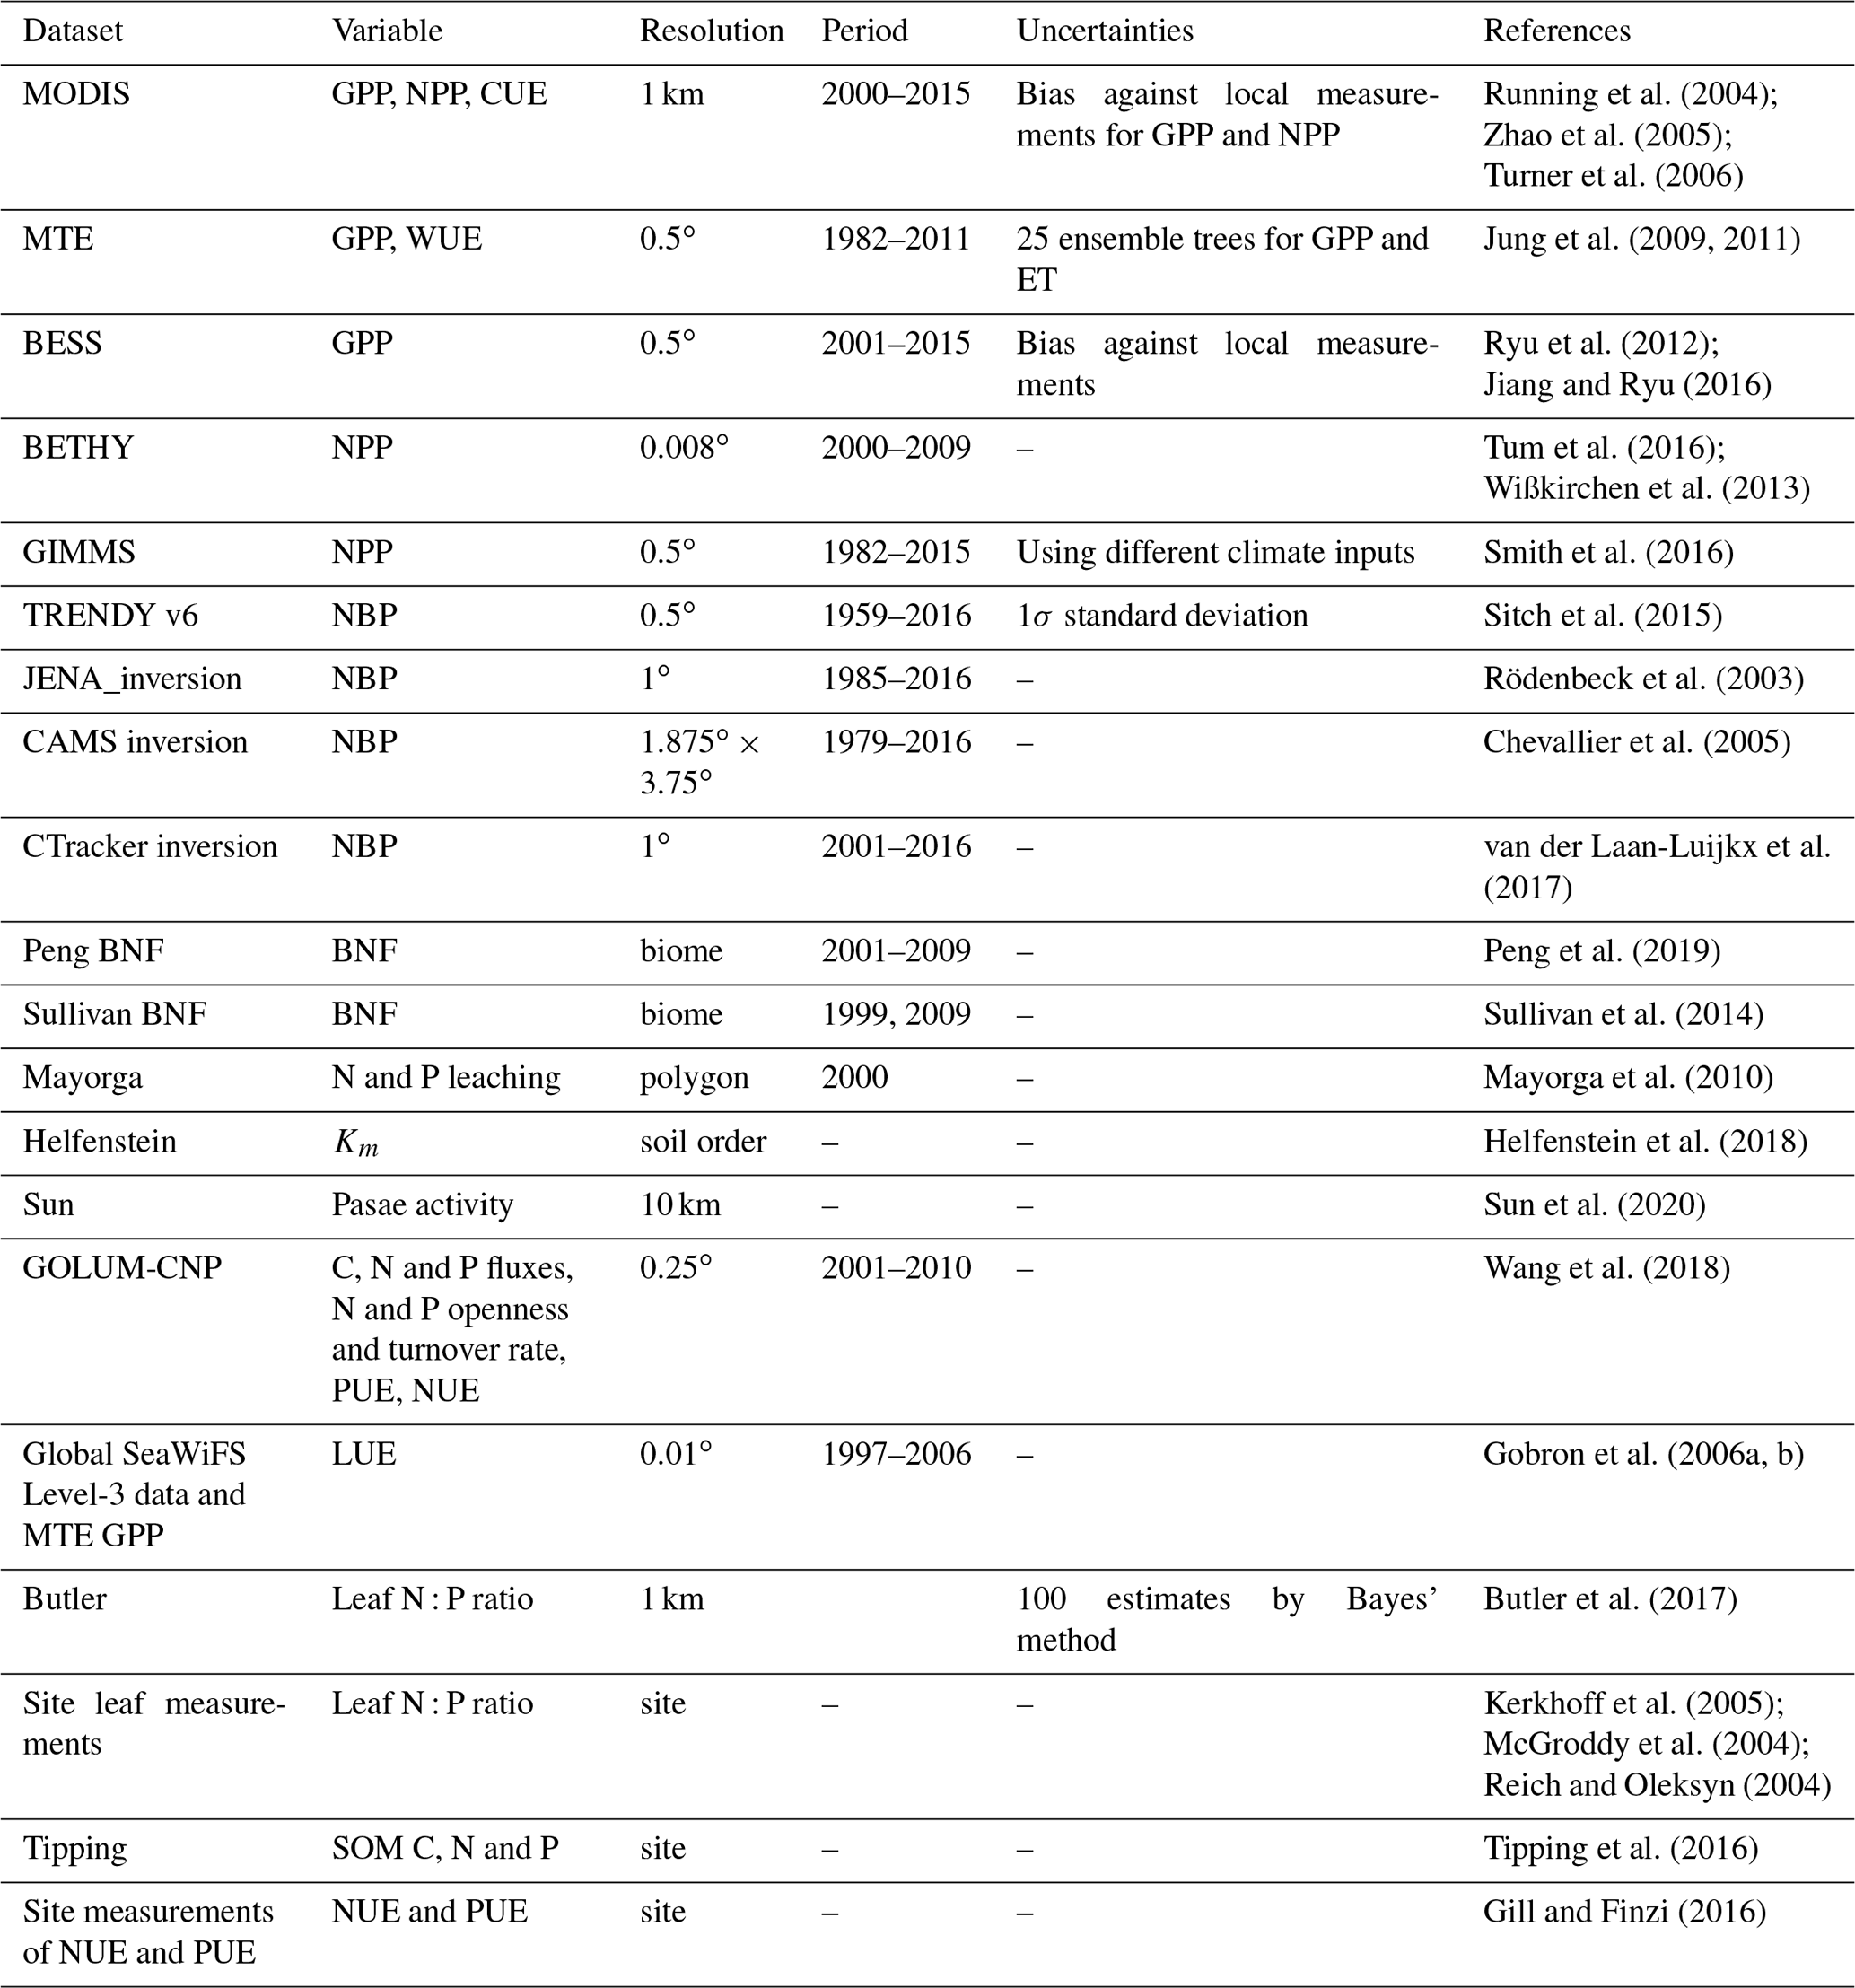
We evaluated the performance of ORCHIDEE-CNP v1.2 based on four major aspects (Fig. 1). Firstly, we evaluated the global C, N and P flows and storages. In the absence of robust spatially resolved estimates of N and P fluxes, we used the data-driven reconstruction of steady-state C, N and P fluxes on the biome level from the Global Observation-based Land-ecosystems Utilization Model of Carbon, Nitrogen and Phosphorus (GOLUM-CNP) v1.0 (Wang et al., 2018) (Table 1). Secondly, we evaluated plant resource use efficiencies (RUEs) of light, water, C, N and P on global and biome scales. RUEs reflect how ecosystems adjust and adapt to the availability of nutrient, water, light, and carbon resources (Fernández-Martínez et al., 2014; Hodapp et al., 2019). For this, we used estimates from site measurements and observation-based gridded datasets. Thirdly, we evaluated the response of gross primary productivity (GPP) to elevated CO2 to assess the response of plant productivity to changing resource availability (i.e., CO2) and historical perturbation C fluxes. For this, we used observation-based estimates (Ehlers et al., 2015; Campbell et al., 2017). Fourthly, we evaluated large-scale patterns of vegetation and soil N : P ratios as well as the N and P openness and turnover rates on the ecosystem level to assess spatial variation in nutrient limitation and the underlying drivers. For this, we used estimates from GOLUM-CNP, site measurements and observation-based gridded datasets (Kerkhoff et al., 2005; McGroddy et al., 2004; Reich and Oleksyn, 2004; Tipping et al., 2016; Butler et al., 2017; Wang et al., 2018). Finally, we showed the implications of ORCHIDEE-CNP for C cycling by evaluating the spatiotemporal patterns of terrestrial C fluxes and pools of the two versions of ORCHIDEE. For this, we used observation-based products of GPP and atmospheric inversions of the net land–atmosphere CO2 flux excluding fossil fuel emissions (Table 1). Each dataset is summarized in Table 1 and described in detail in the Supplement. All the gridded datasets with high spatial resolutions (Table 1) were resampled to the 2∘ × 2∘ resolution of the model output using area-weighted mean methods.
3.1 Ecosystem productivity
Different data-driven maps of NPP and GPP based on remote sensing and climate datasets were used (Table 1), thereby accounting for the uncertainty of each product and for the uncertainty from the spread between different products. Uncertainties of each NPP and GPP product were derived according to the original publications. We used a 20 % uncertainty of gridded GPP from the Moderate Resolution Imaging Spectroradiometer (MODIS) and the Breathing Earth System Simulator (BESS) (Sect. S1C in the Supplement; Turner et al., 2006; Jiang and Ryu, 2016) at a 2∘ scale. This is a coarse extrapolation of uncertainty reported at the grid cell scale, since none of these products reported spatial error covariance information, allowing us to upscale this uncertainty at 2∘ resolution. Further, for some products, uncertainty was defined as the bias against local measurements (Turner et al., 2006) and for others by using different climate input fields (Table 1). For multi-tree ensemble (MTE) GPP (Table 1), we used the spread (1σ standard deviation) from an ensemble of 25 members produced by different machine-learning methods (Jung et al., 2009). For MODIS NPP (Table 1), we used a 19 % uncertainty as assessed by Turner et al. (2006). For BETHY NPP we do not have an uncertainty (Tum et al., 2016). For Global Inventory Modeling and Mapping Studies (GIMMS) NPP (Table 1), we used the variance of three sets of products (Table 1) based on different climate datasets (Smith et al., 2016).
Two statistical indices were used to summarize the performance of ORCHIDEE and ORCHIDEE-CNP with respect to the interannual and seasonal variability of GPP and the interannual variability of net biome productivity (NBP) (Sect. 4.6): the coefficient of determination (R2) and relative mean square deviation (rMSE). The rMSE is defined as
Xmodel and Xref are values from models (i.e., ORCHIDEE and ORCHIDEE-CNP) and referenced datasets (i.e., MTE and BESS; Sect. S1C), respectively, and is the mean value across all years (for interannual variability evaluation) or all months (for seasonality evaluation).
3.2 Resource use efficiencies
The definition of resource use efficiencies is explained in Sect. 4.2. Observation-based light use efficiency (LUE) was calculated using MTE GPP, downward shortwave radiation from CRUJRA, and the fraction of absorbed photosynthetically active radiation (fAPAR) from the Global SeaWiFS Level-3 data (Gobron et al., 2006a, b). Uncertainty was derived from 25 ensemble members of MTE GPP. Observation-based water use efficiency (WUE) was calculated as the ratio between MTE GPP and MTE ET (Table 1); its uncertainties were calculated using a Monte Carlo resampling procedure in which 25 different members of GPP and ET were randomly selected. Observation-based carbon use efficiency (CUE) was calculated from the ratio of MODIS NPP to MODIS GPP. It should be noted that MODIS NPP is based on a calibrated version of the BIOME-BGC model (Turner et al., 2006) so that CUE is not strictly an observation-based quantity. CUE uncertainties were calculated using a Monte Carlo method given 20 % and 19 % uncertainty for MODIS GPP and NPP products at 2∘ resolution, respectively.

Figure 2Flowchart of mean flows and storages per area of C, N and P (g C g−1, N g−1, P m−2 yr−1) in natural biomes for GOLUM-CNP and ORCHIDEE-CNP. GOLUM-CNP stands for Global Observation-based Land-ecosystems Utilization Model of Carbon, Nitrogen and Phosphorus (GOLUM-CNP) v1.0, which is a data-driven model of steady-state C, N and P cycles for present-day (2001–2016) conditions. C, N and P losses via fire in ORCHIDEE-CNP are ignored. Numbers in square brackets indicate the standard deviations to account for the spatial spread of C, N and P fluxes.
4.1 Carbon, nitrogen, and phosphorus flows and storages
We compared the simulated fluxes of C, N and P within natural ecosystems for the period 2001–2010 to the data-driven estimates from GOLUM-CNP (Table 1; Sect. S1B in Supplement) on the global scale and for natural ecosystems at biome scale. Modeled global C, N and P fluxes in ORCHIDEE-CNP are comparable with the estimates by GOLUM-CNP (Fig. 2). One exception is that ORCHIDEE-CNP simulates a fourfold lower P leaching from soils (3.7 ± 9.7 mg P m−2 yr−1) than GOLUM-CNP (23 mg P m−2 yr−1) (Fig. 2), which mainly occurs in forest ecosystems (Fig. S1). Note that GOLUM-CNP presents the steady-state C, N and P cycles in natural biomes, omitting human perturbations that have strongly altered the flows of C, N and P during the recent past. The impact of such perturbations on the nutrient flows are analyzed in detail in Sects. S2 and S3 in the Supplement.
In terms of C and nutrient storages, ORCHIDEE-CNP simulated comparable soil C, N and P storage (soil organic matter and litter) but higher vegetation C, N and P than GOLUM-CNP. Detailed comparisons for the spatial pattern of soil organic carbon (SOC) and forest aboveground C against observation-based datasets can be found in Figs. S2 and S3.
4.2 Resource use efficiencies
Here we evaluate the resource use efficiencies of GPP for light (L), water (W), C, N and P defined by
where GPP is the annual gross primary productivity (g C m−2 yr−1), fAPAR the fraction of absorbed photosynthetically active radiation (%), PAR the annual photosynthetically active radiation (W m−2 yr−1), ET the annual evapotranspiration (mm m−2 yr−1), and FN and FP the total N uptake (g N m−2 yr−1) and P uptake by plants (g P m−2 yr−1), respectively. We calculated fAPAR in ORCHIDEE-CNP and ORCHIDEE as a function of leaf area index (LAI): fAPAR (Ito et al., 2004).
Compared to observed LUE (Sect. S1E in the Supplement), ORCHIDEE-CNP modeled median values at the biome level are generally lower but still within the ranges of uncertainties of observation-based datasets (Sect. 3.2) except for tropical (TRF) and temperate deciduous forest (TEDF). In comparison to ORCHIDEE, ORCHIDEE-CNP simulated LUEs closer to observations for four out of six biomes (TECF, BOCF, TEG, TRG) (Fig. 3a).
Compared to observed WUE, the ORCHIDEE and ORCHIDEE-CNP simulated values fall within the uncertainty range of observations (Fig. 3b). However, the WUE values from ORCHIDEE-CNP are on the high end of the range for temperate conifers (TECF) and BOCF and on the low end for temperate and tropical grasslands (TEG and TRG). The highest median WUEs were correctly simulated in temperate forests by ORCHIDEE-CNP (Fig. 3b), but the lowest WUE values were simulated in temperate instead of tropical forests.
Compared with observed CUE, ORCHIDEE-CNP simulated comparable values for TEDF and TECF but lower values for TRF, BOCF and grasslands. Both ORCHIDEE-CNP and ORCHIDEE cannot capture the increase in CUE from tropical to boreal forests apparent in the observation-based products (Fig. 3c) and in measurements from forest sites (Piao et al., 2010). In comparison to ORCHIDEE, ORCHIDEE-CNP simulated CUEs closer to observations for four out of six biomes (TEDF, TECF, BOCF, TEG) with respect to the median and spread.
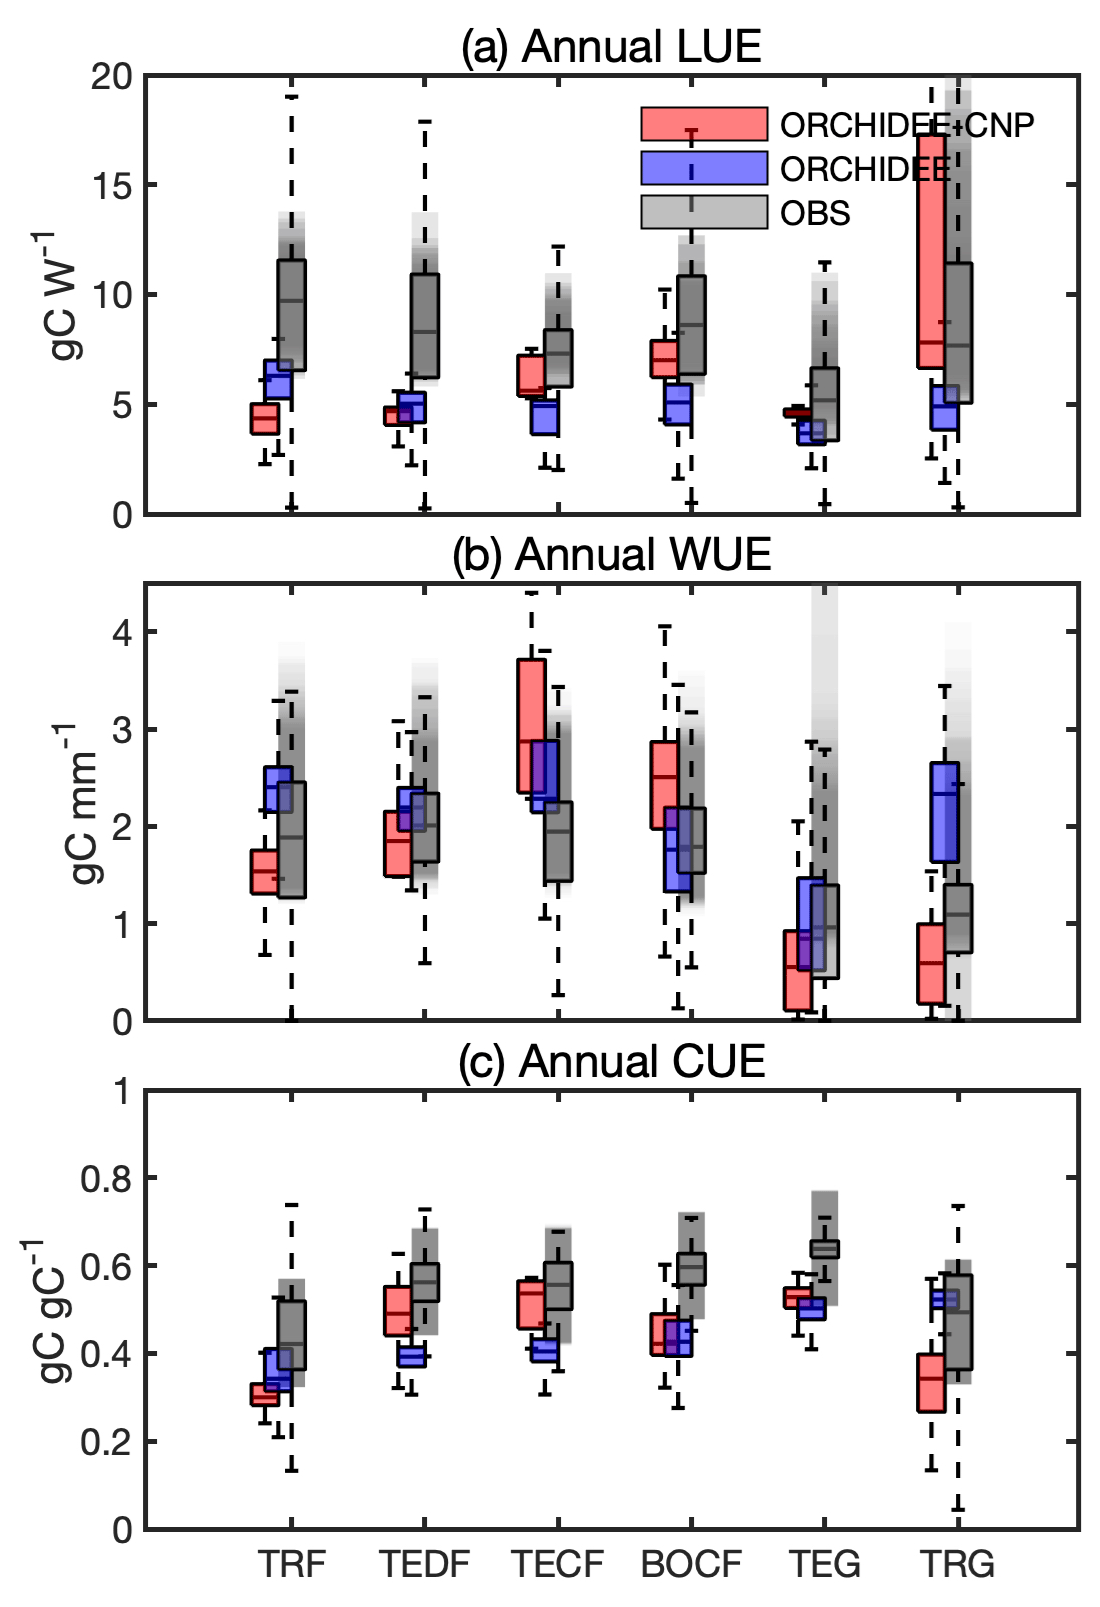
Figure 3Comparison of annual use efficiencies of light (LUE), water (WUE) and carbon (CUE) between ORCHIDEE-CNP, ORCHIDEE and satellite-based estimations for six biomes: tropical rainforest (TRF), temperate deciduous forest (TEDF), temperate conifer forest (TECF), boreal conifer forest (BOCF), temperate grass (TEG) and tropical grass (TRG). The whiskers indicate the interquartile (box) and 95 % confidence intervals (dashed lines). Grey boxes indicate the satellite-based estimations (referenced). The grey shaded areas indicate the uncertainties of resource use efficiencies given by referenced estimations, which involve uncertainties for multi-estimations and spatial variability for each estimation.
Consistent with site observations of NUE from Gill and Finzi (2016) and GOLUM-CNP outputs, ORCHIDEE-CNP correctly simulated the high values of TECF and the low values of tropical forests (Fig. 4a). However, compared with site observations of PUE from Gill and Finzi (2016), showing a PUE decrease from tropical to boreal regions, ORCHIDEE-CNP simulated a rather flat value (Fig. 4b). This suggests a P limitation that is too strong in high-latitude ecosystems, consistent with the fact that the model underestimates peak northern GPP and the northern land sink (Sect. 4.6). Nevertheless, the model-simulated PUE values fall in the range of GOLUM-CNP estimates. Tropical C4 grasslands have higher simulated NUE and PUE than temperate C3 grasslands, consistent with GOLUM-CNP (Fig. 4).
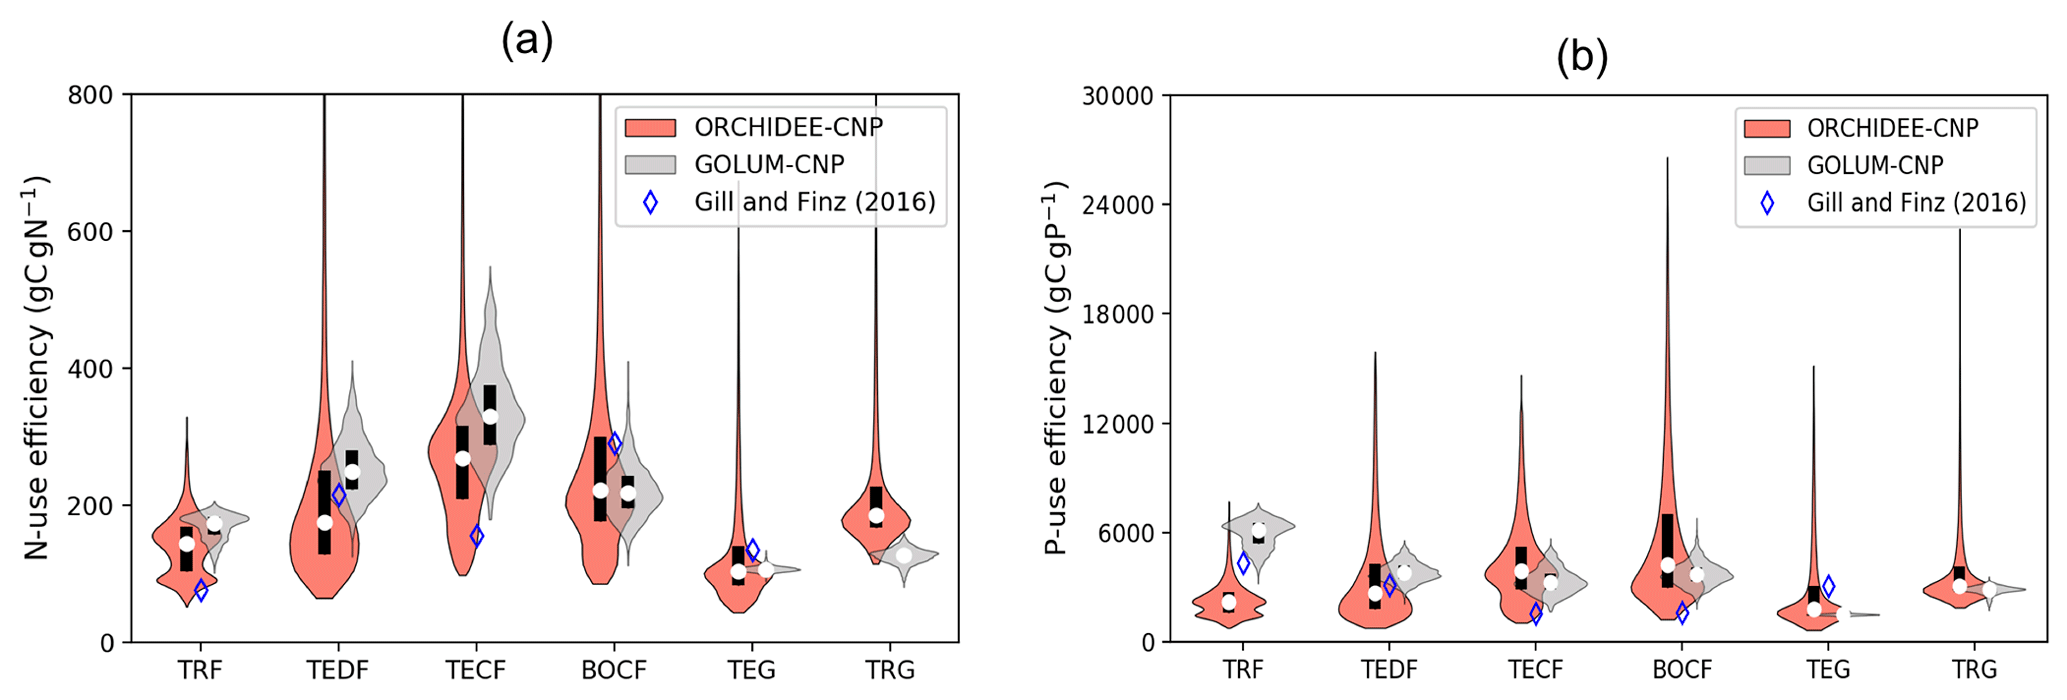
Figure 4Violin plots of nitrogen use efficiency (NUE; a) and phosphorus use efficiency (PUE; b) by ORCHIDEE-CNP, GOLUM-CNP and observations (Gill and Finzi, 2018) for six biomes: tropical rainforest (TRF), temperate deciduous forest (TEDF), temperate conifer forest (TECF), boreal conifer forest (BOCF), temperate grass (TEG) and tropical grass (TRG). Open circles are the medians of all grid cells within each biome, with balloons representing the probability density distribution of each value. Black whiskers indicate the interquartile.
4.3 CO2 fertilization effect
We compare the simulated response of plant productivity to increasing CO2 during the historical period (i.e., CO2 fertilization effect Eco2) with observation-based estimates for C3 plants from the historical change in deuterium isotopomers in leaf herbarium samples (Ehlers et al., 2015). For global (C3 and C4) vegetation we compare to indirect evidence from carbonyl sulfide (COS) atmospheric ice-core observations (Campbell et al., 2017). The CO2 fertilization effect is defined here by the GPP ratio ():
where GPP296 indicates pre-industrial GPP (g C m−2 yr−1) under a CO2 concentration of 296 ppm and GPP396 under a current CO2 concentration of 396 ppm. Those CO2 concentrations of 296 and 396 ppm correspond to tropospheric mixing ratios of CO2 in the years ∼ 1900 and 2013, respectively, similar to values used for estimating the response of GPP to a ∼ 100 ppm CO2 increase in Ehlers et al. (2015) and Campbell et al. (2017).
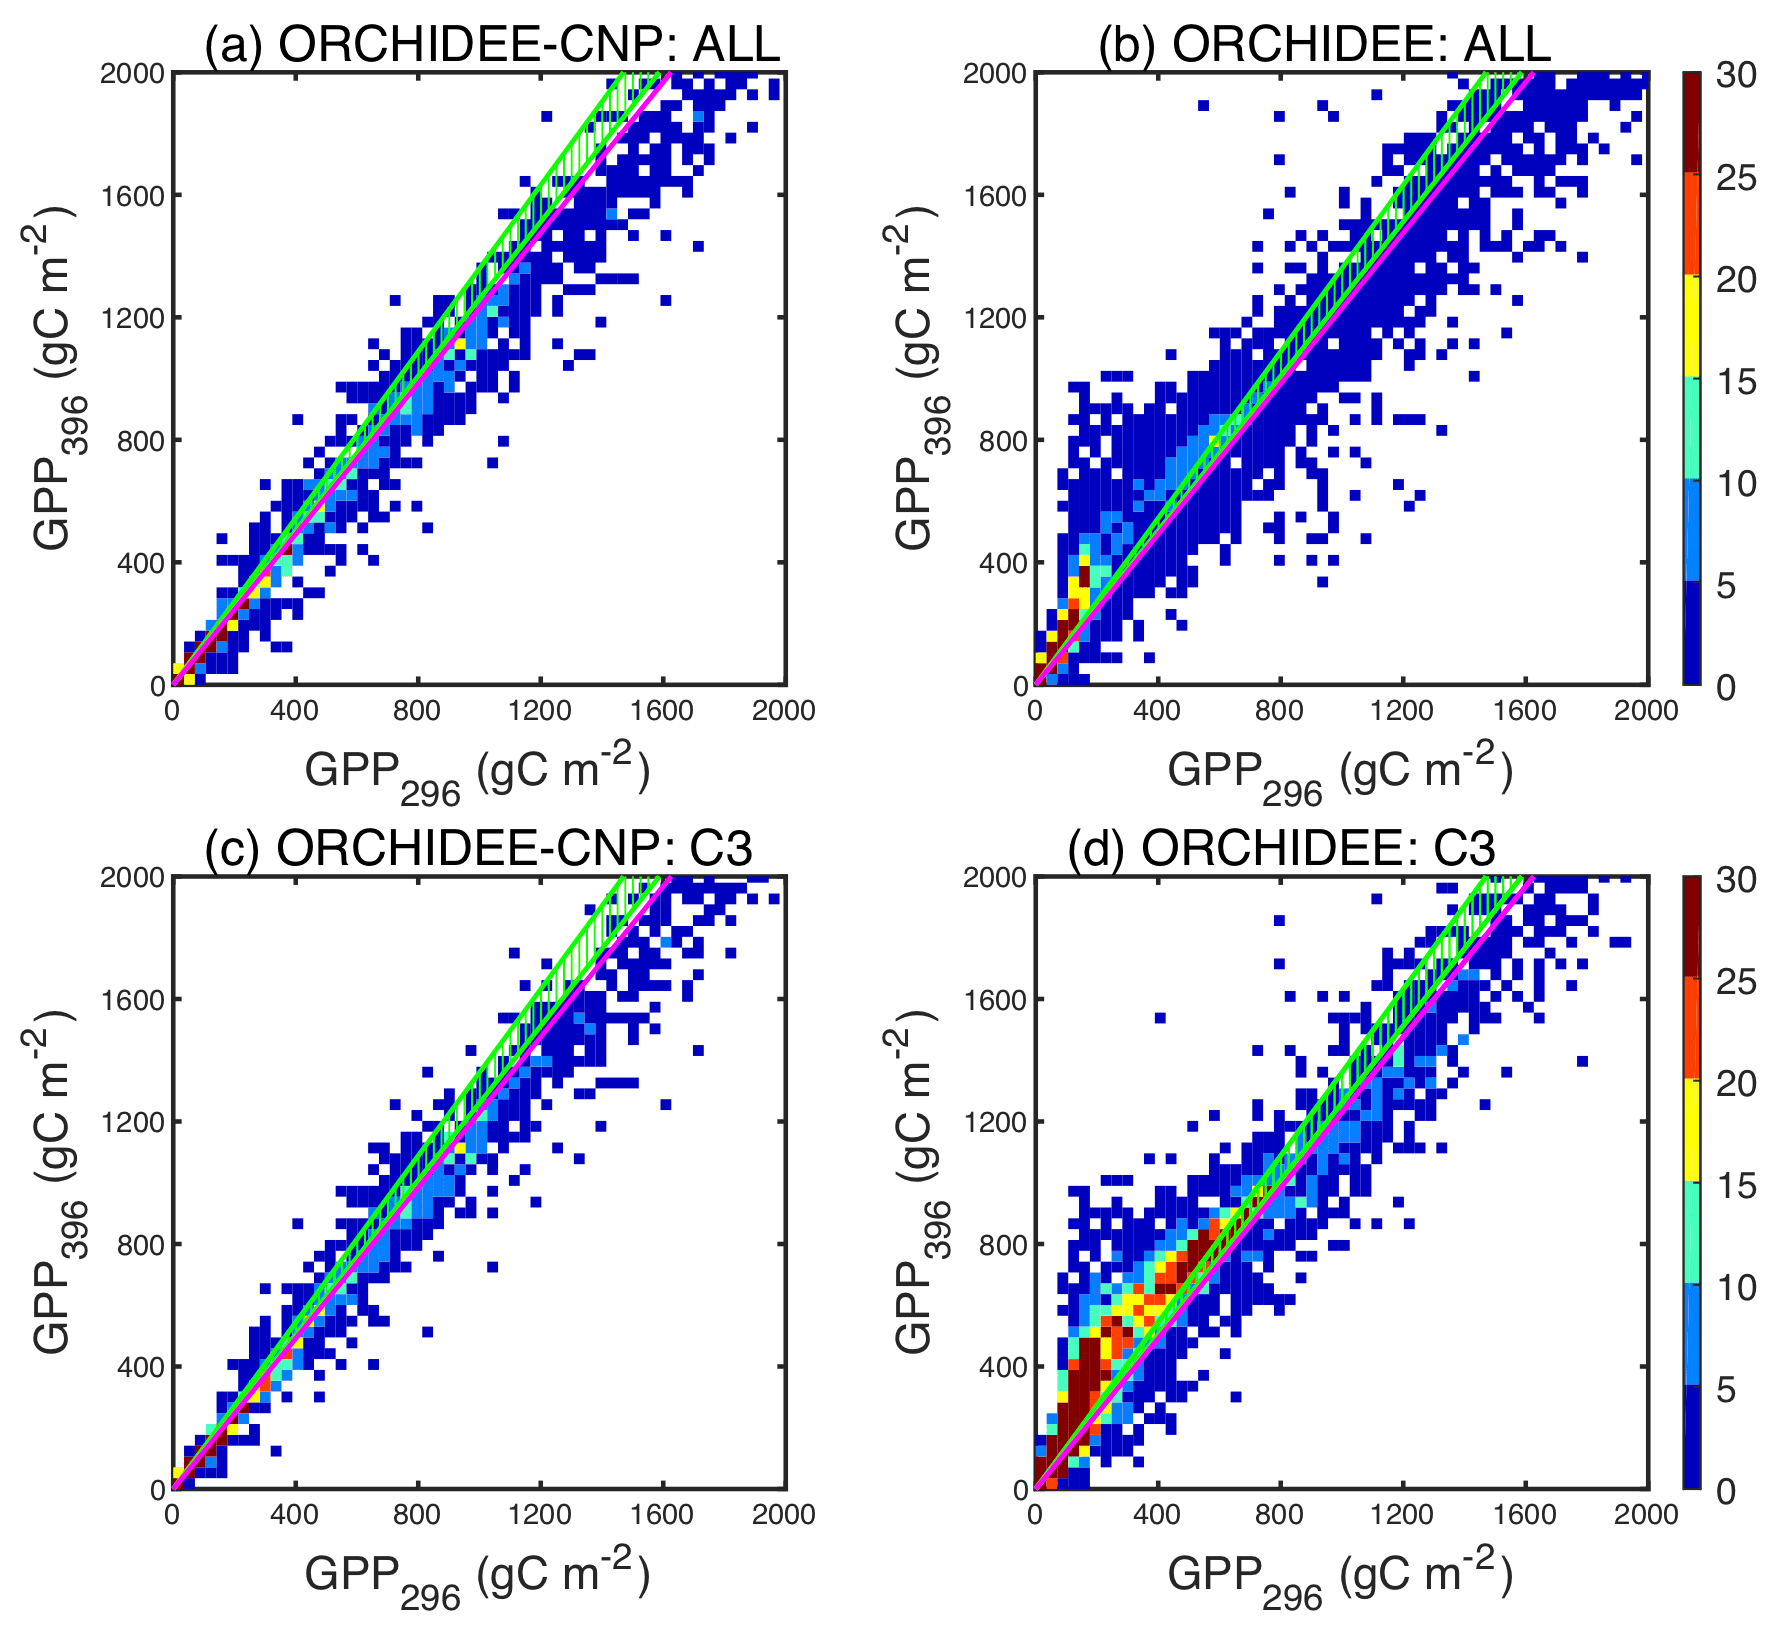
Figure 5Comparisons between pre-industrial GPP with an atmospheric CO2 concentration of 296 ppm (GPP296) and current GPP with an atmospheric CO2 concentration of 396 ppm (GPP396) for all natural plants (a, b) and natural C3 plants (c, d) by ORCHIDEE-CNP (a, c) and ORCHIDEE (b, d). The color scale shows the point density. Different point densities and patch sizes for ORCHIDEE and ORCHIDEE-CNP are due to the different spatial resolution (2∘ × 2∘ for ORCHIDEE-CNP and 0.5∘ × 0.5∘ for ORCHIDEE). The ratio between GPP396 and GPP296 indicates the CO2 fertilization effects (). Green dashed areas indicate the observed from the Campbell et al. (2017) COS records. Pink lines indicate the observed from Ehlers et al. (2015).
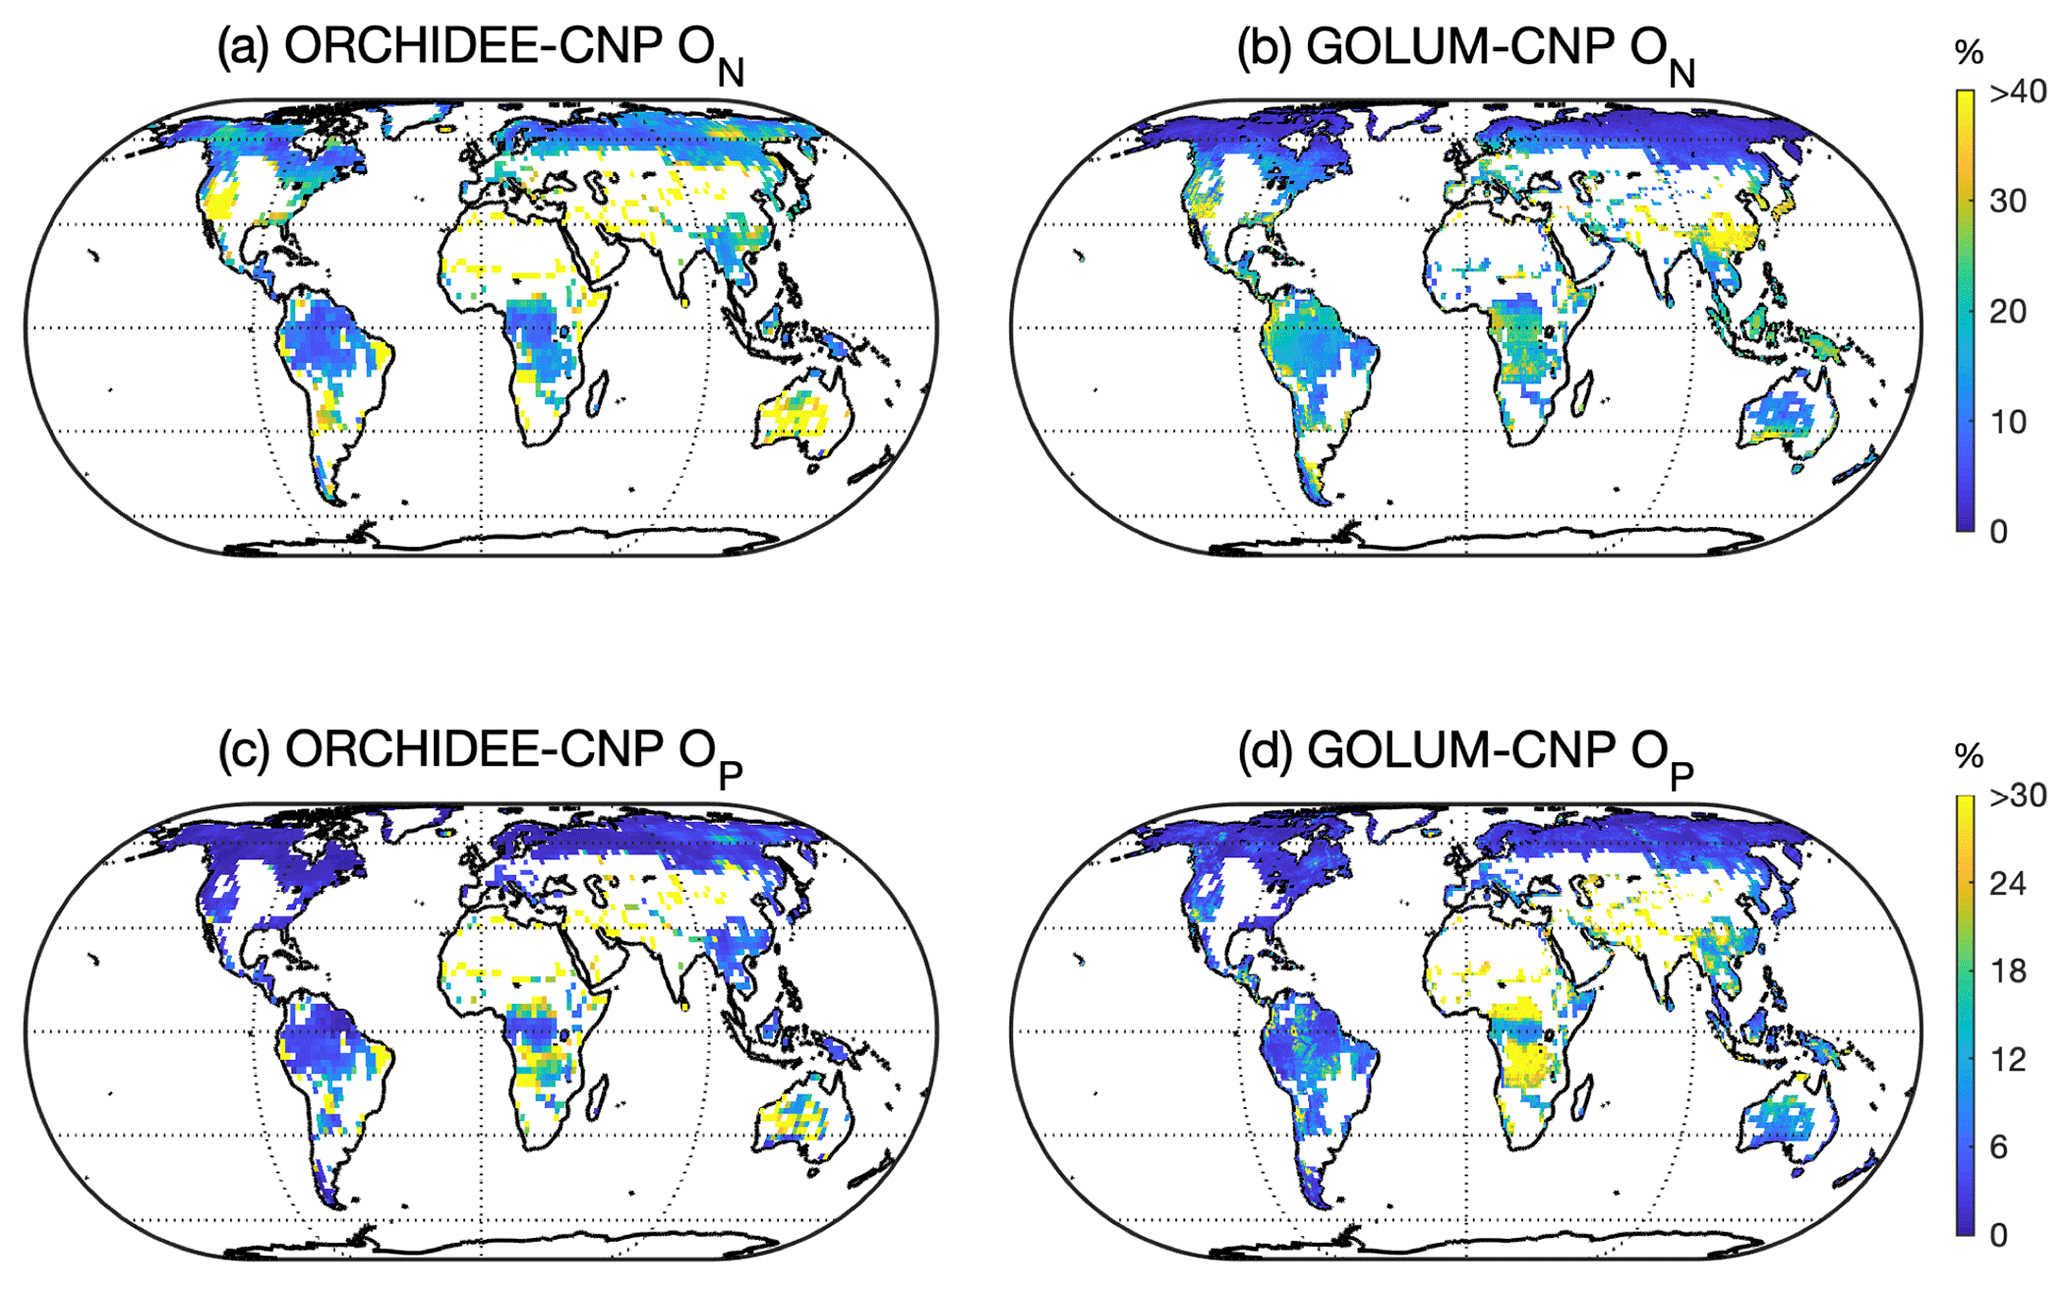
Figure 6Global pattern of N (ON, a, b) and P openness and that (OP, c, d) simulated by ORCHIDEE-CNP (a, c) and GOLUM-CNP (b, d). Pixels with managed lands > 50 % in ORCHIDEE-CNP were masked. The same area was masked from the pattern of ON and OP for GOLUM-CNP.
Modeled by ORCHIDEE-CNP of natural biomes ranges between 1.0 and 1.3 for most regions (Fig. 5a), slightly lower than global derived from COS of 1.26–1.36 (Campbell et al., 2017). Modeled values for C3 plants (Figs. 5c, S4) are also consistent with from herbarium samples (Ehlers et al., 2015), equal to 1.23. When compared to ORCHIDEE without nutrient cycles, we found that ORCHIDEE-CNP simulates smaller and more realistic values of (Fig. 5c, d) but with lower values in boreal regions that could not be checked against observations (Fig. S5).
4.4 Ecosystem nutrient openness and nutrient turnover
Nutrients taken up by plants are either recycled within the ecosystem or acquired from external sources (P weathering of primary and secondary minerals, atmospheric N and P deposition, biological nitrogen fixation – BNF, and N and P fertilizer addition to cultivated lands). Wang et al. (2018) calculated an indicator of the openness of N and P cycling in natural ecosystems as the ratio of external inputs of N and P into the ecosystem to the total amount of N and P that plants use for GPP. Similarly, we diagnosed the openness for N and P (ON and OP) from the ORCHIDEE-CNP output by
where Ix is the annual external nutrient input (g X m−2 yr−1), Fx the annual plant uptake of soil nutrients (g X m−2 yr−1) and RSBx the flux of nutrients recycled within plants (g X m−2 yr−1) by foliar nutrient resorption prior to leaf shedding. External nutrient inputs include atmospheric N deposition and BNF, as well as P deposition and P release from rock weathering.
Modeled ON in natural biomes by ORCHIDEE-CNP showed only a small variance across the globe, whereas GOLUM-CNP predicts a higher ON in tropical and temperate regions than in boreal regions (Fig. 6a, b). OP values are below 15 % in ORCHIDEE-CNP for most biomes, of a similar order of magnitude as in GOLUM-CNP (Fig. 6c, d). ORCHIDEE-CNP simulates a lower ON in tropical natural biomes than GOLUM-CNP, which is mainly due to lower but more realistic tropical BNF in ORCHIDEE-CNP compared to GOLUM-CNP (Sect. S4 in the Supplement). ORCHIDEE-CNP simulates a higher ON in high-latitude grassland (Fig. 6a, b) than GOLUM-CNP, which is due to overestimation of BNF in NH in ORCHIDEE-CNP (Sect. S4 in the Supplement). Modeled OP in natural biomes by ORCHIDEE-CNP compares well with GOLUM-CNP except for central Africa (Fig. 6c, d). This is primarily because ORCHIDEE-CNP used a lower P deposition forcing than GOLUM-CNP.
Residence time quantifies the average time it takes for an N (or P) molecule to enter and leave the ecosystem (τN and τP). In this study, we adopted the approach of Carvalhais et al. (2014) for the carbon residence time. We define the residence time of N and P as the ratio of total respective nutrient stock in the ecosystem to their respective total input flux:
where Ni indicates the N mass (g N m−2) in organic matter pools i (with i= plant, litter, SOM pools), Ninorg is the sum of all inorganic N pools, and Nd and BNF are N deposition and biological N fixation rates, respectively (g N m−2 yr−1). Similarly, Pi is the P mass (g P m−2) in organic matter pools, Pinorg the sum of inorganic P pools, and Pd and Pw are P deposition and P weathering release rates, respectively (g P m−2 yr−1).
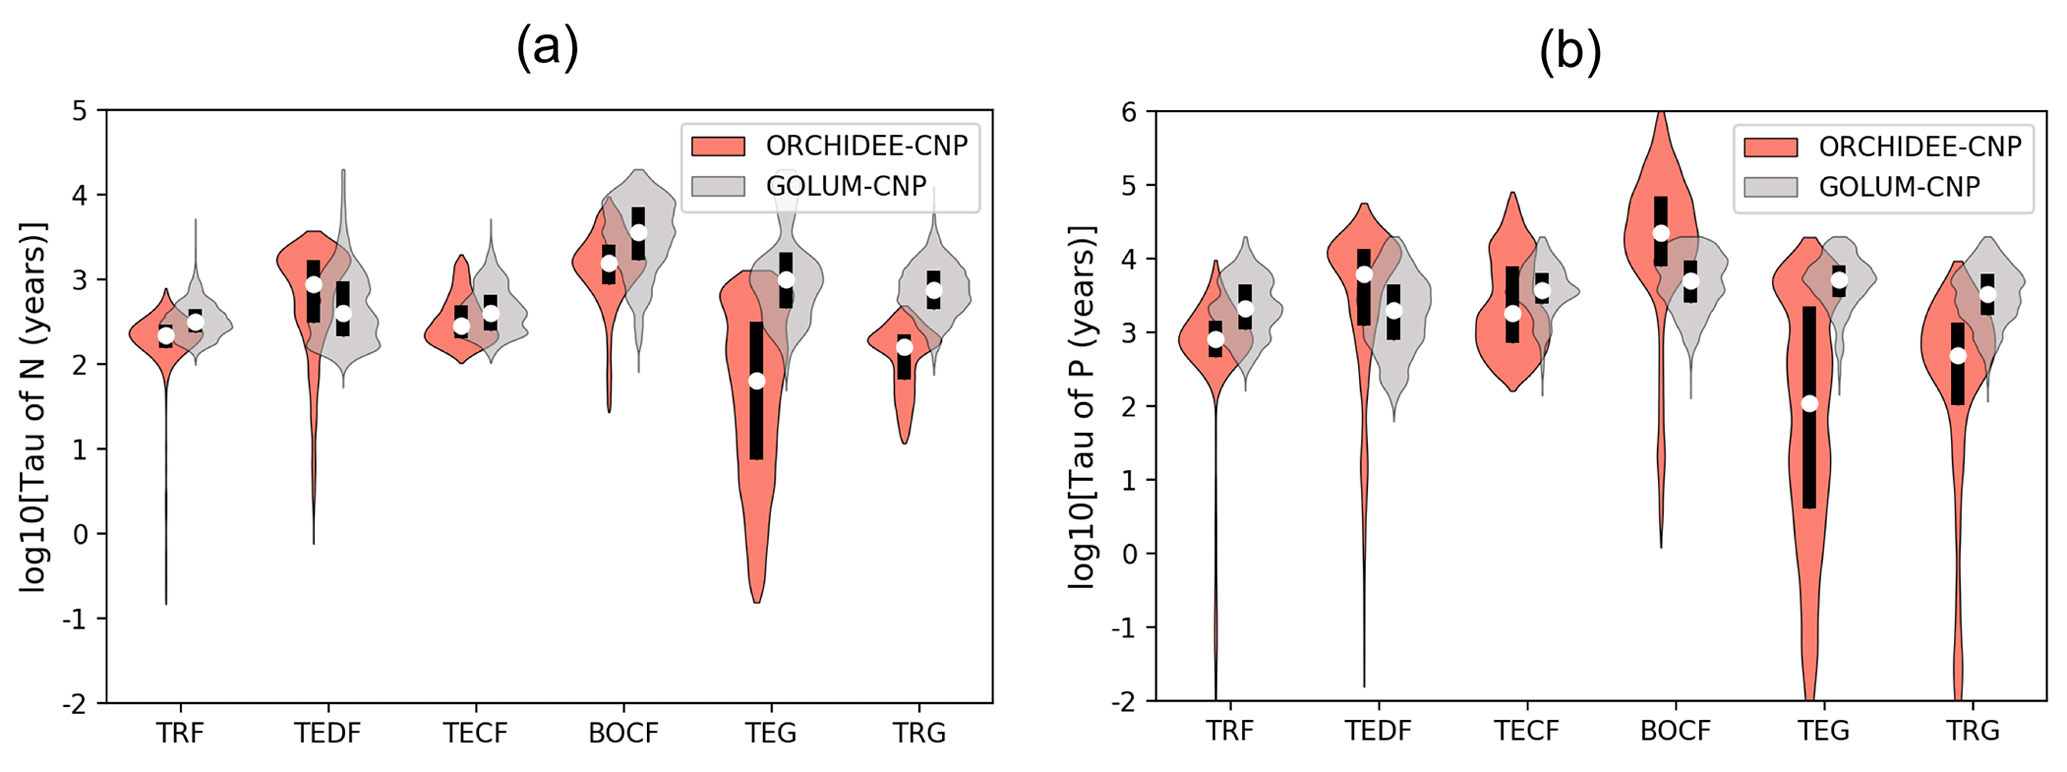
Figure 7Violin plots of the residence time of (a) N and (b) P cycles for six biomes: tropical rainforest (TRF), temperate deciduous forest (TEDF), temperate coniferous forest (TECF), boreal coniferous forest (BOCF), temperate grass (TEG) and tropical grass (TRG). Open circles are the medians of all grid cells within each biome, with balloons representing the probability density distribution of each value. Black whiskers indicate the interquartile.
Modeled median τN of natural biomes in ORCHIDEE-CNP varies between 56 and 1585 years, while τP varies within a large range of 101 to 223 870 years (Fig. 7). ORCHIDEE-CNP captured the order of magnitude of τN and τP for forests found in GOLUM-CNP. Longer median τN (1585 years) and τP (1 223 870 years) are simulated for boreal forest compared to temperate and tropical forests (251–794 years for τN and 891–7080 years for τP) and grassland (56–158 years for τN and 101–468 years for τP) by ORCHIDEE-CNP, consistent with results from GOLUM-CNP. However, for grasslands, simulated τN (56-158 years) and τP (101–468 years) are 5–11-fold shorter than in GOLUM-CNP (Fig. 7).
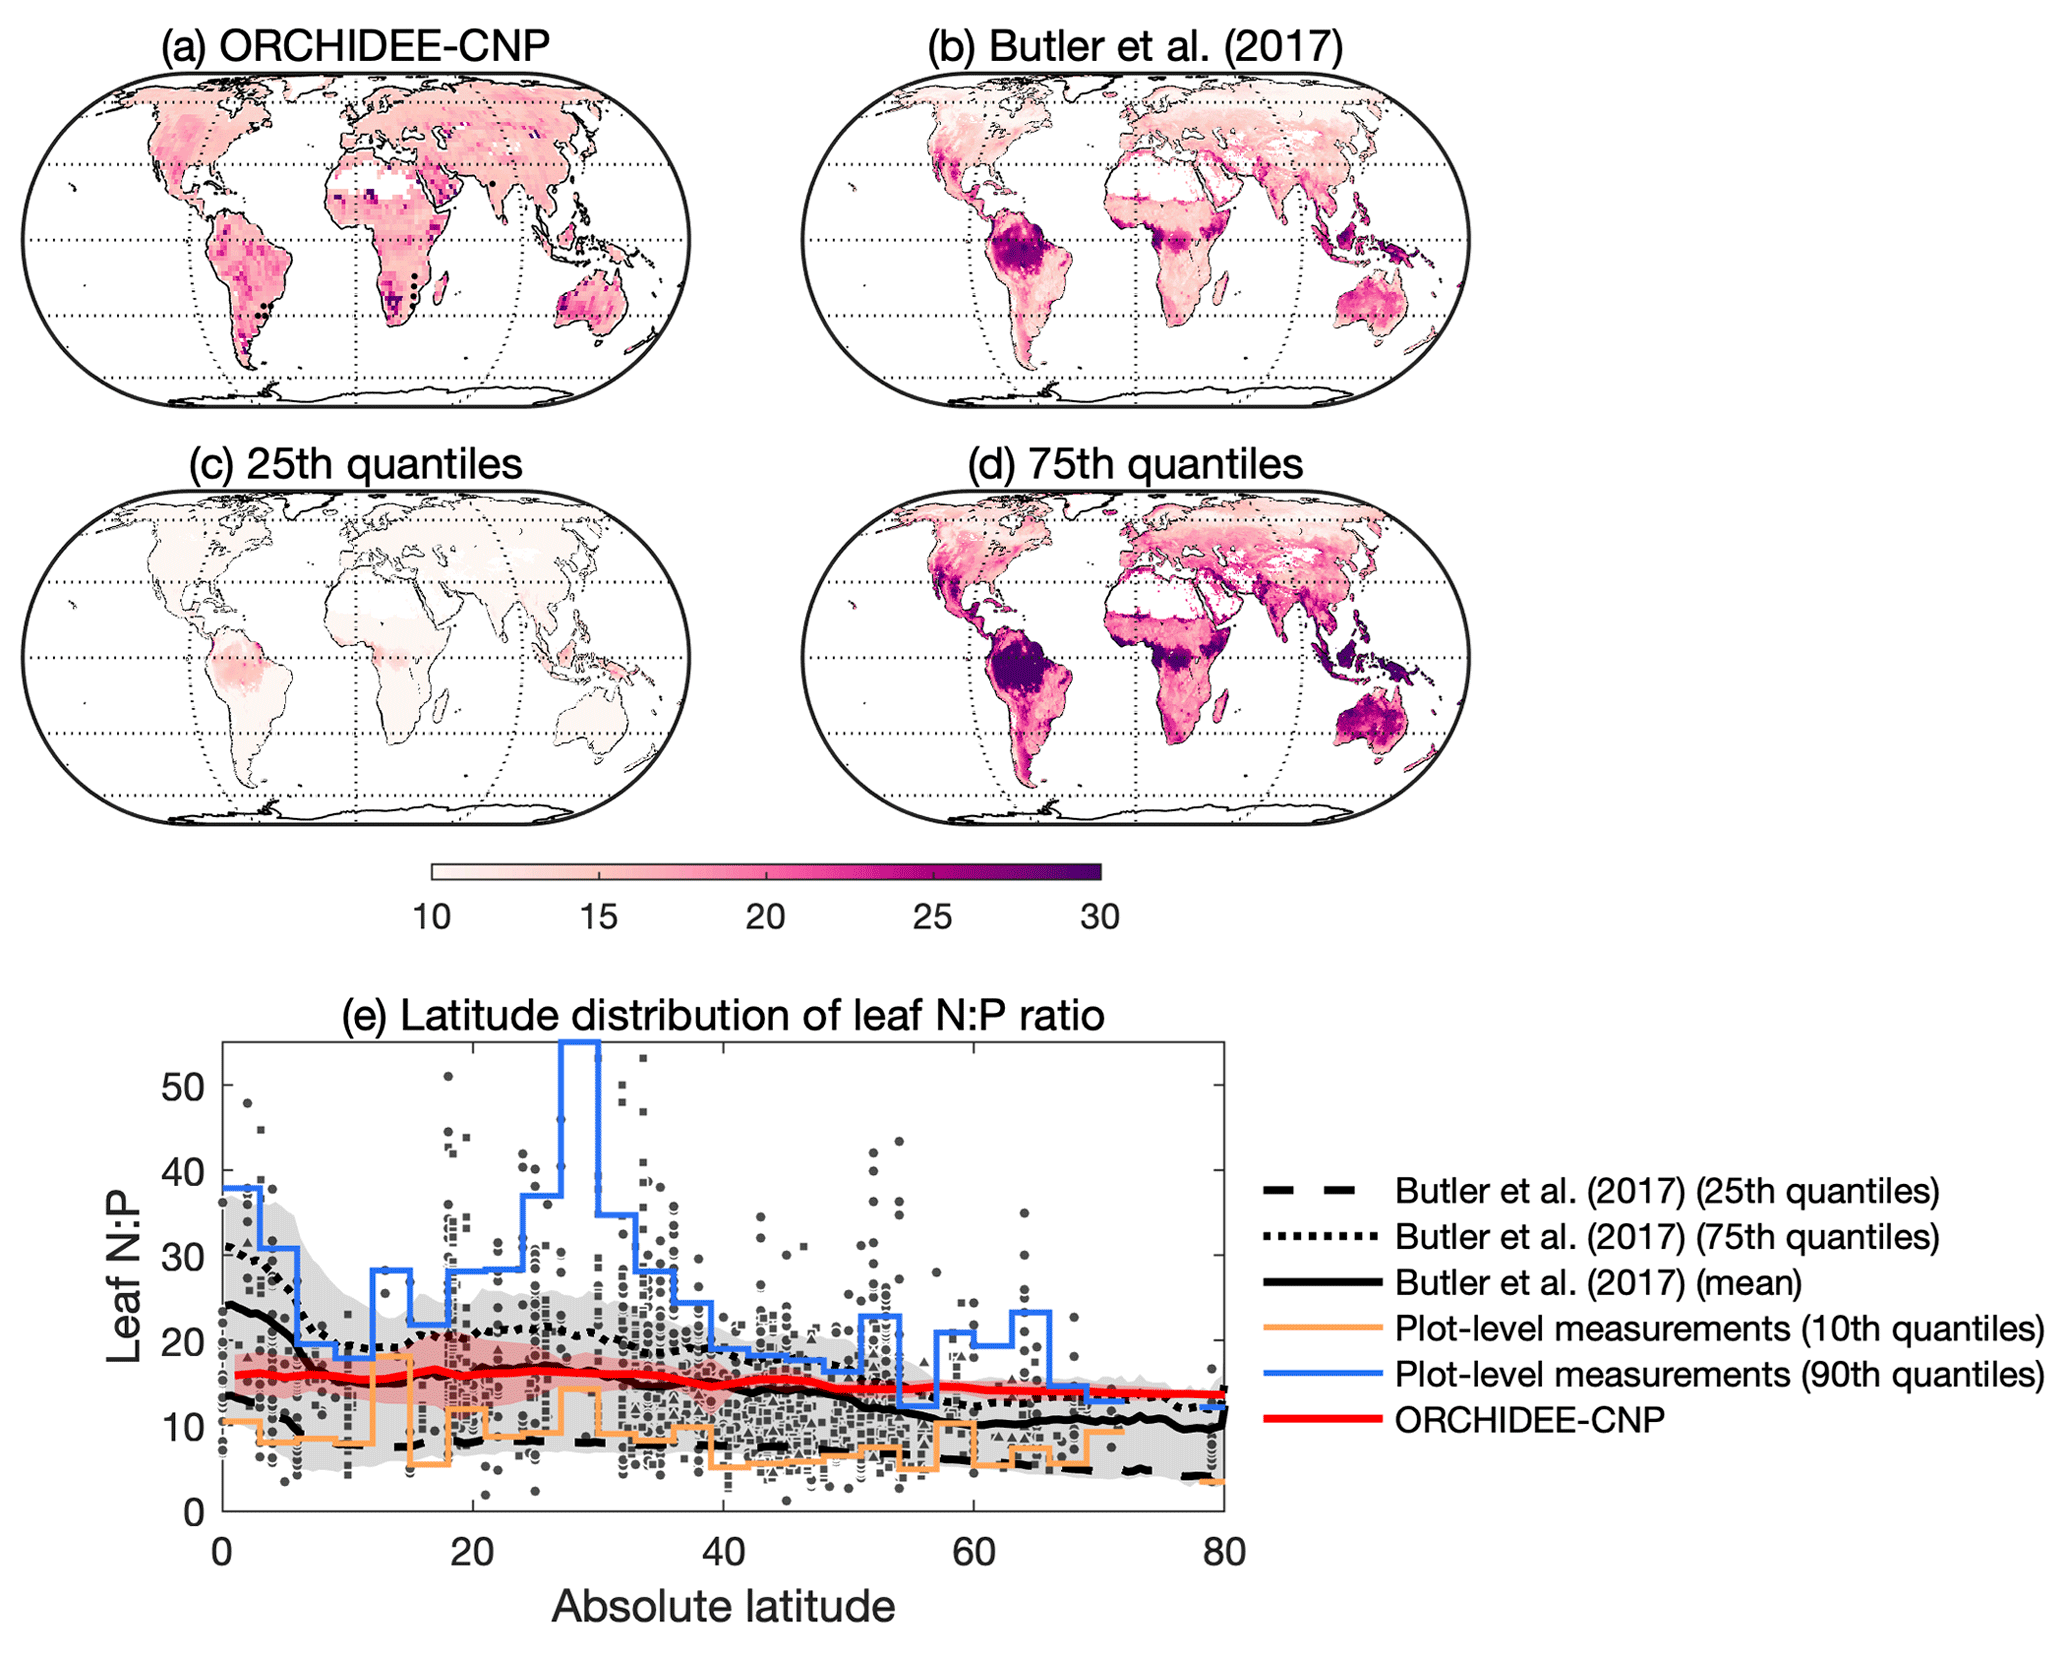
Figure 8Comparisons of the leaf N : P ratio between ORCHIDEE-CNP, data-driven estimates and observations. (a) The global pattern of the mean leaf N : P ratio over 2001–2016 for ORCHIDEE and (b) for mean leaf N : P in Butler et al. (2017). Panels (c) and (d) are the 25th and 75th percentile, respectively, of the leaf N : P ratio by Butler et al. (2017). Dots in (a) indicate the area with a leaf N : P ratio from ORCHIDEE-CNP falling into the 25th–75th percentiles of the Butler et al. (2017) estimation. (d) The latitude distributions of the leaf N : P ratio for ORCHIDEE-CNP, the Butler et al. (2017) estimation and site measurements. Red shared area indicates the uncertainty from latitudinal spreads of the leaf N : P ratio for ORCHIDEE-CNP. The grey shaded area indicates the uncertainty from both the estimations and latitudinal spreads for Butler et al. (2017). Blue and yellow lines indicate the 10th and 90th percentiles, respectively, of measured leaf N : P ratios in each bin of 3∘ latitude.
4.5 Stoichiometry
4.5.1 Foliar stoichiometry
Leaf N : P ratios for natural biomes predicted by ORCHIDEE-CNP vary between 15 and 25 (Fig. 8a). The observed decline in median leaf N : P ratios with increasing latitude was not reproduced by the model (Sect. S1E1 in the Supplement; Fig. 8e), although the modeled latitudinal distribution of leaf N : P ratios remained within the 10–90th quantiles of the site-level data (Kerkhoff et al., 2005; McGroddy et al., 2004; Reich and Oleksyn, 2004). Further, the simulated leaf N : P ratios fall within the interquartile of upscaled site measurements by Butler et al. (2017) for most of the globe, with the exception of regions north of 55∘ N where leaf N : P ratios are outside the observation-based range, suggesting a P constraint relative to N that is too strong (Fig. 8).
4.5.2 Soil stoichiometry
Here we evaluate the modeled C : N, C : P and N : P ratios of soil organic matter for different biomes against data from the large compilation of measurements for soils (0–60 cm depth) by Tipping et al. (2016). Modeled C : N ratios fall into much more narrow ranges (7.8–11.8 for the widest interquartile range) compared to the observations (11.1–20.5; Fig. 9a) as a result of prescribing constant C : N ratios in ORCHIDEE-CNP (Goll et al., 2017a). SOM P content varies in ORCHIDEE-CNP as a consequence of varying biochemical phosphorus mineralization rates (Sect. S7), and thus C : P and N : P ratios of SOM show pronounced variation in space. ORCHIDEE-CNP simulates comparable N : P ratios as measurements in terms of both the median value and distributions for tropical forests, but it overestimates the observed N : P ratios by 108 %–327 % in temperate forest, tropical and temperate grassland soils (Fig. 9b, c). The higher observed C : P and N : P in forest compared to grassland soils are not captured by ORCHIDEE-CNP (Fig. 9b, c). We also compared ORCHIDEE-CNP N : P ratios to the results of GOLUM-CNP, which were based on data from Zechmeister-Boltenstern et al. (2015) that are more limited than Tipping et al. (2016), and found an overestimation for temperate forests, tropical forests and temperate grasslands.
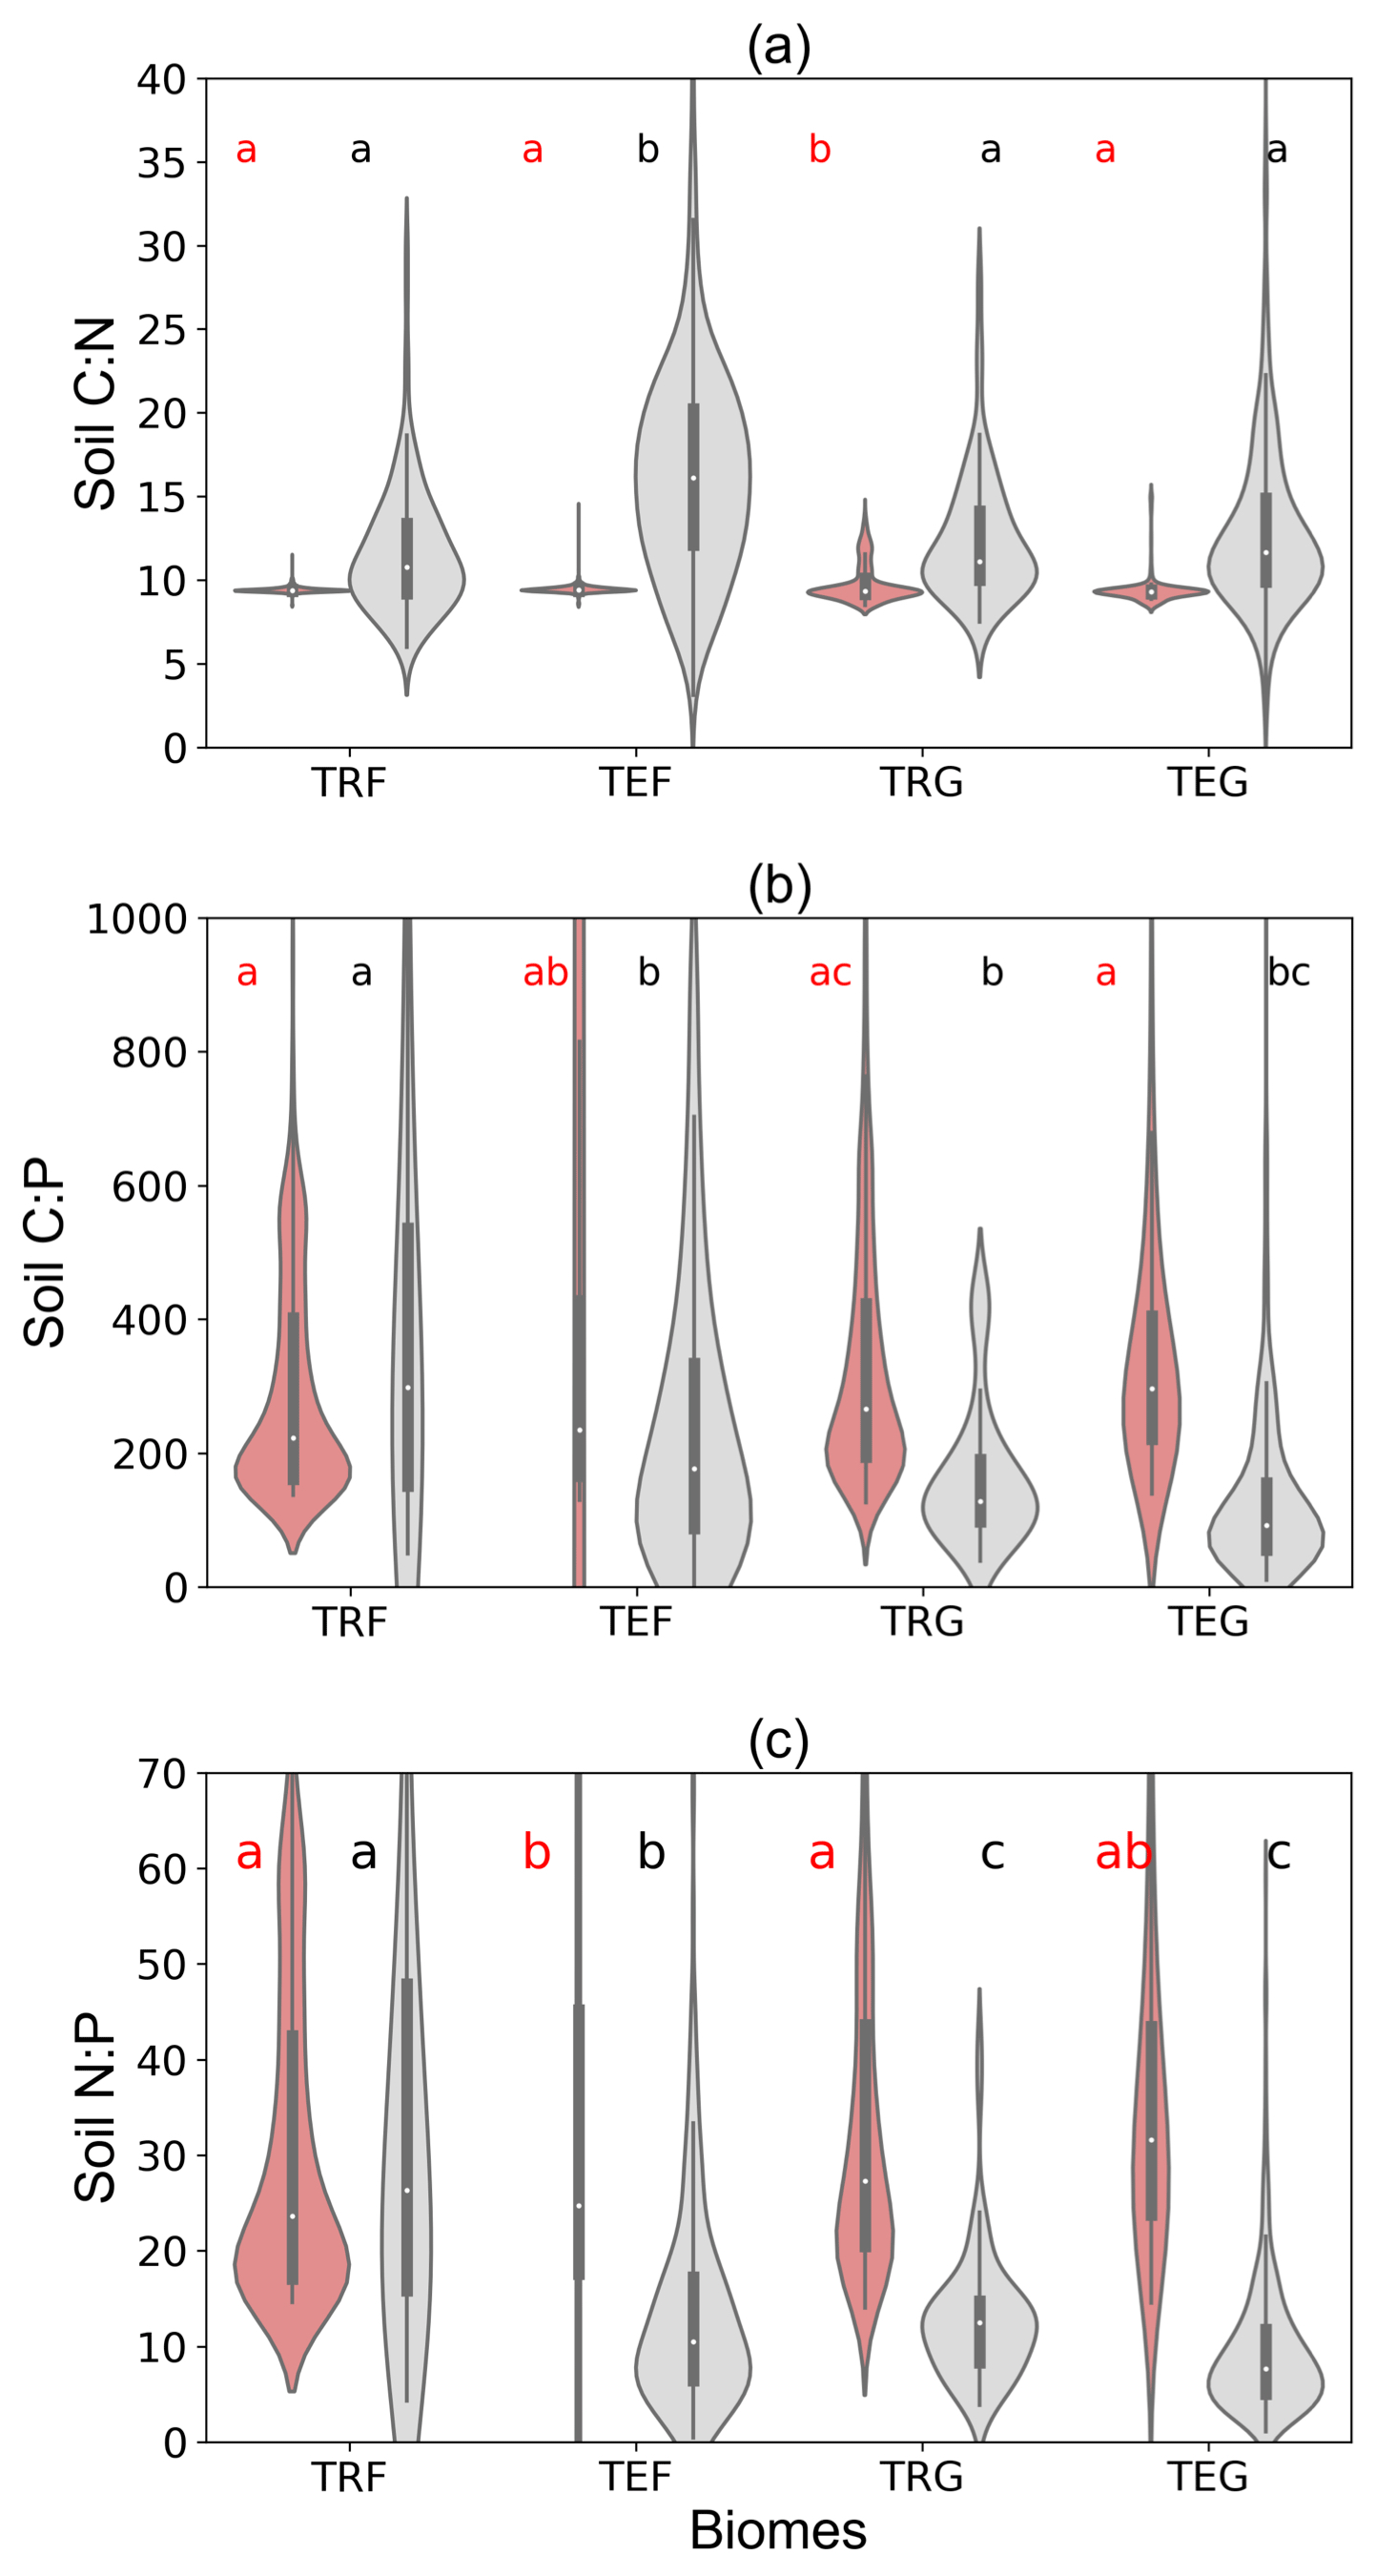
Figure 9C : N, C : P and N : P ratios of soil organic matter by ORCHIDEE-CNP and plot-level measurements by Tipping et al. (2016) for four biomes: tropical forest (TRF), temperate forest (TEF), tropical grass (TRG) and temperate grass (TEG). Soil C : N : P ratios for ORCHIDEE-CNP are calculated for the total soil pool and include soil passive, slow and active pools, while measurements by Tipping et al. (2016) are for soils of 0–60 cm depth. The letters “a”, “b” and “c” indicate the significance of differences among biomes from the analysis of variance (ANOVA).
4.6 Nutrient effects on carbon cycling
We analyze the performance of ORCHIDEE-CNP v1.2 and ORCHIDEE without nutrient cycles with respect to the spatiotemporal patterns of GPP, NPP and net biome productivity.
Global GPP and NPP simulated by ORCHIDEE-CNP averaged over the period 2001–2010 are 119 and 48 Pg C yr−1, respectively, which are both within ranges of the data-driven products listed in Table 1 (Sect. S1C in the Supplement; Table S2). GPP and NPP simulated by ORCHIDEE-CNP are lower than those simulated by ORCHIDEE (140 Pg C yr−1 for GPP and 60 Pg C yr−1 for NPP). The values from ORCHIDEE are on the high end of the range of estimates from the data-driven products in Table 1. ORCHIDEE-CNP simulated comparable GPP values for most parts of the globe (Fig. S6a) and comparable NPP values for most of the northern high latitudes (Fig. S6b), which lie within the range given by the data-driven products.
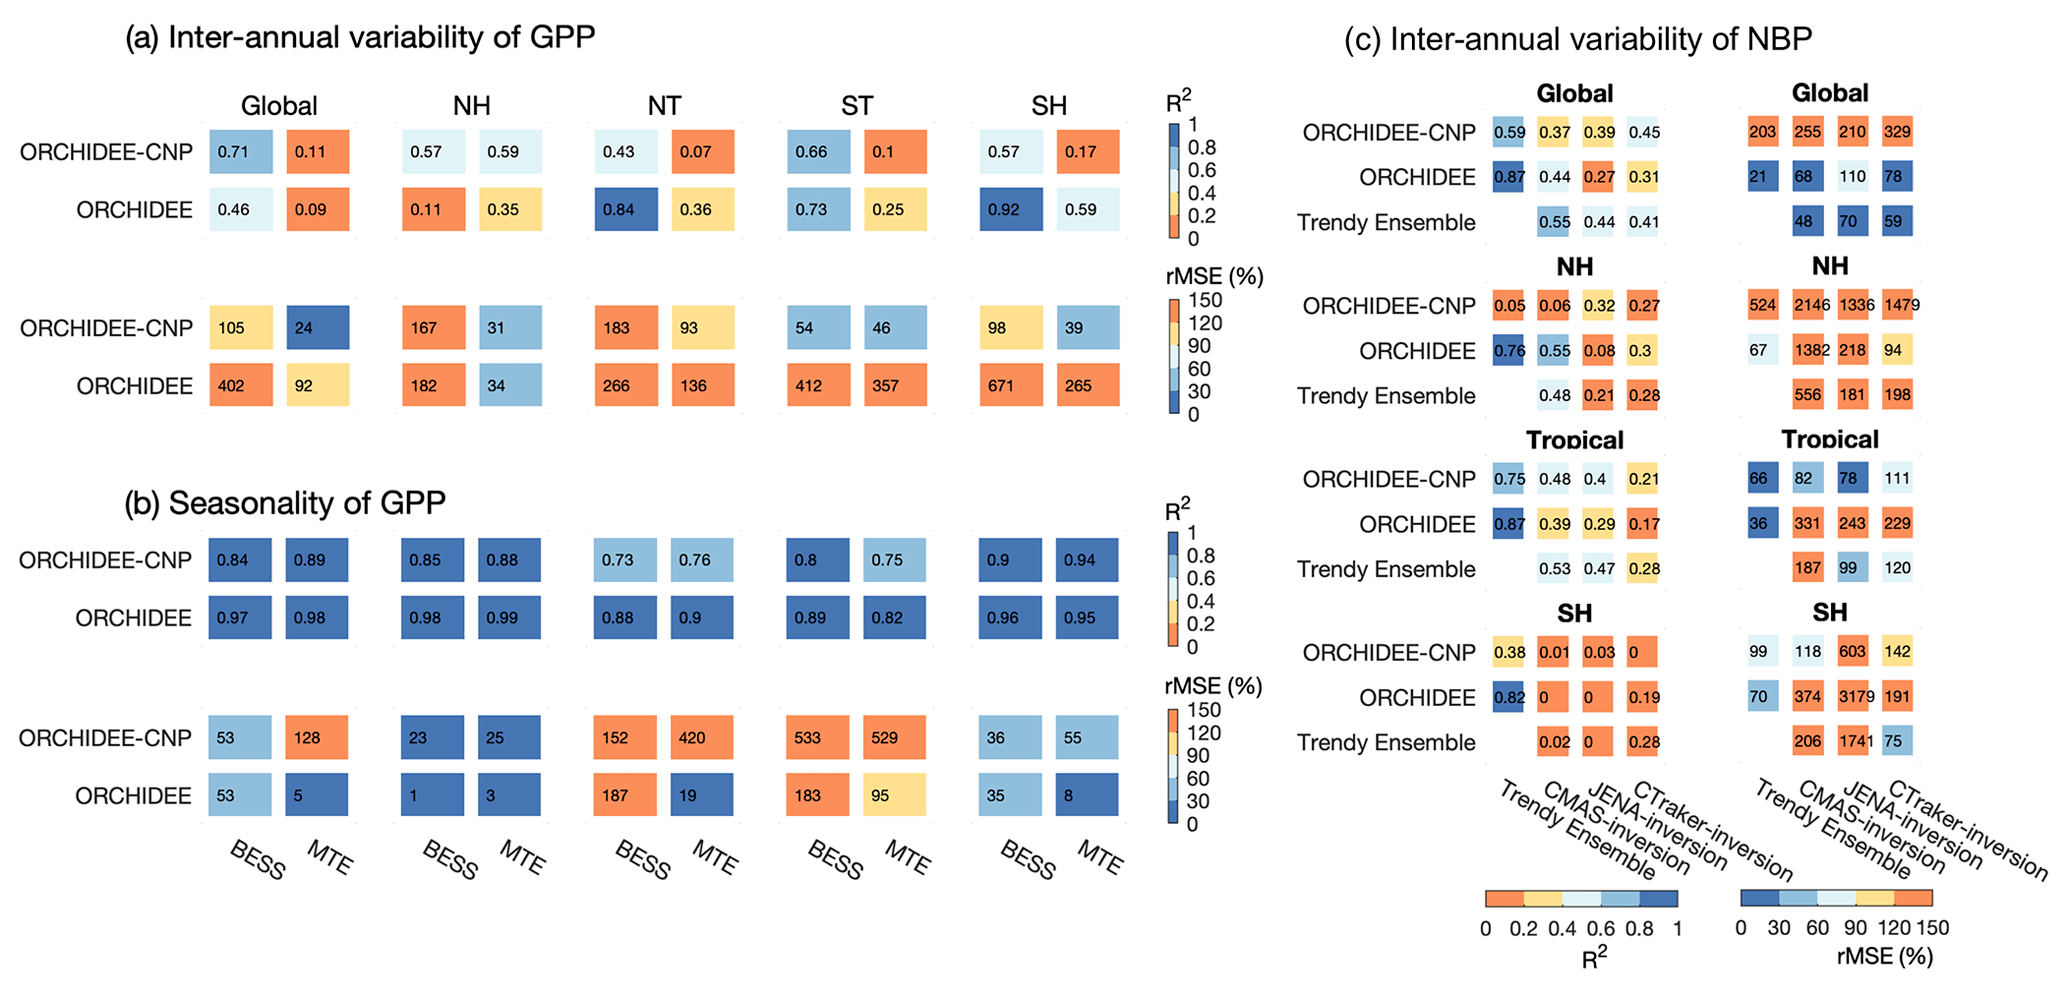
Figure 10The performances of ORCHIDEE and ORCHIDEE-CNP on the interannual variability of de-trended anomalies of GPP during 2001–2010 (a), the seasonal variability of mean GPP across 2001–2010 (b), and the interannual variability of net biome productivity (NBP) (c). Two statistics were used to represent the model performance: coefficient of determination (R2) and relative mean square deviation (rMSE). For (a) and (b), the evaluations are for the globe, the Northern Hemisphere (30–90∘ N; NH), the northern tropics (0–30∘ N; NT), the southern tropics (0–30∘ S; ST) and the Southern Hemisphere (30–90∘ S; SH). Two sets of observation-based GPP products (BESS GPP and MTE GPP) were used for the comparison. For (c), the evaluations are for the globe, the Northern Hemisphere (30–90∘ N, NH), the tropics (30∘ S–30∘ N) and the Southern Hemisphere (30–90∘ S; SH). The mean value across TRENDY ensemble models (v6) and three sets of NBP from inversion datasets were used as the reference database for the comparison with different available periods (TRENDY Ensemble: 1959–2016; CAMS: 1979–2016; JENA: 1985–2016; CTracker: 2001–2016).
Interannual and seasonal variations of GPP reflect the response of ecosystems to interannual or seasonal climatic variability, as well as the effects of natural (e.g., fires, wind throw, insect outbreaks and storms) and anthropogenic disturbances (e.g., land management and land cover change) (Anav et al., 2015). Regarding the interannual anomalies of de-trended GPP (GPPint) for the period 2001–2011, estimations on a global scale from ORCHIDEE-CNP show rather good correlation with the observation-driven model BESS GPP (R2=0.71) but not with MTE GPP (R2=0.11) (Fig. 10a). ORCHIDEE performs somewhat worse on a global scale than ORCHIDEE-CNP, primarily due to its low performance in the NH. We find that inclusion of nutrients in ORCHIDEE leads to a lower model prediction error on a global scale and for all latitudinal bands irrespective of the observation-based product (Fig. 10a).
Regarding the seasonal variation of GPP over the period 2001–2011, the predictions of ORCHIDEE-CNP are in good agreement with observation-based estimates and show no significant differences when compared to ORCHIDEE, except for tropical regions (Fig. 10b). Here, the model errors in seasonal variations of GPP are substantially larger for ORCHIDEE-CNP than for ORCHIDEE (Fig. 10b).
Net biome productivity (NBP) is defined as the net C exchange between the atmosphere and the terrestrial biosphere, which is the sum of net primary productivity, heterotrophic respiration and emissions due to disturbances; positive values denote a land carbon sink. Compared to the three sets of atmospheric inversions (CAMS, JENA and CTracker), ORCHIDEE(-CNP) performs slightly worse than the mean of predictions from 16 land surface models from TRENDY ensembles (v6) (Fig. 10c). ORCHIDEE-CNP shows a worse performance in interannual variability of NBP than ORCHIDEE when compared against inversion datasets at global scale and for the Northern Hemisphere. However, ORCHIDEE-CNP improved the performance of the interannual variability of NBP against inversion datasets relative to ORCHIDEE for tropical regions (higher R2 and lower rMSE), with closer or even better fitness against inversion datasets than the mean value of TRENDY ensemble models (Fig. 10c).
We performed a detailed evaluation of ORCHIDEE-CNP in terms of four nutrient-related ecosystem properties that control ecosystem gas exchanges and carbon storage: vegetation resource use efficiencies, CO2 fertilization effect, ecosystem N and P turnover and openness, and large-scale pattern of ecosystem stoichiometries.
We find that the inclusion of nutrients tends to lead to improvements in simulated resource use efficiency of plant resources (light, carbon, water) on a biome scale (Sect. 5.1). In line with changes in resource use efficiency, the sensitivity of GPP to variations in climate is improved, leading to improved interannual variation in GPP, in particular for the Northern Hemisphere (Sect. 5.5). In addition, the response of GPP to an increasing atmospheric CO2 concentration is improved (Sect. 5.2). However, model biases in C fluxes remained or increased, for example, in the NBP of the Northern Hemisphere. The analysis of nutrient use efficiencies (Sect. 5.1), stoichiometry (Sect. 5.4), and ecosystem openness and turnover of nutrients (Sect. 5.3) reveals biases in boreal regions that might be related to issues with soil organic matter accumulation that is too strong and the dependency of photosynthesis on leaf nutrients in needleleaf PFTs. On a seasonal scale, we found a general deterioration of the simulated seasonal cycle of GPP due to the inclusion of nutrient cycles (Sect. 5.5).
In the following, we discuss in more detail the model performance with respect to nutrient cycles and their effects on simulated C fluxes, and we propose ways to address model biases.
5.1 Inclusion of nutrient cycling improves use efficiencies of other plant resources
Resource use efficiency (RUE) is an ecological concept that measures the proportion of supplied resources that support plant productivity; i.e., it relates realized to potential productivity (Hadapp et al., 2019). It is therefore a critical ecosystem property that relates resource availability to ecosystem productivity, as well as being affected by resource availability.
With the inclusion of the additional plant resources nitrogen and phosphorus, changes in the simulated vegetation use efficiencies of resources like water (WUE), light (LUE) and carbon (CUE) are expected. Indeed, the annual use efficiencies on the biome scale differ between ORCHIDEE-CNP and ORCHIDEE. In comparison to observation-based estimates, the inclusion of nutrient cycles tends to improve simulated LUE and CUE and WUE (Fig. 3).
Both ORCHIDEE-CNP and ORCHIDEE generally underestimate annual LUE for forest biomes (Fig. 3a), which is due to a high bias in fAPAR in both models (28 %–380 % for ORCHIDEE and 80 %–173 % for ORCHIDEE-CNP) (Fig. S4a, b). Although the bias in LUE for TRF is higher, the bias in GPP is largely reduced, whereas the bias in fAPAR is similar in ORCHIDEE-CNP compared to ORCHIDEE (Fig. S4a, b), indicating general issues in ORCHIDEE with respect to how light is transferred within the canopy in tropical forest. Both versions assume a constant canopy light extinction coefficient of 0.5, omitting variations among biomes due their distinctive canopy architectures (Ito et al., 2004). Improving this part of the model requires a canopy light transfer scheme that better accounts for canopy structure (Naudts et al., 2015) and the inclusion of different light components including diffuse incoming, scattered and direct light (Zhang et al., 2020).
ORCHIDEE-CNP simulated a lower WUE than ORCHIDEE with the exception of coniferous biomes (Fig. 3b). The improvement of WUE in TRF is related to improvements in GPP and ET, while the overestimation of WUE in coniferous-dominated biomes by ORCHIDEE-CNP is related to an overestimation of GPP (Fig. S4c). The latter is likely a result of the application of a relationship between photosynthetic capacity and the leaf nutrient concentration, which is based on measurements from broadleaf species for all PFTs. Kattge et al. (2009) showed that coniferous PFTs have a ∼ 40 % lower carboxylation capacity for a given leaf nitrogen concentration than other PFTs. The omission of this could explain the bias in coniferous GPP in ORCHIDEE-CNP. Uncertainties in evaluation datasets hamper a more detailed evaluation of the variations of WUE among biome types.
We found that the inclusion of nutrient cycles improved the spatial variability in simulated CUE, but general biases remain (Fig. 3c), and uncertainties in observation-based estimates are large. Improvements are mainly found in temperate biomes (TEDF, TECF and TEG), indicating that the allocation of GPP to respiration and biomass growth, which is controlled by nutrient availability, works reasonably well. ORCHIDEE-CNP underestimates CUE for tropical biomes (TRF and TRG) more strongly than ORCHIDEE, despite substantially reduced biases in NPP and GPP (Fig. S4d). However, we should be cautious in drawing conclusions considering the large uncertainty in MODIS CUE (He et al., 2018).
NUE and PUE on the biome scale compare well to estimates (Fig. 4), indicating that ORCHIDEE-CNP is able to simulate the coupling strength between C, N and P cycles. However, ORCHIDEE-CNP underestimates PUE in tropical forests. A sensitivity analysis by GOLUM-CNP indicated that NUE and PUE were most sensitive to the NPP allocation fractions (especially to woody biomass) and foliar stoichiometry (Wang et al., 2018). Therefore, we attribute the biases in PUE to the biases in foliar stoichiometry (Fig. 8) and to issues in plant internal P allocation in ORCHIDEE-CNP (Fig. S1).
5.2 Inclusion of nutrient cycling improves CO2 fertilization effect
The effect of CO2 fertilization on terrestrial ecosystem productivity is thought to be the dominant driver behind the current land carbon sink. The strength of the fertilization effect on GPP differs strongly between LSMs (Friedlingstein et al., 2014). We used proxies of the historical increase in GPP for an indirect model evaluation of the CO2 fertilization effect from COS and deuterium measurements of herbarium samples (Ehlers et al., 2015; Campbell et al., 2017), and we found that ORCHIDEE-CNP has smaller and more realistic than the same model without nutrients (Fig. 5), in particular for C3 plants and in boreal regions (Fig. S5). Both ORCHIDEE-CNP and ORCHIDEE simulated an for C4 grass of ∼ 1, as the carboxylation of C4 plants is weakly influenced by elevated CO2 (Osmond et al., 1982; Pearcy and Ehleringer, 1984; Bowes, 1993). This indicates that the inclusion of N and P constraints on GPP leads to a more realistic CO2 fertilization effect in ORCHIDEE-CNP.
5.3 Ecosystem nutrient turnover and openness indicates model biases in boreal phosphorus availability
The capacity of ecosystems to sequester and store additional carbon depends on their ability to supply nutrients for the buildup of organic matter. Enhanced internal nutrient recycling and the accumulation of nutrients over time in ecosystems are theoretically possible mechanisms through which nutrients can be supplied. Therefore, it is important for simulating changes in land carbon storage on decadal timescales and longer that models capture the dependency of ecosystem production to external nutrient sources (i.e., openness of N and P cycles) (Cleveland et al., 2013) and the residence time of nutrients within ecosystems. Besides being related to each other, openness and residence times are also related to the inflows and outflows of nutrients (Eqs. 9 and 10) as well as the turnover time of nutrients in specific ecosystem compartments.
We find that ORCHIDEE-CNP simulates the openness of nutrient cycles, including differences among biomes that are close to estimates from the model–data fusion framework GOLUM-CNP (Fig. 6; Sect. 4.4). There are differences in the openness of N (ON) in tropical natural biomes and the openness of P (OP) in central Africa, which are related to lower but more realistic tropical BNF in ORCHIDEE-CNP (Sect. S4) and a difference in the prescribed P deposition compared to GOLUM-CNP. Simulated nutrient losses due to aquatic transport are generally in good agreement with independent estimates (Sect. S5).
Residence times of N and P (τN and τP) in ORCHIDEE-CNP compare generally well to estimates from GOLUM-CNP: ORCHIDEE-CNP simulates shorter τN and τP in tropical and temperate biomes compared to boreal ones, in line with GOLUM-CNP (Fig. 7). This indicates that ORCHIDEE-CNP is able to reproduce large-scale patterns in the nutrient residence time of biomes, with one exception. In boreal regions, we find that ORCHIDEE-CNP simulates higher τP for BOCF due to the higher standing P stocks of biomass and soil organic matter than in GOLUM-CNP (Fig. S1). This indicates that ORCHIDEE-CNP is likely underestimating P availability in boreal regions. The underlying processes of biochemical P mineralization (Sect. S7) and sorption of P to soil particles (Sect. S6) are reasonably well captured in ORCHIDEE-CNP.
5.4 Model biases in stoichiometry indicate need for refinement of process representation
Leaf and soil stoichiometry are key indexes to characterize the relative ecosystem N and P limitation (e.g., Güsewell, 2004). Measurements show a decrease in foliar N : P ratios from low to high latitudes in natural ecosystems (McGroddy et al., 2004; Reich and Oleksyn, 2004; Kerkhoff et al., 2005). This is seen as evidence for tropical vegetation being generally more P- than N-limited, in contrast to extratropical vegetation (Reich and Oleksyn, 2004). The observed trend of foliar N : P ratios was not reproduced by ORCHIDEE-CNP (Fig. 8), which simulated a flat foliar N : P latitudinal profile. In contrast to the majority of global models, wherein leaf N : P ratios are either prescribed (Goll et al., 2012) or vary within a PFT-specific range (Wang et al., 2010), we conservatively assumed a globally uniform range to let the model freely calculate leaf N : P stoichiometry. It is not trivial to pin down the failure of the model to capture the latitudinal trend in leaf N : P ratios, which could be due to (1) omitted variability in leaf P resorption efficiencies, which varies among biomes between 46 % and 66.6 % (Reed et al., 2012) but was set to 65 % in ORCHIDEE-CNP, (2) the simplistic parameterization of nutrient investment into different plant tissues, (3) and the omission of the diversity of nutrient acquisition pathways (e.g., mycorrhizal association) and rooting strategies (Warren et al., 2015). Testing new formulations for plant growth based on optimality principles (Kvakić et al., 2020) and the refinement of nutrient acquisition pathways (Sulman et al., 2017) are ways forward to improve the model.
Regarding soil stoichiometry, measurements show that tropical biomes have lower soil C : N and higher soil C : P and soil N : P than temperate biomes (Tipping et al., 2016), echoing the pattern of leaf stoichiometry. ORCHIDEE-CNP fails to capture these patterns (Fig. 9). Modeled soil N : P and C : P for tropical forests are comparable to measurements but are too low in temperate forest, tropical forest and temperate grass, which is most likely related to a nutrient immobilization that is too strong in accumulating soil organic matter (Figs. S1); this tends to push systems into P limitation rather than N limitation as ON is larger than OP (Fig. 6). In general, the spread in soil P concentration is well represented by ORCHIDEE-CNP. The rudimentary representation of organic matter decomposition and the lack of nutrient effects on decomposer carbon use efficiency (see Zhang et al., 2018, for possible improvements; Sect. 5.5) are likely contributing to the biases. New developments, including explicit representation of decomposer communities and soil organic matter stabilization (Zhang et al., 2020), will be included in the next model version.
5.5 Nutrient effects on carbon cycling
In the following we discuss the implications for the simulated carbon fluxes of changes in plant resource use efficiencies and the sensitivity of plant productivity to increasing CO2 due to the inclusion of nutrient cycles. We link biases in the simulated carbon fluxes to biases in nutrient cycling, which allows us to prioritize follow-up model development.
5.5.1 Inclusion of nutrient cycling improves the interannual variability of GPP
To what extent nutrient effects on vegetation affect the sensitivity of ecosystem CO2 fluxes to climatic variation is unclear (Goll et al., 2018). For instance, drought can reduce nutrient use by decreasing GPP, but it also slows down decomposition, which supplies nutrients for plant uptake. Further, N : P stoichiometry is also strongly modified by drought and warming towards increased N : P in whole plant biomass (Yuan and Chen, 2015). Here we found that the inclusion of N and P cycles in ORCHIDEE affects the interannual variability of GPP for all vegetation types. In ORCHIDEE-CNP, the interannual variation (IAV) of GPP is better correlated with that of observation-based datasets than in ORCHIDEE globally and for the NH, but less correlated for other regions (Fig. 10a). Observation-based GPP estimates are uncertain, as some of them ignore soil-moisture-induced reductions of GPP during drought (Stocker et al., 2019), as well as soil thaw and snow-related effects (Jiang and Ryu, 2016). Thus, at the moment, it is difficult to falsify one model version over another and to constrain nutrient effects on the variation of GPP based on current observation-based GPP.
In order to further explore the underlying reasons for the general improvement in the IAV of GPP due to the inclusion of nutrient cycles, we analyzed the sensitivity of GPP anomalies to anomalies of temperature (ST), precipitation (SP) and shortwave radiation (SR), all with mean annual values (Sect. S1I). We found that SP by ORCHIDEE-CNP compares well with BESS GPP and MTE GPP, while it is overestimated in ORCHIDEE (Figs. S7 and S8). Thus, the difference in SP is likely the major reason for the differences in IAV in NH between model versions, as ST and SR show only minor differences there. This provides confidence that the improvement in IAV of GPP in the NH is due to an improved sensitivity towards a climatic driver (i.e., SP). For tropical regions, ORCHIDEE-CNP simulates more realistic SP but higher biases in SR than in ORCHIDEE, while observation-based estimates of ST disagree on the sign and model versions show only minor differences (Fig. S7). Therefore, the deterioration of the IAV of tropical GPP by the inclusion of nutrient cycles is likely caused by enhanced biases in SR due to a lowering of LUE of GPP (Sects. 4.2 and 5.1).
5.5.2 Inclusion of nutrient cycling deteriorates phenology and seasonality of GPP
The performance in reproducing seasonal variations of GPP was deteriorated by the inclusion of N and P nutrient cycles in ORCHIDEE (Fig. 10b). We found that biases in GPP are related to biases in the seasonality of the LAI introduced in ORCHIDEE-CNP (Figs. S9a and S10a). For the NH, the delayed increase in LAI in ORCHIDEE-CNP could be partly caused by nutrient shortage during the first half of the growing season, as indicated by the increasing leaf nutrient concentration throughout the growing season (Fig. S11). Several factors could lead to a supply of nutrients that is too low at the beginning of the growing season: an insufficient internal plant nutrient reserve due to resorption of nutrients that is too low prior to leaf shedding or an underestimation of nutrient uptake during the dormant season, an insufficient investment into root growth to acquire nutrients, and an overestimation of soil nutrient losses during the dormant season leaving the soil nutrient depleted at the beginning of the growing season. Many of the related processes (e.g., root phenology, mineralization, nutrient resorption, growth allocation) are only rudimentarily represented. For tropical regions, ORCHIDEE-CNP simulates a quasi-flat seasonal cycle of GPP, in contrast to a peak of GPP during the wet season in MTE GPP and BESS GPP, which is correctly captured by ORCHIDEE (Fig. S9b, c). The reduction of seasonal GPP in ORCHIDEE-CNP compared to ORCHIDEE is more pronounced in the dry season (∼ 100 g C m−2) than in the wet season (Fig. S9b, c), concurrent with a larger reduction of LAI in the dry season (Fig. S10b, c). Tropical phenology is currently only rudimentarily represented in ORCHIDEE(-CNP) (Chen et al., 2020), causing a suboptimal allocation of nutrients to leaves that could cause the biases in the seasonal cycle of GPP and LAI. Model–data assimilation of phenology (Williams et al., 2009; MacBean et al., 2018; Bacour et al., 2019) and efforts to better characterize processes related to plant resource investment into different tissues and symbioses (Prentice et al., 2015; Warren et al., 2015; Jiang et al., 2019) as well as leaf age effects during the year for evergreen forests (Chen et al., 2020) should help to reduce tropical phenology biases in future versions of ORCHIDEE-CNP.
5.5.3 Inclusion of nutrient cycling leads to an underestimation of the land carbon sink
Current LSMs unanimously conclude that CO2 fertilization is the main driver of the land carbon sink and its trend (Friedlingstein et al., 2014), but it remains unclear to what extent other drivers (i.e., climate change, land management, nutrient deposition) contribute to the sink as well. Also, it remains unclear how commonly omitted dynamics (climate and management induced effects on tree mortality, nutrients) lead to overestimation of the contribution of CO2 fertilization in models (Ellsworth et al., 2017; Fleischer et al., 2019). ORCHIDEE-CNP simulates a land carbon sink over the past decades that is lower than other dynamic global vegetation models (DGVMs) and atmospheric inversions (Fig. S12), despite the fact that the response of GPP to CO2 in ORCHIDEE-CNP is in line with proxy data (Fig. 5; Sect. 5.2). In particular, the NH carbon sink, which has persistently increased over the last 50 years (Ciais et al., 2019), is strongly underestimated. The few Free Air Carbon Enrichment (FACE) studies that have experimentally applied elevated CO2 levels in mature stands found no increase in biomass production (Bader et al., 2013; Klein et al., 2016; Körner et al., 2005; Sigurdsson et al., 2013; Ellsworth et al., 2017); thus, an increase in GPP does not necessarily translate into an increase in biomass production, whereas in most DGVMs wherein mortality is constant and growth follows GPP, biomass production is inevitably coupled to GPP. Based on upscaling of data from FACE experiments, Terrer et al. (2019) suggested that the effect of elevated CO2 on biomass may be severely overestimated (on average by a factor of 3.6) in LSMs that ignore nutrients. It would be tempting to conclude from this study that ORCHIDEE-CNP is “right” in its underestimation of the carbon sink, whereas other models are “wrong” because they miss processes such as forest regrowth (Pugh et al., 2019) from, e.g., decreased harvesting pressure (Ciais et al., 2008) and thus have a realistic NH land sink for the wrong reasons. We also showed that ORCHIDEE-CNP underestimates peak GPP (Fig. S12b) and overestimates P limitations in the NH (Sect. 5.1, 5.3 and 5.4); thus, another explanation is that the NH sink in this study is too low because of P limitations that are too strong in this region. These two hypotheses explaining why we underestimate the NH sink (missing forest regrowth vs. overly strong nutrient limitations in the NH) are examined below.
The overly small NH carbon sink in ORCHIDEE-CNP may be explained by an immobilization of nutrients that is too strong in accumulating nutrient-rich organic matter, which leads to a reduction of plant-available nutrients, the so-called “progressive nutrient limitation” proposed by Luo et al. (2004), and subsequently to reduced biomass production. The amount of accumulated N and P immobilized into SOM in the NH during 1850–2016 reaches up to 75.3 g N m−2 and 2.4 g P m−2, respectively, which is twice as much as the accumulated respective nutrient inputs to ecosystems in this region during the same period (37.8 g N m−2 and 1.6 g P m−2; Figs. S13 and S14). This suggests a strong progressive nutrient limitation in the model. The omission of nutrient controls on litter and SOM decomposition in the soil module of ORCHIDEE-CNP could have favored the immobilization of nutrients in accumulating SOM (Zhang et al., 2018). Microbe incubation and N fertilization experiments showed that a low availability of nutrients can hamper the buildup of SOM as more carbon gets respired by decomposers due to elevated energetic requirements of processing low-quality substrate (Recous et al., 1995; Janssens et al., 2010; Allison et al., 2009) and overall lower microbial activity (Wang et al., 2011; Knorr et al., 2005). Uncertainties with respect to the capability of ecosystems to up-regulate P mineralization when P becomes scarce could have contributed to the decline in plant-available nutrients with increasing SOM stocks. The inclusion of nutrient effects on decomposition and microbial dynamics in ORCHIDEE-CNP is ongoing (Zhang et al., 2018, 2020), but the lack of quantification of the ability of ecosystems to enhance P recycling hampers model developments.
The overly small NH carbon sink in ORCHIDEE-CNP may also be explained by the lack of representation of effects of forest age and management on biomass turnover and biomass production efficiency (i.e., CUE). Pugh et al. (2019) found that old-growth forests in the NH have a much smaller C sink than regrowing forests (< 0.1 Pg C yr−1 compared to 0.86 Pg C yr−1) for the period 2001–2010. Forest management effects on biomass production efficiency and biomass turnover are only rudimentarily represented in ORCHIDEE(-CNP). ORCHIDEE-CNP prescribes constant tree mortality rates (i.e., the fraction of total carbon in wood lost to litter), whereas in reality tree mortality rates change with management and climate conditions (Peng et al., 2011). Moreover, ORCHIDEE(-CNP) omits the effect of forest age on C uptake. Compared to data-driven estimates for C storage (Sect. S1G and S1H), ORCHIDEE-CNP simulates a higher global aboveground forest biomass (387 Pg C; 283 Pg C for GlobBiomass, Santoro, 2018; 221 Pg C for GEOCARBON, Operational Global Carbon Observing System, Avitabile et al., 2016; Fig. S2) but lower global soil organic carbon (801 Pg C; 4387 Pg C for Soilgrids, Hengl et al., 2017; 1680 Pg C for GSDE – Global Soil Dataset for use in Earth system models, Shangguan et al., 2014; Fig. S3).
In this study, we evaluated the performance of ORCHIDEE-CNP and found that the model has sufficient skills in capturing observed patterns in (1) vegetation resource use efficiencies, (2) CO2 vegetation fertilization, (3) ecosystem N and P openness and turnover, and (4) leaf and soil stoichiometry. The inclusion of nutrients improves the simulation of the sensitivity of plant productivity to increasing CO2 and to interannual variation in precipitation. However, the nutrient-enabled version cannot capture the current land carbon sink in the NH. This suggests that either the land carbon sink might be less a consequence of the CO2 fertilization effect than of other processes that are currently not well resolved in global models (e.g., biomass turnover, land management) or that ORCHIDEE-CNP underestimates the ability of ecosystems to circumvent nutrient constraints on biomass built up under elevated CO2. We propose the following focus to improve ORCHIDEE in the next model versions: (1) refine the canopy light absorption processes; (2) use model–data assimilation frameworks (like ORCHIDAS) to better calibrate root phenology, mineralization, nutrient resorption and growth allocation; (3) better represent soil processes related to decomposition, stabilization of soil organic matter (e.g., Zhang et al., 2018, 2020) and inorganic P transformation (e.g., Helfenstein et al., 2020); and (4) refine the dynamics of biomass turnover and biomass production efficiency, including effects of forest management and climate. Continued improvements of nutrient cycle representations will further reduce uncertainties in predicting the land carbon sink under climate change and rising atmospheric CO2.
The source code is freely available online via the following address: http://forge.ipsl.jussieu.fr/orchidee/wiki/GroupActivities/CodeAvalaibilityPublication/ORCHIDEE-CN-P_v1.2_r5986 (last access: 8 May 2020, Goll, 2020). Please contact the corresponding author if you plan an application of the model and envisage longer-term scientific collaboration.
Primary data and scripts used in the analysis and other supplementary information that may be useful in reproducing the authors' work can be obtained at https://doi.org/10.17632/f54v9zcgbf.1 (Sun et al., 2020).
The supplement related to this article is available online at: https://doi.org/10.5194/gmd-14-1987-2021-supplement.
YS and DSG carried out the simulation of ORCHIDEE-CNP. YS, JC, JH, VN, YW and HY analyzed the model outputs. YS, DSG, and PC prepared the paper with contributions from all coauthors.
The authors declare that they have no conflict of interest.
Yan Sun, Daniel S. Goll, Philippe Ciais, Haicheng Zhang and Yuanyuan Huang are funded by the IMBALANCE-P project of the European Research Council (ERC-2013-SyG610028). Julian Helfenstein is supported by the Swiss National Science Foundation (project number 200021_162422).
This research has been supported by the IMBALANCE-P project of the European Research Council (grant no. ERC-2013-SyG610028).
This paper was edited by Chiel van Heerwaarden and reviewed by two anonymous referees.
Allison, S. D., LeBauer, D. S., Ofrecio, M. R., Reyes, R., Ta, A.-M., and Tran, T. M.: Low levels of nitrogen addition stimulate decomposition by boreal forest fungi, Soil Biol. Biochem., 41, 293–302, https://doi.org/10.1016/j.soilbio.2008.10.032, 2009.
Anav, A., Friedlingstein, P., Beer, C., Ciais, P., Harper, A., Jones, C., Murray-Tortarolo, G., Papale, D., Parazoo, N. C., Peylin, P., Piao, S., Sitch, S., Viovy, N., Wiltshire, A., and Zhao, M.: Spatiotemporal patterns of terrestrial gross primary production: A review, Rev. Geophys., 53, 785–818, https://doi.org/10.1002/2015RG000483, 2015.
Avitabile, V., Herold, M., Heuvelink, G. B. M., Lewis, S. L., Phillips, O. L., Asner, G. P., Armston, J., Ashton, P. S., Banin, L., Bayol, N., Berry, N. J., Boeckx, P., de Jong, B. H. J., DeVries, B., Girardin, C. A. J., Kearsley, E., Lindsell, J. A., Lopez-Gonzalez, G., Lucas, R., Malhi, Y., Morel, A., Mitchard, E. T. A., Nagy, L., Qie, L., Quinones, M. J., Ryan, C. M., Ferry, S. J. W., Sunderland, T., Laurin, G. V., Gatti, R. C., Valentini, R., Verbeeck, H., Wijaya, A., and Willcock, S.: An integrated pan-tropical biomass map using multiple reference datasets, Glob Change Biol, 22, 1406–1420, https://doi.org/10.1111/gcb.13139, 2016.
Bacour, C., Maignan, F., Peylin, P., MacBean, N., Bastrikov, V., Joiner, J., Köhler, P., Guanter, L., and Frankenberg, C.: Differences Between OCO-2 and GOME-2 SIF Products From a Model-Data Fusion Perspective, J. Geophys. Res.-Biogeosci., 124, 3143–3157, https://doi.org/10.1029/2018JG004938, 2019.
Bader, M. K. F., Leuzinger, S., Keel, S. G., Siegwolf, R. T., Hagedorn, F., Schleppi, P., and Körner, C.: Central European hardwood trees in a high-CO2 future: synthesis of an 8-year forest canopy CO2 enrichment project, J. Ecol., 101, 1509–1519, https://doi.org/10.1111/1365-2745.12149, 2013.
Bontemps, S., Defourny, P., Radoux, J., Van Bogaert, E., Lamarche, C., Achard, F., Mayaux, P., Boettcher, M., Brockmann, C., and Kirches, G.: Consistent global land cover maps for climate modelling communities: current achievements of the ESA's land cover CCI, Proceedings of the ESA Living Planet Symposium, Edimburgh, 2013, 9–13, 2013.
Bowes, G.: Facing the inevitable: plants and increasing atmospheric CO2, Annu. Rev. Plant. Biol., 44, 309–332, https://doi.org/10.1146/annurev.arplant.44.1.309, 1993.
Brovkin, V. and Goll, D.: Land unlikely to become large carbon source, Nat. Geosci., 8, 893–893, https://doi.org/10.1038/ngeo2598, 2015.
Butler, E. E., Datta, A., Flores-Moreno, H., Chen, M., Wythers, K. R., Fazayeli, F., Banerjee, A., Atkin, O. K., Kattge, J., Amiaud, B., Blonder, B., Boenisch, G., Bond-Lamberty, B., Brown, K. A., Byun, C., Campetella, G., Cerabolini, B. E. L., Cornelissen, J. H. C., Craine, J. M., Craven, D., de Vries, F. T., Díaz, S., Domingues, T. F., Forey, E., González-Melo, A., Gross, N., Han, W., Hattingh, W. N., Hickler, T., Jansen, S., Kramer, K., Kraft, N. J. B., Kurokawa, H., Laughlin, D. C., Meir, P., Minden, V., Niinemets, Ü., Onoda, Y., Peñuelas, J., Read, Q., Sack, L., Schamp, B., Soudzilovskaia, N. A., Spasojevic, M. J., Sosinski, E., Thornton, P. E., Valladares, F., van Bodegom, P. M., Williams, M., Wirth, C., and Reich, P. B.: Mapping local and global variability in plant trait distributions, P. Natl. Acad. Sci. USA, 114, E10937–E10946, https://doi.org/10.1073/pnas.1708984114, 2017.
Campbell, J., Berry, J., Seibt, U., Smith, S. J., Montzka, S., Launois, T., Belviso, S., Bopp, L., and Laine, M.: Large historical growth in global terrestrial gross primary production, Nature, 544, 84–87, https://doi.org/10.1038/nature22030, 2017.
Carvalhais, N., Forkel, M., Khomik, M., Bellarby, J., Jung, M., Migliavacca, M., Mu, M., Saatchi, S., Santoro, S., Thurner, M., Weber, U., Ahrens, B., Beer, C., Cescatti, A., Randerson, J. T., and Reichstein, M.: Global covariation of carbon turnover times with climate in terrestrial ecosystems, Nature, 514, 213–217, https://doi.org/10.1038/nature13731, 2014.
Chen, X., Maignan, F., Viovy, N., Bastos, A., Goll, D., Wu, J., Liu, L., Yue, C., Peng, S., and Yuan, W.: Novel representation of leaf phenology improves simulation of Amazonian evergreen forest photosynthesis in a land surface model, J. Adv. Model Earth Syst., 12, e2018MS001565, https://doi.org/10.1029/2018MS001565, 2020.
Chevallier, F., Fisher, M., Peylin, P., Serrar, S., Bousquet, P., Bréon, F. M., Chédin, A., and Ciais, P.: Inferring CO2 sources and sinks from satellite observations: Method and application to TOVS data, J. Geophys. Res.-Atmos., 110, https://doi.org/10.1029/2005JD006390, 2005.
Ciais, P., Schelhaas, M.-J., Zaehle, S., Piao, S., Cescatti, A., Liski, J., Luyssaert, S., Le-Maire, G., Schulze, E.-D., Bouriaud, O., Freibauer, A., Valentini, R., and Nabuurs, G. J.: Carbon accumulation in European forests, Nature, 1, 425–429, https://doi.org/10.1038/ngeo233, 2008.
Ciais, P., Tan, J., Wang, X., Roedenbeck, C., Chevallier, F., Piao, S.-L., Moriarty, R., Broquet, G., Le Quéré, C., and Canadell, J., Peng, S., Poulter, B., Liu, Z., and Tans, P.: Five decades of northern land carbon uptake revealed by the interhemispheric CO2 gradient, Nature, 568, 221–225, https://doi.org/10.1038/s41586-019-1078-6, 2019.
Cleveland, C. C., Houlton, B. Z., Smith, W. K., Marklein, A. R., Reed, S. C., Parton, W., Del Grosso, S. J., and Running, S. W.: Patterns of new versus recycled primary production in the terrestrial biosphere, P. Natl. Acad. Sci. USA, 110, 12733–12737, https://doi.org/10.1073/pnas.1302768110, 2013.
Ehlers, I., Augusti, A., Betson, T. R., Nilsson, M. B., Marshall, J. D., and Schleucher, J.: Detecting long-term metabolic shifts using isotopomers: CO2-driven suppression of photorespiration in C3 plants over the 20th century, P. Natl. Acad. Sci. USA, 112, 15585–15590, https://doi.org/10.1073/pnas.1504493112, 2015.
Ellsworth, D. S., Anderson, I. C., Crous, K. Y., Cooke, J., Drake, J. E., Gherlenda, A. N., Gimeno, T. E., Macdonald, C. A., Medlyn, B. E., Powell, J. R., Tjoelker, M. G., and Reich, P. B.: Elevated CO2 does not increase eucalypt forest productivity on a low-phosphorus soil, Nat. Clim. Chang., 7, 279–282, https://doi.org/10.1038/nclimate3235, 2017.
Elser, J. J., Bracken, M. E., Cleland, E. E., Gruner, D. S., Harpole, W. S., Hillebrand, H., Ngai, J. T., Seabloom, E. W., Shurin, J. B., and Smith, J. E.: Global analysis of nitrogen and phosphorus limitation of primary producers in freshwater, marine and terrestrial ecosystems, Ecol. Lett., 10, 1135–1142, https://doi.org/10.1111/j.1461-0248.2007.01113.x, 2007.
FAO/IIASA/ISRIC/ISSCAS/JRC: Harmonized World Soil Database (version 1.2), available at: http://webarchive.iiasa.ac.at/Research/LUC/External-World-soil-database/HTML/ (last access: 13 May 2015), 2012.
Fernández-Martínez, M., Vicca, S., Janssens, I. A., Sardans, J., Luyssaert, S., Campioli, M., Chapin III, F. S., Ciais, P., Malhi, Y., Obersteiner, M., Papale, D., Piao, S. L., Reichstein, M., Rodà, F., and Peñuelas, J.: Nutrient availability as the key regulator of global forest carbon balance, Nat. Clim. Chang., 4, 471–476, https://doi.org/10.1038/nclimate2177, 2014.
Fleischer, K., Rammig, A., De Kauwe, M. G., Walker, A. P., Domingues, T. F., Fuchslueger, L., Garcia, S., Goll, D. S., Grandis, A., Jiang, M., Haverd, V., Hofhansl, F., Holm, J. A., Kruijt, B., Leung, F., Medlyn, B. E., Mercado, L. M., Norby, R. J., Pak, B., von Randow, C., Quesada, C. A., Schaap, K. J., Valverde-Barrantes, O. J., Wang, Y., Yang, X., Zaehle, S., Zhu, Q., and Lapola, D. M.: Amazon forest response to CO2 fertilization dependent on plant phosphorus acquisition, Nat. Geosci., 12, 736–741, https://doi.org/10.1038/s41561-019-0404-9, 2019.
Freschet, G. T., Cornelissen, J. H., Van Logtestijn, R. S., and Aerts, R.: Evidence of the “plant economics spectrum” in a subarctic flora, J. Ecol., 98, 362–373, https://doi.org/10.1111/j.1365-2745.2009.01615.x, 2010.
Friedlingstein, P., Meinshausen, M., Arora, V. K., Jones, C. D., Anav, A., Liddicoat, S. K., and Knutti, R.: Uncertainties in CMIP5 climate projections due to carbon cycle feedbacks, J. Clim., 27, 511–526, https://doi.org/10.1175/JCLI-D-12-00579.1, 2014.
Friedlingstein, P., Jones, M. W., O'Sullivan, M., Andrew, R. M., Hauck, J., Peters, G. P., Peters, W., Pongratz, J., Sitch, S., Le Quéré, C., Bakker, D. C. E., Canadell, J. G., Ciais, P., Jackson, R. B., Anthoni, P., Barbero, L., Bastos, A., Bastrikov, V., Becker, M., Bopp, L., Buitenhuis, E., Chandra, N., Chevallier, F., Chini, L. P., Currie, K. I., Feely, R. A., Gehlen, M., Gilfillan, D., Gkritzalis, T., Goll, D. S., Gruber, N., Gutekunst, S., Harris, I., Haverd, V., Houghton, R. A., Hurtt, G., Ilyina, T., Jain, A. K., Joetzjer, E., Kaplan, J. O., Kato, E., Klein Goldewijk, K., Korsbakken, J. I., Landschützer, P., Lauvset, S. K., Lefèvre, N., Lenton, A., Lienert, S., Lombardozzi, D., Marland, G., McGuire, P. C., Melton, J. R., Metzl, N., Munro, D. R., Nabel, J. E. M. S., Nakaoka, S.-I., Neill, C., Omar, A. M., Ono, T., Peregon, A., Pierrot, D., Poulter, B., Rehder, G., Resplandy, L., Robertson, E., Rödenbeck, C., Séférian, R., Schwinger, J., Smith, N., Tans, P. P., Tian, H., Tilbrook, B., Tubiello, F. N., van der Werf, G. R., Wiltshire, A. J., and Zaehle, S.: Global Carbon Budget 2019, Earth Syst. Sci. Data, 11, 1783–1838, https://doi.org/10.5194/essd-11-1783-2019, 2019.
Gärdenäs, A. I., Ågren, G. I., Bird, J. A., Clarholm, M., Hallin, S., Ineson, P., Kätterer, T., Knicker, H., Nilsson, S. I., Näsholm, T., Ogle, S., Paustian, K., Persson, T., and Stendahl, J.: Knowledge gaps in soil carbon and nitrogen interactions–from molecular to global scale, Soil Biol. Biochem., 43, 702–717, https://doi.org/10.1016/j.soilbio.2010.04.006, 2011.
Gill, A. L. and Finzi, A. C.: Belowground carbon flux links biogeochemical cycles and resource-use efficiency at the global scale, Ecol. Lett., 19, 1419–1428, https://doi.org/10.1111/ele.12690, 2016.
Global Soil Data Task Group: Global Gridded Surfaces of Selected Soil Characteristics (IGBP-DIS), Data set, Oak Ridge National Laboratory Distributed Active Archive Center, Oak Ridge, Tennessee, 2000.
Gobron, N., Pinty, B., Aussedat, O., Chen, J., Cohen, W. B., Fensholt, R., Gond, V., Huemmrich, K. F., Lavergne, T., Mélin, F., Privette, J. L., Sandholt, I., Taberner, M., Turner, D. P., Verstraete, M. M., and Widlowski, J.: Evaluation of fraction of absorbed photosynthetically active radiation products for different canopy radiation transfer regimes: Methodology and results using Joint Research Center products derived from SeaWiFS against ground-based estimations, J. Geophys. Res.-Atmos, 111, D13110, https://doi.org/10.1029/2005JD006511, 2006a.
Gobron, N., Pinty, B., Taberner, M., Mélin, F., Verstraete, M., and Widlowski, J.-L.: Monitoring the photosynthetic activity of vegetation from remote sensing data, Adv. Space Res., 38, 2196–2202, https://doi.org/10.1016/j.asr.2003.07.079, 2006b.
Goll, D. S.: ORCHIDEE-CN-P_v1.2_r5986, Software, Institut Pierre Simon Laplace (IPSL), https://doi.org/10.14768/20200407002.1, 2020.
Goll, D. S., Brovkin, V., Parida, B. R., Reick, C. H., Kattge, J., Reich, P. B., van Bodegom, P. M., and Niinemets, Ü.: Nutrient limitation reduces land carbon uptake in simulations with a model of combined carbon, nitrogen and phosphorus cycling, Biogeosciences, 9, 3547–3569, https://doi.org/10.5194/bg-9-3547-2012, 2012.
Goll, D. S., Moosdorf, N., Hartmann, J., and Brovkin, V.: Climate‐driven changes in chemical weathering and associated phosphorus release since 1850: Implications for the land carbon balance, Geophys. Res. Lett., 41, 3553–3558, https://doi.org/10.1002/2014GL059471, 2014.
Goll, D. S., Vuichard, N., Maignan, F., Jornet-Puig, A., Sardans, J., Violette, A., Peng, S., Sun, Y., Kvakic, M., Guimberteau, M., Guenet, B., Zaehle, S., Penuelas, J., Janssens, I., and Ciais, P.: A representation of the phosphorus cycle for ORCHIDEE (revision 4520), Geosci. Model Dev., 10, 3745–3770, https://doi.org/10.5194/gmd-10-3745-2017, 2017a.
Goll, D. S., Joetzjer, E., Huang, M., and Ciais, P.: Low phosphorus availability decreases susceptibility of tropical primary productivity to droughts, Geophys. Res. Lett., 45, 8231–8240, https://doi.org/10.1029/2018GL077736, 2018.
Güsewell, S.: N : P ratios in terrestrial plants: variation and functional significance, New Phytol., 164, 243–266, https://doi.org/10.1111/j.1469-8137.2004.01192.x, 2004.
Harris, I., Jones, P. D., Osborn, T. J., and Lister, D. H.: Updated high-resolution grids of monthly climatic observations–the CRU TS3. 10 Dataset, Int. J. Climatol., 34, 623–642, https://doi.org/10.1002/joc.3711, 2014.
Hartmann, J. and Moosdorf, N.: The new global lithological map database GLiM: A representation of rock properties at the Earth surface, Geochem. Geophys. Geosyst., 13, Q12004, https://doi.org/10.1029/2012GC004370, 2012.
Hartmann, J., Moosdorf, N., Lauerwald, R., Hinderer, M., and West, A. J.: Global chemical weathering and associated P-release—The role of lithology, temperature and soil properties, Chem. Geol., 363, 145–163, https://doi.org/10.1016/j.chemgeo.2013.10.025, 2014.
He, Y., Piao, S., Li, X., Chen, A., and Qin, D.: Global patterns of vegetation carbon use efficiency and their climate drivers deduced from MODIS satellite data and process-based models, Agric. For. Meteorol., 256, 150–158, https://doi.org/10.1016/j.agrformet.2018.03.009, 2018.
Helfenstein, J., Jegminat, J., McLaren, T. I., and Frossard, E.: Soil solution phosphorus turnover: derivation, interpretation, and insights from a global compilation of isotope exchange kinetic studies, Biogeosciences, 15, 105–114, https://doi.org/10.5194/bg-15-105-2018, 2018.
Helfenstein, J., Pistocchi, C., Oberson, A., Tamburini, F., Goll, D. S., and Frossard, E.: Estimates of mean residence times of phosphorus in commonly considered inorganic soil phosphorus pools, Biogeosciences, 17, 441–454, https://doi.org/10.5194/bg-17-441-2020, 2020.
Hengl, T., de Jesus, J. M., MacMillan, R. A., Batjes, N. H., Heuvelink, G. B., Ribeiro, E., Samuel-Rosa, A., Kempen, B., Leenaars, J. G., Walsh, M. G. and Gonzalez, M. R.: SoilGrids1km – global soil information based on automated mapping, PLoS One, 9, e114788, https://doi.org/10.1371/journal.pone.0105992, 2014.
Hodapp, D., Hillebrand, H., and Striebel, M.: “Unifying” the concept of resource use efficiency in ecology, Front. Ecol. Evol., 6, 233, https://doi.org/10.3389/fevo.2018.00233, 2019.
Hungate, B. A., Dukes, J. S., Shaw, M. R., Luo, Y., and Field, C. B.: Nitrogen and climate change, Science, 302, 1512–1513, https://doi.org/10.1126/science.1091390, 2003.
Hurtt, G. C., Chini, L. P., Frolking, S., Betts, R. A., Feddema, J., Fischer, G., Fisk, J. P., Hibbard, K., Houghton, R. A., Janetos, A., Jones, C. D., Kindermann, G., Kinoshita, T., Klein Gold- ewijk, K., Riahi, K., Shevliakova, E., Smith, S., Stehfest, E., Thomson, A., Thornton, P., van Vuuren, D. P., and Wang, Y. P.: Harmonization of land-use scenarios for the period 1500–2100: 600 years of global gridded annual land-use transitions, wood harvest, and resulting secondary lands, Clim. Change, 109, 117–161, https://doi.org/10.1007/s10584-011-0153-2, 2011.
Ito, A. and Oikawa, T.: Global mapping of terrestrial primary productivity and light-use efficiency with a process-based model, Global Environmental Change in the Ocean and on Land, 343–358, 2004.
Janssens, I. A. and Vicca, S.: Soil carbon breakdown, Nat. Geosci., 3, 823–824, https://doi.org/10.1038/ngeo1024, 2010.
Jiang, C. and Ryu, Y.: Multi-scale evaluation of global gross primary productivity and evapotranspiration products derived from Breathing Earth System Simulator (BESS), Remote Sens. Environ., 186, 528–547, https://doi.org/10.1016/j.rse.2016.08.030, 2016.
Jiang, M., Caldararu, S., Zaehle, S., Ellsworth, D. S., and Medlyn, B. E.: Towards a more physiological representation of vegetation phosphorus processes in land surface models, New Phytol., 222, 1223–1229, https://doi.org/10.1111/nph.15688, 2019.
Jung, M., Reichstein, M., and Bondeau, A.: Towards global empirical upscaling of FLUXNET eddy covariance observations: validation of a model tree ensemble approach using a biosphere model, Biogeosciences, 6, 2001–2013, https://doi.org/10.5194/bg-6-2001-2009, 2009.
Jung, M., Reichstein, M., Margolis, H. A., Cescatti, A., Richardson, A. D., Arain, M. A., Arneth, A., Bernhofer, C., Bonal, D., Chen, J., Damiano, G., Gobron, N., Kiely, G., Kutsch, W., Lasslop, G., Law, B. E., Lindroth, A., Merbold, L., Montagnani, L., Moors, E. J., Papale, D., Sottocornola, M., Vaccari, F., and Williams, C.: Global patterns of land-atmosphere fluxes of carbon dioxide, latent heat, and sensible heat derived from eddy covariance, satellite, and meteorological observations, J. Geophys. Res.-Biogeo., 116, G00J07, https://doi.org/10.1029/2010JG001566, 2011.
Kattge, J., Knorr, W., Raddatz, T., and Wirth, C.: Quantifying photosynthetic capacity and its relationship to leaf nitrogen content for global-scale terrestrial biosphere models, Glob. Change Biol., 15, 976–991, https://doi.org/10.1111/j.1365-2486.2008.01744.x, 2009.
Kerkhoff, A. J., Enquist, B. J., Elser, J. J., and Fagan, W. F.: Plant allometry, stoichiometry and the temperature-dependence of primary productivity, Glob. Ecol. Biogeogr., 14, 585–598, https://doi.org/10.1111/j.1466-822x.2005.00187.x, 2005.
Klein Goldewijk, K., Beusen, A., Doelman, J., and Stehfest, E.: Anthropogenic land use estimates for the Holocene – HYDE 3.2, Earth Syst. Sci. Data, 9, 927–953, https://doi.org/10.5194/essd-9-927-2017, 2017a.
Klein Goldewijk, K., Dekker, S. C., and van Zanden, J. L.: Per-capita estimations of long-term historical land use and the consequences for global change research, J. Land Use Sci., 12, 313–337, https://doi.org/10.1080/1747423X.2017.1354938, 2017b.
Klein, T., Siegwolf, R. T., and Körner, C.: Belowground carbon trade among tall trees in a temperate forest, Science, 352, 342–344, https://doi.org/10.1126/science.aad6188, 2016.
Knorr, M., Frey, S., and Curtis, P.: Nitrogen additions and litter decomposition: A meta-analysis, Ecology, 86, 3252–3257, https://doi.org/10.1890/05-0150, 2005.
Kobayashi, S., Ota, Y., Harada, Y., Ebita, A., Moriya, M., Onoda, H., Onogi, K., Kamahori, H., Kobayashi, C., Endo, H., Miyaoka, K., and Takahashi, K.: The JRA-55 Reanalysis: General Specifi- cations and Basic Characteristics, J. Meteorol. Soc. Jpn, Ser. II, 93, 5–48, https://doi.org/10.2151/jmsj.2015-001, 2015.
Körner, C., Asshoff, R., Bignucolo, O., Hättenschwiler, S., Keel, S. G., Peláez-Riedl, S., Pepin, S., Siegwolf, R. T., and Zotz, G.: Carbon flux and growth in mature deciduous forest trees exposed to elevated CO2, Science, 309, 1360–1362, https://doi.org/10.1126/science.1113977, 2005.
Krinner, G., Viovy, N., de Noblet-Ducoudré, N., Ogée, J., Polcher, J., Friedlingstein, P., Ciais, P., Sitch, S., and Prentice, I. C.: A dynamic global vegetation model for studies of the coupled atmosphere-biosphere system, Glob. Biogeochem. Cy., 19, GB1015, https://doi.org/10.1029/2003GB002199, 2005.
Kvakić, M., Tzagkarakis, G., Pellerin, S., Ciais, P., Goll, D., Mollier, A., and Ringeval, B.: Carbon and phosphorus allocation in annual plants: an optimal functioning approach, Front. Plant Sci., 11, 149 pp., https://doi.org/10.3389/fpls.2020.00149, 2020.
Le Quéré, C., Andrew, R. M., Friedlingstein, P., Sitch, S., Hauck, J., Pongratz, J., Pickers, P. A., Korsbakken, J. I., Peters, G. P., Canadell, J. G., Arneth, A., Arora, V. K., Barbero, L., Bastos, A., Bopp, L., Chevallier, F., Chini, L. P., Ciais, P., Doney, S. C., Gkritzalis, T., Goll, D. S., Harris, I., Haverd, V., Hoffman, F. M., Hoppema, M., Houghton, R. A., Hurtt, G., Ilyina, T., Jain, A. K., Johannessen, T., Jones, C. D., Kato, E., Keeling, R. F., Goldewijk, K. K., Landschützer, P., Lefèvre, N., Lienert, S., Liu, Z., Lombardozzi, D., Metzl, N., Munro, D. R., Nabel, J. E. M. S., Nakaoka, S., Neill, C., Olsen, A., Ono, T., Patra, P., Peregon, A., Peters, W., Peylin, P., Pfeil, B., Pierrot, D., Poulter, B., Rehder, G., Resplandy, L., Robertson, E., Rocher, M., Rödenbeck, C., Schuster, U., Schwinger, J., Séférian, R., Skjelvan, I., Steinhoff, T., Sutton, A., Tans, P. P., Tian, H., Tilbrook, B., Tubiello, F. N., van der Laan-Luijkx, I. T., van der Werf, G. R., Viovy, N., Walker, A. P., Wiltshire, A. J., Wright, R., Zaehle, S., and Zheng, B.: Global Carbon Budget 2018, Earth Syst. Sci. Data, 10, 2141–2194, https://doi.org/10.5194/essd-10-2141-2018, 2018.
Liu, Y., Piao, S., Gasser, T., Ciais, P., Yang, H., Wang, H., Keenan, T. F., Huang, M., Wan, S., and Song, J.: Field-experiment constraints on the enhancement of the terrestrial carbon sink by CO2 fertilization, Nat. Geosci., 12, 809–814, https://doi.org/10.1038/s41561-019-0436-1, 2019.
Lu, C. and Tian, H.: Global nitrogen and phosphorus fertilizer use for agriculture production in the past half century: shifted hot spots and nutrient imbalance, Earth Syst. Sci. Data, 9, 181–192, https://doi.org/10.5194/essd-9-181-2017, 2017.
Lun, F., Liu, J., Ciais, P., Nesme, T., Chang, J., Wang, R., Goll, D., Sardans, J., Peñuelas, J., and Obersteiner, M.: Global and regional phosphorus budgets in agricultural systems and their implications for phosphorus-use efficiency, Earth Syst. Sci. Data, 10, 1–18, https://doi.org/10.5194/essd-10-1-2018, 2018.
Luo, Y. Q., Su, B., Currie, W. S., Dukes, J. E., Finzi, A., Hartwig, U., Hungate, B., Mc Murtrie, R. E., Oren, R., Parton, W. J., Pataki, D. E., Rebecca Shaw, M., Zak, D. R., and Field, C. B.: Progressive nitrogen limitation of ecosystem responses to rising atmospheric carbon dioxide, BioScience, 54, 731–739, https://doi.org/10.1641/0006-3568(2004)054[0731:PNLOER]2.0.CO;2, 2004.
MacBean, N., Maignan, F., Bacour, C., Lewis, P., Peylin, P., Guanter, L., Köhler, P., Gómez-Dans, J., and Disney, M.: Strong constraint on modelled global carbon uptake using solar-induced chlorophyll fluorescence data, Sci. Rep., 8, 1973, https://doi.org/10.1038/s41598-018-20024-w, 2018.
Malyshev, A. V. and Henry, H. A.: N uptake and growth responses to sub-lethal freezing in the grass Poa pratensis L, Plant Soil, 360, 175–185, https://doi.org/10.1007/s11104-012-1233-4, 2012.
Mayorga, E., Seitzinger, S. P., Harrison, J. A., Dumont, E., Beusen, A. H., Bouwman, A., Fekete, B. M., Kroeze, C., and Van Drecht, G.: Global nutrient export from WaterSheds 2 (NEWS 2): model development and implementation, Environ. Modell. Softw., 25, 837–853, https://doi.org/10.1016/j.envsoft.2010.01.007, 2010.
McGroddy, M. E., Daufresne, T., and Hedin, L. O.: Scaling of C : N : P stoichiometry in forests worldwide: Implications of terrestrial redfield-type ratios, Ecology, 85, 2390–2401, https://doi.org/10.1890/03-0351, 2004.
Melillo, J. M., Butler, S., Johnson, J., Mohan, J., Steudler, P., Lux, H., Burrows, E., Bowles, F., Smith, R., Scott, L., Vario, C., Hill, T., Burton, A., Zhou, Y., and Tang, J.: Soil warming, carbon–nitrogen interactions, and forest carbon budgets, P. Natl. Acad. Sci. USA, 108, 9508–9512, https://doi.org/10.1073/pnas.1018189108, 2011.
Naudts, K., Ryder, J., McGrath, M. J., Otto, J., Chen, Y., Valade, A., Bellasen, V., Berhongaray, G., Bönisch, G., Campioli, M., Ghattas, J., De Groote, T., Haverd, V., Kattge, J., MacBean, N., Maignan, F., Merilä, P., Penuelas, J., Peylin, P., Pinty, B., Pretzsch, H., Schulze, E. D., Solyga, D., Vuichard, N., Yan, Y., and Luyssaert, S.: A vertically discretised canopy description for ORCHIDEE (SVN r2290) and the modifications to the energy, water and carbon fluxes, Geosci. Model Dev., 8, 2035–2065, https://doi.org/10.5194/gmd-8-2035-2015, 2015.
Norby, R. J., Warren, J. M., Iversen, C. M., Medlyn, B. E., and McMurtrie, R. E.: CO2 enhancement of forest productivity constrained by limited nitrogen availability, P. Natl. Acad. Sci. USA, 107, 19368–19373, https://doi.org/10.1073/pnas.1006463107, 2010.
Osmond, C., Winter, K., and Ziegler, H.: Functional significance of different pathways of CO2 fixation in photosynthesis, in: Physiological plant ecology II, Springer, 479–547, 1982.
Pearcy, R. W. and Ehleringer, J.: Comparative ecophysiology of C3 and C4 plants, Plant Cell Environ., 7, 1–13, https://doi.org/10.1111/j.1365-3040.1984.tb01194.x, 1984.
Peng, C., Ma, Z., Lei, X., Zhu, Q., Chen, H., Wang, W., Liu, S., Li, W., Fang, X., and Zhou, X.: A drought-induced pervasive increase in tree mortality across Canada's boreal forests, Nat. Clim. Chang., 1, 467–471, https://doi.org/10.1038/NCLIMATE1293, 2011.
Peng, J., Wang, Y. P., Houlton, B. Z., Dan, L., Pak, B., and Tang, X.: Global carbon sequestration is highly sensitive to model-based formulations of nitrogen fixation, Glob. Biogeochem. Cy., 34, e2019GB006296, https://doi.org/10.1029/2019GB006296, 2019.
Peng, S., Ciais, P., Maignan, F., Li, W., Chang, J., Wang, T., and Yue, C.: Sensitivity of land use change emission estimates to historical land use and land cover mapping, Glob. Biogeochem. Cycle, 31, 626–643, https://doi.org/10.1002/2015GB005360, 2017.
Penuelas, J., Poulter, B., Sardans, J., Ciais, P., Van Der Velde, M., Bopp, L., Boucher, O., Godderis, Y., Hinsinger, P., Llusia, J., Nardin, E., Vicca, S., Obersteiner, M., and Janssens, I. A.: Human-induced nitrogen–phosphorus imbalances alter natural and managed ecosystems across the globe, Nat. Commun., 4, 1–10, https://doi.org/10.1038/ncomms3934, 2013.
Piao, S., Luyssaert, S., Ciais, P., Janssens, I. A., Chen, A., Cao, C., Fang, J., Friedlingstein, P., Luo, Y., and Wang, S.: Forest annual carbon cost: A global-scale analysis of autotrophic respiration, Ecology, 91, 652–661, https://doi.org/10.1890/08-2176.1, 2010.
Poulter, B., Ciais, P., Hodson, E., Lischke, H., Maignan, F., Plummer, S., and Zimmermann, N. E.: Plant functional type mapping for earth system models, Geosci. Model Dev., 4, 993–1010, https://doi.org/10.5194/gmd-4-993-2011, 2011.
Poulter, B., MacBean, N., Hartley, A., Khlystova, I., Arino, O., Betts, R., Bontemps, S., Boettcher, M., Brockmann, C., Defourny, P., Hagemann, S., Herold, M., Kirches, G., Lamarche, C., Lederer, D., Ottlé, C., Peters, M., and Peylin, P.: Plant functional type classification for earth system models: results from the European Space Agency's Land Cover Climate Change Initiative, Geosci. Model Dev., 8, 2315–2328, https://doi.org/10.5194/gmd-8-2315-2015, 2015.
Prentice, I. C., Liang, X., Medlyn, B. E., and Wang, Y.-P.: Reliable, robust and realistic: the three R's of next-generation land-surface modelling, Atmos. Chem. Phys., 15, 5987–6005, https://doi.org/10.5194/acp-15-5987-2015, 2015.
Pugh, T. A., Lindeskog, M., Smith, B., Poulter, B., Arneth, A., Haverd, V., and Calle, L.: Role of forest regrowth in global carbon sink dynamics, P. Natl. Acad. Sci. USA, 116, 4382–4387, https://doi.org/10.1073/pnas.1810512116, 2019.
Recous, S., Robin, D., Darwis, D., and Mary, B.: Soil inorganic N availability: effect on maize residue decomposition, Soil Biol. Biochem., 27, 1529–1538, https://doi.org/10.1016/0038-0717(95)00096-W, 1995.
Reed, S. C., Townsend, A. R., Davidson, E. A., and Cleveland, C. C.: Stoichiometric patterns in foliar nutrient resorption across multiple scales, New Phytol., 196, 173–180, https://doi.org/10.1111/j.1469-8137.2012.04249.x, 2012.
Reich, P. B. and Oleksyn, J.: Global patterns of plant leaf N and P in relation to temperature and latitude, P. Natl. Acad. Sci. USA, 101, 11001–11006, https://doi.org/10.1073/pnas.0403588101, 2004.
Rödenbeck, C., Houweling, S., Gloor, M., and Heimann, M.: CO2 flux history 1982–2001 inferred from atmospheric data using a global inversion of atmospheric transport, Atmos. Chem. Phys., 3, 1919–1964, https://doi.org/10.5194/acp-3-1919-2003, 2003.
Running, S. W., Nemani, R. R., Heinsch, F. A., Zhao, M., Reeves, M., and Hashimoto, H.: A continuous satellite-derived measure of global terrestrial primary production, BioScience, 54, 547–560, https://doi.org/10.1641/0006-3568(2004)054[0547:ACSMOG]2.0.CO;2, 2004.
Ryu, Y., Verfaillie, J., Macfarlane, C., Kobayashi, H., Sonnentag, O., Vargas, R., Ma, S., and Baldocchi, D. D.: Continuous observation of tree leaf area index at ecosystem scale using upward-pointing digital cameras, Remote Sens. Environ., 126, 116–125, https://doi.org/10.1016/j.rse.2012.08.027, 2012.
Santoro, M.: GlobBiomass – global datasets of forest biomass, PANGAEA, https://doi.org/10.1594/PANGAEA.894711, 2018.
Shane, M. W., McCully, M. E., Canny, M. J., Pate, J. S., Ngo, H., Mathesius, U., Cawthray, G. R., and Lambers, H.: Summer dormancy and winter growth: root survival strategy in a perennial monocotyledon, New Phytol., 183, 1085–1096, https://doi.org/10.1111/j.1469-8137.2009.02875.x, 2009.
Sigurdsson, B. D., Medhurst, J. L., Wallin, G., Eggertsson, O., and Linder, S.: Growth of mature boreal Norway spruce was not affected by elevated [CO2] and/or air temperature unless nutrient availability was improved, Tree Physiol., 33, 1192–1205, https://doi.org/10.1093/treephys/tpt043, 2013.
Shangguan, W., Dai, Y., Duan, Q., Liu, B., Yuan, H.: A global soil data set for earth system modeling, J. Adv. Model Earth Syst., 6.1, 249–263, https://doi.org/10.1002/2013MS000293, 2014.
Sitch, S., Friedlingstein, P., Gruber, N., Jones, S. D., Murray-Tortarolo, G., Ahlström, A., Doney, S. C., Graven, H., Heinze, C., Huntingford, C., Levis, S., Levy, P. E., Lomas, M., Poulter, B., Viovy, N., Zaehle, S., Zeng, N., Arneth, A., Bonan, G., Bopp, L., Canadell, J. G., Chevallier, F., Ciais, P., Ellis, R., Gloor, M., Peylin, P., Piao, S. L., Le Quéré, C., Smith, B., Zhu, Z., and Myneni, R.: Recent trends and drivers of regional sources and sinks of carbon dioxide, Biogeosciences, 12, 653–679, https://doi.org/10.5194/bg-12-653-2015, 2015.
Smith, W. K., Reed, S. C., Cleveland, C. C., Ballantyne, A. P., Anderegg, W. R., Wieder, W. R., Liu, Y. Y., and Running, S. W.: Large divergence of satellite and Earth system model estimates of global terrestrial CO2 fertilization, Nat. Clim. Chang., 6, 306–310, https://doi.org/10.1038/NCLIMATE2879, 2016.
Soussana, J.-F. and Lemaire, G.: Coupling carbon and nitrogen cycles for environmentally sustainable intensification of grasslands and crop-livestock systems, Agric. Ecosyst. Environ., 190, 9–17, https://doi.org/10.1016/j.agee.2013.10.012, 2014.
Stocker, B. D., Zscheischler, J., Keenan, T. F., Prentice, I. C., Seneviratne, S. I., and Peñuelas, J.: Drought impacts on terrestrial primary production underestimated by satellite monitoring, Nat. Geosci., 12, 264–270, https://doi.org/10.1038/s41561-019-0318-6, 2019.
Sullivan, B. W., Smith, W. K., Townsend, A. R., Nasto, M. K., Reed, S. C., Chazdon, R. L., and Cleveland, C. C.: Spatially robust estimates of biological nitrogen (N) fixation imply substantial human alteration of the tropical N cycle, P. Natl. Acad. Sci. USA, 111, 8101–8106, https://doi.org/10.1073/pnas.1320646111, 2014.
Sulman, B. N., Brzostek, E. R., Medici, C., Shevliakova, E., Menge, D. N., and Phillips, R. P.: Feedbacks between plant N demand and rhizosphere priming depend on type of mycorrhizal association, Ecol. Lett., 20, 1043–1053, https://doi.org/10.1111/ele.12802, 2017.
Sun, Y.: Global evaluation of the nutrient enabled version of land surface model ORCHIDEE-CNP (v1.2), Mendeley Data, https://doi.org/10.17632/f54v9zcgbf.1, 2020.
Sun, Y., Peng, S., Goll, D. S., Ciais, P., Guenet, B., Guimberteau, M., Hinsinger, P., Janssens, I. A., Peñuelas, J., Piao, S., Poulter, B., Violette, A., Yang, X., Yin, Y., and Zeng, H.: Diagnosing phosphorus limitations in natural terrestrial ecosystems in carbon cycle models, Earths Future, 5, 730–749, https://doi.org/10.1002/2016EF000472, 2017.
Sun, Y., Goll, D. S., Ciais, P., Peng, S., Margalef, O., Asensio, D., Sardans, J., and Peñuelas, J.: Spatial pattern and environmental drivers of acid phosphatase activity in Europe, Front. Big Data, 2, 51, https://doi.org/10.3389/fdata.2019.00051, 2020.
Terrer, C., Jackson, R. B., Prentice, I. C., Keenan, T. F., Kaiser, C., Vicca, S., Fisher, J. B., Reich, P. B., Stocker, B. D., Hungate, B. A., Peñuelas, J., McCallum, I., Soudzilovskaia, N. A., Cernusak, L. A., Talhelm, A. F., van Sundert, K., Piao, S., Newton, P. C. D., Hovenden, M. J., Blumenthal, D. M., Liu, Y. Y., Müller, C., Winter, K., Field, C. B., Viechtbauer, W., van Lissa, C. J., Hoosbeek, M. R., Watanabe, M., Koike, T., Leshyk, V. O., Polley, H. W., and Franklin, O.: Nitrogen and phosphorus constrain the CO2 fertilization of global plant biomass, Nat. Clim. Chang., 9, 684–689, https://doi.org/10.1038/s41558-019-0545-2, 2019.
Thornton, P. E., Lamarque, J. F., Rosenbloom, N. A., and Mahowald, N. M.: Influence of carbon-nitrogen cycle coupling on land model response to CO2 fertilization and climate variability, Glob. Biogeochem. Cy., 21, GB4018, https://doi.org/10.1029/2006GB002868, 2007.
Thum, T., Caldararu, S., Engel, J., Kern, M., Pallandt, M., Schnur, R., Yu, L., and Zaehle, S.: A new model of the coupled carbon, nitrogen, and phosphorus cycles in the terrestrial biosphere (QUINCY v1.0; revision 1996), Geosci. Model Dev., 12, 4781–4802, https://doi.org/10.5194/gmd-12-4781-2019, 2019.
Tipping, E., Somerville, C. J., and Luster, J.: The C : N : P : S stoichiometry of soil organic matter, Biogeochemistry, 130, 117–131, https://doi.org/10.1007/s10533-016-0247-z, 2016.
Tum, M., Zeidler, J., Günther, K. P., and Esch, T.: Global NPP and straw bioenergy trends for 2000–2014, Biomass Bioenerg., 90, 230–236, https://doi.org/10.1016/j.biombioe.2016.03.040, 2016.
Turner, D. P., Ritts, W. D., Cohen, W. B., Gower, S. T., Running, S. W., Zhao, M., Costa, M. H., Kirschbaum, A. A., Ham, J. M., Saleska, S. R., and Ahl, D.: Evaluation of MODIS NPP and GPP products across multiple biomes, Remote Sens. Environ., 102, 282–292, https://doi.org/10.1016/j.rse.2006.02.017, 2006.
van der Laan-Luijkx, I. T., van der Velde, I. R., van der Veen, E., Tsuruta, A., Stanislawska, K., Babenhauserheide, A., Zhang, H. F., Liu, Y., He, W., Chen, H., Masarie, K. A., Krol, M. C., and Peters, W.: The CarbonTracker Data Assimilation Shell (CTDAS) v1.0: implementation and global carbon balance 2001–2015, Geosci. Model Dev., 10, 2785–2800, https://doi.org/10.5194/gmd-10-2785-2017, 2017.
Vergutz, L., Manzoni, S., Porporato, A., Novais, R. F., and Jackson, R. B.: Global resorption efficiencies and concentrations of carbon and nutrients in leaves of terrestrial plants, Ecol. Monogr., 82, 205–220, https://doi.org/10.1890/11-0416.1, 2012.
Wang, C., Han, G., Jia, Y., Feng, X., Guo, P., and Tian, X.: Response of litter decomposition and related soil enzyme activities to different forms of nitrogen fertilization in a subtropical forest, Ecol. Res., 26, 505–513, https://doi.org/10.1007/s11284-011-0805-8, 2011.
Wang, R., Goll, D., Balkanski, Y., Hauglustaine, D., Boucher, O., Ciais, P., Janssens, I., Penuelas, J., Guenet, B., Sardans, J., Bopp, L., Vuichard, N., Zhou, F., Li, B., Piao, S., Peng, S., Huang, Y., and Tao, S.: Global forest carbon uptake due to nitrogen and phosphorus deposition from 1850 to 2100, Glob. Change Biol., 23, 4854–4872, https://doi.org/10.1111/gcb.13766, 2017.
Wang, Y. P., Law, R. M., and Pak, B.: A global model of carbon, nitrogen and phosphorus cycles for the terrestrial biosphere, Biogeosciences, 7, 2261–2282, https://doi.org/10.5194/bg-7-2261-2010, 2010.
Wang, Y., Ciais, P., Goll, D., Huang, Y., Luo, Y., Wang, Y.-P., Bloom, A. A., Broquet, G., Hartmann, J., Peng, S., Penuelas, J., Piao, S., Sardans, J., Stocker, B. D., Wang, R., Zaehle, S., and Zechmeister-Boltenstern, S.: GOLUM-CNP v1.0: a data-driven modeling of carbon, nitrogen and phosphorus cycles in major terrestrial biomes, Geosci. Model Dev., 11, 3903–3928, https://doi.org/10.5194/gmd-11-3903-2018, 2018.
Wang, Y. P. and Houlton, B. Z.: Nitrogen constraints on terrestrial carbon uptake: Implications for the global carbon‐climate feedback, Geophys. Res. Lett., 36, L24403, https://doi.org/10.1029/2009GL041009, 2009.
Warren, J. M., Hanson, P. J., Iversen, C. M., Kumar, J., Walker, A. P., and Wullschleger, S. D.: Root structural and functional dynamics in terrestrial biosphere models–evaluation and recommendations, New Phytol., 205, 59–78, https://doi.org/10.1111/nph.13034, 2015.
Wieder, W. R., Cleveland, C. C., Smith, W. K., and Todd-Brown, K.: Future productivity and carbon storage limited by terrestrial nutrient availability, Nat. Geosci., 8, 441–444, https://doi.org/10.1038/NGEO2413, 2015.
Williams, M., Richardson, A. D., Reichstein, M., Stoy, P. C., Peylin, P., Verbeeck, H., Carvalhais, N., Jung, M., Hollinger, D. Y., Kattge, J., Leuning, R., Luo, Y., Tomelleri, E., Trudinger, C. M., and Wang, Y.-P.: Improving land surface models with FLUXNET data, Biogeosciences, 6, 1341–1359, https://doi.org/10.5194/bg-6-1341-2009, 2009.
Wißkirchen, K., Tum, M., Günther, K. P., Niklaus, M., Eisfelder, C., and Knorr, W.: Quantifying the carbon uptake by vegetation for Europe on a 1 km2 resolution using a remote sensing driven vegetation model, Geosci. Model Dev., 6, 1623–1640, https://doi.org/10.5194/gmd-6-1623-2013, 2013.
Wright, S. J.: Plant responses to nutrient addition experiments conducted in tropical forests, Ecol. Monogr., 89, e01382, https://doi.org/10.1002/ecm.1382, 2019.
Xu, X., Jain, A. K., and Calvin, K. V.: Quantifying the biophysical and socioeconomic drivers of changes in forest and agricultural land in South and Southeast Asia, Glob. Change Biol., 25, 2137–2151, https://doi.org/10.1111/gcb.14611, 2019.
Yang, X., Thornton, P. E., Ricciuto, D. M., and Post, W. M.: The role of phosphorus dynamics in tropical forests – a modeling study using CLM-CNP, Biogeosciences, 11, 1667–1681, https://doi.org/10.5194/bg-11-1667-2014, 2014.
Yuan, Z. and Chen, H. Y.: Decoupling of nitrogen and phosphorus in terrestrial plants associated with global changes, Nat. Clim. Chang., 5, 465–469, https://doi.org/10.1038/NCLIMATE2549, 2015.
Zaehle, S. and Friend, A.: Carbon and nitrogen cycle dynamics in the O-CN land surface model: 1. Model description, site-scale evaluation, and sensitivity to parameter estimates, Glob. Biogeochem. Cy., 24, GB1005, https://doi.org/10.1029/2009GB003521, 2010.
Zaehle, S., Jones, C. D., Houlton, B., Lamarque, J.-F., and Robertson, E.: Nitrogen availability reduces CMIP5 projections of twenty-first-century land carbon uptake, J. Clim., 28, 2494–2511, https://doi.org/10.1175/JCLI-D-13-00776.1, 2015.
Zaehle, S., Medlyn, B. E., De Kauwe, M. G., Walker, A. P., Dietze, M. C., Hickler, T., Luo, Y., Wang, Y.-P., El-Masri, B., Thornton, P., Jain, A., Wang, S., Warlind, D., Weng, E., Parton, W., Iversen, C. M., Gallet-Budynek, A., McCarthy, H., Finzi, A., Hanson, P. J., Prentice, I. C., Oren, R., and Norby, R. J.: Evaluation of terrestrial carbon–nitrogen cycle models against observations from two temperate Free-Air CO2 Enrichment studies, New Phytol., 202, 803–822, https://doi.org/10.1111/nph.12697, 2014.
Zhang, B., Tian, H., Lu, C., Dangal, S. R. S., Yang, J., and Pan, S.: Global manure nitrogen production and application in cropland during 1860–2014: a 5 arcmin gridded global dataset for Earth system modeling, Earth Syst. Sci. Data, 9, 667–678, https://doi.org/10.5194/essd-9-667-2017, 2017.
Zhang, H., Goll, D. S., Manzoni, S., Ciais, P., Guenet, B., and Huang, Y.: Modeling the effects of litter stoichiometry and soil mineral N availability on soil organic matter formation using CENTURY-CUE (v1.0), Geosci. Model Dev., 11, 4779–4796, https://doi.org/10.5194/gmd-11-4779-2018, 2018.
Zhang, H., Goll, D. S., Wang, Y. P., Ciais, P., Wieder, W. R., Abramoff, R., Huang, Y., Guenet, B., Prescher, A. K., Viscarra Rossel, R. A., Barré, P., Chenu, C., Zhou, G., and Tang, X.: Microbial dynamics and soil physicochemical properties explain large-scale variations in soil organic carbon, Glob. Change Biol., 26, 2668–2685, https://doi.org/10.1111/gcb.14994, 2020.
Zhang, X., Davidson, E. A., Mauzerall, D. L., Searchinger, T. D., Dumas, P., and Shen, Y.: Managing nitrogen for sustainable development, Nature, 528, 51–59, https://doi.org/10.1038/nature15743, 2015.
Zhao, M., Heinsch, F. A., Nemani, R. R., and Running, S. W.: Improvements of the MODIS terrestrial gross and net primary production global data set, Remote Sens. Environ., 95, 164–176, https://doi.org/10.1016/j.rse.2004.12.011, 2005.
Zobler, L.: A World Soil File for Global Climate Modelling. NASA Technical Memorandum 87802, NASA Goddard Institute for Space Studies, New York, New York, USA, 32 pp., 1986.
The requested paper has a corresponding corrigendum published. Please read the corrigendum first before downloading the article.
- Article
(7266 KB) - Full-text XML
- Corrigendum
-
Supplement
(14955 KB) - BibTeX
- EndNote