the Creative Commons Attribution 4.0 License.
the Creative Commons Attribution 4.0 License.
 | 09 Mar 2021
Evaluation of regional climate models ALARO-0 and REMO2015 at 0.22° resolution over the CORDEX Central Asia domain
Lola Kotova
Lesley De Cruz
Svetlana Aniskevich
Leonid Bobylev
Rozemien De Troch
Natalia Gnatiuk
Anne Gobin
Rafiq Hamdi
Arne Kriegsmann
Armelle Reca Remedio
Abdulla Sakalli
Hans Van De Vyver
Bert Van Schaeybroeck
Viesturs Zandersons
Philippe De Maeyer
Piet Termonia
Steven Caluwaerts
To allow for climate impact studies on human and natural systems, high-resolution climate information is needed. Over some parts of the world plenty of regional climate simulations have been carried out, while in other regions hardly any high-resolution climate information is available. The CORDEX Central Asia domain is one of these regions, and this article describes the evaluation for two regional climate models (RCMs), REMO and ALARO-0, that were run for the first time at a horizontal resolution of 0.22∘ (25 km) over this region. The output of the ERA-Interim-driven RCMs is compared with different observational datasets over the 1980–2017 period. REMO scores better for temperature, whereas the ALARO-0 model prevails for precipitation. Studying specific subregions provides deeper insight into the strengths and weaknesses of both RCMs over the CAS-CORDEX domain. For example, ALARO-0 has difficulties in simulating the temperature over the northern part of the domain, particularly when snow cover is present, while REMO poorly simulates the annual cycle of precipitation over the Tibetan Plateau. The evaluation of minimum and maximum temperature demonstrates that both models underestimate the daily temperature range. This study aims to evaluate whether REMO and ALARO-0 provide reliable climate information over the CAS-CORDEX domain for impact modeling and environmental assessment applications. Depending on the evaluated season and variable, it is demonstrated that the produced climate data can be used in several subregions, e.g., temperature and precipitation over western Central Asia in autumn. At the same time, a bias adjustment is required for regions where significant biases have been identified.
- Article
(6450 KB) - Full-text XML
-
Supplement
(2835 KB) - BibTeX
- EndNote


There is a strong need for climate information at the regional to local scale that is useful and usable for impact studies on human and natural systems (Giorgi et al., 2009). In order to accommodate for this, the World Climate Research Program (WCRP) Coordinated Regional Climate Downscaling Experiment (CORDEX) was initiated with the aim of designing and conducting several high-resolution experiments over prescribed spatial domains across the globe. CORDEX creates a framework to perform both dynamical and statistical downscaling, to evaluate these regional climate downscaling techniques, and to characterize uncertainties of regional climate change projections by producing ensemble projections (Giorgi and Gutowski, 2015). Within CORDEX there are large ensembles of model simulations available at different resolutions for the Africa (Nikulin et al., 2012, 2018), Europe (Jacob et al., 2014; Kotlarski et al., 2014), Mediterranean (Ruti et al., 2016), and North America (Diaconescu et al., 2016; Whan and Zwiers, 2017; Gibson et al., 2019) CORDEX regions (Gutowski et al., 2016). These large ensembles consist of more than 10 different global–regional climate model (GCM–RCM) combinations. In order to provide such ensembles over all CORDEX regions, coordinated sets of experiments were recently performed or are still ongoing for CORDEX regions such as South America (Solman et al., 2013), Central America (Fuentes-Franco et al., 2015; Cabos et al., 2019), South Asia (Ghimire et al., 2018), East Asia (Zou et al., 2016), South-East Asia (Tangang et al., 2018, 2019; Tuyet et al., 2019), Australasia (Di Virgilio et al., 2019), the Arctic (Koenigk et al., 2015; Akperov et al., 2018), Antarctic (Souverijns et al., 2019), and the Middle East–North Africa (Almazroui et al., 2016; Bucchignani et al., 2018). In addition, a new ensemble of climate change simulations covering all major inhabited regions with a spatial resolution of about 25 km has been established within the WCRP CORDEX COmmon Regional Experiment (CORE) framework to support the growing demands for climate services (Remedio et al., 2019). Furthermore, a number of high-resolution global simulations at climatic timescales, with resolutions of at least 50 km in the atmosphere and 28 km in the ocean, have been performed within the Coupled Model Intercomparison Project 6 (CMIP6) (Haarsma et al., 2016).
While high-resolution ensembles (up to 0.11∘ or 12.5 km spatial resolution) are available for certain regions, e.g., EURO-CORDEX (Jacob et al., 2014), for other regions such as Australasia (Di Virgilio et al., 2019) and the Antarctic (Souverijns et al., 2019) the first experiments were performed only recently. For the CORDEX Central Asia (CAS-CORDEX) domain only a single climate run was publicly available through the Earth System Grid Federation (ESGF) archive until 2019. This was performed by the Met Office Hadley Centre (MOHC) with the regional climate model (RCM) HadRM3P (Jones et al., 2004) at a resolution of 0.44∘, which is insufficient for most impact modeling and environmental assessment applications. In addition, climate projections with the RegCM model at 0.44∘ resolution for the 2071–2100 period and different emission scenarios were reported in Ozturk et al. (2012, 2016); however, they are not available through the ESGF archive. Thus, higher-resolution climate data over the CAS-CORDEX region are needed (Kotova et al., 2018). Recently, Russo et al. (2019, 2020) presented model evaluation results of the COSMO-CLM 5.0 model run at 0.22∘ or 25 km resolution over the CAS-CORDEX region. In this study we aim to address the scarcity of reliable climate information over the CAS-CORDEX domain by evaluating two different RCMs based on multiple scores for temperature (mean, minimum, and maximum) and precipitation over the longer period of 38 years.
In order to fill the knowledge gap over Central Asia two RCMs, ALARO-0 and REMO, were run over this region at 0.22∘ resolution in line with the CORDEX-CORE protocol (CORDEX Scientific Advisory Team, 2019). Here we present the model evaluation through the use of so-called “perfect boundary conditions” taken from reanalysis data and by comparing the downscaled results to observed data for the period 1980–2017. Such a study is necessary to gain confidence in the RCM downscaling procedure before its application in the context of climate projections for which the RCM is driven by a GCM (Giorgi and Mearns, 1999). The methodology for evaluation is partially based on Kotlarski et al. (2014) and Giot et al. (2016), who compared a large ensemble of RCMs over the EURO-CORDEX region with the high-resolution E-OBS observational dataset (Hofstra et al., 2009). However, in this study a slightly different approach is necessary due to the absence of an ensemble of RCM runs over Central Asia. Additionally, in some regions the quality of gridded observational datasets, constructed through interpolation or area averaging of station observations, is poor due to over-smoothing of extreme values (Hofstra et al., 2010) and/or because of station observations that are nonrepresentative for their large-scale environments. This is particularly the case for orographically complex regions such as the Himalayas. The current study compares the model simulations with different gridded observational datasets and reanalysis data. When the different datasets show large deviations and a large spread then their uncertainty is high and no robust conclusions can be drawn (Collins et al., 2013; Russo et al., 2019).
This study contains two assets: for the first time an in-depth evaluation of the RCMs ALARO-0 and REMO is performed at 0.22∘ spatial resolution over the CAS-CORDEX domain, and we reflect on the impact of the observational datasets on the model evaluation. Such an analysis is a prerequisite in order to be able to use the climate data in a sound way for later impact studies, e.g., for investigating climate change impacts on crop yields and biomass production in forest ecosystems, which will be done in the framework of the AFTER project (Kotova et al., 2018).
In the following section we describe the applied methodology for this study (Sect. 2). This section contains details about the study area, the model description, datasets used for the evaluation, and the methodology of the analysis. In Sect. 3, we describe the annual cycle, seasonal and annual means, biases, and the variability of mean, minimum, and maximum surface air temperature and precipitation. Further, we evaluate and provide a discussion of some remarkable anomalies in Sect. 4, and in the final section (Sect. 5) we summarize the conclusions.
2.1 CORDEX Central Asia domain and subregions
The CAS-CORDEX domain as shown in Fig. 1 contains eastern Europe, a large part of the Middle East (including Saudi Arabia, Jordan, Syria, Iraq, and Iran), and Central Asia (including Kazakhstan, Uzbekistan, Turkmenistan, Afghanistan, Pakistan, Tajikistan, Kyrgyzstan, and Mongolia). The majority of Russia and China (excluding the most eastern provinces) and the northern part of India are included as well. This domain is an exceptional CORDEX domain in the sense that it barely covers any open ocean. It contains several important mountain ranges, such as the Ural, Caucasus, Altay, and Himalaya, as well as deserts, e.g., the Arabian, Karakum, Thar, Taklamakan, and Gobi. Mountainous environments are of special interest for regional climate modeling since global climate models poorly resolve mountain ranges with a spatial resolution less than 0.50∘, and hence RCMs may have an added value here (Torma et al., 2015). In addition, the CAS-CORDEX domain contains a wide range of climatic and bioclimatic zones, such as permafrost in the north and the hot regions and monsoon-driven climates with abundant precipitation linked to the Intertropical Convergence Zone (ITCZ) passing in the south.

Figure 1The CAS-CORDEX domain delineated by a red contour and the main overlapping CORDEX domains (black contour lines): Europe (EUR), Arctic (ARC), South-East Asia (SEA), East Asia (EAS), and MENA projected upon the topography of Eurasia (geopotential height in meters of the GTOPO30 global digital elevation model – DEM – 3). All points with orography higher than 3000 m are colored white.
In order to obtain simulations that allow for coordinated intercomparisons, the CORDEX initiative prescribes the minimum inner domain of each CORDEX region that the RCM has to cover. While REMO uses the exact rotated lat–long CAS-CORDEX grid (Jacob et al., 2007) described by the CORDEX community, ALARO-0 has adopted a conformal Lambert projection (Giot et al., 2016), which implies that the non-rotated boundary box should be applied in order to define the domain. The grids were set up in such a way that the CAS-CORDEX domain is completely covered by the model domain excluding the relaxation zone. The CAS-CORDEX 0.22∘ ALARO-0 inner domain encompasses 333 by 223 grid boxes, while REMO circumscribes 309 and 201 grid boxes in the east–west direction and north–south direction, respectively. The outer domain for both RCMs consists of the inner domain plus a relaxation zone of eight grid points at every boundary.
The CAS-CORDEX domain overlaps with eight other CORDEX domains, including the ones covering Europe, the Arctic, East Asia, South-East Asia, South Asia, Africa–MENA, and the Mediterranean. Both RCMs used in this study, ALARO-0 and REMO, were already run and evaluated over the EURO-CORDEX region (Kotlarski et al., 2014; Giot et al., 2016). Additionally, REMO has been validated over five other overlapping CORDEX regions (Remedio et al., 2019).
In the present paper, the CAS-CORDEX domain was further subdivided into five subregions according to the IPCC reference regions as defined by Iturbide et al. (2020): East Europe (EEU), West Siberia (WSB), East Siberia (ESB), West Central Asia (WCA), and the Tibetan Plateau (TIB). These subregions, visualized in Fig. 2, were applied to evaluate the spatial differences in the study area and to investigate whether there were differences in the simulation of subcontinental processes.
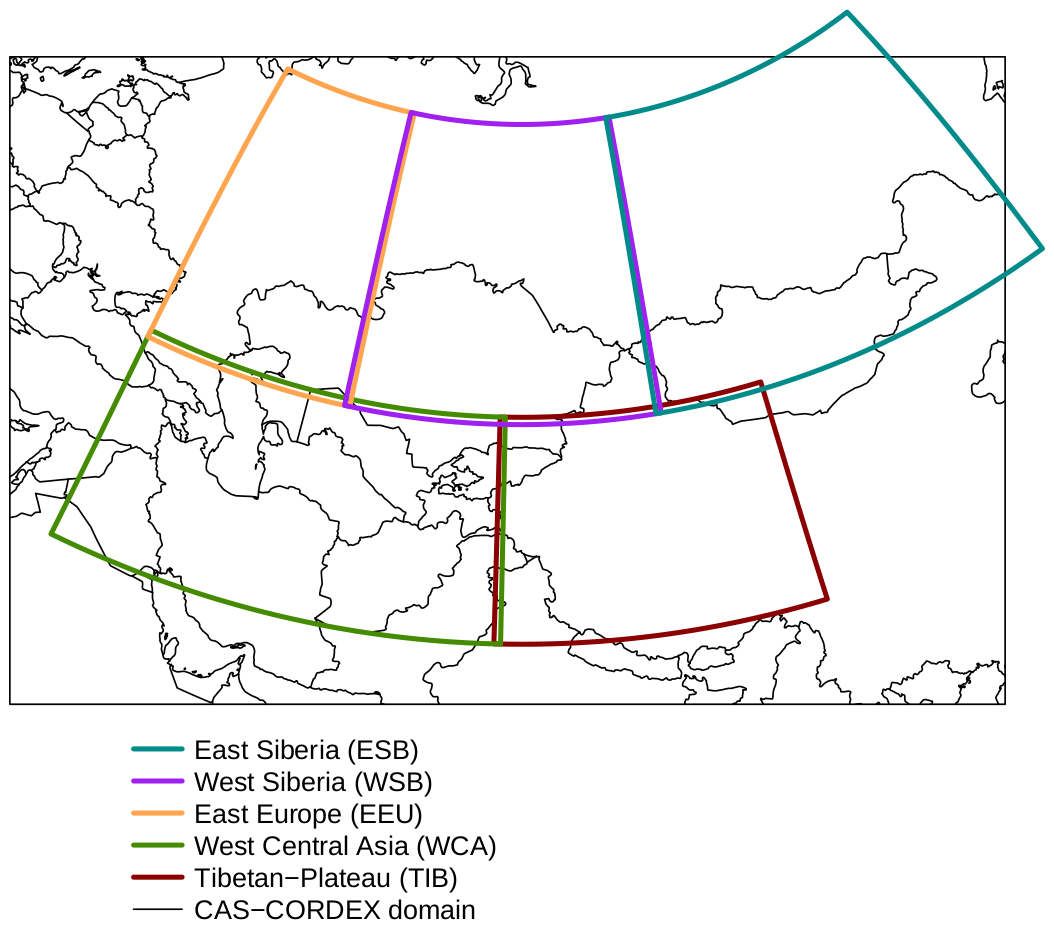
Figure 2IPCC6 subregions projected on the CAS-CORDEX region.
2.2 Model description and experimental design
REMO and ALARO-0 are hydrostatic atmospheric circulation models aimed to run over limited areas. The ALARO-0 model is a configuration of the ALADIN model (ALADIN International Team, 1997; Termonia et al., 2018a), which is developed, maintained, and used operationally by the 16 countries of the ALADIN consortium. The dynamical core of the ALADIN model is based on a spectral spatial discretization and a semi-implicit semi-Lagrangian time stepping algorithm. The ALARO-0 configuration is based on the physics parameterization scheme 3MT (Modular Multiscale Microphysics and Transport; Gerard et al., 2009), which handles convection, turbulence, and microphysics. ALARO-0 has been used and validated for regional climate studies (Hamdi et al., 2012; De Troch et al., 2013; Giot et al., 2016; Termonia et al., 2018b).
REMO is based on the Europa Model, the former numerical weather prediction (NWP) model of the German Weather Service (Jacob, 2001). The model development was initiated by the Max Planck Institute for Meteorology and is further maintained and extended by the Climate Service Center Germany (HZG-GERICS). The physical parameterization originates from the global circulation model ECHAM4 (Roeckner et al., 1996), but there have been many further developments (Hagemann, 2002; Semmler et al., 2004; Pfeifer, 2006; Pietikäinen et al., 2012; Wilhelm et al., 2014). REMO is used in its most recent hydrostatic version, REMO2015, and the dynamical core uses a leapfrog time stepping with semi-implicit correction and an Asselin filter. For both RCMs, the vertical levels are based on hybrid normalized pressure coordinates that follow the orography at the lowest levels. For the ALARO-0 experiment 46 levels were used, whereas the REMO run employs 27 levels. More details on the general setup of ALARO-0 can be found in Giot et al. (2016), and for REMO we refer to Jacob (2001) and Jacob et al. (2012). An overview of the model specifications is given in Table S1 in the Supplement.
In order to evaluate both RCMs, a run driven by a large-scale forcing taken from the ERA-Interim global reanalysis (Dee et al., 2011) was undertaken for the period 1980–2017. A one-way nesting strategy was applied to dynamically downscale the ERA-Interim data, having a horizontal resolution of about 0.70∘ (approximately 79 km), to a higher resolution over the CAS-CORDEX domain (Denis et al., 2002). The ERA-Interim forcing data have been prescribed at the lateral boundaries using the Davies (1976) relaxation scheme, and the downscaling has been performed to a horizontal resolution of 0.22∘ (approximately 25 km). Both model experiments are continuous runs initialized on 1 January 1979 and then forced every 6 h at the boundaries up to 31 December 2017. Furthermore, constant climatological fields for some parameters were used and updated monthly following the methodology of Giot et al. (2016). These include sea surface temperatures (SSTs), surface roughness length, surface albedo, surface emissivity, and vegetation parameters. A spin-up period was needed to allow the models and their surface fields to adjust to the forcing and internal model physics (Giot et al., 2016). While for ALARO-0 the year 1979 was designated as the spin-up year, REMO was spun up for 10 years to allow the model to reach an equilibrium state for the soil temperature and soil moisture. These soil fields were then used as initial soil conditions when restarting the model from 1979. The data produced by both models have been uploaded to the ESGF data nodes (website: http://esgf.llnl.gov/, last access: 7 July 2020).
2.3 Reference datasets
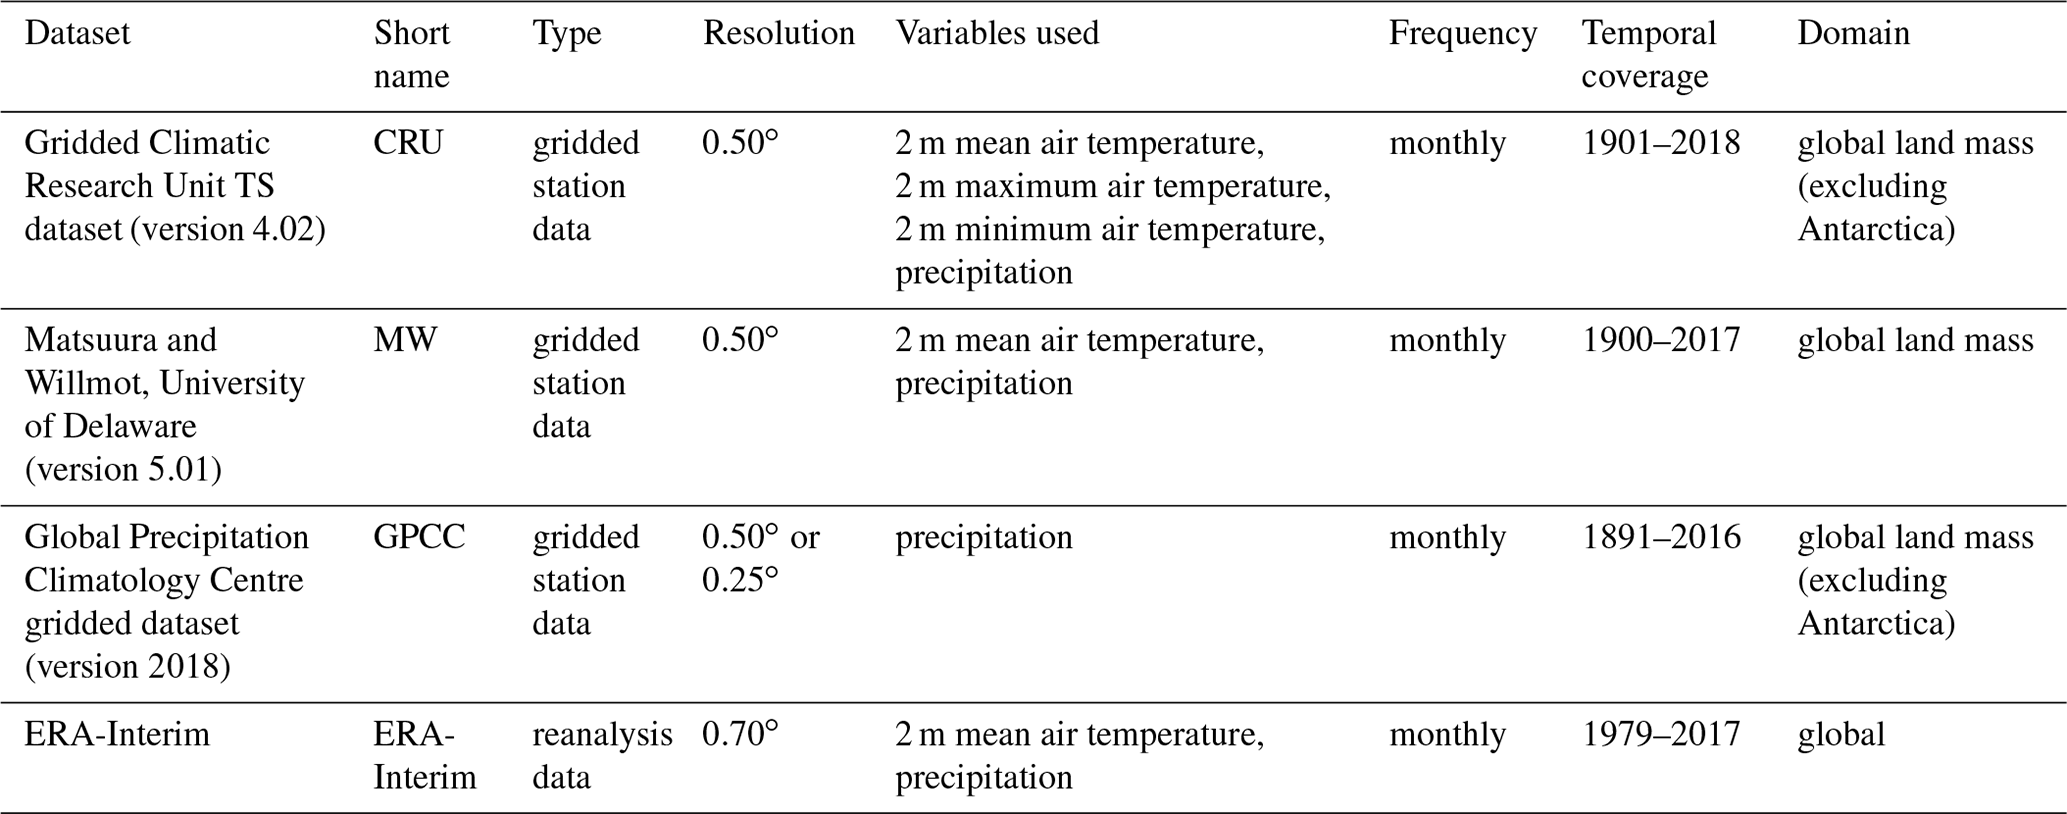
In order to validate the model results, monthly, seasonally, and annually averaged values for temperature and precipitation were compared with different reference datasets. Gridded datasets are based on interpolated station data and are used instead of station observations to overcome the scale difference between the model and observation field (Tustison et al., 2001). A multitude of datasets were considered to assess the reliability of the gridded observational temperature and precipitation (Gómez-Navarro et al., 2012). The reference datasets are briefly presented in Table 1, and in the next sections we give a more detailed overview of the different datasets used in this study.
2.3.1 Climatic Research Unit TS dataset
The gridded Climatic Research Unit (CRU) TS dataset (version 4.02) contains 10 climate-related variables for the period 1901–2018 at a grid resolution of 0.50∘ covering the global land mass (excluding Antarctica) (Harris et al., 2020). Monthly values of minimum, maximum, and mean near-surface air temperature and precipitation were used in the current study. This dataset is widely used all over the world in a wide range of disciplines, although some issues have been reported (Harris et al., 2020), with the main concerns including sparse coverage of measurement stations over certain regions, e.g., northern Russia, and the dissimilarities in measurement methods that are used by different countries (Harris et al., 2020). In the present paper, this dataset is used as the reference, while the spread of the data in all of the datasets is used to assess the reliability over the different areas.
2.3.2 Matsuura and Willmott gridded dataset
The Matsuura and Willmott (MW) (version 5.01) gridded dataset of the University of Delaware contains monthly values at a 0.5∘ resolution based on temperature and precipitation station observations. The main differences with the CRU dataset are the use of different measurement station networks and spatial interpolation methods (Willmott and Matsuura, 1995; Harris et al., 2020). Additionally, this dataset only contains monthly values of mean near-surface air temperature and precipitation, which are used in this study. It is known that the MW dataset generally underestimates the precipitation in the central part of the CAS-CORDEX domain, especially during spring (Hu et al., 2018). The MW dataset contains up to 0.4 ∘C warmer temperatures globally for the latest decades compared to CRU (Harris et al., 2020).
2.3.3 Global Precipitation Climatology Centre dataset
The Global Precipitation Climatology Centre (GPCC) (version 2018) of the German Weather Service is a monthly land surface precipitation dataset at 0.25∘ resolution based on rain gauge measurements. The GPCC full-data monthly product (version 2018) contains globally regular gridded monthly precipitation totals. This updated version uses “climatological infilling” to avoid interpolation artifacts for regions where an entire 5∘ grid is not covered by any station data (Schneider et al., 2018). Hu et al. (2018) concluded for the central part of our domain that GPCC is more in line with the observed station data in Central Asia compared to CRU and MW. For this region, they also found that precipitation is underestimated in mountainous areas and precipitation is slightly underestimated overall by GPCC, especially during spring. In addition, the GPCC has no similar dataset for other variables, and thus only precipitation can be validated with this dataset.
2.3.4 ERA-Interim
Reanalysis products like ERA-Interim are more continuous in space and time than station data, but they also contain biases. The ERA-Interim reanalysis of the European Centre for Medium-Range Weather Forecasts (ECMWF) is available from 1979 onwards. The spatial resolution of the dataset is approximately 0.70∘ (T255 spectral) with 60 levels in the vertical direction from the surface up to 0.1 hPa (Dee et al., 2011). The ERA-interim data have been further interpolated to be used as forcing for both RCMs at a spatial resolution of 0.25∘. Moreover, the ERA-Interim data are used to study the spread between observational gridded datasets and reanalysis data. To evaluate precipitation, total monthly precipitation was obtained from the Monthly Means of Daily Forecast Accumulations dataset. The Monthly Means of Daily Means data at the 2 m temperature level are used for the mean temperature, while the minimum and maximum temperatures are retrieved by extracting the minimum and the maximum, respectively, from the 3-hourly ERA-Interim forecasts. Several studies have shown that ERA-Interim tends to have a warm bias in the northern part of the CAS-CORDEX region, especially during winter (Ozturk et al., 2012, 2016). Ozturk et al. (2012) relate this to the insufficient ability of ERA-Interim to produce snow cover in winter. Additionally, ERA-Interim globally overestimates precipitation, particularly over mountainous regions (Sun et al., 2018).
2.4 Analysis methods
The grids of the observational and reanalysis datasets generally differ from the model grid. Therefore, an interpolation to one common grid is needed in order to compare them (Kotlarski et al., 2014). The output of the RCMs was upscaled and bilinearly interpolated to the 0.50∘ resolution grid of the observational gridded datasets.
For ALARO-0 and REMO, hourly values for temperature at 2 m and convective and stratiform rain and snow are available. The precipitation variables were added up in order to obtain the hourly total precipitation, which in turn was used to calculate monthly totals and seasonal and annual means. Seasons are defined as meteorological seasons; winter includes December, January, and February (DJF). Spring includes March, April, and May (MAM). Summer includes June, July, and August (JJA), and autumn includes September, October, and November (SON).
The diurnal temperature range was obtained by subtracting the minimum temperature from the maximum temperature, and a height correction was performed for mean, minimum, and maximum temperature assuming a uniform temperature lapse rate of 0.0064 K m−1.
The model evaluation was done by calculating different evaluation metrics over the CAS-CORDEX domain and the defined subregions for the 1980–2017 period. We computed the monthly, seasonal, and annual climatological means of the evaluated variables to obtain graphs of the annual cycle and maps that visualize the spatial patterns of the bias between the RCMs and reference datasets. The relative bias for precipitation is computed by subtracting the CRU value from the RCM and dividing it by the CRU value.
The climatological means, biases, and mean absolute errors (MAEs) were spatially averaged to obtain one mean value over the complete domain and each of the subregions. Moreover, Taylor diagrams were produced in order to study the model performance for the different seasons and for annual means. These diagrams supplement the bias analysis by visualizing in a concise way information about the spatial correlation, the centered root mean square error (RMSE), and the ratio of spatial variability (RSV) between the model and the observational dataset (Taylor, 2001). These metrics are computed over all grid points of the CAS-CORDEX domain. The RSV is defined as the ratio of the model standard deviation and the standard deviation of the reference dataset (CRU in this case) averaged over the domain. For the formulas used we refer to Appendix A of Kotlarski et al. (2014).
Limitations of the observational datasets should be kept in mind when interpreting the evaluation results (Kotlarski et al., 2014). These limitations are investigated by comparing the different observational datasets, and their implications for the evaluation will be described in Sect. 4. The spread between the different reference datasets (observational datasets and the ERA-Interim reanalysis dataset) is calculated for each grid point by computing the difference between the maximum and the minimum value of the different datasets for every 3-month period (season) averaged over the 1980–2017 period.
In this section, the results of the model evaluation are presented with a focus on evaluation metrics of seasonal means of mean, minimum, and maximum near-surface air temperature (henceforth denoted as temperature) and seasonal mean precipitation (henceforth precipitation). This is done for the complete CAS-CORDEX domain and for the five subregions.
3.1 Mean temperature
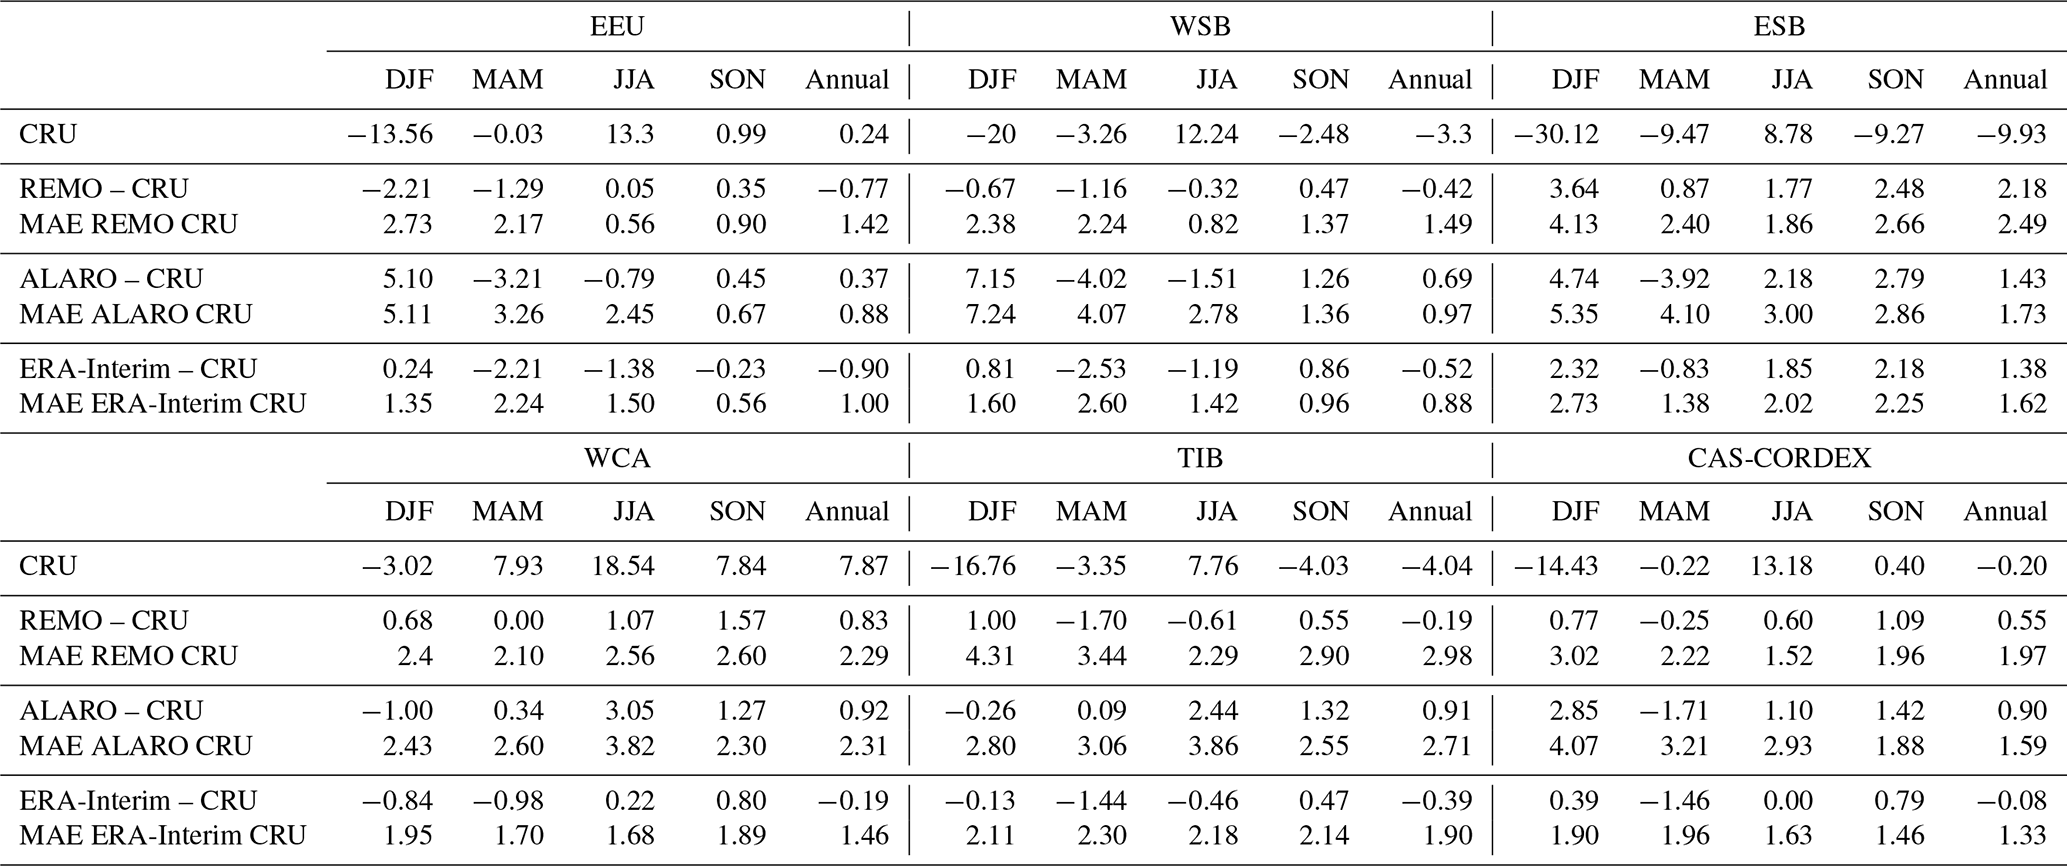
Figure 3 shows the mean seasonal and annual temperature observations of CRU, the model biases with respect to CRU, and the spread between the reference datasets (ERA-Interim, MW, and CRU) for the 1980–2017 period. Table 2 shows the spatially averaged mean seasonal and annual CRU temperature for the 1980–2017 period over the CAS-CORDEX domain and subregions, the biases and MAE of the RCMs (REMO and ALARO-0), and the other reference datasets (ERA-Interim and MW) against CRU.
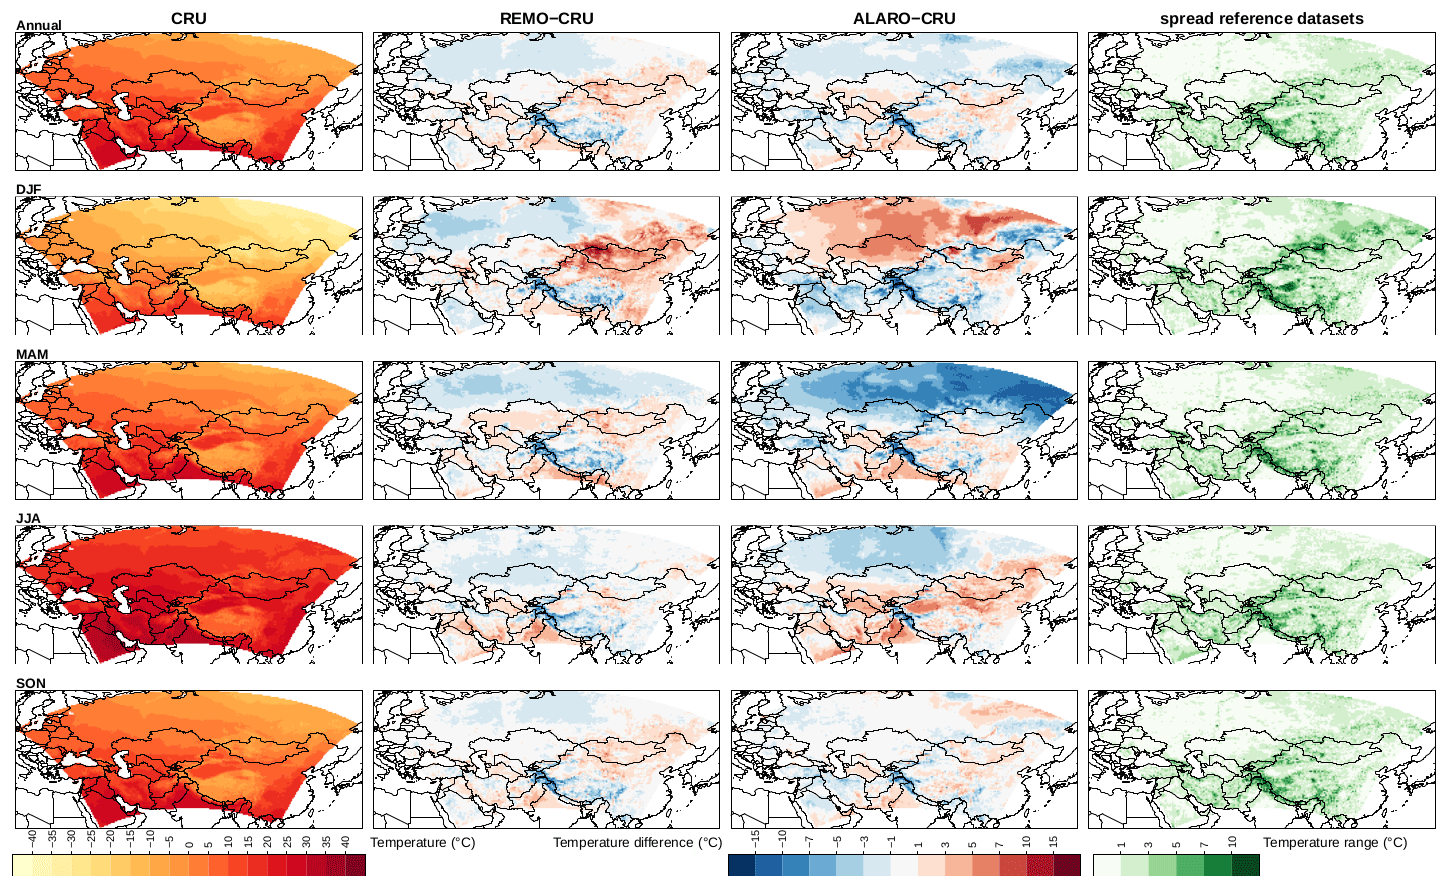
Figure 3Left column: mean air temperature (∘C) at 2 m height over the CAS-CORDEX domain based on the observational CRU dataset for the 1980–2017 period on an annual level and for winter (DJF), spring (MAM), summer (JJA), and autumn (SON). Middle columns: difference in mean temperature between models and CRU. Right column: the range in mean temperature (∘C) between the different reference datasets (CRU, MW, and ERA-Interim).
Table 2Climatological mean CRU temperature (∘C) for the 1980–2017 period over the CAS-CORDEX domain and subdomains, biases (∘C) and MAE (∘C) of the RCMs (REMO and ALARO-0), and the other reference datasets (ERA-Interim and MW) against CRU.
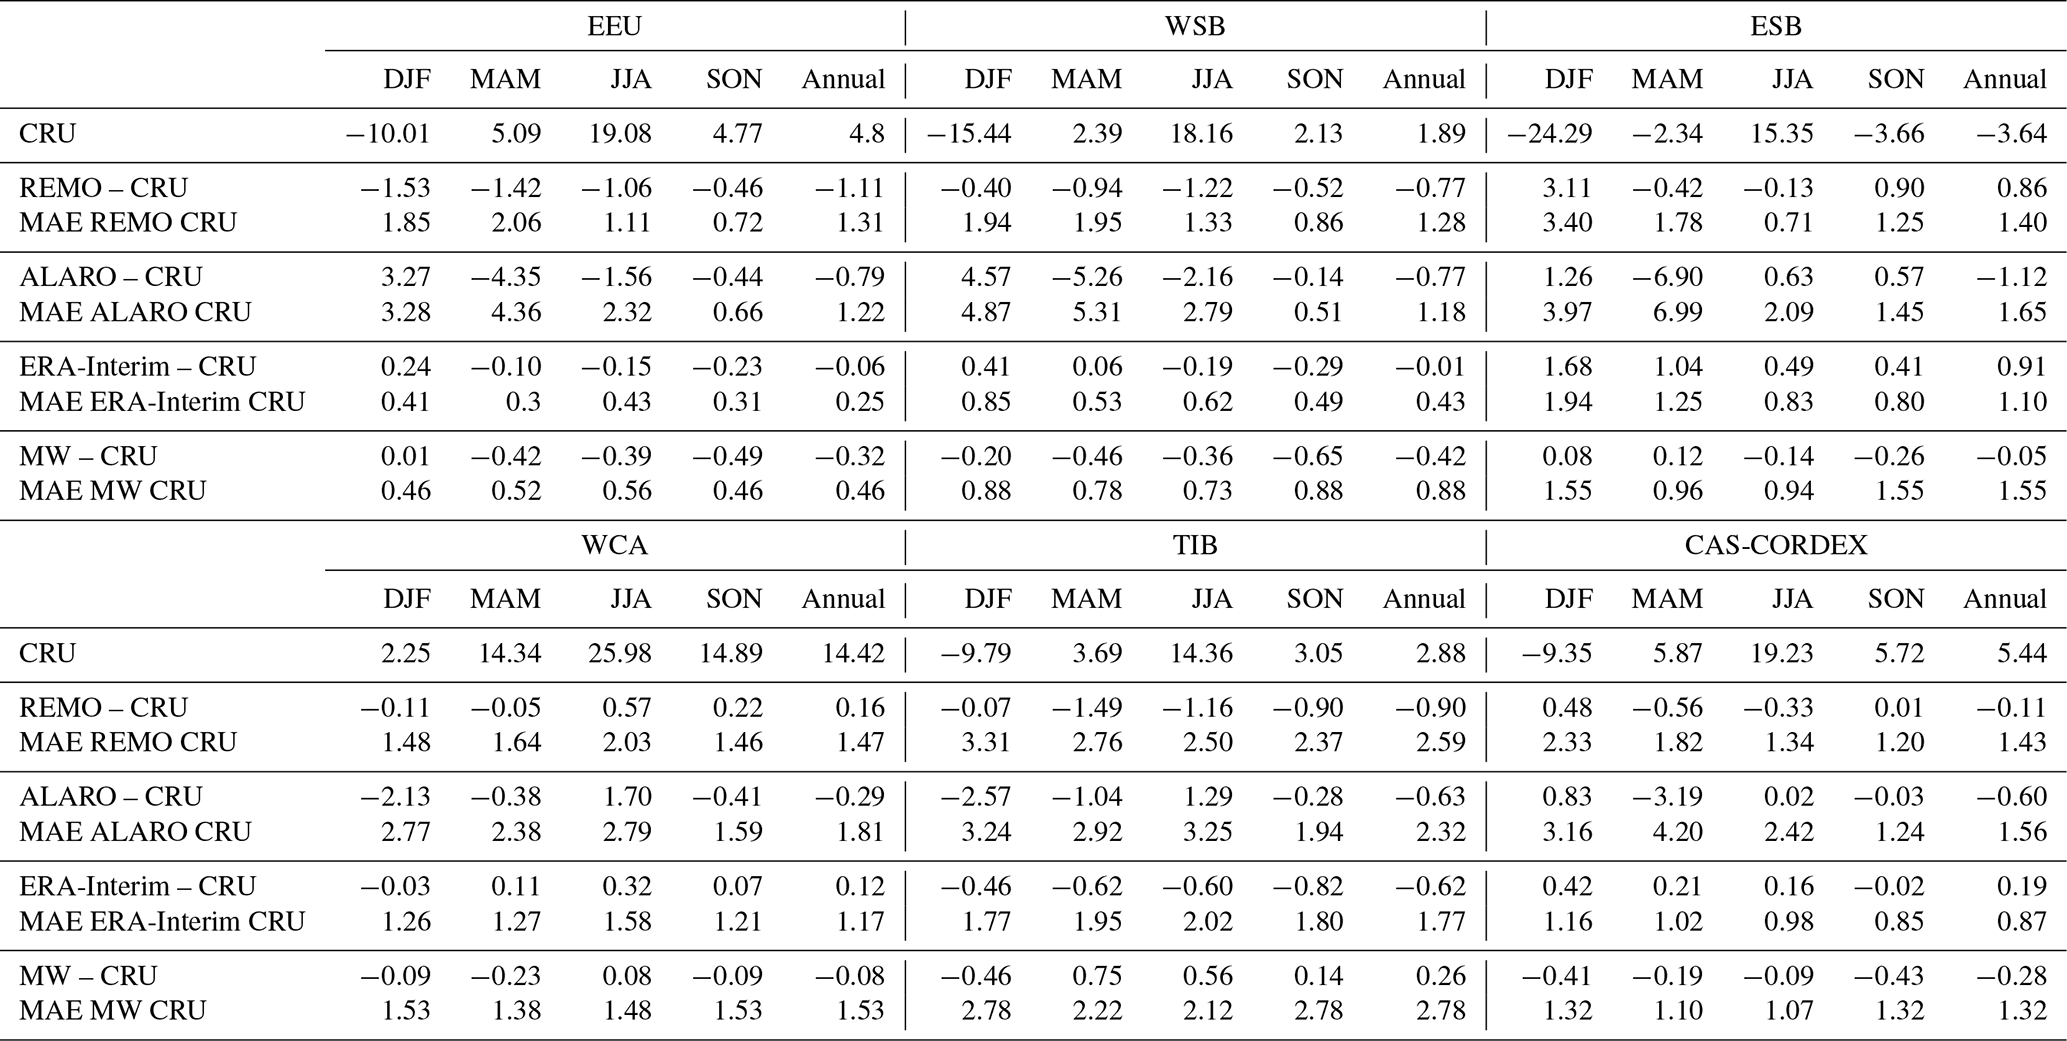
Both RCMs produce similar mean annual temperature patterns in the western part of the domain since they have similar biases with respect to CRU (Fig. 3). Contrasting error patterns can be seen in the temperature bias of ALARO-0 between north and south and for REMO between east and west, with a peak in positively biased temperatures over northwestern Mongolia. Annual biases generally vary between −3 and 3 ∘C for both RCMs, with the exception of orographically complex regions and some areas in northern and eastern Siberia for ALARO-0. The biases and MAE of the annual mean temperature are very comparable between ALARO-0 and REMO (Table 2), with small biases and MAEs that are only slightly larger than the spread of the observational datasets.
On the seasonal timescale, biases over larger areas are mainly pronounced in winter (DJF) and spring (MAM). In particular, both models locally show strong biases in the northeastern part of the domain for winter, with values ranging up to 15 ∘C. Additionally, ALARO-0 shows strong negative biases up to −15 ∘C during spring in this area. These large biases are reflected by the values in Table 2 for the northern subregions EEU, WSB, and ESB for ALARO-0 and the ESB subregion for REMO. Additionally, REMO has a cold bias in the western part of Russia during winter, while ALARO-0 shows a warm bias. During spring, cold biases are found for both models in the northern part of the domain, but the biases of ALARO-0 are more pronounced than those of REMO (Fig. 3 and Table 2). For the summer (JJA) season, warm biases occur over the southern part of the domain for both RCMs, with exception of some regions such as the Himalayas, southeastern China, and the northern border of Iran, which exhibit cold biases. On the contrary, cold biases in summer are overall more dominant in the north. These biases in summer are more pronounced for ALARO-0. The small mean bias during summer (JJA) for ALARO-0 over the complete domain (Table 2) is the result of averaging the warm biases in the south and the cold biases in the north (Fig. 3). Both models have the smallest biases and MAE over the ESB region in this season (Table 2). Both models show modest bias patterns in autumn (SON), with notably modest warm biases over the eastern part of the domain (Fig. 3). In agreement with Fig. 3 the spatially averaged biases and MAE in Table 2 are small for both RCMs during autumn, especially for eastern Europe (EEU), the western and central Russian region, and Kazakhstan (WSB).
Biases in the high-altitude regions are largely persistent throughout the seasons. More specifically, both RCMs have large negative biases over the Pamir Mountains (Tajikistan) and the Himalayas, while they also feature negative biases over the Tibetan Plateau, although this is to a lesser extent for ALARO-0 for which this is only clearly visible in the winter season.
Figure 4 shows the normalized Taylor diagram illustrating the spatial performance of mean temperature for seasonal and annual means for both RCMs (ALARO-0 and REMO), the ERA-Interim reanalysis, and MW observational data with respect to CRU for the five subregions and the complete CAS-CORDEX domain.

Figure 4Normalized Taylor diagram showing the spatial performance of mean temperature for seasonal and annual means for both RCMs (ALARO-0 and REMO), the ERA-Interim reanalysis, and MW observational data with respect to CRU for the five subregions and the complete CAS-CORDEX domain.
Both models have generally good performance for annual and seasonal temperature over the CAS-CORDEX domain since the spatial correlation between the model output and the CRU data is high (> 90 %), while the centered RMSE is small (< 0.5) and the normalized RSV is mostly close to 1. Moreover, the spatial correlation is high (> 90 %) for ALARO-0 over all subregions at the annual level. Annual mean temperatures of REMO have slightly lower spatial correlations with CRU when compared to those of ALARO-0, but they are still high (> 90 %), except for the ESB subregion.
On the other hand, the Taylor diagrams for the subregions illustrate how scores calculated over the complete CAS-CORDEX domain can hide underlying regional patterns. The spatial pattern correlation is lowest during winter for both RCMs, except for the ESB subregion where ALARO-0 shows a lower spatial correlation during summer. When considering the spatial correlation and the RMSE of the different subregions, both RCMs are closest to the CRU data over the WCA subregion. Based on the centered RMSE, the RCMs perform generally best during autumn, except for the REMO simulations in the subregions WSB and TIB. During the other seasons both RCMs simulate the temperature clearly worse in the northern part of the CAS-CORDEX domain (EEU, WSB, ESB). Both RCMs overestimate the normalized RSV, but ALARO-0 underestimates it in winter over the EEU subregion and in autumn over the WCA subregion. In general, both RCMs simulate the normalized standard deviation of the temperature well (RSV deviates less than 0.25 from 1) during autumn and winter. Additionally, REMO simulates the normalized standard deviation well during summer for the northern subregions. During spring the cold bias in the north is limited to −5 ∘C for REMO but not for ALARO-0, which is reflected in a higher RSV for the northern regions. High RSVs are also observed for ALARO-0 in summer over the complete domain (Fig. 4), and this is due to the underestimation of the cold temperatures in cold regions, while warm temperatures are overestimated in regions that are characterized by warmer temperatures (Fig. 3). This is reflected in a normalized standard deviation that is higher than the one of REMO (Fig. 4). Comparing the metrics of the RCMs (Figs. 3, 4 and Table 2) shows that REMO is better in simulating the seasonal variability in temperature compared to ALARO-0, except for the autumn in all subregions and winter in the WSB and TIB subregions. On the other hand, ALARO-0 often better captures spatial temperature patterns since the spatial pattern correlation is slightly higher than for REMO, except during winter and summer over the ESB and WCA subregions and spring and summer over the TIB subregion.
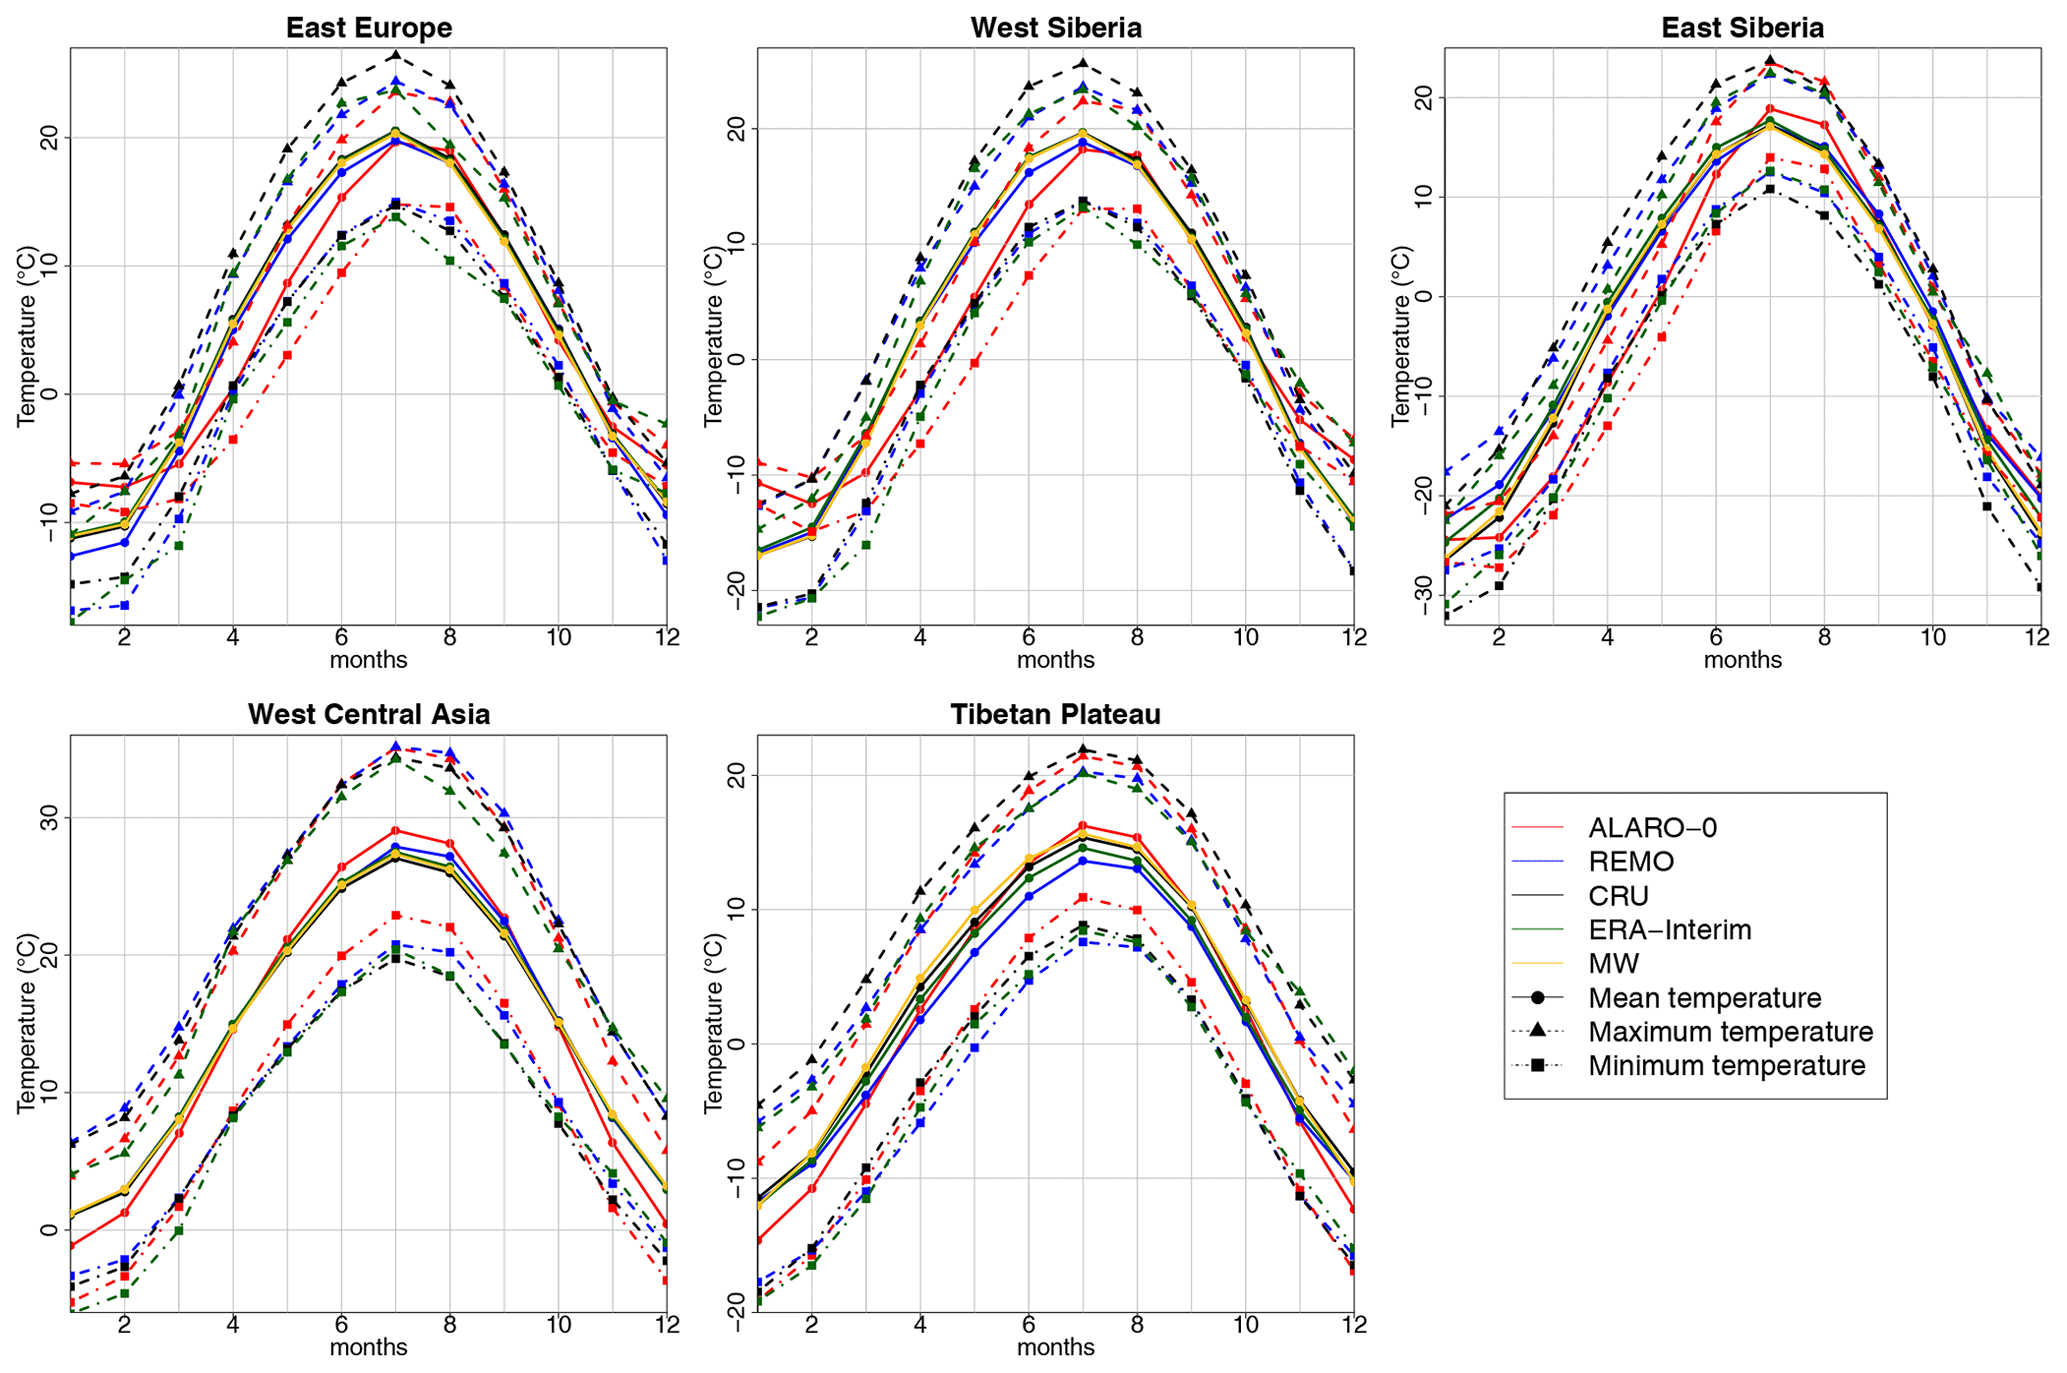
Figure 5Annual cycles of the mean, minimum, and maximum temperature for both RCMs (ALARO-0 and REMO) compared to the ERA-Interim reanalysis, MW, and CRU observational data over five subregions.
Figure 5 shows the annual cycles of the mean, minimum, and maximum temperature for both RCMs (ALARO-0 and REMO) compared to the ERA-Interim reanalysis, MW, and CRU observational data over five subregions. From this figure, it can be seen that in the northern subregions EEU and WSB there is on average a strong warm bias in December and January for ALARO-0, reaching a maximum of 4.1 and 5.8 ∘C, respectively, during December. REMO simulates winter temperatures (months 12, 1, and 2) within the uncertainty range of the observational datasets for WSB and underestimates the temperatures on average by 1.4 ∘C in January for EU. REMO simulates warm biases around 2 ∘C in December and January over ESB. On average there is no strong warm bias observed for ALARO-0 during the winter months in ESB (Table 2) due to the compensation effect of cold biases in both time (Fig. 5) and space (Fig. 3). Furthermore, there is a remarkable cold bias observed for ALARO-0 during spring (months 3, 4, and 5) and June in the northern subregions EEU, WSB, and ESB, reaching up to −7.3 ∘C over ESB during April. REMO performs well during spring months over the northern subregions. From Fig. 5, it can be seen that the RCMs simulate the spatially averaged temperatures well during the autumn months (months 9, 10, and 11), since they are within the observational spread or deviate slightly from the observational spread (< 1 ∘C). The exceptions are the spatially averaged temperatures for ALARO-0 over WSB and WCA in November when the spatially averaged temperature deviates 2 ∘C from CRU.
Compared to the northern subregions, ALARO-0 simulates the annual cycle better for the southern subregions WCA and TIB but slightly overestimates the amplitude of the annual temperature cycle. REMO simulates the mean temperature well over the WCA subregion, with only a slight overestimation of the temperatures in July and August. In the mountainous area of TIB REMO underestimates the temperatures, except for January and December. The better results in spring, summer, and autumn for ALARO-0 over the subregion TIB are due to spatial averaging of cold biases in the northern Himalayas and warm biases over the Taklamakan Desert; the opposite is true for REMO during winter (Fig. 3). This effect is reflected by the large MAE over this subregion during the mentioned seasons (Table 2).
3.2 Diurnal temperature range
Here, we first discuss the model performance of both RCMs for the minimum and maximum temperature and then the diurnal range taken as the difference between the two.
Similar to the mean temperature in Fig. 3, the modeled daily minimum temperature averaged over the different seasons and years during 1980–2017 is compared with the observational CRU data in Fig. 6. Annual biases of the minimum temperature over Russia in general vary between −3 and 3 ∘C for REMO and between −1 and 5 ∘C for ALARO-0, with a few exceptions in the orographically complex regions, e.g., in the Stanovoy Range and Central Siberian Plateau where higher biases are found.

Figure 6Left column: minimum air temperature (∘C) at 2 m height over the CAS-CORDEX domain based on the observational CRU dataset for the 1980–2017 period on an annual level and for winter (DJF), spring (MAM), summer (JJA), and autumn (SON). Middle columns: difference in minimum temperature between the models and CRU. Right column: the range in minimum temperature (∘C) between the different reference datasets (CRU and ERA-Interim).
Compared to ALARO-0, REMO shows larger warm biases over Mongolia during all seasons, except for summer. The warm biases for REMO in the eastern part of the domain are most pronounced during winter, reaching up to 15 ∘C. ALARO-0 also shows equally large biases, but they cover the northern part of the domain. Moreover, strong cold biases are present in the north during spring for both models, but they are more pronounced for the ALARO-0 model, with biases up to −10 ∘C in the northeastern part of the domain. During the summer season the biases for REMO are limited between −5 and 7 ∘C except for the Himalayan mountain range, while the ALARO-0 model output has, except for the Himalayas, a cold bias up to −7 ∘C in the northwestern part of Russia and a warm bias up to 10 ∘C in the southern and eastern part of the domain (Fig. 6). In autumn, both models have a warm bias over almost the entire domain, except for the cold biases in mountainous areas, the Arabian Peninsula, northern Iran, western Russia, and for REMO also in the central northern part of the domain. The increased minimum temperatures obtained with the RCMs indicate that they do not capture the coldest diurnal temperatures.
Table 3 shows the spatially averaged biases and MAE for minimum temperature during the 1980–2017 period of both RCMs and ERA-Interim compared to the minimum temperatures of CRU for the different seasons over the CAS-CORDEX domain and subregions. These scores confirm that the RCMs ALARO-0 and REMO are not able to reproduce the minimum temperature over the northern and eastern part of the domain during winter. During winter and spring, both models simulate minimum temperature best over the subregion WCA, while during summer and autumn they both perform best over the EEU region. REMO is able to simulate the minimum temperature accurately over the EEU and WSB subregions during summer since the errors are small (MAE < 1 ∘C). In general ALARO-0 has difficulties in simulating the minimum temperature correctly in any season and is only able to simulate the minimum temperature well over the EEU region during autumn.
Table 3Spatial average over the CAS-CORDEX domain and subdomains of climatological mean CRU minimum temperature (∘C) for the 1980–2017 period, as well as biases (∘C) and MAE (∘C) against CRU for REMO, ALARO-0, and ERA-Interim.
The normalized Taylor diagrams in Fig. 7 confirm that, in general, the RCMs struggle to simulate the spatial pattern of minimum temperature well over the northeastern part of the domain (ESB), while on an annual level ALARO-0 is able to simulate the spatial pattern well. The RCMs simulate the spatial pattern of minimum temperature well over the WCA region. Additionally, ALARO-0 produces minimum temperatures with a high spatial correlation with CRU over the EEU subregion compared to REMO. At an annual and seasonal scale, except for summer in WSB, ESB, and TIB, ALARO-0 has a slightly better spatial pattern correlation with the minimum temperatures of the CRU dataset than REMO. On the other hand, REMO has a better centered RMSE and spatial variability during summer, except for the WCA region.
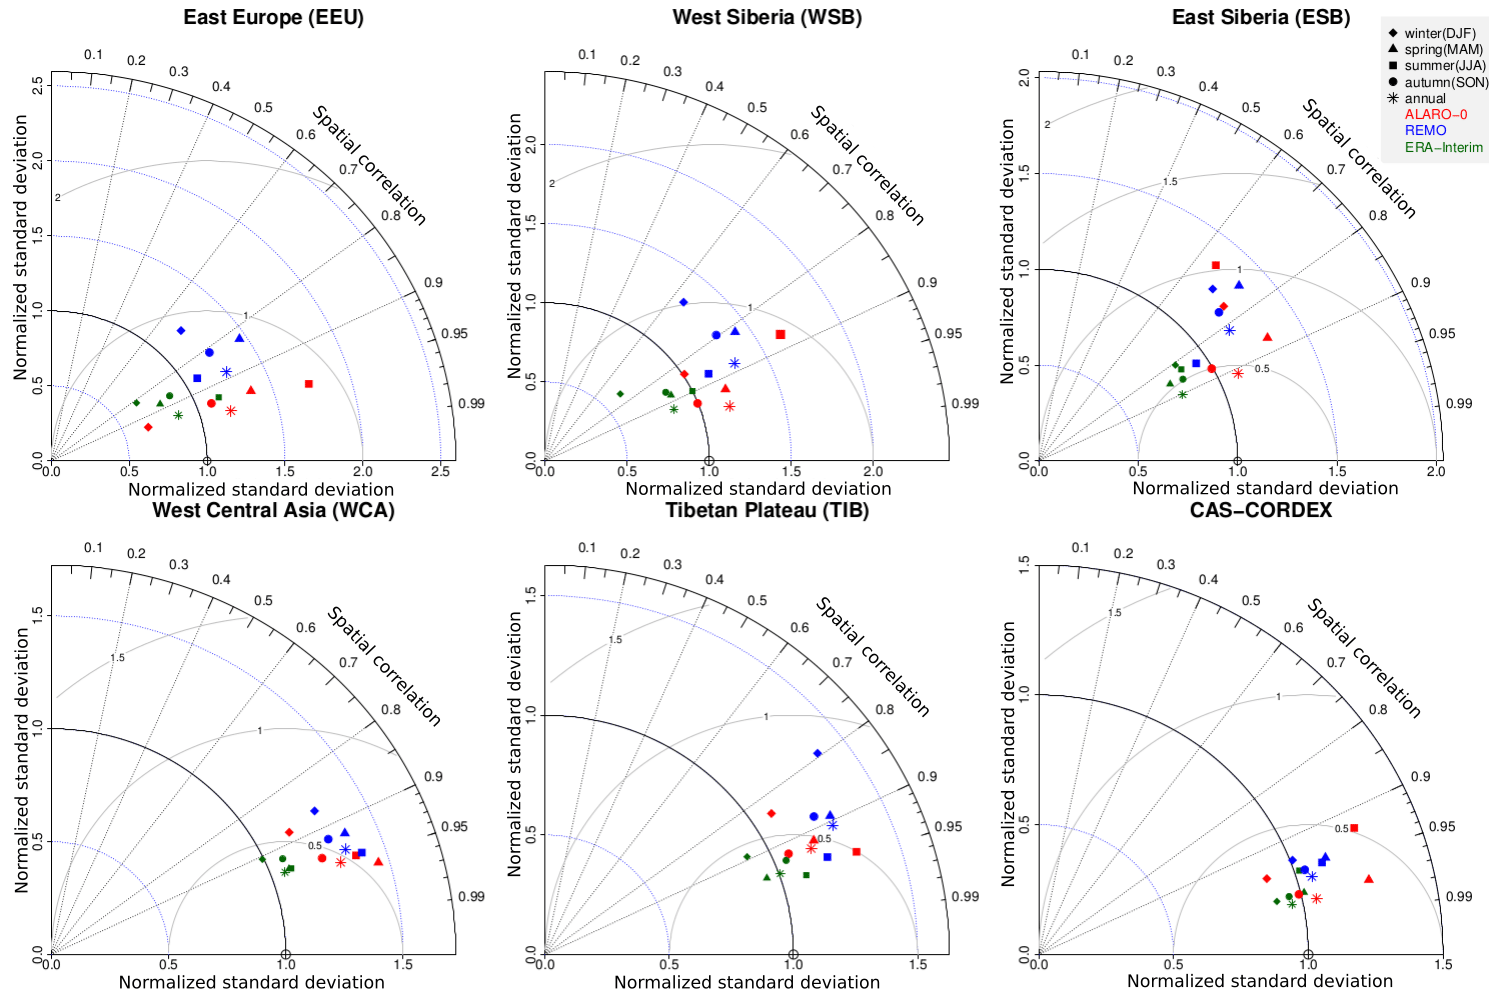
Figure 7Normalized Taylor diagram showing the model spatial performance of the minimum temperature for seasonal and annual means for both RCMs (ALARO-0 and REMO) and ERA-Interim reanalysis with respect to CRU for the five subregions and the complete CAS-CORDEX domain.
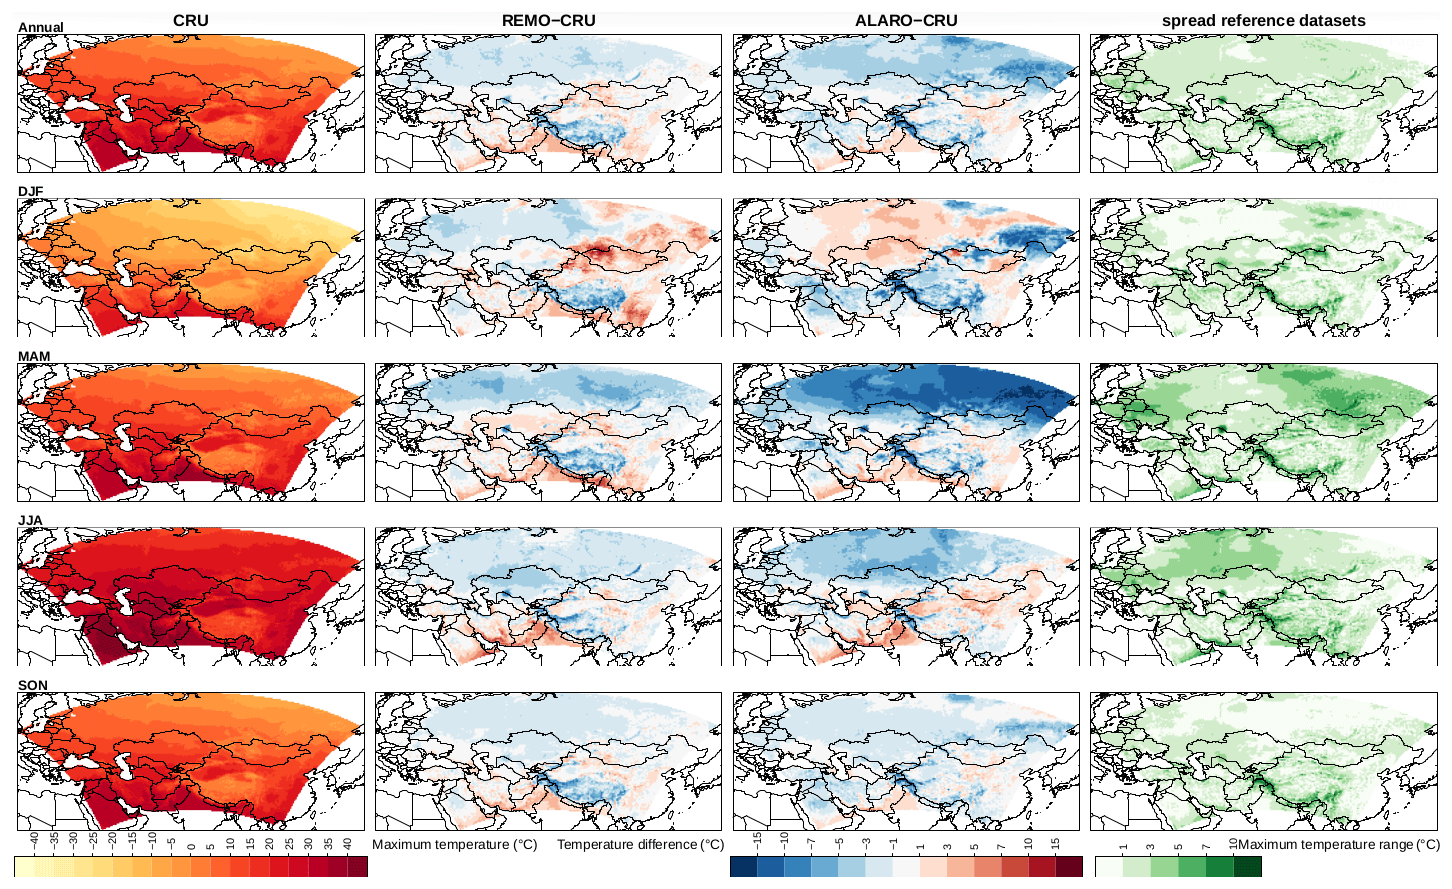
Figure 8Left column: maximum air temperature (∘C) at 2 m height over the CAS-CORDEX domain based on the observational CRU dataset for the 1980–2017 period on an annual level and for winter (DJF), spring (MAM), summer (JJA), and autumn (SON). Middle columns: difference in maximum temperature between the models and CRU. Right column: the range in maximum temperature (∘C) between the different reference datasets (CRU and ERA-Interim).
Biases in Fig. 8 and Table 4 show that for both RCMs a pronounced cold bias is present for maximum temperatures over the northern part of the domain at the annual scale and for all seasons, except for ALARO-0 in winter. During winter, ALARO-0 produces warm biases up to 5 ∘C in the north and cold biases in the southwest and northeast up to −15 ∘C, while REMO has cold biases up to −5 ∘C in the northwest and up to −15 ∘C on the Tibetan Plateau. ALARO-0 has the best performance over the EEU region during winter, while REMO has the best performance over the WCA subregion (Table 4 and Fig. 8). Both RCMs have a cold bias over a large area in the north during spring, which is very pronounced for the ALARO-0 model in the northeast (< −15 ∘C), while the biases remain limited to −7 ∘C for REMO (Fig. 8). The numbers in Table 4 confirm that during spring, the maximum temperature over the northern part of the domain deviates strongly (MAE > 2.50 ∘C) from CRU for both RCMs. During summer, these cold biases are reduced, with biases up to −5 ∘C for REMO and −10 ∘C for ALARO-0. Both models have warm and cold biases in the southern part of the domain during spring and summer. In autumn, the cold bias in the north is limited to −3 ∘C, but some stronger biases up to −7 ∘C appear in the northeast for the ALARO-0 model. The warm biases during autumn are limited to 5 ∘C, and, excluding the Himalayas, the smallest range in biases is obtained for both RCMs during this season. Based on the MAE in Table 4, both RCMs show the best performance for maximum temperature during autumn, except for REMO over the TIB subregion and ALARO-0 over the EEU region.
Table 4Spatial average over the CAS-CORDEX domain and subdomains of climatological mean CRU maximum temperature (∘C) for the 1980–2017 period, as well as biases (∘C) and MAE (∘C) against CRU for REMO, ALARO-0, and ERA-Interim.

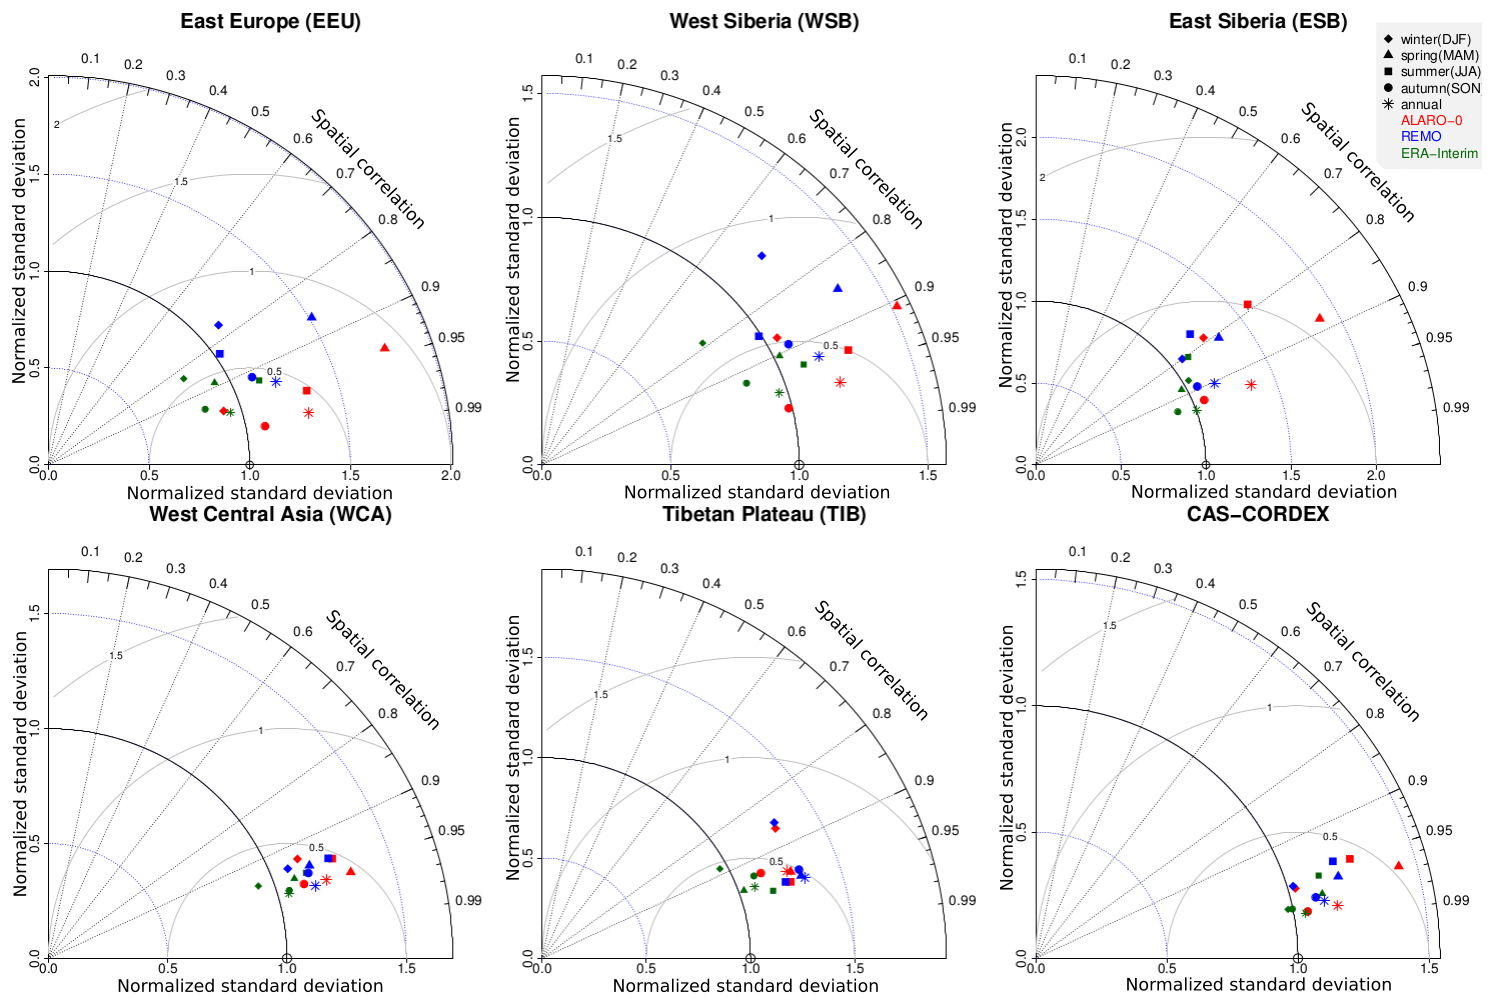
Figure 9Normalized Taylor diagram showing the model spatial performance in terms of the maximum temperature for seasonal and annual means for both RCMs (ALARO-0 and REMO) and ERA-Interim reanalysis with respect to CRU for the five subregions and the complete CAS-CORDEX domain.
Figure 9 shows that for all seasons, both RCMs have a high spatial correlation (> 90%) and a normalized RSV close to 1 for maximum temperature over the WCA subregion. This is also the case for the TIB subregion, excluding the winter season. ALARO-0 has a high spatial correlation over the EEU subregion during all seasons and over the WSB subregion except for winter. Both RCMs struggle the most with reproducing the spatial patterns over the ESB subregion. ALARO-0 has higher spatial pattern correlations with CRU compared to REMO, except for autumn over the TIB subregion and winter over the ESB and WCA subregions.
REMO more often has a normalized RSV value closer to 1 than ALARO-0 for the different subregions and seasons. Additionally, it is seen that both RCMs overestimate the normalized RSV of the maximum temperature for each subregion and season, except for winter in EEU and summer and autumn in WSB (Fig. 9). Based on Figs. 8 and 9, both RCMs simulate the maximum temperature best during autumn.
Finally, comparing the minimum to the maximum temperature, it can be seen that minimum temperature (Table 3 and Fig. 5) shows warmer biases than the mean temperature (Table 2 and Fig. 3) over the different seasons, except for winter in EEU and WSB and spring in WSB and TIB. On the other hand, the maximum temperature (Table 4 and Fig. 7) shows colder biases compared with the mean temperature, except for winter and spring in WCA and summer in TIB. The increased minimum temperatures obtained with the RCMs indicate that they do not capture the coldest diurnal temperatures, nor do they capture the warmest diurnal temperatures because of the decreased maximum temperatures. From this it can be concluded that the daily temperature range is generally underestimated by both RCMs.
Moreover, the annual cycles in Fig. 5 show that both minimum and maximum temperatures are overestimated by ALARO-0 during winter in the northern part of the domain, while they are underestimated during spring. In summer the model is able to evolve to a more accurate balanced state and to simulate spatially averaged minimum temperatures as they are observed, resulting in better model results during autumn. REMO overestimates the minimum temperatures during the complete annual cycle for ESB, while the maximum temperatures in ESB are only overestimated during winter and underestimated during spring and summer. Both RCMs underestimate the maximum temperatures of CRU for the entire annual cycle over the Tibetan Plateau subregion. ALARO-0 overestimates minimum temperatures during the summer months, while REMO slightly overestimates winter and underestimates summer minimum temperatures.
3.3 Precipitation
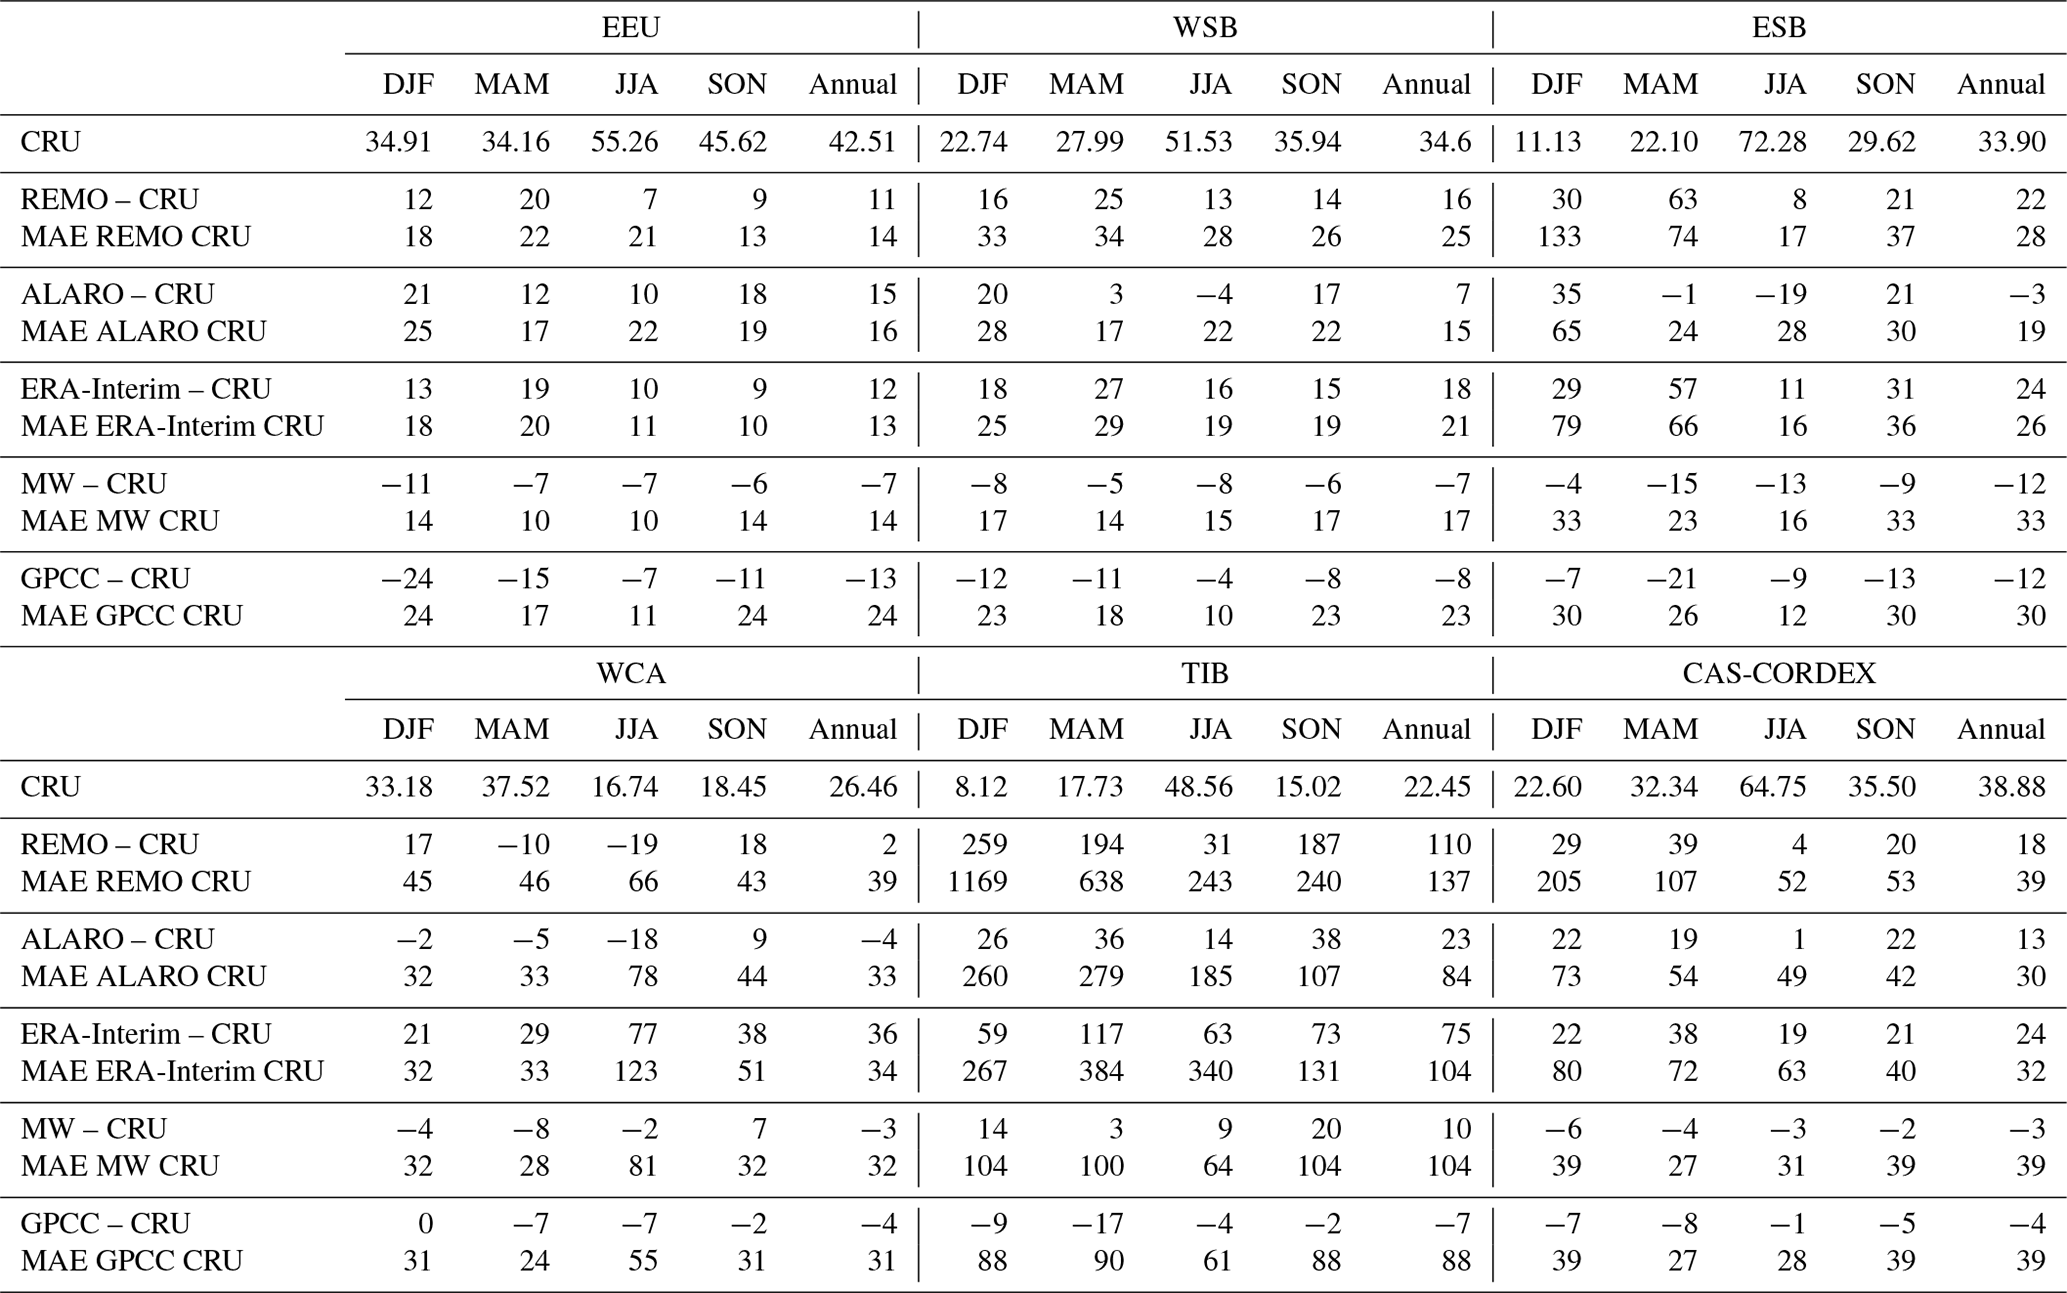
Figure 10 and Table 5 respectively present the spatial pattern of precipitation and the spatially averaged precipitation over the 1980–2017 period for CRU over the full domain and subregions; the relative biases and MAE of the RCMs with respect to CRU during the different seasons and on an annual level are presented as well.
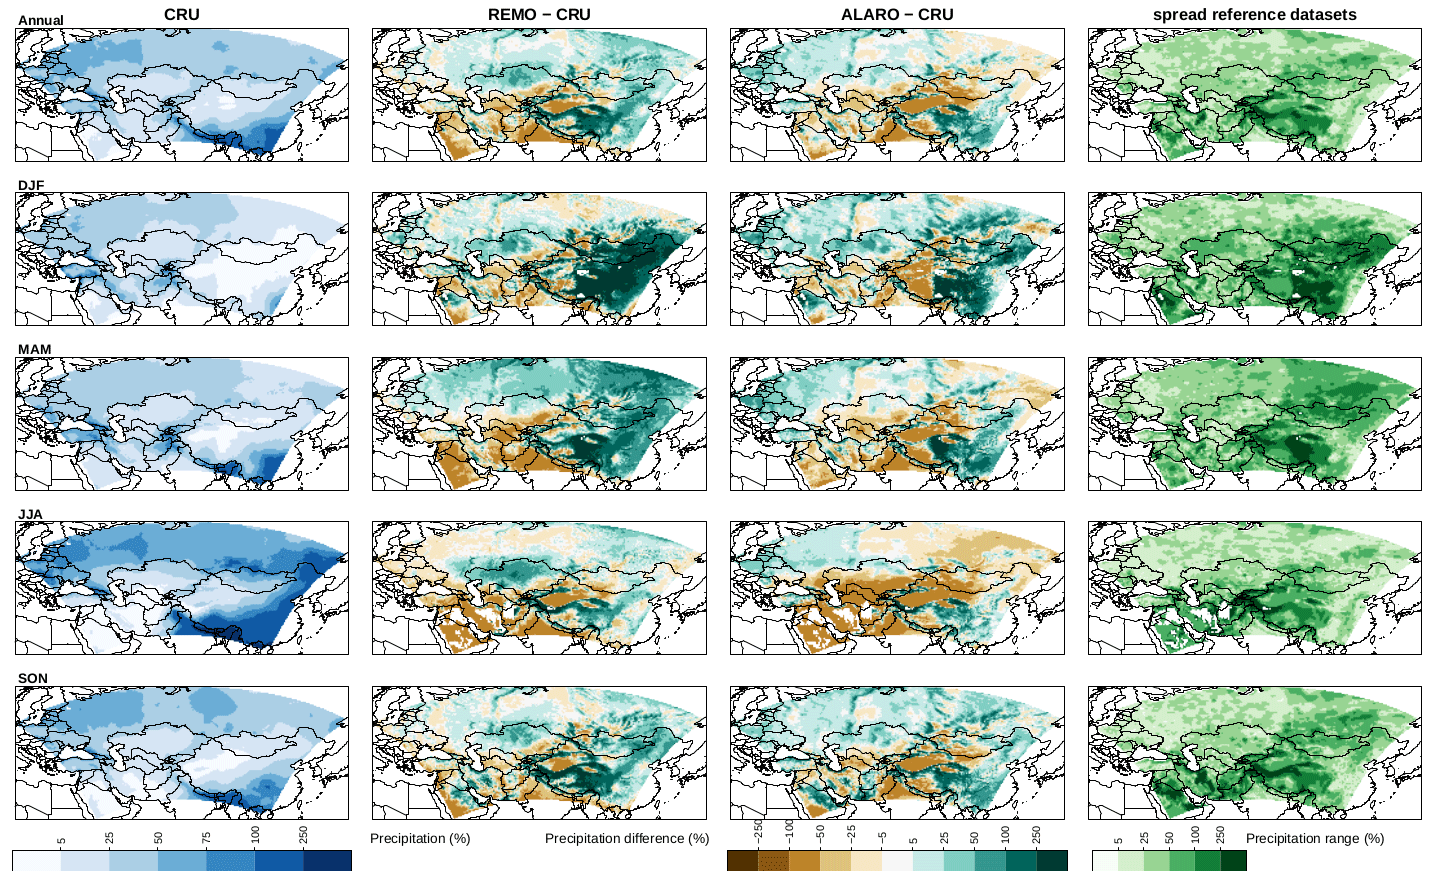
Figure 10Left column: mean monthly precipitation amounts (mm per month) over the CAS-CORDEX domain based on the observational CRU dataset for the 1980–2017 period on an annual level and for winter (DJF), spring (MAM), summer (JJA), and autumn (SON). Middle columns: relative difference between the average annual and seasonal CRU precipitation and the precipitation simulated by the models (%). Right column: the range in precipitation (%) between the different reference datasets (CRU, MW, GPCC, and ERA-Interim).
Table 5Climatological mean CRU precipitation (mm per month) for the 1980–2017 period over the CAS-CORDEX domain and subdomain, with relative biases (%) and MAE (%) against CRU for the RCMs (REMO and ALARO-0) and the other reference datasets (ERA-Interim, MW, and GPCC).
At the annual level, REMO mainly shows a wet bias in the northern and eastern part of the domain and a dry bias in the southwestern part of the domain, while ALARO-0 has a wet bias in the northwest and southeast (Fig. 10). Furthermore, a strong wet bias is persistent over the annual cycle for both RCMs over the East Asian monsoon region, with a less notable wet bias during summer.
For both RCMs the overall bias for precipitation is wet, except for spring and summer in the WCA subregion and for ALARO-0 during summer in WSB, winter in WCA, and spring and summer in the ESB subregion. Next to the wet biases in the monsoon region, both models show dry biases over the Taklamakan Desert, except for winter.
During winter both RCMs have a strong wet bias in the eastern part of the domain (Fig. 10 and Table 5). This is partly due to the low observed precipitation quantities in several regions, e.g., less than 5 mm per month in the Gobi Desert region. Some of the largest relative biases can be found in relatively dry regions, and therefore the absolute biases are presented in Fig. S4 and Table S2.
In spring, a clear wet bias is present for REMO over the complete northern part of the domain and for ALARO-0 over the northwestern part, while a strong dry bias is present in the southwestern part of the domain for both RCMs (Fig. 10). The wet bias for REMO over ESB during spring is low in absolute values when compared to the subregion TIB (Figs. 12 and S1). In summer, both RCMs have a dry bias over the southwestern part of the domain. The Taklamakan and Arabian deserts are located in these areas with a dry bias. In Fig. S4, the absolute dry biases over these regions are less pronounced (> −25 mm per month). The dry biases over the southwestern part of the domain result in spatially averaged negative biases for precipitation over the WCA subregion in spring and summer for both RCMs (Table 5). Additionally, a smaller relative wet bias is present over the East Asian monsoon region during summer compared to the other seasons (Fig. 10). This is related to the higher precipitation rates in the southeastern part of the domain during summer due to the East Asian monsoon. Moreover, both RCMs have a dry bias in the northern part of the domain during summer (Fig. S4). For REMO this dry bias is situated in the northwestern part of the domain, and for ALARO-0, a stronger dry bias is situated in the northeastern part of the domain, resulting in a significant dry bias over the ESB subregion (Table 5). Furthermore, the dry bias over the Taklamakan Desert is more pronounced in summer. In autumn, both RCMs mainly produce a wet bias over the CAS-CORDEX domain, excluding some areas with low precipitation rates that have dry biases, e.g., the Taklamakan Desert. In absolute numbers these dry biases are limited (> −25 mm per month).

Figure 11Normalized Taylor diagram showing the model performance in terms of precipitation for seasonal and annual means for both RCMs (ALARO-0 and REMO), gridded observational datasets (MW, GPCC), and the ERA-Interim reanalysis data with respect to CRU for the five subregions and the CAS-CORDEX domain.
From Fig. 11 it can be deduced that REMO is only able to reliably reproduce the precipitation over the TIB subregion during summer and not during the other seasons. Additionally, ALARO-0 better captures the spatial patterns since the correlations are larger than those for REMO, except for the summer precipitation over WCA. Despite the substantial ALARO-0 biases shown in Table 5 over most parts of the domain, the spatial patterns are thus well represented (Figs. 10 and 12). Both RCMs overestimate the variability in precipitation for all seasons and subregions, except for REMO in summer over WCA (Fig. 11). This excessive spatial variation is due to an overestimation of the precipitation in the wettest regions combined with an underestimation in the driest regions (Fig. 10).
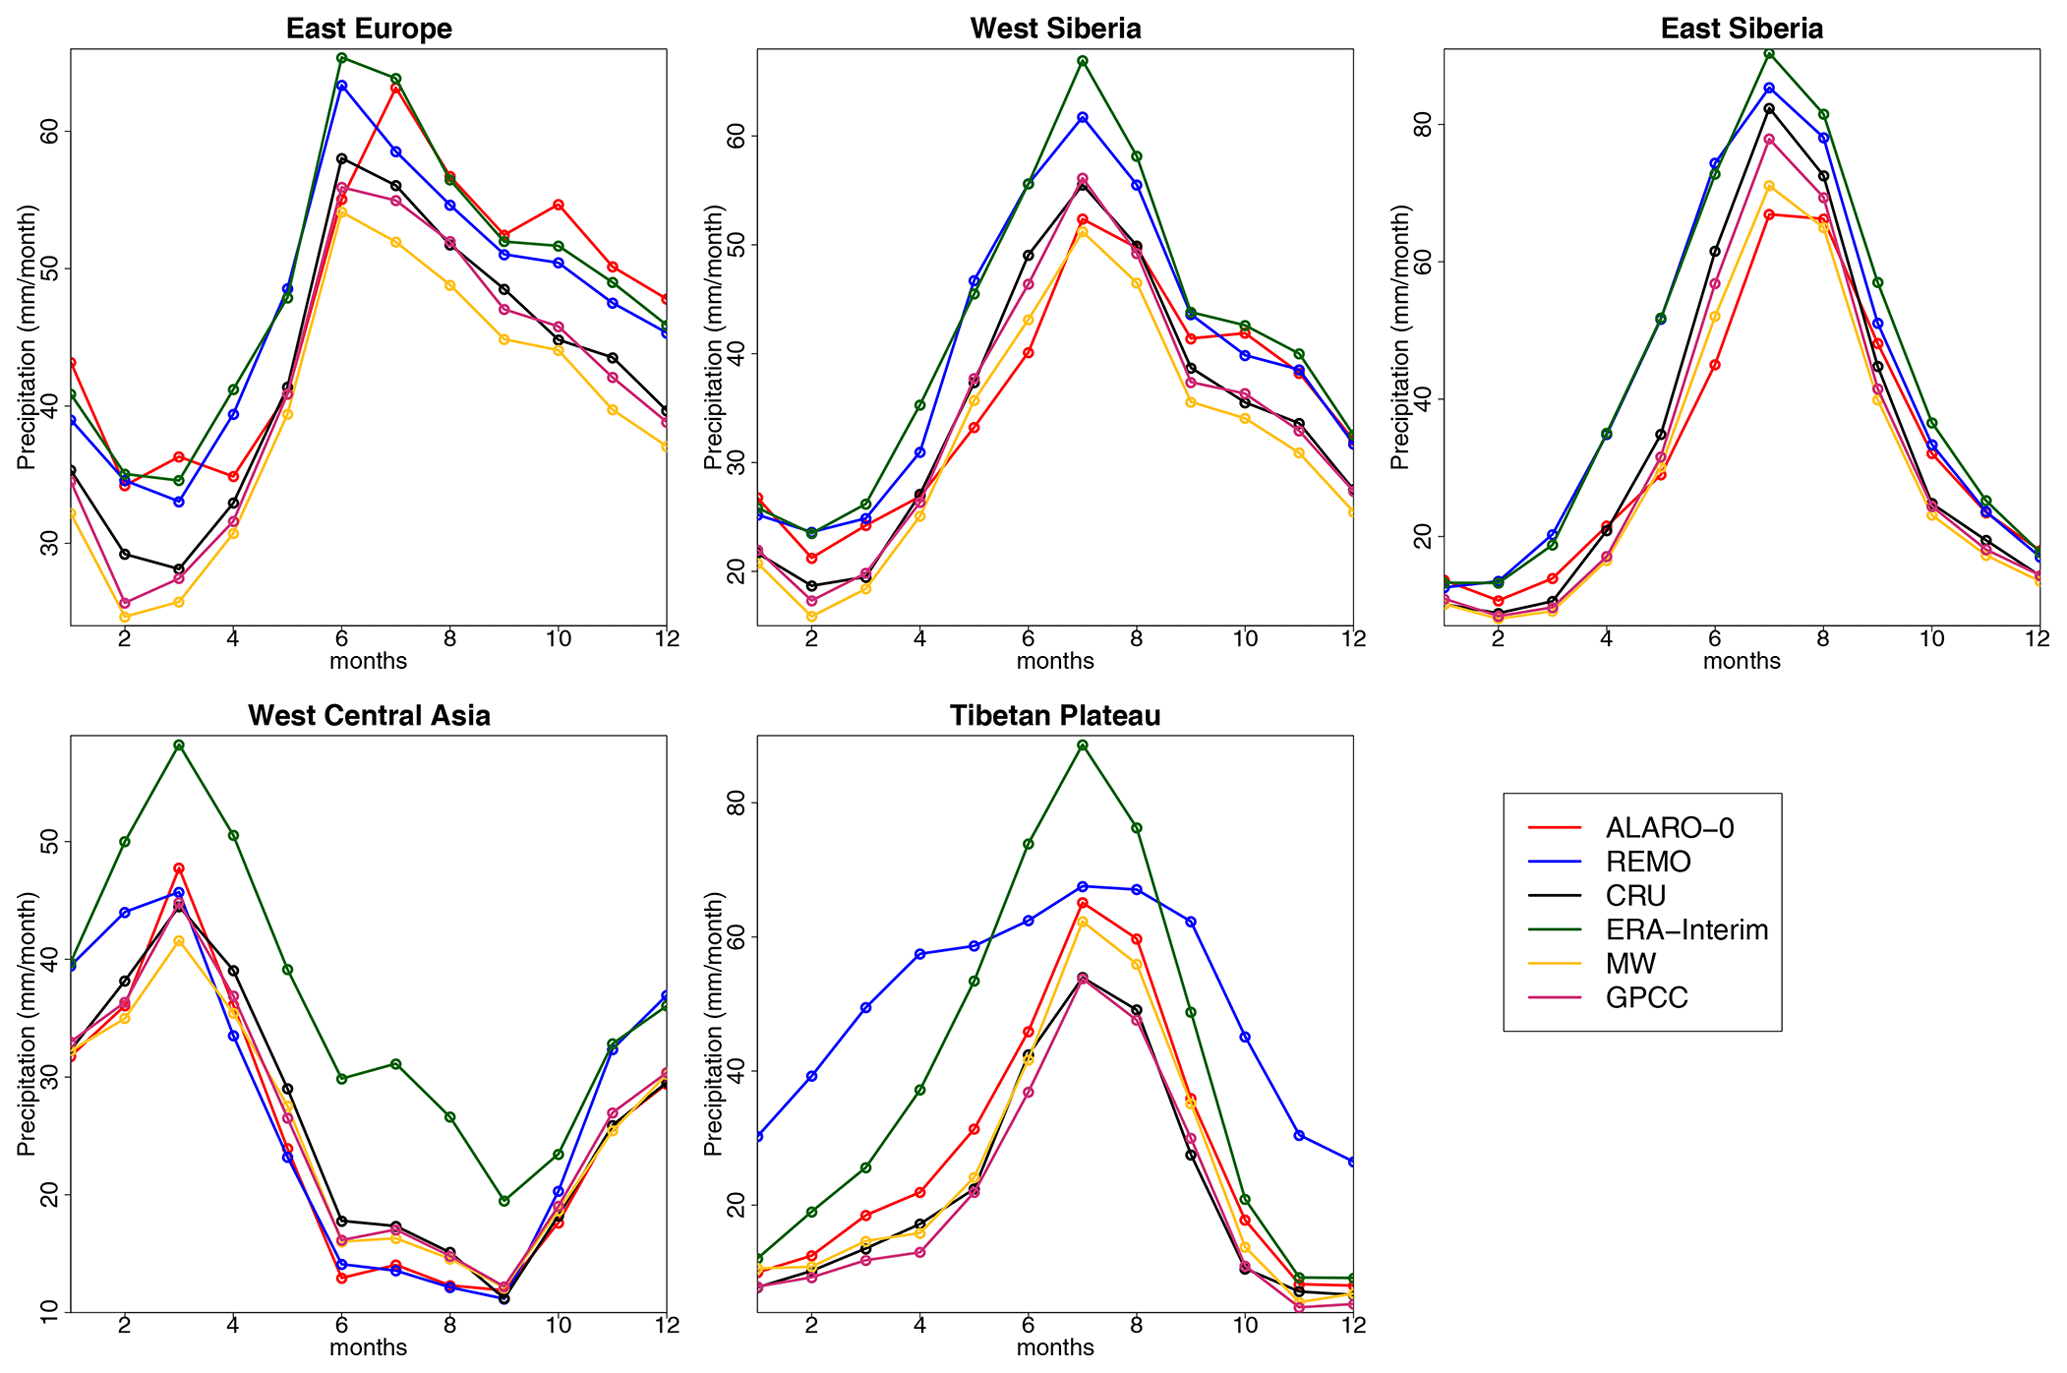
Figure 12Annual cycles of precipitation (mm per month) for both RCMs (ALARO-0 and REMO) compared to the ERA-Interim reanalysis, MW, GPCC, and CRU observational data over five subregions.
The annual cycles over the subregions show that ALARO-0 and REMO indeed mostly overestimate the precipitation values of CRU in the different subregions (Fig. 12). However, ALARO-0 does underestimate the precipitation slightly in May and June over WSB and in June and July over ESB. For the WCA subregion, both RCMs underestimate the precipitation in spring and summer. REMO slightly overestimates the precipitation over the ESB subregion in March and June. As mentioned before, it is seen that REMO is unable to simulate the annual cycle of precipitation correctly over the subregion of the Tibetan Plateau. The precipitation rates are too high, except during the summer when the Asian monsoon takes place. As seen in Fig. 12 and Table 5 the spatially averaged precipitation rate of REMO is slightly closer to the observations than ALARO-0 over the EEU subregion during winter and autumn. In addition, the annual cycle and MAE show that REMO better captures the precipitation over the ESB region than ALARO-0 during summer.
4.1 Temperature
4.1.1 Performance of ALARO-0 and REMO with respect to observational spread and other RCMs
When considering the temperature biases of the RCMs with respect to CRU, larger values are partly located in regions where the range of the different reference datasets is large (> 3 ∘C) (Fig. 3). Some regions where ALARO-0 and REMO show a bias over 3 ∘C also exhibit a spread of at least 3 ∘C between the reference datasets (CRU, MW, and ERA-Interim), resulting in an insignificant bias when compared to the spread (Figs. 3 and S1). This is, for example, the case over mountainous regions such as the Himalayas and Stanovoy Range, which makes the evaluation of the models less reliable over these mountainous regions. The observational temperature spread is larger for the ESB subregion compared to EEU and WSB, indicating there is larger uncertainty for temperature evaluation over ESB. Significant observational uncertainties are typical over complex orography, but this does not explain why there is larger uncertainty over the complete ESB subregion. New et al. (1999) mentioned that CRU contains colder temperatures in winter over Russia, which could explain this larger spread.
However, not all RCM biases are located within the spread of the reference datasets. For instance, the strong biases in the northeastern part of the domain for ALARO-0 during winter and spring exceed the spread in temperatures between the different reference datasets, indicating that ALARO-0 is not able to simulate the temperatures accurately over this region (Fig. S1). Furthermore, the smaller biases for both RCMs over EEU (< 3 ∘C) are not situated within the small (< 1∘) range of the reference datasets (Fig. S1). The biases over WSB are not within the range of the reference datasets either, except for ALARO-0 during autumn. Figure S1 shows that for the majority of grid points the mean temperatures of ALARO-0 and REMO lie within the range of spread between the reference datasets during autumn. From this we conclude that both RCMs simulate temperatures fairly well in autumn. During winter and spring none of the RCMs are able to reproduce temperatures that can be completely explained by the observational uncertainty over a large part of the CAS-CORDEX domain, while this is also the case for ALARO-0 during summer (Fig. 3 and Table 2).
When comparing the mean spatial biases and MAE for the 1980–2017 period (Table 2), it is seen that in most cases the differences between the observational datasets are smaller than the differences between the RCMs and CRU. However, the MAE and spatially averaged bias are smaller for both RCMs than for MW during autumn over the WSB subregion since both RCMs perform well over Kazakhstan, with grid points with biases between −1 and 1 ∘C. Moreover, REMO has lower MAE values than MW over the ESB subregion during summer and autumn and over the WCA subregion during winter. ALARO-0 has lower MAE values than MW during autumn over the TIB subregion.
The Taylor diagrams of temperature (Fig. 4) show that the normalized standard deviation of ERA-Interim and MW differs less from CRU than the RCMs, except for REMO over the EEU and ESB subregions during summer and for ALARO-0 over ESB during autumn as well as WSB and TIB during winter. This smaller difference between the reference datasets implies that the deviation in the spatial variation of temperature between the RCMs and CRU cannot be completely explained by the observational uncertainty, meaning that the data from the RCMs deviate from the observations and can be improved. The spatial correlations between CRU and ERA-Interim or MW are lower than or close to those between CRU and the RCMs for the subregions WCA and TIB, which indicates that the RCMs are able to reproduce the spatial temperature patterns within the range of observational uncertainty, even though they slightly deviate from the spatial temperature patterns in the CRU data. It is seen that the observed spatial patterns are less reliable during summer over the ESB subregion since the MW and ERA-Interim both show a lower spatial correlation (< 90 % for ERA-Interim) with CRU during summer compared to the other seasons. However, the lower spatial correlation of the RCMs during summer over the ESB subregion can only partly be explained by the observational uncertainty in the spatial correlation of temperatures.
Similar to our findings, Ozturk et al. (2016) reported a lower spatial correlation during summer over the complete CAS-CORDEX domain with RegCM4.3.5 at 0.50∘ horizontal resolution. Additionally, similarly high spatial correlations are obtained during the different seasons for ALARO-0 and REMO at 0.22∘ horizontal resolution when compared to the results of Ozturk et al. (2016). For summer temperatures, Russo et al. (2019) found that COSMO-CLM 5.0 produces a spatial pattern with a cold temperature bias in the north and warm biases in the southern part of the domain except for some locations on the Tibetan Plateau, which are similar to ALARO-0.
In general both ALARO-0 and REMO produce biases within a similar order of magnitude as those obtained with other RCMs over the CAS-CORDEX region (Russo et al., 2019) and Central Asian subregions (Wang et al., 2020; Zhu et al., 2020). Zhu et al. (2020) conducted model runs with different land cover schemes in the WRF model over a smaller domain than CAS-CORDEX containing Kazakhstan, Uzbekistan, Kyrgyzstan, Turkmenistan, and Tajikistan. None of their experiments produced biases over Kazakhstan as small as those of REMO in winter and at the annual level, while they obtained biases with different signs and similar magnitude in summer. However, it should be mentioned that they used the observational dataset from the Climate Prediction Center (CPC), which makes comparison difficult. ALARO-0 has biases with the same magnitude at the annual level as the WRF runs, but the absolute value of the biases is larger during winter and summer.
Similar to our findings, larger differences between temperatures of the reference datasets in the region of the Tibetan Plateau (Fig. 3) were also observed by Ozturk et al. (2012, 2016) and Russo et al. (2019), and this is partly due to the fact that observational gridded data, such as MW and CRU, are based on measurements from meteorological stations in the valleys (New et al., 1999). The gridded observations are thus less reliable over the Himalayas and Tibetan Plateau, creating larger observational uncertainty and resulting in large biases of the RCMs that lie within the range of observational uncertainty in most of the grid points (Fig. S1). Further, the amplification of the biases over mountainous regions for the RCMs can be attributed to the applied assumption of a lapse rate of 0.0064K̇ m−1 for the elevation correction (Kotlarski et al., 2014).
4.1.2 Spring and winter biases in northern subregions
In this section the temperature biases over snow-covered areas during winter and spring will be explained. As mentioned in the previous sections, both RCMs have large temperature biases in the northern part of the domain that are not within the range of the reference datasets during winter and spring (Fig. S1). During winter, ALARO-0 simulates warm biases over the northern part of the domain and REMO simulates cold biases over the northwestern part of the domain, while in spring they both show a cold bias over the north (Figs. 3 and 5).
Compared to the northern part in the CAS-CORDEX region, a similar warm bias during winter was found over Scandinavia in the EURO-CORDEX runs, with ALARO-0 (Giot et al., 2016). Both regions have a similar climate which suggests that similar physical processes might be at the basis of these biases (Jacob et al., 2012; Remedio et al., 2019). The warm bias during winter and cold bias during spring in the northeastern part of the domain for ALARO-0 are not due to a temporal shift in the annual cycle in the northern part of the domain, although there is a delay in warming temperatures during spring. A limited warm bias arises in the north during autumn, when the first snow cover appears over this region (Fig. 5). This bias increases when the snow-covered region expands (not shown). ALARO-0 seems to underestimate cooling above snow cover during stable conditions. Mašek (2017) linked exceedingly warm temperatures above snow to the single-layer snow scheme that was used (Douville et al., 1995). REMO uses a multi-layer snow scheme and does not encounter this problem.
A similar strong warm bias in the north, as found for ALARO-0 in winter, was also found by Ozturk et al. (2012) and Russo et al. (2019) for the RegCM and COSMO-CLM 5.0 models, respectively. Ozturk et al. (2012) related this warm bias to shortcomings in the simulation of snow, whereas Russo et al. (2019) found that changes in the snow scheme did not affect the simulation results significantly and did not reduce the warm bias in the northeast during winter. This shows that a more complex multi-layer snow scheme might not be enough to solve the warm bias for ALARO-0 during winter. Therefore, further investigation should be done to see whether the warm bias in winter over the northern part of the domain is due to the inability of the current snow scheme to reproduce the heat conductivity of snow.
In spring, the warm temperature bias of the ALARO-0 simulation over the northern subregion evolves into a significant cold bias. This remarkable evolution is probably related to another issue connected to the snow scheme as we find a delay in the springtime melting of the snowpack (not shown). Additionally, ALARO-0 simulates exceedingly high pressure values over the northern area (not shown). Further research is needed to clarify whether this overestimation of the Siberian High in the ALARO-0 simulations is related to the difficulties with the snow cover.
The cold bias for REMO during winter over the EEU subregion is likely due to the surface treatment of the model when there is snow (Pietikäinen et al., 2018). Pietikäinen et al. (2018) reported that the thermodynamics of the snow layer play an important role in the cold bias that appears over eastern Europe during the months when snow cover is present.
4.2 Diurnal temperature range
Similar to the mean temperature the observational spread for minimum and maximum temperature is larger in the orographically complex regions (Figs. 6 and 8). ALARO-0 and REMO are not able to reproduce the minimum and maximum temperature since they produce biases that are outside this significant observational range (e.g., the range for maximum temperature is 5 to 7 ∘C in the northeastern part of the domain in spring) (Figs. S2 and S3). However, during summer REMO simulates minimum and maximum temperatures within the observational range over western Russia. The MAE of REMO for minimum and maximum temperatures is acceptable during summer over the EEU and WSB subregions since the MAE between ERA-Interim and CRU is larger than the MAE between REMO and CRU (Tables 3 and 4). Moreover, the MAE of REMO for maximum temperature is lower than the MAE of ERA-Interim over the WCA subregion, indicating that REMO is able to produce maximum temperatures over this subregion within the range of the reference datasets.
Both RCMs generally produce a smaller daily temperature range, resulting in biases that are generally warmer for the minimum temperature and colder for the maximum temperature when compared to those of the mean temperature (Figs. 3, 6, and 8 and Tables 2, 3, and 4). The smaller daily temperature range causes a stronger warm bias in winter for the minimum temperature and a stronger cold bias for maximum temperature in spring, which is notably visible in the northern part of the domain for the ALARO-0 model (Figs. 3, 6, and 8 and Tables 2, 3, and 4). Additionally, it is seen that the cold bias in the north during spring for the ALARO-0 model is weaker for the minimum temperature than for the mean temperature, while REMO shows warmer biases over Mongolia during winter and spring for minimum temperature and colder biases in maximum temperature in the north during spring when compared to the mean temperature. Moreover, the smaller daily temperature range causes larger MAE scores for minimum temperature during winter and for maximum temperature during spring, except for ALARO-0 over the WCA and TIB subregion (Tables 3 and 4). This indicates that minimum temperatures are less accurately simulated by both RCMs compared to temperature during winter, while maximum temperatures are simulated less accurately during spring.
The underestimation of the diurnal range is similar to the findings over other regions (Laprise et al., 2003; Kyselý and Plavcová, 2012) and was also observed over the CAS-CORDEX domain by Russo et al. (2019). Their RCM produced smaller diurnal ranges compared to different observational datasets. In particular, ALARO-0 shows a smaller range in the diurnal cycle of temperatures due to very high minimum temperatures (Fig. 5), and this could be due to the inability of the model to simulate temperatures correctly over snow cover during stable conditions (Mašek, 2017).
Although the magnitude of the biases is different for mean, minimum, and maximum temperature, similar spatial patterns are found in the biases of both RCMs over the different seasons and for the annual mean (Figs. 3, 6, and 8). This means that these variables are spatially highly correlated with each other in both models and observations. Additionally, both minimum and maximum temperatures have a similar temporal pattern as the mean temperature (Fig. 5).
The metrics in Figs. 7 and 9 show that spatial pattern correlations of ERA-Interim deviate more from CRU for minimum and maximum temperature compared to mean temperature (Fig. 4). This larger uncertainty makes it harder to draw sound conclusions from the lower spatial pattern correlations of ALARO-0 and REMO.
The evaluation of temperature and its diurnal cycle shows that a bias adjustment is essential before the climate data are applied in impact modeling. However, REMO simulates mean and maximum temperatures well over the WCA subregion when the observational range is taken into account.
4.3 Precipitation
Compared to the RegCM4.3.5 model (Ozturk et al., 2016) ALARO-0 has lower RMSEs over all seasons and REMO has higher RMSEs, excluding summer (Fig. 11). The spatial correlations between CRU and REMO are similar to the values obtained with RegCM4.3.5, except for winter when REMO has a higher spatial correlation (Fig. 11). ALARO-0 obtains higher values for the spatial correlations, and they are close to those of the other observational datasets.
For the majority of the grid points, the precipitation of ALARO-0 and REMO is situated within the spread of the different gridded datasets for all seasons (Fig. S5). However, there are some subregions where the precipitation of ALARO-0 and/or REMO exceeds the observational spread during one or more seasons. For example, both RCMs show slightly lower precipitation amounts in summer over the WCA subregion compared to the different reference datasets (Figs. 12 and S5). Additionally, the overestimation in precipitation by both RCMs in the East Asian monsoon region exceeds the observational spread, especially in winter and spring for REMO and in spring and autumn for ALARO-0, indicating that the models do not completely capture the East Asian monsoon system. Moreover, the ALARO-0 model overestimates the precipitation significantly over the EEU subregion during all seasons when compared to the spread of the reference datasets (Figs. S5 and 12).
Ozturk et al. (2012) and Russo et al. (2019) obtained similar seasonal patterns in precipitation, with their model simulations at a horizontal resolution of 0.50 and 0.22∘, respectively. For example, an extreme excess of precipitation was simulated over the East Asian monsoon region, with a smaller relative wet bias in summer. Additionally, they obtained a dry bias in summer over the western part of the domain, which is similar for REMO, while ALARO-0 shows only a dry bias in the southwestern part of the domain. Moreover, ALARO-0 produces a dry bias over the northeastern part of the domain during summer, while this is not the case for the other RCMs (REMO, COSMO-CLM 5.0, and RegCM4.0) (Ozturk et al., 2012; Russo et al., 2019). The underestimation in precipitation by ALARO-0 during spring and summer in the northeastern part of the domain might be related to the Siberian High that remains too strong (not shown).
Table 5 and Fig. 12 show that, on average, CRU contains higher precipitation amounts than the two other observational datasets, MW and GPCC. As mentioned before, it is known that the MW and GPCC datasets generally underestimate the seasonal precipitation over Central Asia, especially during spring for the central part of the CAS-CORDEX domain (Hu et al., 2018).
The overestimation of the annual precipitation by the RCMs over the Himalaya, Altay, Tian Shan, and Kunlun mountains is partly due to the fact that the gridded observational datasets CRU, MW, and GPCC underestimate the precipitation over these mountainous regions. It is known that the accuracy of gridded precipitation datasets decreases with elevation, especially over an altitude of 1500 m (Zhu et al., 2015). By contrast, ERA-Interim generally overestimates the precipitation, particularly over mountainous regions (Sun et al., 2018). Moreover, a similar pattern of an underestimation by gridded observational datasets and overestimation by reanalysis data is present over the Tibetan Plateau (Sun et al., 2018), causing larger biases (Figs. 10 and 12). The discrepancy between the observational gridded datasets and the ERA-Interim reanalysis data (Figs. 10 and 12) explains why the strong wet biases of the RCMs compared to CRU over mountainous areas and the Tibetan Plateau are not significant (Fig. S5). The pronounced difference between the observational and reanalysis datasets makes it difficult to draw sound conclusions over these regions.
Even when taking into account the large spread between the reference datasets, REMO is not able to reproduce the annual cycle of precipitation over the Asian monsoon region. Remedio et al. (2019) also found a wet bias for REMO at the annual level over the subtropical region where the Asian monsoon takes place.
In the north, the precipitation amounts of REMO bear more resemblance to those of ERA-Interim and COSMO-CLM 5.0 described by Russo et al. (2019) (Fig. S8). This similarity is probably due to the fact that they all use a convection scheme that is based on Tiedtke (1989) (Table S1; https://www.ecmwf.int/, ECMWF, 2020), while ALARO-0 uses the 3MT cloud microphysics scheme.
It can be concluded that for the different subregions and seasons, REMO and ALARO-0 simulated precipitation mostly within the range of the observational spread, although it should be mentioned that the observational uncertainty is large. MW, GPCC, and ERA-Interim deviate more from CRU than was the case for temperature, resulting in larger observational uncertainty for precipitation. Russo et al. (2019) additionally showed that the influence of observational datasets on the RSV is larger for precipitation than for temperature. Moreover, both models are worse in simulating the spatial correlation of precipitation (Fig. 11) compared to the mean, minimum, and maximum temperature (Figs. 4, 7, and 9). This lower correlation is due to the fact that precipitation is less systematically affected by land cover and topography compared to temperature (Kotlarski et al., 2014). Furthermore, the uncertainty range and error in the observational products should be reduced in the future to improve the evaluation of precipitation (Russo et al., 2019).
The evaluation over the CAS-CORDEX domain of ALARO-0 and REMO, run at 0.22∘ resolution, showed that in general both RCMs reproduced realistic spatial patterns for temperature since there is a high spatial correlation with observational data. Additionally, the values of spatial variation for mean temperature from both RCMs correspond closely to the values obtained with other reference datasets. When evaluating the modeled precipitation, poorer scores were obtained for these metrics, but the spread between the different observational datasets is also larger for precipitation compared to temperature.
Both RCMs performed best during autumn for temperature and precipitation, showing biases within the range of the observational uncertainty for the majority of the CAS-CORDEX domain. Nevertheless, there are significant biases in several regions during several seasons, e.g., a warm bias in the north during winter and a wet bias over the Asian monsoon region. For ALARO-0 the northern part of the CAS-CORDEX domain is subject to significant positive temperature biases in winter, followed by large negative temperature biases in spring. This behavior is probably linked to limitations of the used snow scheme. REMO produced excessive precipitation amounts over the Tibetan Plateau subregion during all seasons and incorrectly simulated the annual cycle of the East Asian monsoon system. In general, REMO was better than ALARO-0 in reproducing the seasonal mean temperatures, except during autumn, whereas ALARO-0 estimated the precipitation well.
Additionally, the evaluation of minimum and maximum temperatures showed that the RCMs underestimate the daily temperature range. This illustrates the added value of taking more evaluation variables into account than only the commonly evaluated variables mean temperature and precipitation.
We conclude that REMO and ALARO-0 can be used for climate modeling over Central Asia, e.g., for precipitation and temperature over western Central Asia. However, the deficiencies of both models over Central Asia described in this evaluation study should be kept in mind. Climate data produced by both RCMs can only be used for impact studies if a suitable bias adjustment is applied for subregions where the RCMs perform less well, e.g., temperature over eastern Siberia and precipitation over the Tibetan Plateau.
The R code used for the analysis is available through https://doi.org/10.5281/zenodo.3659717 (Top et al., 2020).
For the code of the ALARO-0 model we refer to the “Code availability” section in Termonia et al. (2018a). More information about REMO is available on request by contacting the Climate Service Center Germany (contact@remo-rcm.de).
The climate data produced by ALARO-0 and REMO2015 have been uploaded to the ESGF data nodes (website: http://esgf.llnl.gov/, last access: 7 July 2020). In order to obtain the data, one of the nodes must be chosen. Thereafter, click on “CORDEX” or search for “CORDEX”, and then select the domain “CAS-22” and the RCM in the left column. The exact identifiers can be found in Table S3 of the Supplement.
The CRU TS Version 4.02 data created by the Climatic Research Unit, University of East Anglia are available through https://crudata.uea.ac.uk/cru/data/hrg/cru_ts_4.02/ (last access: 3 March 2021; Harris et al., 2020). The MW data are freely available at http://climate.geog.udel.edu/~climate/html_pages/download.html (last access: 3 March 2021; Matsuura and Willmott, 2018), and NetCDF files can be found here: https://www.esrl.noaa.gov/psd/data/gridded/data.UDel_AirT_Precip.html (Matsuura and Willmott, 2018) (air.mon.mean.v501.nc and precip.mon.total.v501.nc) provided by the NOAA/OAR/ESRL PSL, Boulder, Colorado, USA. The GPCC data can be accessed through https://doi.org/10.5676/DWD_GPCC/FD_M_V2018_025 (Schneider et al., 2018).
The supplement related to this article is available online at: https://doi.org/10.5194/gmd-14-1267-2021-supplement.
SC, LDC, RDT, LK, AK, and ARR performed modeling and simulations. LDC, RDT, LK, AK, and ARR were responsible for post-processing. LK and ST produced the visualization. ST wrote the original draft. SA, LB, SC, LDC, PDM, RDT, NG, AG, RH, AK, LK, ARR, AS, PT, ST, HVDV, BVS, and VZ participated in writing, review, and editing. SC, PDM, and PT were responsible for supervision. SA, LB, PDM, AG, LK, and PT acquired funding.
The authors declare that they have no conflict of interest.
The computational resources and services for the ALARO-0 regional climate simulations were provided by the Flemish Supercomputer Center (VSC), funded by the Research Foundation – Flanders (FWO) and the Flemish Government department EWI. The CORDEX-CORE REMO simulations were performed under the GERICS/HZG share at the German Climate Computing Centre (DKRZ).
We would like to thank Ján Mašek for his insights on the warm bias above snow cover.
We are grateful for the remarks and suggestions of the anonymous reviewers and topical editor, which improved the paper substantially.
This research has been supported by the ERA.Net RUS Plus Initiative (grant no. ID 166). Ghent University and VITO received funding from the Research Foundation Flanders (FWO, grant no. G0H6117N). HZG-GERICS received funding from the Federal Ministry of Education and Research (BMBF). NIERSC received funding from the Russian Foundation for Basic Research (RFBR, grant no. 18-55-76004). LEGMC received funding from the State Education Development Agency (SEDA). ISTE received funding from the scientific and technological research council of Turkey (TUBITAK) (grant no. 2017O394).
This paper was edited by Fabien Maussion and reviewed by three anonymous referees.
Akperov, M., Rinke, A., Mokhov, I. I., Matthes, H., Semenov, V. A., Adakudlu, M., Cassano, J., Christensen, J. H., Dembitskaya, M. A., Dethloff, K., and Fettweis, X.: Cyclone activity in the Arctic from an ensemble of regional climate models (Arctic CORDEX), J. Geophys. Res.-Atmos., 123, 2537–2554, https://doi.org/10.1002/2017JD027703, 2018.
ALADIN International Team: The ALADIN project: Mesoscale modelling seen as a basic tool for weather forecasting and atmospheric research, WMO bull., 46, 317–324, 1997.
Almazroui, M., Islam, M. N., Alkhalaf, A. K., Saeed, F., Dambul, R., and Rahman, M. A.: Simulation of temperature and precipitation climatology for the CORDEX-MENA/Arab domain using RegCM4, Arab. J. Geosci., 9, 13, https://doi.org/10.1007/s12517-015-2045-7, 2016.
Bucchignani, E., Mercogliano, P., Panitz, H. J., and Montesarchio, M.: Climate change projections for the Middle East–North Africa domain with COSMO-CLM at different spatial resolutions, Advances in Climate Change Research, 9, 66–80, https://doi.org/10.1016/j.accre.2018.01.004, 2018.
Cabos, W., Sein, D. V., Durán-Quesada, A., Liguori, G., Koldunov, N. V., Martínez-López, B., Alvarez, F., Sieck, K., Limareva, N., and Pinto, J.G.: Dynamical downscaling of historical climate over CORDEX Central America domain with a regionally coupled atmosphere–ocean model, Clim. Dynam., 52, 4305–4328, https://doi.org/10.1007/s00382-018-4381-2, 2019.
Collins, M., AchutaRao, K., Ashok, K., Bhandari, S., Mitra, A. K., Prakash, S., Srivastava, R., and Turner, A.: Observational challenges in evaluating climate models, Nat. Clim. Change, 3, 940–941, https://doi.org/10.1038/nclimate2012, 2013.
CORDEX Scientific Advisory Team: The WCRP CORDEX Coordinated Output for Regional Evaluations (CORE) Experiment Guidelines, available at: http://www.cordex.org/experiment-guidelines/cordex-core, last access: 1 March 2019.
Davies, H. C.: A lateral boundary formulation for multi-level prediction models, Q. J. Roy. Meteor. Soc., 102, 405–418, https://doi.org/10.1002/qj.49710243210, 1976.
Dee, D. P., Uppala, S. M., Simmons, A. J., Berrisford, P., Poli, P., Kobayashi, S., Andrae, U., Balmaseda, M. A., Balsamo, G., Bauer, P., Bechtold, P., Beljaars, A. C., van de Berg, L., Bidlot, J., Bormann, N., Delsol, C., Dragani, R., Fuentes, M., Geer, A. J., Haimberger, L., Healy, S. B., Hersbach, H., Hólm, E. V., Isaksen, L., Kållberg, P., Köhler, M., Matricardi, M., Mcnally, A. P., Monge-Sanz, B. M., Morcrette, J. J., Park, B. K., Peubey, C., de Rosnay, P., Tavolato, C., Thépaut, J. N., and Vitart, F.: The ERA-Interim reanalysis: Configuration and performance of the data assimilation system, Q. J. Roy. Meteor. Soc., 137, 553–597, https://doi.org/10.1002/qj.828, 2011.
Denis, B., Laprise, R., Caya, D., and Côté, J.: Downscaling ability of one-way nested regional climate models: the Big-Brother Experiment, Clim. Dynam., 18, 627–646, https://doi.org/10.1007/s00382-001-0201-0, 2002.
De Troch, R., Hamdi, R., Van de Vyver, H., Geleyn, J. F., and Termonia, P.: Multiscale performance of the ALARO-0 model for simulating extreme summer precipitation climatology in Belgium, J. Climate, 26, 8895–8915, https://doi.org/10.1175/JCLI-D-12-00844.1, 2013.
Diaconescu, E. P., Gachon, P., Laprise, R., and Scinocca, J. F.: Evaluation of precipitation indices over North America from various configurations of regional climate models, Atmos.-Ocean, 54, 418–439, https://doi.org/10.1080/07055900.2016.1185005, 2016.
Di Virgilio, G., Evans, J. P., Di Luca, A., Olson, R., Argüeso, D., Kala, J., Andrys, J., Hoffmann, P., Katzfey, J. J., and Rockel, B.: Evaluating reanalysis-driven CORDEX regional climate models over Australia: model performance and errors, Clim. Dynam., 53, 2985–3005, https://doi.org/10.1007/s00382-019-04672-w, 2019.
Douville, H., Royer, J.-F., and Mahfouf, J.-F.: A new snow parameterization for the Meteo-France climate model, Clim. Dynam., 12, 21–35, 1995.
ECMWF: Atmospheric physics, available at: https://www.ecmwf.int/en/research/modelling-and-prediction/atmospheric-physics, last access: 7 July 2020.
Fuentes-Franco, R., Coppola, E., Giorgi, F., Pavia, E. G., Diro, G. T., and Graef, F.: Inter-annual variability of precipitation over Southern Mexico and Central America and its relationship to sea surface temperature from a set of future projections from CMIP5 GCMs and RegCM4 CORDEX simulations, Clim. Dynam., 45, 425–440, https://doi.org/10.1007/s00382-014-2258-6, 2015.
Gerard, L., Piriou, J. M., Brožková, R., Geleyn, J. F., and Banciu, D.: Cloud and precipitation parameterization in a meso-gamma-scale operational weather prediction model, Mon. Weather Rev., 137, 3960–3977, https://doi.org/10.1175/2009MWR2750.1, 2009.
Ghimire, S., Choudhary, A., and Dimri, A. P.: Assessment of the performance of CORDEX-South Asia experiments for monsoonal precipitation over the Himalayan region during present climate: part I, Clim. Dynam., 50, 2311–2334, https://doi.org/10.1007/s00382-015-2747-2, 2018.
Gibson, P. B., Waliser, D. E., Lee, H., Tian, B., and Massoud, E.: Climate model evaluation in the presence of observational uncertainty: precipitation indices over the Contiguous United States, J. Hydrometeorol., 20, 1339–1357, 2019.
Giorgi, F. and Gutowski Jr, W. J.: Regional dynamical downscaling and the CORDEX initiative, Annu. Rev. Env. Resour., 40, 467–490, 2015.
Giorgi, F. and Mearns, L. O.: Introduction to special section: Regional climate modeling revisited, J. Geophys. Res., 104, 6335–6352, https://doi.org/10.1029/98JD02072, 1999.
Giorgi, F., Jones, C., and Asrar, G. R.: Addressing climate information needs at the regional level: the CORDEX framework, World Meteorological Organization (WMO) Bulletin, 58, 175–183, 2009.
Giot, O., Termonia, P., Degrauwe, D., De Troch, R., Caluwaerts, S., Smet, G., Berckmans, J., Deckmyn, A., De Cruz, L., De Meutter, P., Duerinckx, A., Gerard, L., Hamdi, R., Van den Bergh, J., Van Ginderachter, M., and Van Schaeybroeck, B.: Validation of the ALARO-0 model within the EURO-CORDEX framework, Geosci. Model Dev., 9, 1143–1152, https://doi.org/10.5194/gmd-9-1143-2016, 2016.
Gómez-Navarro, J., Montávez, J., Jerez, S., Jiménez-Guerrero, P., and Zorita, E.: What is the role of the observational dataset in the evaluation and scoring of climate models?, Geophys. Res. Lett., 39, L24701, https://doi.org/10.1029/2012GL054206, 2012.
Gutowski Jr., W. J., Giorgi, F., Timbal, B., Frigon, A., Jacob, D., Kang, H.-S., Raghavan, K., Lee, B., Lennard, C., Nikulin, G., O'Rourke, E., Rixen, M., Solman, S., Stephenson, T., and Tangang, F.: WCRP COordinated Regional Downscaling EXperiment (CORDEX): a diagnostic MIP for CMIP6, Geosci. Model Dev., 9, 4087–4095, https://doi.org/10.5194/gmd-9-4087-2016, 2016.
Haarsma, R. J., Roberts, M. J., Vidale, P. L., Senior, C. A., Bellucci, A., Bao, Q., Chang, P., Corti, S., Fučkar, N. S., Guemas, V., von Hardenberg, J., Hazeleger, W., Kodama, C., Koenigk, T., Leung, L. R., Lu, J., Luo, J.-J., Mao, J., Mizielinski, M. S., Mizuta, R., Nobre, P., Satoh, M., Scoccimarro, E., Semmler, T., Small, J., and von Storch, J.-S.: High Resolution Model Intercomparison Project (HighResMIP v1.0) for CMIP6, Geosci. Model Dev., 9, 4185–4208, https://doi.org/10.5194/gmd-9-4185-2016, 2016.
Hagemann, S.: An improved land surface parameter data set for global and regional climate models, Max Planck Institute for Meteorology report series, Report No. 336, Hamburg, Germany, 2002.
Hamdi, R., Van de Vyver, H., and Termonia, P.: New cloud and microphysics parameterisation for use in high-resolution dynamical downscaling: application for summer extreme temperature over Belgium, Int. J. Climatol., 32, 2051–2065, https://doi.org/10.1002/joc.2409, 2012.
Harris, I., Osborn, T. J., Jones, P. D., and Lister, D. H.: Version 4 of the CRU TS monthly high-resolution gridded multivariate climate dataset, Scientific Data, 7, 1–18, https://doi.org/10.1038/s41597-020-0453-3, 2020.
Hofstra, N., Haylock, M., New, M., and Jones, P. D.: Testing E-OBS European high-resolution gridded data set of daily precipitation and surface temperature, J. Geophys. Res.-Atmos., 114, D21101, https://doi.org/10.1029/2009JD011799, 2009.
Hofstra, N., New, M., and McSweeney, C.: The influence of interpolation and station network density on the distributions and trends of climate variables in gridded daily data, Clim. Dynam., 35, 841–858, https://doi.org/10.1007/s00382-009-0698-1, 2010.
Hu, Z., Zhou, Q., Chen, X., Li, J., Li, Q., Chen, D., Liu, W., and Yin, G.: Evaluation of three global gridded precipitation data sets in central Asia based on rain gauge observations, Int. J. Climatol., 38, 3475–3493, https://doi.org/10.1002/joc.5510, 2018.
Iturbide, M., Gutiérrez, J. M., Alves, L. M., Bedia, J., Cerezo-Mota, R., Cimadevilla, E., Cofiño, A. S., Di Luca, A., Faria, S. H., Gorodetskaya, I. V., Hauser, M., Herrera, S., Hennessy, K., Hewitt, H. T., Jones, R. G., Krakovska, S., Manzanas, R., Martínez-Castro, D., Narisma, G. T., Nurhati, I. S., Pinto, I., Seneviratne, S. I., van den Hurk, B., and Vera, C. S.: An update of IPCC climate reference regions for subcontinental analysis of climate model data: definition and aggregated datasets, Earth Syst. Sci. Data Discuss., https://doi.org/10.5194/essd-2019-258, 2020.
Jacob, D.: A note to the simulation of the annual and inter-annual variability of the water budget over the Baltic Sea drainage basin, Meteorol. Atmos. Phys., 77, 61–73, https://doi.org/10.1007/s007030170017, 2001.
Jacob, D., Bärring, L., Christensen, O. B., Christensen, J. H., De Castro, M., Déqué, M., Giorgi, F., Hagemann, S., Hirschi, M., Jones, R., Kjellström, E. Lenderink, G., Rockel, F., Sánchez, E., Schär, C., Seneviratne, S. I., Somot, S., van Ulden, A., and van den Hurk, B.: An inter-comparison of regional climate models for Europe: model performance in present-day climate, Climatic Change, 81, 31–52, https://doi.org/10.1007/s10584-006-9213-4, 2007.
Jacob, D., Elizalde, A., Haensler, A., Hagemann, S., Kumar, P., Podzun, R., Rechid, D., Remedio, A. R., Saeed, F., Sieck, K., Teichmann, C., and Wilhelm, C.: Assessing the transferability of the regional climate model REMO to different coordinated regional climate downscaling experiment (CORDEX) regions, Atmosphere, 3, 181–199, https://doi.org/10.3390/atmos3010181, 2012.
Jacob, D., Petersen, J., Eggert, B., Alias, A., Christensen, O. B., Bouwer, L. M., Braun, A., Colette, A., Déqué, M., Georgievski, G., Georgopoulou, E., Gobiet, A., Menut, L., Nikulin, G., Haensler, A., Hempelmann, N., Jones, C., Keuler, K., Kovats, S., Kröner, N., Kotlarski, S., Kriegsmann, A., Martin, E., van Meijgaard, E., Moseley, C., Pfeifer, S., Preuschmann, S., Radermacher, C., Radtke, K., Rechid, D., Rounsevell, M., Samuelsson, P., Somot, S., Soussana, J.-F., Teichmann, C., Valentini, R., Vautard, R., Weber, B., and Yiou, P.: EURO-CORDEX: new high-resolution climate change projections for European impact research, Reg. Environ. Change, 14, 563–578, https://doi.org/10.1007/s10113-013-0499-2, 2014.
Jones, R. G., Noguer, M., Hassell, D. C., Hudson, D., Wilson, S. S., Jenkins, G. J., and Mitchell, J. F. B.: Generating high resolution climate change scenarios using PRECIS, Met Office Hadley Centre, Exeter, UK, 40, 2004.
Koenigk, T., Berg, P., and Döscher, R.: Arctic climate change in an ensemble of regional CORDEX simulations, Polar Res., 34, 24603, https://doi.org/10.3402/polar.v34.24603, 2015.
Kotlarski, S., Keuler, K., Christensen, O. B., Colette, A., Déqué, M., Gobiet, A., Goergen, K., Jacob, D., Lüthi, D., van Meijgaard, E., Nikulin, G., Schär, C., Teichmann, C., Vautard, R., Warrach-Sagi, K., and Wulfmeyer, V.: Regional climate modeling on European scales: a joint standard evaluation of the EURO-CORDEX RCM ensemble, Geosci. Model Dev., 7, 1297–1333, https://doi.org/10.5194/gmd-7-1297-2014, 2014.
Kotova, L., Aniskevich, S., Bobylev, L., Caluwaerts, S., De Cruz, L., De Troch, R., Gnatiuk, N., Gobin, A., Hamdi, R., Sakalli, A., Sirin, A., Termonia, P., Top, S., Van Schaeybroeck, B., and Viksna, A.: A new project AFTER investigates the impacts of climate change in the Europe-Russia-Turkey region, Climate Services, 12, 64–66, https://doi.org/10.1016/j.cliser.2018.11.003, 2018.
Kyselý, J. and Plavcová, E.: Biases in the diurnal temperature range in Central Europe in an ensemble of regional climate models and their possible causes, Clim. Dynam., 39, 1275–1286, https://doi.org/10.1007/s00382-011-1200-4, 2012.
Laprise, R., Caya, D., Frigon, A., and Paquin, D.: Current and perturbed climate as simulated by the second-generation Canadian Regional Climate Model (CRCM-II) over northwestern North America, Clim. Dynam., 21, 405–421, https://doi.org/10.1007/s00382-003-0342-4, 2003.
Mašek, J.: Problem with screen level temperatures above snow in ISBA scheme, report RC LACE, available at: https://www.rclace.eu/?page=12 (last access: 7 July 2020), 2017.
Matsuura, K. and Willmott, C. J.: Terrestrial Air Temperature and Precipitation: 1900–2017 Gridded Monthly Time Series (V 5.01), available at: http://climate.geog.udel.edu/~climate/html_pages/Global2017/README.GlobalTsT2017.html (Last access: 3 March 2021), 2018.
New, M., Hulme, M., and Jones, P.: Representing twentieth-century space–time climate variability. Part I: Development of a 1961–90 mean monthly terrestrial climatology, J. Climate, 12, 829–856, https://doi.org/10.1175/1520-0442(1999)012<0829:RTCSTC>2.0.CO;2, 1999.
Nikulin, G., Jones, C., Giorgi, F., Asrar, G., Büchner, M., Cerezo-Mota, R., Christensen, O. B., Déqué, M., Fernandez, J., Hänsler, A., van Meijgaard, E., Samuelsson, P., Sylla, M. B., and Sushama, L.: Precipitation climatology in an ensemble of CORDEX-Africa regional climate simulations, J. Climate, 25, 6057–6078, https://doi.org/10.1175/JCLI-D-11-00375.1, 2012.
Nikulin, G., Lennard, C., Dosio, A., Kjellström, E., Chen, Y., Hänsler, A., Kupiainen, M., Laprise, R., Mariotti, L., Fox Maule, C., van Meijgaard, E., Panitz, H.-J., Scinocca, J. F., and Somot, S.: The effects of 1.5 and 2 degrees of global warming on Africa in the CORDEX ensemble, Environ. Res. Lett., 13, 065003, https://doi.org/10.1088/1748-9326/aab1b1, 2018.
Ozturk, T., Altinsoy, H., Türkeş, M., and Kurnaz, M. L.: Simulation of temperature and precipitation climatology for the Central Asia CORDEX domain using RegCM 4.0, Clim. Res., 52, 63–76, https://doi.org/10.3354/cr01082, 2012.
Ozturk, T., Turp, M. T., Türkeş, M., and Kurnaz, M. L.: Projected changes in temperature and precipitation climatology of Central Asia CORDEX Region 8 by using RegCM4. 3.5, Atmos. Res., 183, 296–307, https://doi.org/10.1016/j.atmosres.2016.09.008, 2016.
Pfeifer, S.: Modeling cold cloud processes with the regional climate model REMO, PhD thesis, Reports on Earth System Science, Max Planck Institute for Meteorology, Hamburg, Germany, 2006.
Pietikäinen, J.-P., O'Donnell, D., Teichmann, C., Karstens, U., Pfeifer, S., Kazil, J., Podzun, R., Fiedler, S., Kokkola, H., Birmili, W., O'Dowd, C., Baltensperger, U., Weingartner, E., Gehrig, R., Spindler, G., Kulmala, M., Feichter, J., Jacob, D., and Laaksonen, A.: The regional aerosol-climate model REMO-HAM, Geosci. Model Dev., 5, 1323–1339, https://doi.org/10.5194/gmd-5-1323-2012, 2012.
Pietikäinen, J.-P., Markkanen, T., Sieck, K., Jacob, D., Korhonen, J., Räisänen, P., Gao, Y., Ahola, J., Korhonen, H., Laaksonen, A., and Kaurola, J.: The regional climate model REMO (v2015) coupled with the 1-D freshwater lake model FLake (v1): Fenno-Scandinavian climate and lakes, Geosci. Model Dev., 11, 1321–1342, https://doi.org/10.5194/gmd-11-1321-2018, 2018.
Remedio, A. R., Teichmann, C., Buntemeyer, L., Sieck, K., Weber, T., Rechid, D., Hoffmann, P., Nam, C., Kotova, L., and Jacob, D.: Evaluation of New CORDEX Simulations Using an Updated Köppen–Trewartha Climate Classification, Atmosphere, 10, 726, https://doi.org/10.3390/atmos10110726, 2019.
Roeckner, E., Arpe, K., Bengtsson, L., Christoph, M., Claussen, M., Dümenil, L., Esch, M., Giorgetta, M., Schlese, U., and Schulzweida, U.: The Atmospheric General Circulation Model Echam-4: Model Description and Simulation of the Present Day Climate, Report No. 218, Max-Planck-Institute for Meteorology, Hamburg, Germany, 1996.
Russo, E., Kirchner, I., Pfahl, S., Schaap, M., and Cubasch, U.: Sensitivity studies with the regional climate model COSMO-CLM 5.0 over the CORDEX Central Asia Domain, Geosci. Model Dev., 12, 5229–5249, https://doi.org/10.5194/gmd-12-5229-2019, 2019.
Russo, E., Sørland, S. L., Kirchner, I., Schaap, M., Raible, C. C., and Cubasch, U.: Exploring the parameter space of the COSMO-CLM v5.0 regional climate model for the Central Asia CORDEX domain, Geosci. Model Dev., 13, 5779–5797, https://doi.org/10.5194/gmd-13-5779-2020, 2020.
Ruti, P. M., Somot, S., Giorgi, F., Dubois, C., Flaounas, E., Obermann, A., Dell'Aquila, A., Pisacane, G., Harzallah, A., Lombardi, E., Ahrens, B., Akhtar, N., Alias, A., Arsouze, T., Aznar, R., Bastin, S., Bartholy, J., Béranger, K., Beuvier, J., Bouffies-Cloché, S., Brauch, J., Cabos, W., Calmanti, S., Calvet, J.-C., Carillo, A., Conte, D., Coppola, E., Djurdjevic, V., Drobinski, P., Elizalde-Arellano, A., Gaertner, M., Galàn, P., Gallardo, C., Gualdi, S., Goncalves, M., Jorba, O., Jordà, G., L'Heveder, B., Lebeaupin-Brossier, C., Li, L., Liguori, G., Lionello, P., Maciàs, D., Nabat, P., Önol, B., Raikovic, B., Ramage, K., Sevault, F., Sannino, G., Struglia, M. V., Sanna, A., Torma, C., and Vervatis, V.: MED-CORDEX initiative for Mediterranean climate studies, B. Am. Meteorol. Soc., 97, 1187–1208, https://doi.org/10.1175/BAMS-D-14-00176.1, 2016.
Schneider, U., Becker, A. Finger, P. Meyer-Christoffer, A., and Ziese, M.: GPCC Full Data Monthly Product Version 2018 at 0.25∘ : Monthly Land-Surface Precipitation from Rain-Gauges built on GTS-based and Historical Data, Global Precipitation Climatology Centre (GPCC) at Deutscher Wetterdienst, https://doi.org/10.5676/DWD_GPCC/FD_M_V2018_025, 2018.
Semmler, T., Jacob, D., Schlünzen, K. H., and Podzun, R.: Influence of sea ice treatment in a regional climate model on boundary layer values in the Fram Strait region, Mon. Weather Rev., 132, 985–999, https://doi.org/10.1175/1520-0493(2004)132<0985:IOSITI>2.0.CO;2, 2004.
Solman, S. A., Sanchez, E., Samuelsson, P., da Rocha, R. P., Li, L., Marengo, J., Pessacg, N. L., Remedio, A. R. C., Chou, S. C., Berbery, H., Le Treut, H., de Castro, M., and Jacob, D.: Evaluation of an ensemble of regional climate model simulations over South America driven by the ERA-Interim reanalysis: model performance and uncertainties, Clim. Dynam., 41, 1139–1157, https://doi.org/10.1007/s00382-013-1667-2, 2013.
Souverijns, N., Gossart, A., Demuzere, M., Lenaerts, J. T. M., Medley, B., Gorodetskaya, I. V., Vanden Broucke, S., and van Lipzig, N. P. M.: A New Regional Climate Model for POLAR-CORDEX: Evaluation of a 30-Year Hindcast with COSMO-CLM2 Over Antarctica, J. Geophys. Res.-Atmos., 124, 1405–1427, https://doi.org/10.1029/2018JD028862, 2019.
Sun, Q., Miao, C., Duan, Q., Ashouri, H.,Sorooshian, S., and Hsu, K.-L.: A review of global precipitation data sets: Data sources, estimation, and inter-comparisons, Rev. Geophys., 56, 79–107, https://doi.org/10.1002/2017RG000574, 2018.
Tangang, F., Supari, S., Chung, J. X., Cruz, F., Salimun, E., Ngai, S. T., Juneng, L., Santisirisomboon, J., Santisirisomboon, J., Ngo-Duc, T., Phan-Van, T., Narisma, G., Singhruck, P., Gunawan, D., Aldrian, E., Sopaheluwakan, A., Nikulin, G., Yang, H., Remedio, A. R. C., Sein, D., and Hein-Griggs, D.: Future changes in annual precipitation extremes over Southeast Asia under global warming of 2 C, APN Science Bulletin, 8, 3–8, https://doi.org/10.30852/sb.2018.436, 2018.
Tangang, F., Santisirisomboon, J., Juneng, L., Salimun, E., Chung, J., Cruz, F., Ngai, S. T., Ngo-Duc, T., Singhruck, P., Narisma, G., Santisirisomboon, J., Wongsaree, W., Promjirapawat, K., Sukamongkol, Y., Srisawadwong, R., Setsirichok, D., Phan-Van, T., Gunawan, D., Aldrian, E., Nikulin, G., and Yang, H.: Projected future changes in mean precipitation over Thailand based on multi-model regional climate simulations of CORDEX Southeast Asia, Int. J. Climatol., 39, 5413–5436, https://doi.org/10.1002/joc.6163, 2019.
Taylor, K. E.: Summarizing multiple aspects of model performance in a single diagram, J. Geophys. Res.-Atmos., 106, 7183–7192, https://doi.org/10.1029/2000JD900719, 2001.
Termonia, P., Fischer, C., Bazile, E., Bouyssel, F., Brožková, R., Bénard, P., Bochenek, B., Degrauwe, D., Derková, M., El Khatib, R., Hamdi, R., Mašek, J., Pottier, P., Pristov, N., Seity, Y., Smolíková, P., Španiel, O., Tudor, M., Wang, Y., Wittmann, C., and Joly, A.: The ALADIN System and its canonical model configurations AROME CY41T1 and ALARO CY40T1, Geosci. Model Dev., 11, 257–281, https://doi.org/10.5194/gmd-11-257-2018, 2018a.
Termonia, P., Van Schaeybroeck, B., De Cruz, L., De Troch, R., Caluwaerts, S., Giot, O., Hamdi, R., Vannitsem, S., Duchêne, F., Willems, P., Tabari, H., Van Uytven, E., Hosseinzadehtalaei, P., Van Lipzig, N., Wouters, H., Vanden Broucke, S., van Ypersele, J.-P., Marbaix, P., Villanueva-Birriel, C., Fettweis, X., Wyard, C., Scholzen, C., Doutreloup, S., De Ridder, K., Gobin, G., Lauwaet, D., Stavrakou, T., Bauwens, M., Müller, J.-F., Luyten, P., Ponsar, S., Van den Eynde, D., and Pottiaux, E.: The CORDEX.be initiative as a foundation for climate services in Belgium, Climate Services, 11, 49–61, https://doi.org/10.1016/j.cliser.2018.05.001, 2018b.
Tiedtke, M.: A comprehensive mass flux scheme for cumulus parameterization in large-scale models, Mon. Weather Rev., 117, 1779–1800, 1989.
Top, S., Kotova, L., De Cruz, L., Aniskevich, S., Bobylev, L., De Troch, R., Gnatiuk, N., Gobin, A., Hamdi, R., Kriegsmann, A., Remedio, A. R., Sakalli, A., Van De Vyver, H., Van Schaeybroeck, B., Zandersons, V., De Maeyer, P., Termonia, P., and Caluwaerts, S.: R code validation analysis ALARO-0 and REMO2015 climate data Central Asia, Zenodo, https://doi.org/10.5281/zenodo.3659717, 2020.
Torma, C., Giorgi, F., and Coppola, E.: Added value of regional climate modeling over areas characterized by complex terrain – Precipitation over the Alps, J. Geophys. Res.-Atmos., 120, 3957–3972, https://doi.org/10.1002/2014JD022781, 2015.
Tustison, B., Harris, D., and Foufoula-Georgiou, E.: Scale issues in verification of precipitation forecasts, J. Geophys. Res.-Atmos., 106, 11775–11784, https://doi.org/10.1029/2001JD900066, 2001.
Tuyet, N. T., Thanh, N. D., and van Tan, P.: Performance of SEACLID/CORDEX-SEA multi-model experiments in simulating temperature and rainfall in Vietnam, Vietnam Journal of Earth Sciences, 41, 374–387, https://doi.org/10.15625/0866-7187/41/4/14259, 2019.
Wang, Y., Feng, J., Luo, M., Wang, J., and Yuan, Q.: Uncertainties in simulating Central Asia: sensitivity to physical parameterizations using WRF, Int. J. Climatol., 40, 5813–5828, https://doi.org/10.1002/joc.6567, 2020.
Whan, K. and Zwiers, F.: The impact of ENSO and the NAO on extreme winter precipitation in North America in observations and regional climate models, Clim. Dynam., 48, 1401–1411, https://doi.org/10.1007/s00382-016-3148-x, 2017.
Wilhelm, C., Rechid, D., and Jacob, D.: Interactive coupling of regional atmosphere with biosphere in the new generation regional climate system model REMO-iMOVE, Geosci. Model Dev., 7, 1093–1114, https://doi.org/10.5194/gmd-7-1093-2014, 2014.
Willmott, C. J. and Matsuura, K.: Smart interpolation of annually averaged air temperature in the United States, J. Appl. Meteorol., 34, 2577–2586, https://doi.org/10.1175/1520-0450(1995)034<2577:SIOAAA>2.0.CO;2, 1995.
Zhu, X., Zhang, M., Wang, S., Qiang, F., Zeng, T., Ren, Z., and Dong, L.: Comparison of monthly precipitation derived from high-resolution gridded datasets in arid Xinjian, central Asia, Quatern. Int., 358, 160–170, https://doi.org/10.1016/j.quaint.2014.12.027, 2015.
Zhu, X., Wei, Z., Dong, W., Ji, Z., Wen, X., Zheng, Z., Yan, D., and Chen, D.: Dynamical downscaling simulation and projection for mean and extreme temperature and precipitation over central Asia, Clim. Dynam., 54, 3279–3306, https://doi.org/10.1007/s00382-020-05170-0, 2020.
Zou, L., Zhou, T., and Peng, D.: Dynamical downscaling of historical climate over CORDEX East Asia domain: A comparison of regional ocean-atmosphere coupled model to stand-alone RCM simulations, J. Geophys. Res.-Atmos., 121, 1442–1458, https://doi.org/10.1002/2015JD023912, 2016.