the Creative Commons Attribution 4.0 License.
the Creative Commons Attribution 4.0 License.
 | 02 Mar 2021
PMIP4 experiments using MIROC-ES2L Earth system model
Akitomo Yamamoto
Tomohiro Hajima
Ryouta O'ishi
Manabu Abe
Hiroaki Tatebe
Ayako Abe-Ouchi
Michio Kawamiya
Following the protocol of the fourth phase of the Paleoclimate Modelling Intercomparison Project (PMIP4), we performed numerical experiments targeting distinctive past time periods using the Model for Interdisciplinary Research on Climate, Earth System version 2 for Long-term simulations (MIROC-ES2L), which is an Earth system model. Setup and basic performance of the experiments are presented.
The Last Glacial Maximum was one of the most extreme climate states during the Quaternary and conducting numerical modeling experiments of this period has long been a challenge for the paleoclimate community. We conducted a Last Glacial Maximum experiment with a long spin-up of nearly 9000 years. Globally, there was reasonable agreement between the anomalies relative to the present day derived from model climatology and those derived from proxy data archives, while some regional discrepancies remained.
By changing orbital and greenhouse gas forcings, we conducted experiments for two interglacial periods: 6000 and 127 000 years before present. Model anomalies relative to the present day were qualitatively consistent with variations in solar forcing. However, anomalies in the model were smaller than those derived from proxy data archives, suggesting that processes that play a role in past interglacial climates remain lacking in this state-of-the-art model.
We conducted transient simulations from 850 to 1850 CE and from 1850 to 2014 CE. Cooling in the model indicated a clear response to huge volcanic eruptions, consistent with paleo-proxy data. The contrast between cooling during the Little Ice Age and warming during the 20th to 21st centuries was represented well at the multidecadal timescale.
- Article
(8419 KB) - Full-text XML
-
Supplement
(383 KB) - BibTeX
- EndNote


Using climate models to simulate past climate provides unique opportunities to evaluate models' projections of future climate.
The Paleoclimate Modelling Intercomparison Project (PMIP) began in the early 1990s (Joussaume et al., 1999). Since then, the paleoclimate community has continued to expand their research to include more time periods and events. With the increase of computational power, models of higher complexity are used to make future projections (Kawamiya et al., 2020). Phase 3 of PMIP was endorsed by phase 5 of the Coupled Model Intercomparison Project (CMIP5; Braconnot et al., 2012), and PMIP is now in its fourth phase (PMIP4; Kageyama et al., 2018). The proposed PMIP4 experiments cover a wide range of time periods, including the Last Glacial Maximum (LGM; 21 000 years before present), two interglacials (6000 and 127 000 years before present), the last millennium (LM), the mid-Pliocene, and many non-CMIP time periods.
The Quaternary is characterized by cyclic climate change with long glacials and short interglacials that have been recorded in various paleo-proxy records such as ice cores (Jouzel et al., 2007; Dome Fuji Ice Core Project Members et al., 2017), ocean sediment cores (Weldeab et al., 2007), loess records (Maher et al., 2010), and terrestrial fossils (Bartlein et al., 2011). The LGM refers to the period when global ice volume reached its maximum. It was also one of the coldest periods of the Quaternary.
Since the beginning of PMIP, attention has been drawn toward the LGM, which was one of the extreme periods in the glacial–interglacial cycles of the Quaternary (Joussaume et al., 1999; Braconnot et al., 2007; Kageyama et al., 2020) and also the most recent period during which global coverage of the continental ice sheets was at its maximum and greenhouse gas (GHG) levels were at a minimum.
As LGM cooling relative to the pre-industrial (PI) experiment over the tropics is at a comparable level to equilibrium climate sensitivity (ECS), LGM modeling can provide useful information to constrain climate sensitivity for projections of future climate (Annan and Hargreaves, 2006; Renoult et al., 2020). Intercomparison studies of proxy-based reconstructions of climate variables and model output continue to be conducted (Braconnot et al., 2007; Bartlein et al., 2011; Kageyama et al., 2020). They report good agreement between model output and proxy data for temperature and sea surface temperature (SST) anomalies over the low latitudes (Otto-Bliesner et al., 2009; Hargreaves et al., 2013); however, the tendency for models to underestimate cooling over Greenland remains (Masson-Delmotte et al., 2006). Models have difficulty in reproducing the weakened Atlantic meridional overturning circulation (AMOC) of the LGM (Weber, 2007; Brady et al., 2013; Muglia and Schmittner, 2015; Marzocchi and Jansen, 2017), which might influence the underestimation of cooling. The dust deposition was several to tens of times higher at LGM (Lambert et al., 2008; Lamy et al., 2014; Dome Fuji Ice Core Project members et al., 2017) but was difficult to reproduce by LGM experiments; to reproduce the dust abundance at LGM, we need to assume glaciogenic dust (Mahowald et al., 2006; Ohgaito et al., 2018) or assume an erodibility map (Albani et al., 2014). And an erodibility map was formally introduced in PMIP4 (Kageyama et al., 2017), in addition to the dust emission that is simulated in non-paleo simulations. In Ohgaito et al. (2018), they showed that sufficient dust loading affects the temperature around Antarctica.
The interglacial periods of 6000 and 127 000 years before present were characterized by differences in solar radiation at the top of the atmosphere caused by orbital states that were different from those of the present day (Brierley et al., 2020; Otto-Bliesner et al., 2021), resulting in seasonalities that were different from the PI period (1850 CE). As it was in the recent past and because various paleo-proxy records are available (Ritchie et al., 1985; Drake et al., 2011; Hely et al., 2014; Tierney et al., 2013, 2017), the interglacial period of 6000 years before present was the only interglacial included in earlier phases of PMIP (Braconnot et al., 2007; Ohgaito and Abe-Ouchi, 2007, 2009; Ohgaito et al., 2013). Following efforts to collect paleo-proxy data (Otto-Bliesner and Brady, 2001; Lunt et al., 2013; Capron et al., 2014, 2017), it is now also possible to conduct the same experiment for 127 000 years before present; experiments on this interglacial period have the advantage of strong seasonality in the Northern Hemisphere (NH). The insolation anomaly at 127 000 years before present was larger than that at 6000 years before present, and the stronger insolation at 127 000 years before present during boreal summer modulated the temperature and circulation for that time period (Lunt et al., 2013). The role of vegetation coupling has been discussed intensively as studies report that vegetation enhances warming in the NH (O'ishi and Abe-Ouchi, 2011). However, models have been unable to reproduce the quantitative changes recorded in proxy data (McKay et al., 2011, Capron et al., 2014, Hoffman et al., 2017).
As the LM is the most recent period prior to the PI period, there are vast amounts and varieties of data available from exact times in proxy records (PAGES2k-PMIP3 group, 2015; Luterbacher et al., 2016; Gagen et al., 2016) and in the literature (Pfister and Brazdil, 2006; Xoplaki et al., 2016; Camenisch et al., 2016). In earlier numerical paleoclimate studies, simple models were used to conduct transient experiments over periods of 1000 years (Crowley, 2000; Goosse et al., 2005). With the increase of computational power, simulations using coupled atmosphere–ocean general circulation models (AOGCMs) and/or comprehensive Earth system models (ESMs) became the standard (Kawamiya et al., 2020). Coordination of LM experiments began under PMIP3 (Schmidt et al., 2011), and multiple AOGCMs and ESMs have been used to perform LM experiments. One of the important questions for LM experiments is whether climate variabilities stem from internal variability or forced responses. Atwood et al. (2016) decomposed the forcing of the LM experiment and concluded that cooling during the Little Ice Age (LIA; 1450–1850 CE) was largely driven by volcanic eruptions. PAGES 2k-PMIP3 group (2015) summarized reconstruction–model intercomparisons and reported that the agreement between model and proxy-based reconstructions is better in the high latitudes in the NH and worse in the Southern Hemisphere. Historical (HIST; 1850–2014 CE) and LM experiments are intrinsically different from the other PMIP4 time-slice experiments discussed in this paper. They are time-varying experiments that follow the same method used in the historical experiment in CMIP6. Hence, the LM experiment is closely aligned with the scientific focus of other endorsed MIPs, such as comparison of climatic response to volcanic forcing (VolMIP; Zanchettin et al., 2016) and land use (LUMIP; Lawrence et al., 2016).
Using the Model for Interdisciplinary Research on Climate, Earth System version 2 for Long-term simulations (MIROC-ES2L), we performed numerical experiments targeting distinctive time periods. These simulations included the LGM, the 6 and 127 ka time slices, and the LM experiments. MIROC-ES2L is an ESM that contains atmosphere, ocean, land, and ocean and land biogeochemical cycles (Hajima et al., 2020), which has been developed recently to contribute to CMIP6 and the United Nations Intergovernmental Panel on Climate Change Sixth Assessment Report.
The model is presented in Sect. 2 and the experimental setup and spin-up procedures are explained in Sect. 3. Basic climate states from the experiments are presented in Sect. 4, and conclusions and an outlook are discussed in Sect. 5.
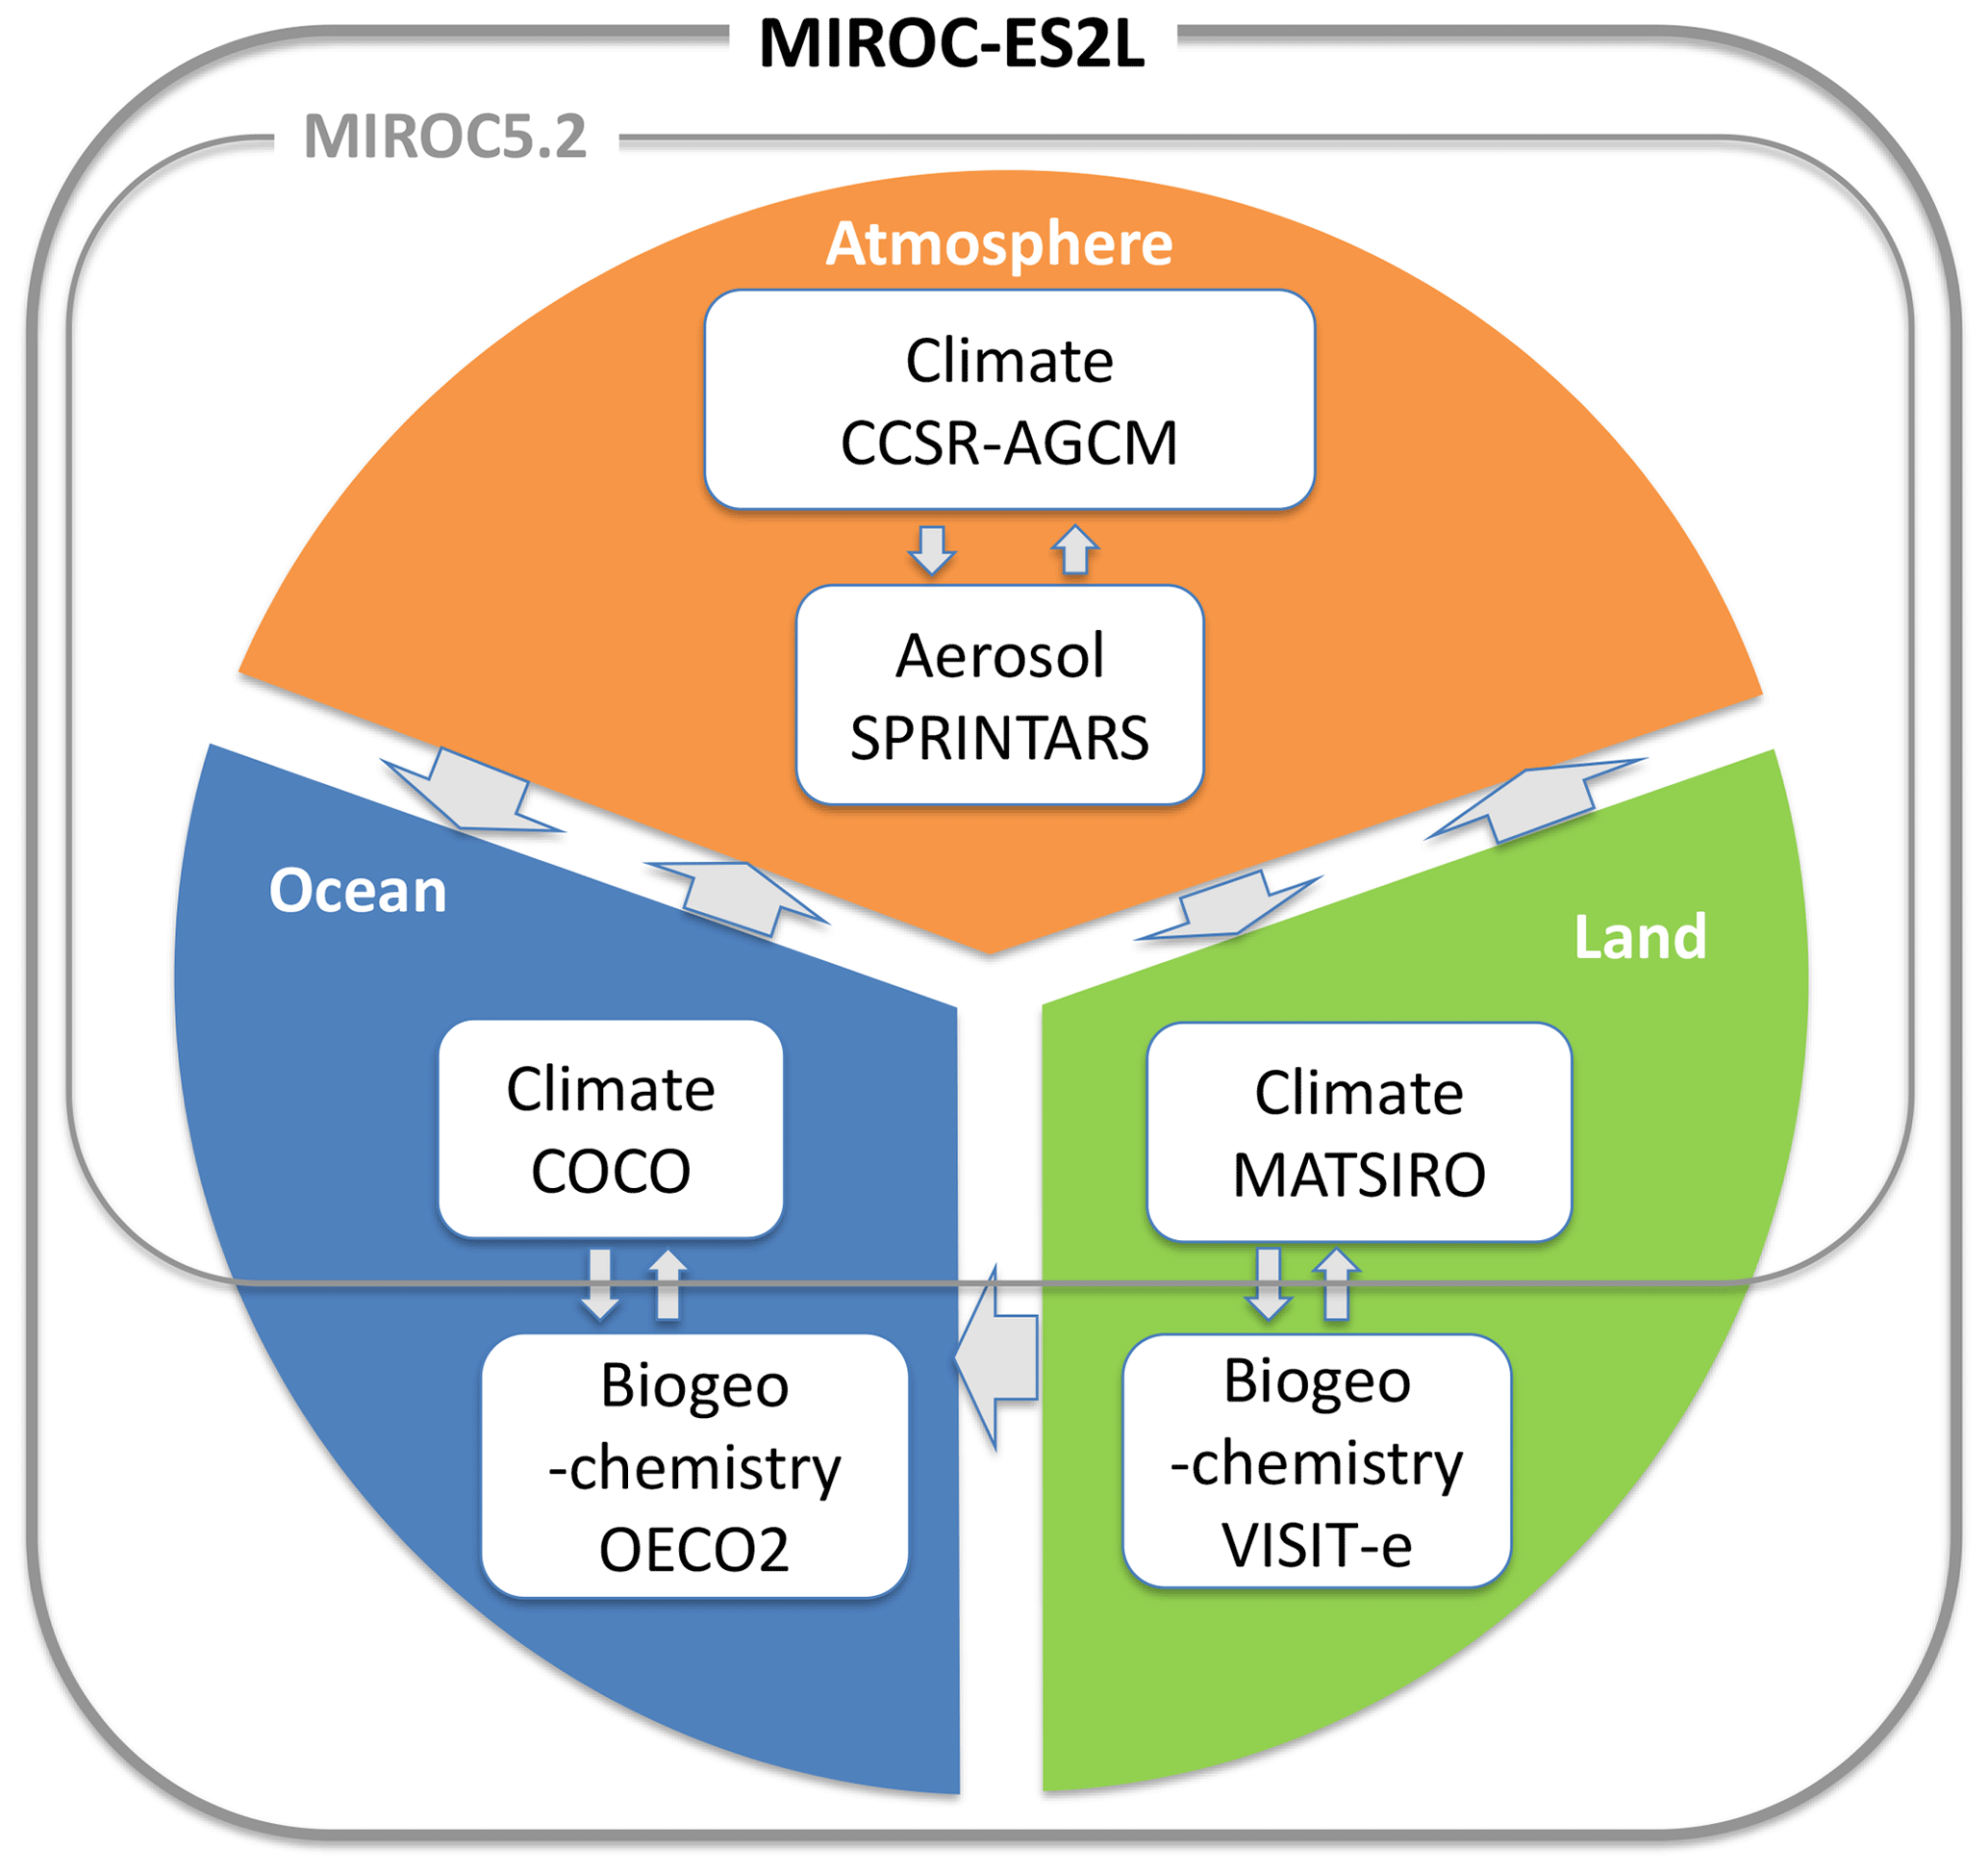
MIROC-ES2L is an ESM developed for CMIP6 (Hajima et al., 2020), and its physical core comprises atmosphere, ocean, and land modules; variables are exchanged via a flux coupler (Fig. 1). The AOGCM components are the same as those in Tatebe et al. (2018). The physical ocean and land modules are coupled with the Vegetation Integrative SImulator for Trace gases adapted for ESMs (VISIT-e; Ito and Inatomi, 2012) land ecosystem model and the OECO2 ocean biogeochemical model with a nutrient–phytoplankton–zooplankton–detritus-type representation of the ecosystem. The ecosystem modules can simulate global carbon and nitrogen cycles explicitly. As the carbon and nitrogen in the atmosphere are prescribed to predetermined values in each experimental setting in this study, carbon and nitrogen variables calculated in OECO2 and VISIT-e are not returned to the atmosphere. Distribution of plant functional types (PFTs) is prescribed because VISIT-e is not a dynamic vegetation model. Dynamics of aerosols are calculated by an online aerosol module, SPRINTARS (Takemura et al., 2000, 2005, 2009).
Horizontal resolution of the atmosphere is set to T42 spectral truncation. Vertical resolution is 40 levels up to 3 hPa. The ocean component has tripolar horizontal coordinates, with two poles in the NH that are located over land to avoid singularity over ocean grids. Horizontal resolution of the ocean is 1∘ longitude and varies from 0.5∘ latitude around the Equator to 1∘ latitude over the midlatitudes. Vertical resolution of the ocean is 62 layers with a hybrid sigma–z coordinate.
Using this model, various types of CMIP6 experiments have been performed. These include all of the Diagnostic, Evaluation and Characterization of Klima (DECK) experiments, the historical experiment of CMIP6 (from 1850 to 2014 CE), and the endorsed MIP experiments. The ECS of this model version is 2.66 K by Gregory's method (Gregory et al., 2004). The identical model version was used for all the experiments in this study.
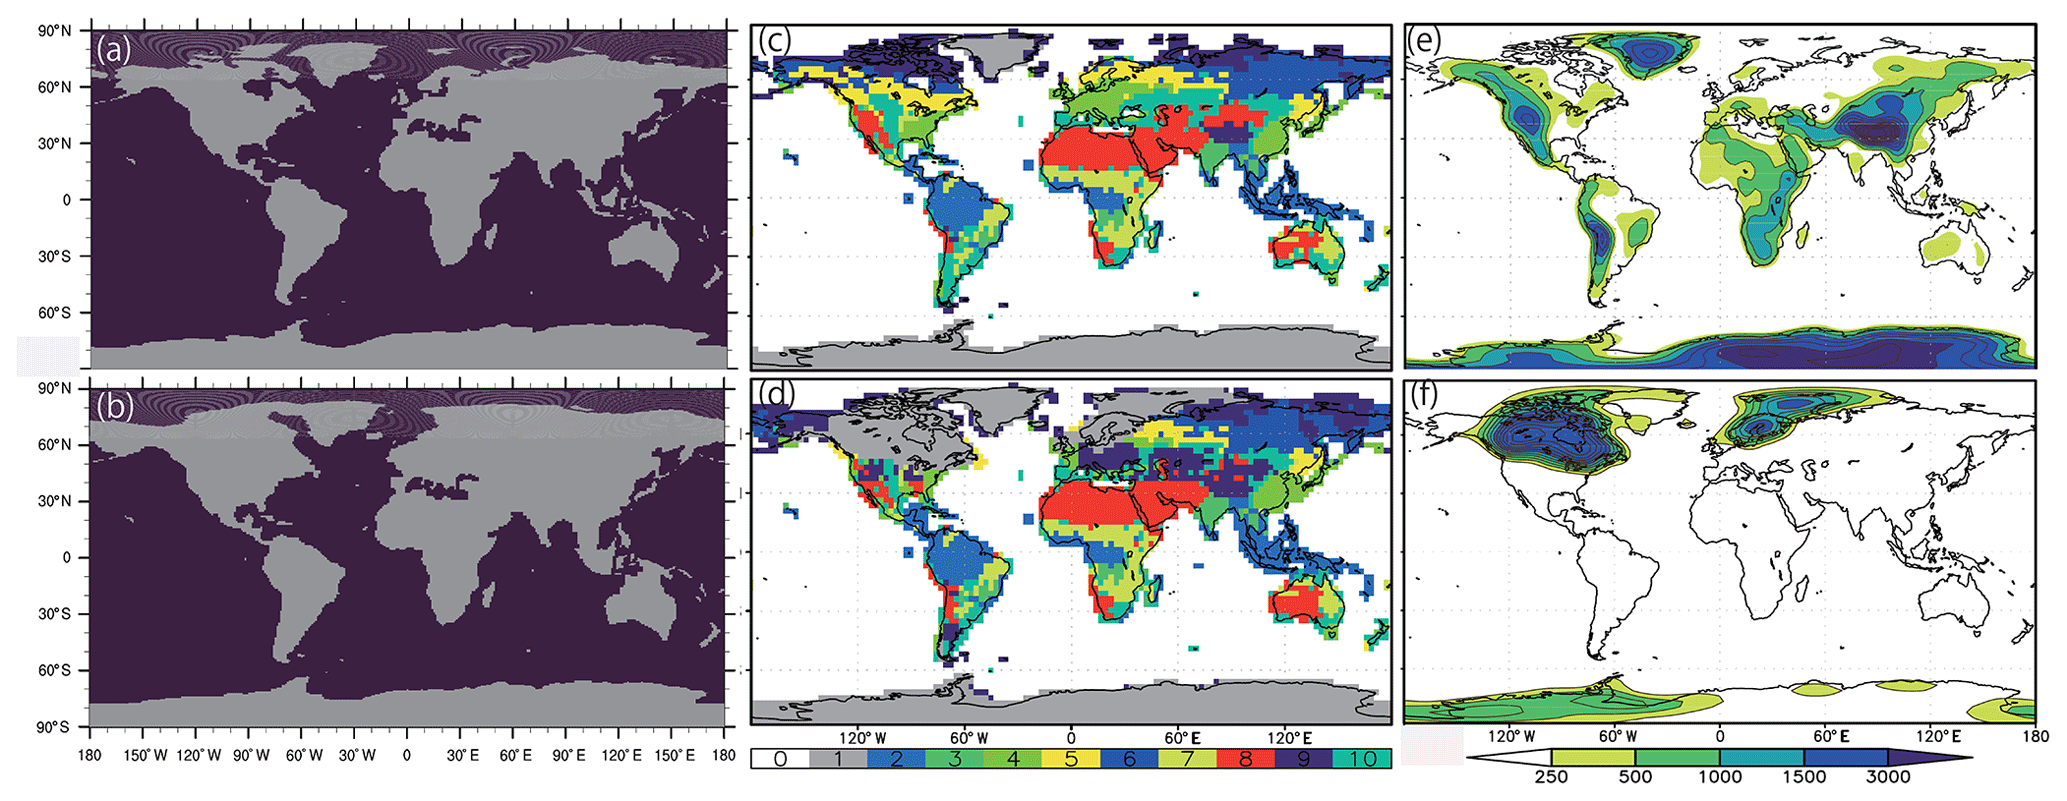
Figure 2(a, b) Land–sea distribution converted to 1∘ × 1∘ ocean grids for (a) PI, 6 ka, and 127 ka and (b) LGM. (c, d) Distribution of land vegetation types for (c) PI, 6 ka, and 127 ka and (d) LGM. Numbers in color bar represent vegetation types: (1) ice sheets, (2) broadleaf evergreen forest, (3) broadleaf deciduous forest and woodland, (4) mixed coniferous and broadleaf deciduous forest and woodland, (5) coniferous forest and woodland, (6) high-latitude deciduous forest and woodland, (7) wooded C4 grassland, (8) shrubs and bare ground, (9) tundra, and (10) C3 grassland. (e) Altitude for PI, 6 ka, and 127 ka and LM (unit: m) and (f) altitude anomaly (unit: m) given for the LGM experiment based on ICE-6G_C (Peltier et al., 2015).

3.1 Setup and spin-up of the PI control experiment
The PI control experiment is the reference experiment of all the paleoclimate experiments. It is identical to the piControl experiment in CMIP6 (Eyring et al., 2016), and the experimental configuration of PI in MIROC-ES2L is described in detail in Hajima et al. (2020). Levels of GHGs were set following the protocol of CMIP6: CO2, CH4, and N2O were set to 284.725 ppm, 808.25 ppb, and 273.02 ppb, respectively (Table 1). The PFTs in the PI are inherited from MIROC-ESM (Watanabe et al., 2011), which was based on Ramankutty and Foley (1999) (Fig. 2c). A description of each PFT is given in the caption of Fig. 2c. Topography is defined from GTOPO30 (Fig. 2e). The experiment was run for more than 9000 model years during the course of model development, and the final drift of the global mean surface air temperature was ∘C yr−1 for the final 500 years (Hajima et al., 2020). Model output from this period was submitted to CMIP6 and the climatology of this period is used for the analyses in this study.
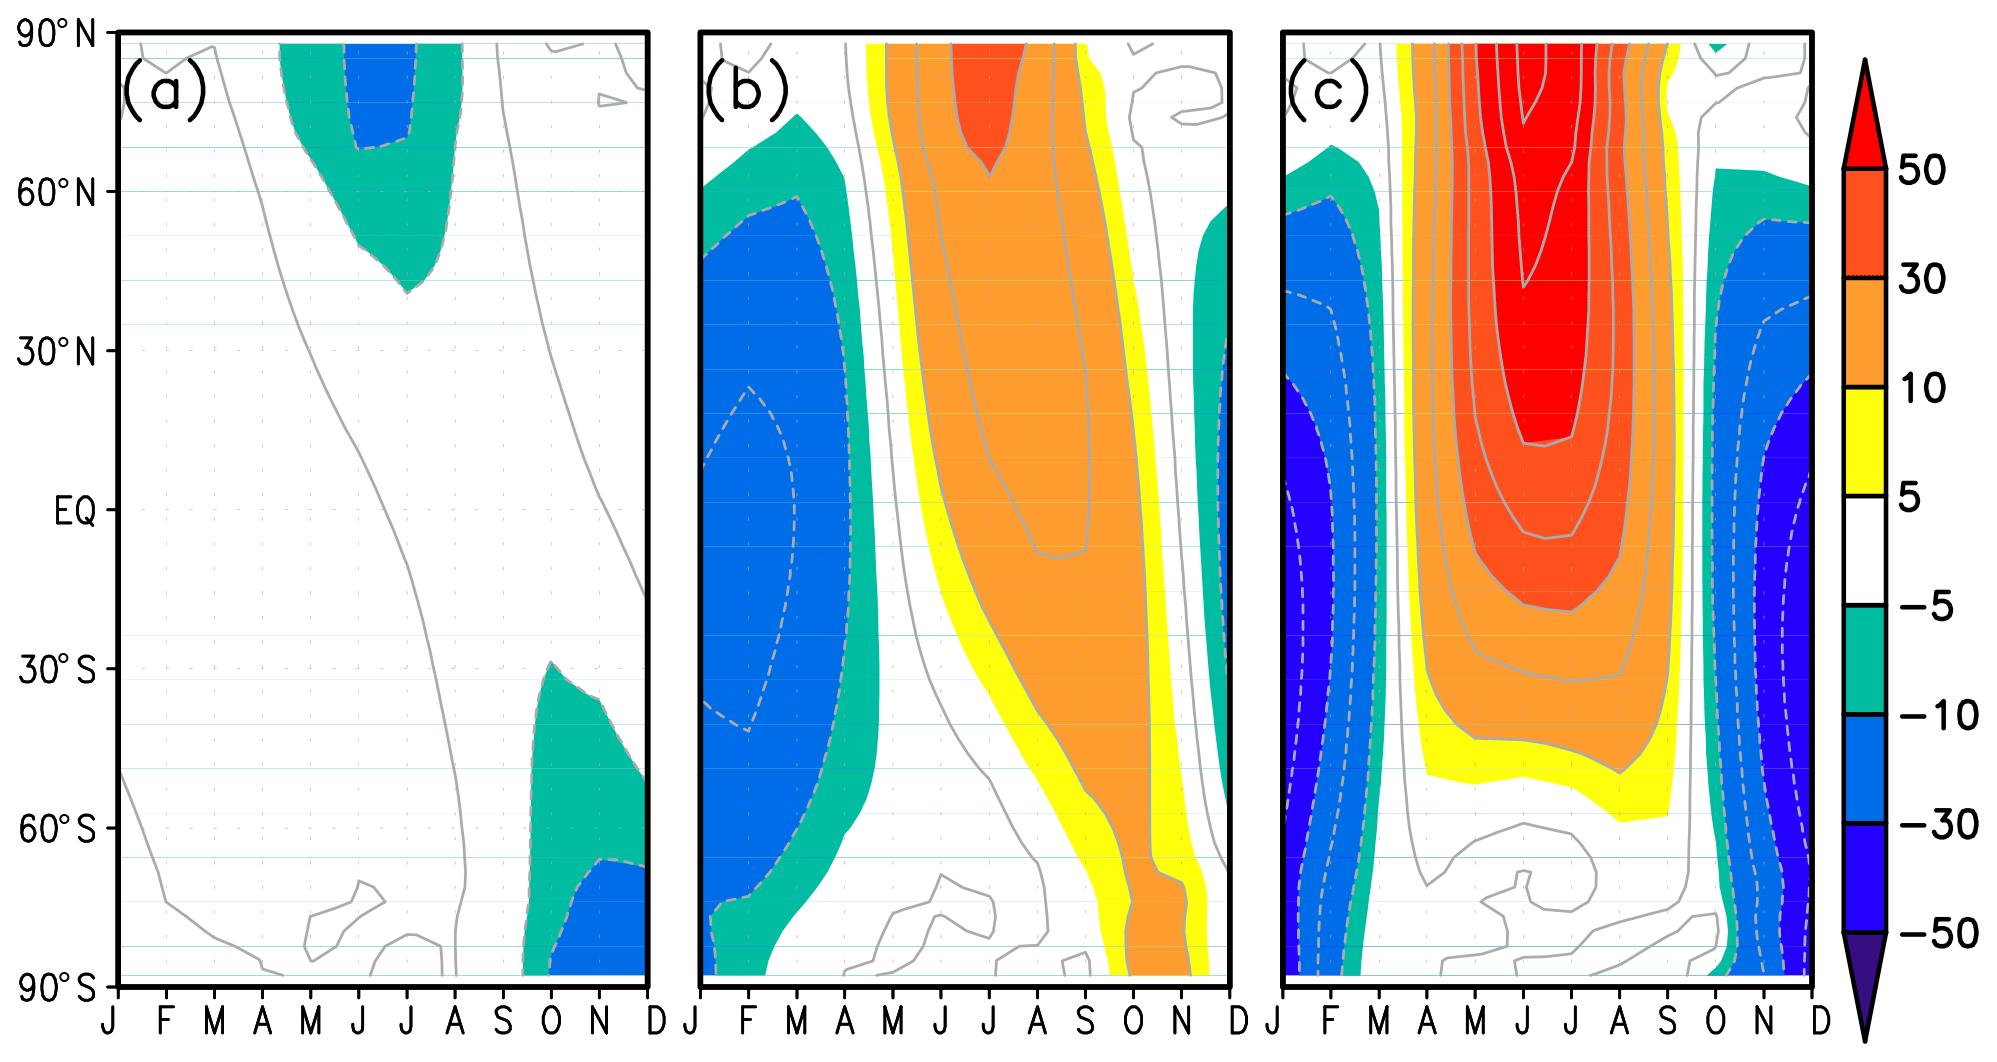
Figure 3Variation of incoming shortwave solar radiation anomaly relative to PI (unit: W m−2) with season and latitude for (a) LGM, (b) 6 ka, and (c) 127 ka.
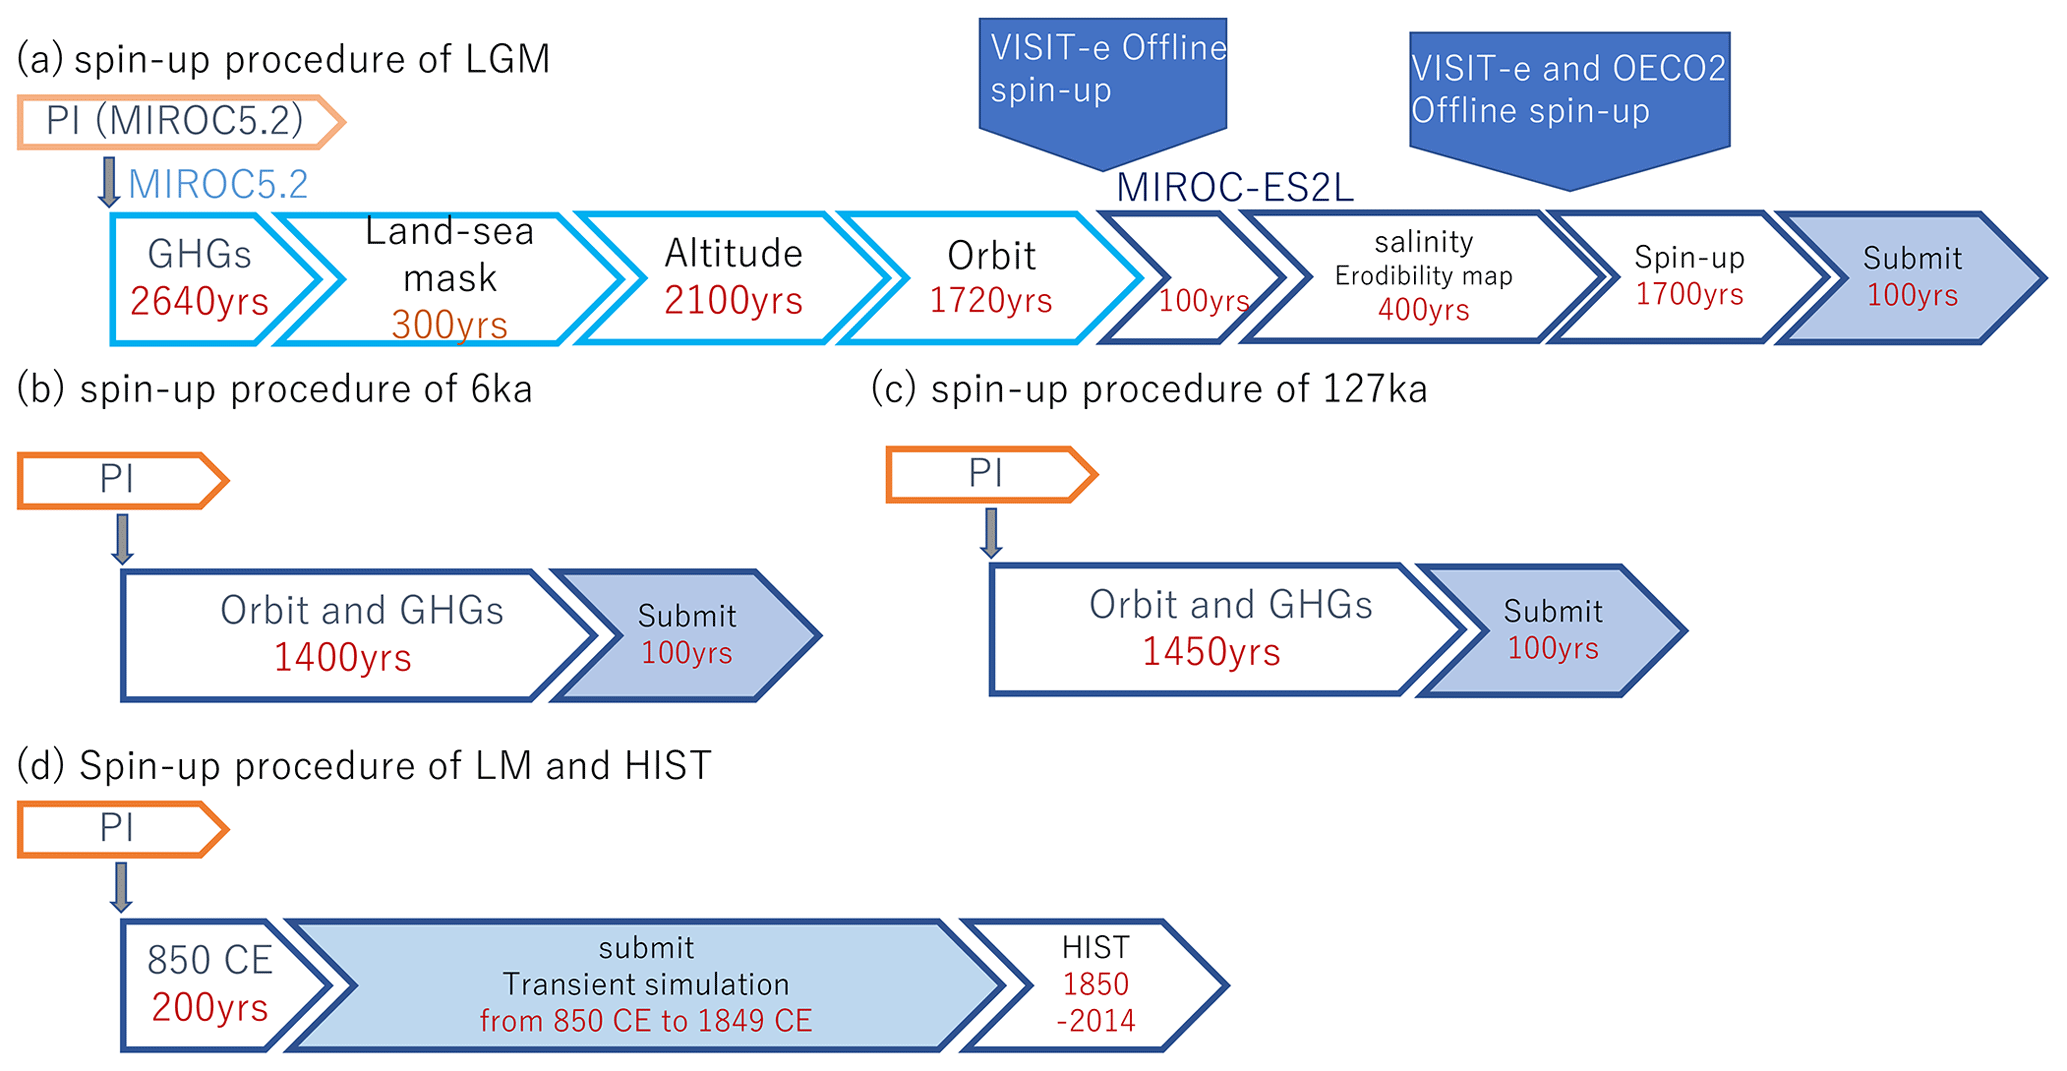
Figure 4Schematic showing spin-up procedures of the following experiments: (a) LGM, (b) 6 ka, (c) 127 ka, and (d) LM and HIST. Shapes with dark orange or dark blue outlines represent experiments using MIROC-ES2L. Shapes with light orange or light blue outlines represent experiments using MIROC5.2. Shapes filled in pale blue represent model output submitted to PMIP4-CMIP6.
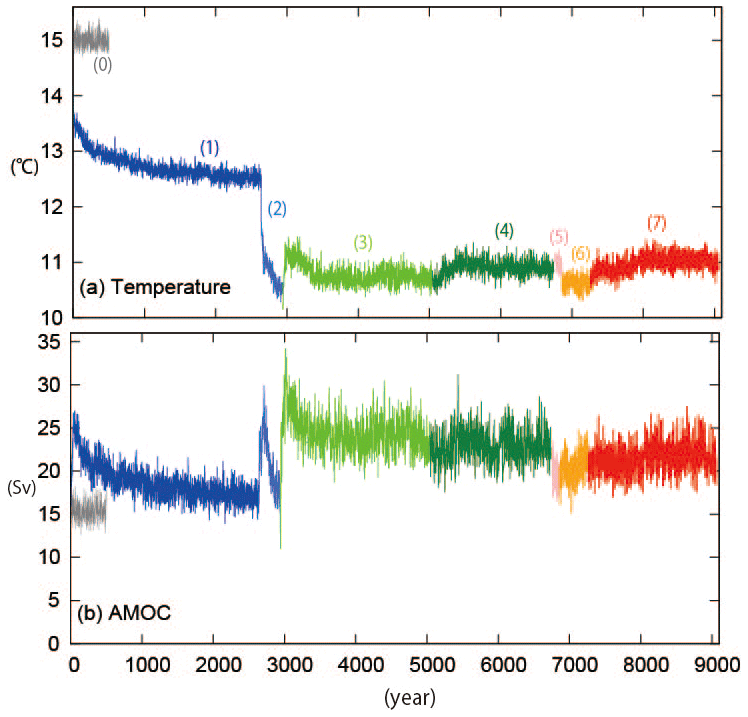
Figure 5Time series for spin-up and submitted period (final 100 years) of LGM experiment and PI as a reference for (a) global mean air temperature at 2 m height and (b) peak values of annual mean AMOC. Gray line (0) denotes PI value. Blue line (1): the experiment with only GHG levels set to LGM values. Light blue line (2): with the land–sea distribution and land PFTs changed to the LGM states. Light green line (3): with altitude set to the LGM state. Dark green line (4): with orbit of the Earth set to the LGM value. Pink line (5): spin-up experiment using MIROC-ES2L after VISIT-e offline spin-up. Orange line (6): with erodibility map and offset of ocean salinity applied. Red line (7): final spin-up after offline spin-up experiments by VISIT-e and OECO2.
3.2 Setup and spin-up of Last Glacial Maximum (LGM) experiment
We performed the LGM experiment following PMIP4 protocol (Kageyama et al., 2017). A long spin-up is essential because of the considerable differences between LGM and present-day conditions. Hence, before model development was finalized, we started spinning up using the physical core (AOGCM) of MIROC-ES2L (Tatebe et al., 2018). Spin-up started by reducing CO2 (Bereiter et al., 2015), CH4 (Loulergue et al., 2008), and N2O (Schilt et al., 2010) levels from PI to LGM values (Table 1). Global mean air temperature gradually reached quasi-equilibrium. After integration for 2640 model years, the land–sea mask, ice sheets, altitude (from ICE-6G_C, as presented in Peltier et al., 2015, Fig. 2b, d, and f), river courses, and Earth's orbit (Berger, 1978) (Fig. 3a) were changed from PI to LGM conditions step by step. The total spin-up time was 6760 model years (Figs. 4 and 5). The LGM PFTs were created based on the PI PFTs with the ice sheet grids defined by ICE-6G_C, and nearby PFTs were diverted to non-ice-sheet land (exposed continental shelves) expanded from PI. In this process, the biggest technical difficulty occurred when the LGM land–sea mask and ice sheet albedo were introduced (the marker (2) in Fig. 5). As mentioned in the Appendix, the LGM spin-up failed at year 3305, and the simulation could not proceed because a grid reached the upper limit of the model's sea ice thickness on the north coast of North America. Figure A1 shows the time evolution of winter sea ice thickness along the north coast of North America during the spin-up. In the present-day condition, the Beaufort Gyre prevails on the north coast of North America, with southward winds pushing sea ice toward land. In addition to this, the sea ice thickness had increased too much due to the cold conditions. When we changed the elevation to the LGM condition, which was left at PI (marker (3) in Fig. 5), the circulation field changed due to the appearance of the high-altitude Laurentide ice sheet, and the north coast of North America had neutral north–south winds on average, which would eliminate the sea ice build-up phenomenon and allowed the experiment to continue.
As the development of MIROC-ES2L was finalized during LGM spin-up, conditions in the 6760th model year of the spin-up were used to initiate the LGM experiment in MIROC-ES2L. In this conversion procedure, the offline terrestrial module was spun up for 40 000 model years until quasi-stability was reached, and the end state was used in the LGM experiment in MIROC-ES2L. This was followed by spinning up the main MIROC-ES2L experiment for a further 100 years. Ocean salinity (1 practical salinity unit (PSU) was added globally) and an erodibility map (addressing dust emission under LGM conditions, as proposed by Albani et al., 2014, 2016) were introduced. The erodibility map specifies low latitudes as deserts and mid-to-high latitudes as tundra (Fig. 2d). Land and ocean ecosystem models were spun up offline for 40 000 and 3000 model years, respectively, on the basis of the physical conditions created by MIROC-ES2L. Land and ocean biogeochemical states at the end of the offline spin-up were used to initialize the LGM experiment in MIROC-ES2L. The LGM experiment was run for a further 1800 years until it eventually reached quasi-equilibrium. Surface air temperature of the final 500 model years showed a trend of 0.0002 ∘C yr−1. Model output from the final 100 years was submitted to PMIP4-CMIP6.
3.3 Setup and spin-up of the two interglacial experiments
The 6 and 127 ka experiments were spun up following the protocol outlined in Otto-Bliesner et al. (2017). The specified GHGs and orbital parameters were as listed in Table 1. The main difference between these periods and the PI period was the change in insolation attributable to Earth's orbit, as shown in Fig. 3b and c, where seasonality was amplified in the NH and diminished in the Southern Hemisphere.
Starting from PI, the 6 ka experiment was integrated for 1500 model years and the 127 ka experiment was integrated for 1550 model years (Fig. 4b and c). After the long spin-up, the final 100 years of the simulations were selected as the formal products to be submitted to CMIP6 and for analyses in this study. The 127 ka experiment is identical to the last interglacial (LIG) experiment in O'ishi et al. (2021).
3.4 Setup and spin-up of the last millennium and historical experiments
We performed the LM experiment following the protocol of Jungclaus et al. (2017). The experiment was forced with time-varying total solar irradiance (Shapiro et al., 2011; Vieira et al., 2011; Wu, 2017), orbit (Berger, 1978), GHGs (Meinshausen et al., 2017), volcanic eruptions (Sigl et al., 2015; Toohey and Sigl, 2017), ozone, and land use change (Hurtt et al., 2016) (Table 1). The experiment followed the same procedure as that of the historical experiment in CMIP6 (Eyring et al., 2016). From PI, the model was run under constant forcing from 850 CE for 200 model years (Fig. 4d). The end state of the spin-up was used to initialize the time-varying LM experiment, which was conducted from 850 to 1850 CE. We performed a HIST experiment following CMIP6 protocol (Eyring et al., 2016). The end state of the LM experiment was used to initialize HIST, which was run until 2014 CE.
4.1 PI mean climate
Hajima et al. (2019b) analyzed basic model performance for the present and indicated that MIROC-ES2L is a state-of-the-art ESM that is able to reproduce mean climatology reasonably well. Global annual mean air temperature at 2 m height is 14.99 ∘C and the peak value of the annual mean AMOC is 15.3 Sv, which falls within the range of reasonable estimates (Frajka-Williams et al., 2019). The peak AMOC is defined as the peak value of the area from 15–60∘ N and from 900–3300 m depth. Model SST presents a reasonable global distribution but has positive bias over the Southern Ocean, which leads to underestimation of the extent of Antarctic sea ice.
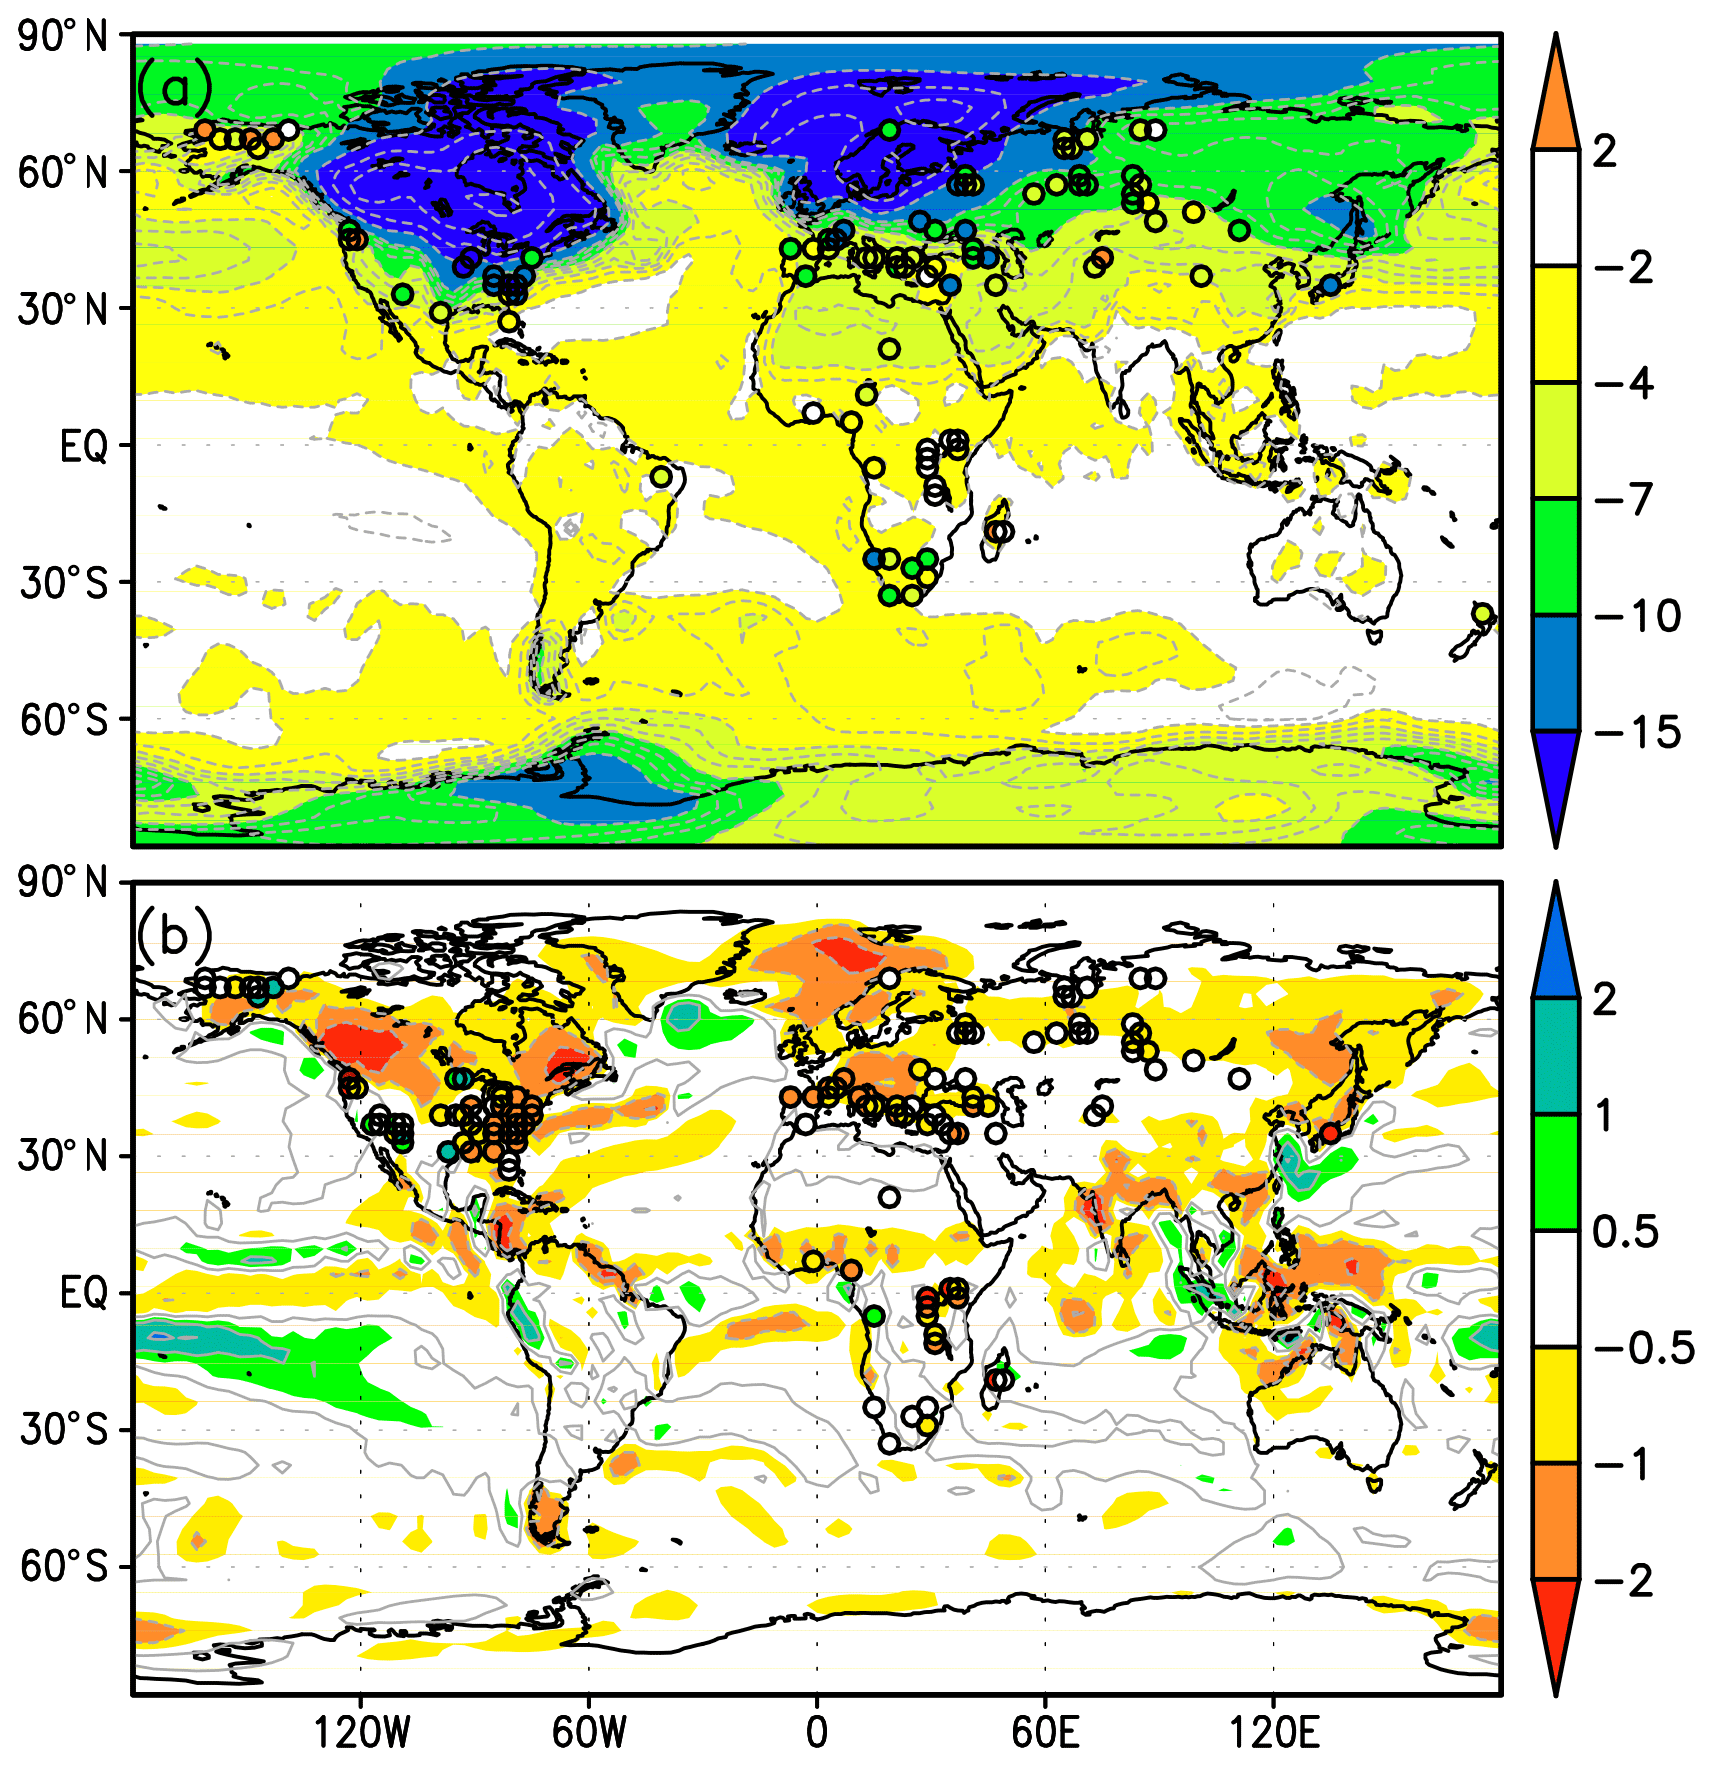
Figure 6(a) Air temperature anomaly at 2 m height (unit: ∘C) and (b) precipitation anomaly (unit: mm d−1). Anomalies are calculated as LGM relative to PI values. Circles denote values derived from proxy data (Bartlein et al., 2011).

Figure 7Meridional overturning streamfunction for the Atlantic Basin (unit: Sv) for (a) PI and (b) LGM.
4.2 LGM mean climate
Relative to PI, the final 100 years of the LGM has a global mean surface air temperature anomaly of −4.4 ∘C (Figs. 5a and 6a) and a tropical air temperature anomaly of approximately −2 ∘C, consistent with values derived from paleo-proxy archives (MARGO project members et al., 2009; Bartlein et al., 2011). Borehole thermometry suggested a temperature anomaly of the LGM relative to PI over Eastern Antarctica of −7 to −10 ∘C (Stenni et al., 2010; Uemura et al., 2012). The temperature anomaly in the model is approximately −6.0 ∘C, suggesting that cooling in the model is weak. For central Greenland, borehole thermometry suggested a temperature anomaly of −21 to −25 ∘C (Cuffey et al., 1995; Johnsen et al., 1995; Dahl-Jensen et al., 1998), whereas the model temperature anomaly is −11.1 ∘C. The large discrepancy between ice core data and model output could partly be attributed to issues related to the modeling of the thermohaline state of the ocean (McManus et al., 2004; Curry and Oppo, 2005). It is well known that numerical models have difficulty in reproducing the sluggish thermohaline circulation of the LGM (Otto-Bliesner et al., 2007; Muglia and Schmittner, 2015; Sherriff-Tadano et al., 2018) that is suggested in proxy data (Lynch-Stieglitz et al., 2007; Hesse et al., 2011). In our experiment, the peak value of the annual mean AMOC of the LGM is 21.0 Sv (Figs. 5b and 7), which is higher than that of PI. To address this issue, we will continue the experiment to identify the components that contribute to global cooling and those that contribute to cooling over the polar regions. The sharp gradient shown by the contour lines around 32∘ N would be caused by a strong and deep westerly boundary current and associated strong upwelling (Brady et al., 2013), which can be seen in the previous LGM modeling studies having strong AMOC (Brady et al., 2013; Muglia and Schmittner, 2015; Sherriff-Tadano et al., 2018).
Figure 6b shows the net precipitation anomaly relative to PI. Total precipitation is 1063 mm yr−1 for LGM and 1166 mm yr−1 for PI. Consistent with Bartlein et al. (2011), model precipitation has a general tendency to be lower for the LGM than for the PI period because the lower SSTs and colder climate of the LGM result in a weaker hydrological cycle, which is also shown in the weakened zonal water vapor transport (Fig. S1b). Large reductions in precipitation relative to PI are found in areas that were covered by ice sheets during the LGM but were no longer ice covered at PI, i.e., the areas covered by the Laurentide and Fennoscandian ice sheets. These large anomalies would be associated with the higher altitude of the ice surface relative to the ground surface when the ice sheets have disappeared. In the northern North Atlantic Ocean, large anomalies are associated with the southward expansion of sea ice during the LGM.
Anomalies of zonal mean oceanic potential temperature and salinity are shown in Fig. S2a and d. In the Southern Ocean, proxy data (Adkins et al., 2002) suggested anomalies of −2 ∘C and +2.5 PSU at around 3600 m depth. The underestimation might be attributed to too little sea ice formation, which would be related to a warm bias of the Southern Ocean (Hajima et al., 2020). In contrast, in the North Atlantic Ocean, the anomaly of salinity agrees with the proxy data (Adkins et al., 2002), whereas the temperature anomaly (−1 to −2 ∘C) is underestimated (−4 to −5 ∘C; Adkins et al., 2002). A temperature that is too warm could possibly be attributed to a high state of AMOC.
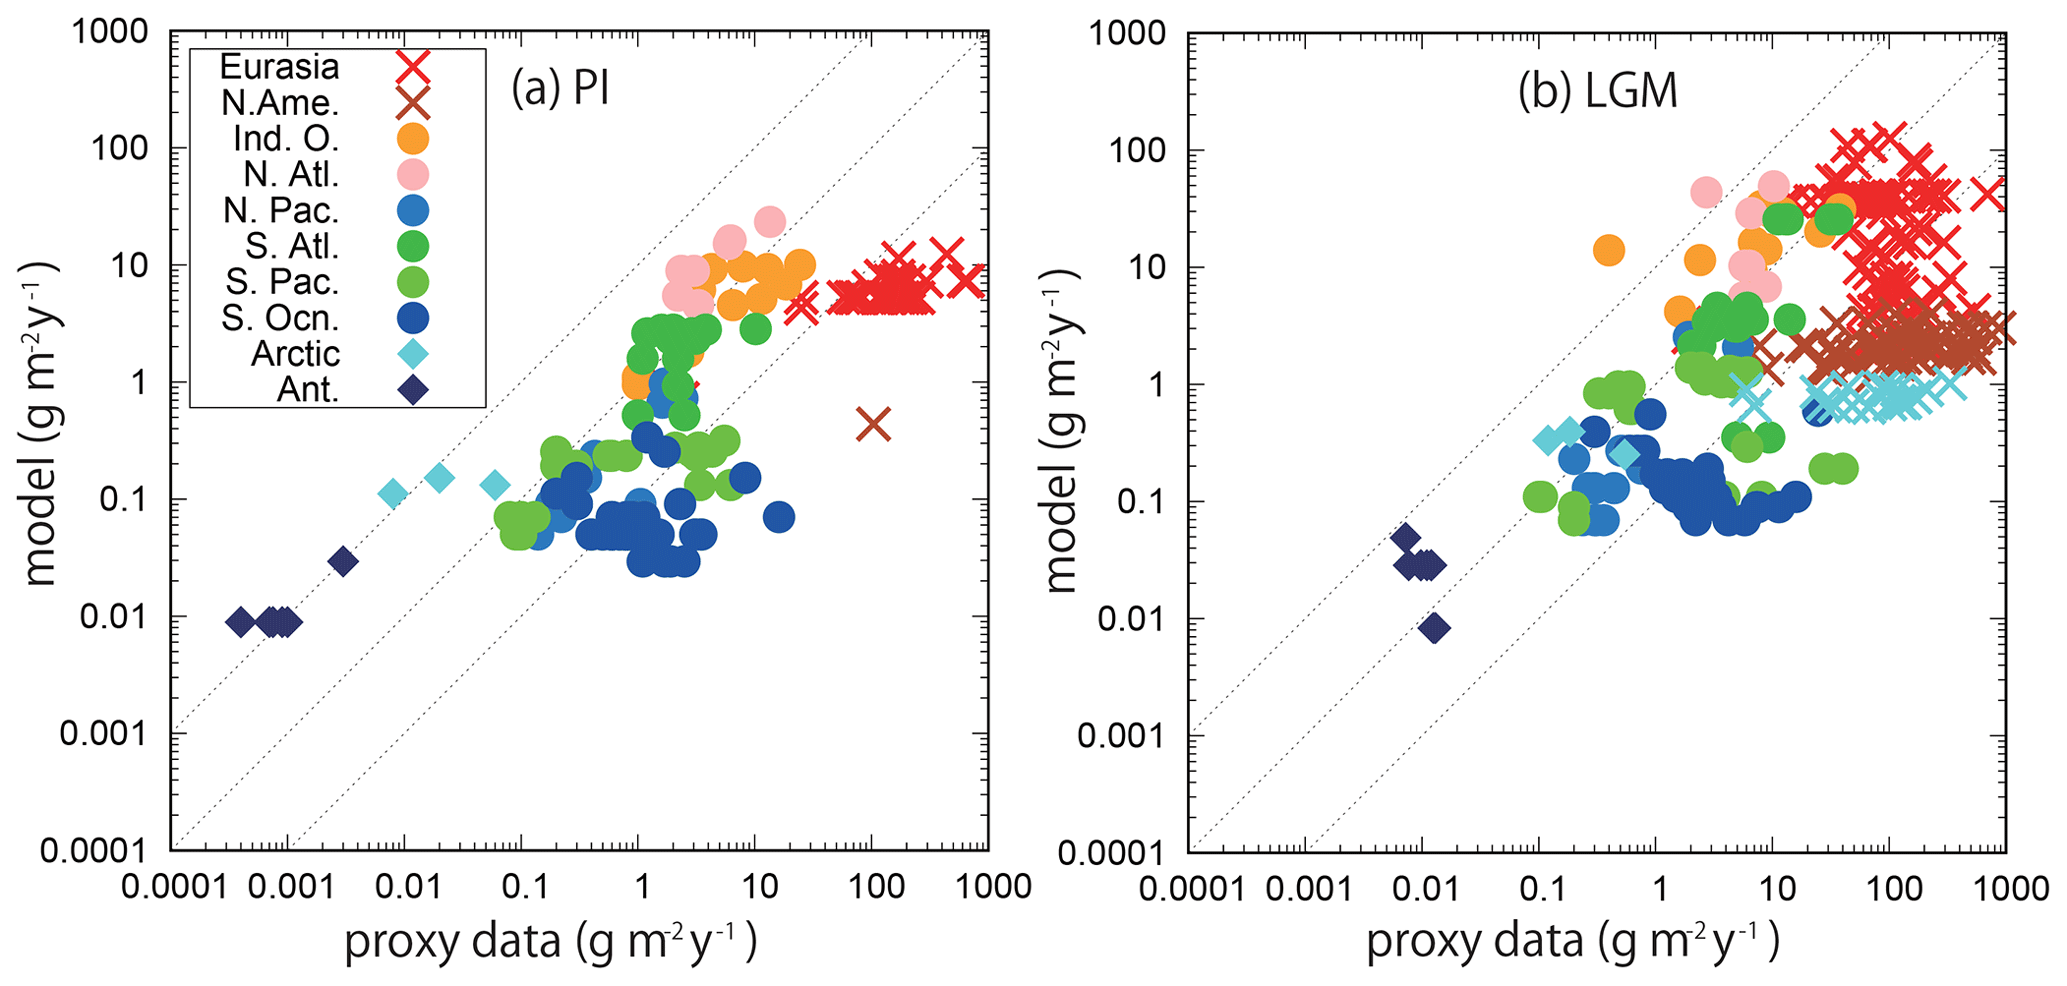
Figure 8Dust deposition from model output and derived from proxy archives (Kohfeld et al., 2013; Albani et al., 2014) for (a) PI and (b) LGM (g m−2 yr−1). Colors represent the locations of the proxy data, as explained in the legend in the figure. Crosses, circles, and diamonds represent terrestrial, marine, and ice core data.
In Fig. 8, we compare the dust deposition fluxes with data archives (Kohfeld et al., 2013; Albani et al., 2014). The distribution is also shown in Fig. S3. The model shows general consistency with the data archives globally, with positive bias in the PI over Antarctica and Greenland, and values that are insufficiently high in the Gobi and Taklamakan regions. The LGM shows better representation of the proxy data than the PI, with reasonable fluxes over Antarctica. However, it underestimates the high values that are abundant in the East Asian region and the high dust fluxes in North America. The LGM dust fluxes are shown in Fig. S3c as a ratio of the LGM dust fluxes to those of the PI. The ratio is generally well represented globally, but the ratio is underestimated in South America and in regions of the South Atlantic downstream of the wind. The reason for the underestimation, as mentioned above, is probably overestimation of South American dust emissions in the PI.
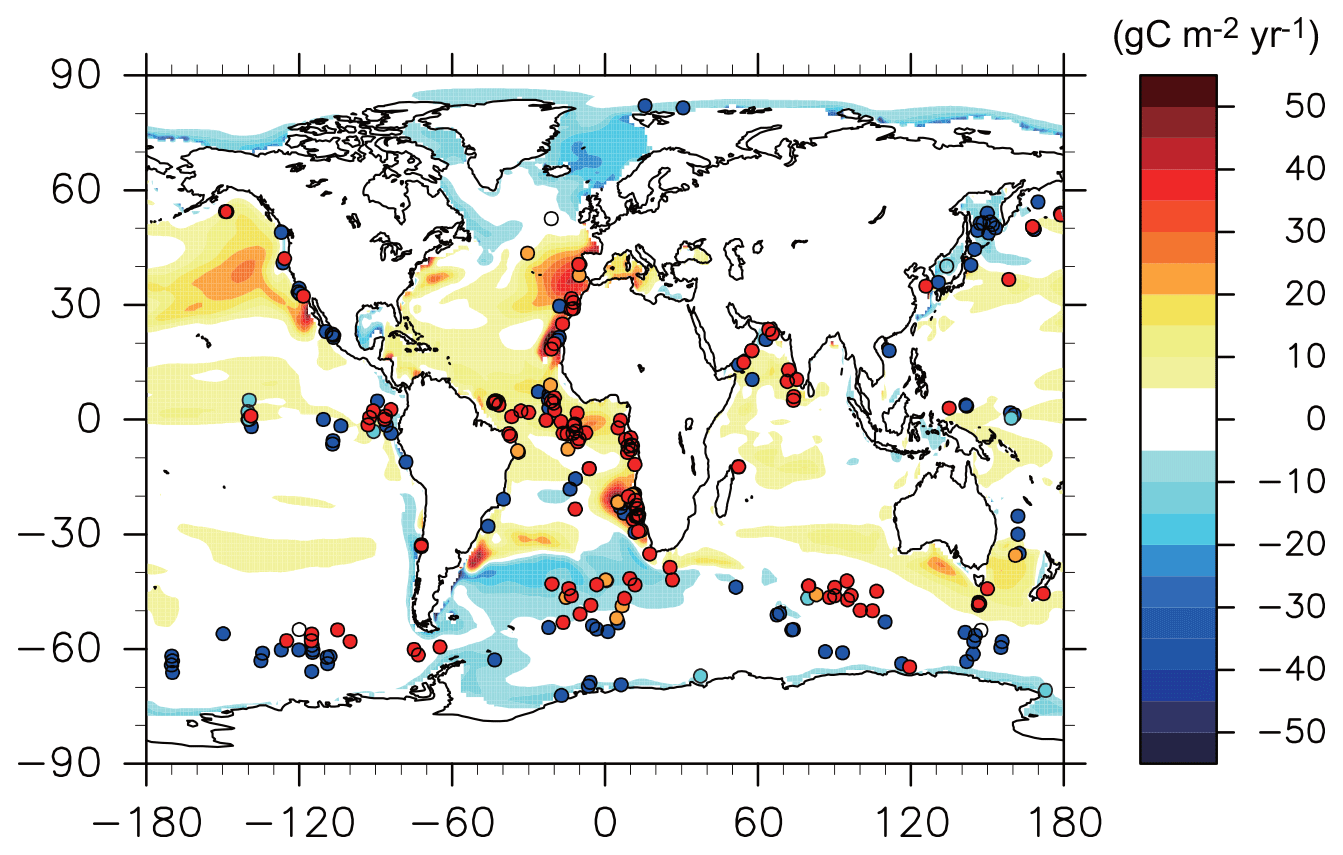
Figure 9Primary production anomaly of the oceanic ecosystem (unit: g C m−2 yr−1). Anomalies are calculated as LGM relative to PI values. Circles denote qualitative changes in primary production derived from proxy data (Kohfeld et al., 2013).
Figure 9 shows the export production anomaly of the oceanic ecosystem of the LGM relative to PI with paleo-proxy data (Kohfeld et al., 2013) superimposed on model output. As proxy data provide qualitative information rather than quantitative assessments, comparisons between model output and proxy data can only be used to evaluate the accuracy of the general direction of the model anomaly. Positive model anomalies over the low- to midlatitudes are consistent with the proxy data. Negative anomalies over the high latitudes can be understood to reflect sea ice expansion during the LGM. Sea ice expansion during the LGM is underestimated in the model (Crosta et al., 1998) and could result in negative anomalies around Antarctica that have smaller absolute values than those indicated by proxy data (Fig. 9).
An excessively weak positive anomaly around 40–50∘ S in LGM could be the result of dust emission being too high over South America in the PI experiment (Fig. 8). Mean global terrestrial gross primary production in the LGM experiment is 65 % of that in the PI experiment, which is consistent with the estimates of Prentice et al. (2011) obtained using a dynamic global vegetation model.
Table 2Changes in dissolved inorganic carbon, dissolved oxygen, and water-mass age from PI referred to the global ocean inventory or global ocean mean values. Values in brackets are the PI results. Upper (deep) ocean is above (below) 1000 m depth. Atmospheric CO2 concentration is prescribed in each experiment.
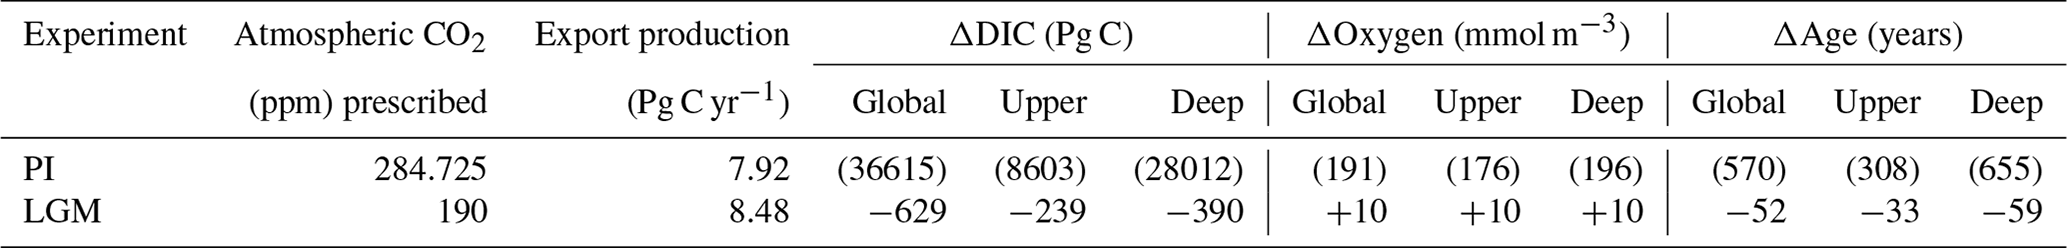
The dissolved inorganic carbon content of the ocean in LGM is 629 Pg C less than in the PI. Lowering the atmospheric CO2 to 190 ppm and strengthening of the overturning circulation lead to extraction of a large amount of carbon out of the ocean. Conversely, increased solubility due to cooling and enhanced biological carbon export because of increases in nutrient and iron supply from the ocean interior and dust lead to accumulation of carbon within the ocean. The former effects mainly contribute to carbon redistribution, resulting in reduction in the carbon content of 239 Pg C in the upper ocean and 390 Pg C in the deep ocean (Table 2 and Fig. S4). The simulated glacial ocean is therefore unable to explain the glacial–interglacial drawdown of atmospheric CO2, which is similar to previous modeling studies (Buchanan et al., 2016). It should be noted that the effects of burial–nutrient feedback and carbonate compensation on the oceanic carbon cycle are not considered in this simulation because MIROC-ES2L does not include a sediment module.
As the dissolved oxygen cycle is the mirror image of the biological carbon cycle, reconstructed oxygen change is useful to constrain the respired carbon accumulation. We compared modeled oxygen changes from PI to LGM with qualitative and quantitative proxy data (Jaccard et al., 2016; Durand et al., 2018; Schmiedl and Mackensen, 2006; Hoogakker et al., 2015, 2018; Gottschalk et al., 2016; Lu et al., 2016; Bunzel et al., 2017; Umling and Thunell, 2018). The combination of cooler SST and enhanced AMOC increases the oxygen content by approximately 10 mmol m−3 in both the upper and the deep ocean (Table 2). The simulated increases in oxygen are in reasonable agreement with the proxy data for the upper ocean but contrast the proxy data for the deep ocean, which show a decrease in oxygen of more than 30 mmol m−3 (Fig. S4). The model–proxy disagreement of deep-ocean oxygen change results in underestimation of the accumulated respired carbon.
The simulated deep-water-mass age is younger during the LGM than during the PI by approximately 60 years (Table 2), indicating an increase in ventilation due to enhanced AMOC. However, proxy data show an increase in water-mass age of more than 1000 years, suggesting reduced ventilation and weaker AMOC (Burke and Robinson, 2012; Curry and Oppo, 2005). Enhanced ventilation supplies oxygen-rich surface water to the deep ocean and simultaneously releases carbon accumulated in the deep water to the atmosphere. Therefore, we attribute the model–proxy disagreement of deep-ocean oxygen change and underestimation of respired carbon accumulation to overestimation of ventilation. Our results suggest that weaker AMOC is required for reproducing the respired carbon accumulation and deoxygenation in the glacial deep ocean.

Figure 10Seasonal temperature anomaly for (a) JJA and (c) DJF. Seasonal precipitation anomaly for (b) JJA and (d) DJF. Anomalies are calculated as 6 ka relative to PI values. Calendar adjustments are applied.
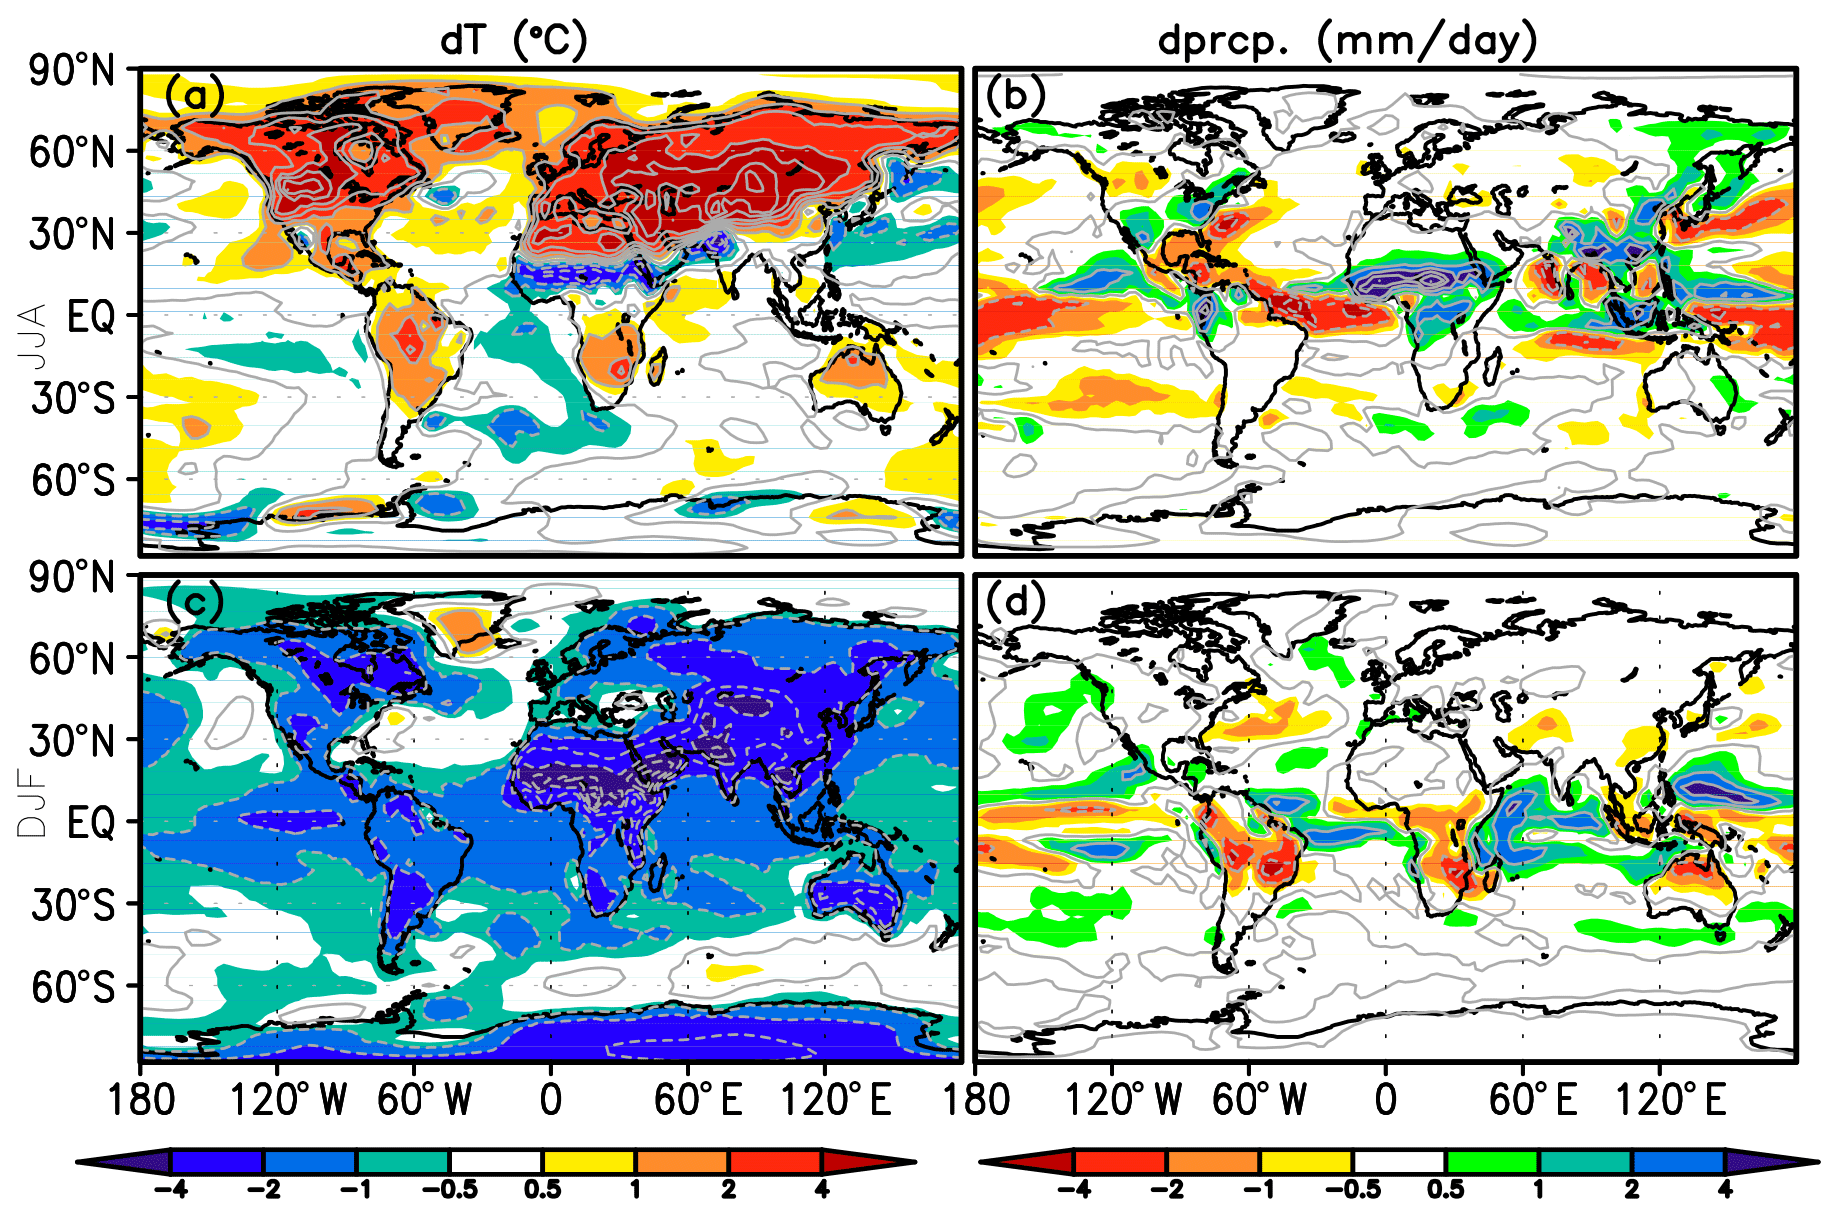
Figure 11Same as Fig. 10 but for 127 ka.
4.3 Mean changes in interglacial experiments
Figures 10 and 11 show air temperature and precipitation anomalies of 6 and 127 ka relative to PI. Because of the marked changes in seasonality in these time periods, adjustment of the calendar was applied and average anomalies were calculated for June–August (JJA) and December–February (DJF). Air temperature anomalies are positive over continental interiors in the mid–high latitudes in JJA for both 6 ka (Fig. 10a) and 127 ka (Fig. 11a) because of changes in shortwave radiation forcing. Compared with 6 ka, stronger shortwave forcing results in larger air temperature anomalies in 127 ka (Fig. 3).
Precipitation anomalies suggest that, relative to PI, boreal summer monsoons were stronger (Figs. 10b and 11b) and austral summer monsoons were weaker during the interglacials (Figs. 10d and 11d). The precipitation anomaly over the Sahel region suggests that the reduction of desert area during the interglacials relative to PI is smaller in the model than that suggested by proxy data (Petit-Maire, 1999; Castaneda, 2009; Tierney et al., 2017; Drake et al., 2011; Hely et al., 2014), which is a mismatch that has been persistent through many modeling efforts (Braconnot et al., 2000, 2007). The zonal water vapor transport is shown in Fig. S1c and d. Relative to PI, more water vapor is transported to northern Africa, and the amplitude is more pronounced in 127 than 6 ka following the radiation anomaly.
Variations of temperature and precipitation anomalies with season and latitude are shown in four Hovmöller diagrams in Fig. 12. The temperature anomaly responds to changes in solar radiation with a lag of approximately 1 month (Figs. 3b, c and 12a, b), which could be a consequence of the slow thermal response of the ocean surface. Precipitation anomalies of 6 and 127 ka, relative to PI, exhibit a northward shift and enhancement during boreal summer in the NH (Fig. 12c and d) which is consistent with Figs. 10b and 11.
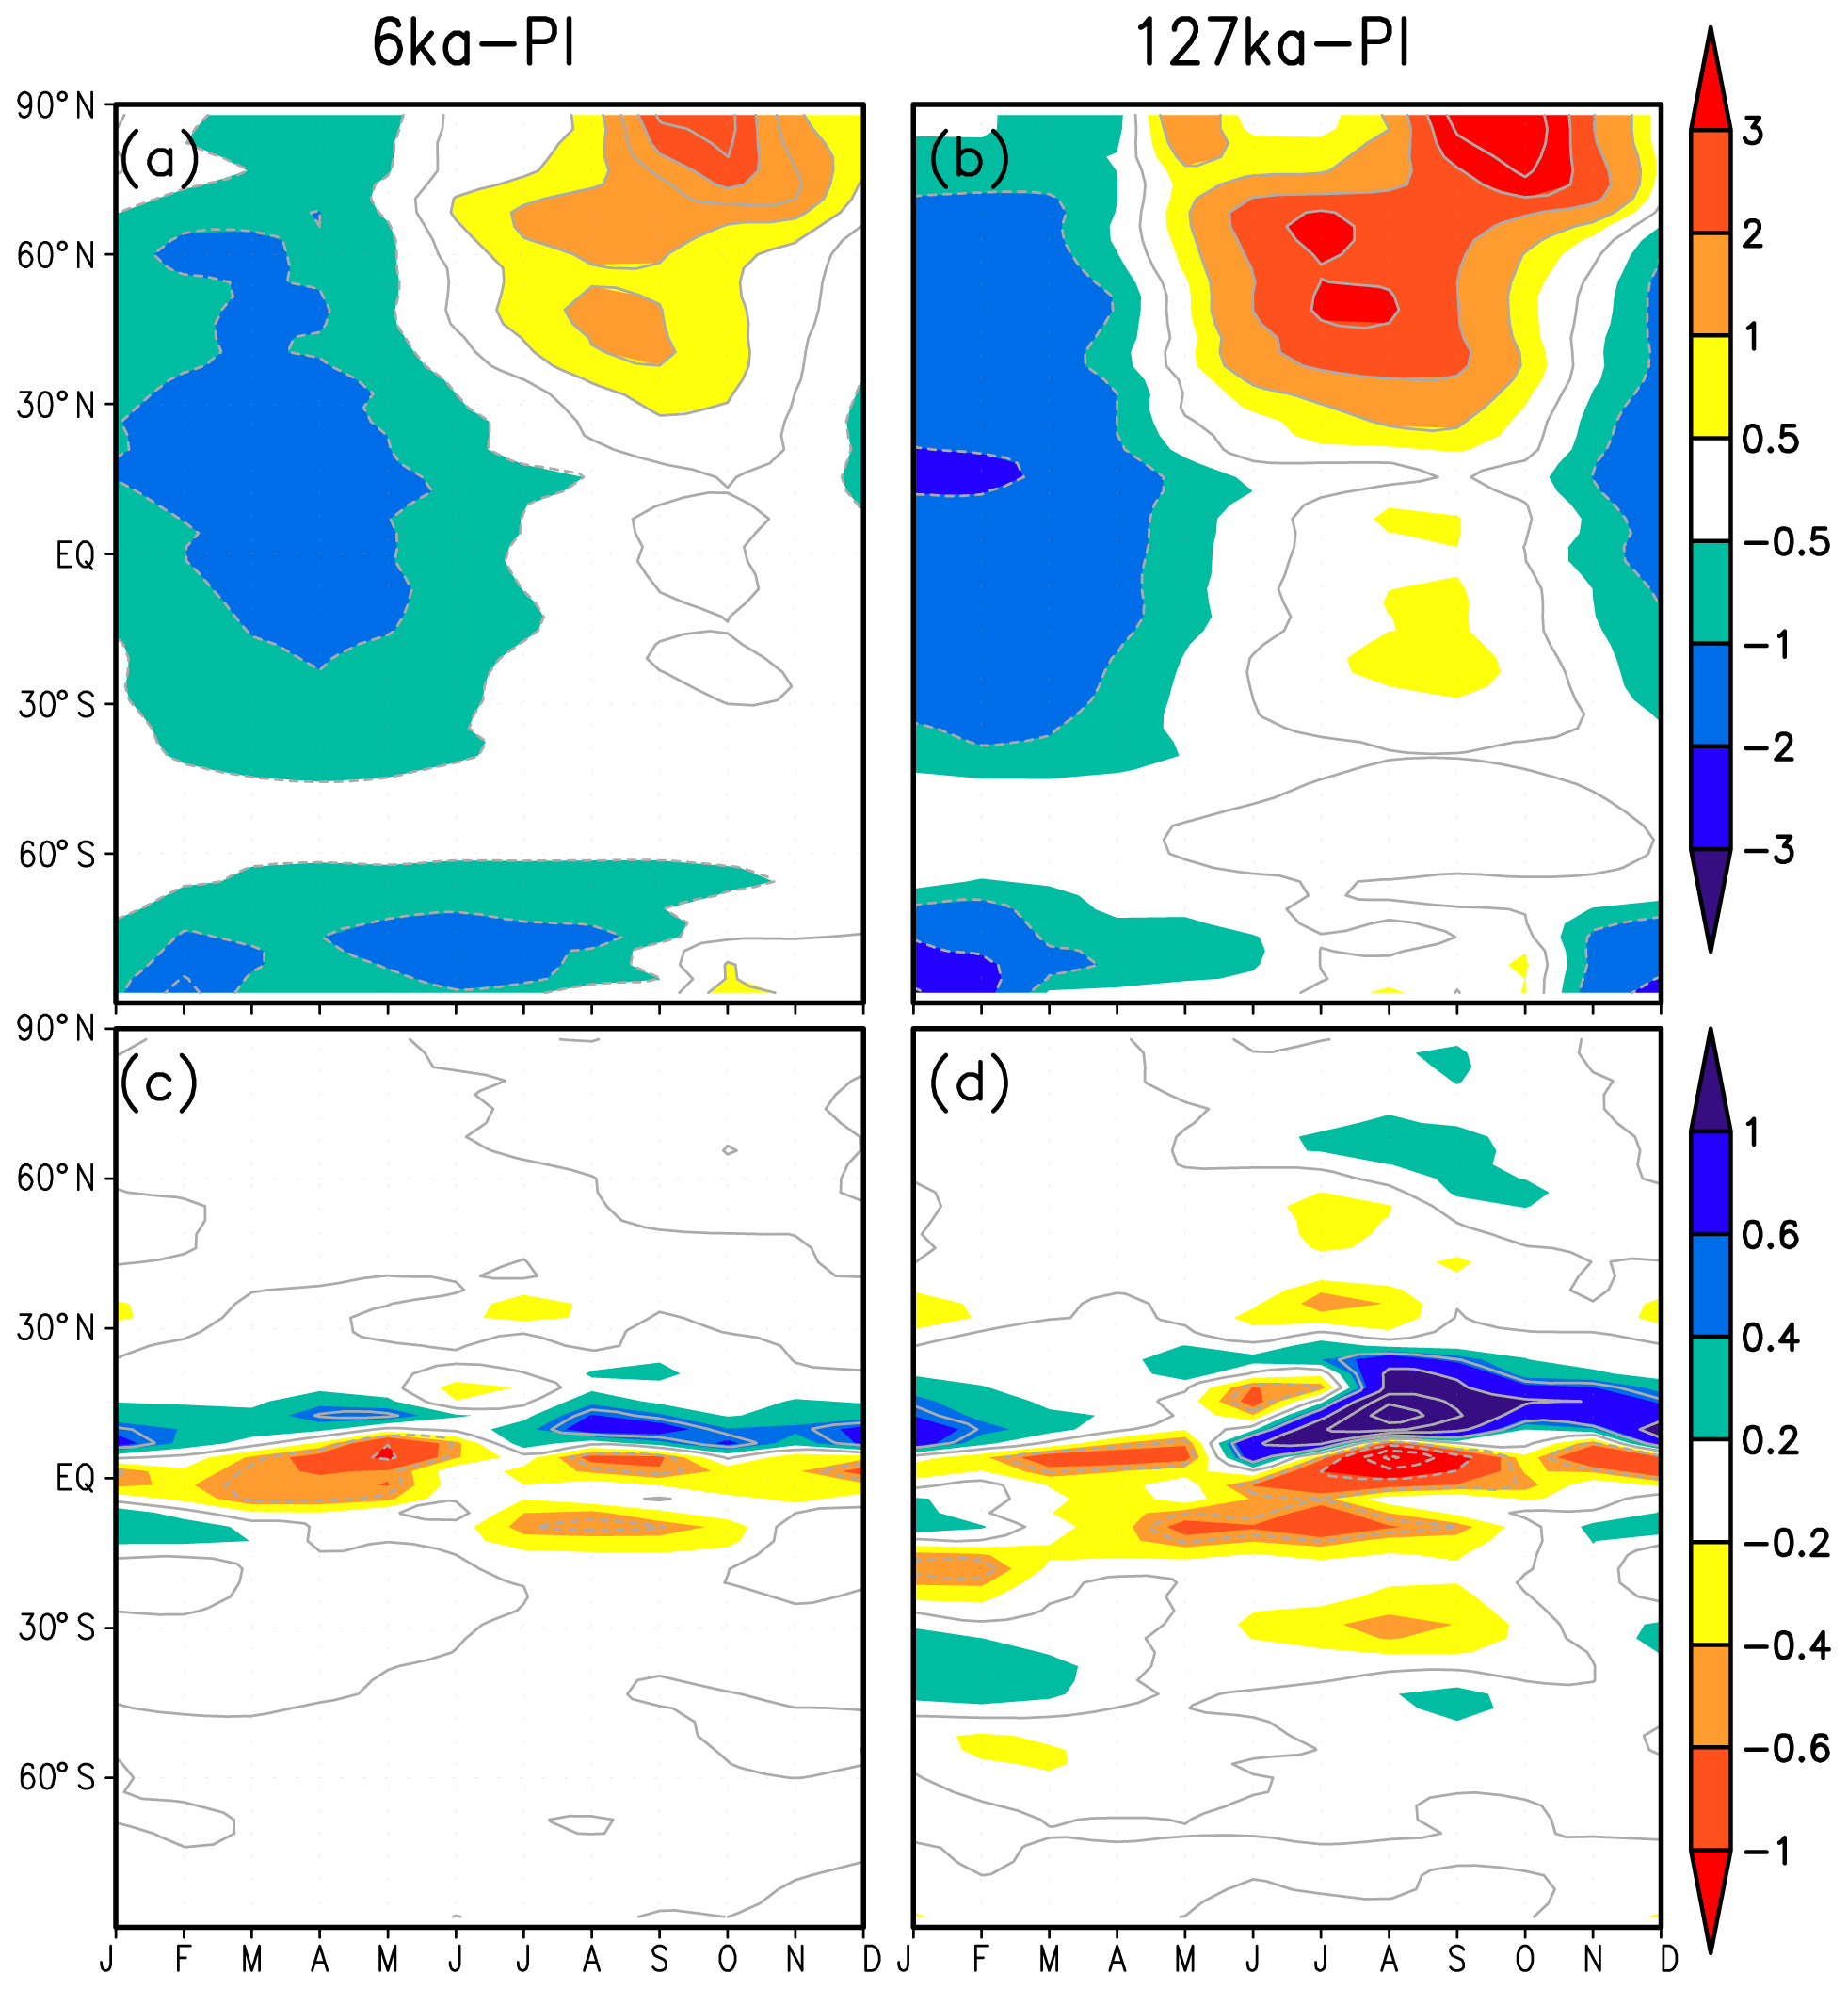
Figure 12Hovmöller diagrams for (a) air temperature anomaly at 2 m height (∘C) for 6 ka relative to PI, (b) air temperature anomaly at 2 m height (∘C) for 127 ka relative to PI, (c) precipitation anomaly (mm d−1) for 6 ka relative to PI, and (d) precipitation anomaly (mm d−1) for 127 ka relative to PI. Calendar adjustments are applied.
Figure S2 shows the anomaly of the zonal mean oceanic potential temperature and salinity of 6 and 127 ka relative to PI. Surface cooling is consistent with Fig. 12, and freshening would be the result of a more active water circulation in the NH. Strong freshening around 32∘ N in Fig. S2f is attributed to low salinity in the Mediterranean Sea.
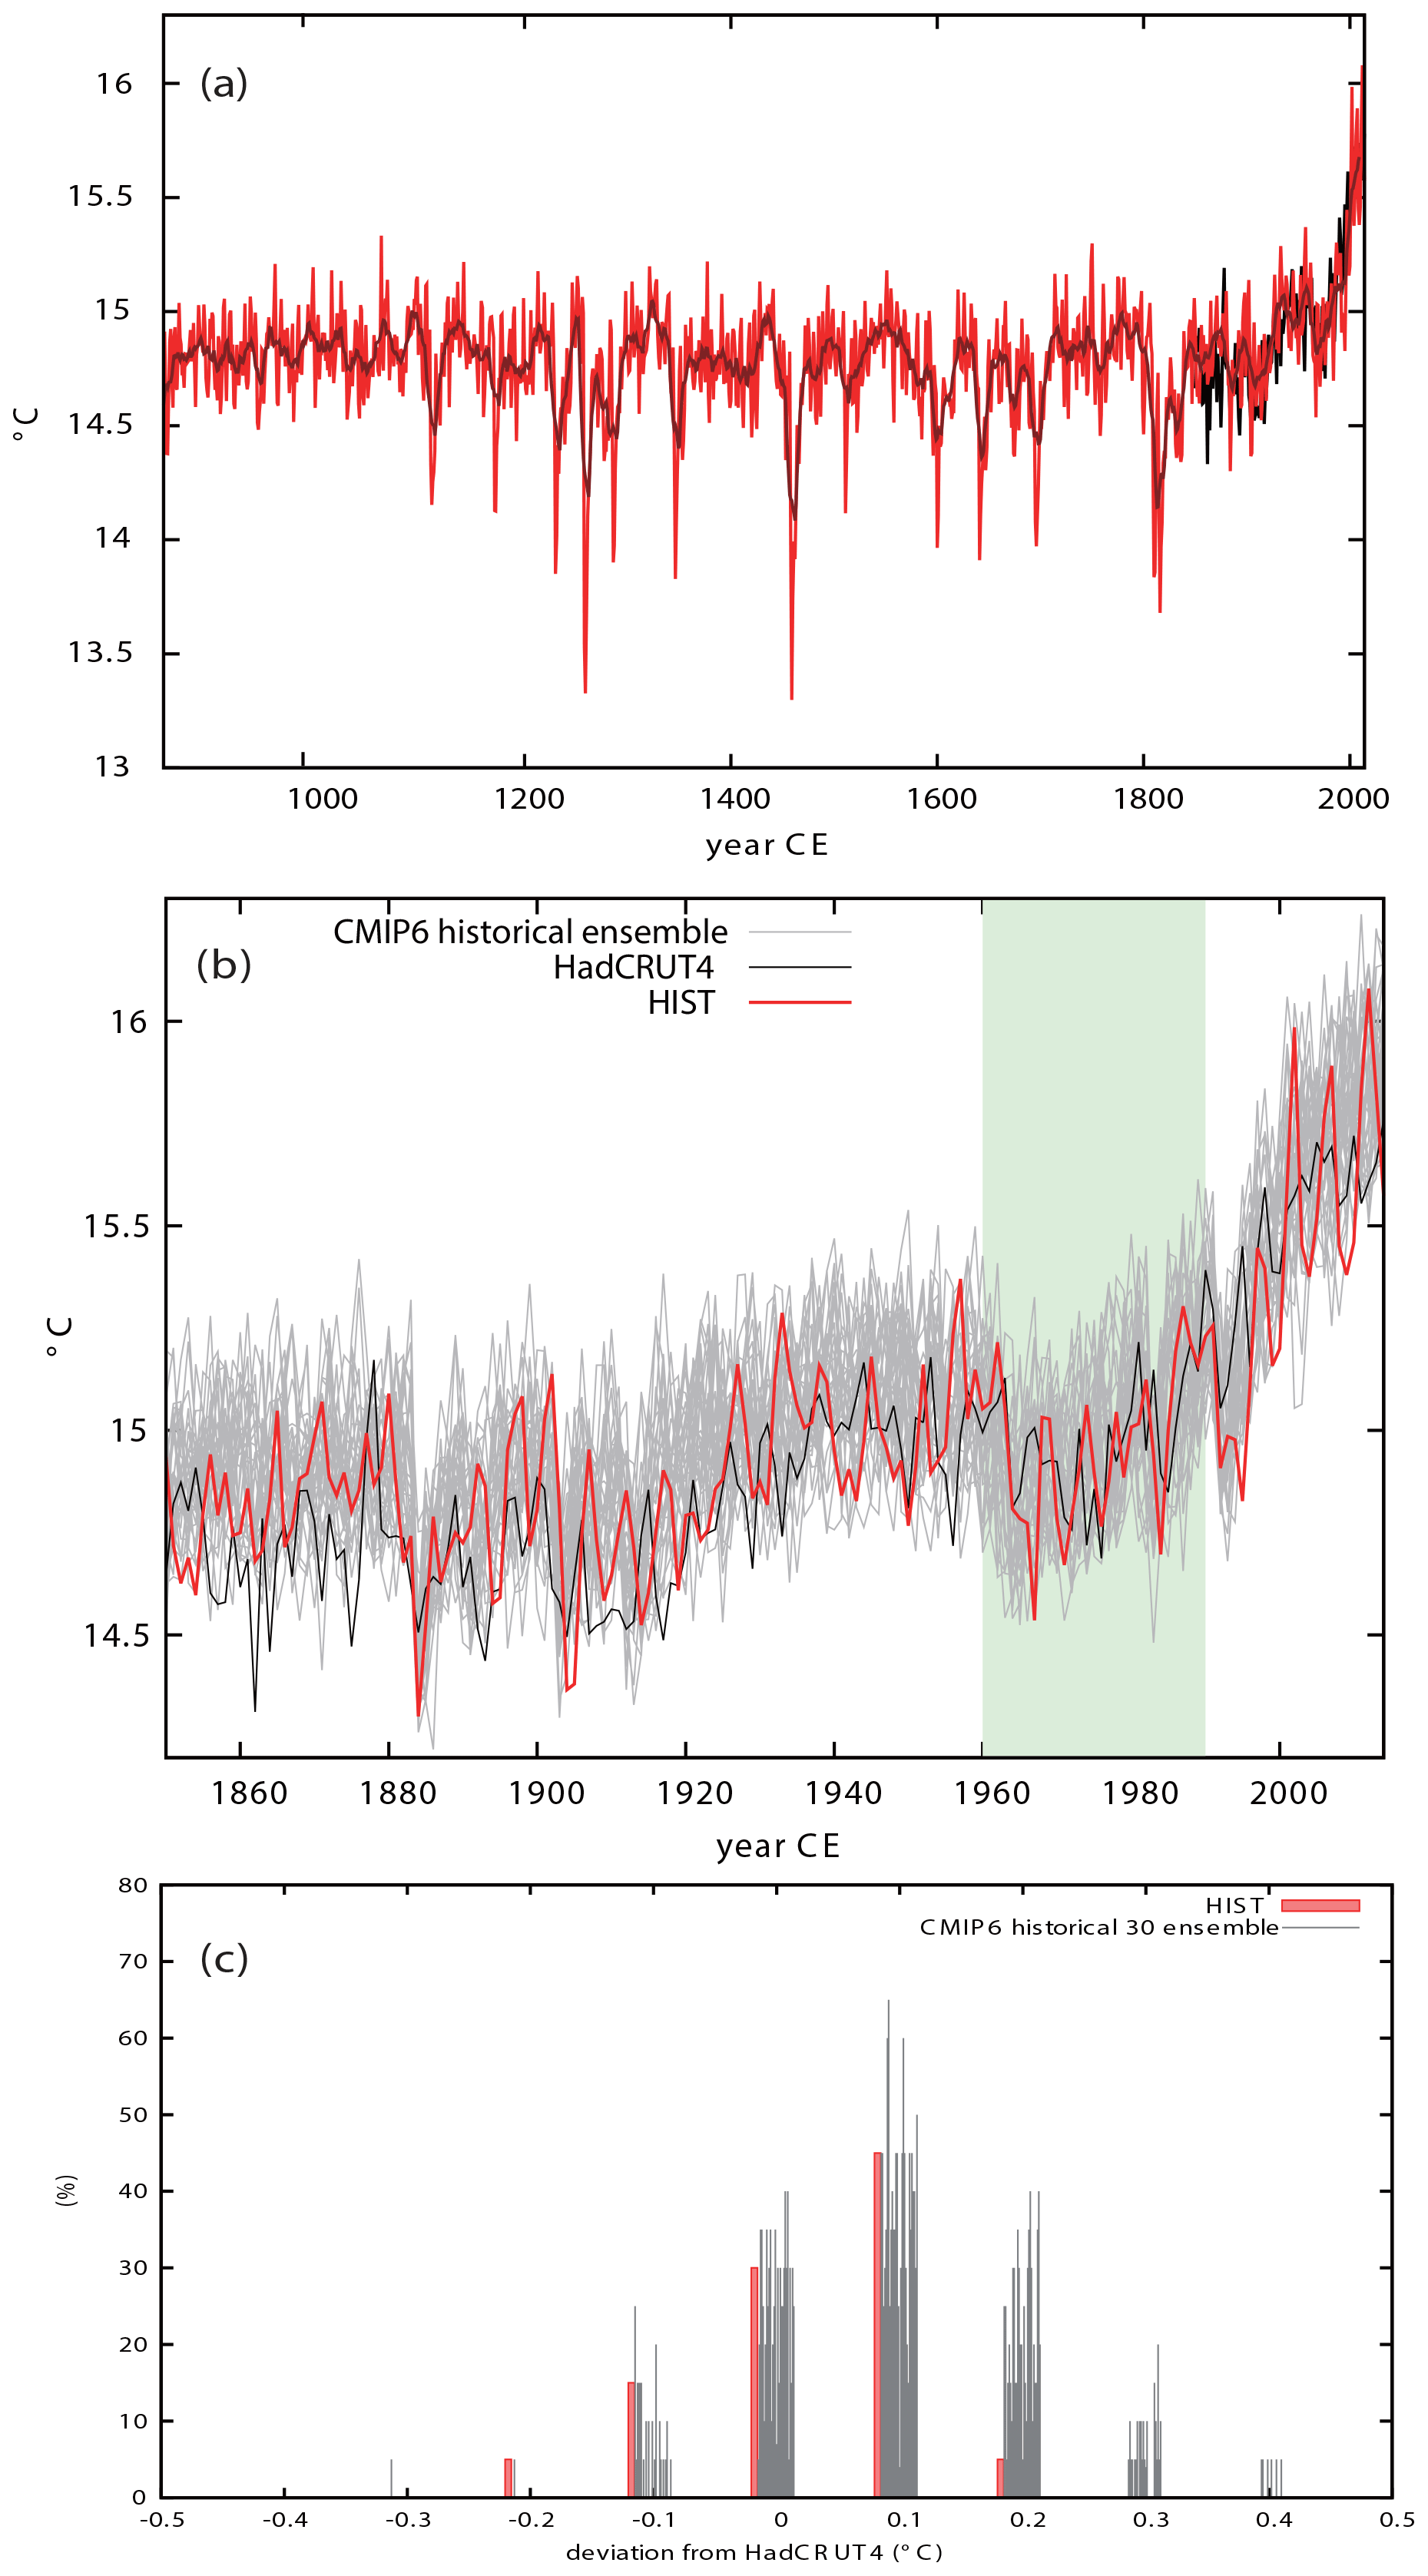
Figure 13(a) Annual mean air temperature (∘C) averaged over the Northern Hemisphere from the LM and HIST experiments (red: annual mean; dark red: 10-year running mean) and observational data from HadCRUT4 (black). (b) Annual mean air temperature (∘C) averaged over the Northern Hemisphere from 1850–2014 for HIST and 30 ensemble members of the historical experiments (gray) and HadCRUT4 (black). HadCRUT4 is scaled for the period from 1961–1990 (period shaded light green). (c) Histogram of deviations from HadCRUT4 shown in panel (b), averaged for every 5-year mean during 1850–1949, counted in 0.1 ∘C increments in bins. Red: HIST experiment; gray: CMIP6 historical ensemble of 30 members.
4.4 Last millennium and historical transient variabilities
Figure 13a shows the time series of annual mean NH air temperature of LM and HIST. Sharp cooling events are clear responses to huge volcanic eruptions. The effect of solar forcing on annual mean temperature is unclear, probably because the signals are small in comparison with internal variability.
The LIA is reasonably well expressed in the NH mean, but the warming during the Medieval Climate Anomaly (MCA; 950–1250 CE), which is suggested by proxy data, is underestimated by the model. The difference between the NH mean temperature of the LIA and that of the MCA is −0.1 ∘C, which is not statistically significant in Student's t test.
The HIST experiment was run for the period between 1850 and 2014 CE. Figure 13b shows the output of 30 ensembles of MIROC-ES2L historical experiments submitted to CMIP6 and data from the Hadley Centre – Climate Research Unit Temperature dataset version 4 (HadCRUT4) (Morice et al., 2012), which is scaled at the mean value of 1960–1989. Centennial variabilities of the NH mean temperature in HIST and in the CMIP6 historical experiments consistently show a positive trend during the first half of the 20th century, followed by a cooling trend until 1970 and then subsequent warming. In comparison with the standard historical experiments, HIST has a less positive bias (Fig. 13c).
Using MIROC-ES2L, an ESM that has recently been developed for CMIP6, we performed numerical experiments to examine the paleoclimate during several time periods and one historical experiment that was initiated from the LM experiment.
Globally, there was reasonable agreement between the climate states described by the model and those derived from proxy data, while some regional discrepancies remained. In this section, we summarize the results and explore the possible causes of the discrepancies.
From PI, LGM conditions were introduced step by step into MIROC-ES2L, and the LGM spin-up experiment was run for approximately 9000 model years. The temperature anomaly of LGM relative to PI over the tropics is negative and there is general quantitative agreement between the anomaly derived from the model and that from proxy data (Bartlein et al., 2011; MARGO project members et al., 2009). This could be useful in constraining future projections, given that Annan and Hargreaves (2006) and Renoult et al. (2020) revealed the correlation between tropical cooling at LGM and ECS. It has been pointed out in Stocker et al. (2013) Fifth Assessment Report that the cooling over Greenland during the LGM relative to PI is underestimated in the models. This could be attributed to strong AMOC in the models, which leads to an estimate of sea ice expansion over the northern Atlantic Ocean that is lower than suggested by proxy data. The anticorrelation between sea ice expansion and AMOC is known from observations (Bohm et al., 2015) and modeling (Peltier and Vettoretti, 2014). Intrusion of Antarctic bottom water into the Atlantic Basin is very weak in MIROC-ES2L, even in the PI experiment (Tatebe et al., 2018). Insufficient abyssal flow into the Atlantic Basin could be partly caused by the low resolution of the ocean component. Detailed analyses on the representation of atmospheric circulations would be necessary for further investigation. Model representation of the Southern Ocean might influence the distribution of CO2 between the atmosphere and the ocean (Moore et al., 2000). Anomalies associated with topography might be obscured by the low horizontal resolution of the model, resulting in discrepancies between climate states in the model and those derived from proxy data. Cooling of Eastern Antarctica during the LGM relative to PI, which is suggested by ice core data (−7 to −10 ∘C), is underestimated by this model (−6 ∘C), as explained in Sect. 4.2. This could be partly attributed to the positive SST bias over the Southern Ocean in the model at PI and subsequent underestimation of sea ice expansion. PMIP model analyses (Otto-Bliesner et al., 2007; Marozzochi and Jansen, 2017) also suggested the correlation of AMOC and sea ice coverage.
There is reasonable agreement between dust flux from the LGM experiment and that suggested by proxy data. However, the PI experiment overestimates dust emissions from South America. Thus, the change in dust emission between LGM and PI is likely to be underestimated in the model, leading to underestimates of LGM anomalies relative to PI for climate (Ohgaito et al., 2018) and ecosystem activity in the Southern Ocean (Yamamoto et al., 2019). Further studies will be necessary to investigate the impact of representing reasonable dust emission and loading on climate.
We prescribed conventional land PFTs in the LGM experiment, as discussed in Sect. 3.2. In models that comprise a coupled dynamic vegetation model, climate states would be altered through biophysical feedback because of changes in vegetation cover (O'ishi and Abe-Ouchi, 2013).
The LGM experiment was also performed in the previous phase of PMIP using MIROC-ESM (Sueyoshi et al., 2013), which is the previous version of MIROC-ES2L. Due to differences in forcing (mainly in terms of GHGs and ice sheets) and spin-up procedures, we are unable to make direct comparisons of the experiments conducted using the two versions of the model. However, there is a general tendency of the PMIP4 model to simulate less cooling at LGM relative to PI, which is a tendency that was also identified by Kageyama et al. (2020) in their comparison of LGM experiments from different versions of PMIP. Further sensitivity experiments using different boundary conditions could be helpful for identifying causes of this discrepancy. Although we conducted a long spin-up for the LGM experiment, the abyssal salinity and oceanic temperature are not representative of the structure suggested by proxy data. This discrepancy might reflect model biases, e.g., SST bias, and/or difficulty in representing the AMOC state of the LGM.
The two interglacial experiments (6 and 127 ka) include different orbital parameters and GHG levels, and had long spin-up times that exceeded 1400 years. Results showed warming over NH continents during boreal summer relative to PI, consistent with the direction of change suggested by proxy archives (Bartlein et al., 2011; Turney and Jones, 2010); however, the model underestimates the amount of warming. The discrepancy could be reduced by improving the experimental setup, such as replacing the prescription of PFTs by a process that could produce PFTs that are closer to the real conditions of the periods. The vegetation coupling greatly improves the representation of the warmings shown by proxies at the Arctic Ocean margin (O'ishi and Abe-Ouchi, 2011; O'ishi et al., 2021). On the other hand, some inconsistency remains in inland areas such as inner Eurasia. Pfeiffer and Lohmann (2016) suggested that we need to take into account the uncertainty of the times of the proxy data.
Compared with PI, temperature over the tropics is generally lower in the 6 ka experiment, which may partly be inconsistent with proxy data archives (Bartlein et al., 2011; Kaufman et al., 2020). Because the uncertainty of the marine proxies is so large (Hessler et al., 2014) that it is unlikely to be possible to identify positive or negative SST anomalies at 6 ka, we exclude them from our assessment here. However, cooling over the tropics could be considered a reasonable and direct response to net negative solar forcing. Thus, the discrepancy between the model and proxy data suggests that feedbacks that might play a role in the modeling of climate change are missing in the current model. Further improvement and expansion of the model would be necessary.
The precipitation anomaly shows a northward shift of peak precipitation in boreal summer in the NH. The precipitation anomaly over the Sahara in the model is still smaller than that suggested by the proxy data archive, which is a mismatch that has been persistent throughout the long history of PMIP. It might be necessary to include new processes to maintain higher soil moisture in the interglacials (Hopcroft et al., 2017).
The LM experiment performed in this study showed clear responses of global temperature to huge volcanic eruptions, while the responses of global temperature to other forcings were unclear. Responses to external forcings except volcanos are likely to be small in comparison with internal variabilities.
The difference between model NH mean temperature at the LIA and that at the MCA is too small to be statistically significant. However, earlier studies suggested that signals might be more pronounced at regional scales (PAGES 2k-PMIP3 group, 2015; Fernández-Donado et al., 2013); thus, further investigations regarding regional scales would be necessary. The HIST experiment was initiated from the end of the LM experiment and it produced time series of global temperatures that are similar to those from the other historical experiments that were initiated from PI (Hajima et al., 2020). This suggests that the initial conditions used for the standard historical experiment in CMIP6 are appropriate for the simulation of global temperatures in the industrial era. Sensitivity experiments using different boundary conditions would be useful for identifying causalities to obtain more details in future analyses.
Various difficulties can be expected in the realization of the LGM experiment. We encountered the most difficulty when we incorporated the LGM conditions step by step during the LGM spin-up.
Figure A1 shows the evolution of sea ice thickness on the north coast of North America (averaged over 70–75∘ N, 150–180∘ E; averaged for January to March) for the first half of the LGM spin-up. We lowered the GHG levels in step (1) in Fig. 5 and we changed the bathymetry and ice sheet grids (albedo) in step (2). The AMOC settled down after the shock spike, but sea ice built up to 50 m on one grid of the north coast of North America in the 3305th year in Fig. A1, which is the limit of acceptable thickness in the model, and thus the experiment was unable to continue (Fig. A1). After various trials and errors, the introduction of the LGM elevation (step 3) changed the atmospheric circulation field and prevented the sea ice from being pushed to the north coast of North America. Thus, the sea ice thickness settled within a range that allowed the experiment to continue. We do not know whether this happens in other models, but we release this information for reference in the event that other studies find continuation of the LGM experiment impossible.

Figure A1Average sea ice thickness (m) from January to March for the first half of the spin-up of the LGM experiment, averaged over 70–75∘ N, 150–180∘ E. The blue line: step 1, light blue: step 2, and yellow-green: step 3 in Fig. 5, respectively. For simplicity, data for 1 year for every 10 years are plotted.
The source code of MIROC-ES2L can be obtained from https://doi.org/10.5281/zenodo.3893386 (Ohgaito et al., 2020b). The source codes of the analyses and required input data can be found at https://doi.org/10.5281/zenodo.3893403 (Ohgaito et al., 2020c). The DOIs of the experiments are listed in Table 1 (https://doi.org/10.22033/ESGF/CMIP6.5710, Hajima et al., 2019a; https://doi.org/10.22033/ESGF/CMIP6.5644, Ohgaito et al., 2019a; https://doi.org/10.22033/ESGF/CMIP6.5646, Ohgaito et al., 2019b; https://doi.org/10.22033/ESGF/CMIP6.5645, O'ishi et al., 2019; https://doi.org/10.22033/ESGF/CMIP6.5666, Ohgaito et al., 2020a; https://doi.org/10.22033/ESGF/CMIP6.5602, Hajima et al., 2019b). The DOI for the historical experiments is https://doi.org/10.22033/ESGF/CMIP6.5602 (Hajima et al., 2019b). The model outputs derived in this study are freely available through the Earth System Grid Federation (ESGF). Details regarding the ESGF can be found on the website of the CMIP Panel (https://www.wcrp-climate.org/wgcm-cmip/wgcm-cmip6, last access: 10 November 2020).
The supplement related to this article is available online at: https://doi.org/10.5194/gmd-14-1195-2021-supplement.
RuO coordinated, prepared the boundaries, conducted the LGM, 6 ka, and LM experiments, analyzed the results, and wrote the manuscript. AY conducted offline spin-up of the ocean ecosystem experiments for LGM, analyzed the results, and wrote the manuscript. TH developed and provided MIROC-ES2L and the offline land ecosystem model and advised on conducting the experiments. RyO conducted the 127 ka experiment and provided code for the calendar adjustment. MA prepared most of the boundary conditions of the LM experiment and submitted the data to the ESGF. HT helped prepare the ocean mask for the LGM experiment. All authors contributed to discussions and improvement of the manuscript.
The authors declare that they have no conflict of interest.
This work was supported by the TOUGOU project “Integrated Research Program for Advancing Climate Models” (grant no. JPMXD0717935715) of Ministry of Education, Culture, Sports, Science, and Technology of Japan (MEXT). The authors acknowledge funding from MEXT KAKENHI (grant nos. 17H06323, 17H06104) and JAMSTEC for use of the Earth Simulator supercomputer. We would like to thank Qiong Zhang and an anonymous reviewer for their suggestions to greatly improve this work. We thank Osamu Arakawa for his support regarding data management and submission of data to the ESGF. We thank Dai Yamazaki and Takashi Obase for providing the river and height data for the LGM. We thank the TOUGOU-b team for discussions and advice regarding the experiments. We thank Tina Tin and James Buxton from Edanz Group (https://en-author-services.edanzgroup.com/, last access: 24 February 2021) for editing a draft of the manuscript.
This research has been supported by the Ministry of Education, Culture, Sports, Science, and Technology of Japan (TOUGOU (grant nos. JPMXD0717935715 and 17H06104)).
This paper was edited by Julia Hargreaves and reviewed by Qiong Zhang and one anonymous referee.
Adkins, J. F., McIntyre, K., and Schrag, D. P.: The salinity, temperature, and delta O-18 of the glacial deep ocean, Science, 298, 1769–1773, 2002.
Albani, S., Mahowald, N. M., Perry, A. T., Scanza, R. A., Zender, C. S., Heavens, N. G., Maggi, V., Kok, J. F., and Otto-Bliesner, B. L.: Improved dust representation in the Community Atmosphere Model, J. Adv. Model. Earth Sy., 6, 541–570, https://doi.org/10.1002/2013ms000279, 2014.
Albani, S., Mahowald, N. M., Murphy, L. N., Raiswell, R., Moore, J. K., Anderson, R. F., McGee, D., Bradtmiller, L. I., Delmonte, B., Hesse, P. P., and Mayewski, P. A.: Paleodust variability since the Last Glacial Maximum and implications for iron inputs to the ocean, Geophys. Res. Lett., 43, 3944–3954, https://doi.org/10.1002/2016gl067911, 2016.
Annan, J. D. and Hargreaves, J. C.: Using multiple observationally-based constraints to estimate climate sensitivity, Geophys. Res. Lett., 33, L06704, https://doi.org/10.1029/2005gl025259, 2006.
Atwood, A. R., Wu, E., Frierson, D. M. W., Battisti, D. S., and Sachs, J. P.: Quantifying Climate Forcings and Feedbacks over the Last Millennium in the CMIP5-PMIP3 Models, J. Climate, 29, 1161–1178, https://doi.org/10.1175/jcli-d-15-0063.1, 2016.
Bartlein, P. J., Harrison, S. P., Brewer, S., Connor, S., Davis, B. A. S., Gajewski, K., Guiot, J., Harrison-Prentice, T. I., Henderson, A., Peyron, O., Prentice, I. C., Scholze, M., Seppa, H., Shuman, B., Sugita, S., Thompson, R. S., Viau, A. E., Williams, J., and Wu, H.: Pollen-based continental climate reconstructions at 6 and 21 ka: a global synthesis, Clim. Dynam., 37, 775–802, https://doi.org/10.1007/s00382-010-0904-1, 2011.
Bereiter, B., Eggleston, S., Schmitt, J., Nehrbass-Ahles, C., Stocker, T. F., Fischer, H., Kipfstuhl, S., and Chappellaz, J.: Revision of the EPICA Dome C CO2 record from 800 to 600 kyr before present, Geophys. Res. Lett., 42, 542–549, https://doi.org/10.1002/2014gl061957, 2015.
Berger, A. L.: Long-Term Variations of Daily Insolation and Quaternary Climatic Changes, J. Atmos. Sci., 35, 2362–2367, https://doi.org/10.1175/1520-0469(1978)035<2362:ltvodi>2.0.co;2, 1978.
Bohm, E., Lippold, J., Gutjahr, M., Frank, M., Blaser, P., Antz, B., Fohlmeister, J., Frank, N., Andersen, M. B., and Deininger, M.: Strong and deep Atlantic meridional overturning circulation during the last glacial cycle, Nature, 517, 73–U170, 2015.
Braconnot, P., Joussaume, S., de Noblet, N., and Ramstein, G.: Mid-holocene and Last Glacial Maximum African monsoon changes as simulated within the Paleoclimate Modelling Intercomparison Project, Global Planet. Change, 26, 51–66, 2000.
Braconnot, P., Otto-Bliesner, B., Harrison, S., Joussaume, S., Peterchmitt, J.-Y., Abe-Ouchi, A., Crucifix, M., Driesschaert, E., Fichefet, Th., Hewitt, C. D., Kageyama, M., Kitoh, A., Laîné, A., Loutre, M.-F., Marti, O., Merkel, U., Ramstein, G., Valdes, P., Weber, S. L., Yu, Y., and Zhao, Y.: Results of PMIP2 coupled simulations of the Mid-Holocene and Last Glacial Maximum – Part 1: experiments and large-scale features, Clim. Past, 3, 261–277, https://doi.org/10.5194/cp-3-261-2007, 2007.
Braconnot, P., Harrison, S. P., Kageyama, M., Bartlein, P. J., Masson-Delmotte, V., Abe-Ouchi, A., Otto-Bliesner, B., and Zhao, Y.: Evaluation of climate models using palaeoclimatic data, Nat. Clim. Change, 2, 417–424, https://doi.org/10.1038/nclimate1456, 2012.
Brady, E. C., Otto-Bliesner, B. L., Kay, J. E., and Rosenbloom, N.: Sensitivity to Glacial Forcing in the CCSM4, J. Climate, 26, 1901–1925, https://doi.org/10.1175/jcli-d-11-00416.1, 2013.
Brierley, C. M., Zhao, A., Harrison, S. P., Braconnot, P., Williams, C. J. R., Thornalley, D. J. R., Shi, X., Peterschmitt, J.-Y., Ohgaito, R., Kaufman, D. S., Kageyama, M., Hargreaves, J. C., Erb, M. P., Emile-Geay, J., D'Agostino, R., Chandan, D., Carré, M., Bartlein, P. J., Zheng, W., Zhang, Z., Zhang, Q., Yang, H., Volodin, E. M., Tomas, R. A., Routson, C., Peltier, W. R., Otto-Bliesner, B., Morozova, P. A., McKay, N. P., Lohmann, G., Legrande, A. N., Guo, C., Cao, J., Brady, E., Annan, J. D., and Abe-Ouchi, A.: Large-scale features and evaluation of the PMIP4-CMIP6 midHolocene simulations, Clim. Past, 16, 1847–1872, https://doi.org/10.5194/cp-16-1847-2020, 2020.
Buchanan, P. J., Matear, R. J., Lenton, A., Phipps, S. J., Chase, Z., and Etheridge, D. M.: The simulated climate of the Last Glacial Maximum and insights into the global marine carbon cycle, Clim. Past, 12, 2271–2295, https://doi.org/10.5194/cp-12-2271-2016, 2016.
Bunzel, D., Schmiedl, G., Lindhorst, S., Mackensen, A., Reolid, J., Romahn, S., and Betzler, C.: A multi-proxy analysis of Late Quaternary ocean and climate variability for the Maldives, Inner Sea, Clim. Past, 13, 1791–1813, https://doi.org/10.5194/cp-13-1791-2017, 2017.
Burke, A. and Robinson, L. F.: The Southern Ocean's role in carbon exchange during the last deglaciation, Science, 335, 557–561, 2012.
Camenisch, C., Keller, K. M., Salvisberg, M., Amann, B., Bauch, M., Blumer, S., Brázdil, R., Brönnimann, S., Büntgen, U., Campbell, B. M. S., Fernández-Donado, L., Fleitmann, D., Glaser, R., González-Rouco, F., Grosjean, M., Hoffmann, R. C., Huhtamaa, H., Joos, F., Kiss, A., Kotyza, O., Lehner, F., Luterbacher, J., Maughan, N., Neukom, R., Novy, T., Pribyl, K., Raible, C. C., Riemann, D., Schuh, M., Slavin, P., Werner, J. P., and Wetter, O.: The 1430s: a cold period of extraordinary internal climate variability during the early Spörer Minimum with social and economic impacts in north-western and central Europe, Clim. Past, 12, 2107–2126, https://doi.org/10.5194/cp-12-2107-2016, 2016.
Capron, E., Govin, A., Stone, E. J., Masson-Delmotte, V., Mulitza, S., Otto-Bliesner, B., Rasmussen, T. L., Sime, L. C., Waelbroeck, C., and Wolff, E. W.: Temporal and spatial structure of multi-millennial temperature changes at high latitudes during the Last Interglacial, Quaternary Sci. Rev., 103, 116–133, https://doi.org/10.1016/j.quascirev.2014.08.018, 2014.
Capron, E., Govin, A., Feng, R., Otto-Bliesner, B. L., and Wolff, E. W.: Critical evaluation of climate syntheses to benchmark CMIP6/PMIP4 127 ka Last Interglacial simulations in the high-latitude regions, Quaternary Sci. Rev., 168, 137–150, https://doi.org/10.1016/j.quascirev.2017.04.019, 2017.
Castaneda, I. S., Mulitza, S., Schefuss, E., dos Santos, R. A. L., Damste, J. S. S., and Schouten, S.: Wet phases in the Sahara/Sahel region and human migration patterns in North Africa, P. Natl. Acad. Sci. USA, 106, 20159–20163, https://doi.org/10.1073/pnas.0905771106, 2009.
Crosta, X., Pichon, J. J., and Burckle, L. H.: Application of modern analog technique to marine Antarctic diatoms: Reconstruction of maximum sea-ice extent at the Last Glacial Maximum, Paleoceanography, 13, 284–297, https://doi.org/10.1029/98pa00339, 1998.
Crowley, T. J.: Causes of climate change over the past 1000 years, Science, 289, 270–277, https://doi.org/10.1126/science.289.5477.270, 2000.
Cuffey, K. M., Clow, G. D., Alley, R. B., Stuiver, M., Waddington, E. D., and Saltus, R. W.: Large Arctic Temperature-Change at the Wisconsi-Holocene Glacial Transition, Science, 270, 455–458, 1995.
Curry, W. B. and Oppo, D. W.: Glacial water mass geometry and the distribution of delta C-13 of Sigma CO2 in the western Atlantic Ocean, Paleoceanography, 20, PA1017, https://doi.org/10.1029/2004pa001021, 2005.
Dahl Jensen, D., Mosegaard, K., Gundestrup, N., Clow, G. D., Johnsen, S. J., Hansen, A. W., and Balling, N.: Past temperatures directly from the Greenland Ice Sheet, Science, 282, 268–271, 1998.
Dome Fuji Ice Core Project Members, Kawamura, K., Abe-Ouchi, A., Motoyama, H., Ageta, Y., Aoki, S., Azuma, N., Fujii, Y., Fujita, K., Fujita, S., Fukui, K., Furukawa, T., Furusaki, A., Goto-Azuma, K., Greve, R., Hirabayashi, M., Hondoh, T., Hori, A., Horikawa, S., Horiuchi, K., Igarashi, M., Iizuka, Y., Kameda, T., Kanda, H., Kohno, M., Kuramoto, T., Matsushi, Y., Miyahara, M., Miyake, T., Miyamoto, A., Nagashima, Y., Nakayama, Y., Nakazawa, T., Nakazawa, F., Nishio, F., Obinata, I., Ohgaito, R., Oka, A., Okuno, J., Okuyama, J., Oyabu, I., Parrenin, F., Pattyn, F., Saito, F., Saito, T., Sakurai, T., Sasa, K., Seddik, H., Shibata, Y., Shinbori, K., Suzuki, K., Suzuki, T., Takahashi, A., Takahashi, K., Takahashi, S., Takata, M., Tanaka, Y., Uemura, R., Watanabe, G., Watanabe, O., Yamasaki, T., Yokoyama, K., Yoshimori, M., Yoshimoto, T., and Dome Fuji Ice Core, P.: State dependence of climatic instability over the past 720,000 years from Antarctic ice cores and climate modeling, Sci. Adv., 3, https://doi.org/10.1126/sciadv.1600446, 2017.
Drake, N. A., Blench, R. M., Armitage, S. J., Bristow, C. S., and White, K. H.: Ancient watercourses and biogeography of the Sahara explain the peopling of the desert, P. Natl. Acad. Sci. USA, 108, 458–462, https://doi.org/10.1073/pnas.1012231108, 2011.
Durand, A., Chase, Z., Noble, T. L., Bostock, H., Jaccard, S. L., Townsend, A. T., Bindoff, N. L., Neil, H., and Jacobsen, G.: Reduced oxygenation at intermediate depth of the southwest Pacific during the last glacial maximum, Earth Planet. Sc. Lett., 491, 48–57, 2018.
Eyring, V., Gleckler, P. J., Heinze, C., Stouffer, R. J., Taylor, K. E., Balaji, V., Guilyardi, E., Joussaume, S., Kindermann, S., Lawrence, B. N., Meehl, G. A., Righi, M., and Williams, D. N.: Towards improved and more routine Earth system model evaluation in CMIP, Earth Syst. Dynam., 7, 813–830, https://doi.org/10.5194/esd-7-813-2016, 2016.
Fernández-Donado, L., González-Rouco, J. F., Raible, C. C., Ammann, C. M., Barriopedro, D., García-Bustamante, E., Jungclaus, J. H., Lorenz, S. J., Luterbacher, J., Phipps, S. J., Servonnat, J., Swingedouw, D., Tett, S. F. B., Wagner, S., Yiou, P., and Zorita, E.: Large-scale temperature response to external forcing in simulations and reconstructions of the last millennium, Clim. Past, 9, 393–421, https://doi.org/10.5194/cp-9-393-2013, 2013.
Frajka-Williams, E., Ansorge, I. J., Baehr, J., Bryden, H. L., Chidichimo, M. P., Cunningham, S. A., Danabasoglu, G., Dong, S. F., Donohue, K. A., Elipot, S., Heimbach, P., Holliday, N. P., Hummels, R., Jackson, L. C., Karstensen, J., Lankhorst, M., Le Bras, I. A., Lozier, M. S., McDonagh, E. L., Meinen, C. S., Mercier, H., Moat, B. I., Perez, R. C., Piecuch, C. G., Rhein, M., Srokosz, M. A., Trenberth, K. E., Bacon, S., Forget, G., Goni, G., Kieke, D., Koelling, J., Lamont, T., McCarthy, G. D., Mertens, C., Send, U., Smeed, D. A., Speich, S., van den Berg, M., Volkov, D., and Wilson, C.: Atlantic Meridional Overturning Circulation: Observed Transport and Variability, Front. Mar. Sci., 6, 260, https://doi.org/10.3389/fmars.2019.00260, 2019.
Gagen, M. H., Zorita, E., McCarroll, D., Zahn, M., Young, G. H. F., and Robertson, I.: North Atlantic summer storm tracks over Europe dominated by internal variability over the past millennium, Nat. Geosci., 9, 630–635, https://doi.org/10.1038/ngeo2752, 2016.
Goosse, H., Renssen, H., Timmermann, A., and Bradley, R. S.: Internal and forced climate variability during the last millennium: a model-data comparison using ensemble simulations, Quaternary Sci. Rev., 24, 1345–1360, https://doi.org/10.1016/j.quascirev.2004.12.009, 2005.
Gottschalk, J., Skinner, L. C., Lippold, J., Vogel, H., Frank, N., Jaccard, S. L., and Waelbroeck, C.: Biological and physical controls in the Southern Ocean on past millennialscale atmospheric CO2 changes, Nat. Commun., 7, 11539, https://doi.org/10.1038/ncomms11539, 2016.
Gregory, J. M., Ingram, W., Palmer, M., Jones, G., Stott, P., Thorpe, R., Lowe, J., Johns, T., and Williams, K.: A new method for diagnosing radiative forcing and climate sensitivity, Geophys. Res. Lett., 31, L03205, https://doi.org/10.1029/2003GL018747, 2004.
Hajima, T., Abe, M., Arakawa, O., Suzuki, T., Komuro, Y., Ogura, T., Ogochi, K., Watanabe, M., Yamamoto, A., Tatebe, H., Noguchi, M. A., Ohgaito, R., Ito, A., Yamazaki, D., Ito, A., Takata, K., Watanabe, S., Kawamiya, M., and Tachiiri, K.: MIROC MIROC-ES2L model output prepared for CMIP6 CMIP piControl, Earth System Grid Federation, https://doi.org/10.22033/ESGF/CMIP6.5710, 2019a.
Hajima, T., Abe, M., Arakawa, O., Suzuki, T., Komuro, Y., Ogura, T., Ogochi, K., Watanabe, M., Yamamoto, A., Tatebe, H., Noguchi, M. A., Ohgaito, R., Ito, A., Yamazaki, D., Ito, A., Takata, K., Watanabe, S., Kawamiya, M., and Tachiiri, K.: MIROC MIROC-ES2L model output prepared for CMIP6 CMIP historical, Version 20191118, Earth System Grid Federation, https://doi.org/10.22033/ESGF/CMIP6.5602, 2019b.
Hajima, T., Watanabe, M., Yamamoto, A., Tatebe, H., Noguchi, M. A., Abe, M., Ohgaito, R., Ito, A., Yamazaki, D., Okajima, H., Ito, A., Takata, K., Ogochi, K., Watanabe, S., and Kawamiya, M.: Development of the MIROC-ES2L Earth system model and the evaluation of biogeochemical processes and feedbacks, Geosci. Model Dev., 13, 2197–2244, https://doi.org/10.5194/gmd-13-2197-2020, 2020.
Hargreaves, J. C., Annan, J. D., Ohgaito, R., Paul, A., and Abe-Ouchi, A.: Skill and reliability of climate model ensembles at the Last Glacial Maximum and mid-Holocene, Clim. Past, 9, 811–823, https://doi.org/10.5194/cp-9-811-2013, 2013.
Hély, C., Lézine, A.-M., and contributors, A.: Holocene changes in African vegetation: tradeoff between climate and water availability, Clim. Past, 10, 681–686, https://doi.org/10.5194/cp-10-681-2014, 2014.
Hesse, T., Butzin, M., Bickert, T., and Lohmann, G.: A model-data comparison of delta C-13 in the glacial Atlantic Ocean, Paleoceanography, 26, A3220, https://doi.org/10.1029/2010pa002085, 2011.
Hessler, I., Harrison, S. P., Kucera, M., Waelbroeck, C., Chen, M.-T., Anderson, C., de Vernal, A., Fréchette, B., Cloke-Hayes, A., Leduc, G., and Londeix, L.: Implication of methodological uncertainties for mid-Holocene sea surface temperature reconstructions, Clim. Past, 10, 2237–2252, https://doi.org/10.5194/cp-10-2237-2014, 2014.
Hoffman, J. S., Clark, P. U., Parnell, A. C., and He, F.: Regional and global sea-surface temperatures during the last interglaciation, Science, 355, 276–279, 2017.
Hoogakker, B. A. A., Elderfield, H., Schmiedl, G., McCave, I. N., and Rickaby, R. E. M.: Glacial–interglacial changes in bottom water oxygen content on the Portuguese margin, Nat. Geosci., 8, 40–43, https://doi.org/10.1038/ngeo2317, 2015.
Hoogakker, B. A. A., Lu, Z., Umling, N., Jones, L., Zhou, X., Rickaby, R. E. M., Thunell, R., Cartapanis, O., and Galbraith, E.: Glacial expansion of oxygen-depleted seawater in the eastern tropical Pacific, Nature, 562, 410–413, https://doi.org/10.1038/s41586-018-0589-x, 2018.
Hopcroft, P. O., Valdes, P. J., Harper, A. B., and Beerling, D. J.: Multi vegetation model evaluation of the Green Sahara climate regime, Geophys. Res. Lett., 44, 6804–6813, https://doi.org/10.1002/2017gl073740, 2017.
Hurtt, G. C., Thomas, R. Q., Fisk, J. P., Dubayah, R. O., and Sheldon, S. L.: The Impact of Fine-Scale Disturbances on the Predictability of Vegetation Dynamics and Carbon Flux, Plos One, 11, e0152883, https://doi.org/10.1371/journal.pone.0152883, 2016.
Ito, A. and Inatomi, M.: Use of a process-based model for assessing the methane budgets of global terrestrial ecosystems and evaluation of uncertainty, Biogeosciences, 9, 759–773, https://doi.org/10.5194/bg-9-759-2012, 2012.
Jaccard, S. L., Galbraith, E. D., Martínez-García, A., and Anderson, R. F.: Covariation of deep Southern Ocean oxygenation and atmospheric CO2 through the last ice age, Nature, 530, 207–210, https://doi.org/10.1038/nature16514, 2016.
Johnsen, S. J., Dahljensen, D., Dansgaard, W., and Gundestrup, N.: Greenland Paleotemperatures derived from grip bore hole temperature and ice core isotope profiles, Tellus B, 47, 624–629, https://doi.org/10.1034/j.1600-0889.47.issue5.9.x, 1995.
Joussaume, S., Taylor, K. E., Braconnot, P., Mitchell, J. F. B., Kutzbach, J. E., Harrison, S. P., Prentice, I. C., Broccoli, A. J., Abe-Ouchi, A., Bartlein, P. J., Bonfils, C., Dong, B., Guiot, J., Herterich, K., Hewitt, C. D., Jolly, D., Kim, J. W., Kislov, A., Kitoh, A., Loutre, M. F., Masson, V., McAvaney, B., McFarlane, N., de Noblet, N., Peltier, W. R., Peterschmitt, J. Y., Pollard, D., Rind, D., Royer, J. F., Schlesinger, M. E., Syktus, J., Thompson, S., Valdes, P., Vettoretti, G., Webb, R. S., and Wyputta, U.: Monsoon changes for 6000 years ago: Results of 18 simulations from the Paleoclimate Modeling Intercomparison Project (PMIP), Geophys. Res. Lett., 26, 859–862, https://doi.org/10.1029/1999gl900126, 1999.
Jouzel, J., Masson-Delmotte, V., Cattani, O., Dreyfus, G., Falourd, S., Hoffmann, G., Minster, B., Nouet, J., Barnola, J. M., Chappellaz, J., Fischer, H., Gallet, J. C., Johnsen, S., Leuenberger, M., Loulergue, L., Luethi, D., Oerter, H., Parrenin, F., Raisbeck, G., Raynaud, D., Schilt, A., Schwander, J., Selmo, E., Souchez, R., Spahni, R., Stauffer, B., Steffensen, J. P., Stenni, B., Stocker, T. F., Tison, J. L., Werner, M., and Wolff, E. W.: Orbital and millennial Antarctic climate variability over the past 800,000 years, Science, 317, 793–796, https://doi.org/10.1126/science.1141038, 2007.
Jungclaus, J. H., Bard, E., Baroni, M., Braconnot, P., Cao, J., Chini, L. P., Egorova, T., Evans, M., González-Rouco, J. F., Goosse, H., Hurtt, G. C., Joos, F., Kaplan, J. O., Khodri, M., Klein Goldewijk, K., Krivova, N., LeGrande, A. N., Lorenz, S. J., Luterbacher, J., Man, W., Maycock, A. C., Meinshausen, M., Moberg, A., Muscheler, R., Nehrbass-Ahles, C., Otto-Bliesner, B. I., Phipps, S. J., Pongratz, J., Rozanov, E., Schmidt, G. A., Schmidt, H., Schmutz, W., Schurer, A., Shapiro, A. I., Sigl, M., Smerdon, J. E., Solanki, S. K., Timmreck, C., Toohey, M., Usoskin, I. G., Wagner, S., Wu, C.-J., Yeo, K. L., Zanchettin, D., Zhang, Q., and Zorita, E.: The PMIP4 contribution to CMIP6 – Part 3: The last millennium, scientific objective, and experimental design for the PMIP4 past1000 simulations, Geosci. Model Dev., 10, 4005–4033, https://doi.org/10.5194/gmd-10-4005-2017, 2017.
Kageyama, M., Albani, S., Braconnot, P., Harrison, S. P., Hopcroft, P. O., Ivanovic, R. F., Lambert, F., Marti, O., Peltier, W. R., Peterschmitt, J.-Y., Roche, D. M., Tarasov, L., Zhang, X., Brady, E. C., Haywood, A. M., LeGrande, A. N., Lunt, D. J., Mahowald, N. M., Mikolajewicz, U., Nisancioglu, K. H., Otto-Bliesner, B. L., Renssen, H., Tomas, R. A., Zhang, Q., Abe-Ouchi, A., Bartlein, P. J., Cao, J., Li, Q., Lohmann, G., Ohgaito, R., Shi, X., Volodin, E., Yoshida, K., Zhang, X., and Zheng, W.: The PMIP4 contribution to CMIP6 – Part 4: Scientific objectives and experimental design of the PMIP4-CMIP6 Last Glacial Maximum experiments and PMIP4 sensitivity experiments, Geosci. Model Dev., 10, 4035–4055, https://doi.org/10.5194/gmd-10-4035-2017, 2017.
Kageyama, M., Braconnot, P., Harrison, S. P., Haywood, A. M., Jungclaus, J. H., Otto-Bliesner, B. L., Peterschmitt, J.-Y., Abe-Ouchi, A., Albani, S., Bartlein, P. J., Brierley, C., Crucifix, M., Dolan, A., Fernandez-Donado, L., Fischer, H., Hopcroft, P. O., Ivanovic, R. F., Lambert, F., Lunt, D. J., Mahowald, N. M., Peltier, W. R., Phipps, S. J., Roche, D. M., Schmidt, G. A., Tarasov, L., Valdes, P. J., Zhang, Q., and Zhou, T.: The PMIP4 contribution to CMIP6 – Part 1: Overview and over-arching analysis plan, Geosci. Model Dev., 11, 1033–1057, https://doi.org/10.5194/gmd-11-1033-2018, 2018.
Kageyama, M., Harrison, S. P., Kapsch, M.-L., Löfverström, M., Lora, J. M., Mikolajewicz, U., Sherriff-Tadano, S., Vadsaria, T., Abe-Ouchi, A., Bouttes, N., Chandan, D., LeGrande, A. N., Lhardy, F., Lohmann, G., Morozova, P. A., Ohgaito, R., Peltier, W. R., Quiquet, A., Roche, D. M., Shi, X., Schmittner, A., Tierney, J. E., and Volodin, E.: The PMIP4-CMIP6 Last Glacial Maximum experiments: preliminary results and comparison with the PMIP3-CMIP5 simulations, Clim. Past Discuss. [preprint], https://doi.org/10.5194/cp-2019-169, in review, 2020.
Kaufman, D., McKay, N., Routson, C., Erb, M., Davis, B., Heiri, O., Jaccard, S., Tierney, J., Dätwyler, C., Axford, Y., Brussel, T., Cartapanis, O., Chase, B., Dawson, A., de Vernal, A., Engels, S., Jonkers, L., Marsicek, J., Moffa-Sánchez, P., Morrill, C., Orsi, A., Rehfeld, K., Saunders, K., Sommer, P. S., Thomas, E., Tonello, M., Tóth, M., Vachula, R., Andreev, A., Bertrand, S., Biskaborn, B., Bringué, M., Brooks, S., Caniupán, M., Chevalier, M., Cwynar, L., Emile-Geay, J., Fegyveresi, J., Feurdean, A., Finsinger, W., Fortin, M.-C., Foster, L., Fox, M., Gajewski, K., Grosjean, M., Hausmann, S., Heinrichs, M., Holmes, N., Ilyashuk, B., Ilyashuk, E., Juggins, S., Khider, D., Koinig, K., Langdon, P., Larocque-Tobler, I., Li, J., Lotter, A., Luoto, T., Mackay, A., Magyari, E., Malevich, S., Mark, B., Massaferro, J., Montade, V., Nazarova, L., Novenko, E., Pařil, P., Pearson, E., Peros, M., Pienitz, R., Płociennik, M., Porinchu, D., Potito, A., Rees, A., Reinemann, S., Roberts, S., Rolland, N., Salonen, S., Self, A., Sepp a, H., Shala, S., St-Jacques, J.-M., Stenni, B., Syrykh, L., Tarrats, P., Taylor, K., van den Bos, V., Velle, G., Wahl, E., Walker, I., Wilmshurst, J., Zhang, E., and Zhilich, S.: A global database of Holocene paleo-temperature records, Sci. Data, 7, 115, https://doi.org/10.1038/s41597-020-0445-3, 2020
Kawamiya, M., Hajima, T., Tachiiri, K., Watanabe, S., and Yokohata, T.: Two decades of Earth system modeling with an emphasis on Model for Interdisciplinary Research on Climate (MIROC), Prog. Earth Planet. Sci. 7, 64, 2020.
Kohfeld, K. E., Graham, R. M., de Boer, A. M., Sime, L. C., Wolff, E. W., Le Quere, C., and Bopp, L.: Southern Hemisphere westerly wind changes during the Last Glacial Maximum: paleo-data synthesis, Quaternary Sci. Rev., 68, 76–95, https://doi.org/10.1016/j.quascirev.2013.01.017, 2013.
Lambert, F., Delmonte, B., Petit, J. R., Bigler, M., Kaufmann, P. R., Hutterli, M. A., Stocker, T. F., Ruth, U., Steffensen, J. P., and Maggi, V.: Dust-climate couplings over the past 800,000 years from the EPICA Dome C ice core, Nature, 452, 616–619, 2008.
Lamy, F., Gersonde, R., Winckler, G., Esper, O., Jaeschke, A., Kuhn, G., Ullermann, J., Martinez-Garcia, A., Lambert, F., and Kilian, R.: Increased Dust Deposition in the Pacific Southern Ocean During Glacial Periods, Science, 343, 403–407, 2014.
Lawrence, D. M., Hurtt, G. C., Arneth, A., Brovkin, V., Calvin, K. V., Jones, A. D., Jones, C. D., Lawrence, P. J., de Noblet-Ducoudré, N., Pongratz, J., Seneviratne, S. I., and Shevliakova, E.: The Land Use Model Intercomparison Project (LUMIP) contribution to CMIP6: rationale and experimental design, Geosci. Model Dev., 9, 2973–2998, https://doi.org/10.5194/gmd-9-2973-2016, 2016.
Loulergue, L., Schilt, A., Spahni, R., Masson-Delmotte, V., Blunier, T., Lemieux, B., Barnola, J. M., Raynaud, D., Stocker, T. F., and Chappellaz, J.: Orbital and millennial-scale features of atmospheric CH4 over the past 800,000 years, Nature, 453, 383–386, https://doi.org/10.1038/nature06950, 2008.
Lu, Z., Hoogakker, B. A. A., Hillenbrand, C.-D., Zhou, X., Thomas, E., Gutchess, K. M., Lu, W., Jones, L., and Rickaby, R. E. M.: Oxygen depletion recorded in upper waters of the glacial Southern Ocean, Nat. Commun., 7, 11146, https://doi.org/10.1038/ncomms11146, 2016.
Lunt, D. J., Abe-Ouchi, A., Bakker, P., Berger, A., Braconnot, P., Charbit, S., Fischer, N., Herold, N., Jungclaus, J. H., Khon, V. C., Krebs-Kanzow, U., Langebroek, P. M., Lohmann, G., Nisancioglu, K. H., Otto-Bliesner, B. L., Park, W., Pfeiffer, M., Phipps, S. J., Prange, M., Rachmayani, R., Renssen, H., Rosenbloom, N., Schneider, B., Stone, E. J., Takahashi, K., Wei, W., Yin, Q., and Zhang, Z. S.: A multi-model assessment of last interglacial temperatures, Clim. Past, 9, 699–717, https://doi.org/10.5194/cp-9-699-2013, 2013.
Luterbacher, J., Werner, J. P., Smerdon, J. E., Fernandez-Donado, L., Gonzalez-Rouco, F. J., Barriopedro, D., Ljungqvist, F. C., Buntgen, U., Zorita, E., Wagner, S., Esper, J., McCarroll, D., Toreti, A., Frank, D., Jungclaus, J. H., Barriendos, M., Bertolin, C., Bothe, O., Brazdil, R., Camuffo, D., Dobrovolny, P., Gagen, M., Garica-Bustamante, E., Ge, Q., Gomez-Navarro, J. J., Guiot, J., Hao, Z., Hegerl, G. C., Holmgren, K., Klimenko, V. V., Martin-Chivelet, J., Pfister, C., Roberts, N., Schindler, A., Schurer, A., Solomina, O., von Gunten, L., Wahl, E., Wanner, H., Wetter, O., Xoplaki, E., Yuan, N., Zanchettin, D., Zhang, H., and Zerefos, C.: European summer temperatures since Roman times, Environ. Res. Lett., 11, 024001, https://doi.org/10.1088/1748-9326/11/2/024001, 2016.
Lynch-Stieglitz, J., Adkins, J. F., Curry, W. B., Dokken, T., Hall, I. R., Herguera, J. C., Hirschi, J. J. M., Ivanova, E. V., Kissel, C., Marchal, O., Marchitto, T. M., McCave, I. N., McManus, J. F., Mulitza, S., Ninnemann, U., Peeters, F., Yu, E. F., and Zahn, R.: Atlantic meridional overturning circulation during the Last Glacial Maximum, Science, 316, 66–69, https://doi.org/10.1126/science.1137127, 2007.
Maher, B. A., Prospero, J. M., Mackie, D., Gaiero, D., Hesse, P. P., and Balkanski, Y.: Global connections between aeolian dust, climate and ocean biogeochemistry at the present day and at the last glacial maximum, Earth-Sci. Rev,, 99, 61–97, https://doi.org/10.1016/j.earscirev.2009.12.001, 2010.
Mahowald, N. M., Lamarque, J. F., Tie, X. X., and Wolff, E.: Sea-salt aerosol response to climate change: Last Glacial Maximum, preindustrial, and doubled carbon dioxide climates, J. Geophys. Res.-Atmos., 111, D05303, https://doi.org/10.1029/2005jd006459, 2006.
MARGO Project members: Waelbroeck, C., Paul, A., Kucera, M., Rosell-Mele, A., Weinelt, M., Schneider, R., Mix, A.C., Abelmann, A., Armand, L., Bard, E., Barker, S., Barrows, T. T., Benway, H., Cacho, I., Chen, M. T., Cortijo, E., Crosta, X., de Vernal, A., Dokken, T., Duprat, J., Elderfield, H., Eynaud, F., Gersonde, R., Hayes, A., Henry, M., Hillaire-Marcel, C., Huang, C. C., Jansen, E., Juggins, S., Kallel, N., Kiefer, T., Kienast, M., Labeyrie, L., Leclaire, H., Londeix, L., Mangin, S., Matthiessen, J., Marret, F., Meland, M., Morey, A. E., Mulitza, S., Pflaumann, U., Pisias, N. G., Radi, T., Rochon, A., Rohling, E. J., Sbaffi, L., Schaefer-Neth, C., Solignac, S., Spero, H., Tachikawa, K., Turon, J. L., and Members, M. P.: Constraints on the magnitude and patterns of ocean cooling at the Last Glacial Maximum, Nat. Geosci., 2, 127–132, 2009.
Marzocchi, A. and Jansen, M. F.: Connecting Antarctic sea ice to deep-ocean circulation in modern and glacial climate simulations, Geophys. Res. Lett., 44, 6286–6295, https://doi.org/10.1002/2017gl073936, 2017.
Masson-Delmotte, V., Kageyama, M., Braconnot, P., Charbit, S., Krinner, G., Ritz, C., Guilyardi, E., Jouzel, J., Abe-Ouchi, A., Crucifix, M., Gladstone, R. M., Hewitt, C. D., Kitoh, A., LeGrande, A. N., Marti, O., Merkel, U., Motoi, T., Ohgaito, R., Otto-Bliesner, B., Peltier, W. R., Ross, I., Valdes, P. J., Vettoretti, G., Weber, S. L., Wolk, F., and Yu, Y.: Past and future polar amplification of climate change: climate model intercomparisons and ice-core constraints, Clim. Dyn., 26, 513–529, 2006.
McKay, N. P., Overpeck, J. T., and Otto-Bliesner, B. L.: The role of ocean thermal expansion in Last Interglacial sea level rise, Geophys. Res. Lett., 38, L14605, 2011.
McManus, J. F., Francois, R., Gherardi, J. M., Keigwin, L. D., and Brown-Leger, S.: Collapse and rapid resumption of Atlantic meridional circulation linked to deglacial climate changes, Nature, 428, 834–837, https://doi.org/10.1038/nature02494, 2004.
Meinshausen, M., Vogel, E., Nauels, A., Lorbacher, K., Meinshausen, N., Etheridge, D. M., Fraser, P. J., Montzka, S. A., Rayner, P. J., Trudinger, C. M., Krummel, P. B., Beyerle, U., Canadell, J. G., Daniel, J. S., Enting, I. G., Law, R. M., Lunder, C. R., O'Doherty, S., Prinn, R. G., Reimann, S., Rubino, M., Velders, G. J. M., Vollmer, M. K., Wang, R. H. J., and Weiss, R.: Historical greenhouse gas concentrations for climate modelling (CMIP6), Geosci. Model Dev., 10, 2057–2116, https://doi.org/10.5194/gmd-10-2057-2017, 2017.
Moore, J. K., Abbott, M. R., Richman, J. G., and Nelson, D. M.: The Southern Ocean at the last glacial maximum: A strong sink for atmospheric carbon dioxide, Global Biogeochem. Cy,, 14, 455–475, https://doi.org/10.1029/1999gb900051, 2000.
Morice, C. P., Kennedy, J. J., Rayner, N. A., and Jones, P. D.: Quantifying uncertainties in global and regional temperature change using an ensemble of observational estimates: The HadCRUT4 data set, J. Geophys. Res.-Atmos., 117, D08101, https://doi.org/10.1029/2011jd017187, 2012.
Muglia, J. and Schmittner, A.: Glacial Atlantic overturning increased by wind stress in climate models, Geophys. Res. Lett., 42, 9862–9869, https://doi.org/10.1002/2015gl064583, 2015.
Ohgaito, R. and Abe-Ouchi, A.: The role of ocean thermodynamics and dynamics in Asian summer monsoon changes during the mid-Holocene, Clim. Dyn., 29, 39–50, 2007.
Ohgaito, R. and Abe-Ouchi, A.: The effect of sea surface temperature bias in the PMIP2 AOGCMs on mid-Holocene Asian monsoon enhancement, Clim. Dyn., 33, 975–983, https://doi.org/10.1007/s00382-009-0533-8, 2009.
Ohgaito, R., Sueyoshi, T., Abe-Ouchi, A., Hajima, T., Watanabe, S., Kim, H.-J., Yamamoto, A., and Kawamiya, M.: Can an Earth System Model simulate better climate change at mid-Holocene than an AOGCM? A comparison study of MIROC-ESM and MIROC3, Clim. Past, 9, 1519–1542, https://doi.org/10.5194/cp-9-1519-2013, 2013.
Ohgaito, R., Abe-Ouchi, A., O'ishi, R., Takemura, T., Ito, A., Hajima, T., Watanabe, S., and Kawamiya, M.: Effect of high dust amount on surface temperature during the Last Glacial Maximum: a modelling study using MIROC-ESM, Clim. Past, 14, 1565–1581, https://doi.org/10.5194/cp-14-1565-2018, 2018.
Ohgaito, R., Abe-Ouchi, A., Abe, M., Arakawa, O., Ogochi, K., Hajima, T., Watanabe, M., Yamamoto, A., Tatebe, H., Noguchi, M. A., Ito, A., Yamazaki, D., Ito, A., Takata, K., Watanabe, S., Kawamiya, M., and Tachiiri, K.: MIROC MIROC-ES2L model output prepared for CMIP6 PMIP lgm, Earth System Grid Federation, https://doi.org/10.22033/ESGF/CMIP6.5644, 2019a.
Ohgaito, R., Abe-Ouchi, A., Abe, M., Arakawa, O., Ogochi, K., Hajima, T., Watanabe, M., Yamamoto, A., Tatebe, H., Noguchi, M. A., Ito, A., Yamazaki, D., Ito, A., Takata, K., Watanabe, S., Kawamiya, M., and Tachiiri, K.: MIROC MIROC-ES2L model output prepared for CMIP6 PMIP midHolocene, Earth System Grid Federation, https://doi.org/10.22033/ESGF/CMIP6.5646, 2019b.
Ohgaito, R., Abe-Ouchi, A., Abe, M., Arakawa, O., Ogochi, K., Hajima, T., Watanabe, M., Yamamoto, A., Tatebe, H., Noguchi, M. A., Ito, A., Yamazaki, D., Ito, A., Takata, K., Watanabe, S., Kawamiya, M., and Tachiiri, K.: MIROC MIROC-ES2L model output prepared for CMIP6 PMIP past1000, Earth System Grid Federation, https://doi.org/10.22033/ESGF/CMIP6.5666, 2020a.
Ohgaito, R., Yamamoto, A., Hajima, T., O'ishi, R., Abe, M., Tatebe, H., Abe-Ouchi, A., and Kawamiya, M.: Core code of MIROC-ES2L, Geoscientific Model Development, Zenodo, https://doi.org/10.5281/zenodo.3893386, 2020b.
Ohgaito, R., Yamamoto, A., Hajima, T., O'ishi, R., Abe, M., Tatebe, H., Abe-Ouchi, A., and Kawamiya, M.: Code and data for the figures of Ohgaito et al. entitled “PMIP4 experiments using MIROC-ES2L Earth System Model”. Geoscientific Model Development, Zenodo, https://doi.org/10.5281/zenodo.3893403, 2020c.
O'Ishi, R. and Abe-Ouchi, A.: Polar amplification in the mid-Holocene derived from dynamical vegetation change with a GCM, Geophys. Res. Lett., 38, L14702, https://doi.org/10.1029/2011gl048001, 2011.
O'ishi, R. and Abe-Ouchi, A.: Influence of dynamic vegetation on climate change and terrestrial carbon storage in the Last Glacial Maximum, Clim. Past, 9, 1571–1587, https://doi.org/10.5194/cp-9-1571-2013, 2013.
O'ishi, R., Abe-Ouchi, A., Ohgaito, R., Abe, M., Arakawa, O., Ogochi, K., Hajima, T., Watanabe, M., Yamamoto, A., Tatebe, H., Noguchi, M. A., Ito, A., Yamazaki, D., Ito, A., Takata, K., Watanabe, S., Kawamiya, M., and Tachiiri, K.: MIROC MIROC-ES2L model output prepared for CMIP6 PMIP lig127k, Earth System Grid Federation, https://doi.org/10.22033/ESGF/CMIP6.5645, 2019.
O'ishi, R., Chan, W.-L., Abe-Ouchi, A., Sherriff-Tadano, S., Ohgaito, R., and Yoshimori, M.: PMIP4/CMIP6 last interglacial simulations using three different versions of MIROC: importance of vegetation, Clim. Past, 17, 21–36, https://doi.org/10.5194/cp-17-21-2021, 2021.
Otto-Bliesner, B. L. and Brady, E. C.: Tropical Pacific variability in the NCAR Climate System Model, J. Climate, 14, 3587–3607, https://doi.org/10.1175/1520-0442(2001)014<3587:tpvitn>2.0.co;2, 2001.
Otto-Bliesner, B. L., Hewitt, C. D., Marchitto, T. M., Brady, E., Abe-Ouchi, A., Crucifix, M., Murakami, S., and Weber, S. L.: Last Glacial Maximum ocean thermohaline circulation: PMIP2 model intercomparisons and data constraints, Geophys. Res. Lett., 34, L12706, 2007.
Otto-Bliesner, B. L., Schneider, R., Brady, E. C., Kucera, M., Abe-Ouchi, A., Bard, E., Braconnot, P., Crucifix, M., Hewitt, C. D., Kageyama, M., Marti, O., Paul, A., Rosell-Mele, A., Waelbroeck, C., Weber, S. L., Weinelt, M., and Yu, Y.: A comparison of PMIP2 model simulations and the MARGO proxy reconstruction for tropical sea surface temperatures at last glacial maximum, Clim. Dynam., 32, 799–815, https://doi.org/10.1007/s00382-008-0509-0, 2009.
Otto-Bliesner, B. L., Braconnot, P., Harrison, S. P., Lunt, D. J., Abe-Ouchi, A., Albani, S., Bartlein, P. J., Capron, E., Carlson, A. E., Dutton, A., Fischer, H., Goelzer, H., Govin, A., Haywood, A., Joos, F., LeGrande, A. N., Lipscomb, W. H., Lohmann, G., Mahowald, N., Nehrbass-Ahles, C., Pausata, F. S. R., Peterschmitt, J.-Y., Phipps, S. J., Renssen, H., and Zhang, Q.: The PMIP4 contribution to CMIP6 – Part 2: Two interglacials, scientific objective and experimental design for Holocene and Last Interglacial simulations, Geosci. Model Dev., 10, 3979–4003, https://doi.org/10.5194/gmd-10-3979-2017, 2017.
Otto-Bliesner, B. L., Brady, E. C., Zhao, A., Brierley, C. M., Axford, Y., Capron, E., Govin, A., Hoffman, J. S., Isaacs, E., Kageyama, M., Scussolini, P., Tzedakis, P. C., Williams, C. J. R., Wolff, E., Abe-Ouchi, A., Braconnot, P., Ramos Buarque, S., Cao, J., de Vernal, A., Guarino, M. V., Guo, C., LeGrande, A. N., Lohmann, G., Meissner, K. J., Menviel, L., Morozova, P. A., Nisancioglu, K. H., O'ishi, R., Salas y Mélia, D., Shi, X., Sicard, M., Sime, L., Stepanek, C., Tomas, R., Volodin, E., Yeung, N. K. H., Zhang, Q., Zhang, Z., and Zheng, W.: Large-scale features of Last Interglacial climate: results from evaluating the lig127k simulations for the Coupled Model Intercomparison Project (CMIP6)–Paleoclimate Modeling Intercomparison Project (PMIP4), Clim. Past, 17, 63–94, https://doi.org/10.5194/cp-17-63-2021, 2021.
PAGES 2k-PMIP3 group: Continental-scale temperature variability in PMIP3 simulations and PAGES 2k regional temperature reconstructions over the past millennium, Clim. Past, 11, 1673–1699, https://doi.org/10.5194/cp-11-1673-2015, 2015.
Peltier, W. R. and Vettoretti, G.: Dansgaard-Oeschger oscillations predicted in a comprehensive model of glacial climate: A “kicked” salt oscillator in the Atlantic, Geophys. Res. Lett., 41, 7306–7313, 2014.
Peltier, W. R., Argus, D. F., and Drummond, R.: Space geodesy constrains ice age terminal deglaciation: The global ICE-6G_C (VM5a) model, J. Geophys. Res.-Sol. Ea., 120, 450–487, https://doi.org/10.1002/2014jb011176, 2015.
Petit-Maire, N.: Natural variability of the Earth's environments: the last two climatic extremes (18000 +/- 2000 and 8000 +/- 1000 yrs BP), Comptes Rendus De L Academie Des Sciences Serie Ii Fascicule a-Sciences De La Terre Et Des Planetes, 328, 273–279, https://doi.org/10.1016/s1251-8050(99)80307-3, 1999.
Pfeiffer, M. and Lohmann, G.: Greenland Ice Sheet influence on Last Interglacial climate: global sensitivity studies performed with an atmosphere–ocean general circulation model, Clim. Past, 12, 1313–1338, https://doi.org/10.5194/cp-12-1313-2016, 2016.
Pfister, C. and Brázdil, R.: Social vulnerability to climate in the ”Little Ice Age”: an example from Central Europe in the early 1770s, Clim. Past, 2, 115–129, https://doi.org/10.5194/cp-2-115-2006, 2006.
Prentice, I. C., Harrison, S. P., and Bartlein, P. J.: Global vegetation and terrestrial carbon cycle changes after the last ice age, New Phytol., 189, 988–998, https://doi.org/10.1111/j.1469-8137.2010.03620.x, 2011.
Ramankutty, N. and Foley, J. A.: Estimating historical changes in global land cover: Croplands from 1700 to 1992, Global Biogeochem. Cy., 13, 997–1027, 1999.
Renoult, M., Annan, J. D., Hargreaves, J. C., Sagoo, N., Flynn, C., Kapsch, M.-L., Li, Q., Lohmann, G., Mikolajewicz, U., Ohgaito, R., Shi, X., Zhang, Q., and Mauritsen, T.: A Bayesian framework for emergent constraints: case studies of climate sensitivity with PMIP, Clim. Past, 16, 1715–1735, https://doi.org/10.5194/cp-16-1715-2020, 2020.
Ritchie, J. C., Eyles, C. H., and Haynes, C. V.: Sediment and pollen Evidence for an early to mid-holocen humid period in the eastern Sahara, Nature, 314, 352–355, https://doi.org/10.1038/314352a0, 1985.
Schilt, A., Baumgartner, M., Schwander, J., Buiron, D., Capron, E., Chappellaz, J., Loulergue, L., Schupbach, S., Spahni, R., Fischer, H., and Stocker, T. F.: Atmospheric nitrous oxide during the last 140,000 years, Earth Planet. Sci. Lett., 300, 33–43, https://doi.org/10.1016/j.epsl.2010.09.027, 2010.
Schmidt, G. A., Jungclaus, J. H., Ammann, C. M., Bard, E., Braconnot, P., Crowley, T. J., Delaygue, G., Joos, F., Krivova, N. A., Muscheler, R., Otto-Bliesner, B. L., Pongratz, J., Shindell, D. T., Solanki, S. K., Steinhilber, F., and Vieira, L. E. A.: Climate forcing reconstructions for use in PMIP simulations of the last millennium (v1.0), Geosci. Model Dev., 4, 33–45, https://doi.org/10.5194/gmd-4-33-2011, 2011.
Schmiedl, G. and Mackensen, A.: Multispecies stable isotopes of benthic foraminifers reveal past changes of organic matter decomposition and deepwater oxygenation in the Arabian Sea, Paleoceanography, 21, 1–14, https://doi.org/10.1029/2006PA001284, 2006.
Shapiro, A. I., Schmutz, W., Rozanov, E., Schoell, M., Haberreiter, M., Shapiro, A. V., and Nyeki, S.: A new approach to the long-term reconstruction of the solar irradiance leads to large historical solar forcing, Astron. Astrophys., 529, A67, https://doi.org/10.1051/0004-6361/201016173, 2011.
Sherriff-Tadano, S., Abe-Ouchi, A., Yoshimori, M., Oka, A., and Chan, W. L.: Influence of glacial ice sheets on the Atlantic meridional overturning circulation through surface wind change, Clim. Dyn,, 50, 2881–2903, https://doi.org/10.1007/s00382-017-3780-0, 2018.
Sigl, M., Winstrup, M., McConnell, J. R., Welten, K. C., Plunkett, G., Ludlow, F., Buentgen, U., Caffee, M., Chellman, N., Dahl-Jensen, D., Fischer, H., Kipfstuhl, S., Kostick, C., Maselli, O. J., Mekhaldi, F., Mulvaney, R., Muscheler, R., Pasteris, D. R., Pilcher, J. R., Salzer, M., Schuepbach, S., Steffensen, J. P., Vinther, B. M., and Woodruff, T. E.: Timing and climate forcing of volcanic eruptions for the past 2,500 years, Nature, 523, 543–549, https://doi.org/10.1038/nature14565, 2015.
Stenni, B., Masson-Delmotte, V., Selmo, E., Oerter, H., Meyer, H., Rothlisberger, R., Jouzel, J., Cattani, O., Falourd, S., Fischer, H., Hoffmann, G., Iacumin, P., Johnsen, S. J., Minster, B., and Udisti, R.: The deuterium excess records of EPICA Dome C and Dronning Maud Land ice cores (East Antarctica), Quaternary Sci. Rev., 29, 146–159, 2010.
Stocker, T. F., Qin, D., Plattner, G.-K., Tignor, M., Allen, S. K., Boschung, J., Nauels, A., Xia, Y., Bex, V., and Midgley, P. M. (Eds.): Climate Change 2013: The Physical Science Basis, Contribution of Working Group I to the Fifth Assessment Report of the Intergovernmental Panel on Climate Change, Cambridge University Press, Cambridge, United Kingdom and New York, NY, USA, 1535 pp., 2013.
Sueyoshi, T., Ohgaito, R., Yamamoto, A., Chikamoto, M. O., Hajima, T., Okajima, H., Yoshimori, M., Abe, M., O'ishi, R., Saito, F., Watanabe, S., Kawamiya, M., and Abe-Ouchi, A.: Set-up of the PMIP3 paleoclimate experiments conducted using an Earth system model, MIROC-ESM, Geosci. Model Dev., 6, 819–836, https://doi.org/10.5194/gmd-6-819-2013, 2013.
Takemura, T., Okamoto, H., Maruyama, Y., Numaguti, A., Higurashi, A., and Nakajima, T.: Global three-dimensional simulation of aerosol optical thickness distribution of various origins, J. Geophys. Res.-Atmos., 105, 17853–17873, https://doi.org/10.1029/2000jd900265, 2000.
Takemura, T., Nozawa, T., Emori, S., Nakajima, T. Y., and Nakajima, T.: Simulation of climate response to aerosol direct and indirect effects with aerosol transport-radiation model, J. Geophys. Res.-Atmos., 110, D02202, https://doi.org/10.1029/2004jd005029, 2005.
Takemura, T., Egashira, M., Matsuzawa, K., Ichijo, H., O'ishi, R., and Abe-Ouchi, A.: A simulation of the global distribution and radiative forcing of soil dust aerosols at the Last Glacial Maximum, Atmos. Chem. Phys., 9, 3061–3073, https://doi.org/10.5194/acp-9-3061-2009, 2009.
Tatebe, H., Tanaka, Y., Komuro, Y., and Hasumi, H.: Impact of deep ocean mixing on the climatic mean state in the Southern Ocean, Sci. Rep.-UK, 8, 14479, https://doi.org/10.1038/s41598-018-32768-6, 2018.
Tierney, J. E. and deMenocal, P. B.: Abrupt Shifts in Horn of Africa Hydroclimate Since the Last Glacial Maximum, Science, 342, 843–846, https://doi.org/10.1126/science.1240411, 2013.
Tierney, J. E., Pausata, F. S. R., and deMenocal, P. B.: Rainfall regimes of the Green Sahara, Sci. Adv., 3, e1601503, https://doi.org/10.1126/sciadv.1601503, 2017.
Toohey, M. and Sigl, M.: Volcanic stratospheric sulfur injections and aerosol optical depth from 500 BCE to 1900 CE, Earth Syst. Sci. Data, 9, 809–831, https://doi.org/10.5194/essd-9-809-2017, 2017.
Turney, C. S. M. and Jones, R. T.: Does the Agulhas Current amplify global temperatures during super-interglacials?, J. Quaternary Sci., 25, 839–843, 2010.
Uemura, R., Masson-Delmotte, V., Jouzel, J., Landais, A., Motoyama, H., and Stenni, B.: Ranges of moisture-source temperature estimated from Antarctic ice cores stable isotope records over glacial–interglacial cycles, Clim. Past, 8, 1109–1125, https://doi.org/10.5194/cp-8-1109-2012, 2012.
Umling, N. E. and Thunell, R. C.: Mid-depth respired carbon storage and oxygenation of the eastern equatorial Pacific over the last 25,000 years, Quaternary Sci. Rev., 189, 43–56, 2018.
Vieira, L. E. A., Solanki, S. K., Krivova, N. A., and Usoskin, I.: Evolution of the solar irradiance during the Holocene, Astron. Astrophys., 531, A6, https://doi.org/10.1051/0004-6361/201015843, 2011.
Watanabe, S., Hajima, T., Sudo, K., Nagashima, T., Takemura, T., Okajima, H., Nozawa, T., Kawase, H., Abe, M., Yokohata, T., Ise, T., Sato, H., Kato, E., Takata, K., Emori, S., and Kawamiya, M.: MIROC-ESM 2010: model description and basic results of CMIP5-20c3m experiments, Geosci. Model Dev., 4, 845–872, https://doi.org/10.5194/gmd-4-845-2011, 2011.
Weber, S. L., Drijfhout, S. S., Abe-Ouchi, A., Crucifix, M., Eby, M., Ganopolski, A., Murakami, S., Otto-Bliesner, B., and Peltier, W. R.: The modern and glacial overturning circulation in the Atlantic ocean in PMIP coupled model simulations, Clim. Past, 3, 51–64, https://doi.org/10.5194/cp-3-51-2007, 2007.
Weldeab, S., Schneider, R. R., and Muller, P.: Comparison of Mg/Ca- and alkenone-based sea surface temperature estimates in the fresh water-influenced Gulf of Guinea, eastern equatorial Atlantic, Geochem. Geophys. Geosys., 8, Q05P22, https://doi.org/10.1029/2006gc001360, 2007.
Wu, C.-J.: SATIRE-M reconstruction of spectral solar irradiance over the Holocene, Max Planck Institute for Solar System Research, https://doi.org/10.17617/3.11, 2017.
Xoplaki, E., Fleitmann, D., Luterbacher, J., Wagner, S., Haldon, J. F., Zorita, E., Telelis, I., Toreti, A., and Izdebski, A.: The Medieval Climate Anomaly and Byzantium: A review of the evidence on climatic fluctuations, economic performance and societal change, Quaternary Sci. Rev., 136, 229–252, https://doi.org/10.1016/j.quascirev.2015.10.004, 2016.
Yamamoto, A., Abe-Ouchi, A., Ohgaito, R., Ito, A., and Oka, A.: Glacial CO2 decrease and deep-water deoxygenation by iron fertilization from glaciogenic dust, Clim. Past, 15, 981–996, https://doi.org/10.5194/cp-15-981-2019, 2019.
Zanchettin, D., Khodri, M., Timmreck, C., Toohey, M., Schmidt, A., Gerber, E. P., Hegerl, G., Robock, A., Pausata, F. S. R., Ball, W. T., Bauer, S. E., Bekki, S., Dhomse, S. S., LeGrande, A. N., Mann, G. W., Marshall, L., Mills, M., Marchand, M., Niemeier, U., Poulain, V., Rozanov, E., Rubino, A., Stenke, A., Tsigaridis, K., and Tummon, F.: The Model Intercomparison Project on the climatic response to Volcanic forcing (VolMIP): experimental design and forcing input data for CMIP6, Geosci. Model Dev., 9, 2701–2719, https://doi.org/10.5194/gmd-9-2701-2016, 2016.
- Abstract
- Introduction
- Model
- Experimental setup and spin-up procedures
- Comparison of mean climate states derived from model output and paleoclimate proxy data archives
- Outlook and conclusions
- Appendix A: How we overcame the difficulties of the LGM experiment
- Code and data availability
- Author contributions
- Competing interests
- Acknowledgements
- Financial support
- Review statement
- References
- Supplement