the Creative Commons Attribution 4.0 License.
the Creative Commons Attribution 4.0 License.
 | 02 Dec 2020
Modeling long-term fire impact on ecosystem characteristics and surface energy using a process-based vegetation–fire model SSiB4/TRIFFID-Fire v1.0
Huilin Huang
Fire is one of the primary disturbances to the distribution and ecological properties of the world's major biomes and can influence the surface fluxes and climate through vegetation–climate interactions. This study incorporates a fire model of intermediate complexity to a biophysical model with dynamic vegetation, SSiB4/TRIFFID (The Simplified Simple Biosphere Model coupled with the Top-down Representation of Interactive Foliage and Flora Including Dynamics Model). This new model, SSiB4/TRIFFID-Fire, updating fire impact on the terrestrial carbon cycle every 10 d, is then used to simulate the burned area during 1948–2014. The simulated global burned area in 2000–2014 is 471.9 Mha yr−1, close to the estimate of 478.1 Mha yr−1 in Global Fire Emission Database v4s (GFED4s), with a spatial correlation of 0.8. The SSiB4/TRIFFID-Fire reproduces temporal variations of the burned area at monthly to interannual scales. Specifically, it captures the observed decline trend in northern African savanna fire and accurately simulates the fire seasonality in most major fire regions. The simulated fire carbon emission is 2.19 Pg yr−1, slightly higher than the GFED4s (2.07 Pg yr−1).
The SSiB4/TRIFFID-Fire is applied to assess the long-term fire impact on ecosystem characteristics and surface energy budget by comparing model runs with and without fire (FIRE-ON minus FIRE-OFF). The FIRE-ON simulation reduces tree cover over 4.5 % of the global land surface, accompanied by a decrease in leaf area index and vegetation height by 0.10 m2 m−2 and 1.24 m, respectively. The surface albedo and sensible heat are reduced throughout the year, while latent heat flux decreases in the fire season but increases in the rainy season. Fire results in an increase in surface temperature over most fire regions.
- Article
(10183 KB) - Full-text XML
-
Supplement
(2393 KB) - BibTeX
- EndNote


Wildfire, whether natural or human-made, is one of the primary ecosystem disturbances and it plays a major role in the terrestrial biogeochemical cycles and ecological succession across spatial and temporal scales (Sousa, 1984; Bowman et al., 2009). Every year in the dry season, wildfires burn about 400 Mha of land vegetated areas, leaving behind numerous scars in the landscape (Giglio et al., 2013; Chuvieco et al., 2016). Fires affect the climate through modification of water, energy, and momentum exchange between land and atmosphere (Chambers and Chapin, 2002; Bond-Lamberty et al., 2009) and can interact with monsoons by affecting atmospheric circulations (De Sales et al., 2016; Saha et al., 2016). Fires are also important sources of global carbon, aerosols, and trace gas emissions. Based on the latest satellite estimates, global fires emit 1.5–4.2 Pg C yr−1 carbon, 7–8.2 Pg C yr−1 CO2, and 1.9–6.0 Tg C yr−1 black carbon to the atmosphere (Chuvieco et al., 2016; van der Werf et al., 2017; Li et al., 2019). Fire emissions contribute to increases in greenhouse gases and cloud condensation nuclei through geochemistry processes (Scholes et al., 1996), affecting radiative forcing, the hydrology cycle (Ward et al., 2012; Jiang et al., 2016; Hamilton et al., 2018), and air quality (van der Werf et al., 2010; Johnston et al., 2012).
Since the early 2000s, fire models have been developed within Dynamic Global Vegetation Models (DGVMs) to explicitly describe the burned area, fire emissions, and fire disturbance on terrestrial ecosystems (Thonicke et al., 2001; Venevsky et al., 2002; Arora and Boer, 2005; Thonicke et al., 2010; Li et al., 2012; Pfeiffer et al., 2013; Lasslop et al., 2014; Yue et al., 2014; Rabin et al., 2018; Burton et al., 2019; Venevsky et al., 2019). These fire models have various levels of complexity, from simple statistical models (SIMFIRE; Knorr et al., 2016) to complicated process-based ones such as SPITFIRE (Thonicke et al., 2010) and MC2 (Bachelet et al., 2015). With increasing complexity, more fire processes and fire characteristics are considered in fire models. In general, current fire models broadly capture the global amounts and spatial distribution of burned area and carbon emissions, as compared to different observations. However, many empirically determined parameters are included in the complicated process-based models, which leads to large uncertainties. There is no model that outperforms other models across all fire variables (Hantson et al., 2020). Moreover, current fire models have deficiencies in simulating the peak fire month, fire season length, and interannual variability, as reported by the Fire Model Intercomparison Project (FireMIP; Hantson et al., 2020; Li et al., 2019). Most fire models show a 1–2 month shift in peak burned area and simulate a longer fire season compared to observations.
Fire models have been used to reconstruct fire history before the satellite era (Yang et al., 2015; van Marle et al., 2017; Li et al., 2019). In addition, they are widely used to attribute historical variability of burned area to various climate and anthropogenic driving factors (Kloster et al., 2012; Andela et al., 2017; Forkel et al., 2019; Teckentrup et al., 2019). Some fire models have been used to assess long-term fire impact on the terrestrial carbon cycle by comparing a reference simulation with fire and a sensitivity simulation representing “a world without fire”. However, the simulated responses of vegetation and carbon cycle are divergent. Bond et al. (2005) reported that forest cover would double in a world without fire, while in the recent fire-coupled DGVMs, a much smaller tree cover reduction by 10 % (ranges between 3 % and 25 %) is simulated when fire is taken into account (Lasslop et al., 2020). Earlier model-based studies reported that fire reduced terrestrial carbon uptake. However, the range of the quantified reduction was fairly broad (0.05–3.60 Pg C yr−1), and most studies did not consider the fire effects on vegetation distribution and related mechanisms (Li et al., 2014; Yue et al., 2015; Poulter et al., 2015; Yang et al., 2015; Seo and Kim, 2019; Zou et al. 2020).
Thus far, only the fire model developed by Li et al. (2012, 2013) has been used to investigate the long-term fire effects on surface energy. By comparing the simulated climate with and without fire, Li et al. (2017) concluded that fire caused a significant decrease in surface radiation, latent heat, and a slight decrease in sensible heat fluxes through changes in biophysical properties such as albedo, Bowen ratio, and aerodynamic resistance. An increase in surface temperature was found over most fire regions. However, the long-term fire impact on vegetation distribution was not taken into account in Li et al. (2017), which has been widely observed on site-level studies (Higgins et al., 2007; Smit et al., 2010) and can cause substantial changes in aerodynamic resistance due to conversions of dominant plant functional type (PFT) (Huang et al., 2020b). Moreover, Li et al. (2017) focused on the annual fire impact on energy fluxes. However, fire's effects on energy budget can have large seasonal variations associated with the vegetation loss during the fire seasons and vegetation recovery during post-fire rainy seasons. The seasonal variations in fire effects have not been investigated in any fire studies.
In the original SSiB4/TRIFFID, the carbon disturbance caused by fire and insects was assumed to be a constant, which depended solely on PFT without spatial and temporal changes (Cox et al., 2001; Liu et al., 2019). However, the fire disturbance is varies greatly with climate, vegetation productivity, and socioeconomic conditions, which has a strong influence on vegetation dynamics, carbon cycling, and soil processes. In this study, we develop the fire modeling by incorporating the fire scheme of Li et al. (2012, 2013) to SSiB4/TRIFFID (hereafter, SSiB4/TRIFFID-Fire). The SSiB4/TRIFFID-Fire model updates fire-induced carbon loss every 10 d, which has been rarely employed in current process-based fire models, and is used to provide a quantitative assessment of fire impact on ecosystem characteristics and surface energy at subseasonal, seasonal, interannual, and long-term scales. Specifically, our objectives are (1) to evaluate the climatology and interannual variability of burned area and carbon emissions simulated by offline SSiB4/TRIFFID-Fire, (2) to assess the ability of SSiB4/TRIFFID-Fire in capturing the fire seasonality in major fire regions, and (3) to assess the long-term fire impact on PFT distribution and vegetation properties and the resultant changes in seasonal surface energy budget and temperature. In Sect. 2, we provide a brief description of the DGVM, SSiB4/TRIFFID; the fire model, taken from Li et al. (2012, 2013); and the coupling procedures. The experimental design and data for model input and validation are introduced in Sect. 3. The fire model evaluation on a global scale and the application of long-term fire impact on ecosystem characteristics and surface properties are presented in Sect. 4. Discussions and conclusions are given in Sect. 5.
2.1 Land and vegetation model
The Simplified Simple Biosphere Model (SSiB, Xue et al., 1991; Zhan et al., 2003) is a biophysical model which simulates fluxes of surface radiation, momentum, sensible and latent heat, runoff, soil moisture, surface temperature, and vegetation gross and net primary productivity (GPP and NPP) based on energy and water balance. The SSiB was coupled with a dynamic vegetation model, the Top-down Representation of Interactive Foliage and Flora Including Dynamics Model (TRIFFID), to calculate leaf area index (LAI), canopy height, and PFT fractional coverage according to the carbon balance (Cox, 2001; Zhang et al., 2015; Harper et al., 2016; Liu et al., 2019). We have improved the PFT competition strategy and plant physiology processes to make the SSiB4/TRIFFID suitable for seasonal, interannual, and decadal studies (Zhang et al., 2015; Liu et al., 2019). SSiB4/TRIFFID includes seven PFTs: (1) broadleaf evergreen trees (BET), (2) needleleaf evergreen trees (NET), (3) broadleaf deciduous trees (BDT), (4) C3 grasses, (5) C4 plants, (6) shrubs, and (7) tundra. The coverage of a PFT is determined by net carbon availability, competition between species, and disturbance, which implicitly includes mortality due to fires, pests, and windthrow. A detailed description and validation of SSiB4/TRIFFID can be found in Zhang et al. (2015) and Liu et al. (2019).
2.2 Fire model and modifications
In this study, a process-based fire model of intermediate complexity has been implemented in the SSiB4/TRIFFID, called SSiB4/TRIFFID-Fire. The fire model developed by Li et al. (2012, 2013) was first built on the model platform of CLM-DGVM and has been incorporated in IAP-DGVM (Zeng et al., 2014), CLM4.5 (Oleson et al., 2013), CLM5 (Lawrence et al., 2019), LM3 in Earth system model GFDL-ESM (Rabin et al., 2018; Ward et al., 2018), AVIM in Climate System Model BCC-CSM (Weiping Li, personal communication, 2016), E3SM Land Model (ELM; Ricciuto et al., 2018), NASA GEOS catchment-CN4.5 model (Zeng et al., 2019), and DLEM (Yang et al., 2014), and it has been partly used in GLASS-CTEM (Melton and Arora, 2016). The following briefly describes the fire schemes adapted from Li et al. (2012, 2013), Li and Lawrence (2017), and our own modifications.
The fire model is comprised of three parts: fire occurrence, fire spread, and fire impact. The basic equation is that the burned area in a grid cell (Ab, km2 s−1) is determined by the number of fires per time step (Nf, count s−1) and the average spread area per fire (a, km2 count−1):
2.2.1 Fire occurrence
Nf is the product of the number of potential ignition counts due to both natural causes (In, count s−1 km−2) and human ignitions (Ia, count s−1 km−2), fuel availability (fb), fuel combustibility (fm), and human suppression factors (feo). In this paper, we only consider non-crop fire by excluding the cropland fraction (fcrop) from burning:
where Ag is the land area of the grid cell (km2). Fires in the croplands are excluded here due to their small extent within the major fire regions and their relatively low intensity (Bistinas et al., 2014). Cropland fire is still a major uncertainty in remote sensing datasets (Randerson et al., 2012), and more data and investigation are needed.
The number of natural ignitions is related to lightning flashes (Il, count s−1); cloud-to-ground lightning fraction, , which depends on latitude λ (Prentice and Mackerras, 1977); and ignition efficiency (ψ=0.22). The anthropogenic ignition, Ia, is parameterized using the number of potential anthropogenic ignitions by a person ( count per person s−1) and population density (Dp; person) (Venevsky et al. 2002):
The fuel availability fb(fraction, range 0−1) is given as follows:
where Bag (g C m−2) is the aboveground biomass (leaf and stem in SSiB4/TRIFFID-Fire) of all PFTs. Following Li et al. (2012), we use Blow=155 g C m−2 as the lower fuel threshold, below which fire does not occur and Bup =1050 g C m−2 as the upper fuel threshold, above which fuel load is not a constraint for fire occurrence.
Fuel combustibility fm (fraction, 0–1) is given as follow:
where fRH and fθ represent the dependence of fuel combustibility on relative humidity (RH; %) and the root zone soil moisture (θ), respectively (Li and Lawrence, 2017). Following Li et al. (2013), we assume fm= 0 when surface air temperature T is below −10 ∘C. fRH reflects the impact of real-time climate conditions on fuel combustibility, while fθ reflects the response of fuel combustibility to the preceding climate conditions (Shinoda and Yamaguchi, 2003):
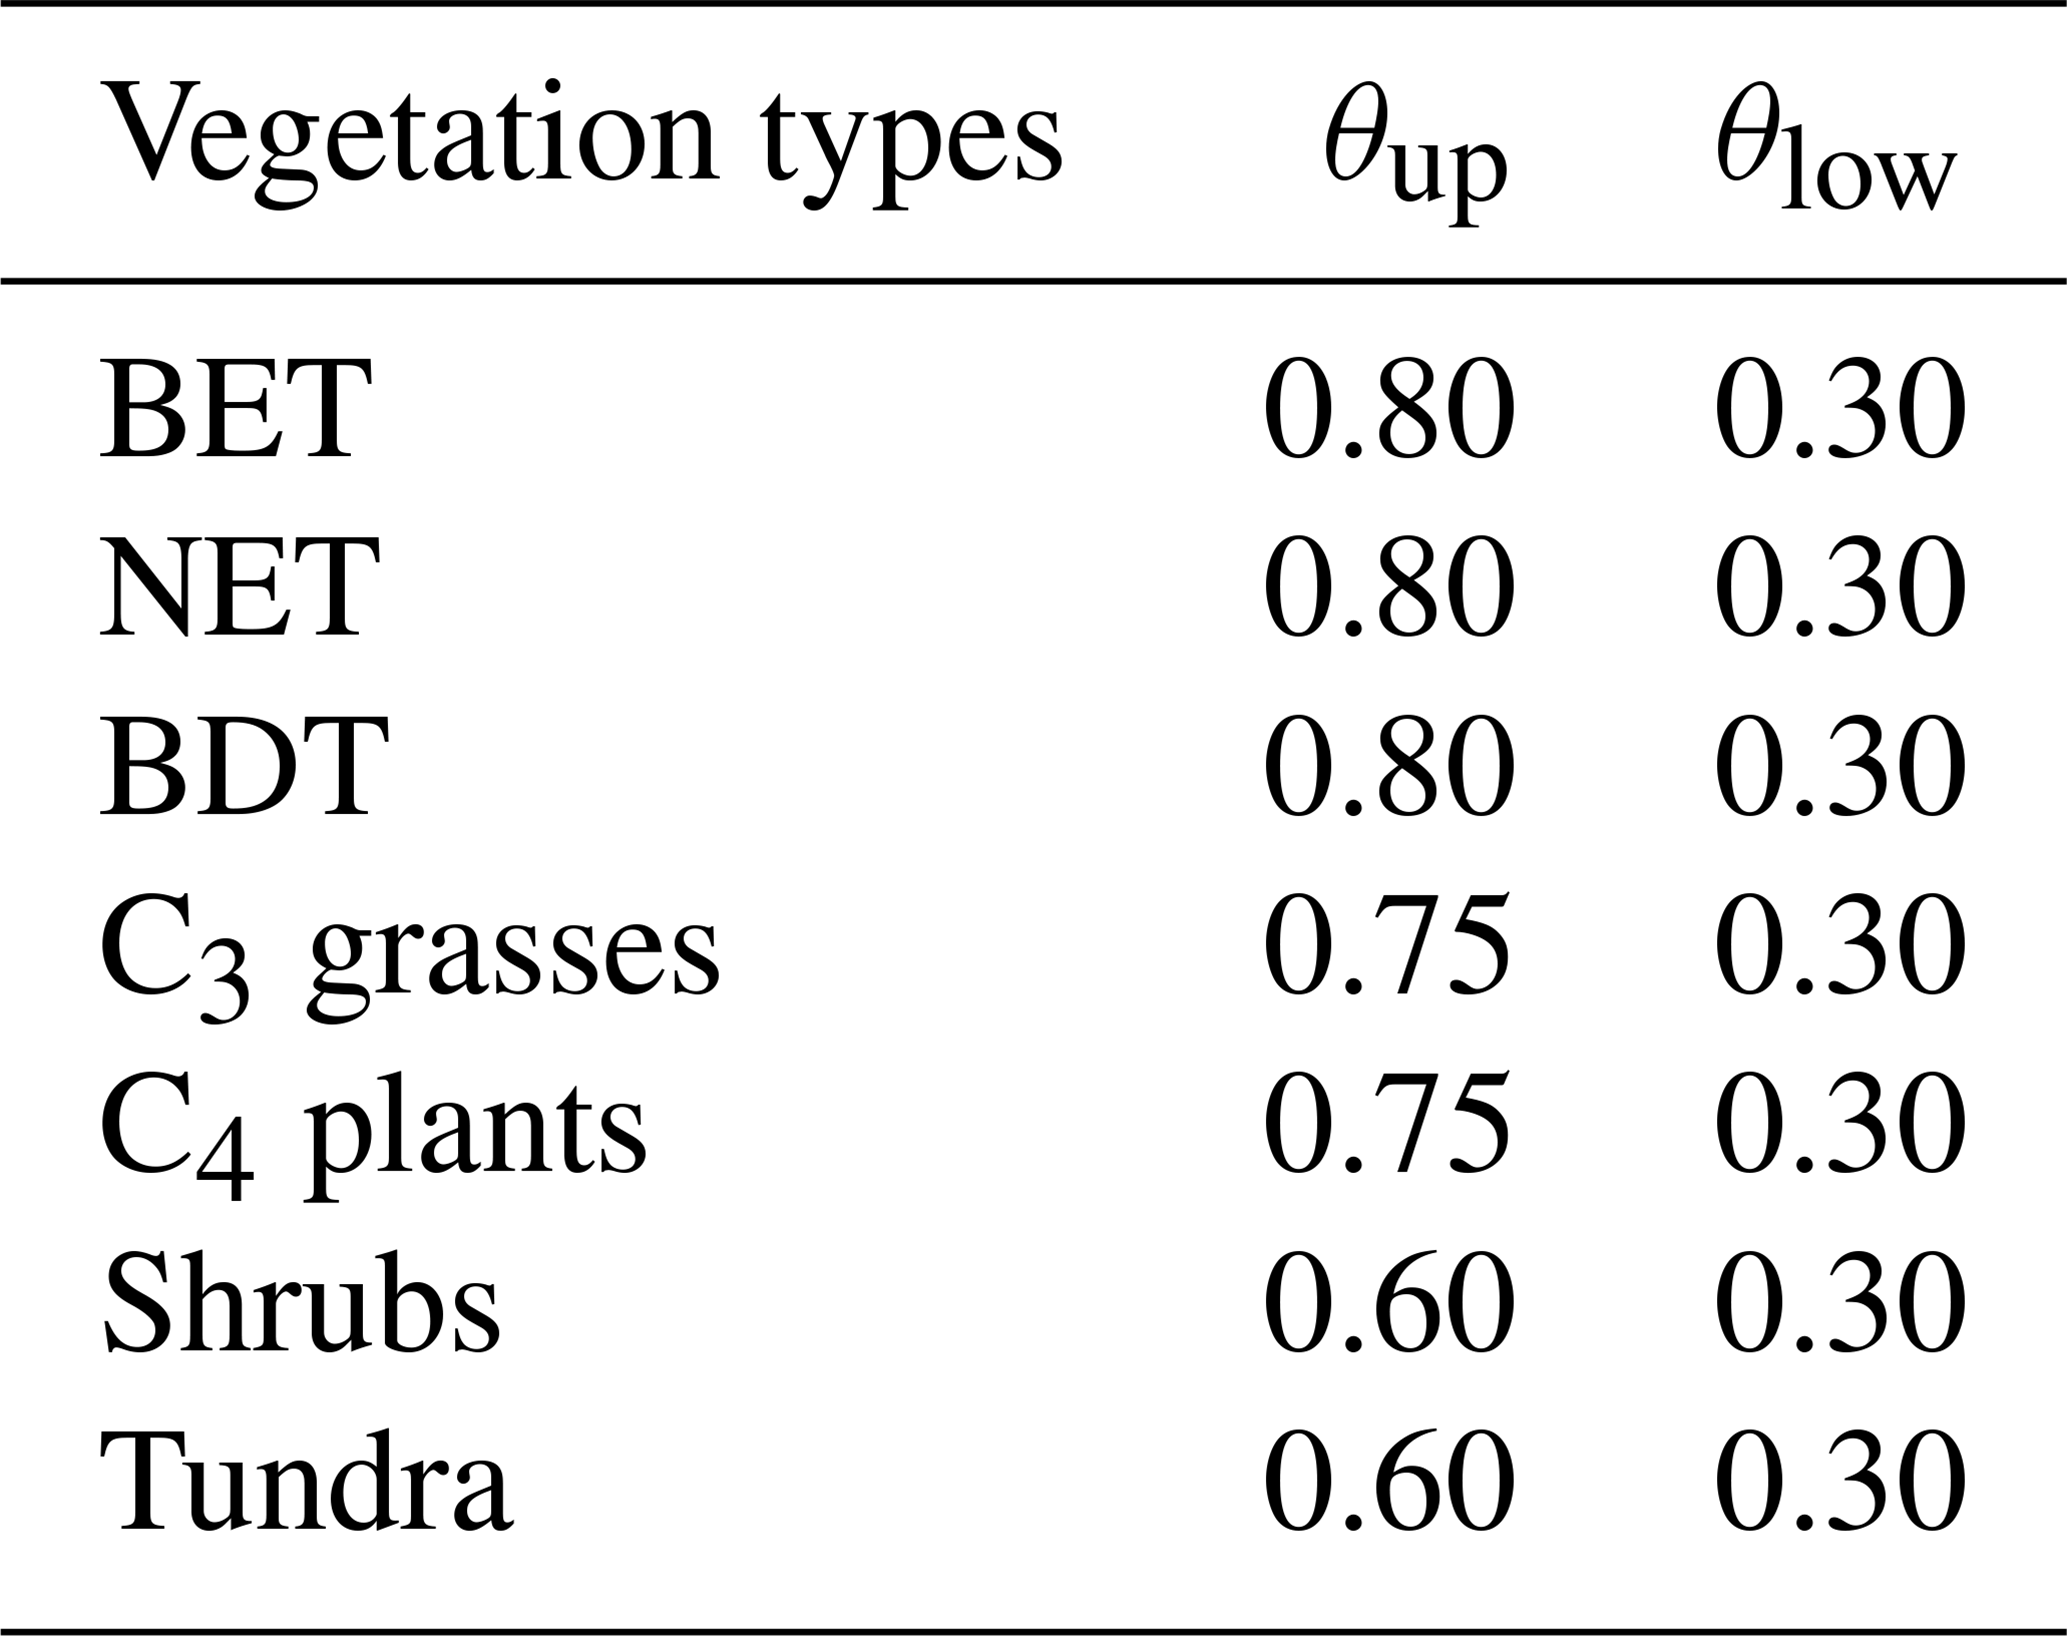
Relative humidity suppresses fire occurrence when it is larger than RHup=70 %, and relative humidity does not constrain fire when it is smaller than RHlow=30 %. The PFT-dependent θup and θlow are used as the upper and lower thresholds of soil moisture in a similar way to the thresholds of relative humidity (Table 1). In the Li et al. (2012) fire scheme, this factor (fθ) is parameterized using root zone soil moisture potential factor β (0–1.0), a model-dependent variable used to calculate transpiration in CLM (Li and Lawrence, 2017). βlow=0.85 and βup=0.98 are used as the lower and upper thresholds for all PFTs, yet the narrow range of β in CLM5 has led to fire model too sensitive to drought. In SSiB4/TRIFFID-Fire, the root zone soil moisture θ is found to be the best variable to describe the dependence of fuel combustibility on the preceding climate.
Table 1The upper (θup) and lower (θlow) thresholds of root zone soil moisture for PFTs in SSiB4/TRIFFID-Fire.
The human suppression factor (feo; 0–1) reflects the demographic (fd) and economic (fe) impact on fire occurrence in populated areas (population density Dp>0.1 per person km−2):
The human suppression is assumed to be negligible (fseo=1) when Dp≤0.1 person km−2. A detailed description of fd and fe parameterization can be found in Li et al. (2012, 2013).
2.2.2 Average spread area after fire ignition
The average spread area of a fire is assumed to be elliptical in shape, with the ignition point located at one of the foci and the fastest spread occurring along the major axis. The average burned area of a fire a (km2 per count) is represented as follows (Li et al., 2012):
where LB is the length-to-breadth ratio of the ellipse shape and is related to the wind speed, W (m s−1):
umax is the PFT-dependent maximum fire spread rate (m s−1; Table S1). g0=0.05 is the dependence of fire spread rate perpendicular to the wind direction. Fm is the influence of fuel wetness on fire spread and is assumed to be related to fm in the fire occurrence Eq. (6):
τ ( s) is the global average fire duration, which is simply taken to be 1 d, as reported by Giglio et al. (2006). The human suppression factor, Fse, reflects the human impact on fire spread through firefighting activities and is parameterized following Li et al. (2013).
2.2.3 Carbon emissions, post-fire mortality, and emissions of aerosols and trace gases
In post-fire regions, the fire carbon emission, φj (g C s−1), from the jth PFT is calculated based on the burned area (Ab; km2 s−1), Carbon density Cj, and carbon combustion completeness CCj:
is carbon density vector (g C km−2) for leaf, stem, root, and litter of the jth PFT calculated in TRIFFID. As the carbon cycle in current SSiB4/TRIFFID does not explicitly represent the litter carbon storage and decomposition, we assume the litter carbon and woody debris account for about 25 % of aboveground biomass for global forest and about 30 % for savanna and grassland based on previous studies (Pan et al., 2011; de Oliveira et al., 2019). CCj is the corresponding combustion completeness for leaf, stem, root, and litter of the jth PFT (Table S2). Meanwhile, fire-induced mortality transfers carbon from uncombusted leaf, stem, and root to litter:
where is the corresponding mortality factor for the jth PFT(Table S2).
Finally, the emissions of trace gases and aerosols species x for the jth PFT (EMx,j, g s−1) can be calculated from carbon emissions (φj) using the PFT-dependent emission factor (EFx,j, g species (kg dm)−1):
where [C] (=0.5 g C (kg dm)−1) is a unit conversion factor from dry matter to carbon (Li et al., 2019). The emission factors, EFx,j, of trace gases and aerosols in Table S3 are based on Andreae (2019). The emissions of trace gases and aerosols can be applied in the atmospheric chemistry model to calculate the production of secondary aerosols, transport of pollutants, and the resultant aerosol direct and indirect effects on climate.
2.2.4 Including the fire effect on the carbon pool
When the Li et al. (2012) fire model is coupled with CLM, the vegetation distribution is prescribed using satellite-based land cover, and therefore the fire impact on vegetation cover is not simulated. In SSiB4/TRIFFID-Fire, the fire-related carbon loss due to combustion and post-fire mortality is transferred to changes of PFT fraction based on carbon balance.
In TRIFFID (Cox, 2001), the fractional change of the jth PFT () is governed by the Lotka–Volterra equation:
where fj is the fractional coverage of the jth PFT; λjNPPj is the carbon available for spreading; Cvj is the carbon density (g C km−2); cij is the competition coefficient between the ith and jth PFTs; and γj (s−1) is the constant disturbance representing the loss of PFT fraction due to fires, pests, windthrow, and many other processes.
When the fire model is coupled to SSiB4/TRIFFID, the loss of PFT fraction due to fires (βj) can be explicitly derived from the fire-induced carbon loss:
where φj and ψj are PFT-dependent carbon loss due to combustion and post-fire mortality, respectively. The fire-caused PFT fraction loss results in bare soil for vegetation spreading decided by the competition strategy in TRIFFID. As such, fire disturbance is explicitly represented and varies in space and time, and the original γj is adjusted to to exclude fire disturbance (Table 2):
Table 2The disturbance rate implicitly including fire disturbance (γv) and excluding fire disturbance ().

2.3 Implementing the fire model in SSiB4/TRIFFID
In SSiB4/TRIFFID, SSiB4 provides GPP, autotrophic respiration, and other physical variables such as canopy temperature and soil moisture every 3 h for TRIFFID (Fig. 1). TRIFFID accumulates the 3-hourly GPP and respiration and provides biotic carbon, PFT fractional coverage, vegetation height, and LAI every 10 d, which are used to update surface properties (albedo, canopy height, roughness length, and aerodynamic/canopy resistances) in SSiB4. When the fire model is included, it uses the meteorological forcings and physical variables provided by SSiB4 every 3 h and the biophysical properties (PFT fraction and biotic carbon) provided by TRIFFID every 10 d. The fire model calculates the burned area, carbon combustion, post-fire mortality, and emissions every 3 h, and the fire-induced carbon loss is subtracted from fuel load. The carbon loss is accumulated within 10 d in the fire model and is transferred to TRIFFID on day 10. TRIFFID updates the vegetation dynamics based on carbon balance on day 10, using the net primary production, fire-induced carbon loss, and PFT competition strategy. The updated vegetation dynamics are transferred to SSiB4 to reflect fire effects on surface properties.
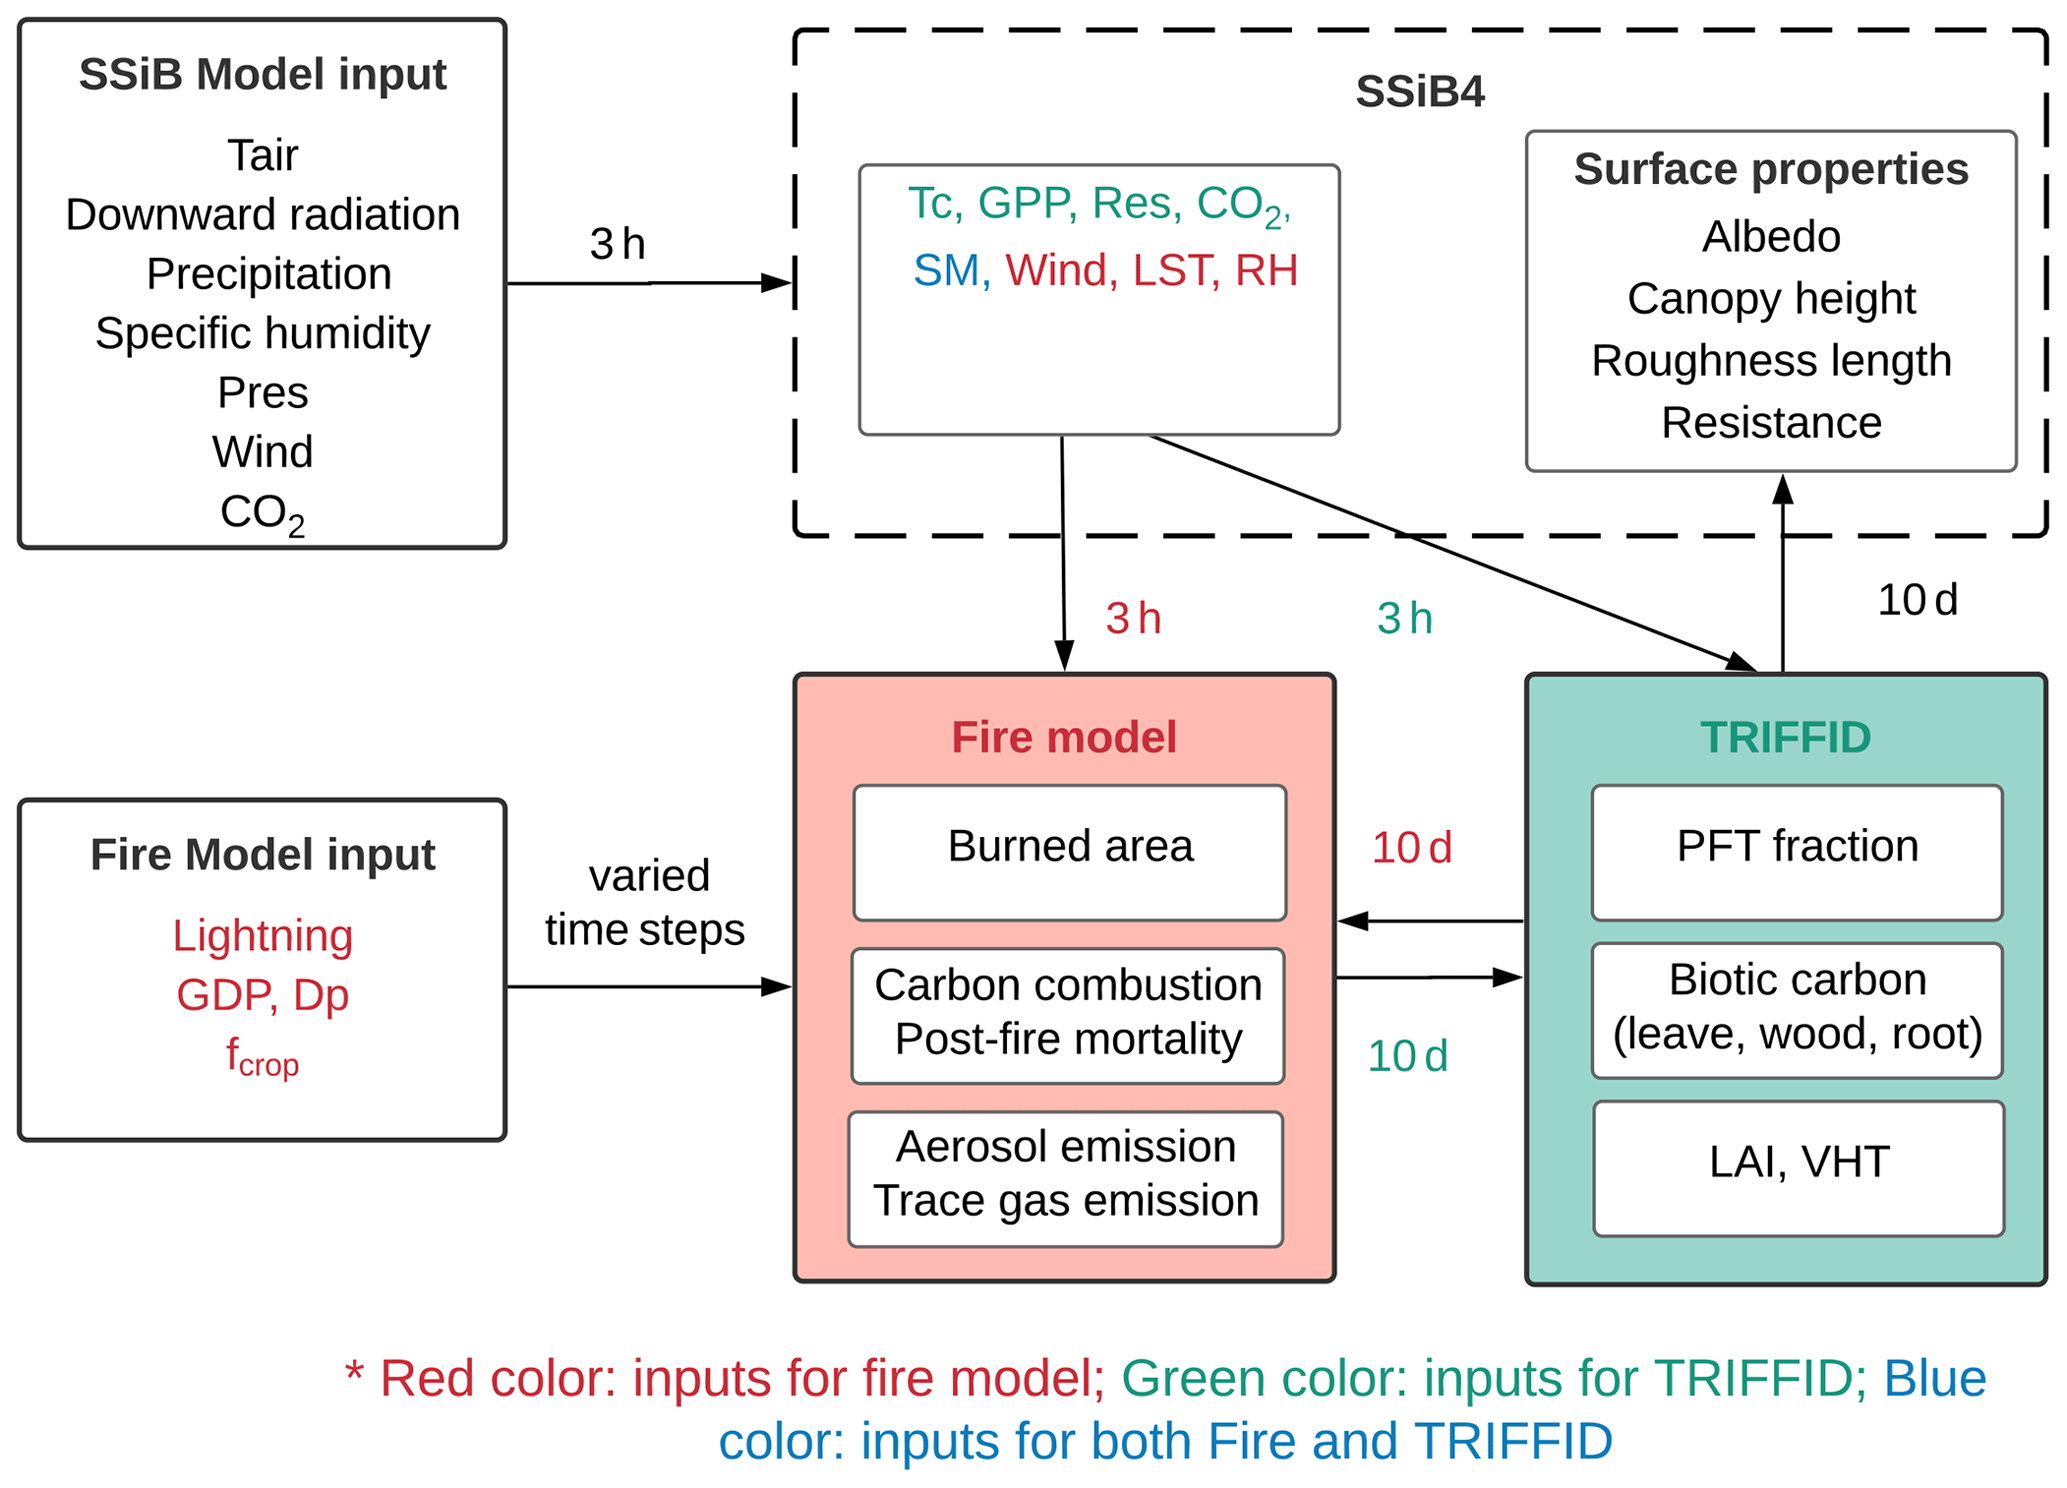
Figure 1Schematic diagram of fire model coupling in SSiB4/TRIFFID-Fire (Tair: air temperature; Pres: surface pressure; Dp: population density; fcrop: crop fraction; Tc: canopy temperature; Res: autotrophic respiration; SM: soil moisture; LST: land surface temperature; RH: relative humidity; VHT: vegetation height)
3.1 Experimental design
Two sets of offline experiments have been conducted using SSiB4/TRIFFID-Fire, which consist of FIRE-ON (SSiB4/TRIFFID-Fire with fire model switched on) and FIRE-OFF (SSiB4/TRIFFID-Fire with fire model switched off). To obtain the initial conditions for these two experiments, similar to our previous SSiB4/TRIFFID experiments (Zhang et al., 2015; Liu et al., 2019), we conducted spin-up simulations (SPFIRE-ON and SPFIRE-OFF) for 100 years to reach a quasi-equilibrium PFT distribution with and without fire disturbance. These spin-up simulations were initialized using the quasi-equilibrium state from Liu et al. (2019) (SPINIT in Fig. 2) and were driven by climatology forcing averaged over 1948–1972 and atmospheric CO2 concentration, population density, and GDP in 1948 (Fig. 2). Following Liu et al. (2019), the quasi-equilibrium status is defined as the rate of relative change in fractional coverage of all PFTs is less than 2 % over the last 10 years of simulation.

Based on the quasi-equilibrium status with fire disturbance (SPFIRE-ON), a transient run was performed (FIRE-ON) with the fire model turned on from 1948 to 2014 (Fig. 2). The model was forced by 3-hourly meteorological forcings and yearly updated atmospheric CO2 concentration, population density, and GDP data. FIRE-ON produced the fire regime, ecosystem, and surface conditions during 1948–2014. A FIRE-OFF run, based on SPFIRE-OFF, was carried out with the fire model switched off during 1948–2014. The vegetation distribution was allowed to respond to climate variations in both FIRE-ON and FIRE-OFF simulations and to fire disturbances only in the FIRE-ON.
3.2 Model input and validation data
The meteorological forcings used to drive SSiB4/TRIFFID-Fire for the period of 1948–2014 are from the Princeton global meteorological dataset for land surface modeling (Sheffield et al., 2006), including surface air temperature, surface pressure, specific humidity, wind speed, downward shortwave radiation flux, downward longwave radiation flux, and precipitation (Table 3). The dataset is constructed by combining global observation-based datasets with the NCEP/NCAR reanalysis. The spatial resolution is 1.0∘ × 1.0∘, and the temporal interval is 3 h.
The required inputs for driving the fire model are listed in Table 3. The 2-hourly climatology lightning flashes data from NASA LIS/OTD v2.2 at 2.5∘ × 2.5∘ resolution are used to calculate the number of natural ignitions. The population density data are provided by the Gridded Population of the World version 3 (GPWv3; CIESIN, 2005) for 1990–2005 and Database of the Global Environment version 3.1 (HYDEv3.1; Goldewijk et al., 2010) for 1850–1980. GDP per capita in 2000 is from van Vuuren et al. (2007). The population density and GDP data are used to calculate the human ignitions and suppression in the fire model. The agriculture fraction is obtained from the GLC2000, which represents the agriculture distribution for the year 2000 (Bartholome and Belward, 2005). All the datasets are resampled to 1.0∘ × 1.0∘ spatial and 3-hourly temporal resolution.
Table 3Datasets used to drive SSIB4/TRIFFID-Fire and evaluate simulations.
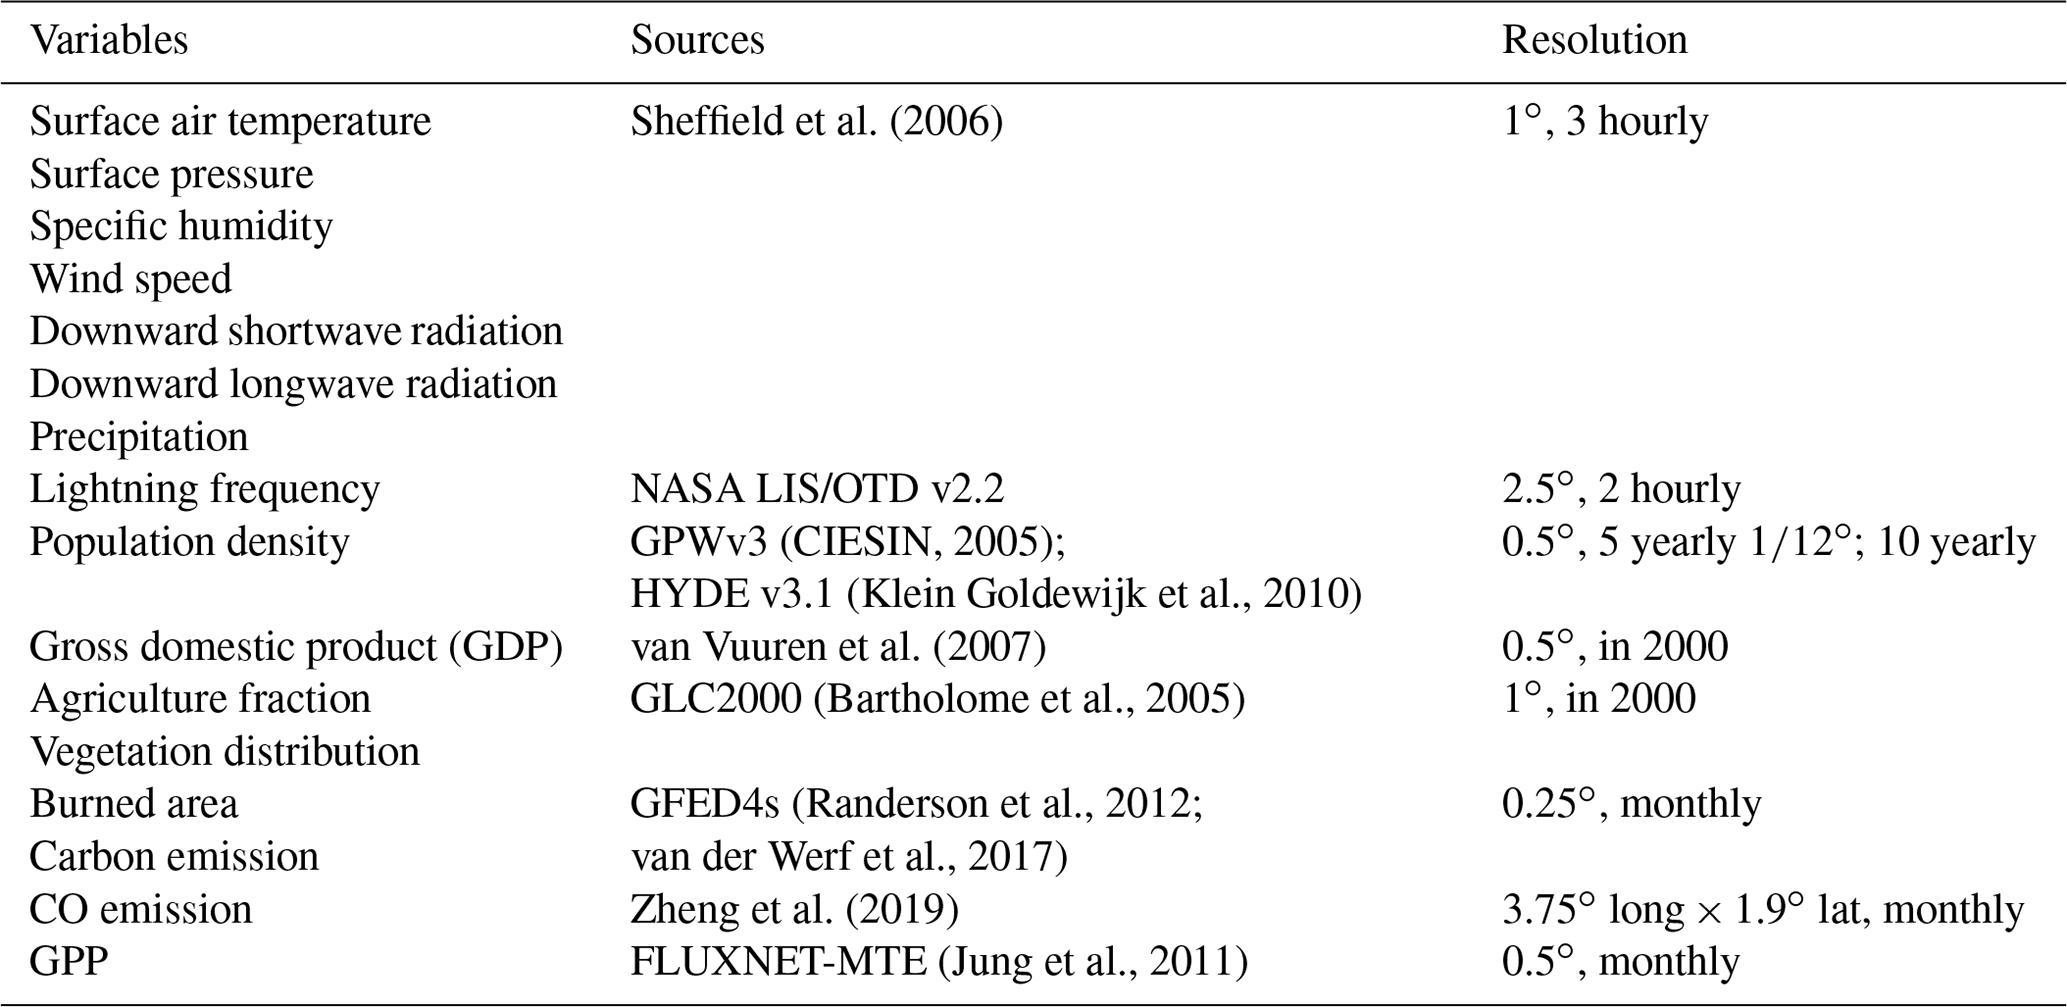
The Global Fire Emission Database (GFED) is a fire dataset derived mainly from MODIS satellite observations (van der Werf et al., 2006; van der Werf et al., 2010; Giglio et al., 2013). The GFED fire product provides the burned area and fire emissions on the global scale and has been widely used for fire model validation and calibration (van Marle et al., 2017; Li et al., 2019). The latest version of GFED, GFED4s, has included the contribution from small fires that are below the MODIS detection limit (van der Werf et al., 2017). The burned area and carbon emissions simulated by SSiB4/TRIFFID-Fire will be validated using gridded monthly GFED4s fire products in 2000–2014 at 0.25∘ spatial resolution.
We also evaluate the simulated vegetation distribution, CO emission from fire, and GPP with observations. We use the vegetation fraction from GLC2000 generated in Liu et al. (2019) by calculating the percentage of each land cover type in 1.0∘ × 1.0∘ and converting to PFTs in SSiB4/TRIFFID-Fire. The CO emission from Zheng et al. (2019) is an inversion-based product that uses CO emission from multiple sources as prior and performs inversion simulations constrained by atmosphere CO concentration retrieved from the satellite. It provides the latest CO emission estimate from fire in 2000-2017. FLUXNET Model Tree Ensemble (FLUXNET-MTE) GPP is upscaled from FLUXNET observations to the global scale using the machine learning technique MTE (Jung et al., 2011). The FLUXNET-MTE GPP at 0.5∘ × 0.5∘ spatial resolution in 1982–2011 has been resampled to 1.0∘ × 1.0∘ to be compared with SSiB4/TRIFFID-Fire.
This section evaluates the model simulation of burned area, carbon emissions, PFT fraction, and GPP by comparing FIRE-ON results with GFED4s, GLC2000, and FLUXNET-MTE data. Specifically, we will focus on the model description of fire seasonality. After model validation, SSiB4/TRIFFID-Fire is applied to assess the long-term fire effect on the ecosystem and surface energy budget using the differences between the FIRE-ON and FIRE-OFF.
4.1 Burned area
The simulations of burned area are evaluated using satellite-based product GFED4s for the period of 2000–2014. Figure 3 shows the 2000–2014 annual burned fraction in GFED4s and SSiB4/TRIFFID-Fire and their latitudinal distribution. The simulated global burned area is 471.9 Mha yr−1, slightly higher than the estimate from MODIS Collection 6 in 2002–2016 (423 Mha yr−1; Giglio et al., 2018) but very close to the value from GFED4s (478.1 Mha yr−1). The spatial distribution of observed burned area is well captured in the SSiB4/TRIFFID-Fire simulation with a spatial correlation of 0.80. Both GFED4s and SSiB4/TRIFFID-FIRE show that the major burned area is concentrated in the tropical savannas (5–15∘ N; 5–20∘ S), including Northern Hemisphere Africa (NHAF), Southern Hemisphere African (SHAF), Southern Hemisphere South America (SHSA), and northern Australia (Fig. 3a and c). GFED4s shows that the Northern African savanna has a larger latitudinal burned area in a narrower fire band compared to the Southern African savanna (Fig. 3b). SSiB4/TRIFFID-Fire captures the latitudinal band in burned Northern African savanna but underestimates its magnitude (Fig. 3d). Another burned area peak occurs around 50∘ N in Boreal Asia (BOAS) and Boreal North America (BONA). The humid climate there suppresses fire ignition yet the high level of aboveground biomass and a lack of human suppression facilitate fire occurrence and spread, which results in an intermediate burned area in the boreal regions. The low burned fraction for deserts and tropical rainforests, which is caused, respectively, by low fuel availability and combustibility, are also well simulated (Fig. 3a), leading to the minimum burned area around the Equator and subtropical regions.
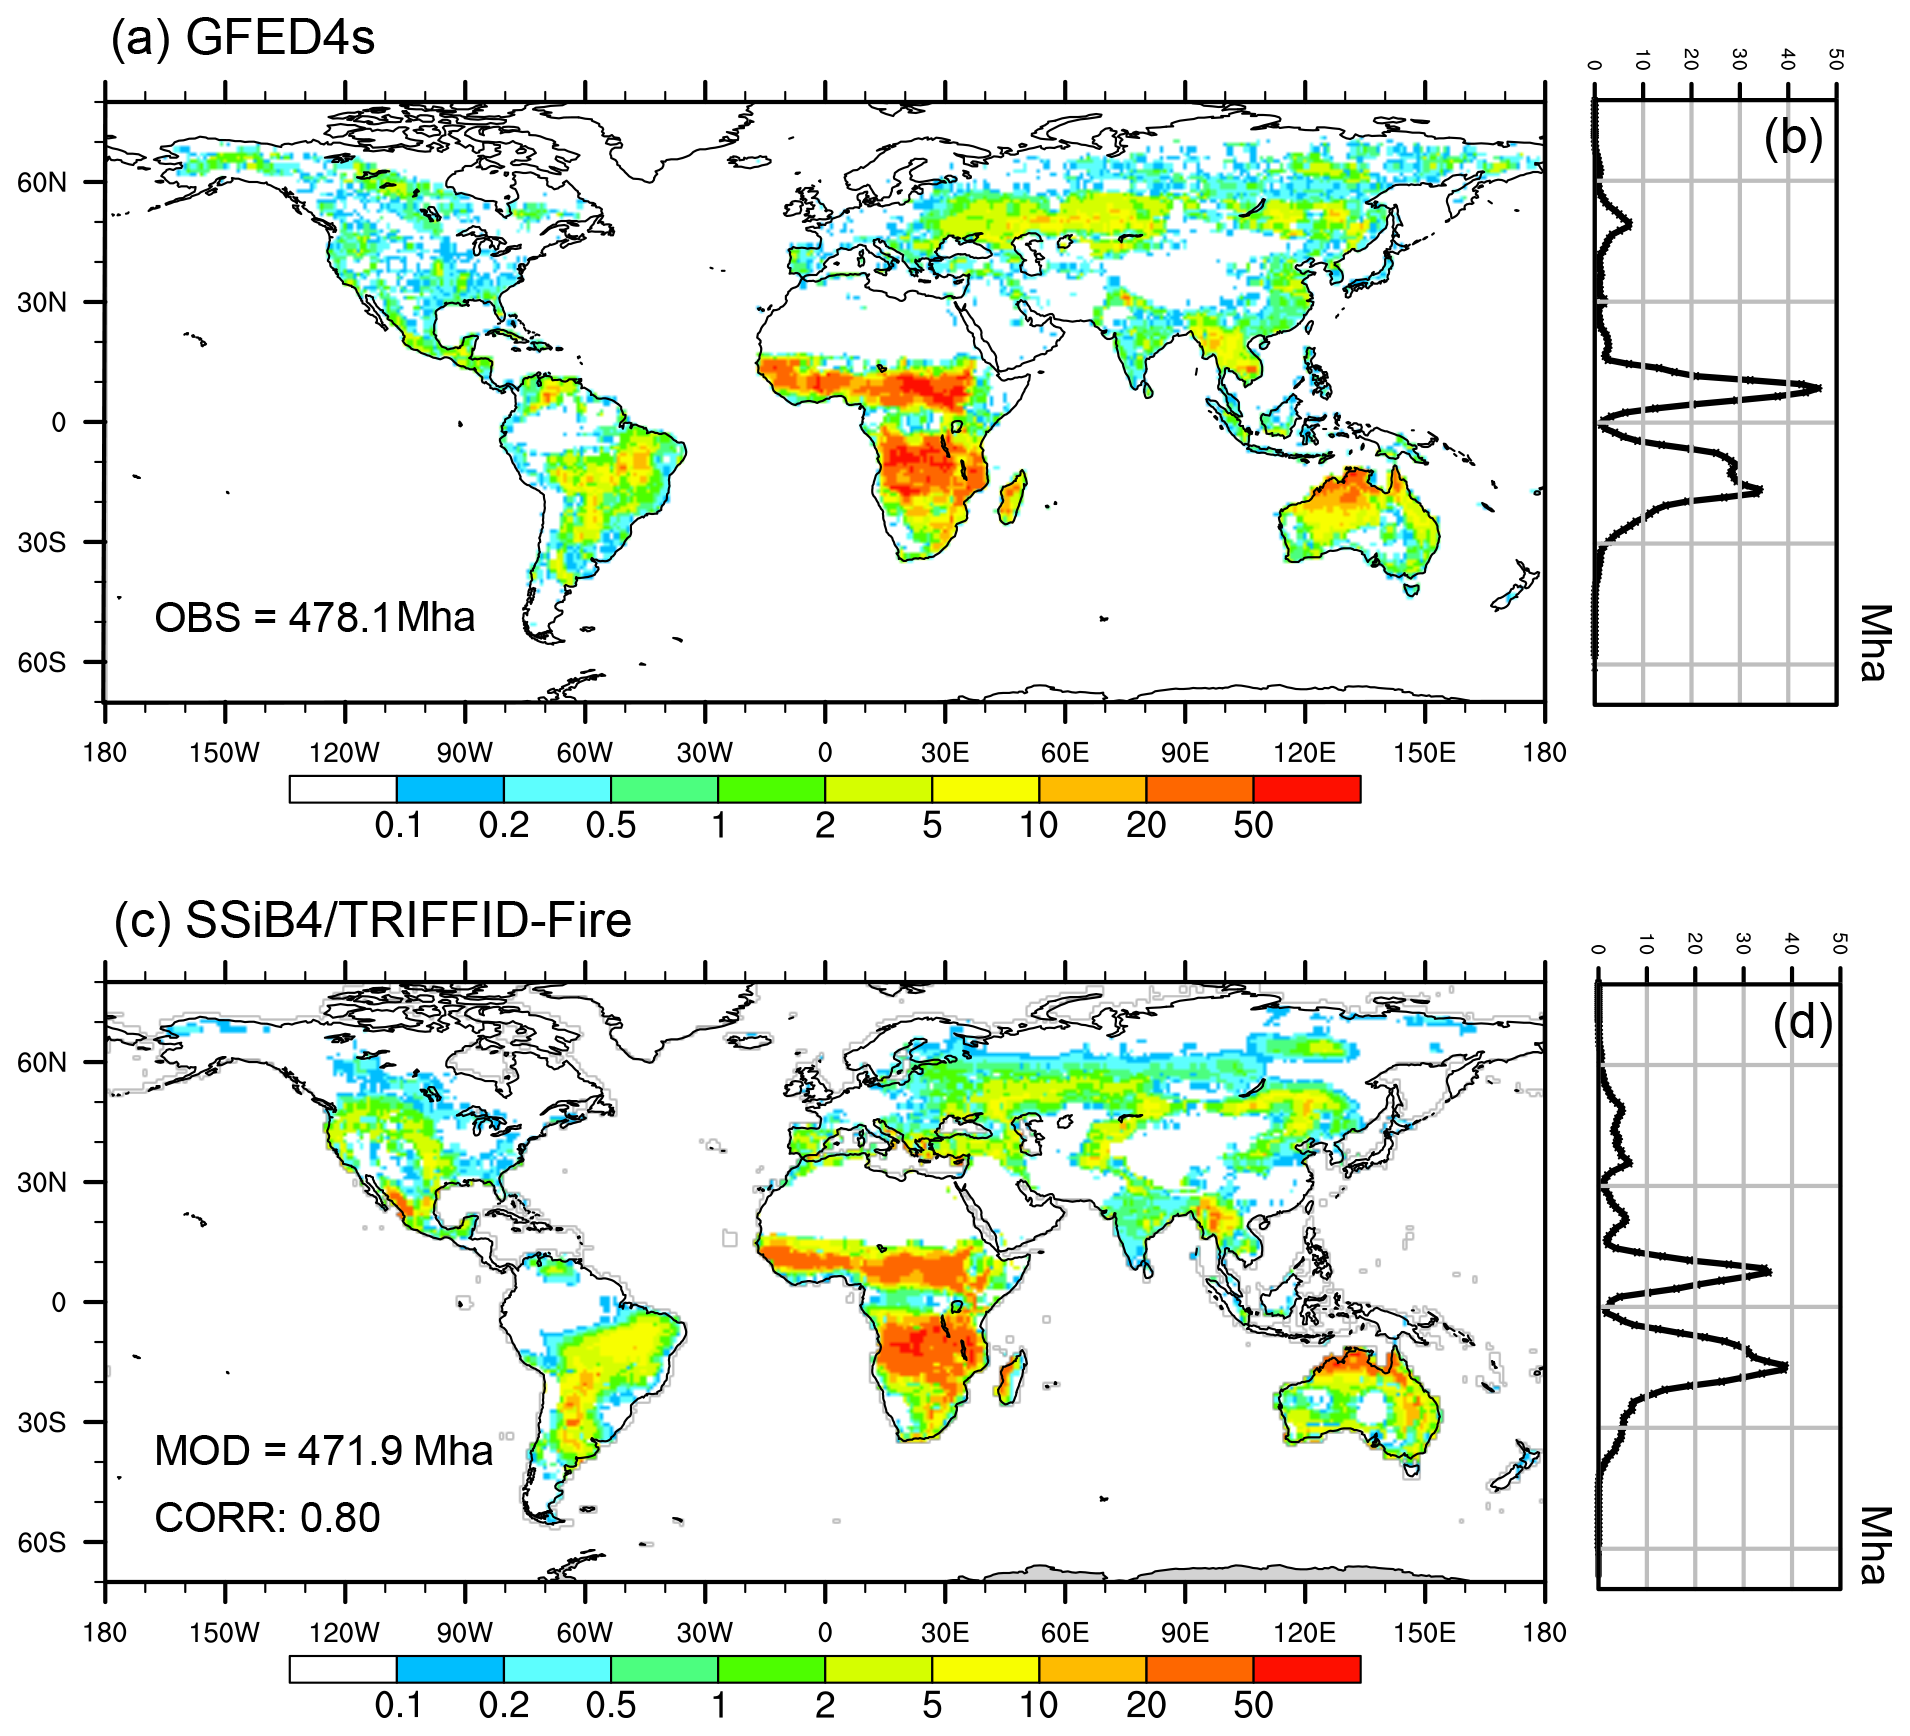
Figure 3Spatial distribution of annual burned fraction (%) averaged over 2000–2014 for (a) GFED4s and (c) SSiB4/TRIFFID-Fire. Panels (b) and (d) show the zonal mean burned area (Mha) for GFED4s and SSiB4/TRIFFID-Fire, respectively.
We also evaluate the 14 sub-regions following the definition in GFED according to the fire behavior similarity (van der Werf et al., 2006). The burned area in African savanna accounts for more than 60 % of the global burned area in both GFED4s and SSiB4/TRIFFID-Fire (Fig. 4b). The simulated burned areas in SHAF and NHAF are 168.3 and 124.5 Mha, respectively, very close to GFED4s burned areas in SHAF (167.9 Mha) but slightly underestimated in NHAF (155.5 Mha). The negative bias in NHAF burned area is the main cause of the underestimation in the latitudinal fire distribution around 10∘ N (Fig. 3d). SSiB4/TRIFFID-Fire also captures the burned fraction in other major fire regions such as Australia (AUST) and SHSA (Fig. 4b), which are dominated by savanna fire. We notice that the burned area in western and central parts of temperate North America (TENA) is overestimated (Figs. 3c and 4b). Nevertheless, the burned area there is relatively small compared to that in major fire regions such as SHAF and NHAF. This shortcoming has been reported in a number of fire models (Pfeiffer et al., 2013; Lasslop et al., 2014; Yue et al., 2014; Venevsky et al., 2019). The reasons include an underestimate of anthropogenic suppression, inaccurate description of fuel pattern/grassland fraction, and landscape fragmentation from roads and other anthropogenic features. The burned area in the Middle East (MIDE) is also overestimated (Fig. 4b) as a larger burned area is simulated at the northern boundary of the Sahara Desert and south of the Black Sea (Fig. 3c). The simulated burned area is underestimated in BONA and BOAS where fire has a lower incidence but a longer duration compared to the global average (Ward et al., 2018; Venevsky et al., 2019). As we assume all fires persist for 1 d, the burned area in boreal regions is therefore underestimated. Further improvements, such as multiday burning and a deliberate scheme for anthropogenic effect, are necessary in regional applications.
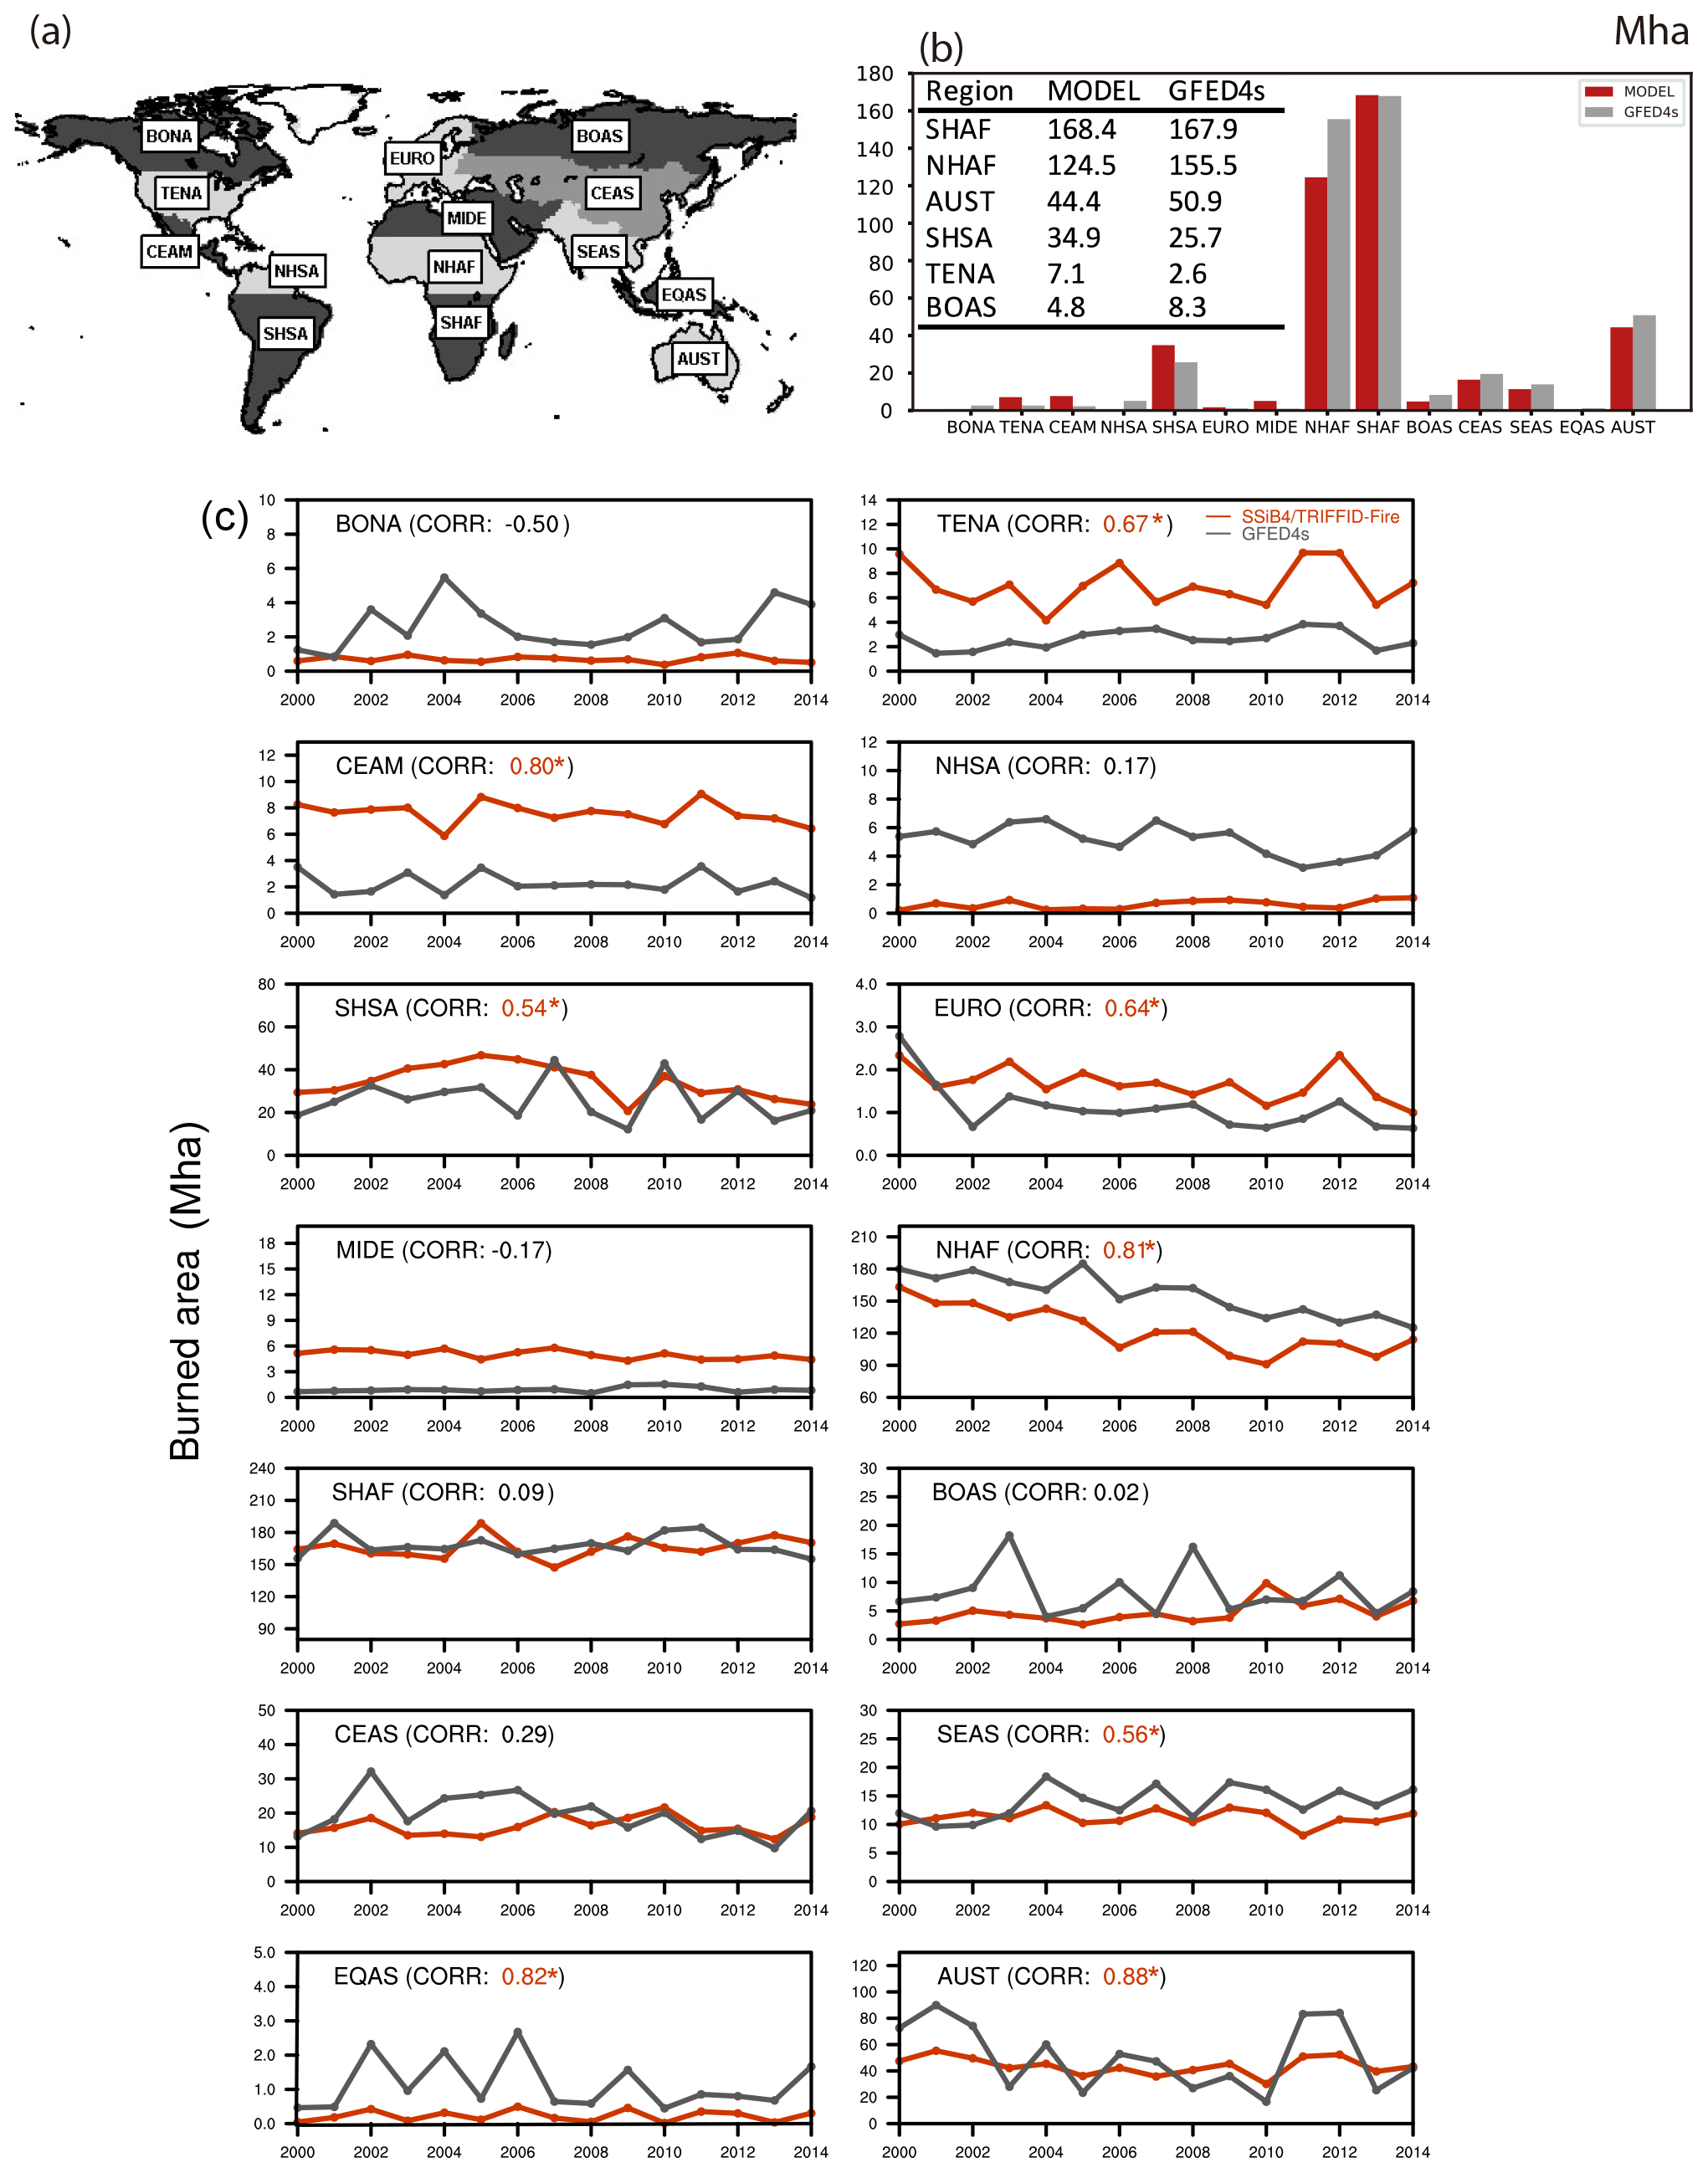
Figure 4(a) Map of 14 regions used in this study, following Giglio et al. (2010) and van der Werf et al. (2006, 2010) (b) Annual burned area (Mha) averaged over 2000–2014 for GFED4s and SSiB4/TRIFFID-Fire in 14 regions. (c) Annual burned area (Mha) for 2000–2014 for GFED4s and SSiB4/TRIFFID-Fire in 14 GFED regions. The “*” and the red color indicate the positive correlation is significant at p<0.05.
In 8 out of the 14 sub-regions, SSiB4/TRIFFID-Fire reproduces the observed interannual variability (IAV) of burned area well, with the correlation between simulations and observations significant at p<0.05 (Fig. 4c). The regions are NHAF, SHSA, AUST, TENA, Central America (CEAM), Europe (EURO), Southeast Asia (SEAS), and Equatorial Asia (EQAS). In particular, a decline in NHAF burned area is found in both SSiB4/TRIFFID-Fire and GFED4s, which has been attributed to agricultural expansion and intensification in recent fire studies (Andela et al., 2017; Teckentrup et al., 2019). Although our model does not have an explicit description of agriculture fraction and intensification changes, the anthropogenic effect is implicitly included by relating fire suppression to population density and GDP (Li et al., 2013). Meanwhile, SSiB4/TRIFFID-Fire also captures the IAV in SEAS and EQAS, which is known to be driven by climate factors such as relative humidity and soil moisture.
The simulated IAV of SHAF burned area is not as good as other savanna fire regions (e.g., NHAF, SHSA, and AUST), although the IAV is small there (Fig. 4c). Some studies have reported that humans have a substantial impact on SHAF fire, which limits the effect of climate-induced IAV (Archibald et al., 2010; Venevsky et al., 2019). In addition, the simulated IAV of burned areas is lower than observations in BONA and BOAS as the model fails to capture some extreme fire events (Fig. S1 in the Supplement). The lower variability comes from the climatology lightning data (Pfeiffer et al., 2013). As lightning flash is the predominant ignition source in the Northern Hemisphere high latitudes, the application of climatology lightning has a greater impact in boreal regions than in other parts of the globe.
Figure 5 shows the pointwise temporal correlation of the multi-year monthly burned area between SSiB4/TRIFFID-Fire and GFED4s averaged in 2000–2014. SSiB4/TRIFFID-Fire captures the fire seasonality in most regions, including the Southern African savanna, South American savanna, the northeastern part of Boreal Asia, the eastern part of Boreal America, Southeast Asia, and Equatorial Asia. Specifically, we examine the simulation of peak fire month and fire season length in SSiB4/TRIFFID-Fire following the definition that fire seasons include months with more than 1∕12 of the mean annual burned fraction (Venevsky et al., 2019). Over the globe, August and December are the two peak fire months that have the largest contribution to the annual burned area (Fig. 6a). SSiB4/TRIFFID-Fire generates two fire seasons in June–July–August and December–January–February, capturing the peak month in August but underestimating the burned area in December. In the tropical savannas (SHAF, SHSA, and NHAF), fire activities concentrate in the local dry season, and the burned area during the fire season accounts for more than 80 % of the annual burned area (Fig. 6b–d). The burned area in Southern Hemisphere major fire regions, SHAF and SHSA, peaks in August and September in both the observations and model. The simulated fire seasons in SHAF (June–October) and SHSA (July–October) match precisely with the observations. In other fire regions, such as SEAS and EQAS, SSiB4/TRIFFID-Fire also reproduces the fire seasonality and peak fire months (Fig. 6e–f). Compared with the latest results from other fire models (Hantson et al., 2020), our model produces more realistic burned area peak and fire season duration.
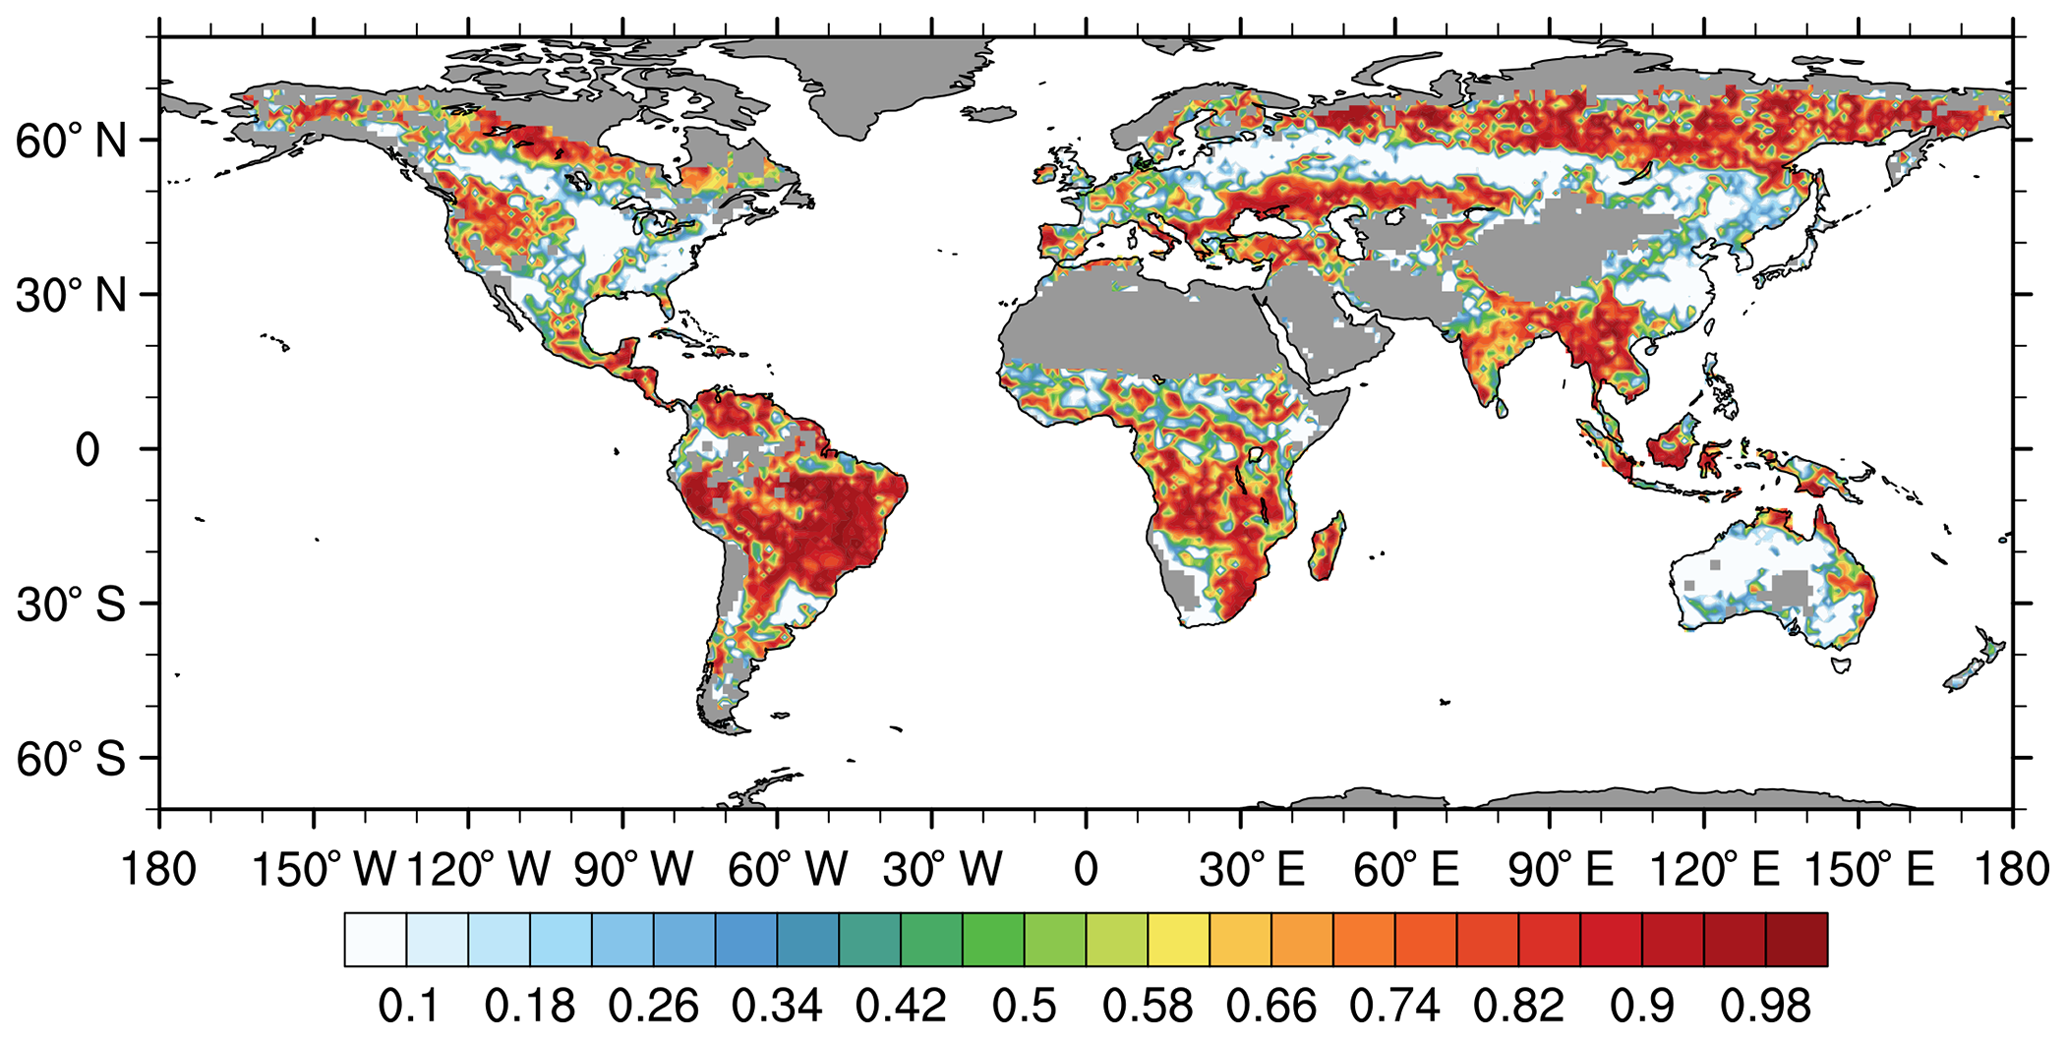
Figure 5Temporal correlation of monthly burned area averaged over 2000–2014 between SSiB4/TRIFFID-Fire and GFED4s (grids with annual burned fraction <0.001 % are masked).
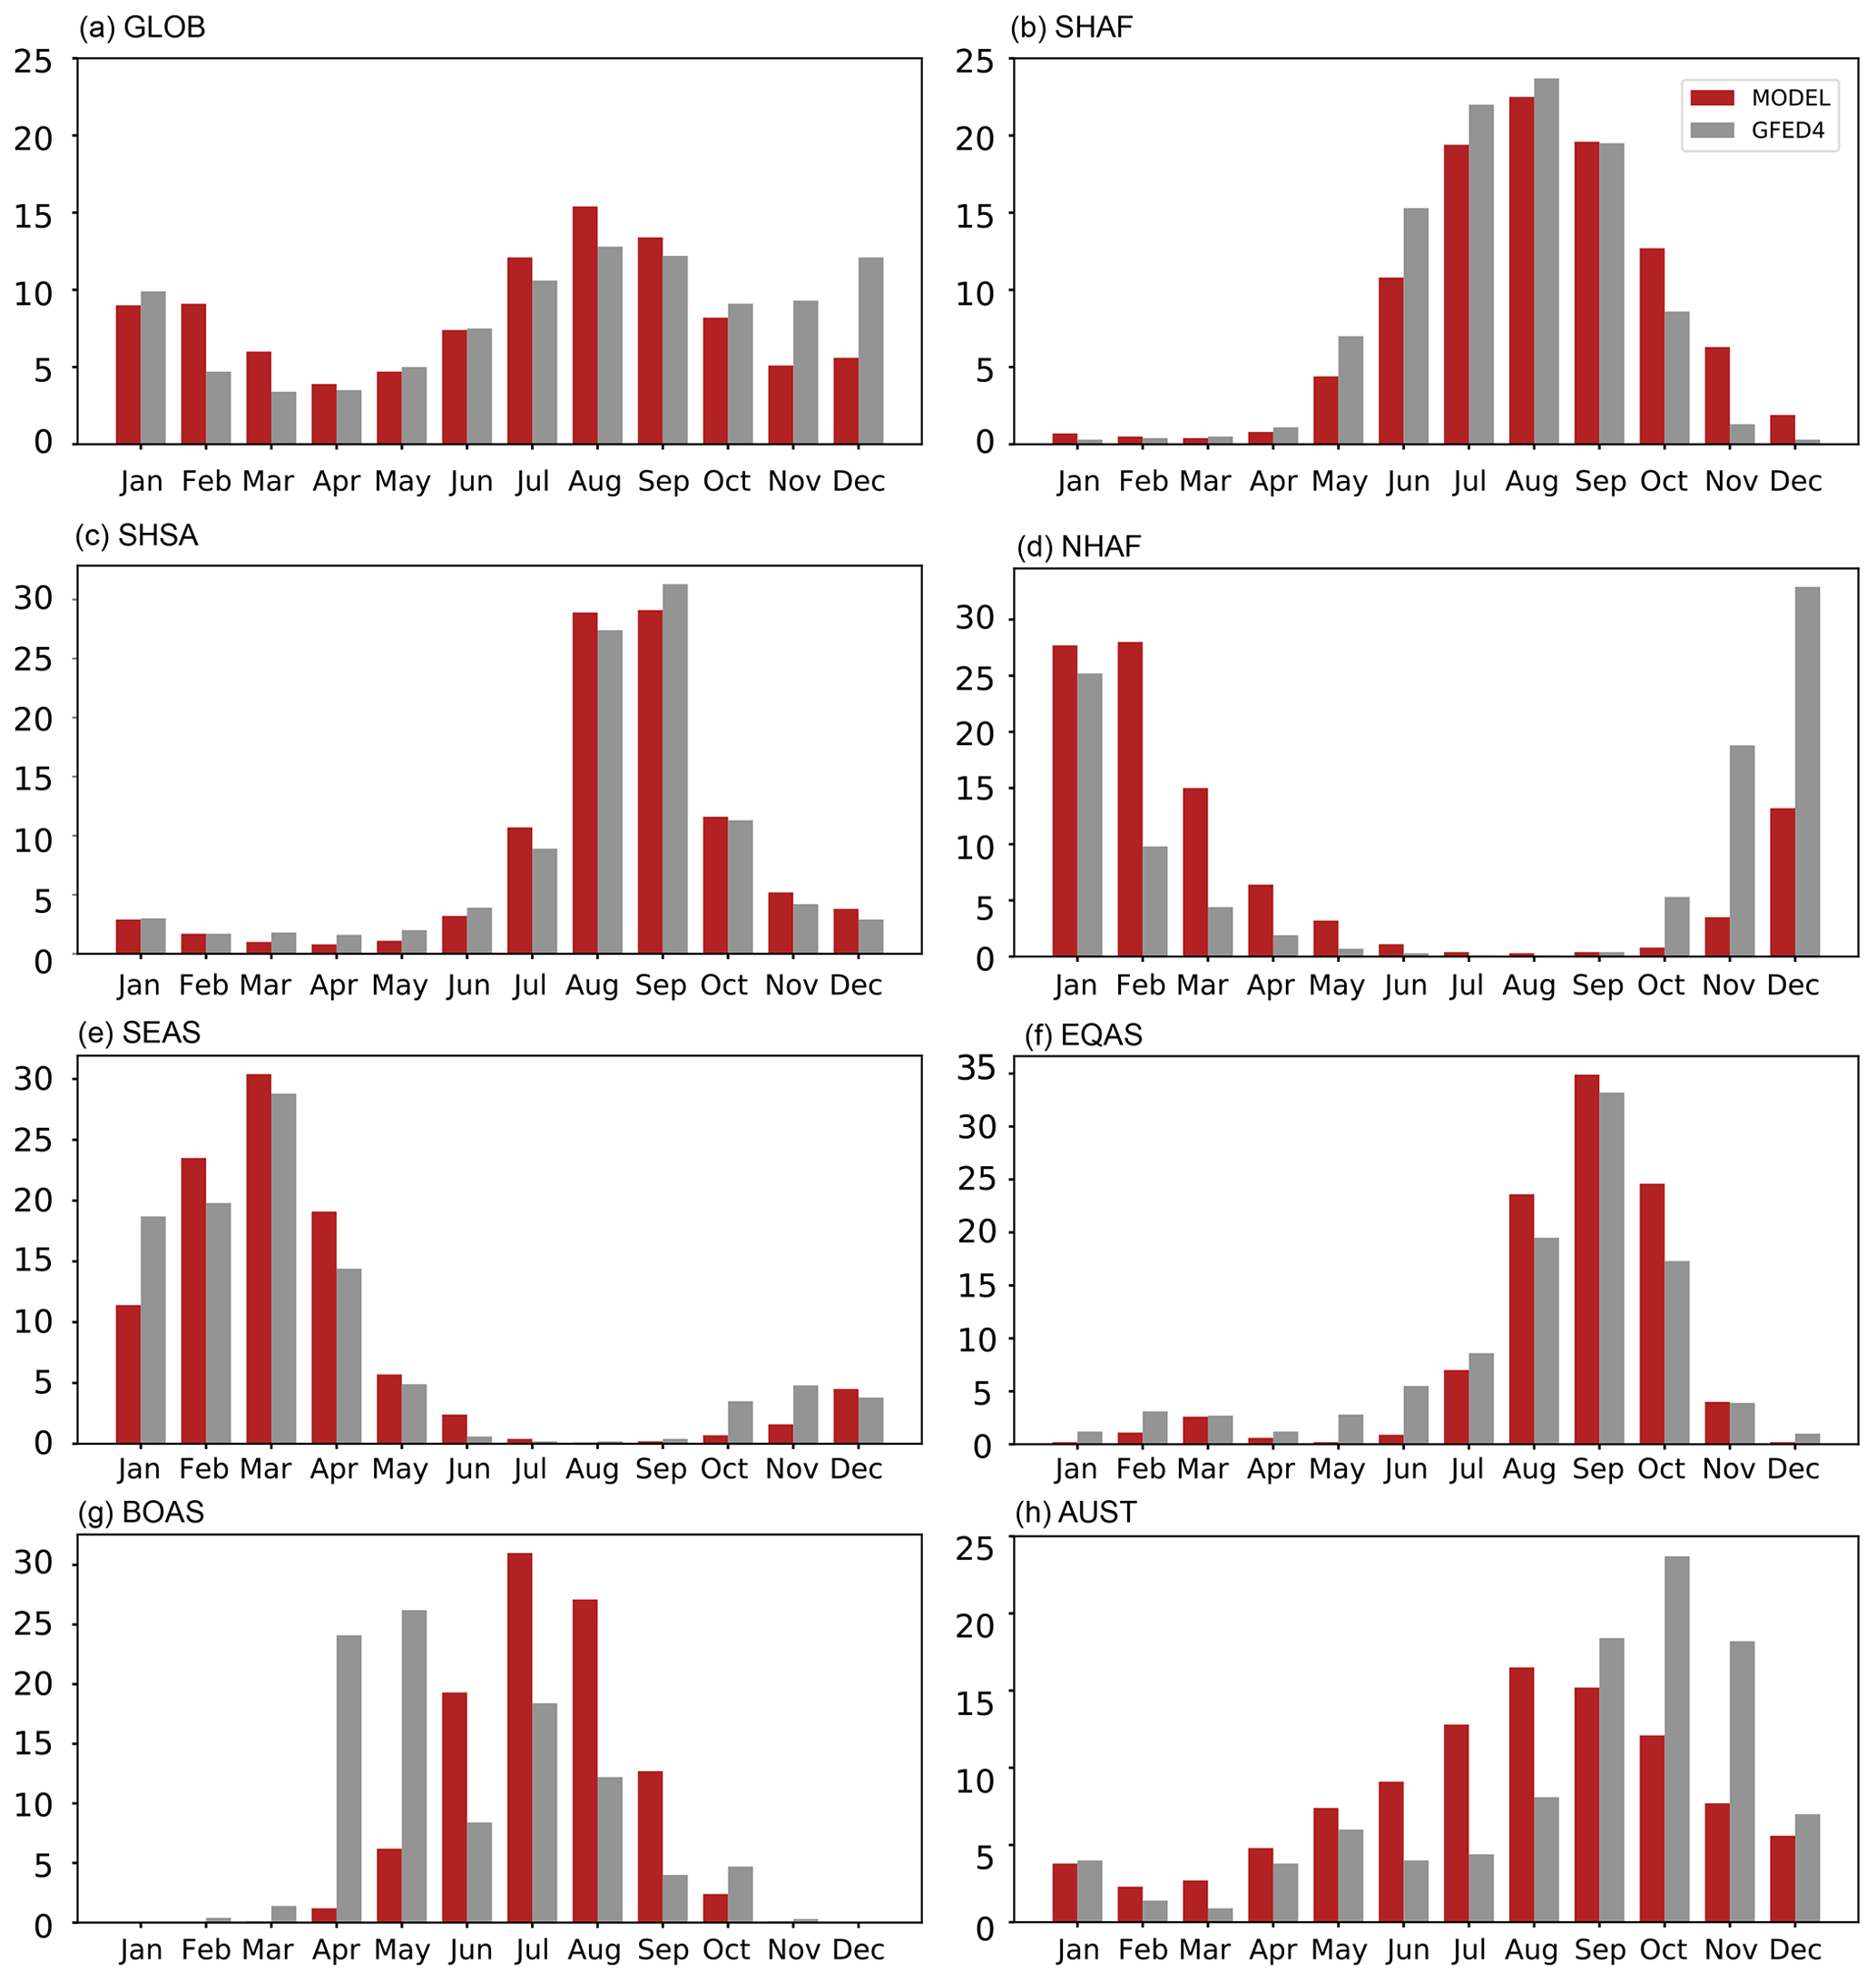
Figure 6The contribution of monthly burned area to annual burned area (%) over the (a) GLOB, (b) SHAF, (c) SHSA, (d) NHAF, (e) SEAS, (f) EQAS, (g) BOAS, and (h) AUST averaged over 2000–2014 for SSiB4/TRIFFID-Fire and GFED4s
Figure 5 shows, however, that the fire seasonality in Northern Hemisphere Africa, the western part of Boreal Asia, eastern China, western Australia, and the central eastern US needs to be improved. The simulated fire season in West Africa is December–March (Fig. 6d), slightly shifted from the fire season in GFED4s (November–February), which contributes to the lower fire peak in December in the global burned area. The recent FireMIP models also show a 2-month delay in peak fire month in the Northern Hemisphere tropics (Hantson et al., 2020), which might be related to the representation of seasonality in vegetation production and fuel build up. In BOAS, the first fire season occurs in April and May. The observed fire season is not captured in SSiB4/TRIFFID-Fire as the model underestimates the burned area in western Siberia due to too wet moisture conditions that come from the high precipitation and specific humidity in the forcing data. A similar scenario is found in western Australia (Fig. 6h). Meanwhile, the absence of crop fire in SSiB4/TRIFFID-Fire also contributes to the low temporal correlation with the observations in agricultural areas, such as the central eastern US and eastern China, where fires are used to clear the crop residues (Xia et al., 2013; van der Werf et al., 2017).
Overall, SSiB4/TRIFFID shows good consistency in the simulation of peak fire month and fire season duration in most regions, probably related to the better representation of vegetation–fire interactions in SSiB4/TRIFFID-Fire, which updates fire effects on vegetation dynamics every 10 d. The inaccurate simulation of fire season in several fire regions could come from deficiency of the forcing data, the inaccuracy in dynamic vegetation processes, or some processes that control the fire but are not represented in the model. More comprehensive observational data are needed to improve the simulation in these areas.
4.2 Fire emissions
Biomass burning emissions are determined by burned area, fuel combustion rate per unit area, and emission factors per unit mass of fuel burned (van der Werf et al., 2017). The carbon emission in SSiB4/TRIFFID-Fire is 2.19 Pg yr−1, higher than the estimate from GFED4s (2.07 Pg yr−1) (Fig. 7). SSiB4/TRIFFID-Fire captures the high carbon emissions in tropical savannas, the intermediate emissions in Northern Hemisphere boreal forests, and the low emissions in humid forests and deserts with a spatial correlation of 0.72, higher than the simulation in Li et al. (2013) (0.61 compared with the GFED3). In general, the spatial distribution of carbon emissions coincides with that of the burned area: SHAF, NHAF, and SHSA are the major fire emission regions and they contribute to 65.4 % of the total emission in both GFED4s and SSiB4/TRIFFID-Fire (Fig. 8a). The exception occurs in EQAS, BOAS, and BONA, where the fire emissions contribute to 11.6 % of the global emissions with only 2.5 % of the global burned area there. The regions have large areas of peatland, which contains a thick layer of soil carbon and emits several times more trace gases per unit of biomass combusted than fires in savannas (van der Werf et al., 2010). As our model does not include the peat soil type, fire emissions are underestimated in these regions.
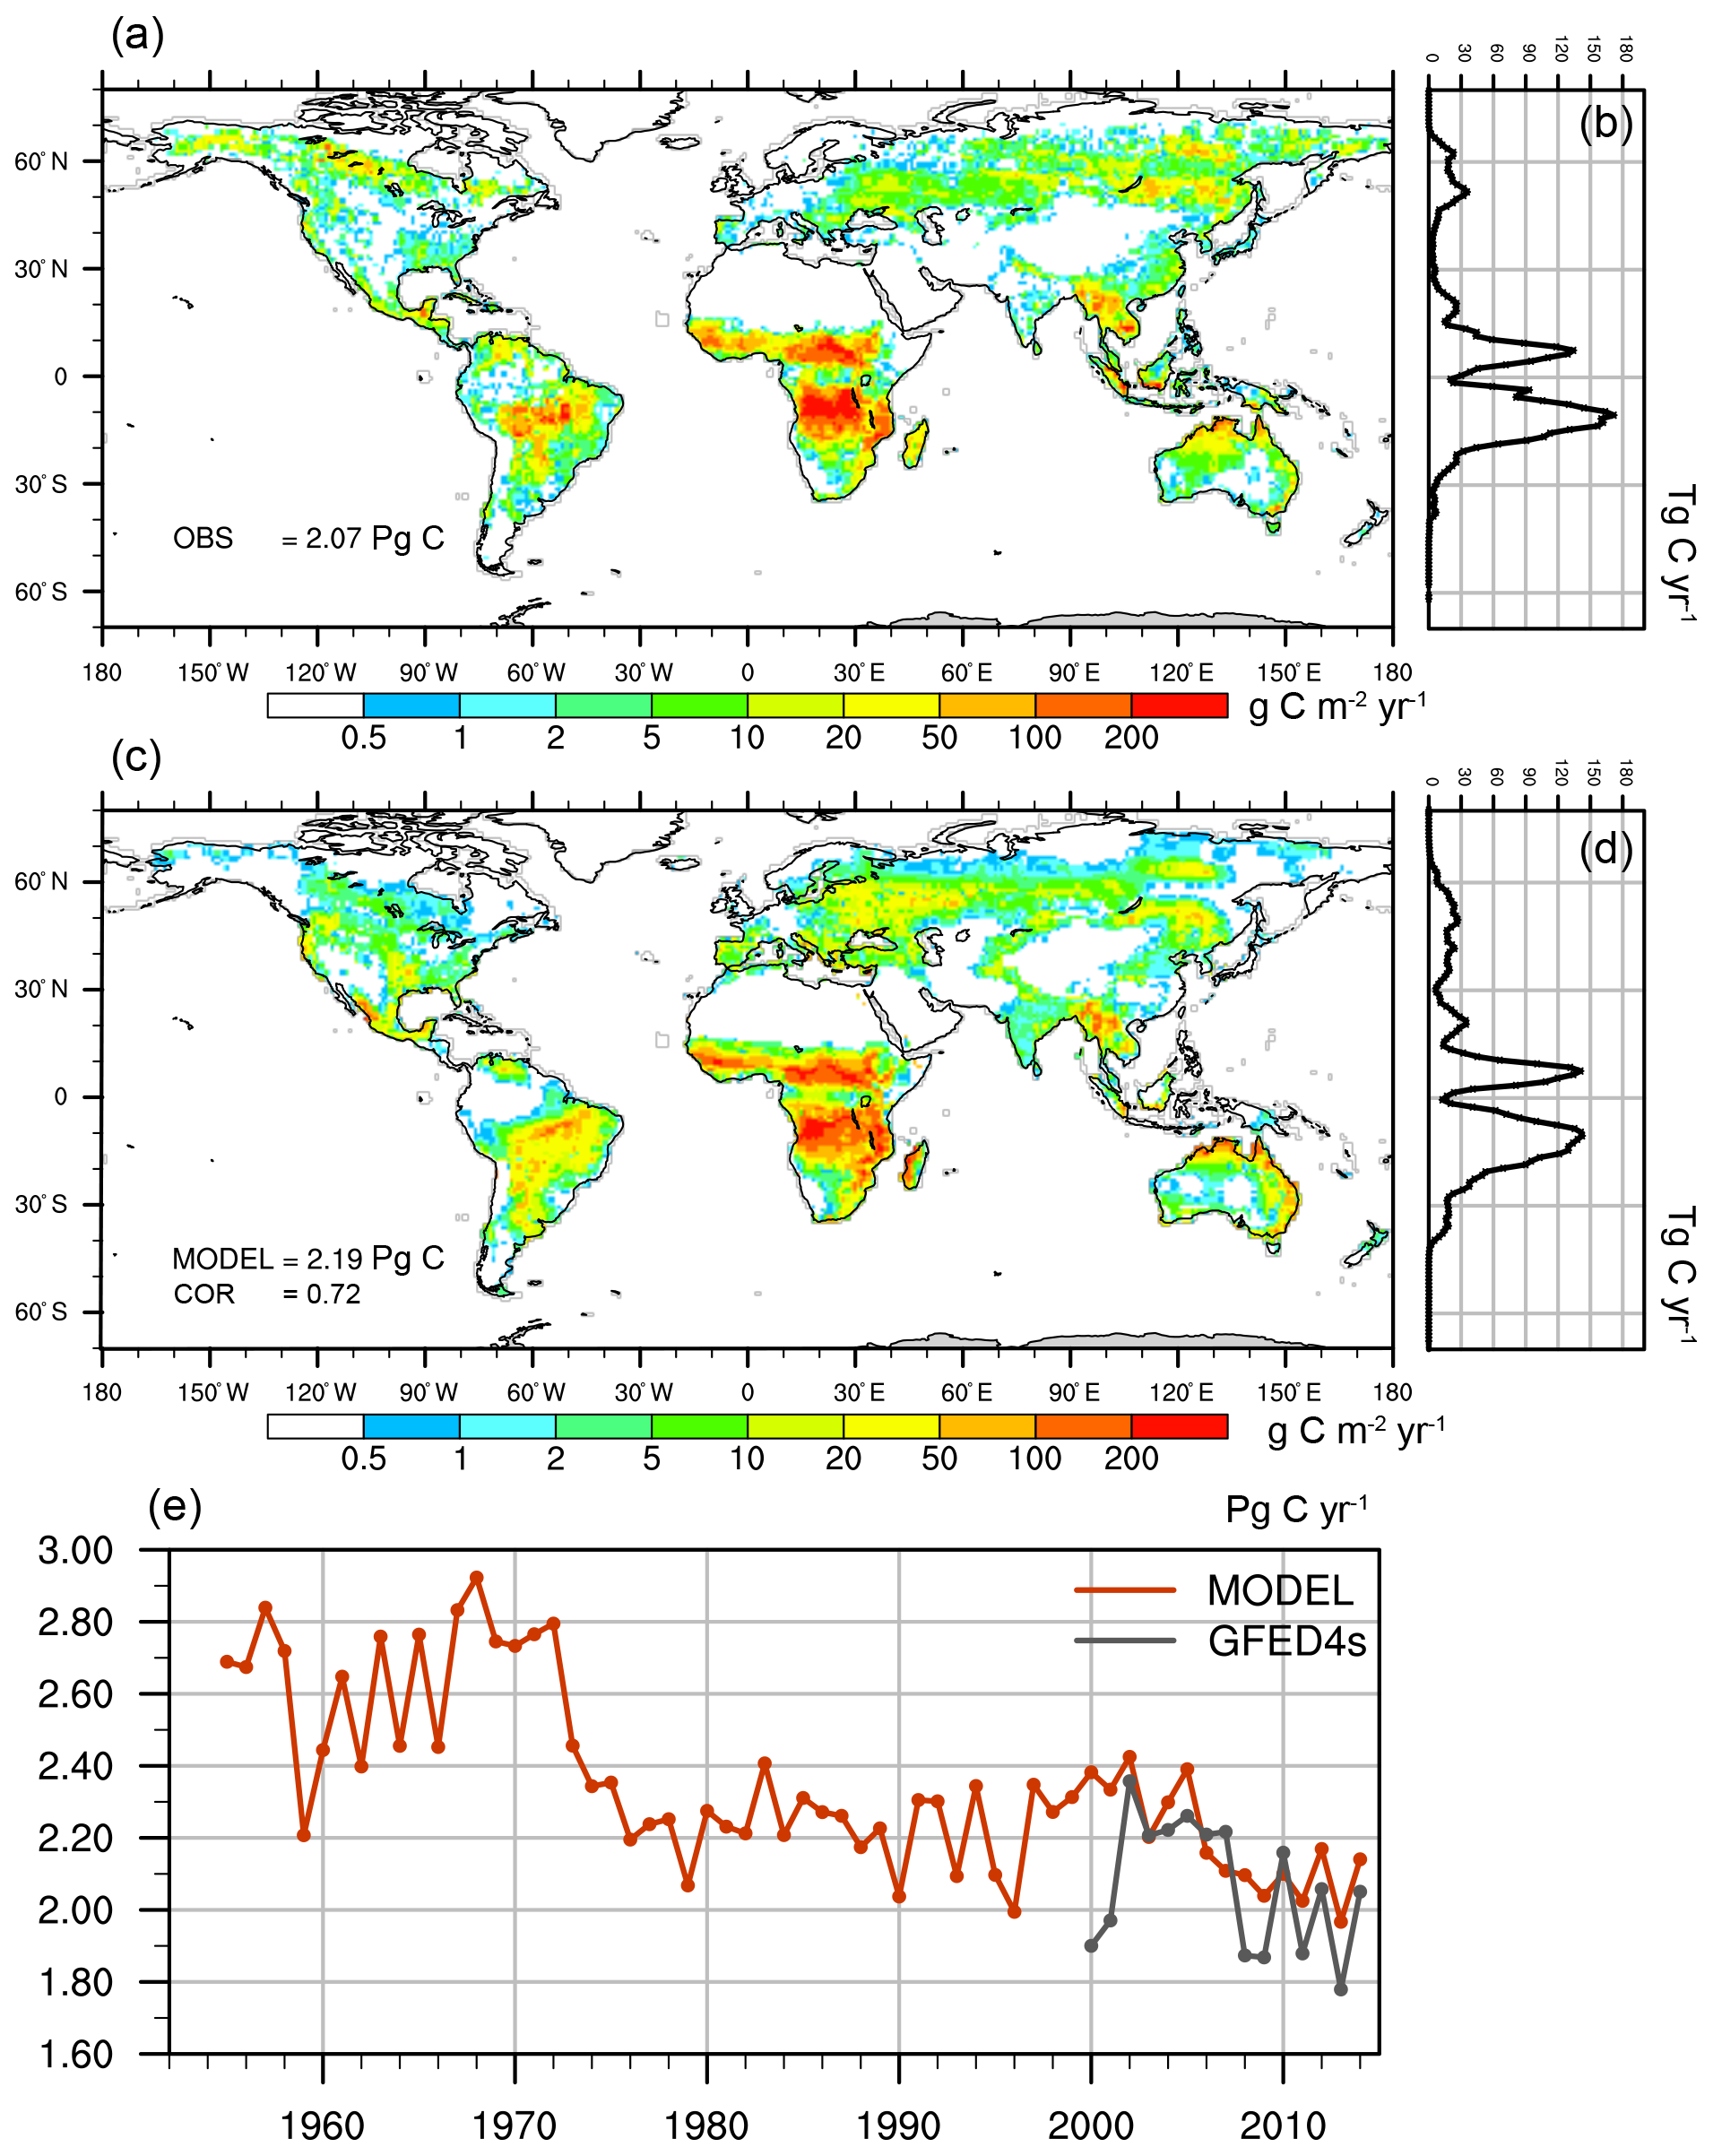
Figure 7(a) Spatial distribution of annual carbon emission (g C yr−1) averaged over 2000–2014 for GFED4s and (b) the latitudinal distribution of carbon emission (Tg C yr−1). Panels (c, d) are the same as (a, b) but for SSiB4/TRIFFID-Fire (g C yr−1). (e) Annual carbon emission (Pg C yr−1) for GFED4s for 2000–2014 and for SSiB4/TRIFFID-Fire for 1948–2014.
The interannual variability (IAV) of fire emissions is captured in SSiB4/TRIFFID-Fire in 7 out of 14 fire regions with a significance level p<0.05 (Fig. S2). Both model and observations have shown a decrease in carbon emissions in NHAF (Fig. 8b), which contributes to the decrease in global fire emission in 2000–2014 (Fig. 7e). SSiB4/TRFFID-Fire suggests that the decline of global fire emissions starts in the 1950s, which is also found in some of the FireMIP models (Li et al., 2019). Similar to our conclusions in the IAV of burned areas, the IAV of carbon emissions in SHSA is small and is not well represented in the model (Fig. 8c).
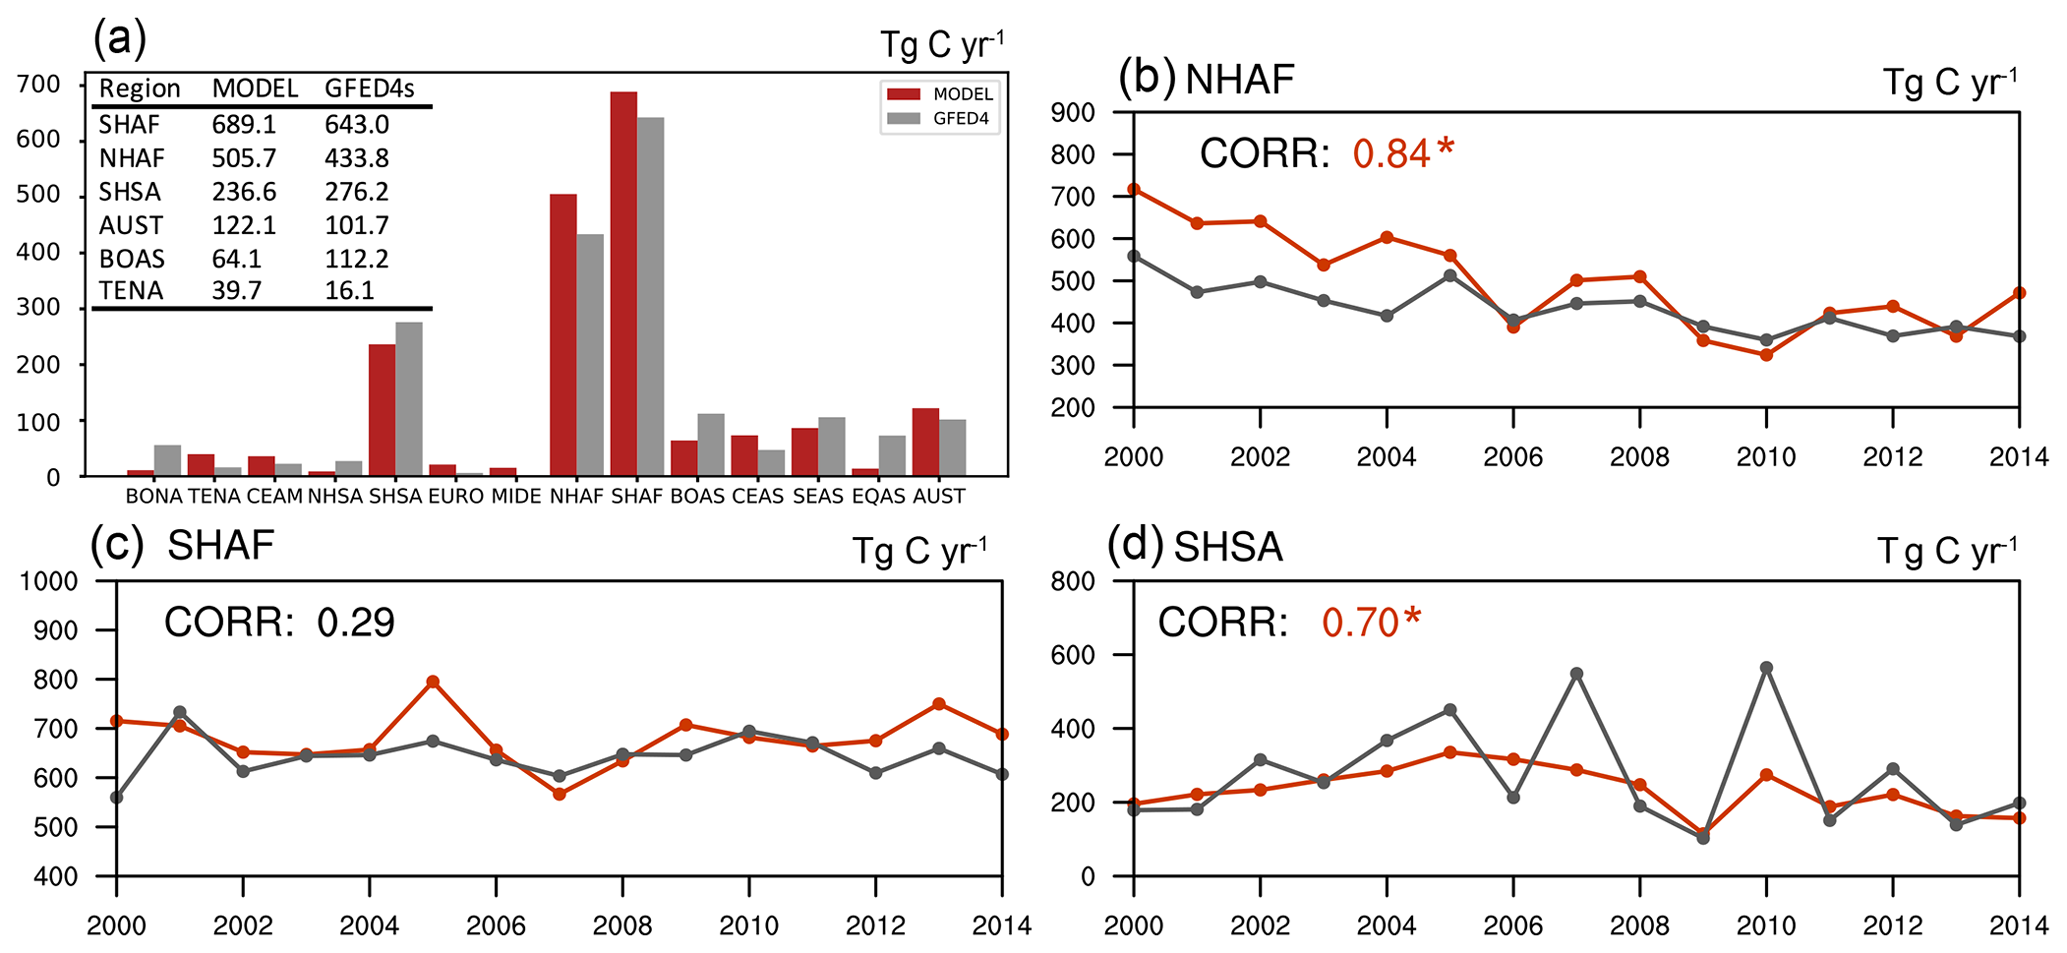
Figure 8(a) Annual carbon emission averaged over 2000–2014 for GFED4s and SSiB4/TRIFFID-Fire in 14 GFED regions. (b–d) Annual carbon emission in (b) SHAF, (c) NHAF, and (d) SHSA for 2000–2014 for GFED4s and SSiB4/TRIFFID-Fire. The “*” and red color indicate the correlation is significant at p<0.05.
The CO emission from fire is one of the key variables in fire modeling, as CO plays a vital role in atmospheric chemistry. The simulated global CO emission is 433.7 Tg yr−1 in 2000–2014, very close to the observational estimates (434.0 Tg yr−1) from Zheng et al. (2019) with a spatial correlation of 0.74. The inversion-based and simulated monthly CO emissions in Africa are compared in Fig. 9. We find the annual cycle of CO emission in SHAF is well captured in SSiB4/TRIFFID-Fire, which shows the largest CO emission occur in JJAS and the regions with high emissions (Fig. 9b) are coincident with those in observations (Fig. 9a). In NHAF, SSiB4/TRIFFID-Fire reproduces the large CO emission in DJF, although the model slightly underestimates CO emission in December and overestimates it in February. The seasonality of CO emission broadly follows that of burned area, which further demonstrates that our model has shown promising results in seasonal fire simulations.
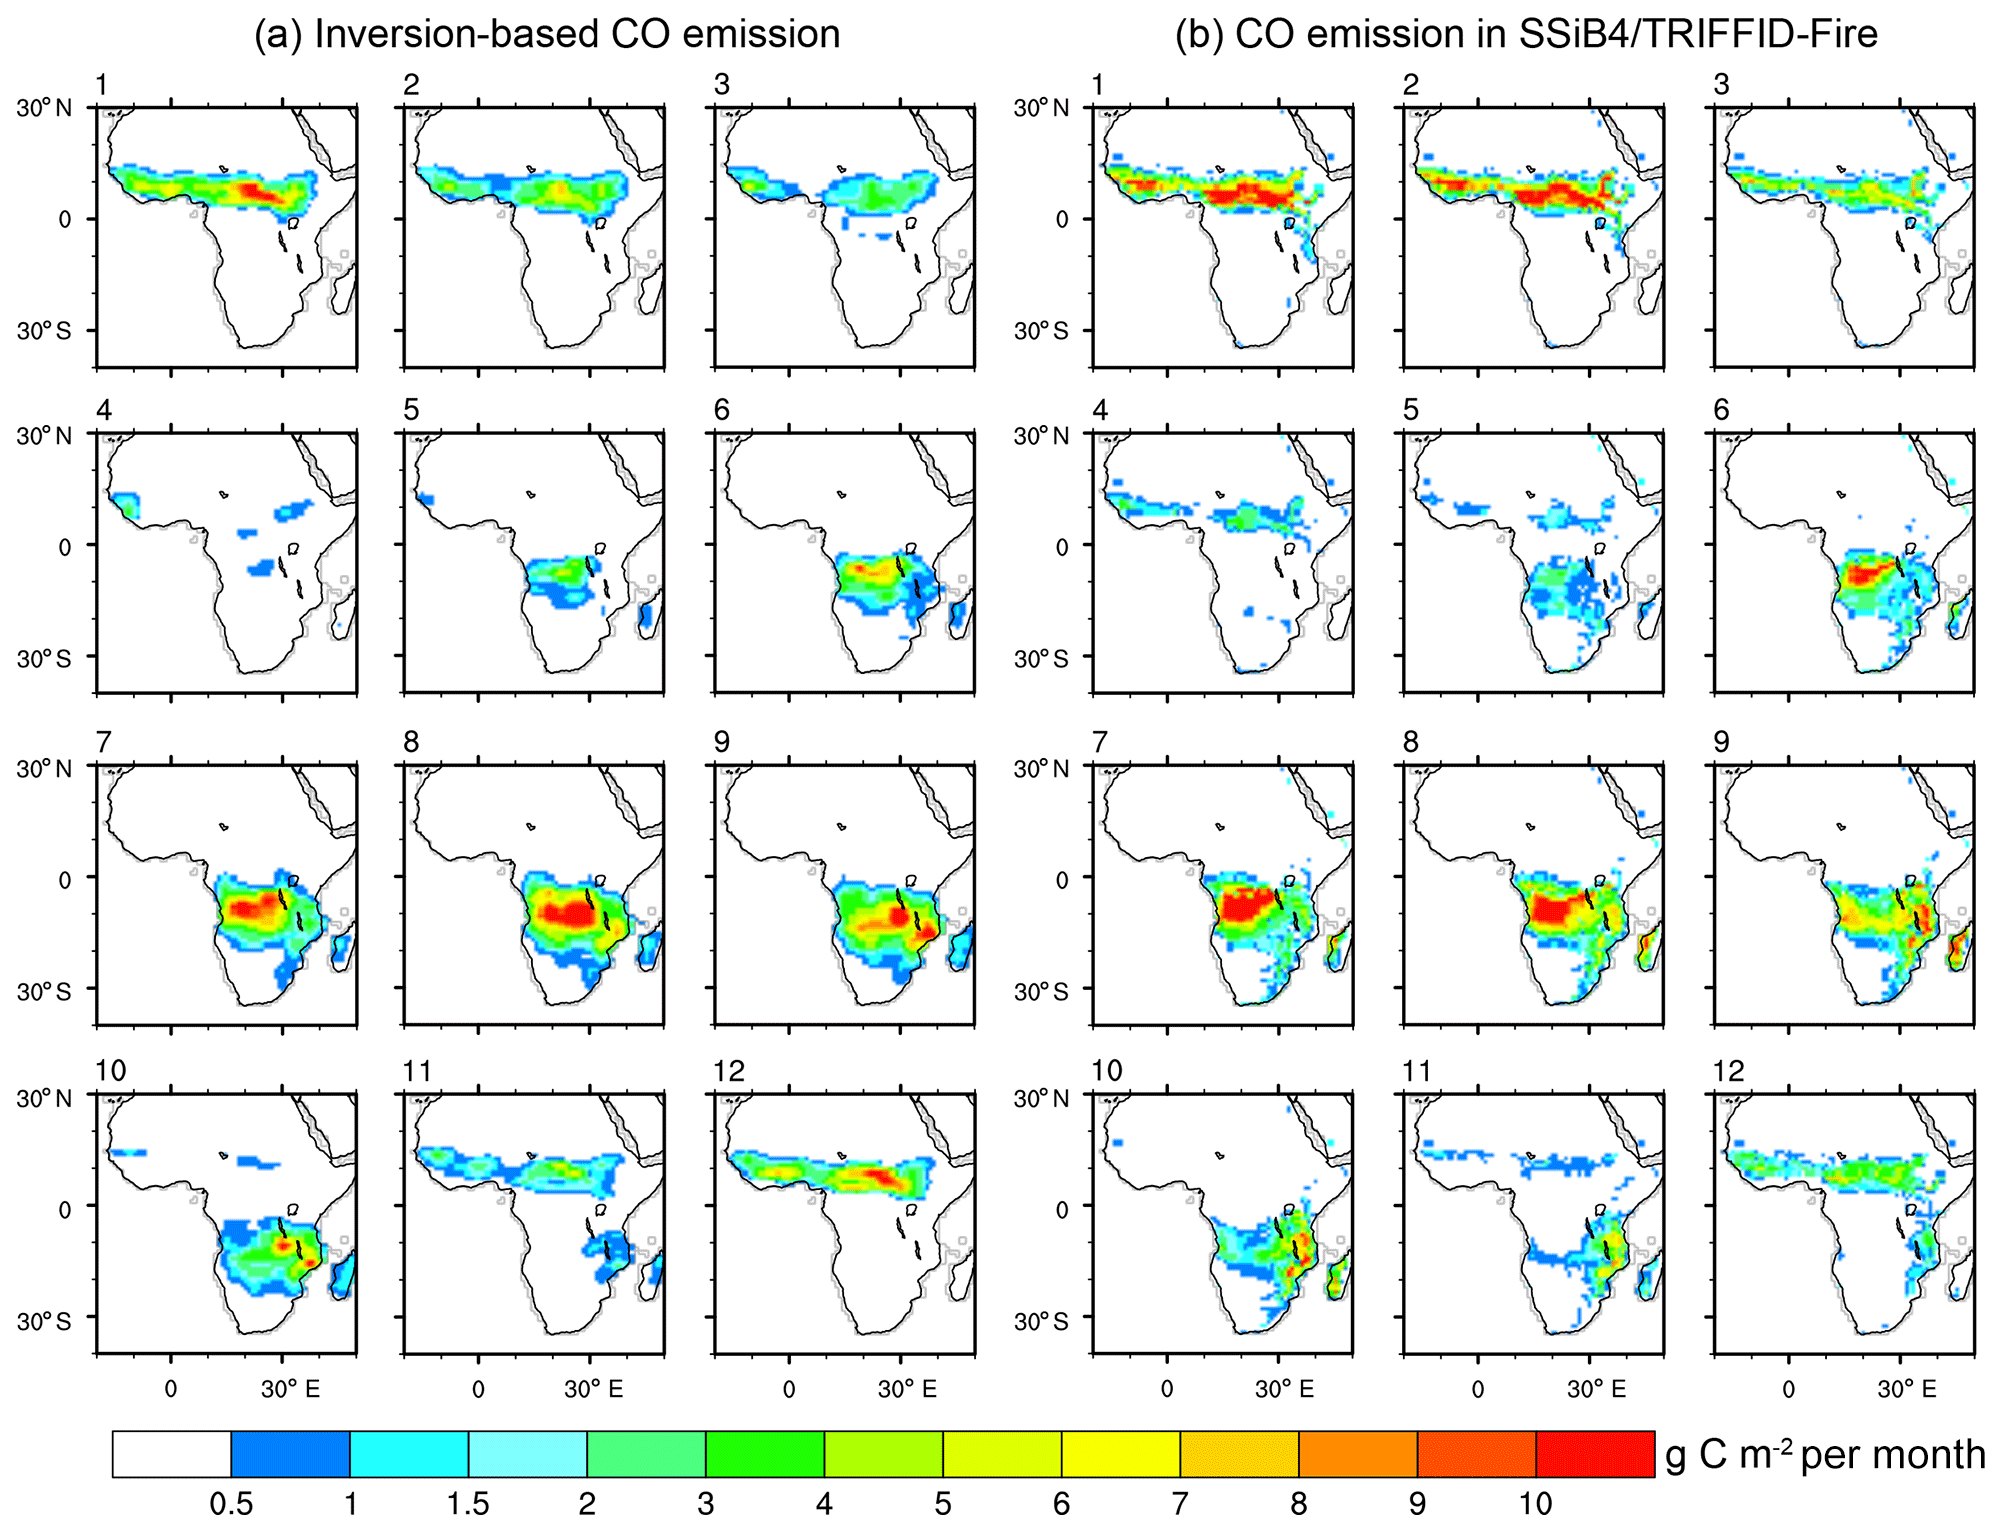
Figure 9Monthly CO emission in Africa averaged in 2000–2014 from (a) Zheng et al. (2019) and (b) SSiB4/TRIFFID-Fire.
4.3 PFT distribution and GPP
The simulation of vegetation coverage, which represents model description of biomass allocation and influences the fuel availability and flammability in fire modeling, is evaluated against GLC2000 (Bartholome and Belward, 2005). As the dynamic vegetation model only includes natural PFTs, the simulated PFT fraction in one grid box is scaled using the non-agriculture fraction from GLC2000. Overall, the vegetated areas cover 80.6 % of global land areas, very close to the estimates from GLC2000 (80.8 %). The simulated tree cover is 34.1 %, higher than 29.8 % in GLC2000. Compared with the observations (Fig. 10a), SSiB4/TRIFFID-Fire captures the fractional coverage of trees in the Amazon rainforest, tropical Africa, equatorial Asia, Southeast Asia, southeastern North America, and the Northern Hemisphere Boreal regions (Fig. 10c). The BET is concentrated in the tropics, and the NET is mostly found in the North America and Eurasia Boreal zones (Fig. S3a–c). The C3 and C4 grasses are found in the Northern Hemisphere Africa, Southern Africa, South America, the central US, Eurasian steppes, and eastern Australia (Fig. 10b and d). The simulated C3 and C4 fractions are 11.1 % and 7.5 %, respectively, similar to the estimates in GLC2000 (11.9 % for C3 and 7.9 % for C4; Liu et al. 2019). Shrubs are primarily located in the semiarid regions and the pan-Arctic area and tundra is limited to the pan-Arctic area and Tibetan Plateau (Fig. S3f–g). SSiB4/TRIFFID-Fire is shown to capture some key processes of fire–vegetation interactions under the current climate, which is important to study fire effects on the ecosystem.
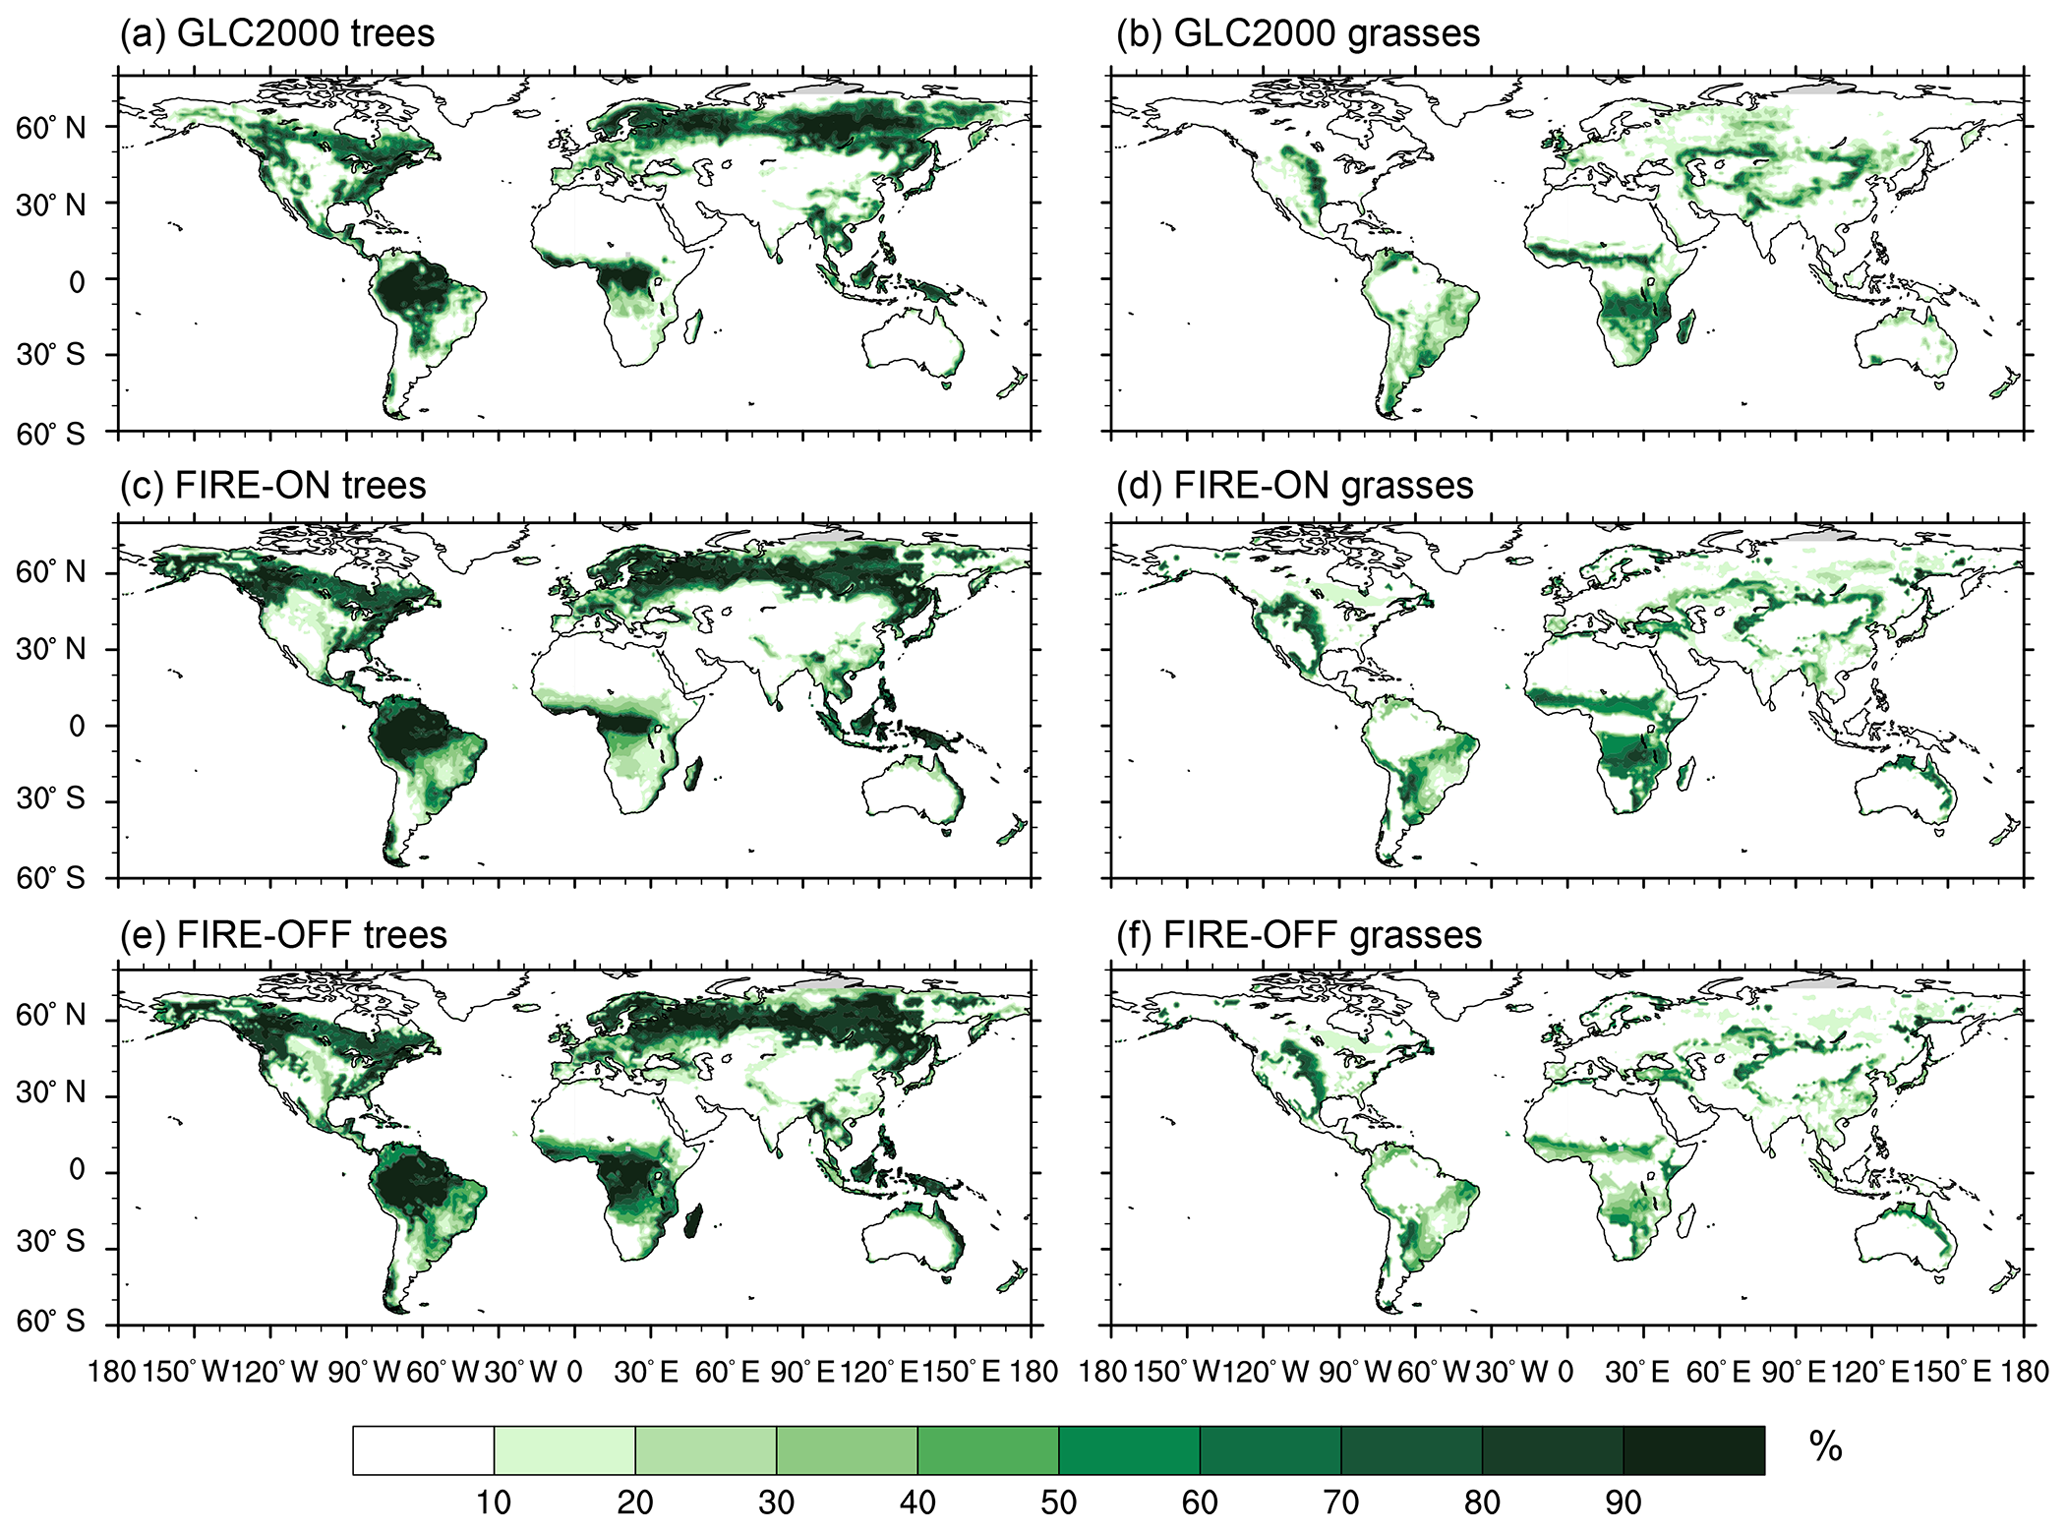
Figure 10The fractional coverage of trees in (a) GLC2000, (c) FIRE-ON, and (e) FIRE-OFF and the fractional coverage of grasses in (b) GLC2000, (d) FIRE-ON, and (f) FIRE-OFF in 2000.
We also compare the simulated GPP averaged over 1982–2011 to FLUXNET-MTE GPP (Jung et al., 2011) to examine the modeled impact of fire on carbon. SSiB4/TRIFFID-Fire captures the distribution of global GPP with a spatial correlation of 0.93 (p<0.05) (Fig. S4). The highest GPP occurs in the tropical evergreen forest and decreases with latitude in both observations and model. However, the simulated GPP has a negative bias in the Amazon tropical forest and a positive bias in tropical Africa and boreal regions. The simulated global GPP is 141 Pg C yr−1, higher than the FLUXNET-MTE estimate (119 Pg C yr−1; Jung et al., 2011), but is within the range of simulated GPP in current DGVMs (111–151 Pg C yr−1; Piao et al., 2013). In addition, the correlation of IAV of global GPP is 0.68 (p<0.05) between SSiB4/TRIFFID-Fire and FLUXNET-MTE, indicating that the model has reasonably captured the terrestrial ecosystem variability during the historical period.
4.4 Fire effects on ecosystem characteristics and surface properties
In this section, we investigate long-term fire effects on ecosystem characteristics, surface properties, and surface energy budget using the differences between FIRE-ON and FIRE-OFF (FIRE-ON minus FIRE-OFF). In SSiB4/TRIFFID-Fire, fire is found to cause a strong decrease in tree fraction by 12.6 % (about 4.5 % of the land surface). Meanwhile, the fractional coverage of grass and bare land is increased on 3.4 % and 0.5 % of the land surface, respectively (Fig. 11a–b). The tree cover reduction is concentrated in southern Africa, northern Africa, and South America, which are dominated by C4 savanna in FIRE-ON (Fig. S3), suggesting that fire is an important determinant of structure and functions of the savanna; otherwise it would be encroached by trees. The magnitude of change simulated is generally consistent with the results from long-term fire experiments in Kruger National Park, South Africa, which showed that fire reduced woody cover by 30 %–50 % (Smit et al., 2010). The changes in the fractional coverage of trees and grass are associated with tree mortality after fire and the fast regrowth of grass PFTs with space and nutrient availability during the post-fire recovery season. Across the globe, fire is simulated to reduce LAI by 3.6 % (0.10 m2 m−2) and shorten vegetation height by 12.7 % (1.24 m).
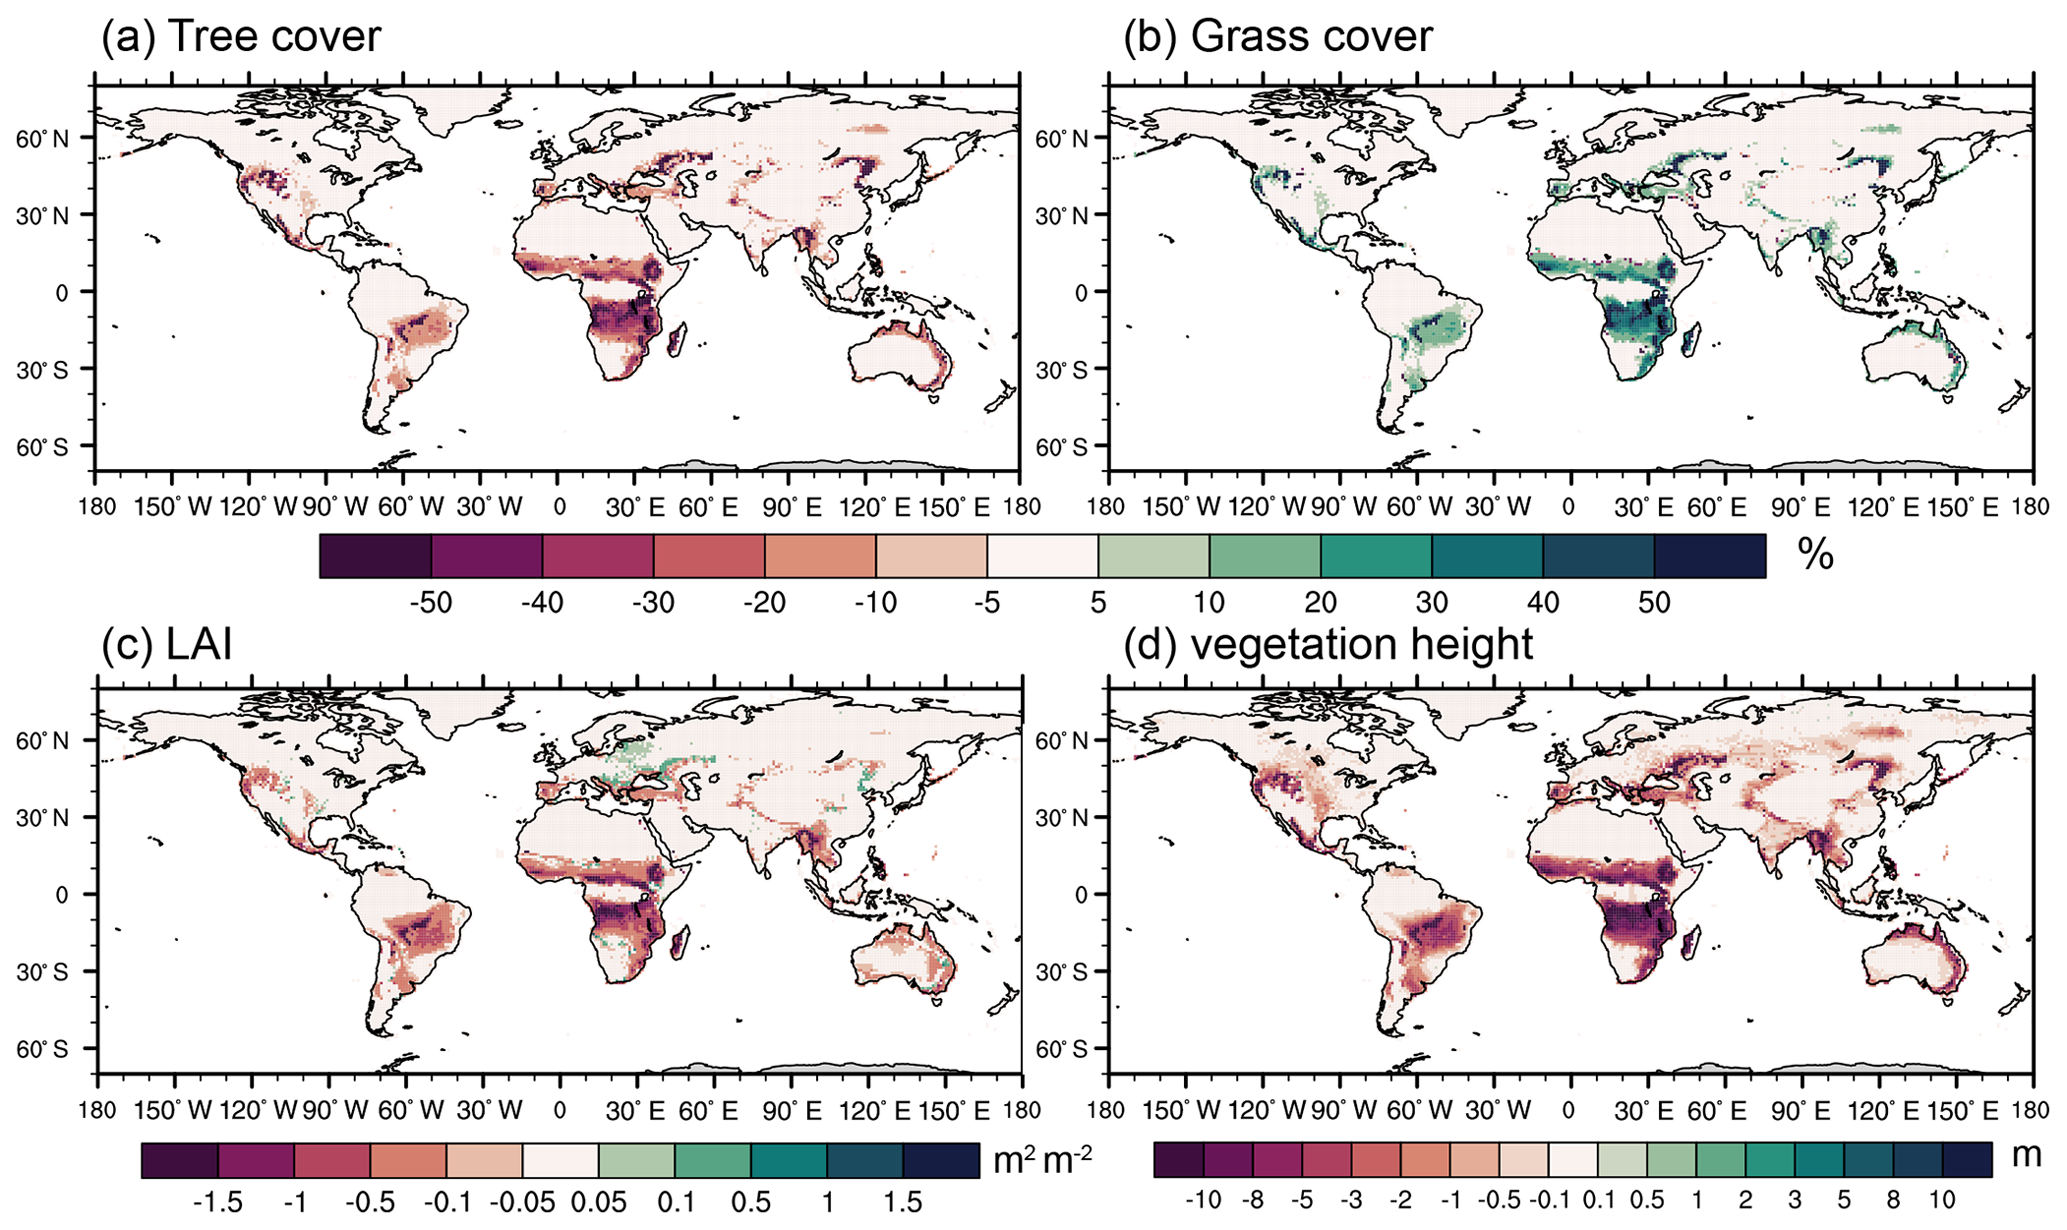
Figure 11Differences in (a) tree cover (BET, NET, and BDT; %) (b) grass cover (C3 and C4; %), (c) LAI (m2 m−2), and (d) vegetation height (m) in SSiB4/TRIFFID-Fire averaged over 2000–2014 between FIRE-ON and FIRE-OFF.
In Africa, the simulated fire effects on vegetation structure (tree and grass cover, LAI, and vegetation height) peak in the tropical savanna surrounding the forests and gradually decrease towards the deserts (Fig. 11). When the fire model is turned off, the tree cover expands in the wetter savanna around the tropical African forest where the climate (mainly rainfall in the model) allows for more trees to approach canopy closure such that grasses can be effectively excluded (Fig. 10e). The grass cover shrinks to the southern and northern part of the southern and northern African savanna, respectively (Fig. 10f), where tree populations are constrained by environmental conditions.
Our results are consistent with the long-term fire experiments that reported that fire strongly affected vegetation structure, lowering the proportions of trees to fire-resistant grasses and reducing the vegetation height and aboveground biomass (Shackleton and Scholes, 2000; Higgins et al., 2007; van Wilgen et al., 2007; Furley et al., 2008; Smit et al., 2010; Devine et al., 2015), and that fire impact is more significant in wetter savanna than in drier savanna (Moreira, 2000; Sankaran et al., 2005). However, the long-term fire experiments were only conducted in very limited regions and mostly focused on site-level fire impact (Furley et al., 2008). The assessment of continental and global fire impact on vegetation and carbon can only be achieved by fire-coupled DGVMs. After appropriate validation of fire effects on the local scale, SSiB4/TRIFFID-Fire can be used as an effective tool to describe the climate potential of the ecosystem without fire disturbance and to quantify fire impact on the global scale.
The changes in vegetation structure modify the albedo, aerodynamic resistance, and evapotranspiration processes, which further influences surface radiation and energy partitioning between latent heat and sensible heat fluxes. In this study, we investigate seasonal fire impact by distinguishing between fire season (DJF for NHAF and JJA for SHAF and SHSA) and post-fire rainy season (JJA for NHAF and DJF for SHAF and SHSA) for major fire regions. Because grass PFTs have a higher albedo than tree PFTs, the replacement of trees by grasses and savannas (Fig. 11a–b) has caused an increase in grid-average albedo, which decreases the net radiation absorbed by the surface (Fig. 12a–b). The reduction in surface radiation is larger in fire season (DJF for NHAF and JJA for SHAF and SHSA) as the exposure of bare land after fire further enhances the albedo. The reduction in vegetation height between FIRE-ON and FIRE-OFF (Fig. 11d) has significantly decreased the roughness length and increased the aerodynamic resistance (Liu et al., 2016), which causes a reduction of sensible heat flux by 4–8 W m−2 (Fig. 12c–d). Our results are in agreement with the observational studies on different fire types (e.g., forest fire and savanna fire) showing that surface properties changes after fire results in an increase in albedo (Gholz and Clark, 2002; Amiro et al., 2006b; Sun et al., 2010) and a decrease in sensible heat (Chambers and Chapin, 2002; Liu et al., 2005; Amiro et al., 2006a, b; Rogers et al., 2013).
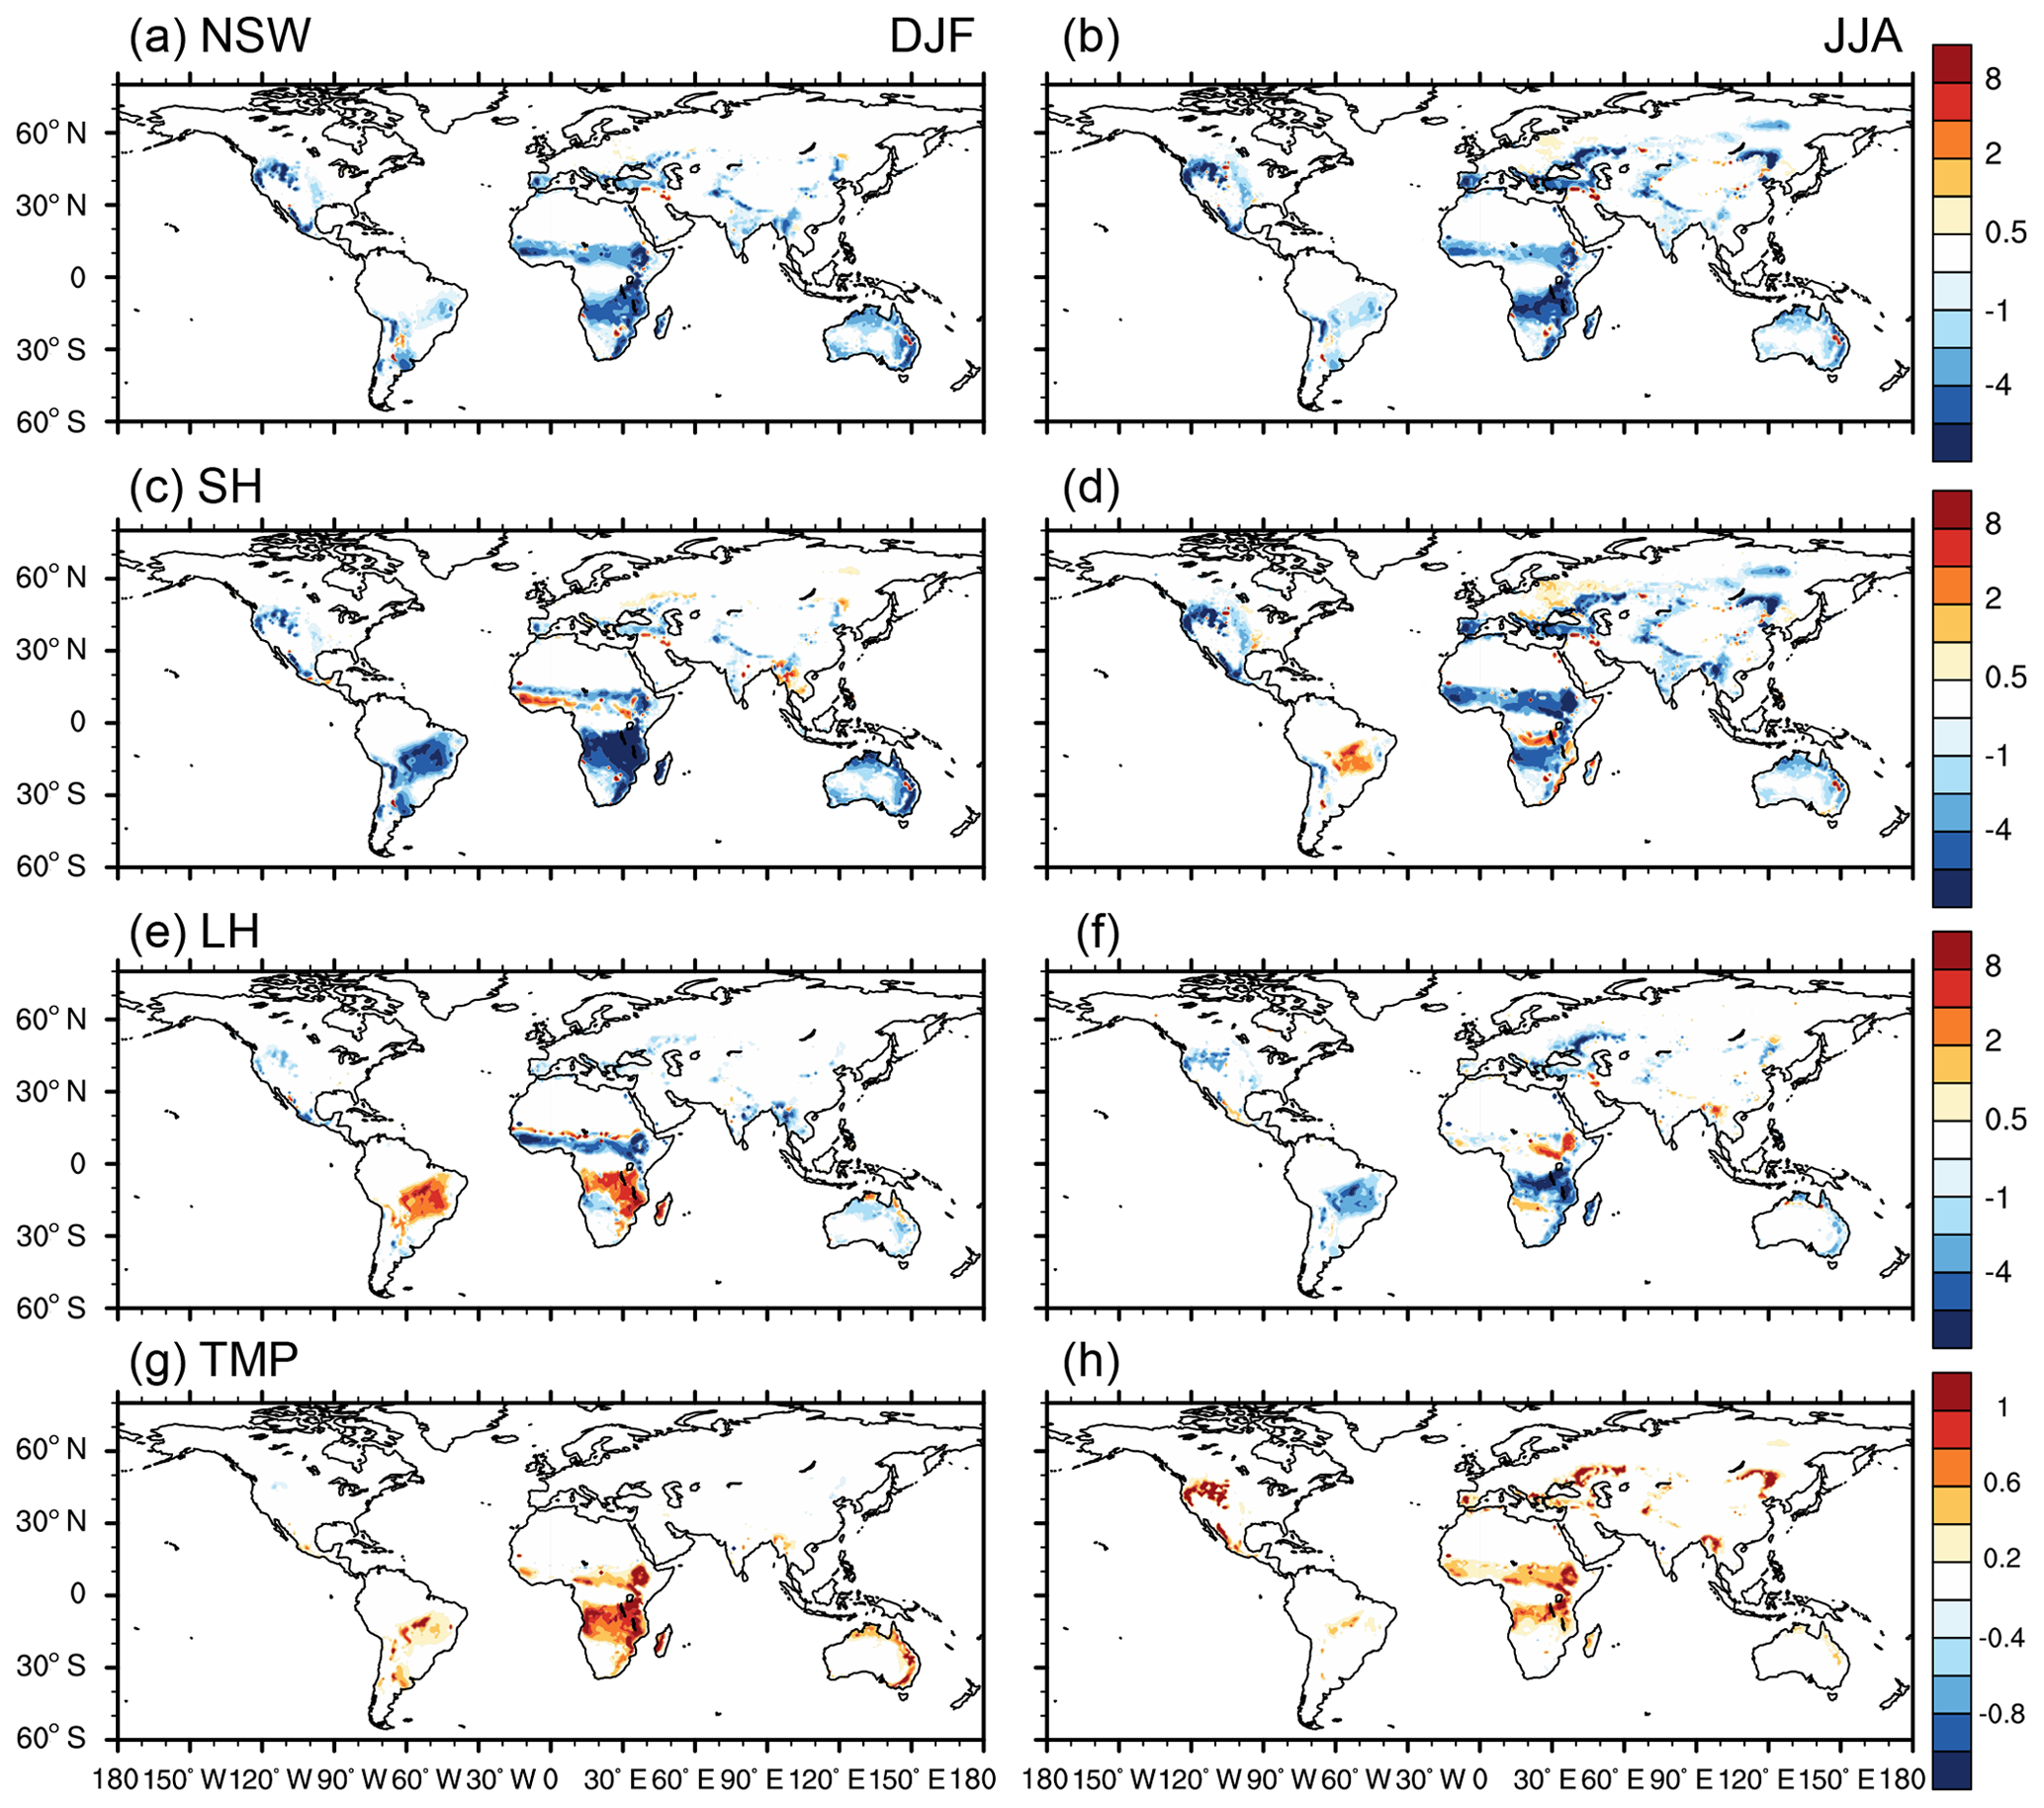
Figure 12Differences in net shortwave (a, b; W m−2), sensible heat (c, d; W m−2), latent heat (e, f; W m−2), and surface temperature (g, h; K) in DJF (a, c, e, g) and JJA (b, d, f, h) averaged over 2000–2014 between FIRE-ON and FIRE-OFF.
The change of latent heat flux varies with seasons in tropical savanna. It is reduced in the fire season and enhanced in the rainy season for each fire region (Fig. 12e–f). In SSiB4, the grid-average latent heat flux consists of canopy evapotranspiration, canopy interception, and soil evaporation, among which canopy interception normally plays a minor role. During the local fire season, the canopy transpiration is decreased (Fig. S5a–b) due to fire-induced vegetation canopy loss. The soil evaporation does not change too much as there is not much surface water to evaporate (Fig. S5c–d). Therefore, the grid-average latent heat is decreased. During the post-fire rainy season, the canopy transpiration is still reduced as the vegetation has not recovered from the fire. However, the exposure of bare soil has produced more soil evaporation. Therefore, the latent heat can be increased due to enhanced soil evaporation. The significant increase in soil evaporation and latent heat during the wet season has been widely observed after vegetation removal, especially when the soil is saturated (Langford, 1976; Dunin, 1987; Gholz and Clark, 2002; Santos et al., 2003; Amiro et al., 2006b). The increase is proposed to be caused by the exposure of moist soil surface, the increase in surface energy that can be used for evaporation, and the smaller surface resistance when dense plant canopy is removed by fire (Schulze et al., 1994). Despite the reduction in surface radiation, the decreased surface fluxes associated with aerodynamic and surface resistance changes have resulted in an increase in surface temperature throughout the year (Fig. 12g–h).
Our estimate of fire effects on radiation, surface fluxes, and temperature are qualitatively consistent with Li et al. (2017) but different in the partitioning between sensible heat and latent heat changes. The discrepancies might be attributed to the changes in vegetation distribution. As the vegetation distribution is prescribed in Li et al. (2017), trees and grass grow taller and denser when the fire model is turned off. In contrast, fire has caused changes in vegetation distribution and conversions of dominant PFTs in SSiB4/TRIFFID-Fire. Tree PFTs are spreading in FIRE-OFF and encroaching the tropical savanna and grassland in southern Africa, northern Africa, and South America shown in FIRE-ON. Over the African and South American savanna, we find fire has reduced the area-averaged LAI and vegetation height by 0.52 m2 m−2 (12.5 %) and 5.76 m (49.1 %), respectively. The larger relative change in vegetation height is simulated as tree PFTs have a greater contrast with grass PFTs in vegetation height than in LAI. Compared with Li et al. (2017), SSiB4/TRIFFID-Fire simulates a greater change in vegetation height but a smaller change in LAI, which probably causes the larger sensible heat changes in our results. Other sources of uncertainties include the differences in the partitioning between latent heat and sensible heat fluxes in land surface models, the differences in the parameterization of the evaporation processes, and the changes due to atmospheric feedbacks, such as cloud cover and precipitation changes.
We have implemented a process-based fire model of intermediate complexity into a DGVM, SSiB4/TRIFFID, which is based on the surface water, carbon, and energy balances, as well as the PFT competition. The high-frequency exchanges between the fire model and SSiB4/TRIFFID allow vegetation dynamics and surface parameters, such as albedo and surface roughness length, to be updated every 10 d based on surface carbon balance, which are rarely applied in other fire models. Moreover, the plant production and biomass allocation are reasonably reproduced in SSiB4/TRIFFID-Fire, which have been considered to contribute to the proper burned area simulation (Forkel et al., 2019; Hantson et al., 2020). The SSiB4/TRIFFID-Fire produces similar global burned area, major regional burned areas, and fire carbon emissions compared to GFED4s. The model captures the decreasing trend in burned area related to human suppression and land management and the interannual variability associated with moisture conditions. It reasonably reproduces the global GPP and PFT distribution, which is important to study fire effects on the ecosystem.
Future development of SSiB4/TRIFFID-Fire is in three aspects. First, SSiB4/TRIFFID-Fire does not explicitly represent the occurrence of peat fire, deforestation fire, and agriculture fire. The inclusion of peat fire and deforestation fire may reduce the negative bias in the burned area and carbon emission in EQAS, BOAS, and BONA, and the parameterization of agriculture fire may improve the fire seasonality simulation in the central eastern US and eastern China. Second, the effect of agriculture expansion on fire suppression is not considered in current SSiB4/TRIFFID-Fire as we apply a constant agricultural fraction, which is expected to influence the spatial and temporal variations of burned area beyond GDP and population effects (Andela et al., 2017). Third, the carbon cycle in the current SSiB4/TRIFFID version does not explicitly represent the litter carbon storage and decomposition. Therefore, we assume aboveground litter to be 25 % and 30 % of aboveground biomass for global forest and savanna, respectively, based on observations from Pan et al. (2011) and de Oliveira et al. (2019). The next generation of SSiB couples SSiB/TRIFFID with DayCent-SOM, which describes the full processes of litter accumulation and decomposition constrained by nitrogen availability (Parton et al., 1994). An explicit scheme for litter combustion will be updated in the fire model in the new SSiB/TRIFFID.
The SSiB4/TRIFFID-Fire is then applied to study the long-term fire effects on ecosystem characteristics and surface energy. By comparing the simulations with and without fire, we show that fire has reduced global tree cover by 12.6 % (4.5 % of land surface). Meanwhile, the global LAI and vegetation height are decreased by 0.10 m2 m−2 and 1.24 m, respectively. The surface radiation, sensible heat, and canopy evapotranspiration are decreased, while the soil evaporation is increased, especially during the post-fire rainy season. The change in surface fluxes has caused an increase in surface temperature over most fire regions. As Li et al. (2017) is the only modeling study investigating the long-term fire effects on the land energy budget, our simulation provides another approach that quantifies fire effects using a different land surface model with different approaches in parameterizing some land surface processes and vegetation dynamics. More studies with more land surface models, fire models, and vegetation dynamics are necessary to explore this issue further. A systematic comparison of long-term fire effects in different fire models, such as the current FireMIP project, would allow evaluation of the robustness of model simulations and identification of key uncertainties of fire impacts.
The source code of fire model is archived at https://doi.org/10.5281/zenodo.3872633 (Huang et al., 2020a).
The supplement related to this article is available online at: https://doi.org/10.5194/gmd-13-6029-2020-supplement.
HH, YX, and YL designed the coupling strategy between SSiB4/TRIFFID and the fire model. HH conducted the simulation with suggestions from FL and YL. HH drafted the text and made the figures. All authors (HH, YX, FL, and YL) have contributed to the analysis methods and to the text.
The authors declare that they have no conflict of interest.
The authors acknowledge the use of the Cheyenne supercomputer (https://doi.org/10.5065/D6RX99HX, Computational and Information Systems Laboratory, 2019), provided by NCAR CISL, for providing HPC resources. Fang Li acknowledges support from the National Key R&D Program of China (2017YFA0604302 and 2017YFA0604804).
This research has been supported by the National Science Foundation, Division of Atmospheric and Geospace Sciences (grant nos. 1419526 and 1849654).
This paper was edited by Hisashi Sato and reviewed by two anonymous referees.
Amiro, B. D., Barr, A. G., Black, T. A., Iwashita, H., Kljun, N., McCaughey, J. H., Morgenstern, K., Murayama, S., Nesic, Z., Orchansky, A. L., and Saigusa, N.: Carbon, energy and water fluxes at mature and disturbed forest sites, Saskatchewan, Canada, Agr. Forest. Meteorol., 136, 237–251, https://doi.org/10.1016/j.agrformet.2004.11.012, 2006a.
Amiro, B. D., Orchansky, A. L., Barr, A. G., Black, T. A., Chambers, S. D., Chapin, F. S., Gouldenf, M. L., Litvakg, M., Liu, H. P., McCaughey, J. H., McMillan, A., and Randerson, J. T.: The effect of post-fire stand age on the boreal forest energy balance, Agr. Forest Meteorol., 140, 41–50, https://doi.org/10.1016/j.agrformet.2006.02.014, 2006b.
Andela, N., Morton, D. C., Giglio, L., Chen, Y., van der Werf, G. R., Kasibhatla, P. S., DeFries, R. S., Collatz, G. J., Hantson, S., Kloster, S., Bachelet, D., Forrest, M., Lasslop, G., Li, F., Mangeon, S., Melton, J. R., Yue, C., and Randerson, J. T.: A human-driven decline in global burned area, Science, 356, 1356–1361, https://doi.org/10.1126/science.aal4108, 2017.
Andreae, M. O.: Emission of trace gases and aerosols from biomass burning – an updated assessment, Atmos. Chem. Phys., 19, 8523–8546, https://doi.org/10.5194/acp-19-8523-2019, 2019.
Archibald, S., Nickless, A., Govender, N., Scholes, R. J., and Lehsten, V.: Climate and the inter-annual variability of fire in southern Africa: a meta-analysis using long-term field data and satellite-derived burnt area data, Global Ecol. Biogeogr., 19, 794–809, https://doi.org/10.1111/j.1466-8238.2010.00568.x, 2010.
Arora, V. K. and Boer, G. J.: Fire as an interactive component of dynamic vegetation models, J. Geophys. Res.-Biogeo., 110, G02008, https://doi.org/10.1029/2005jg000042, 2005.
Bachelet, D., Ferschweiler, K., Sheehan, T. J., Sleeter, B. M., and Zhu, Z. L.: Projected carbon stocks in the conterminous USA with land use and variable fire regimes, Glob. Change Biol., 21, 4548–04560, https://doi.org/10.1111/gcb.13048, 2015.
Bartholome, E. and Belward, A. S.: GLC2000: a new approach to global land cover mapping from Earth observation data, Int. J. Remote Sens., 26, 1959–1977, 2005.
Bistinas, I., Harrison, S. P., Prentice, I. C., and Pereira, J. M. C.: Causal relationships versus emergent patterns in the global controls of fire frequency, Biogeosciences, 11, 5087–5101, https://doi.org/10.5194/bg-11-5087-2014, 2014.
Bond, W. J., Woodward, F. I., and Midgley, G. F.: The global distribution of ecosystems in a world without fire, New Phytol., 165, 525–537, https://doi.org/10.1111/j.1469-8137.2004.01252.x, 2005.
Bond-Lamberty, B., Peckham, S. D., Gower, S. T., and Ewers, B. E.: Effects of fire on regional evapotranspiration in the central Canadian boreal forest, Glob. Change Biol, 15, 1242–1254, https://doi.org/10.1111/j.1365-2486.2008.01776.x, 2009.
Bowman, D. M., Balch, J. K., Artaxo, P., Bond, W. J., Carlson, J. M., Cochrane, M. A., D'Antonio, C. M., Defries, R. S., Doyle, J. C., Harrison, S. P., Johnston, F. H., Keeley, J. E., Krawchuk, M. A., Kull, C. A., Marston, J. B., Moritz, M. A., Prentice, I. C., Roos, C. I., Scott, A. C., Swetnam, T. W., van der Werf, G. R., and Pyne, S. J.: Fire in the Earth system, Science, 324, 481–484, https://doi.org/10.1126/science.1163886, 2009.
Burton, C., Betts, R., Cardoso, M., Feldpausch, T. R., Harper, A., Jones, C. D., Kelley, D. I., Robertson, E., and Wiltshire, A.: Representation of fire, land-use change and vegetation dynamics in the Joint UK Land Environment Simulator vn4.9 (JULES), Geosci. Model Dev., 12, 179–193, https://doi.org/10.5194/gmd-12-179-2019, 2019.
Chambers, S. D. and Chapin, F. S.: Fire effects on surface-atmosphere energy exchange in Alaskan black spruce ecosystems: Implications for feedbacks to regional climate, J. Geophys. Res.-Atmos., 108, 8145, https://doi.org/10.1029/2001jd000530, 2002.
Chuvieco, E., Yue, C., Heil, A., Mouillot, F., Alonso-Canas, I., Padilla, M., Pereira, J. M., Oom, D., and Tansey, K.: A new global burned area product for climate assessment of fire impacts, Global Ecol Biogeogr., 25, 619–629, https://doi.org/10.1111/geb.12440, 2016.
CIESIN (Center for International Earth Science Information Network): Gridded population of the world version 3(GPWv3): Population density grids, Technical report, Socioeconomic Data and Applications Center (SEDAC), Columbia University, Palisades, New York, USA, available at: http://sedac.ciesin.columbia.edu/gpw (last access: 12 September 2017), 2005.
Computational and Information Systems Laboratory: Cheyenne: HPE/SGI ICE XA System (NCAR Community Computing), Boulder, CO, National Center for Atmospheric Research, https://doi.org/10.5065/D6RX99HX, 2019.
Cox, P. M.: Description of the “TRIFFID” Dynamic Global Vegetation Model, Hadley Centre technical note 24, Hadley Centre, Exeter, UK, 1–16, 2001.
de Oliveira, C. P., Francelino, M. R., Daher, M., de Araujo, E. J. G., Sanches, L. D., de Andrade, K. D. C., and de Campos, J. S. N.: Estimation of the aboveground biomass and carbon stocks in open Brazilian Savannah developed on sandy soils, Carbon Balance and Management, 14, 5, https://doi.org/10.1186/s13021-019-0121-0, 2019.
De Sales, F., Xue, Y. K., and Okin, G. S.: Impact of burned areas on the northern African seasonal climate from the perspective of regional modeling, Clim. Dyn., 47, 3393–3413, https://doi.org/10.1007/s00382-015-2522-4, 2016.
Devine, A. P., Stott, I., McDonald, R. A., and Maclean, I. M. D.: Woody cover in wet and dry African savannas after six decades of experimental fires, J. Ecol., 103, 473–478, 2015.
Dunin, F. X.: Run-off and drainage from grassland catchments, in: Managed Grasslands, B. Analytical Studies, edited by: Snaydon, R. W., 205–213, 1987.
Forkel, M., Andela, N., Harrison, S. P., Lasslop, G., van Marle, M., Chuvieco, E., Dorigo, W., Forrest, M., Hantson, S., Heil, A., Li, F., Melton, J., Sitch, S., Yue, C., and Arneth, A.: Emergent relationships with respect to burned area in global satellite observations and fire-enabled vegetation models, Biogeosciences, 16, 57–76, https://doi.org/10.5194/bg-16-57-2019, 2019.
Furley, P. A., Rees, R. M., Ryan, C. M., and Saiz, G.: Savanna burning and the assessment of long-term fire experiments with particular reference to Zimbabwe, Prog. Phys. Geog., 32, 611–634, 2008.
Gholz, H. L. and Clark, K. L.: Energy exchange across a chronosequence of slash pine forests in Florida, Agr. Forest Meteorol., 112, 87–102, 2002.
Giglio, L., Csiszar, I., and Justice, C. O.: Global distribution and seasonality of active fires as observed with the Terra and Aqua Moderate Resolution Imaging Spectroradiometer (MODIS) sensors, J. Geophys. Res.-Biogeo., 111, G02016, https://doi.org/10.1029/2005jg000142, 2006.
Giglio, L., Randerson, J. T., van der Werf, G. R., Kasibhatla, P. S., Collatz, G. J., Morton, D. C., and DeFries, R. S.: Assessing variability and long-term trends in burned area by merging multiple satellite fire products, Biogeosciences, 7, 1171–1186, https://doi.org/10.5194/bg-7-1171-2010, 2010.
Giglio, L., Randerson, J. T., and van der Werf, G. R.: Analysis of daily, monthly, and annual burned area using the fourth-generation global fire emissions database (GFED4), J. Geophys. Res.-Biogeo., 118, 317–328, https://doi.org/10.1002/jgrg.20042, 2013.
Giglio, L., Boschetti, L., Roy, D. P., Humber, M. L., and Justice, C. O.: The Collection 6 MODIS burned area mapping algorithm and product, Remote. Sens. Environ., 217, 72–85, https://doi.org/10.1016/j.rse.2018.08.005, 2018.
Goldewijk, K. K., Beusen, A., and Janssen, P.: Long-term dynamic modeling of global population and built-up area in a spatially explicit way: HYDE 3.1, Holocene, 20, 565–573, 2010.
Hamilton, D. S., Hantson, S., Scott, C. E., Kaplan, J. O., Pringle, K. J., Nieradzik, L. P., Rap, A., Folberth, G. A., Spracklen, D. V., and Carslaw, K. S.: Reassessment of pre-industrial fire emissions strongly affects anthropogenic aerosol forcing, Nat. Commun., 9, 3182, https://doi.org/10.1038/s41467-018-05592-9, 2018.
Hantson, S., Kelley, D. I., Arneth, A., Harrison, S. P., Archibald, S., Bachelet, D., Forrest, M., Hickler, T., Lasslop, G., Li, F., Mangeon, S., Melton, J. R., Nieradzik, L., Rabin, S. S., Prentice, I. C., Sheehan, T., Sitch, S., Teckentrup, L., Voulgarakis, A., and Yue, C.: Quantitative assessment of fire and vegetation properties in simulations with fire-enabled vegetation models from the Fire Model Intercomparison Project, Geosci. Model Dev., 13, 3299–3318, https://doi.org/10.5194/gmd-13-3299-2020, 2020.
Harper, A. B., Cox, P. M., Friedlingstein, P., Wiltshire, A. J., Jones, C. D., Sitch, S., Mercado, L. M., Groenendijk, M., Robertson, E., Kattge, J., Bönisch, G., Atkin, O. K., Bahn, M., Cornelissen, J., Niinemets, Ü., Onipchenko, V., Peñuelas, J., Poorter, L., Reich, P. B., Soudzilovskaia, N. A., and Bodegom, P. V.: Improved representation of plant functional types and physiology in the Joint UK Land Environment Simulator (JULES v4.2) using plant trait information, Geosci. Model Dev., 9, 2415–2440, https://doi.org/10.5194/gmd-9-2415-2016, 2016.
Higgins, S. I., Bond, W. J., February, E. C., Bronn, A., Euston-Brown, D. I. W., Enslin, B., Govender, N., Rademan, L., O'Regan, S., Potgieter, A. L. F., Scheiter, S., Sowry, R., Trollope, L., and Trollope, W. S. W.: Effects of four decades of fire manipulation on woody vegetation structure in savanna, Ecology, 88, 1119–1125, 2007.
Huang, H., Liu, Y., and Xue, Y.: hhllbao93/SSiB4-TRIFFID-Fire: Release of SSiB4/TRIFFID-Fire v1.0 (Version v1.0), Zenodo, https://doi.org/10.5281/zenodo.3872633, 2020a.
Huang, H., Xue, Y., Chilukoti, N., Liu, Y., Chen, G., and Diallo, I.: Assessing global and regional effects of reconstructed land use and land cover change on climate since 1950 using a coupled land-atmosphere-ocean model, J. Climate, 33, 8997–9013, https://doi.org/10.1175/JCLI-D-20-0108.1, 2020b.
Jiang, Y., Lu, Z., Liu, X., Qian, Y., Zhang, K., Wang, Y., and Yang, X.-Q.: Impacts of global open-fire aerosols on direct radiative, cloud and surface-albedo effects simulated with CAM5, Atmos. Chem. Phys., 16, 14805–14824, https://doi.org/10.5194/acp-16-14805-2016, 2016.
Johnston, F. H., Henderson, S. B., Chen, Y., Randerson, J. T., Marlier, M., DeFries, R. S., Kinney, P., Bowman, D. M. J. S., and Brauer, M.: Estimated Global Mortality Attributable to Smoke from Landscape Fires, Environ. Health Persp., 120, 695–701, https://doi.org/10.1289/ehp.1104422, 2012.
Jung, M., Reichstein, M., Margolis, H. A., Cescatti, A., Richardson, A. D., Arain, M. A., Arneth, A., Bernhofer, C., Bonal, D., Chen, J. Q., Gianelle, D., Gobron, N., Kiely, G., Kutsch, W., Lasslop, G., Law, B. E., Lindroth, A., Merbold, L., Montagnani, L., Moors, E. J., Papale, D., Sottocornola, M., Vaccari, F., and Williams, C.: Global patterns of land-atmosphere fluxes of carbon dioxide, latent heat, and sensible heat derived from eddy covariance, satellite, and meteorological observations, J. Geophys. Res.-Biogeo., 116, G00J07, https://doi.org/10.1029/2010JG00156, 2011.
Kloster, S., Mahowald, N. M., Randerson, J. T., and Lawrence, P. J.: The impacts of climate, land use, and demography on fires during the 21st century simulated by CLM-CN, Biogeosciences, 9, 509–525, https://doi.org/10.5194/bg-9-509-2012, 2012.
Knorr, W., Jiang, L., and Arneth, A.: Climate, CO2 and human population impacts on global wildfire emissions, Biogeosciences, 13, 267–282, https://doi.org/10.5194/bg-13-267-2016, 2016.
Langford, K. J.: Change in Yield of Water Following a Bushfire in a Forest of Eucalyptus Regnans, J. Hydrol., 29, 87–114, 1976.
Lasslop, G., Thonicke, K., and Kloster, S.: SPITFIRE within the MPI Earth system model: Model development and evaluation, J. Adv. Model. Earth Sy., 6, 740–755, https://doi.org/10.1002/2013ms000284, 2014.
Lasslop, G., Hantson, S., Harrison, S. P., Bachelet, D., Burton, C., Forkel, M., Forrest, M., Li F., Melton, J. R., Yue, C., Archibald, S., Scheiter, S., Arneth, A., Hickler, T., and Sitch, S.: Global ecosystems and fire: Multi-model assessment of fire-induced tree-cover and carbon storage reduction, Glob. Change Biol., 26, 5027–5041, https://doi.org/10.1111/gcb.15160, 2020.
Lawrence, D. M., Fisher, R. A., Koven, C. D., Oleson, K. W., Swenson, S. C., Bonan, G., Collier, N., Ghimire, B., van Kampenhout, L., Kennedy, D., Kluzek, E., Lawrence, P. J., Li, F., Li, H. Y., Lombardozzi, D., Riley, W. J., Sacks, W. J., Shi, M. J., Vertenstein, M., Wieder, W. R., Xu, C. G., Ali, A. A., Badger, A. M., Bisht, G., van den Broeke, M., Brunke, M. A., Burns, S. P., Buzan, J., Clark, M., Craig, A., Dahlin, K., Drewniak, B., Fisher, J. B., Flanner, M., Fox, A. M., Gentine, P., Hoffman, F., Keppel-Aleks, G., Knox, R., Kumar, S., Lenaerts, J., Leung, L. R., Lipscomb, W. H., Lu, Y. Q., Pandey, A., Pelletier, J. D., Perket, J., Randerson, J. T., Ricciuto, D. M., Sanderson, B. M., Slater, A., Subin, Z. M., Tang, J. Y., Thomas, R. Q., Martin, M. V., and Zeng, X. B.: The Community Land Model Version 5: Description of New Features, Benchmarking, and Impact of Forcing Uncertainty, J. Adv. Model. Earth Sy., 11, 4245–4287, https://doi.org/10.1029/2018ms001583, 2019.
Li, F. and Lawrence, D. M.: Role of Fire in the Global Land Water Budget during the Twentieth Century due to Changing Ecosystems, J. Climate, 30, 1893–1908, https://doi.org/10.1175/Jcli-D-16-0460.1, 2017.
Li, F., Zeng, X. D., and Levis, S.: A process-based fire parameterization of intermediate complexity in a Dynamic Global Vegetation Model, Biogeosciences, 9, 2761–2780, https://doi.org/10.5194/bg-9-2761-2012, 2012.
Li, F., Levis, S., and Ward, D. S.: Quantifying the role of fire in the Earth system – Part 1: Improved global fire modeling in the Community Earth System Model (CESM1), Biogeosciences, 10, 2293–2314, https://doi.org/10.5194/bg-10-2293-2013, 2013.
Li, F., Bond-Lamberty, B., and Levis, S.: Quantifying the role of fire in the Earth system – Part 2: Impact on the net carbon balance of global terrestrial ecosystems for the 20th century, Biogeosciences, 11, 1345–1360, https://doi.org/10.5194/bg-11-1345-2014, 2014.
Li, F., Lawrence, D. M., and Bond-Lamberty, B.: Impact of fire on global land surface air temperature and energy budget for the 20th century due to changes within ecosystems, Environ. Res. Lett., 12, 044014, https://doi.org/10.1088/1748-9326/aa727f, 2017.
Li, F., Val Martin, M., Andreae, M. O., Arneth, A., Hantson, S., Kaiser, J. W., Lasslop, G., Yue, C., Bachelet, D., Forrest, M., Kluzek, E., Liu, X., Mangeon, S., Melton, J. R., Ward, D. S., Darmenov, A., Hickler, T., Ichoku, C., Magi, B. I., Sitch, S., van der Werf, G. R., Wiedinmyer, C., and Rabin, S. S.: Historical (1700–2012) global multi-model estimates of the fire emissions from the Fire Modeling Intercomparison Project (FireMIP), Atmos. Chem. Phys., 19, 12545–12567, https://doi.org/10.5194/acp-19-12545-2019, 2019.
Liu, H. P., Randerson, J. T., Lindfors, J., and Chapin, F. S.: Changes in the surface energy budget after fire in boreal ecosystems of interior Alaska: An annual perspective, J. Geophys. Res.-Atmos., 110, D13101, https://doi.org/10.1029/2004jd005158, 2005.
Liu, Y., Guo, W. D., and Song, Y. M.: Estimation of key surface parameters in semi-arid region and their impacts on improvement of surface fluxes simulation, Sci. China. Earth Sci., 59, 307–319, https://doi.org/10.1007/s11430-015-5140-4, 2016.
Liu, Y., Xue, Y. K., MacDonald, G., Cox, P., and Zhang, Z. Q.: Global vegetation variability and its response to elevated CO2, global warming, and climate variability - a study using the offline SSiB4/TRIFFID model and satellite data, Earth Syst. Dynam., 10, 9-29, 2019.
Melton, J. R. and Arora, V. K.: Competition between plant functional types in the Canadian Terrestrial Ecosystem Model (CTEM) v. 2.0, Geosci. Model Dev., 9, 323–361, https://doi.org/10.5194/gmd-9-323-2016, 2016.
Moreira, A. G.: Effects of fire protection on savanna structure in Central Brazil, J. Biogeogr., 27, 1021–1029, 2000.
Oleson, K., Lawrence, D., Bonan, G., Drewniak, B., Huang, M., Koven, C., Levis, S., Li, F., Riley, W., and Subin, Z.: Technical Description of version 4.5 of the Community Land Model (CLM)(NCAR Technical Note No. NCAR/TN-503+ STR), National Center for Atmospheric Research, https://doi.org/10.5065/D6RR1W7M, 2013.
Pan, Y., Birdsey, R. A., Fang, J., Houghton, R., Kauppi, P. E., Kurz, W. A., Phillips, O. L., Shvidenko, A., Lewis, S. L., Canadell, J. G., Ciais, P., Jackson, R. B., Pacala, S. W., McGuire, A. D., Piao, S., Rautiainen, A., Sitch, S., and Hayes, D.: A large and persistent carbon sink in the world's forests, Science, 333, 988–993, 2011.
Parton, W. J., Ojima, D. S., Cole, C. V., and Schimel, D. S.: A General Model for Soil Organic Matter Dynamics – Sensitivity to Litter Chemistry, Texture and Management, Sssa Spec. Publ., 147–167, 1994.
Pfeiffer, M., Spessa, A., and Kaplan, J. O.: A model for global biomass burning in preindustrial time: LPJ-LMfire (v1.0), Geosci. Model Dev., 6, 643–685, https://doi.org/10.5194/gmd-6-643-2013, 2013.
Piao, S. L., Sitch, S., Ciais, P., Friedlingstein, P., Peylin, P., Wang, X. H., Ahlstrom, A., Anav, A., Canadell, J. G., Cong, N., Huntingford, C., Jung, M., Levis, S., Levy, P. E., Li, J. S., Lin, X., Lomas, M. R., Lu, M., Luo, Y. Q., Ma, Y. C., Myneni, R. B., Poulter, B., Sun, Z. Z., Wang, T., Viovy, N., Zaehle, S., and Zeng, N.: Evaluation of terrestrial carbon cycle models for their response to climate variability and to CO2 trends, Glob. Change Biol., 19, 2117–2132, https://doi.org/10.1111/gcb.12187, 2013.
Poulter, B., Cadule, P., Cheiney, A., Ciais, P., Hodson, E., Peylin, P., Plummer, S., Spessa, A., Saatchi, S., Yue, C., and Zimmermann, N. E.: Sensitivity of global terrestrial carbon cycle dynamics to variability in satellite-observed burned area, Global Biogeochem. Cy., 29, 207–222, 2015.
Prentice, S. and Mackerras, D.: The ratio of cloud to cloud-ground lightning flashes in thunderstorms, J. Appl. Meteorol., 16, 545–550, 1977.
Rabin, S. S., Ward, D. S., Malyshev, S. L., Magi, B. I., Shevliakova, E., and Pacala, S. W.: A fire model with distinct crop, pasture, and non-agricultural burning: use of new data and a model-fitting algorithm for FINAL.1, Geosci. Model Dev., 11, 815–842, https://doi.org/10.5194/gmd-11-815-2018, 2018.
Randerson, J. T., Chen, Y., van der Werf, G. R., Rogers, B. M., and Morton, D. C.: Global burned area and biomass burning emissions from small fires, J. Geophys. Res.-Biogeo., 117, G04012, https://doi.org/10.1029/2012jg002128, 2012.
Ricciuto, D., Sargsyan, K., and Thornton, P.: The Impact of Parametric Uncertainties on Biogeochemistry in the E3SM Land Model, J. Adv. Model. Earth Sy., 10, 297–319, https://doi.org/10.1002/2017ms000962, 2018.
Rogers, B. M., Randerson, J. T., and Bonan, G. B.: Rogers, B. M., Randerson, J. T., and Bonan, G. B.: High-latitude cooling associated with landscape changes from North American boreal forest fires, Biogeosciences, 10, 699–718, https://doi.org/10.5194/bg-10-699-2013, 2013.
Saha, M. V., Scanlon, T. M., and D'Odorico, P.: Suppression of rainfall by fires in African drylands, Geophys. Res. Lett., 43, 8527–8533, https://doi.org/10.1002/2016gl069855, 2016.
Sankaran, M., Hanan, N. P., Scholes, R. J., Ratnam, J., Augustine, D. J., Cade, B. S., Gignoux, J., Higgins, S. I., Le Roux, X., Ludwig, F., Ardo, J., Banyikwa, F., Bronn, A., Bucini, G., Caylor, K. K., Coughenour, M. B., Diouf, A., Ekaya, W., Feral, C. J., February, E. C., Frost, P. G. H., Hiernaux, P., Hrabar, H., Metzger, K. L., Prins, H. H. T., Ringrose, S., Sea, W., Tews, J., Worden, J., and Zambatis, N.: Determinants of woody cover in African savannas, Nature, 438, 846–849, 2005.
Santos, A. J. B., Silva, G. T. D. A., Miranda, H. S., Miranda, A. C., and Lloyd, J.: Effects of fire on surface carbon, energy and water vapour fluxes over campo sujo savanna in central Brazil, Funct. Ecol., 17, 711–719, 2003.
Scholes, R. J., Ward, D. E., and Justice, C. O.: Emissions of trace gases and aerosol particles due to vegetation burning in southern hemisphere Africa, J. Geophys. Res.-Atmos., 101, 23677–23682, https://doi.org/10.1029/95jd02049, 1996.
Schulze, E. D., Kelliher, F. M., Korner, C., Lloyd, J., and Leuning, R.: Relationships among Maximum Stomatal Conductance, Ecosystem Surface Conductance, Carbon Assimilation Rate, and Plant Nitrogen Nutrition – a Global Ecology Scaling Exercise, Annu. Rev. Ecol. Syst., 25, 629–660, https://doi.org/10.1146/annurev.es.25.110194.003213, 1994.
Seo, H. and Kim, Y.: Interactive impacts of fire and vegetation dynamics on global carbon and water budget using Community Land Model version 4.5, Geosci. Model Dev., 12, 457–472, https://doi.org/10.5194/gmd-12-457-2019, 2019.
Shackleton, C. and Scholes, R. J.: Impact of fire frequency on woody community structure and soil nutrients in the Kruger National Park, Koedoe, 43, 75–81, 2000.
Sheffield, J., Goteti, G., and Wood, E. F.: Development of a 50-year high-resolution global dataset of meteorological forcings for land surface modeling, J. Climate, 19, 3088–3111, https://doi.org/10.1175/Jcli3790.1, 2006.
Shinoda, M. and Yamaguchi, Y.: Influence of soil moisture anomaly on temperature in the Sahel: A comparison between wet and dry decades, J. Hydrometeorol, 4, 437–447, https://doi.org/10.1175/1525-7541(2003)4<437:IOSMAO>2.0.CO;2, 2003.
Smit, I. P. J., Asner, G. P., Govender, N., Kennedy-Bowdoin, T., Knapp, D. E., and Jacobson, J.: Effects of fire on woody vegetation structure in African savanna, Ecol. Appl., 20, 1865–1875, 2010.
Sousa, W. P.: The Role of Disturbance in Natural Communities, Annu. Rev. Ecol. Syst., 15, 353–391, https://doi.org/10.1146/annurev.es.15.110184.002033, 1984.
Sun, G., Noormets, A., Gavazzi, M. J., McNulty, S. G., Chen, J., Domec, J. C., King, J. S., Amatya, D. M., and Skaggs, R. W.: Energy and water balance of two contrasting loblolly pine plantations on the lower coastal plain of North Carolina, USA, Forest. Ecol. Manag., 259, 1299–1310, 2010.
Teckentrup, L., Harrison, S. P., Hantson, S., Heil, A., Melton, J. R., Forrest, M., Li, F., Yue, C., Arneth, A., Hickler, T., Sitch, S., and Lasslop, G.: Response of simulated burned area to historical changes in environmental and anthropogenic factors: a comparison of seven fire models, Biogeosciences, 16, 3883–3910, https://doi.org/10.5194/bg-16-3883-2019, 2019.
Thonicke, K., Venevsky, S., Sitch, S., and Cramer, W.: The role of fire disturbance for global vegetation dynamics: coupling fire into a Dynamic Global Vegetation Model, Global Ecol. Biogeogr., 10, 661–677, https://doi.org/10.1046/j.1466-822x.2001.00175.x, 2001.
Thonicke, K., Spessa, A., Prentice, I. C., Harrison, S. P., Dong, L., and Carmona-Moreno, C.: The influence of vegetation, fire spread and fire behaviour on biomass burning and trace gas emissions: results from a process-based model, Biogeosciences, 7, 1991–2011, https://doi.org/10.5194/bg-7-1991-2010, 2010.
van der Werf, G. R., Randerson, J. T., Giglio, L., Collatz, G. J., Kasibhatla, P. S., and Arellano Jr., A. F.: Interannual variability in global biomass burning emissions from 1997 to 2004, Atmos. Chem. Phys., 6, 3423–3441, https://doi.org/10.5194/acp-6-3423-2006, 2006.
van der Werf, G. R., Randerson, J. T., Giglio, L., Collatz, G. J., Mu, M., Kasibhatla, P. S., Morton, D. C., DeFries, R. S., Jin, Y., and van Leeuwen, T. T.: Global fire emissions and the contribution of deforestation, savanna, forest, agricultural, and peat fires (1997–2009), Atmos. Chem. Phys., 10, 11707–11735, https://doi.org/10.5194/acp-10-11707-2010, 2010.
van der Werf, G. R., Randerson, J. T., Giglio, L., van Leeuwen, T. T., Chen, Y., Rogers, B. M., Mu, M., van Marle, M. J. E., Morton, D. C., Collatz, G. J., Yokelson, R. J., and Kasibhatla, P. S.: Global fire emissions estimates during 1997–2016, Earth Syst. Sci. Data, 9, 697–720, https://doi.org/10.5194/essd-9-697-2017, 2017.
van Marle, M. J. E., Kloster, S., Magi, B. I., Marlon, J. R., Daniau, A.-L., Field, R. D., Arneth, A., Forrest, M., Hantson, S., Kehrwald, N. M., Knorr, W., Lasslop, G., Li, F., Mangeon, S., Yue, C., Kaiser, J. W., and van der Werf, G. R.: Historic global biomass burning emissions for CMIP6 (BB4CMIP) based on merging satellite observations with proxies and fire models (1750–2015), Geosci. Model Dev., 10, 3329–3357, https://doi.org/10.5194/gmd-10-3329-2017, 2017.
van Vuuren, D. P., Lucas, P. L., and Hilderink, H.: Downscaling drivers of global environmental change: Enabling use of global SRES scenarios at the national and grid levels, Global Environ. Chang., 17, 114–130, 2007.
van Wilgen, B. W., Govender, N., and Biggs, H. C.: The contribution of fire research to fire management: a critical review of a long-term experiment in the Kruger National Park, South Africa, Int. J. Wildland Fire, 16, 519–530, 2007.
Venevsky, S., Thonicke, K., Sitch, S., and Cramer, W.: Simulating fire regimes in human-dominated ecosystems: Iberian Peninsula case study, Global Change. Biol., 8, 984–998, https://doi.org/10.1046/j.1365-2486.2002.00528.x, 2002.
Venevsky, S., Le Page, Y., Pereira, J. M. C., and Wu, C.: Analysis fire patterns and drivers with a global SEVER-FIRE v1.0 model incorporated into dynamic global vegetation model and satellite and on-ground observations, Geosci. Model Dev., 12, 89–110, https://doi.org/10.5194/gmd-12-89-2019, 2019.
Ward, D. S., Kloster, S., Mahowald, N. M., Rogers, B. M., Randerson, J. T., and Hess, P. G.: The changing radiative forcing of fires: global model estimates for past, present and future, Atmos. Chem. Phys., 12, 10857–10886, https://doi.org/10.5194/acp-12-10857-2012, 2012.
Ward, D. S., Shevliakova, E., Malyshev, S., and Rabin, S.: Trends and Variability of Global Fire Emissions Due To Historical Anthropogenic Activities, Global Biogeochem. Cy., 32, 122–142, https://doi.org/10.1002/2017gb005787, 2018.
Xia, X. G., Zong, X. M., and Sun, L.: Exceptionally active agricultural fire season in mid-eastern China in June 2012 and its impact on the atmospheric environment, J. Geophys. Res.-Atmos., 118, 9889–9900, https://doi.org/10.1002/jgrd.50770, 2013.
Xue, Y., Sellers, P. J., Kinter, J. L., and Shukla, J.: A Simplified Biosphere Model for Global Climate Studies, J, Climate, 4, 345–364, https://doi.org/10.1175/1520-0442(1991)004<0345:ASBMFG>2.0.CO;2, 1991.
Yang, J., Tian, H. Q., Tao, B., Ren, W., Kush, J., Liu, Y. Q., and Wang, Y. H.: Spatial and temporal patterns of global burned area in response to anthropogenic and environmental factors: Reconstructing global fire history for the 20th and early 21st centuries, J. Geophys. Res.-Biogeo., 119, 249–263, https://doi.org/10.1002/2013jg002532, 2014.
Yang, J., Tian, H. Q., Tao, B., Ren, W., Pan, S. F., Liu, Y. Q., and Wang, Y. H.: A growing importance of large fires in conterminous United States during 1984–2012, J. Geophys. Res.-Biogeo., 120, 2625–2640, https://doi.org/10.1002/2015jg002965, 2015.
Yue, C., Ciais, P., Cadule, P., Thonicke, K., Archibald, S., Poulter, B., Hao, W. M., Hantson, S., Mouillot, F., Friedlingstein, P., Maignan, F., and Viovy, N.: Modelling the role of fires in the terrestrial carbon balance by incorporating SPITFIRE into the global vegetation model ORCHIDEE – Part 1: simulating historical global burned area and fire regimes, Geosci. Model Dev., 7, 2747–2767, https://doi.org/10.5194/gmd-7-2747-2014, 2014.
Yue, C., Ciais, P., Cadule, P., Thonicke, K., and van Leeuwen, T. T.: Modelling the role of fires in the terrestrial carbon balance by incorporating SPITFIRE into the global vegetation model ORCHIDEE – Part 2: Carbon emissions and the role of fires in the global carbon balance, Geosci. Model Dev., 8, 1321–1338, https://doi.org/10.5194/gmd-8-1321-2015, 2015.
Zeng, F. W., Koster, R. D., Lee, E., Follette-Cook, M. B., Weir, B., Colarco, P. R., Ott, L., and Poulter, B.: Evaluating Prognostic Fire Emissions within the NASA GEOS Earth System Model, AGUFM, A23L–2959, 2019.
Zeng, X. D., Li, F., and Song, X.: Development of the IAP Dynamic Global Vegetation Model, Adv. Atmos. Sci., 31, 505–514, https://doi.org/10.1007/s00376-013-3155-3, 2014.
Zhan, X. W., Xue, Y. K., and Collatz, G. J.: An analytical approach for estimating CO2 and heat fluxes over the Amazonian region, Ecol. Model, 162, 97–117, 2003.
Zhang, Z., Xue, Y., MacDonald, G., Cox, P. M., and Collatz, G. J.: Investigation of North American vegetation variability under recent climate: A study using the SSiB4/TRIFFID biophysical/dynamic vegetation model, J. Geophys. Res.-Atmos., 120, 1300–1321, 2015.
Zheng, B., Chevallier, F., Yin, Y., Ciais, P., Fortems-Cheiney, A., Deeter, M. N., Parker, R. J., Wang, Y., Worden, H. M., and Zhao, Y.: Global atmospheric carbon monoxide budget 2000–2017 inferred from multi-species atmospheric inversions, Earth Syst. Sci. Data, 11, 1411–1436, https://doi.org/10.5194/essd-11-1411-2019, 2019.
Zou, Y., Wang, Y., Qian, Y., Tian, H., Yang, J., and Alvarado, E.: Using CESM-RESFire to understand climate–fire–ecosystem interactions and the implications for decadal climate variability, Atmos. Chem. Phys., 20, 995–1020, https://doi.org/10.5194/acp-20-995-2020, 2020.