the Creative Commons Attribution 4.0 License.
the Creative Commons Attribution 4.0 License.
 | 01 Dec 2020
Effects of horizontal resolution and air–sea coupling on simulated moisture source for East Asian precipitation in MetUM GA6/GC2
Ruud J. van der Ent
Nicholas P. Klingaman
Marie-Estelle Demory
Pier Luigi Vidale
Andrew G. Turner
Claudia C. Stephan
Amulya Chevuturi
Precipitation over East Asia in six Met Office Unified Model (MetUM) simulations is compared with observation and ERA-Interim reanalysis. These simulations include three different horizontal resolutions, from low and medium to high, and including atmosphere-only version (Global Atmosphere 6.0; GA6) and air–sea coupling version (Global Coupled 2.0; GC2). Precipitation in simulations is systematically different from that in observations and reanalysis. Increasing horizontal resolution and including air–sea coupling improve simulated precipitation but cannot eliminate bias. Moisture sources of East Asian precipitation are identified using the Water Accounting Model (WAM-2layers) – a moisture tracking model that traces moisture source using collective information of evaporation, atmospheric moisture and circulation. Similar to precipitation, moisture sources in simulations are systematically different from that of ERA-Interim. Major differences in moisture sources include underestimated moisture contribution from tropical Indian Ocean and overestimate contribution from Eurasian continent. By increasing horizontal resolution, precipitation bias over the Tibetan Plateau is improved. From the moisture source point of view, this is achieved by reducing contribution from remote moisture source and enhancing local contribution over its eastern part. Although including air–sea coupling does not necessarily change East Asian precipitation, moisture sources show differences between coupled and atmosphere-only simulations. These differences in moisture sources indicate different types of models biases caused by surface flux or/and atmospheric circulation on different locations. This information can be used to target model biases on specified locations and due to different mechanisms.
- Article
(10581 KB) - Full-text XML
-
Supplement
(245 KB) - BibTeX
- EndNote


Identifying moisture source for East Asian (EA) precipitation has been a challenging subject that motivates the scientific community and is essential for regional socio-economical development. Different methods have been applied, from the diagnosis of the net moisture flux on the boundary of a studied region (e.g. Zhou and Yu, 2005), to using one- or two-dimensional analytic models (e.g. Guo et al., 2018), to using moisture tracking models based on the atmospheric moisture conservation under the both Lagrangian and Eulerian frameworks (e.g. Wei et al., 2012; Zhang et al., 2017; Guo et al., 2019; Fremme and Sodemann, 2019). The understanding about the major moisture source for EA precipitation is changing. With East Asia being under the influence of the East Asian summer monsoon, early studies tend to consider the adjacent oceans as the major direct moisture source for the EA precipitation and its interannual variability (Zhou and Yu, 2005; Wang and Chen, 2012). With sophisticated moisture tracking tools being applied, moisture source for precipitation can be identified more accurately. As a result, moisture contributions of land surface have been recognised (Wei et al., 2012; Zhang et al., 2017; Fremme and Sodemann, 2019) and replace oceanic sources becoming major contributors to EA precipitation, especially over the northern and western parts. Considering the fact that EA spans a large area from tropics to extratropics and experiences dry winter and wet summer, the major land moisture source also varies from region to region and from season to season. In summer, over southeastern EA, take the Yangtze River (YR) region, for example: the major moisture source is the adjacent land along the route of the EA summer monsoon, i.e. southwestern China and southeast Asia (Zhao et al., 2016; Fremme and Sodemann, 2019). One the other hand, in winter, over midlatitude EA, the major moisture source is the vast Eurasian continent beneath the midlatitude westerly jet (van der Ent et al., 2010). On the Tibetan Plateau, due to the surrounding mountains, the major moisture source is the evaporation from the local land mass (Curio et al., 2015; van der Ent and Savennije, 2011; Zhang et al., 2017). Although more and more recent studies support the view that the land surface is the major moisture source for EA precipitation, exceptions have also been found. Guo et al. (2019) have shown that, during the boreal winter, due to the frozen Eurasian continent and snow cover, the midlatitude ocean again becomes the major moisture source for midlatitude EA precipitation.
Correctly simulating the global hydrological cycle in up-to-date global climate models (GCMs) remains challenging (Liepert and Previdi, 2012). This challenge also remains on the regional scales and has been reported over EA (Wen et al., 2016; Yang et al., 2014; Ou et al., 2013; Chen and Sun, 2015; Jiang et al., 2015). Despite these uncertainties, improvements in precipitation as well as on hydrological cycle have been made in GCMs with the increase of horizontal resolution and the inclusion of air–sea coupling. By investigating 18 GCMs with horizontal resolution varying between 100 and 20 km, Vannière et al. (2018) found improvement in precipitation over land with the increase of horizontal resolution. They also found improvement in precipitation pattern and amplitude over regional scale due to improvement in the seasonal circulation with the increase of horizontal resolution. Similar improvement in the global hydrological cycle has also been reported (Terai et al., 2018; Demory et al., 2014). Improvements in the regional scales due to increasing horizontal resolution have been reported over South Asia (Johnson et al., 2016; Ogata et al., 2017), the Maritime Continent (Schiemann et al., 2014), tropical Africa (Vellinga et al., 2016) and the midlatitude storm track (van Haren et al., 2015). Over EA, Stephan et al. (2018) found that the seasonal mean precipitation and its interannual variability improved with increasing resolution in the Met Office Unified Models, particularly near orography in southwestern China.
The ocean plays an important role in the global hydrological cycle as about 85 % of the evaporation and 77 % of the precipitation occur over the ocean (Schanze et al., 2010). The air–sea coupling makes the air–sea fluxes in the GCMs more realistic, in terms of both heat and water, and therefore changes water/precipitation distributions in models (Ratnam et al., 2015; Dong et al., 2017; Hirons et al., 2018). Furthermore, air–sea coupling changes the atmospheric circulation and the atmospheric internal variability (Barsugli and Battisti, 1998; Dickinson, 2000; He et al., 2017; Park et al., 2005; Ma et al., 2015), which changes the moisture transport and the associated precipitation over land.
Aforementioned studies show progressive understanding on the EA precipitation moisture source and show evidence and challenges for improving the simulated hydrological cycle and regional precipitation in terms of changing the horizontal resolution and introducing air–sea coupling. Based on this knowledge, we will try to understand systematic errors in EA precipitation simulated from a set of GCMs by linking these errors to errors in evaporation and moisture transport using a moisture tracking model. The set of GCMs is the Met Office Unified Model (MetUM) Global Atmosphere 6.0 (GA6) and Global Coupled model 2.0 (GC2) with three different horizontal resolution configurations. The moisture tracking model is the Water Accounting Model – 2 layers (WAM-2layers). WAM-2layers has been applied to EA precipitation in previous studies (Keys et al., 2014; Guo et al., 2019) with different reanalysis datasets. Compared to other tracking methods, its efficiency makes it a better tool to work with high-resolution and long-term climate simulations. More details about MetUM and WAM-2layers are given in Sect. 2. Simulated precipitation and moisture sources are compared to observation and reanalyses in Sect. 3. Differences of the moisture source for EA precipitation due to changes in horizontal resolution and air–sea coupling are discussed in Sect. 4. The conclusion and discussions will be in Sects. 6 and 5.
2.1 Data
The European Centre for Medium-Range Weather Forecasts interim reanalysis dataset (ERA-Interim; Berrisford et al., 2011; Dee et al., 2011) is used to validate simulated precipitation and to drive WAM-2layers moisture tracking model. Daily mean variables on a single level (precipitation, evaporation, surface pressure and near-surface specific humidity) and model levels (horizontal wind and specific humidity) are used. ERA-Interim data with the horizonal resolution of 1.5∘ × 1.5∘ are used to drive WAM-2layers. This resolution is close to the model resolution at its lowest configurations (see below).
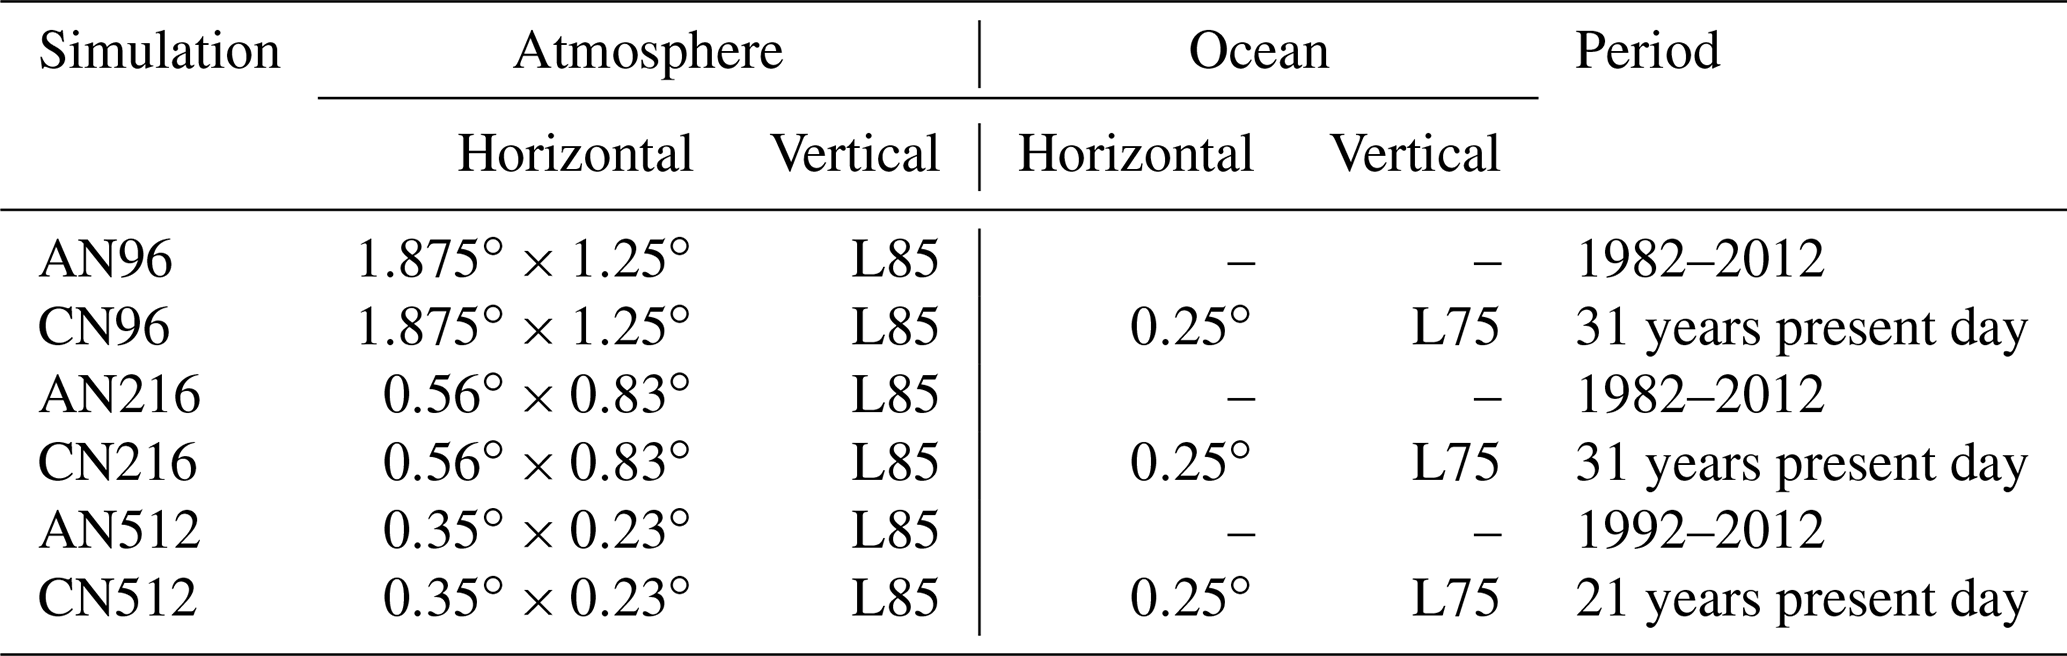
Table 1Simulations used in this study. L85 of the atmospheric vertical resolution is a terrain-following hybrid height coordinate (units: m) that has 85 levels and a fixed model lid at 85 km (Hewitt et al., 2011). L75 of the oceanic vertical resolution is a z* coordinate (units: m) (Hewitt et al., 2011; Madec and Imbard, 1996).
Observational daily precipitation over the Asian monsoon region is obtained from the Asian Precipitation – Highly-Resolved Observational Data Integration Towards Evaluation (APHRODITE; Yatagai et al., 2012) dataset. APHRODITE utilises rain-gauge data with processes of quality control and is available from 1951 to 2015. To match with MetUM simulations, the period between 1982 and 2012 is used for both ERA-Interim and APHRODITE. Other precipitation observations from the Global Precipitation Climatology Centre (GPCC; Schneider et al., 2014) are also used in comparison. Because of the similarity between the two datasets, only results from APHRODITE are shown in the following text.
Simulated sea surface temperature (SST) is evaluated against the Operational Sea Surface Temperature and Sea Ice Analysis (OSTIA; Donlon et al., 2012). As coupled simulations are configured to represent present-day climate, OSTIA date from 1982 to 2012 is used.
2.2 Met Office Unified Model and experiments
MetUM GA6 (Walters et al., 2017) and GC2 (Williams et al., 2015) are used. GA6 includes a relatively new dynamical core, which significantly increases midlatitude variability and increases variability in the tropics. GC2 couples GA6 with an ocean model (Nucleus for European Modelling of the Ocean (NEMO); Madec, 2008) and a sea-ice model (the Community Ice CodE and the Los Alamos Sea Ice Model (CICE); Hunke and Lipscomb, 2004) via the OASIS3 coupler (Valcke, 2013) on a 3-hourly frequency. GC2 showed an improvement from previous configurations, particularly in terms of modes of variability, e.g. midlatitude and tropical cyclone intensities, the Madden–Julian Oscillation and El Niño–Southern Oscillation (Williams et al., 2015).
Six MetUM simulations are used, which can be grouped into three pairs. Each pair includes an atmosphere-only simulation (A) and an atmosphere–ocean coupled simulation (C), which have the same atmospheric horizontal resolution. Three different atmospheric horizontal resolutions are configured: 192 × 145 (N96), 432 × 325 (N216) and 1024 × 769 (N512s). Therefore, the six simulations used here are denoted as AN96, CN96, AN216, CN216, AN512 and CN512. The equivalent side length of the atmospheric grid along the longitude at the Equator is 200, 90 and 40 km, respectively. Atmosphere models have 85 hybrid height levels in the vertical plane covering 0–85 km (Hewitt et al., 2011). The ocean model uses 75 vertical levels and the OCRA025 tripolar grid which has 0.25∘ resolution at the Equator (Hewitt et al., 2011; Madec and Imbard, 1996). Periods of simulation are listed in Table 1. Most simulations match the period of ERA-Interim (1982–2012), except N512 simulations which have a shorter simulation period (1992–2012).
2.3 Water Accounting Model-2layers

Figure 1(a) Annual mean precipitation minus evaporation (P−E), calculated using ERA-Interim reanalysis during 1979–2016 (units: m yr−1); (b) topography over the EA land mass (units: m). Boxes 1–5 in panel (a) indicate subregions over EA. This is reproduced from Guo et al. (2018).
WAM-2layers is a moisture tracking model developed by van der Ent et al. (2013, 2014). WAM-2layers is based on the atmospheric water conservation equation and combines information on precipitation, evaporation, atmospheric circulation and moisture to determine sources or sinks of moisture originating from a specified region. In this study, WAM-2layers is applied to backtrack moisture sources of precipitation over EA in both ERA-Interim reanalysis and MetUM simulations. Daily precipitation from either reanalysis or simulations is fed into WAM-2layers, which is integrated backward using circulation and humidity information on model/pressure levels. Domain and magnitude of moisture source will be calculated. A detailed description about WAM-2layers and its setup over EA are given in Guo et al. (2019). Because EA crosses several climatic zones and has inhomogeneous hydrological features, this region is first divided into five subregions according precipitation minus evaporation and topography (Fig. 1). These regions are southeastern EA (region 1), the Tibetan Plateau (region 2), central–eastern EA (region 3), northwestern EA (region 4) and northeastern EA (region 5). A similar division was used in Guo et al. (2018), where a detailed discussion about the division is given.
3.1 Precipitation
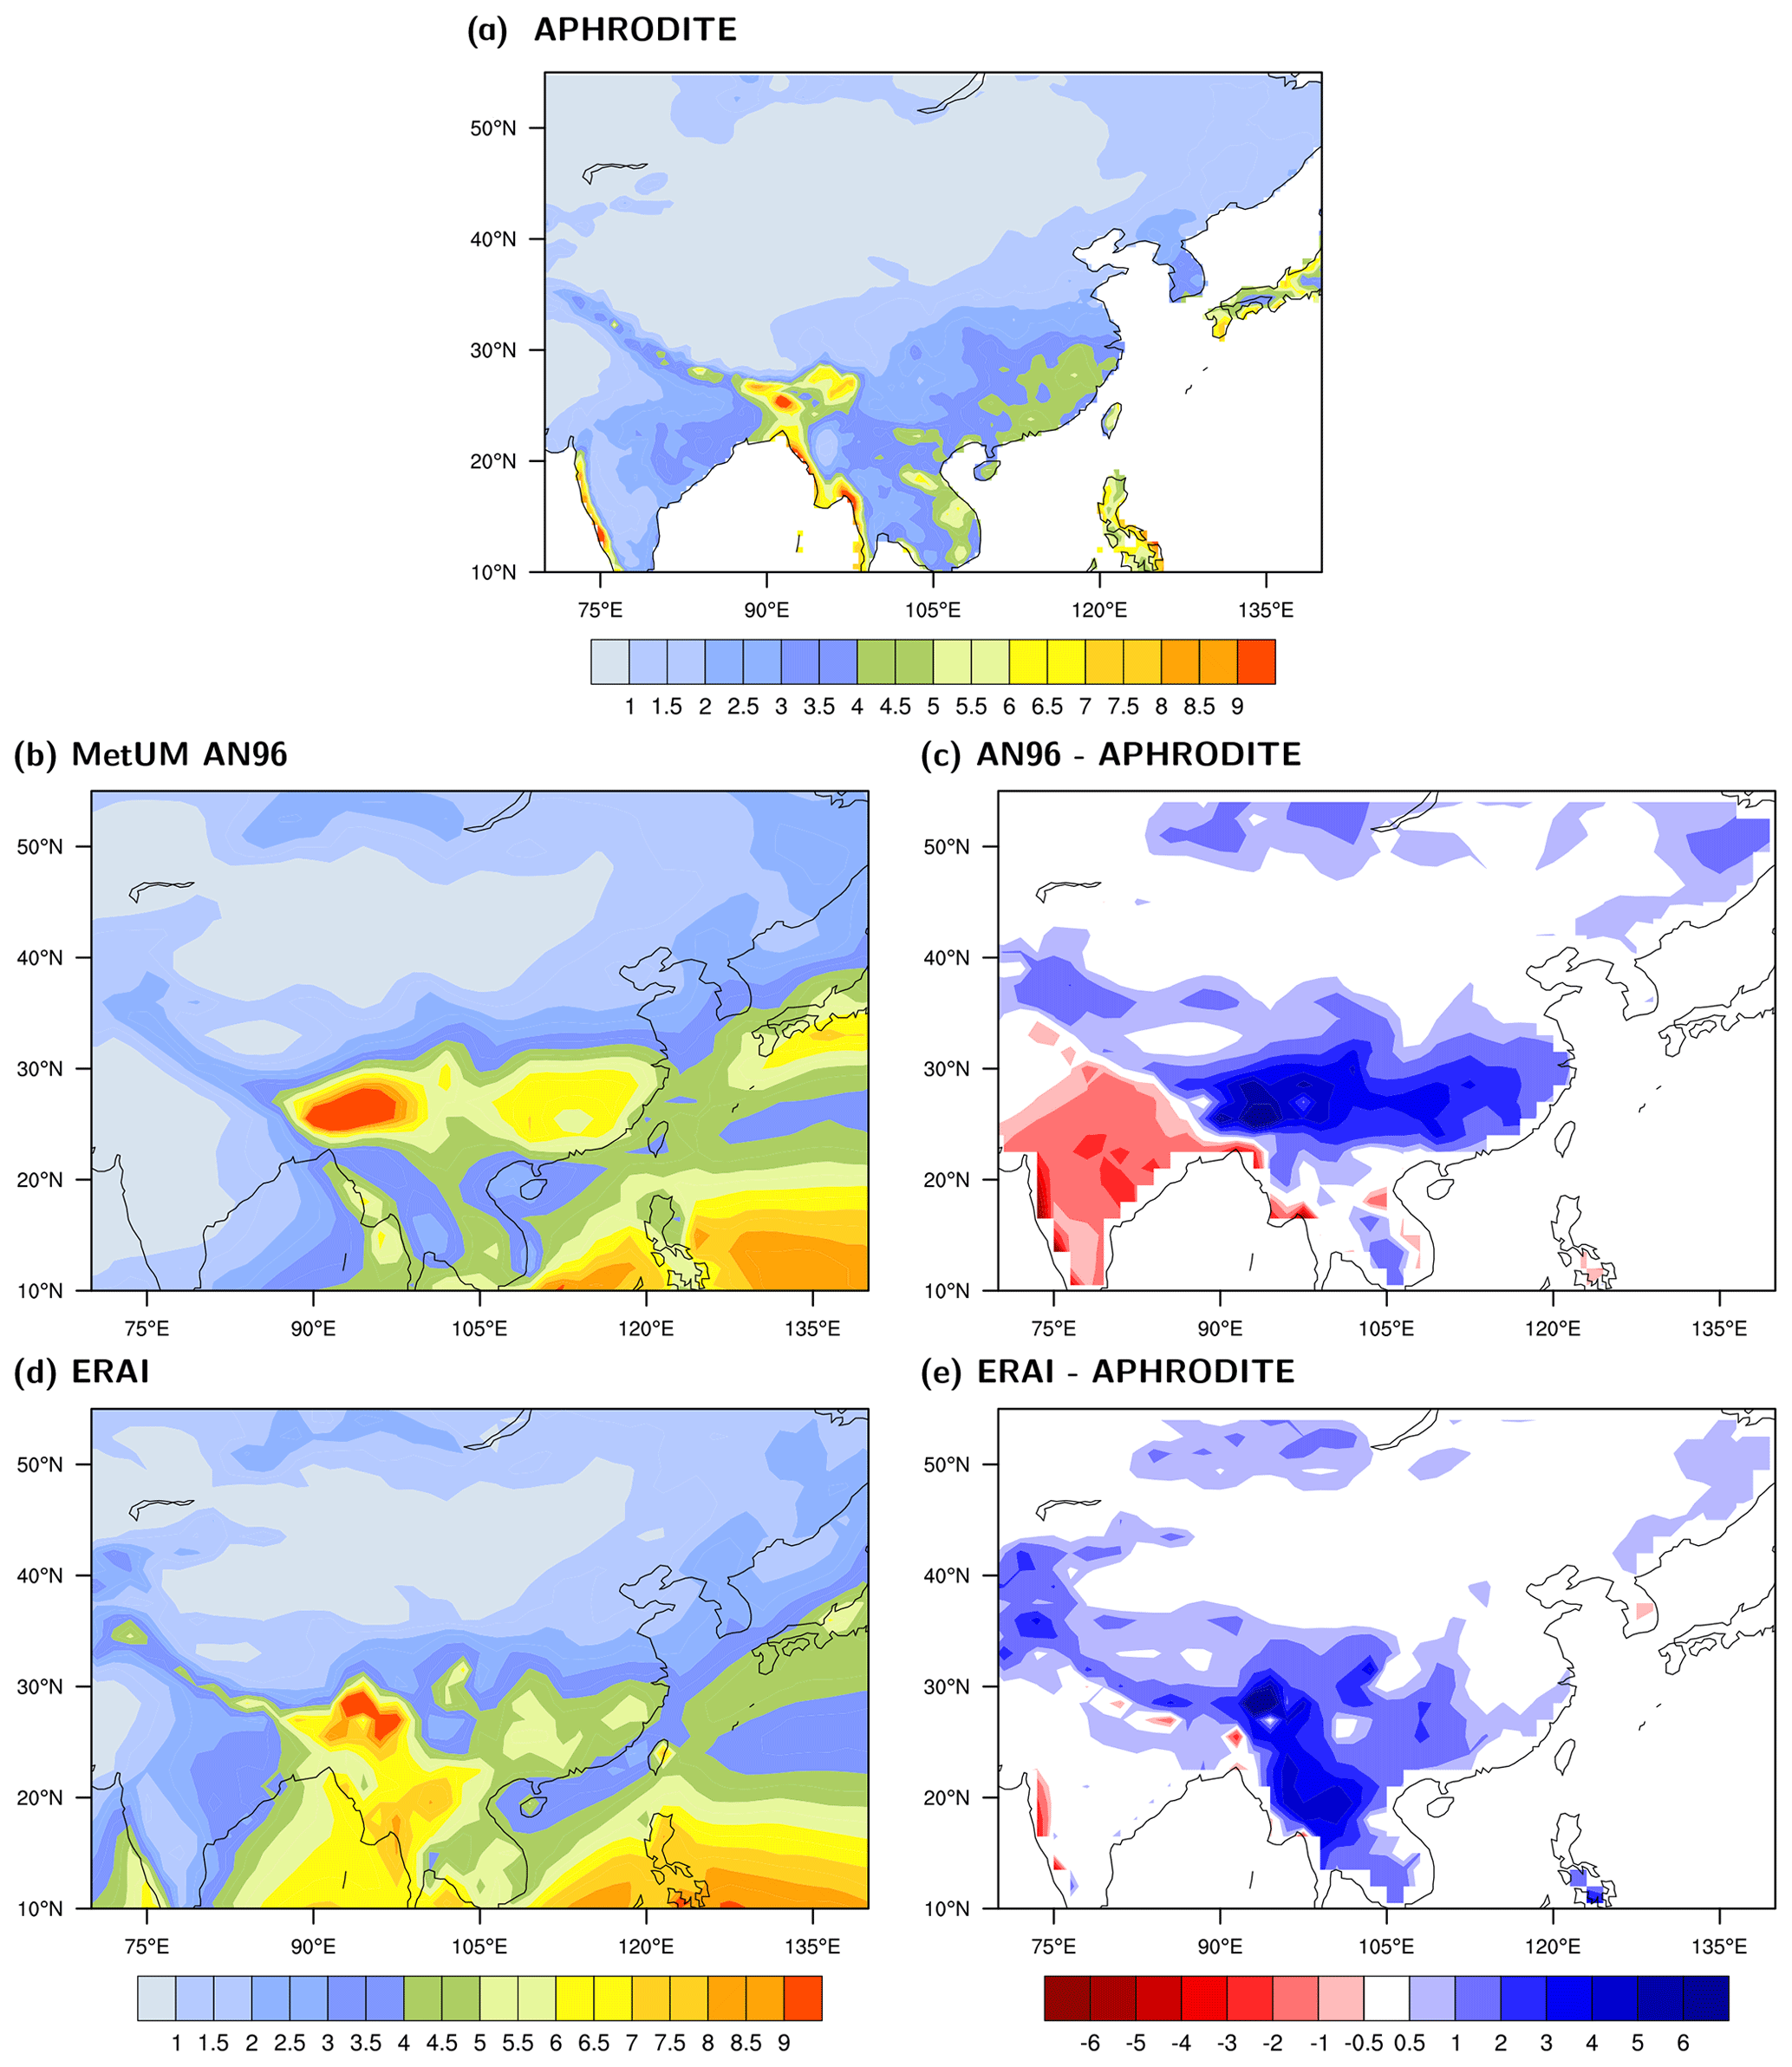
Figure 2Annual mean precipitation of (a) APHRODITE, (b) MetUM AN96 and (d) ERA-Interim, and differences (c) between AN96 and APHRODITE, and (e) between ERA-Interim and APHRODITE. The annual precipitation is averaged over 1982–2012 (units: mm d−1).
Figure 2 shows annual mean precipitation in APHRODITE, MetUM AN96 and ERA-Interim and biases against APHRODITE. AN96 captures major features of precipitation over EA, i.e. the south–north precipitation gradient, the precipitation maxima over the Sichuan Basin and southeastern China (Fig. 2b). However, compared to APHRODITE, AN96 overestimates precipitation over the Tibetan Plateau, Sichuan Basin and southeastern China and underestimates precipitation over the southern slope of the Himalayas (Fig. 2c). There are also biases over southern Asia, i.e. the Indian Peninsula, Bangladesh and southeastern Asia. These similarities and biases are also common in other simulations (Fig. S1 in the Supplement). Comparing ERA-Interim to APHRODITE (Fig. 2d and e), ERA-Interim overestimates precipitation over southwestern China and the Tibetan Plateau. These biases will affect moisture tracking accuracy over these regions. However, using ERA-Interim precipitation for moisture source tracking remains a better option because it matches with other ERA-Interim variables, i.e. moisture fluxes and evaporation.
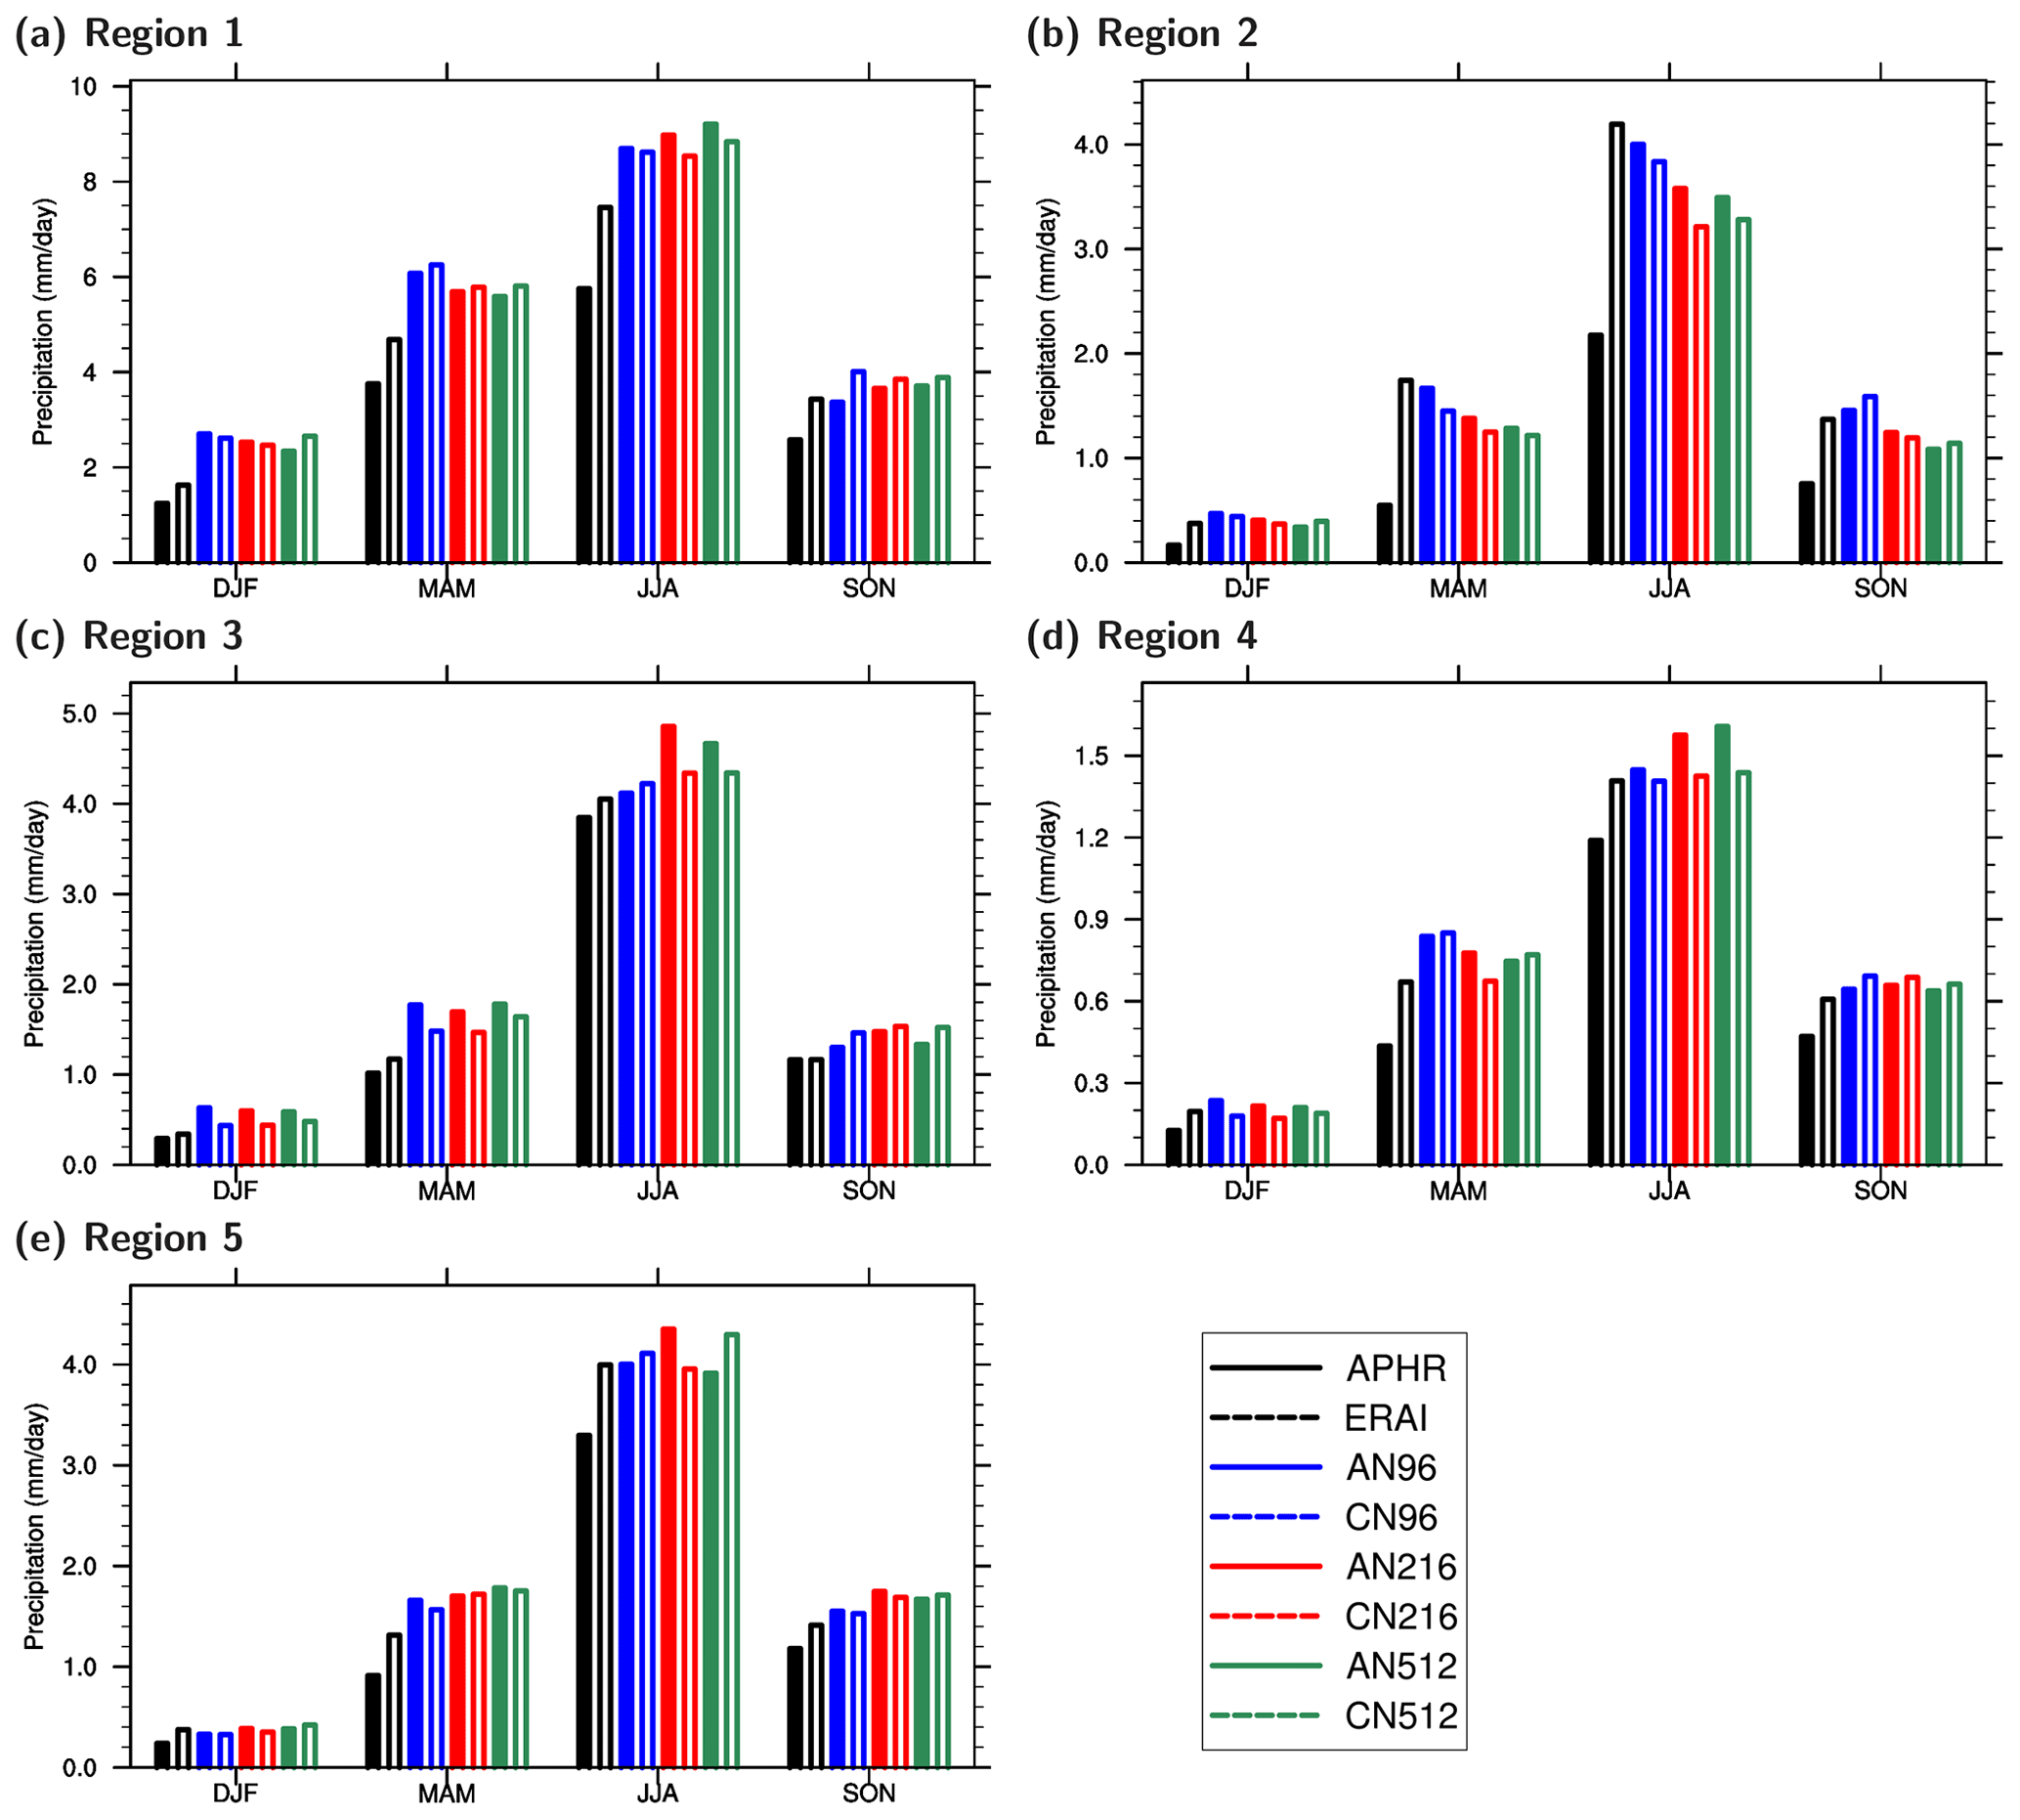
Figure 3Seasonal and regional mean precipitation over EA subregions. Compared datasets include APHRODITE, ERA-Interim, AN96, CN96, AN216, CN216, AN512 and CN512 (units: mm d−1).
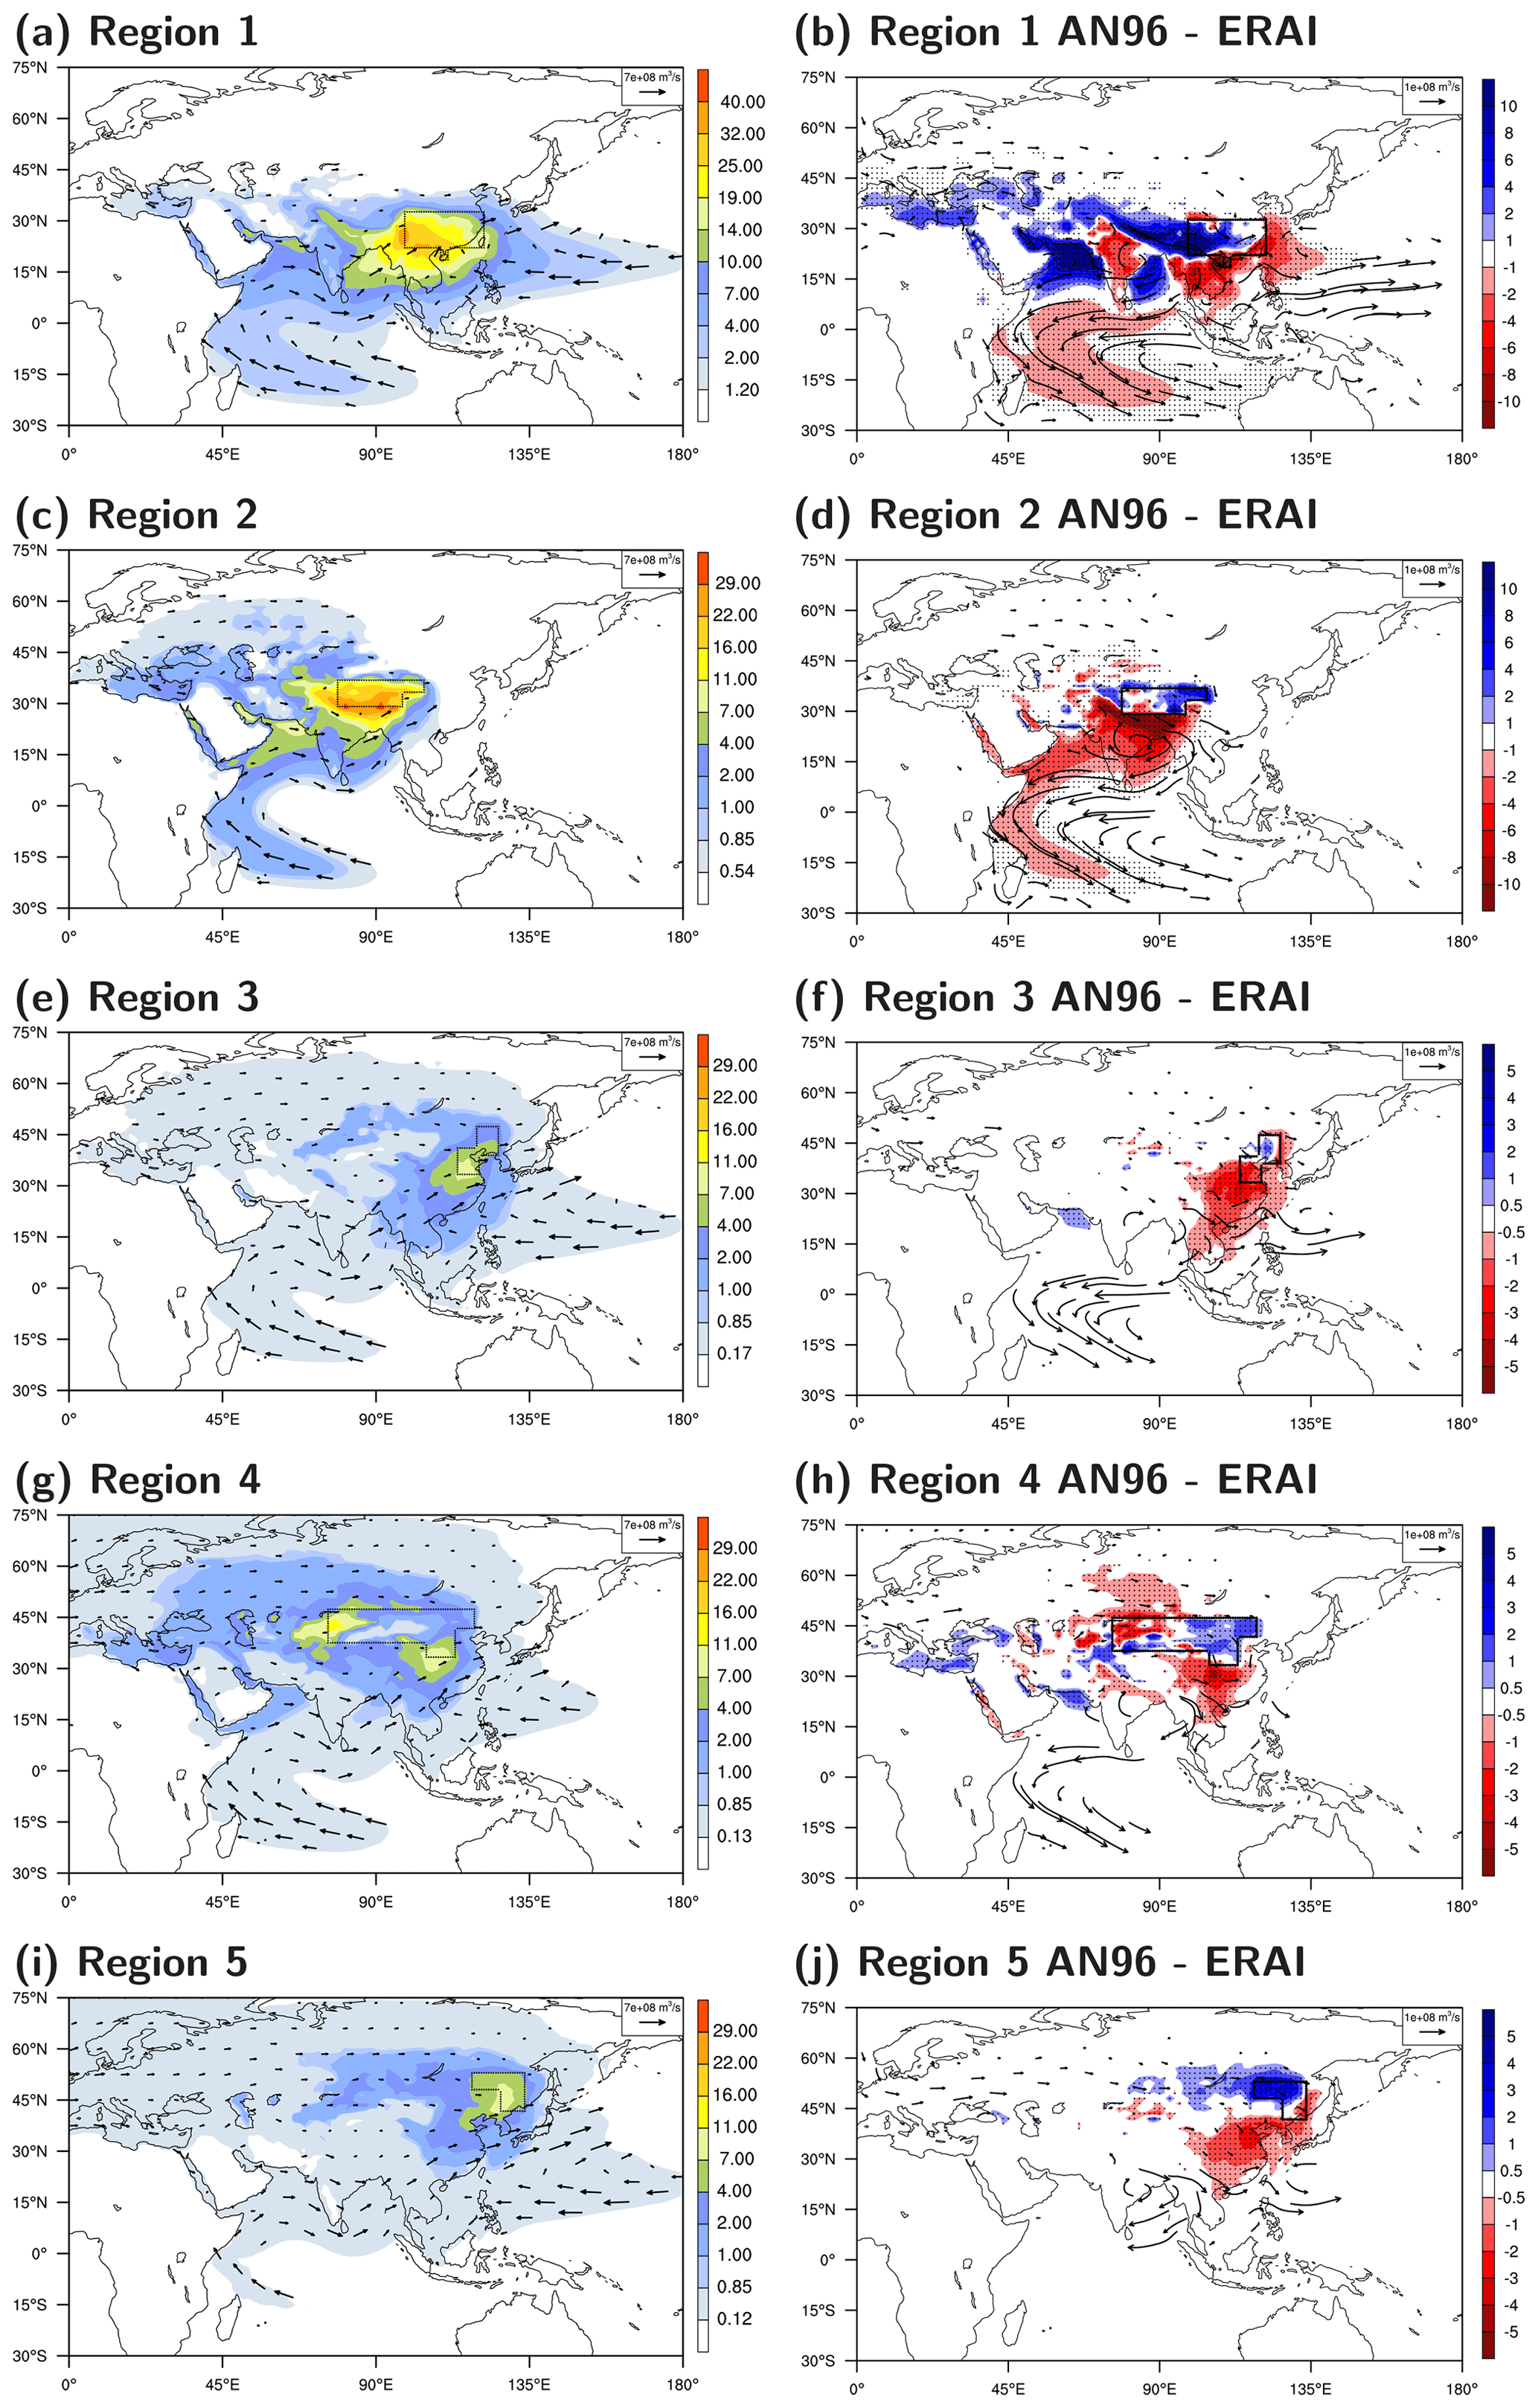
Figure 4Annual mean moisture source for EA subregions (a, c, e, g and i; units: mmpermonth) and vertically integrated moisture flux (vector; units: m3 s−1) calculated from ERA-Interim. Moisture source accounts for 80 % of precipitation are shown. Difference in annual mean moisture sources between AN96 and ERA-Interim (b, d, f, h and j; units: mmpermonth). The black box in each panel indicates the target region.
Aforementioned precipitation biases are also reflected in the seasonal and regional mean precipitation over EA subregions (Fig. 3). Both ERA-Interim reanalysis and MetUM simulations overestimate precipitation over southeastern EA (region 1) with MetUM simulations having larger biases. Precipitation biases over the Tibetan Plateau (region 2) are high in both reanalysis and simulations. With an increase in horizontal resolution, precipitation biases in MetUM simulations decrease, especially from low resolution (N96) to medium resolution (N216). This is related to better representation of topography in simulations with higher resolutions. A detailed analysis about resolution-related moisture source change will be given in Sect. 4.1. Precipitation biases over regions 3 and 4 are smaller in coupled simulations than that in atmosphere-only simulations, especially, in June–July–August (JJA) and in medium-/high-resolution simulations. This difference is due to the fact that the strength of the western North Pacific subtropical high (WNPSH) is weaker in coupled simulations. The weak WNPSH in the coupled simulations reduces moisture transport from low latitude (i.e. region 1) to midlatitude (regions 3 and 4) and therefore reduces the positive precipitation biases (Fig. 4f and h). The weak WNPSH in coupled simulations has also been identified in previous studies (Rodríguez et al., 2017).
Both increasing horizontal resolution and introducing air–sea coupling in MetUM can improve precipitation simulation over EA; however, these improvements cannot sufficiently correct precipitation biases against observation. To further investigate these biases, moisture sources of EA precipitation are tracked and compared against those from reanalysis.
3.2 Moisture source
As mentioned earlier, due to the inhomogeneity of EA precipitation, EA is divided into five subregions (as in Fig. 1). The moisture source for each subregion is investigated separately. Figure 4 shows the annual mean moisture source and vertically integrated moisture flux calculated from ERA-Interim, as well as differences between AN96 and ERA-Interim. Compared to ERA-Interim, AN96 takes up less moisture from low latitudes but more from midlatitudes for all EA subregions. These differences in moisture source are largely associated with differences in moisture fluxes (Fig. 4b, d, f, h and j). In AN96, the cross-equatorial flow along the Somali jet is too weak but the midlatitude westerly is too strong. The moisture flux over region 1 is too zonal, which has coexisted with a weak WNPSH (the cyclonic moisture flux anomaly shown in Fig. 4b). It is difficult to separate the causal relationship between the strong zonal monsoon flow and the weak WNPSH. However, these differences cause less moisture to be transported to midlatitude EA subregions from low-latitude land masses, which causes a negative moisture source change from the southeastern EA to regions 3–5 (Fig. 4f, h and j). Over the Tibetan Plateau, AN96 takes up less moisture over the whole moisture source domain, except the local source over eastern Tibet. This explains the lower seasonal mean precipitation over the Tibetan Plateau in all simulations (Fig. 3b).
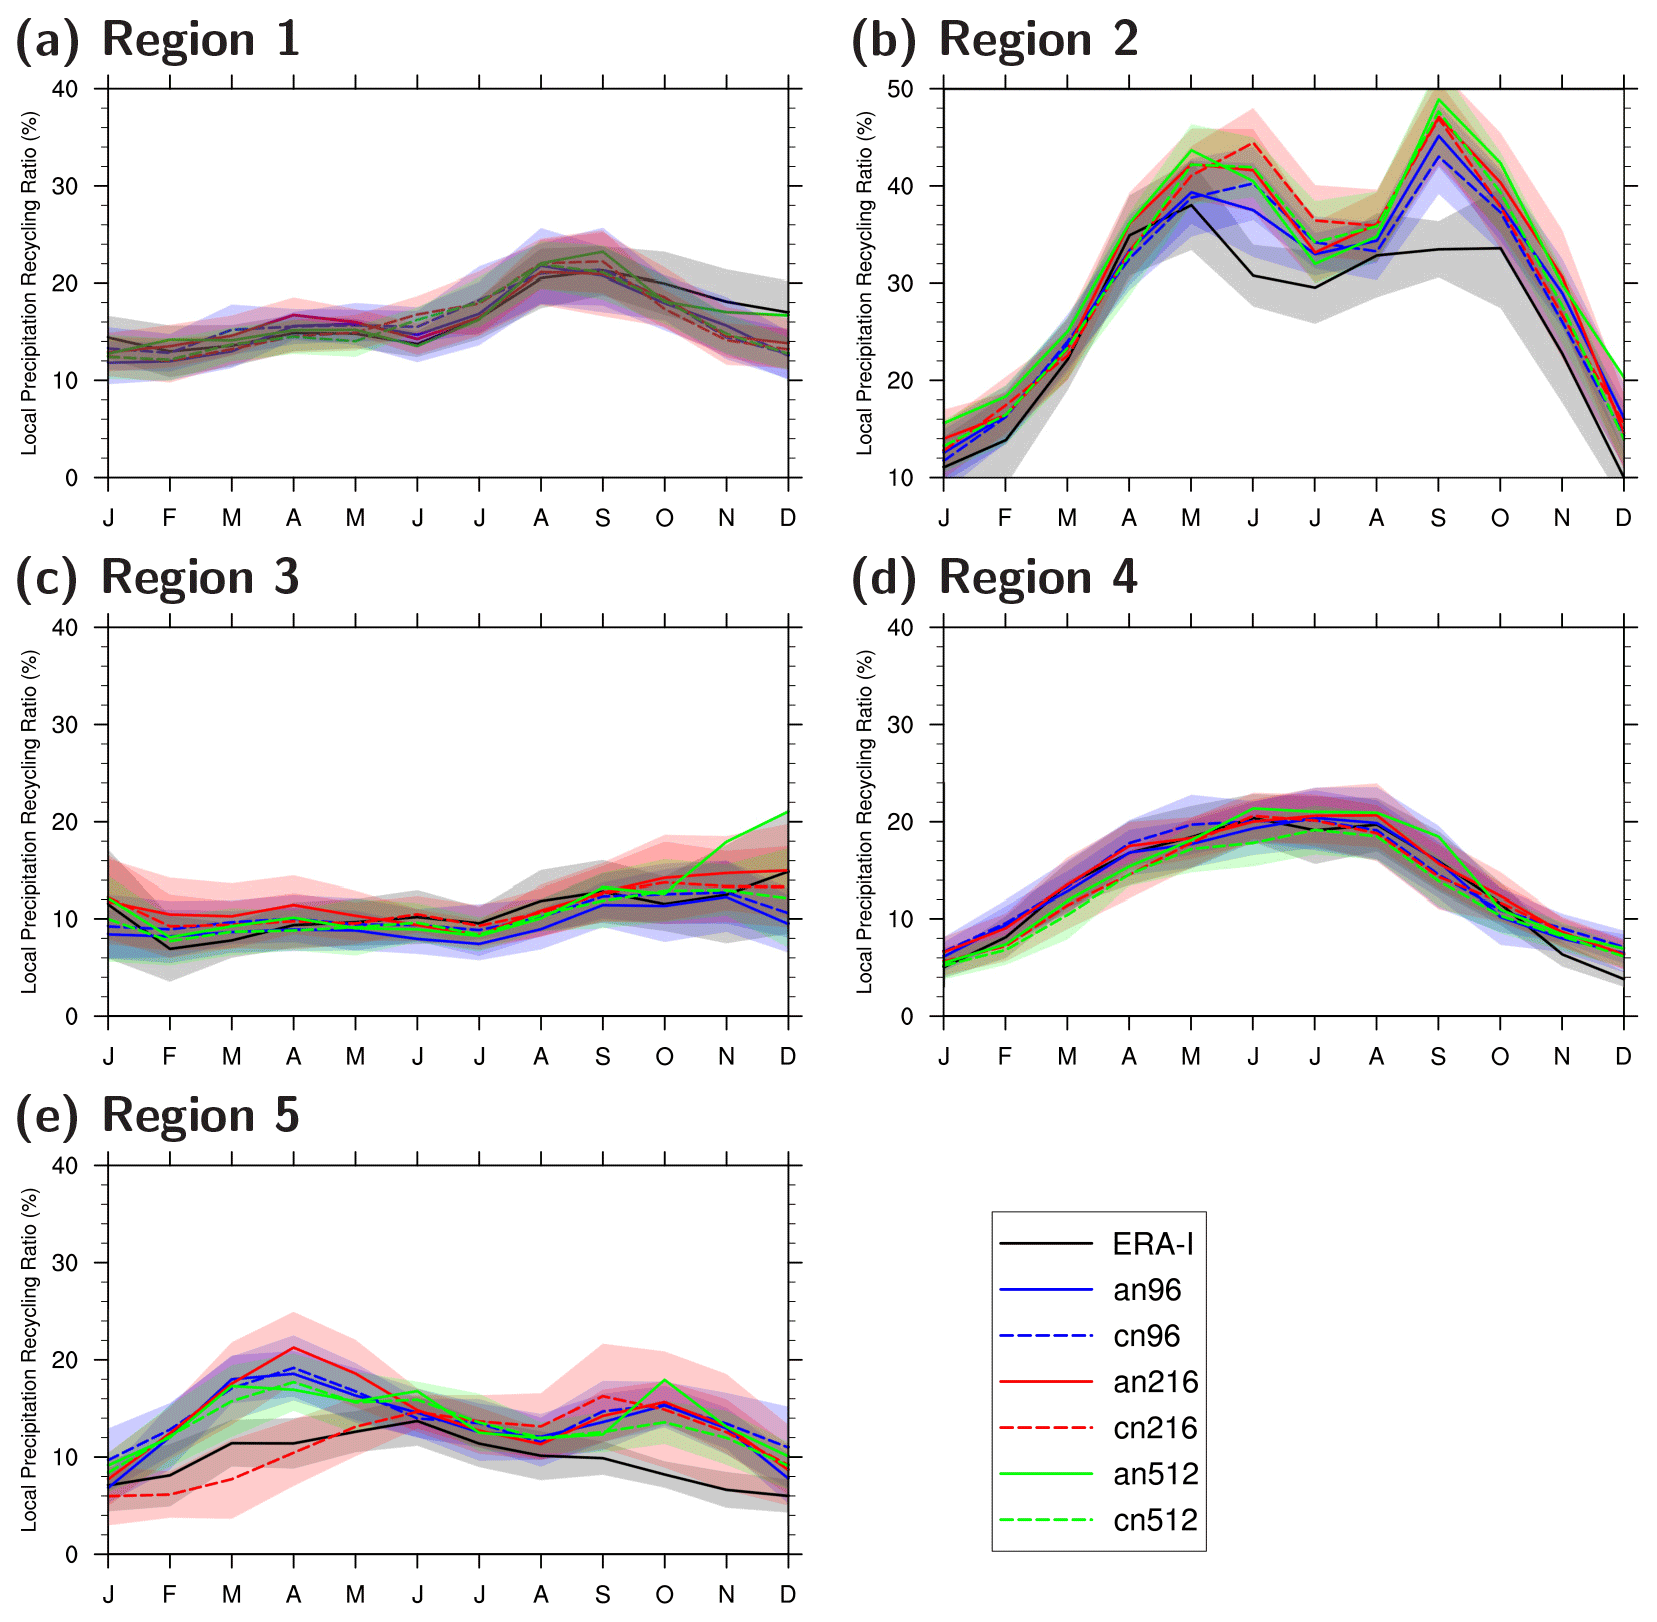
Figure 5Annual cycle of the mean precipitation recycling ratio for EA subregions calculated from ERA-Interim and simulations (units: %). Shaded bands represent ± 1σ.
Table 2Root-mean-square deviation of monthly precipitation recycling ratio (%) measured between MetUM simulations and ERA-Interim over five EA subregions.
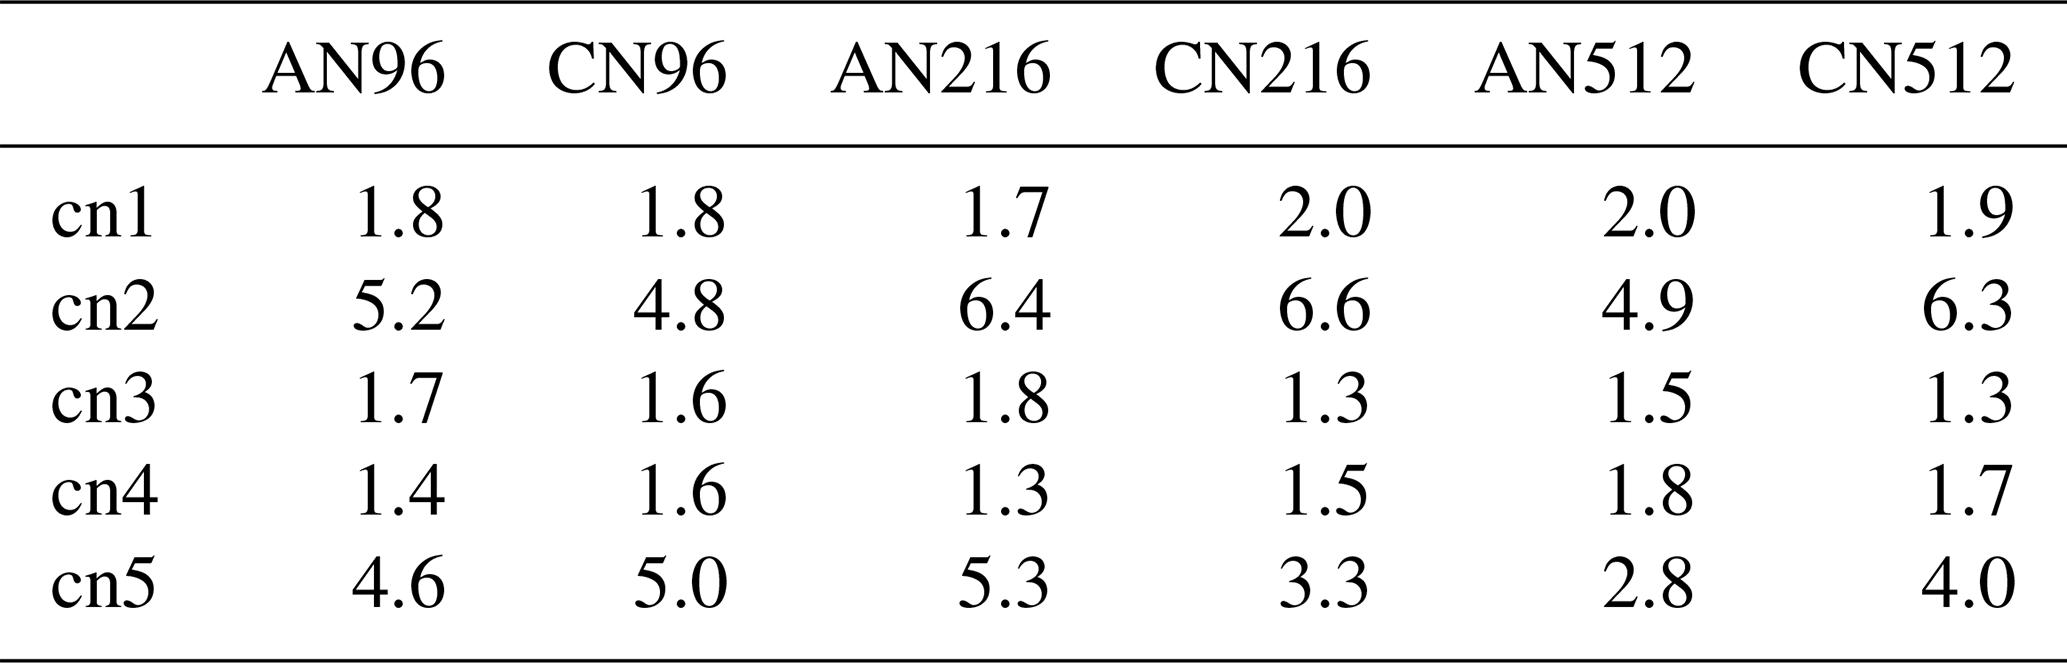
The local moisture source is measured using the precipitation recycling ratio. The precipitation recycling ratio is defined as the proportion of precipitation in the target region that is contributed from the evaporation over the same region. Figure 5 shows the annual cycle of the precipitation recycling ratio calculated from ERA-Interim and MetUM. MetUM can produce similar annual cycles and magnitudes of the precipitation recycling ratio over regions 1, 3 and 4 (Table 2) but overestimates the recycling ratio over regions 2 (summer and autumn) and 5 (spring and autumn). However, from maps of moisture sources (Fig. 4), we learn that the precipitation recycling ratios in simulations are not closely matched with the distribution in ERA-Interim.
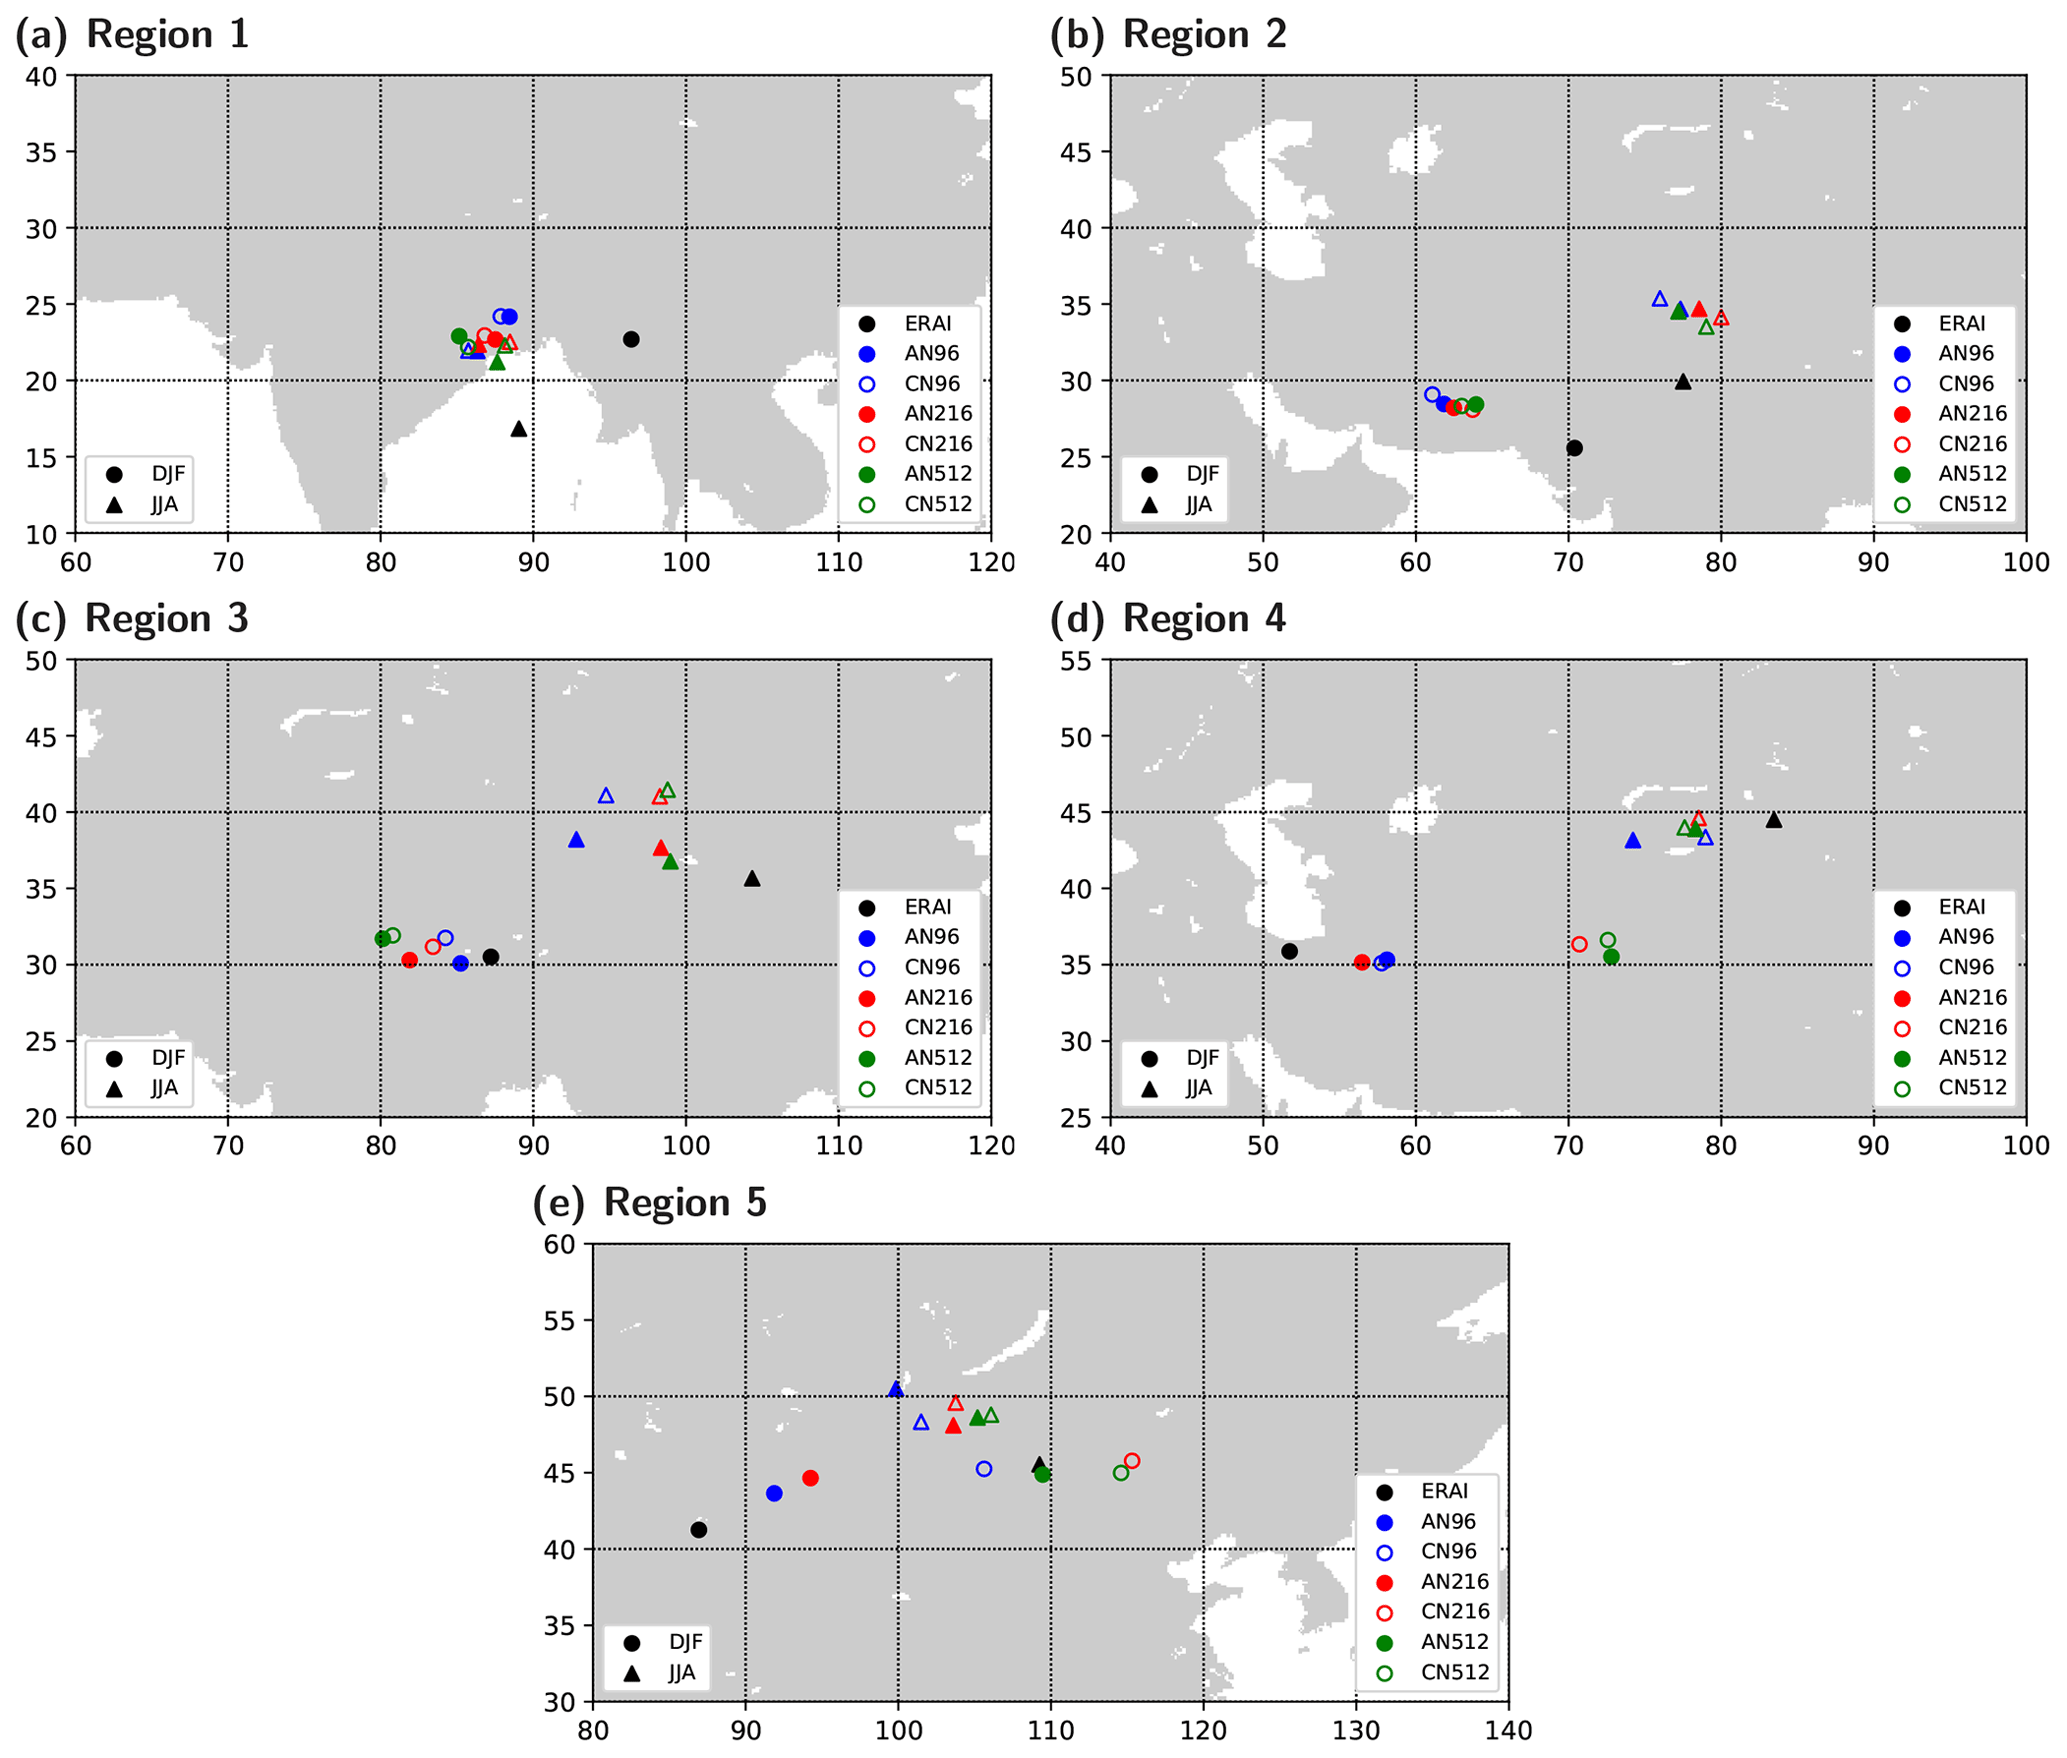
Figure 6Mass centres of moisture source in DJF and JJA for regions 1–5 from ERA-Interim and MetUM simulations.
The remote moisture source is first compared using its shape. Due to the number of datasets used in this study, it would be lengthy to show maps of moisture source one by one. Therefore, instead of showing maps of moisture sources, mass centres of moisture sources from different datasets are calculated and compared collectively. Figure 6 shows mass centres in DJF and JJA. Mass centres are measured using moisture sources that account for 80 % of precipitation in target regions, similar to those in Fig. 4. Mass centres have also been measured using threshold at 50 % and 65 % of precipitation; results are consistent and not sensitive to the choice of threshold. As shown in Fig. 6, mass centres of moisture sources in simulations show consistent seasonal variations as in reanalysis. However, there are systematic differences between simulations and reanalysis as well as among simulations themselves.
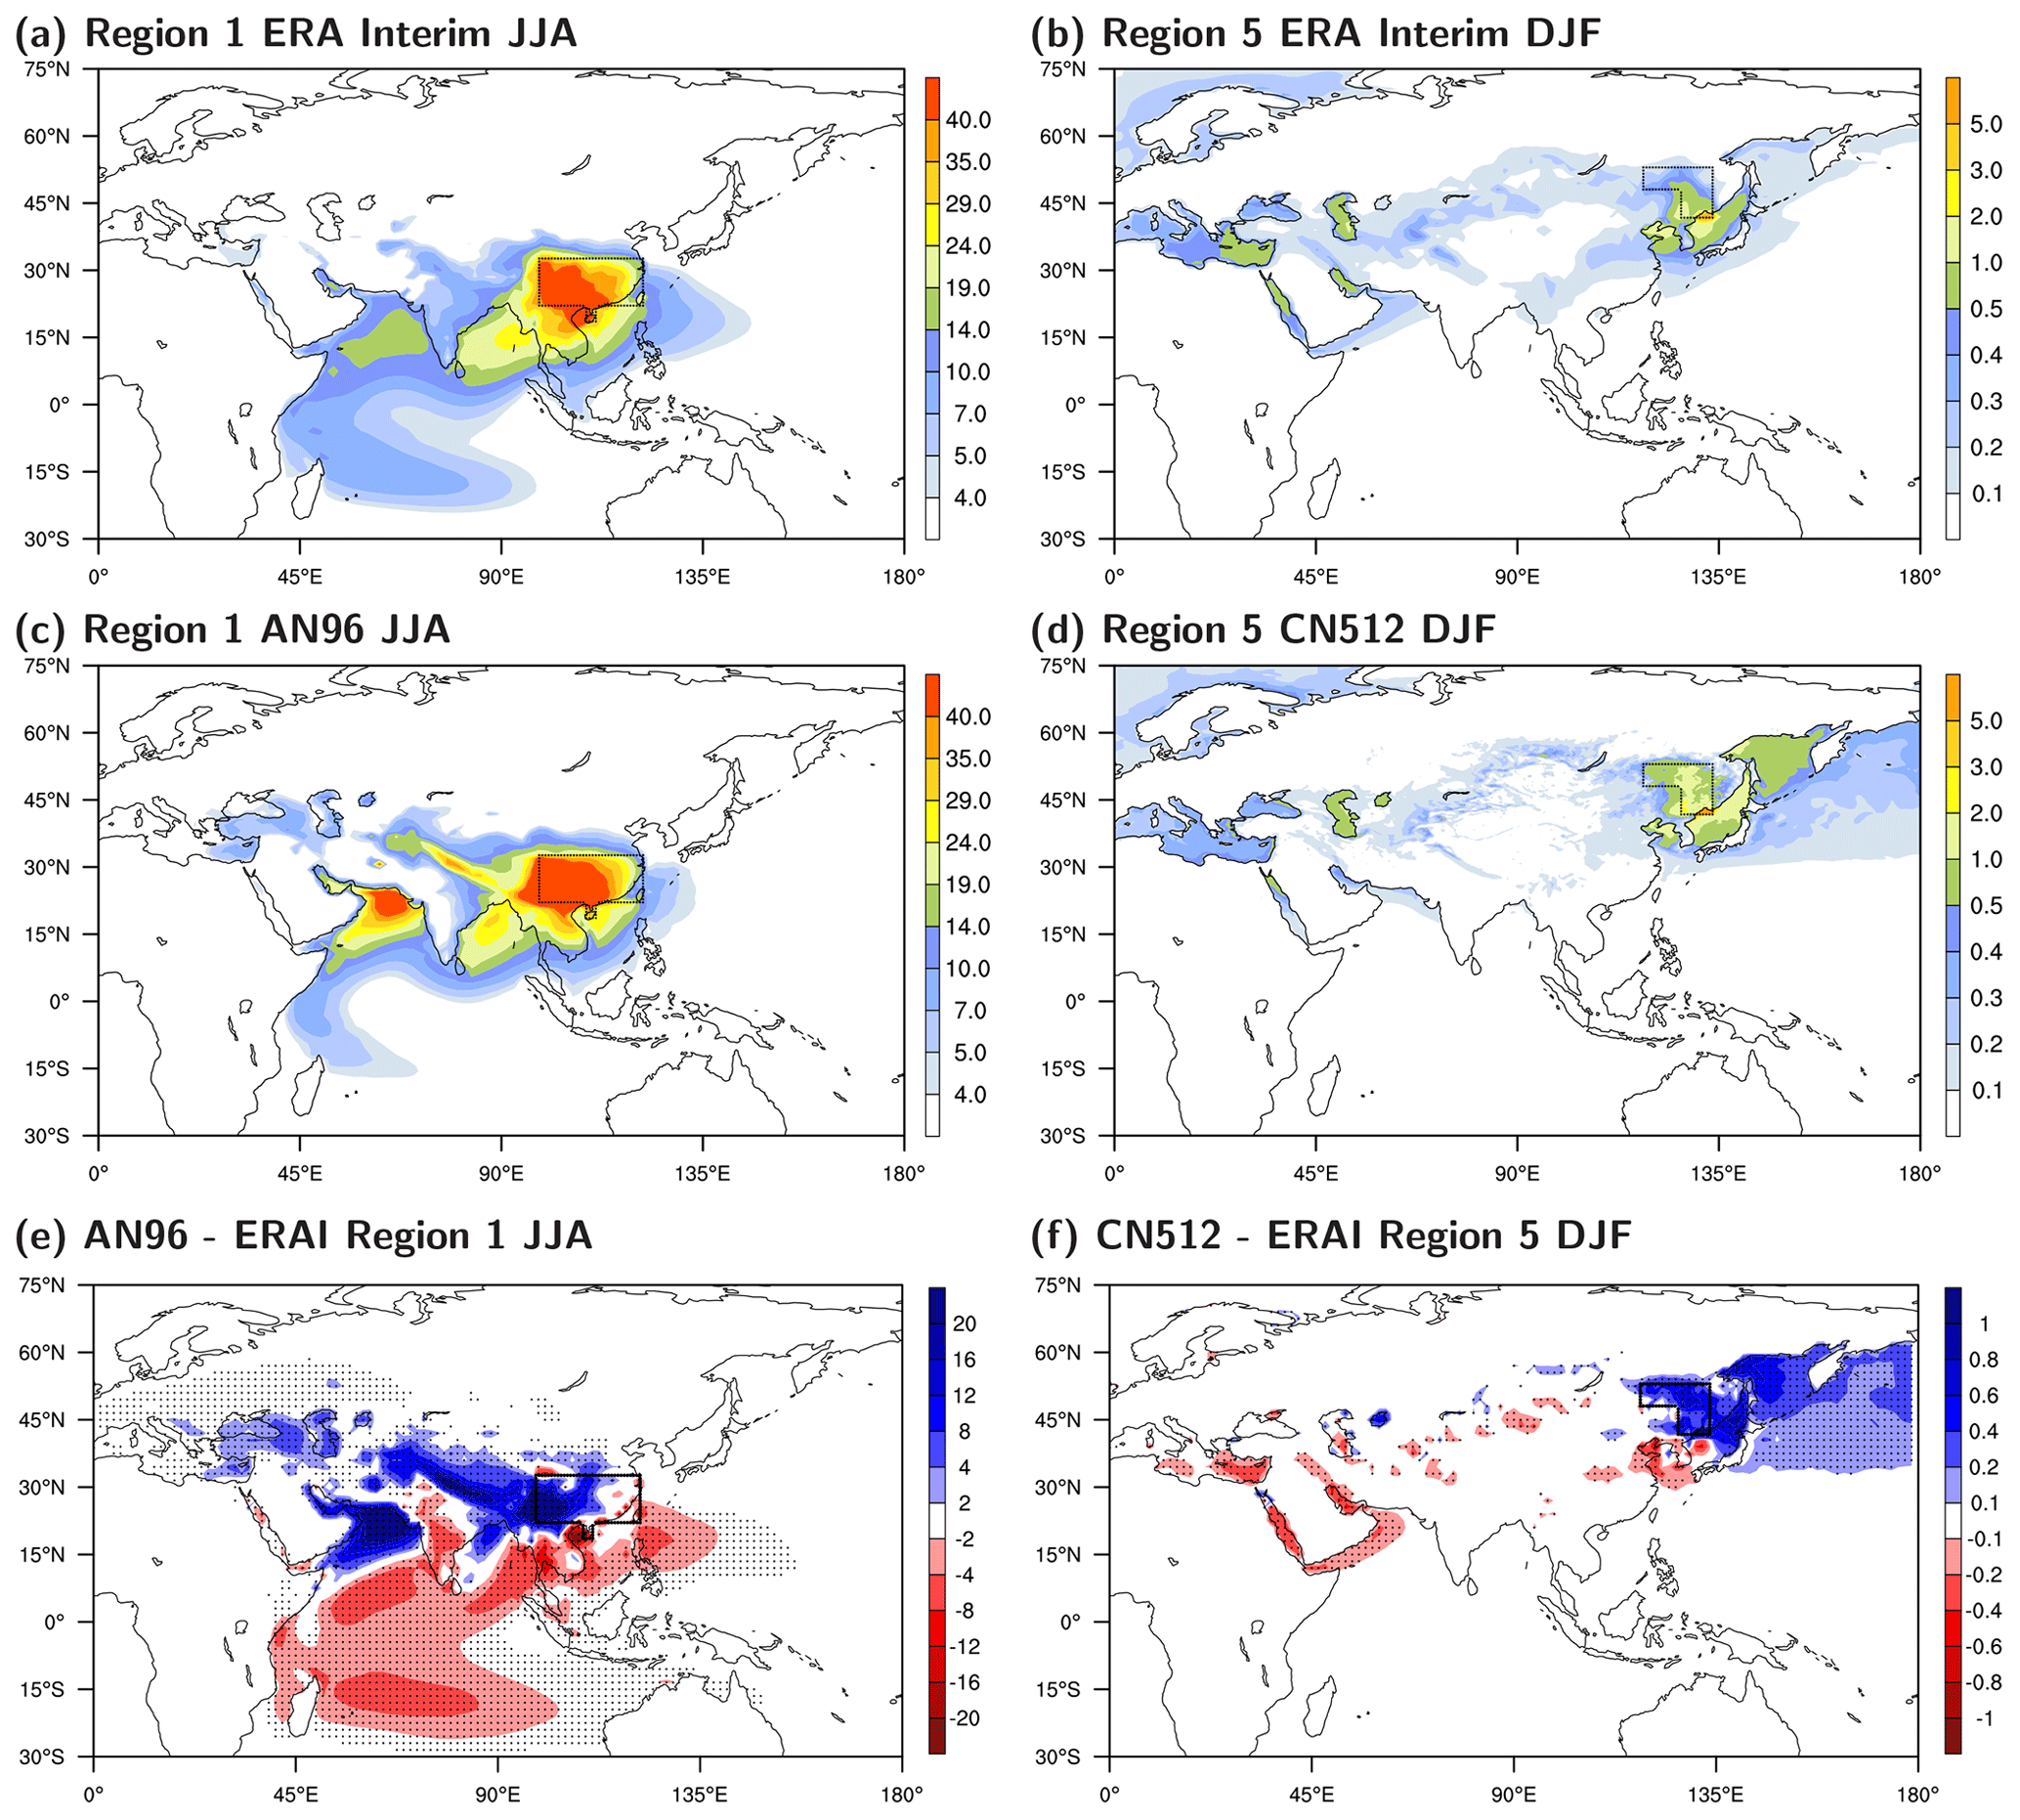
Figure 7Moisture source during JJA for region 1 from ERA-Interim (a) and AN96 (c). Moisture source during DJF for region 5 from ERA-Interim (b) and CN512 (d). Difference of moisture source in region 1 JJA: (e) between AN96 and ERA-Interim (f); between CN512 and ERA-Interim (units: mmpermonth). The black box in each panel represents target regions. Details of the division can be found in Fig. 1.
Over region 1 during JJA, mass centres of MetUM are located approximately 5∘ to the north compared to ERA-Interim (triangles in Fig. 6a). Similar to difference in the annual mean moisture source (Fig. 4b), this is due to the weak cross-equatorial moisture transport over the tropical Indian Ocean (Fig. 7e). Over the same region in DJF, mass centres of MetUM are located 10∘ to the west compared to ERA-Interim (circles in Fig. 6a), which is related to the stronger DJF westerly moisture flux. Similar shifts of both JJA and DJF mass centres are also seen over regions 2 and 3 (Fig. 6b and c).
The northward shift of JJA mass centres over regions 4 and 5 is lower, as these midlatitude regions are less impacted by the EA summer monsoon and therefore by the moisture flux bias over the tropical Indian Ocean. Over regions 4 and 5 during DJF, on the other hand, mass centres of MetUM are located to the east compared to ERA-Interim, especially in high-resolution simulations, i.e. CN216, AN512 and CN512, in which the eastward deviation is as large as 30∘ along the longitude (circles in Fig. 6d and e). Comparing CN512's moisture source over region 5 DJF to that of ERA-Interim (Fig. 7b, d and f), CN512 picks up more moisture from Pacific Ocean (seas of Japan and Okhotsk); while in ERA-Interim, more moisture is picked up from west, especially over the Mediterranean Sea, Red Sea and Persian Gulf. There is a low-/high-resolution division among simulations. More details about this division will be discussed in Sect. 4.3.
Table 3Annual and seasonal mean contributions to regional precipitation (regions 1–5, units: %) from the tropical ocean (Ts), tropical land (Tl), extratropical ocean (Xs), extratropical land (Xl) and local precipitation recycling (ρ). The solstice latitudes (23.4∘ N and 23.4∘ S) are used to separate the tropics and the extratropics. In each column, seven values represent seven datasets, shown in order as ERA-Interim, AN96, CN96, AN216, CN216, AN512 and CN512. Values with boldface highlight the difference that is discussed in Sect. 4.3.
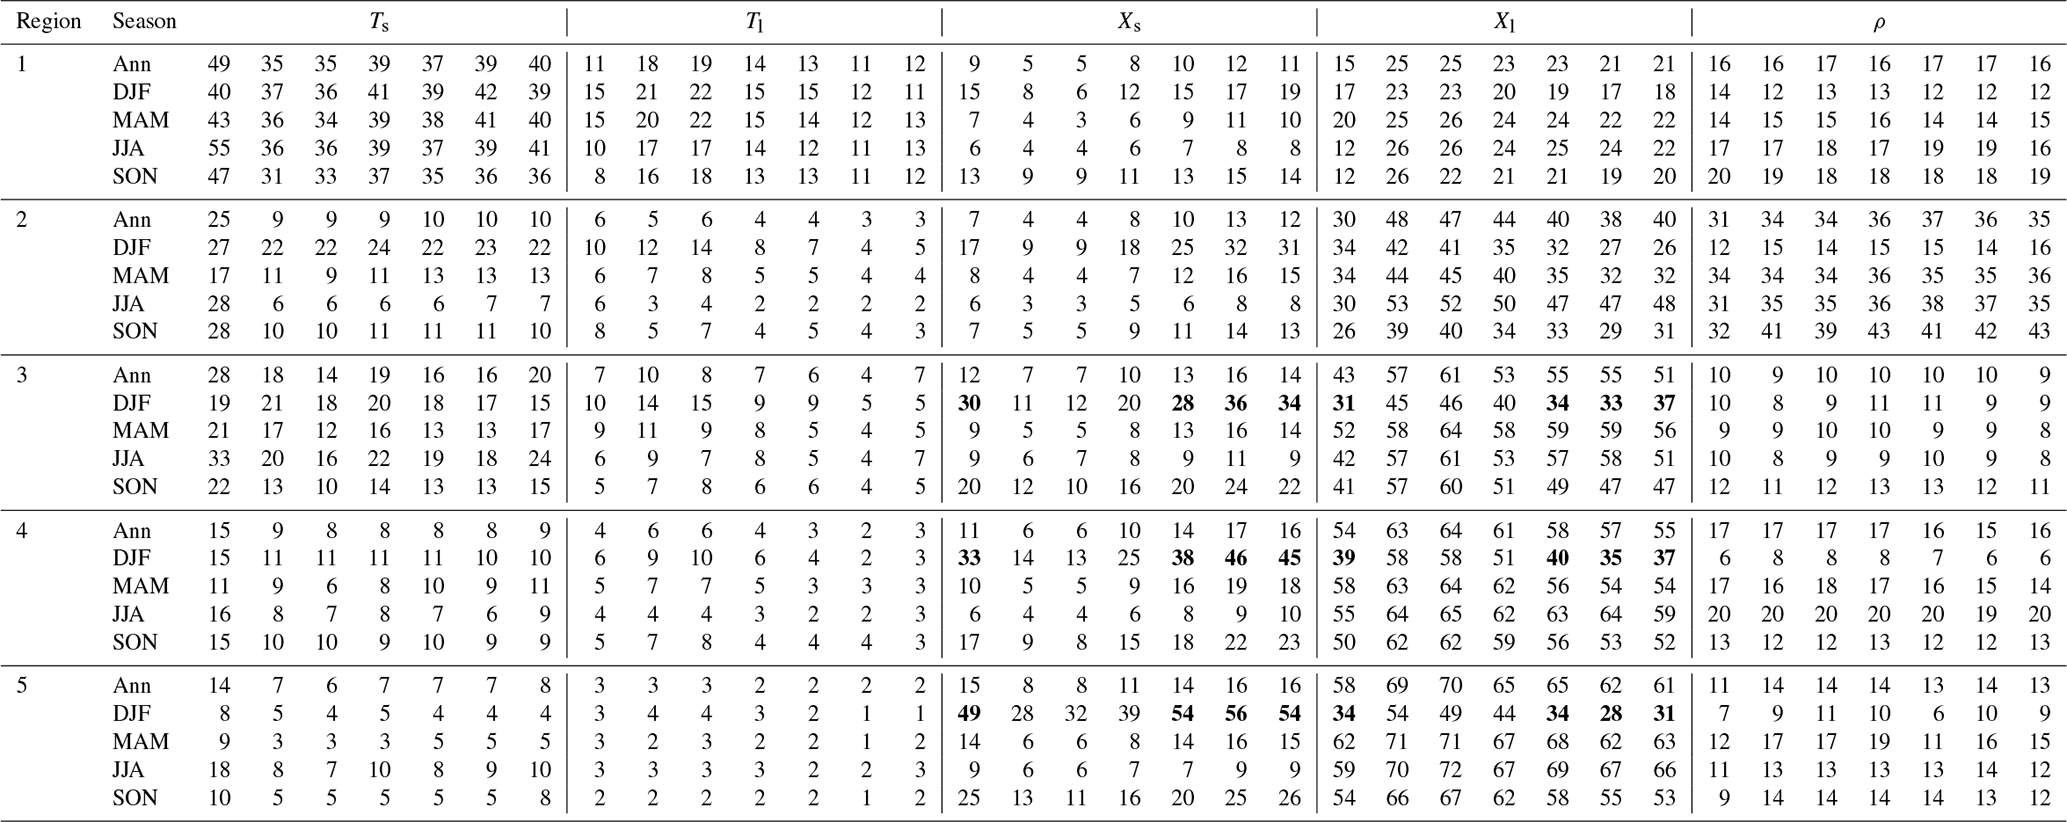
The remote moisture source is further divided into four sections (tropical sea, tropical land, extratropical sea and extratropical land); together with local moisture source (measured by precipitation recycling ratio), contributions (both annal and seasonal means) from these sections are listed in Table 3 for both simulations and reanalysis. In annual mean, simulations reproduce the primary moisture sources for each EA subregion, i.e. the tropical sea for region 1 and the extratropical land for regions 2–5. However, the contribution from tropical sea is smaller in all simulations, which reflects the aforementioned negative moisture source difference over the tropical Indian Ocean. Instead, the contribution from extratropical land is greater in all simulations. In seasonal mean, however, discrepancies between simulations and reanalysis are greater, even the primary moisture source is different (as boldface values highlighted in Table 3). These seasonal discrepancies will be discussed in Sect. 4.3.
In the previous section, diagnoses of both precipitation and moisture source show that MetUM simulations are systematically different from ERA-Interim. By increasing horizontal resolution or including coupling, the gap between simulations and reanalysis cannot be bridged. On the other hand, however, diagnoses also show variations/improvements in precipitation and moisture source with changes in both resolution and coupling. Therefore, changes in moisture sources due to model resolution and coupling are discussed; links from changes in moisture source to precipitation are made in the section.
4.1 Change with resolution
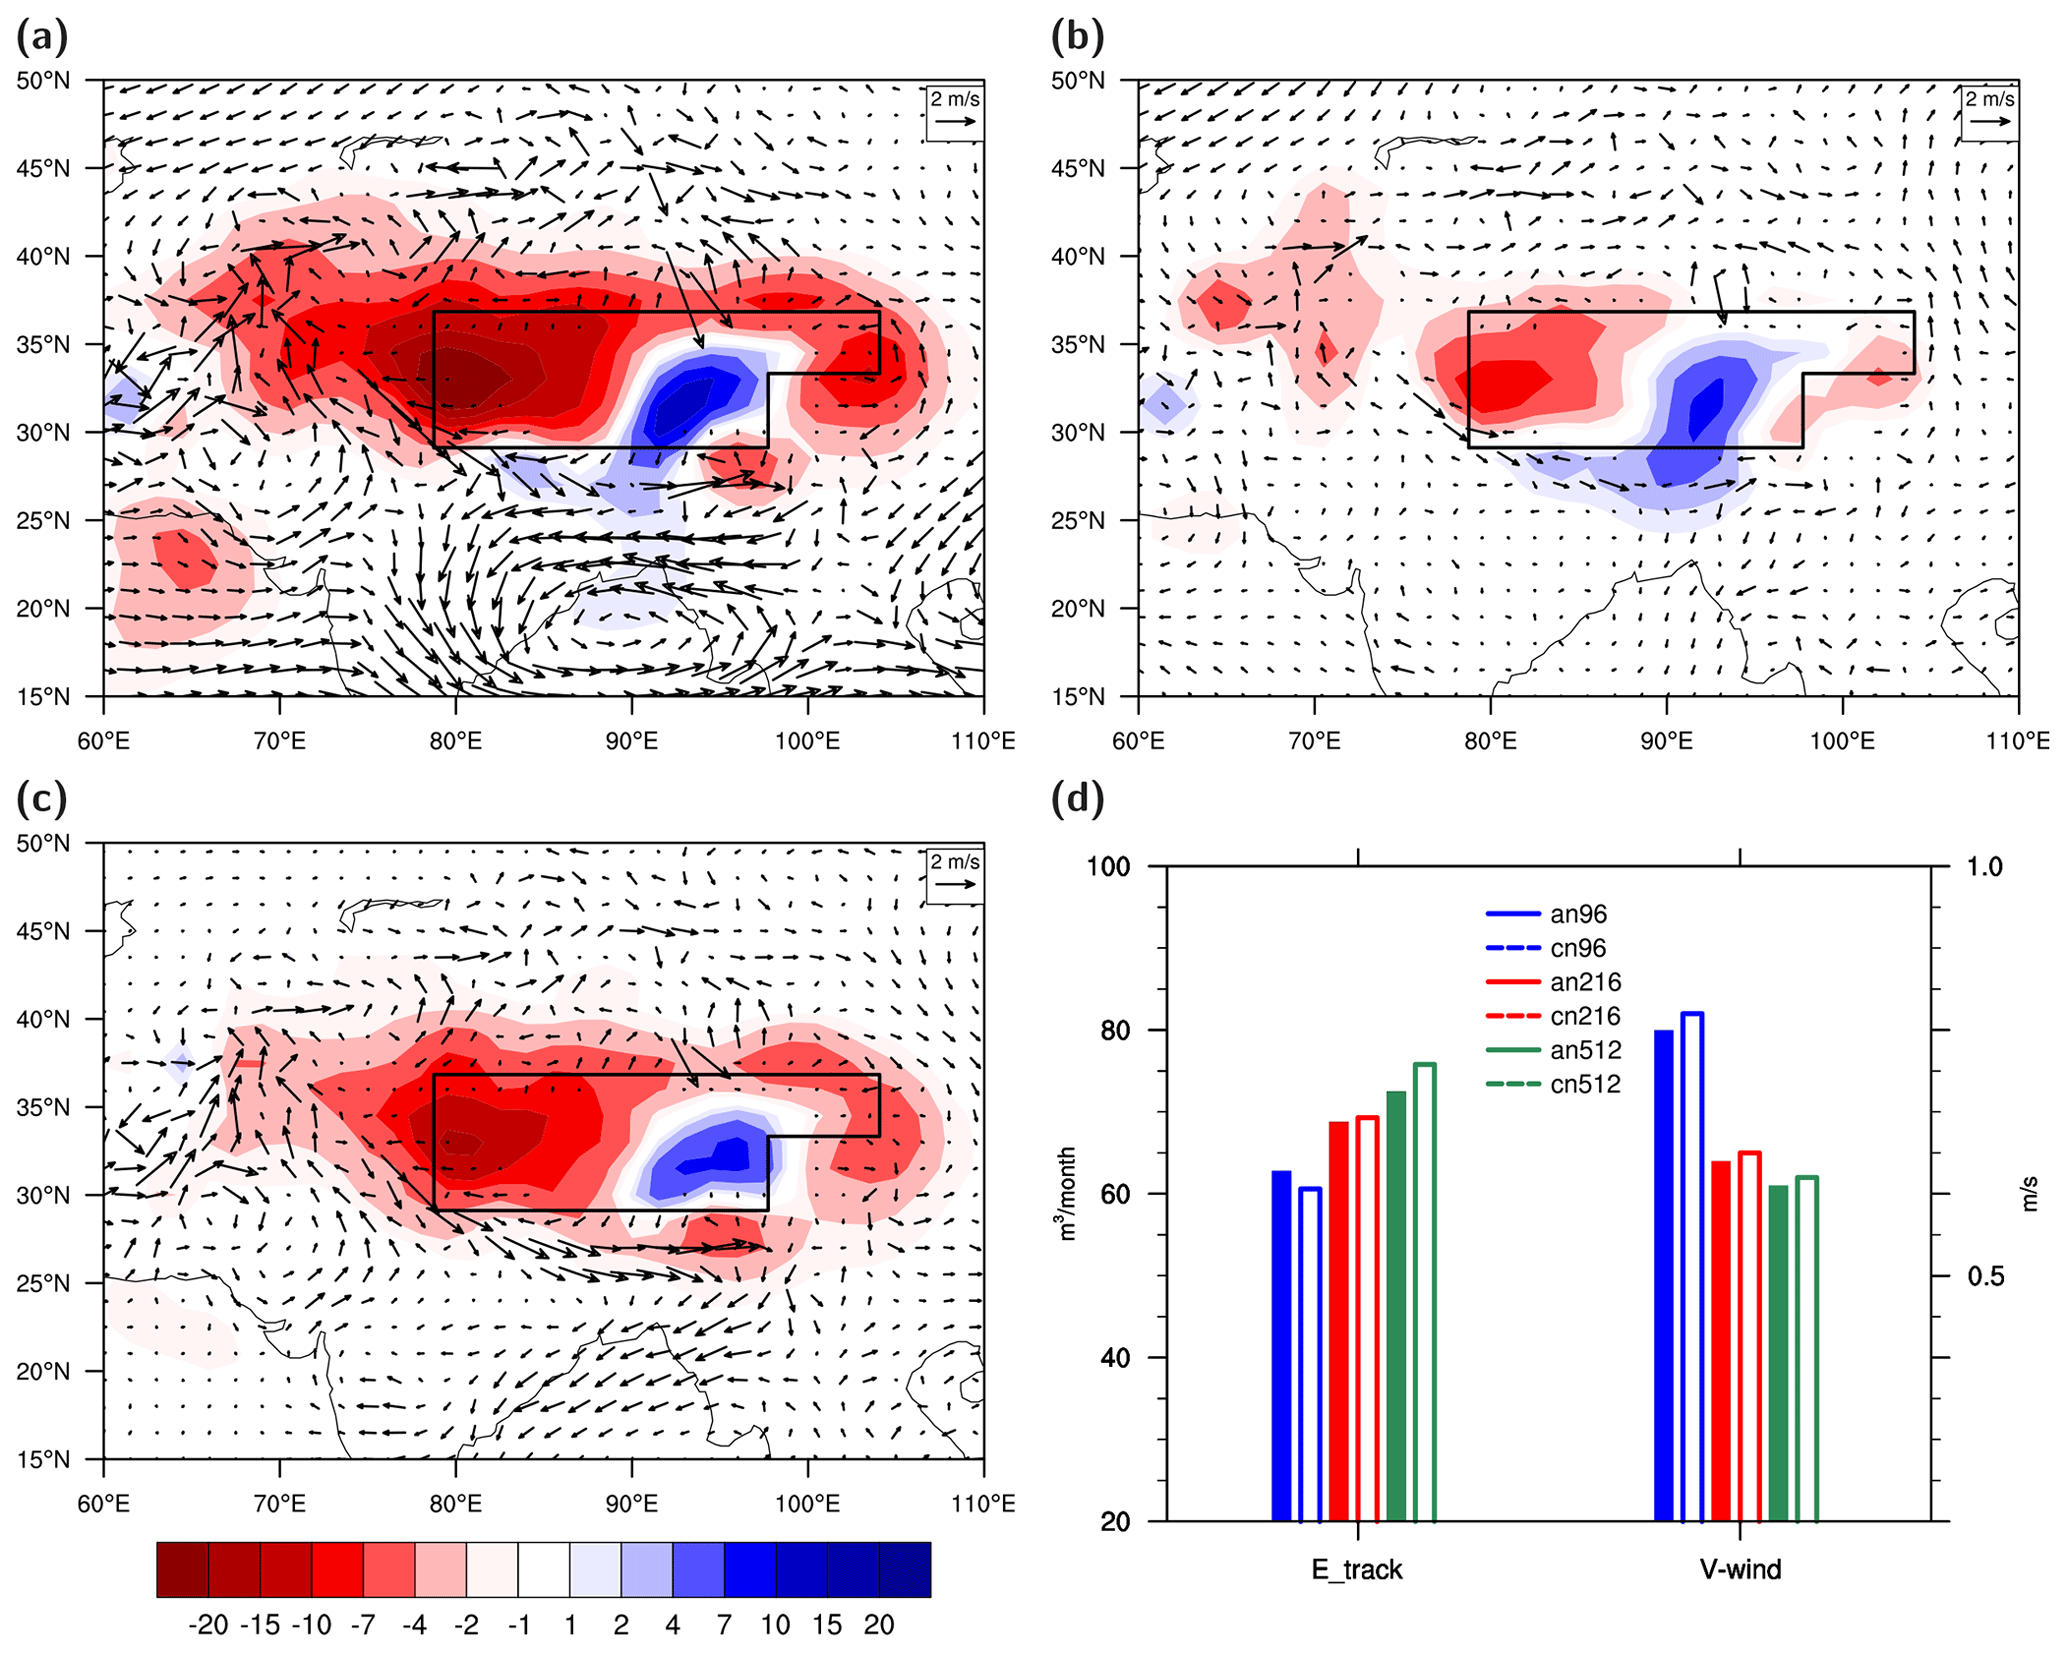
Figure 8Difference of tracked evaporation (colour; units: mmpermonth) and 700 hPa wind (vector; units: m s−1) in JJA over the Tibetan Plateau (region 2) between (a) CN512 and AN96; (b) CN512 and CN216; and (c) CN216 and CN96. (d) Seasonal mean tracked evaporation (E_track; units: m3permonth) over eastern Tibet and the 700 hPa meridional wind (V wind; units: m s−1) along the southern boundary of the eastern Tibetan Plateau.
As shown in Fig. 3b, over the Tibetan Plateau, precipitation bias in simulations is reduced compared to ERA-Interim. By comparing moisture source, this reduction is due to a weaker simulated remote moisture source/flux (Fig. 4d). Precipitation bias is further reduced with an increase in horizontal resolution (Fig. 3b), which is consistent with previous studies showing that the higher the horizontal resolution is, the more remote moisture is blocked by the Himalayas (Curio et al., 2015). On the other hand, the precipitation recycling ratio increases with horizontal resolution (Fig. 5b), which indicates that, with reduced remote moisture contribution, the local moisture source becomes more important over Tibet. Figure 8a–c show that this intensified local source is located mainly over eastern Tibet. This is because eastern Tibet has greater precipitation (Fig. 2) and the remote moisture is transported into Tibet via meridionally oriented valleys along its southeastern boundary. With reduced remote moisture flux caused by increased resolution along its boundary, the moisture source for this region shifts from a remote to a local source. This is also demonstrated as opposite trends in tracked local evaporation (increase) and low-level wind (decrease) shown in Fig. 8d.
4.2 Change with coupling

Figure 9Differences in moisture source for precipitation over region 1 JJA between air–sea coupled and atmosphere-only simulations: (a) CN96 minus AN96, (b) CN216 minus AN216 and (c) CN512 minus AN512 (units: mmpermonth). Vectors are differences in the vertically integrated moisture flux (units: ). (d) Mean evaporation (bars with outline only; units: m3permonth), mean zonal wind (dot; units: m s−1) and sea surface temperature anomaly from observation (filled bar; units: K) over the Arabian Sea (AS) and South China Sea (SCS).
To investigate the impact of air–sea coupling on moisture source, we focus on region 1, where ocean is the major contributor (according to Table 3). Differences in moisture source over region 1 in JJA between coupled and atmosphere-only simulations are shown in Fig. 9. As shown in Fig. 9a–c, whatever the horizontal resolution is, coupled simulations show consistent differences against atmosphere-only simulations, which include a reduced moisture contribution from the Indian Ocean (Arabian Sea and Bay of Bengal) but an increased moisture contribution from the Pacific Ocean (South and East China seas). For the reduced moisture source over the Indian Ocean, it is linked to the cold SST bias, which has been reported in previous studies (Marathayil et al., 2013) and which is demonstrated in Fig. 9d. As shown in Fig. 9d, the averaged SST over the Arabian Sea shows a consistent negative anomaly in coupled simulations (filled bars on the left-hand side). On the other hand, over the Pacific Ocean, there is not a consistent SST bias associated with the increased moisture source. Instead, there is a consistent increase in low-level zonal wind in coupled simulations (dots on right-hand side of Fig. 9d). As mentioned in Sect. 3, this wind bias is due to the EA summer monsoon flow in coupled simulations being too zonal. Coexisted with this wind bias, is the weak WNPSH, which explains the cyclonic circulation anomaly over the southeast coast of EA. This cyclonic anomaly converges extra evaporation caused by positive zonal wind bias (via the wind–evaporation feedback; hollow bars on right-hand side of Fig. 9d) and increases the local moisture contribution over region 1.
Compared to atmosphere-only simulations, coupled simulations pick up less moisture from the Indian Ocean along summer monsoon flow but more from adjacent oceans due to a circulation difference. As a result, precipitation does not show obvious difference between coupled and uncoupled simulations averaged over region 1 (Fig. 3a).
4.3 Shift of major moisture source over midlatitude regions
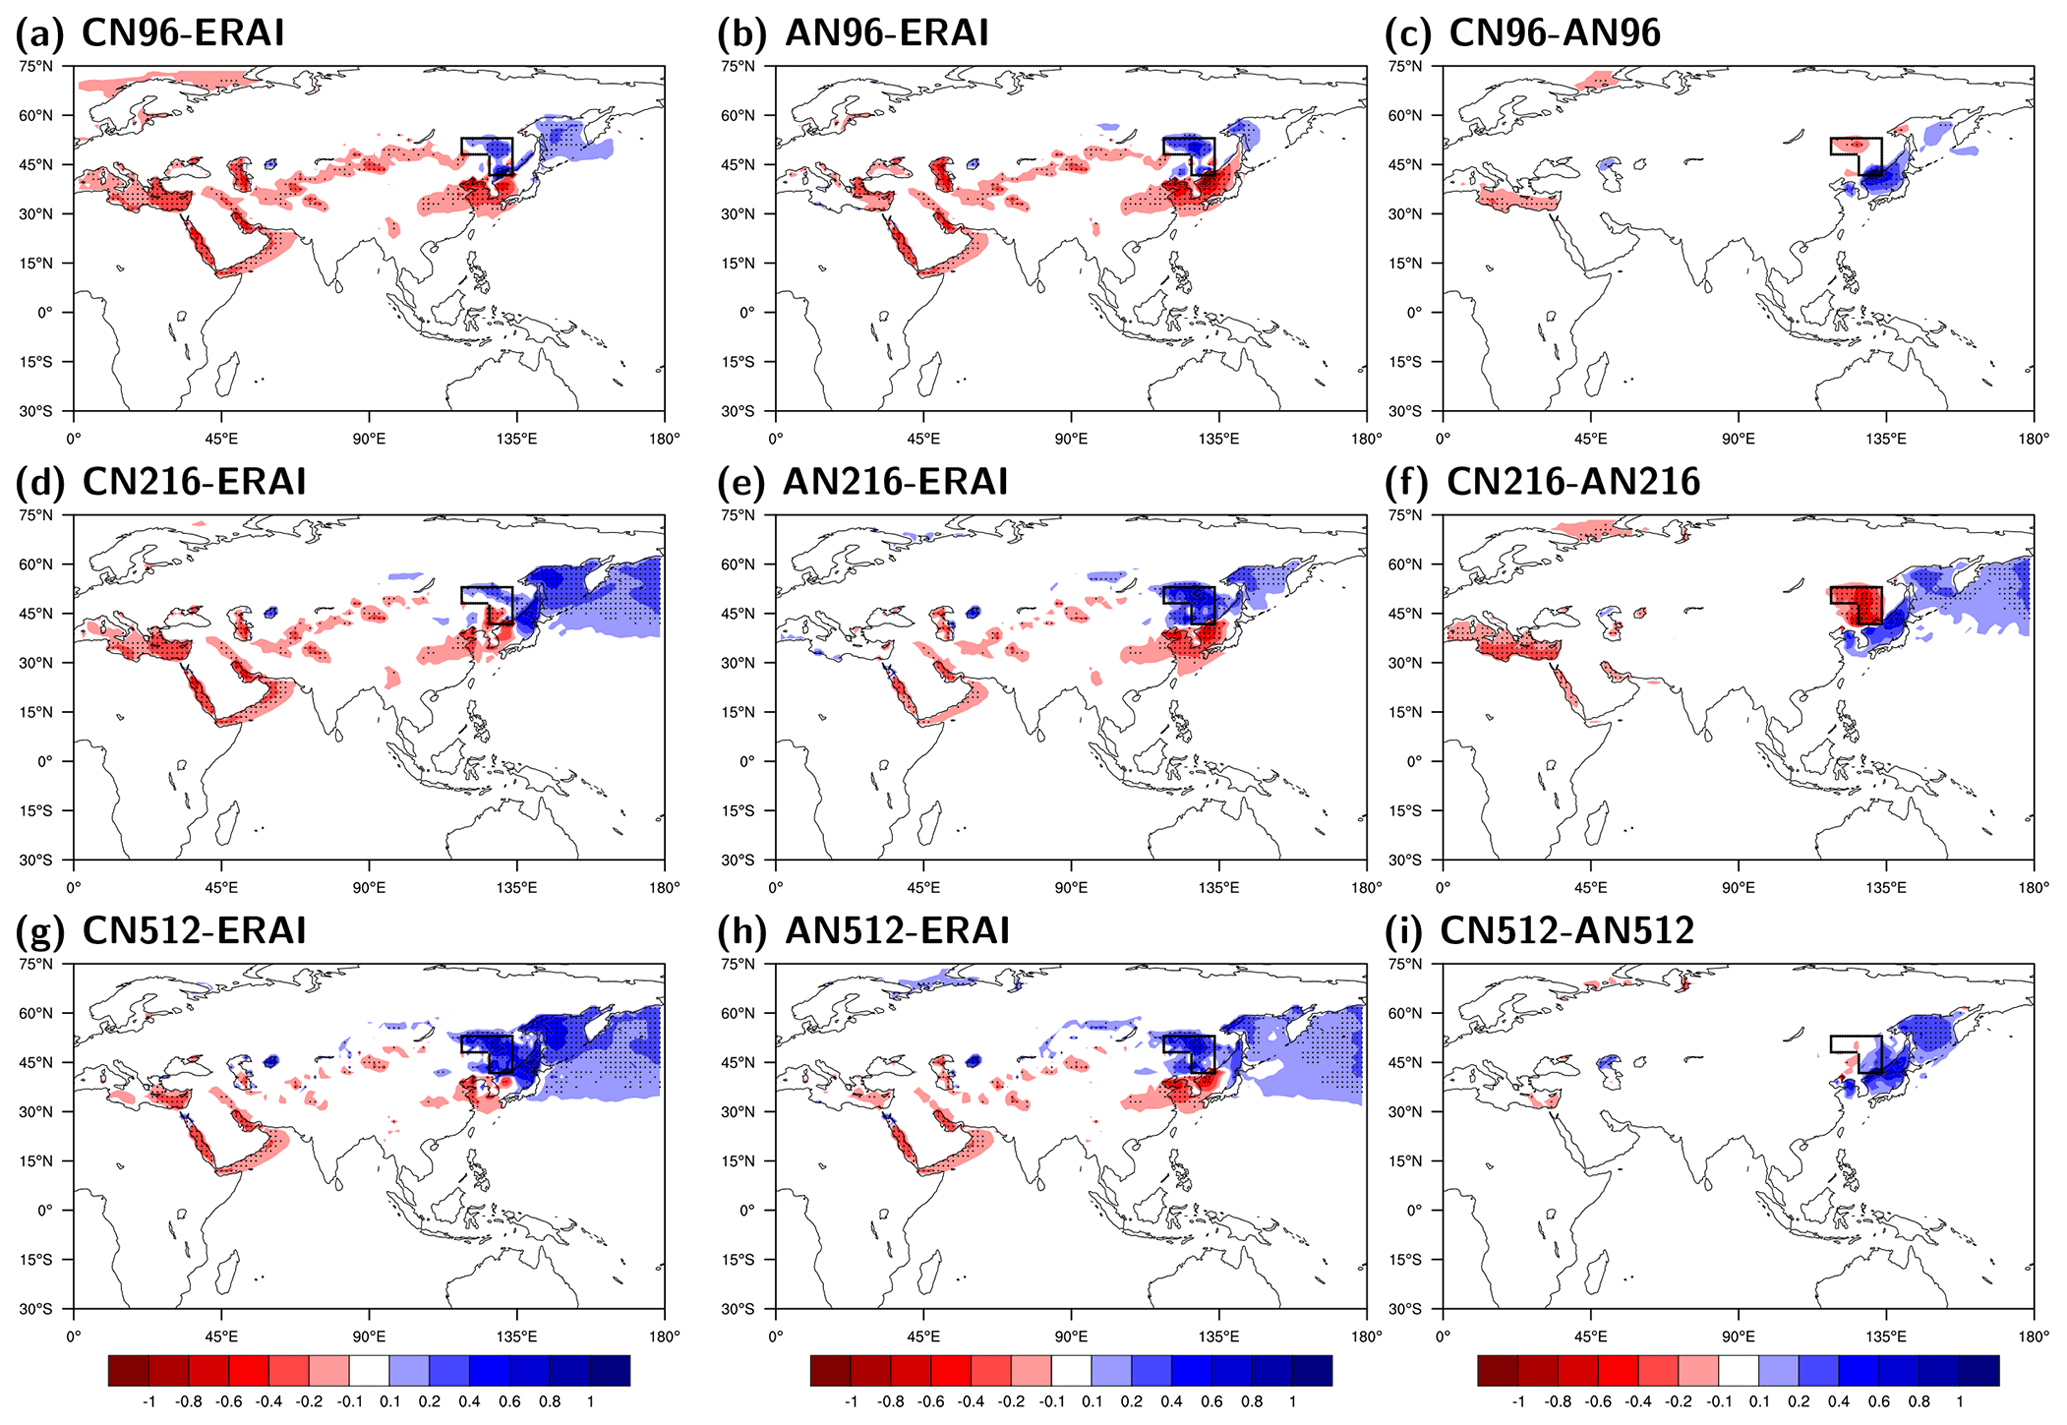
Figure 10Difference in moisture source for region 5 in DJF (units: mmpermonth).

Figure 11SST bias in MetUM coupled simulation in DJF (units: K).
In Sect. 3.2, it has been mentioned that simulated mass centres of moisture source for regions 4 and 5 are separated into two groups according to resolution (Fig. 6d and e). A similar division also exists among simulations when identifying the major moisture source for these regions (Table 3). In Table 3, moisture contribution from different remote sections (tropical sea, tropical land, extratropical sea and extratropical land) and local sources is estimated for precipitation over all EA subregions on both annual and seasonal scales. On an annual scale, the major moisture source for region 1 is tropical sea, but it is extratropical land for other subregions. This result is consistent among reanalysis and simulations. On a seasonal scale, however, results are inconsistent, especially for regions 4 and 5 in DJF. For regions 4 and 5 in DJF, in ERA-Interim, there is a shift of the major moisture source from extratropical land to extratropical sea (boldface values in Table 3). This shift is partly because the frozen land surface over the Eurasian continent in DJF reduces its evaporation and partly because the stronger midlatitude westerly brings in moisture from saturated surfaces west of target regions, such as the Mediterranean Sea, Black Sea and Caspian Sea (Guo et al., 2019). In simulations, this shift from land to sea is captured by simulations with higher horizontal resolutions, i.e. CN216, AN512 and CN512. However, maps of moisture source (Fig. 10) show that this shift is simulations is caused by the wrong reason. For region 5 in DJF, simulations pick up more moisture from the adjacent Pacific Ocean but less moisture from water bodies to the west. This difference is greater in coupled simulations and in simulations with higher horizontal resolution. In DJF, the land moisture source plays a minor role, due to its frozen soil and therefore low evaporation. The midlatitude circulation in DJF is also reasonably simulated in all MetUM simulations (figure is not shown). Figure 11 shows that this difference in the moisture source is rooted in SST bias. The negative SST bias over the Mediterranean Sea indicates an underestimation of evaporation and moisture source (Fig. 10a, d and g); the positive SST bias over the seas of Japan and Okhotsk, especially within higher resolutions simulations, indicates an overestimation of moisture source over these regions. Note that the positive SST bias over the East Asian coast is enlarged with the increasing horizontal resolution, especially over the Sea of Okhotsk and the North Pacific. The SST bias in coupled simulations explains the shift of moisture source from extratropical land to extratropical sea in coupled simulations like CN216 and CN512. However, it cannot explain the shift in AN512 wherein there is no SST bias involved. Note that a similar but smaller magnitude change in moisture source (increase over the seas of Japan and Okhotsk) is also found in atmosphere-only simulations with increasing horizontal resolution. Considering the fact that the precipitation in region 5 during DJF is low (Fig. 3e), the small increase in moisture source can eventually shift the major moisture source in AN512.
In this study, we analysed systematic errors in EA precipitation simulated from a set of GCMs by linking these errors to errors in evaporation and moisture transport using a moisture tracking model. The advantage of using a moisture tracking model is that errors in evaporation, atmospheric moisture and circulation are combined and reflected in the tracked moisture source. Compared to previous studies that linked precipitation biases to the net moisture flux on the boundary of a study region, a moisture tracking model reveals more information on a large spatial scale and from multiple hydrological components. Even though the precipitation bias could be small in some circumstance, the method shown in this study can still reveal biases associated other hydrological components. As shown in current study, prior to precipitation, biases in surface flux and atmospheric circulation can cause moisture source bias towards opposite directions in different locations, even though the collective impact on precipitation is small due to the cancellation. These biases in surface flux and atmosphere circulation indicate that simulations have yet to improve their air–sea coupling and/or atmospheric forcings.
Moisture sources tracked using WAM-2layers and the physical processes that link the source regions with the precipitation over EA have been discussed in Guo et al. (2019). Compared with studies employing other moisture methods, the results are consistent (Sun and Wang, 2015; Baker et al., 2015; Chu et al., 2017). As also shown herein, the Indian Ocean provides the largest portion of moisture during boreal summer for precipitation over southeastern EA. This contribution to precipitation decreases with the latitude of precipitation. Meanwhile, the contribution from land increases with latitude. Local evaporation makes a larger contribution over the Tibetan Plateau compared to other EA subregions. During the boreal winter, due to the prevailing westerly and the frozen soil over the Eurasian continent, the Mediterranean Sea and other adjacent water bodies become the major moisture contributor for precipitation over the midlatitude EA subregions. MetUM simulations can generally capture most of these contributions, albeit biases are noticeable and vary with resolution and coupling. Similar biases have also been reported in Peatman and Klingaman (2018); Stephan et al. (2017a, b).
ERA-Interim is employed here for evaluating the simulations. It is chosen for its small residual in the global hydrological budget, its accurate representation of the mean and interannual variability of EA monsoon precipitation and its resemblance to the observation of evaporation over China (Trenberth et al., 2011; Lin et al., 2014; Sun and Wang, 2015). However, ERA-Interim has noticeable biases in the representation of the water cycle over the ocean; i.e. the P−E interannual variability in the tropical Indian Ocean is not well represented compared to observations (Skliris et al., 2014; Schanze et al., 2010). This bias could potentially affect the moisture contribution from the Indian Ocean estimated with ERA-Interim. To deliver more accurate information on the performance of MetUM in terms of tracking moisture sources, multiple reanalysis datasets should be included, so that biases from any single reanalysis dataset can be identified and considered.
In the current climate modelling community, tools that can separately correct biases in air–sea coupling or atmospheric forcings are readily used, e.g. coupling a mixed-layer ocean model to an atmosphere model to correct surface flux (Hirons et al., 2015) or adding a relaxation term to circulation variables to correct atmospheric circulation according to observations (Rodríguez et al., 2017). Moisture-source-associated biases can therefore serve as a guideline about where correcting techniques should be applied in simulations. Take the case of precipitation over southeastern EA in JJA as an example: the surface flux correction should be applied over the northern Indian Ocean to correct the cold SST bias, and the atmospheric circulation correction should be applied over the western Pacific Ocean to correct the weak subtropical high bias. Although the deployment of these corrections is based on tracked moisture sources over a small region, it could potentially correct simulations on a much larger region, as components of hydrological cycle are closely linked and coupled with the energy cycle via circulation and moisture transport. Therefore, we could expect improvement in precipitation over larger regions, i.e. Tibet and midlatitude EA.
In this study, moisture sources of East Asian (EA) precipitation simulated in a set of MetUM configurations are traced using the Water Accounting Model – 2 layers (WAM-2layers) and compared to that of ERA-Interim reanalysis. The purpose of this study is to understand the precipitation bias in the MetUM and to link this bias to biases in evaporation and moisture transport over the moisture source region. Six MetUM simulations are used here (AN96, CN96, AN216, CN216, AN512 and CN512), which include an atmosphere-only simulation and an air–sea coupled simulation on three different horizontal resolutions.
MetUM simulations can reasonably capture EA precipitation features but also show systematic biases against observations regardless of horizontal resolution or air–sea coupling. These biases include overestimates precipitation over southeastern EA and the Tibetan Plateau.
To trace moisture source for EA precipitation, EA was first divided into five subregions, each of which has a relative homogenous hydrological feature. These subregions include the southeastern EA, the Tibetan Plateau, central–eastern EA, northwestern EA and northeastern EA. MetUM simulations show agreement with ERA-Interim in terms of capturing annual cycle of precipitation recycling ratio, seasonal shifts of moisture source. However, systematic differences between simulations and reanalysis remain. MetUM captures less moisture from tropical sea but more from extratropical land, which are linked to an underestimated moisture transport from the tropical Indian Ocean and an overestimated moisture transport from the midlatitude Eurasian continent. These differences in moisture sources can be used to explain precipitation differences between simulations and reanalysis.
Although increasing horizontal resolution cannot bridge the gap between simulated and observational precipitation, improvement in precipitation is visible, especially over the Tibetan Plateau. This is ascribed to a reduced remote moisture source and to an enhanced local moisture source over eastern Tibet.
Although including air–sea coupling does not necessarily improve precipitation over EA, differences in moisture sources indicate model biases due to biases in surface flux and atmospheric circulation. Over southeastern EA in JJA, coupled simulations take up less moisture from the Arabian Sea due to a persistent SST cold bias but take up more moisture from the South China Sea due to a positive wind–evaporation feedback and a cyclonic circulation anomaly. These differences in moisture source have similar magnitudes, which counteracts precipitation differences in coupled simulations when compared to atmosphere-only simulations.
Simulations with higher-resolution and/or air–sea coupling, i.e. CN216, AN512 and CN512, capture a shift of the major moisture source over northwestern and northeastern EA in DJF. The major moisture source over these regions shifts from extratropical land to extratropical sea. However, the cause of this shift in simulations is different from that in reanalysis and is mainly due to a positive anomaly of moisture source over the midlatitude Pacific Ocean, which is related to the SST bias in the air–sea coupling and to the increase of the horizontal resolution.
ERA-Interim has been used here for its good performance in calculating EA precipitation (Lin et al., 2014). However, considering that the source regions for EA precipitation are much larger, the accuracies of the hydrological components over other related regions are also important for correctly tracking moisture sources. The hydrological variables (i.e. E−P) over the oceans show large discrepancies among the reanalysis products (Skliris et al., 2014), due to scarcity and discontinuity of observation over the oceans (Schanze et al., 2010). In ERA-Interim, there has been an increasing E−P trend over the tropical Indian Ocean since 1979 compared to the observations indicating an increased net evaporation (Skliris et al., 2014). This bias could cause overestimation of moisture contribution from the tropical Indian Ocean provided that the circulation connecting this region and EA is less biased. Therefore, results shown here need to be interpreted with caution.
For WAM-2layers, the model code is available at https://github.com/ruudvdent/WAM2layersPython/tree/distance/ (last access: March 2020). For MetUM, the code is available only under license from the Met Office. The data used to produce the figures in this study have been published at https://doi.org/10.6084/m9.figshare.12801278 (Guo, 2020).
The supplement related to this article is available online at: https://doi.org/10.5194/gmd-13-6011-2020-supplement.
LG and NPK designed the moisture tracking experiments. RJvdE developed WAM-2layers and LG adopted it to MetUM simulations. PLV and MED ran the MetUM simulations. LG prepared the manuscript with contributions from all co-authors.
The authors declare that they have no conflict of interest.
This work and its contributors (Liang Guo, Marie-Estelle Demory, Pier Luigi Vidale, Andrew G. Turner, Amulya Chevuturi) were supported by the UK–China Research and Innovation Partnership Fund through the Met Office Climate Science for Service Partnership (CSSP) China as part of the Newton Fund. Liang Guo was also funded by the UK National Centre for Atmospheric Science Visiting Scientist Programme. Ruud J. van der Ent acknowledges the Innovational Research Incentives Scheme with project no. 016.Veni.181.015, which is financed by the Netherlands Organisation for Scientific Research (NWO). NPK was also funded by a UK Natural Environment Research Council Independent Research Fellowship (NE/L010976/1).
This research has been supported by the PERCHANCE/P105086 CSSP-China project.
This paper was edited by Robert Marsh and reviewed by two anonymous referees.
Baker, A. J., Sodemann, H., Baldini, J. U. L., Breitenbach, S. F. M., Johnson, K. R., van Hunen, J., and Pingzhong, Z.: Seasonality of westerly moisture transport in the East Asian summer monsoon and its implications for interpreting precipitation δ18, J. Geophys. Res.-Atmos., 120, 5850–5862, https://doi.org/10.1002/2014JD022919, 2015. a
Barsugli, J. J. and Battisti, D. S.: The Basic Effects of Atmosphere–Ocean Thermal Coupling on Midlatitude Variability, J. Atmos. Sci., 55, 477–493, https://doi.org/10.1175/1520-0469(1998)055<0477:TBEOAO>2.0.CO;2, 1998. a
Berrisford, P., Dee, D., Poli, P., Brugge, R., Fielding, K., Fuentes, M., Kållberg, P., Kobayashi, S., Uppala, S., and Simmons, A.: The ERA-Interim archive Version 2.0, Shinfield Park, Reading, 2011. a
Chen, H. and Sun, J.: Assessing model performance of climate extremes in China: an intercomparison between CMIP5 and CMIP3, Climatic Change, 129, 197–211, https://doi.org/10.1007/s10584-014-1319-5, 2015. a
Chu, Q., Wang, Q., and Feng, G.: Determination of the major moisture sources of cumulative effect of torrential rain events during the preflood season over South China using a Lagrangian particle model, J. Geophys. Res.-Atmos., 122, 8369–8382, https://doi.org/10.1002/2016JD026426, 2017. a
Curio, J., Maussion, F., and Scherer, D.: A 12-year high-resolution climatology of atmospheric water transport over the Tibetan Plateau, Earth Syst. Dynam., 6, 109–124, https://doi.org/10.5194/esd-6-109-2015, 2015. a, b
Dee, D. P., Uppala, S. M., Simmons, A. J., Berrisford, P., Poli, P., Kobayashi, S., Andrae, U., Balmaseda, M. A., Balsamo, G., Bauer, P., Bechtold, P., Beljaars, A. C. M., van de Berg, L., Bidlot, J., Bormann, N., Delsol, C., Dragani, R., Fuentes, M., Geer, A. J., Haimberger, L., Healy, S. B., Hersbach, H., Hólm, E. V., Isaksen, L., Kållberg, P., Köhler, M., Matricardi, M., McNally, A. P., Monge-Sanz, B. M., Morcrette, J.-J., Park, B.-K., Peubey, C., de Rosnay, P., Tavolato, C., Thèpauta, J.-N., and Vitarta, F.: The ERA-Interim reanalysis: configuration and performance of the data assimilation system, Q. J. Roy. Meteor. Soc., 137, 553–597, https://doi.org/10.1002/qj.828, 2011. a
Demory, M.-E., Vidale, P. L., Roberts, M. J., Berrisford, P., Strachan, J., Schiemann, R., and Mizielinski, M. S.: The role of horizontal resolution in simulating drivers of the global hydrological cycle, Clim. Dynam., 42, 2201–2225, https://doi.org/10.1007/s00382-013-1924-4, 2014. a
Dickinson, R. E.: How coupling of the atmosphere to ocean and land helps determine the timescales of interannual variability of climate, J. Geophys. Res., 105, 20115–20119, https://doi.org/10.1029/2000JD900301, 2000. a
Dong, B., Sutton, R. T., Shaffrey, L., and Klingaman, N. P.: Attribution of Forced Decadal Climate Change in Coupled and Uncoupled Ocean–Atmosphere Model Experiments, J. Climate, 30, 6203–6223, https://doi.org/10.1175/JCLI-D-16-0578.1, 2017. a
Donlon, C. J., Martin, M., Stark, J., Roberts-Jones, J., Fiedler, E., and Wimmer, W.: The Operational Sea Surface Temperature and Sea Ice Analysis (OSTIA) system, Remote Sens. Environ., 116, 140–158, https://doi.org/10.1016/j.rse.2010.10.017, 2012. a
Fremme, A. and Sodemann, H.: The role of land and ocean evaporation on the variability of precipitation in the Yangtze River valley, Hydrol. Earth Syst. Sci., 23, 2525–2540, https://doi.org/10.5194/hess-23-2525-2019, 2019. a, b, c
Guo, L.: Moisture source for East Asia precipition, figshare, Dataset, https://doi.org/10.6084/m9.figshare.12801278.v1, 2020. a
Guo, L., Klingaman, N. P., Demory, M.-E., Vidale, P. L., Turner, A. G., and Stephan, C. C.: The contributions of local and remote atmospheric moisture fluxes to East Asian precipitation and its variability, Clim. Dynam., 51, 4139–4156, https://doi.org/10.1007/s00382-017-4064-4, 2018. a, b, c
Guo, L., van der Ent, R. J., Klingaman, N. P., Demory, M.-E., Vidale, P. L., Turner, A. G., Stephan, C. C., and Chevuturi, A.: Moisture Sources for East Asian Precipitation: Mean Seasonal Cycle and Interannual Variability, J. Hydrometeorol., 20, 657–672, https://doi.org/10.1175/JHM-D-18-0188.1, 2019. a, b, c, d, e, f
He, J., Deser, C., and Soden, B. J.: Atmospheric and Oceanic Origins of Tropical Precipitation Variability, J. Climate, 30, 3197–3217, https://doi.org/10.1175/JCLI-D-16-0714.1, 2017. a
Hewitt, H. T., Copsey, D., Culverwell, I. D., Harris, C. M., Hill, R. S. R., Keen, A. B., McLaren, A. J., and Hunke, E. C.: Design and implementation of the infrastructure of HadGEM3: the next-generation Met Office climate modelling system, Geosci. Model Dev., 4, 223–253, https://doi.org/10.5194/gmd-4-223-2011, 2011. a, b, c, d
Hirons, L. C., Klingaman, N. P., and Woolnough, S. J.: MetUM-GOML1: a near-globally coupled atmosphere–ocean-mixed-layer model, Geosci. Model Dev., 8, 363–379, https://doi.org/10.5194/gmd-8-363-2015, 2015. a
Hirons, L. C., Klingaman, N. P., and Woolnough, S. J.: The Impact of Air-Sea Interactions on the Representation of Tropical Precipitation Extremes, J. Adv. Model. Earth Sy., 10, 550–559, https://doi.org/10.1002/2017MS001252, 2018. a
Hunke, E. C. and Lipscomb, W. H.: CICE: The Los Alamos sea ice model, documentation and software. Version 3.1, Tech. Rep. Tech. Rep., LACC-98-16, Los Alamos National Laboratory, Los Alamos, NM, 2004. a
Jiang, Z., Li, W., Xu, J., and Li, L.: Extreme Precipitation Indices over China in CMIP5 Models. Part I: Model Evaluation, J. Climate, 28, 8603–8619, https://doi.org/10.1175/JCLI-D-15-0099.1, 2015. a
Johnson, S. J., Levine, R. C., Turner, A. G., Martin, G. M., Woolnough, S. J., Schiemann, R., Mizielinski, M. S., Roberts, M. J., Vidale, P. L., Demory, M.-E., and Strachan, J.: The resolution sensitivity of the South Asian monsoon and Indo-Pacific in a global 0.35∘ AGCM, Clim. Dynam., 46, 807–831, https://doi.org/10.1007/s00382-015-2614-1, 2016. a
Keys, P. W., Barnes, E. A., van der Ent, R. J., and Gordon, L. J.: Variability of moisture recycling using a precipitation shed framework, Hydrol. Earth Syst. Sci., 18, 3937–3950, https://doi.org/10.5194/hess-18-3937-2014, 2014. a
Liepert, B. G. and Previdi, M.: Inter-model variability and biases of the global water cycle in CMIP3 coupled climate models, Environ. Res. Lett., 7, 014006, https://doi.org/10.1088/1748-9326/7/1/014006, 2012. a
Lin, R., Zhou, T., and Qian, Y.: Evaluation of Global Monsoon Precipitation Changes based on Five Reanalysis Datasets, J. Climate, 27, 1271–1289, https://doi.org/10.1175/JCLI-D-13-00215.1, 2014. a, b
Ma, X., Chang, P., Saravanan, R., Wu, D., Lin, X., Wu, L., and Wan, X.: Winter Extreme Flux Events in the Kuroshio and Gulf Stream Extension Regions and Relationship with Modes of North Pacific and Atlantic Variability, J. Climate, 28, 4950–4970, https://doi.org/10.1175/JCLI-D-14-00642.1, 2015. a
Madec, G.: NEMO ocean engine, Tech. Rep. Tech. Rep. 27, Note du Pole de modélisation, Institut Pierre-Simon Laplace (IPSL), France, 2008. a
Madec, G. and Imbard, M.: A global ocean mesh to overcome the North Pole singularity, Clim. Dynam., 12, 381–388, https://doi.org/10.1007/bf00211684, 1996. a, b
Marathayil, D., Turner, A. G., Shaffrey, L. C., and Levine, R. C.: Systematic winter sea-surface temperature biases in the northern Arabian Sea in HiGEM and the CMIP3 models, Environ. Res. Lett., 8, 1–6, https://doi.org/10.1088/1748-9326/8/1/014028, 2013. a
Ogata, T., Johnson, S. J., Schiemann, R., Demory, M., Mizuta, R., Yoshida, K., and Arakawa, O.: The resolution sensitivity of the Asian summer monsoon and its inter-model comparison between MRI-AGCM and MetUM, Clim. Dynam., 49, 3345–3361, https://doi.org/10.1007/s00382-016-3517-5, 2017. a
Ou, T., Chen, D., Linderholm, H. W., and Jeong, J.-H.: Evaluation of global climate models in simulating extreme precipitation in China, Tellus A, 65, 19 799, https://doi.org/10.3402/tellusa.v65i0.19799, 2013. a
Park, S., Deser, C., and Alexander, M. A.: Estimation of the Surface Heat Flux Response to Sea Surface Temperature Anomalies over the Global Oceans, J. Climate, 18, 4582–4599, https://doi.org/10.1175/JCLI3521.1, 2005. a
Peatman, S. C. and Klingaman, N. P.: The Indian summer monsoon in MetUM-GOML2.0: effects of air–sea coupling and resolution, Geosci. Model Dev., 11, 4693–4709, https://doi.org/10.5194/gmd-11-4693-2018, 2018. a
Ratnam, J. V., Morioka, Y., Behera, S. K., and Yamagata, T.: A model study of regional air-sea interaction in the austral summer precipitation over southern Africa, J. Geophys. Res.-Atmos., 120, 2342–2357, https://doi.org/10.1002/2014JD022154, 2015. a
Rodríguez, J. M., Milton, S. F., and Marzin, C.: The East Asian Atmospheric Water Cycle and Monsoon Circulation in the Met Office Unified Model, J. Geophys. Res.-Atmos., 122, 10246–10265, https://doi.org/10.1002/2016JD025460, 2017. a, b
Schanze, J. J., Schmitt, R. W., and Yu, L. L.: The global oceanic freshwater cycle: A state-of-the-art quantification, J. Mar. Res., 68, 569–595, https://doi.org/10.1357/002224010794657164, 2010. a, b
Schiemann, R., Demory, M.-E., Mizielinski, M. S., Roberts, M. J., Shaffrey, L. C., Strachan, J., and Vidale, P. L.: The sensitivity of the tropical circulation and Maritime Continent precipitation to climate model resolution, Clim. Dynam., 42, 2455–2468, https://doi.org/10.1007/s00382-013-1997-0, 2014. a
Schneider, U., Becker, A., Finger, P., Meyer-Christoffer, A., Ziese, M., and Rudolf, B.: GPCC's new land surface precipitation climatology based on quality-controlled in situ data and its role in quantifying the global water cycle, Theor. Appl. Climatol., 115, 15–40, https://doi.org/10.1007/s00704-013-0860-x, 2014. a
Skliris, N., Marsh, R., Josey, S. A., Good, S. A., Liu, C., and Allan, R. P.: Salinity changes in the World Ocean since 1950 in relation to changing surface freshwater fluxes, Clim. Dynam., 43, 709–736, https://doi.org/10.1007/s00382-014-2131-7, 2014. a, b, c
Stephan, C. C., Klingaman, N. P., Vidale, P. L., Turner, A. G., Demory, M.-E., and Guo, L.: A Comprehensive Analysis of Coherent Rainfall Patterns in China and Potential Drivers. Part I: Interannual Variability, Clim. Dynam., 50, 4405–4424, https://doi.org/10.1007/s00382-017-3882-8, 2017a. a
Stephan, C. C., Klingaman, N. P., Vidale, P. L., Turner, A. G., Demory, M.-E., and Guo, L.: A Comprehensive Analysis of Coherent Rainfall Patterns in China and Potential Drivers. Part II: intraseasonal variability, Clim. Dynam., 51, 17–33, https://doi.org/10.1007/s00382-017-3904-6, 2017b. a
Stephan, C. C., Klingaman, N. P., Vidale, P. L., Turner, A. G., Demory, M.-E., and Guo, L.: Interannual rainfall variability over China in the MetUM GA6 and GC2 configurations, Geosci. Model Dev., 11, 1823–1847, https://doi.org/10.5194/gmd-11-1823-2018, 2018. a
Sun, B. and Wang, H.: Analysis of the major atmospheric moisture sources affecting three sub-regions of East China, Int. J. Climatol., 35, 2243–2257, https://doi.org/10.1002/joc.4145, 2015. a, b
Terai, C. R., Caldwell, P. M., Klein, S. A., Tang, Q., and Branstetter, M. L.: The atmospheric hydrologic cycle in the ACME v0.3 model, Clim. Dynam., 50, 3251–3279, https://doi.org/10.1007/s00382-017-3803-x, 2018. a
Trenberth, K. E., Fasullo, J. T., and Mackaro, J.: Atmospheric Moisture Transports from Ocean to Land and Global Energy Flows in Reanalyses, J. Climate, 24, 4907–4924, https://doi.org/10.1175/2011JCLI4171.1, 2011. a
Valcke, S.: The OASIS3 coupler: a European climate modelling community software, Geosci. Model Dev., 6, 373–388, https://doi.org/10.5194/gmd-6-373-2013, 2013. a
van der Ent, R. J. and Savenije, H. H. G.: Length and time scales of atmospheric moisture recycling, Atmos. Chem. Phys., 11, 1853–1863, https://doi.org/10.5194/acp-11-1853-2011, 2011. a
van der Ent, R. J., Savenije, H. H. G., Schaefli, B., and Steele-Dunne, S. C.: Origin and fate of atmospheric moisture over continents, Water Resour. Res., 46, W09525, https://doi.org/10.1029/2010WR009127, 2010. a
van der Ent, R. J., Tuinenburg, O. A., Knoche, H.-R., Kunstmann, H., and Savenije, H. H. G.: Should we use a simple or complex model for moisture recycling and atmospheric moisture tracking?, Hydrol. Earth Syst. Sci., 17, 4869–4884, https://doi.org/10.5194/hess-17-4869-2013, 2013. a
van der Ent, R. J., Wang-Erlandsson, L., Keys, P. W., and Savenije, H. H. G.: Contrasting roles of interception and transpiration in the hydrological cycle – Part 2: Moisture recycling, Earth Syst. Dynam., 5, 471–489, https://doi.org/10.5194/esd-5-471-2014, 2014. a
van Haren, R., Haarsma, R. J., Van Oldenborgh, G. J., and Hazeleger, W.: Resolution Dependence of European Precipitation in a State-of-the-Art Atmospheric General Circulation Model, J. Climate, 28, 5134–5149, https://doi.org/10.1175/JCLI-D-14-00279.1, 2015. a
Vannière, B., Demory, M.-E., Vidale, P. L., Schiemann, R., Roberts, M. J., Roberts, C. D., Matsueda, M., Terray, L., Koenigk, T., and Senan, R.: Multi-model evaluation of the sensitivity of the global energy budget and hydrological cycle to resolution, Clim. Dynam., 52, 6817–6846, https://doi.org/10.1007/s00382-018-4547-y, 2018. a
Vellinga, M., Roberts, M., Vidale, P. L., Mizielinski, M. S., Demory, M.-E., Schiemann, R., Strachan, J., and Bain1, C.: Sahel decadal rainfall variability and the role of model horizontal resolution, Geophys. Res. Lett., 43, 326–333, https://doi.org/10.1002/2015GL066690, 2016. a
Walters, D., Boutle, I., Brooks, M., Melvin, T., Stratton, R., Vosper, S., Wells, H., Williams, K., Wood, N., Allen, T., Bushell, A., Copsey, D., Earnshaw, P., Edwards, J., Gross, M., Hardiman, S., Harris, C., Heming, J., Klingaman, N., Levine, R., Manners, J., Martin, G., Milton, S., Mittermaier, M., Morcrette, C., Riddick, T., Roberts, M., Sanchez, C., Selwood, P., Stirling, A., Smith, C., Suri, D., Tennant, W., Vidale, P. L., Wilkinson, J., Willett, M., Woolnough, S., and Xavier, P.: The Met Office Unified Model Global Atmosphere 6.0/6.1 and JULES Global Land 6.0/6.1 configurations, Geosci. Model Dev., 10, 1487–1520, https://doi.org/10.5194/gmd-10-1487-2017, 2017. a
Wang, H. and Chen, H.: Climate control for southeastern China moisture and precipitation: Indian or East Asian monsoon?, J. Geophys. Res., 117, D12109, https://doi.org/10.1029/2012JD017734, 2012. a
Wei, J., Dirmeyer, P. A., Bosilovich, M. G., and Wu, R.: Water vapor sources for Yangtze River Valley rainfall: Climatology, variability, and implications for rainfall forecasting, J. Geophys. Res., 117, D05126, https://doi.org/10.1029/2011JD016902, 2012. a, b
Wen, X., Fang, G., Qi, H., Zhou, L., and Gao, Y.: Changes of temperature and precipitation extremes in China: past and future, Theor. Appl. Climatol., 126, 369–383, https://doi.org/10.1007/s00704-015-1584-x, 2016. a
Williams, K. D., Harris, C. M., Bodas-Salcedo, A., Camp, J., Comer, R. E., Copsey, D., Fereday, D., Graham, T., Hill, R., Hinton, T., Hyder, P., Ineson, S., Masato, G., Milton, S. F., Roberts, M. J., Rowell, D. P., Sanchez, C., Shelly, A., Sinha, B., Walters, D. N., West, A., Woollings, T., and Xavier, P. K.: The Met Office Global Coupled model 2.0 (GC2) configuration, Geosci. Model Dev., 8, 1509–1524, https://doi.org/10.5194/gmd-8-1509-2015, 2015. a, b
Yang, S., Feng, J., Dong, W., and Chou, J.: Analyses of extreme climate events over china based on CMIP5 historical and future simulations, Adv. Atmos. Sci., 31, 1209–1220, https://doi.org/10.1007/s00376-014-3119-2, 2014. a
Yatagai, A., Kamiguchi, K., Arakawa, O., Hamada, A., Yasutomi, N., and Kitoh, A.: APHRODITE: Constructing a Long-Term Daily Gridded Precipitation Dataset for Asia Based on a Dense Network of Rain Gauges, B. Am. Meteorol. Soc., 93, 1401–1415, https://doi.org/10.1175/BAMS-D-11-00122.1, 2012. a
Zhang, C., Tang, Q., and Chen, D.: Recent changes in the moisture source of precipitation over the Tibetan Plateau, J. Climate, 30, 1807–1819, https://doi.org/10.1175/JCLI-D-15-0842.1, 2017. a, b, c
Zhao, T., Zhao, J., Hu, H., and Ni, G.: Source of atmospheric moisture and precipitation over China's major river basins, Front. Earth Sci.-PRC, 10, 159–170, https://doi.org/10.1007/s11707-015-0497-4, 2016. a
Zhou, T.-J. and Yu, R.-C.: Atmospheric water vapor transport associated with typical anomalous summer rainfall patterns in China, J. Geophys. Res., 110, D08104, https://doi.org/10.1029/2004JD005413, 2005. a, b
- Abstract
- Introduction
- Data and methods
- Differences to observation/reanalysis
- Differences in moisture source due to the model resolution and air–sea coupling
- Discussions
- Conclusions
- Code and data availability
- Author contributions
- Competing interests
- Acknowledgements
- Financial support
- Review statement
- References
- Supplement